methionine selective enzyme electrode
TRANSCRIPT
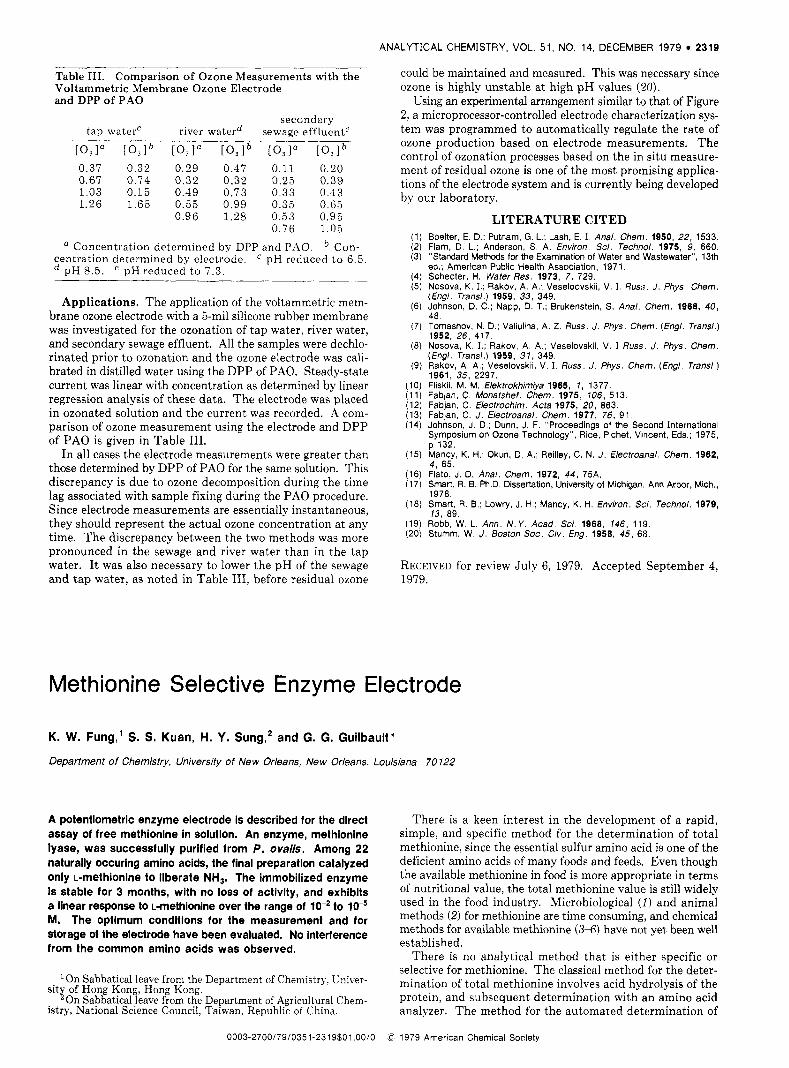
Table 111. Voltammetric Membrane Ozone Electrode and DPP of P A 0
Comparison of Ozone Measurements with the
secondary tap water' river waterd sewage effluente
[ O , I U [ 0 3 1 b l 0 3 l " [0,lb [O,l" 0.37 0.32 0.29 0.47 0.11 0.20 0.67 0.74 0.32 0.32 0.25 0.39 1.03 0.15 0.49 0.73 0.33 0.43 1.26 1.65 0.55 0.99 0.35 0.65
0.96 1.28 0.53 0.95 0.76 1.05
Concentration determined by DPP and PAO. Con- centration determined by electrode. ' pH reduced to 6.5.
pH 8.5. e pH reduced to 7.3.
Applications. The application of the voltammetric mem- brane ozone electrode with a 5-mil silicone rubber membrane was investigated for the ozonation of tap water, river water, and secondary sewage effluent. All the samples were dechlo- rinated prior t o ozonation and the ozone electrode was cali- brated in distilled water using the DPP of PAO. Steady-state current was linear with concentration as determined by linear regression analysis of these data. The electrode was placed in ozonated solution and the current was recorded. A com- parison of ozone measurement using the electrode and DPP of P A 0 is given in Table 111.
In all cases the electrode measurements were greater than those determined by DPP of P A 0 for the same solution. This discrepancy is due to ozone decomposition during the time lag associated with sample fixing during the P A 0 procedure. Since electrode measurements are essentially instantaneous, they should represent the actual ozone concentration at any time. The discrepancy between the two methods was more pronounced in the sewage and river water than in the tap water. I t was also necessary to lower the pH of the sewage and tap water, as noted in Table 111, before residual ozone
ANALYTICAL CHEMISTRY, VOL. 51, NO. 14, DECEMBER 1979 2319
could be maintained and measured. This was necessary since ozone is highly unstable at high pltl values (20).
Using an experimental arrangement similar to that of Figure 2 , a microprocessor-controlled electrode characterization sys- tem was programmed to automatically regulate the rate of ozone production based on electrode measurements. The control of ozonation processes based on the in situ measure- ment of residual ozone is one of the most promising applica- tions of the electrode system and is currently being developed by our laboratory.
LITERATURE CITED Boeiter, E. D.: Putnam, G. L.; Lash, E. I . Anal. Cheni. 1950, 22, 1533. Flam, D. L.; Anderson, S. A. fnviron Sci. Techno/. 1975, 9, 660. Standard Methods fw the Examination of Water and Wastewater", 13th
ed.; American Public Health Association, 1971. Schecter, H. Water Res. 1973, 7, 729. Nosova. K. I.; Rakov, A. A.; Veseioovskii, V. I . Rus:;. J . Phys. Chem. ( fng l . Trans/.) 1959, 33, 349. Johnson, D. C.; Napp. D. T.; Brukenstein, S. Anal. Chem. 1988, 40,
Tomashov, N. D.: Valiulina, A. 2. Russ. J . Phys. Chem. (Engl. Trans/.) 1952, 26, 417. Nosova, K. I.: Rakov, A. A.; Veselovskii, V. I Russ. J . Phys. Chem. IEnol. Trans/.\ 1959. 37. 349
48.
~ . . , . , . . Ra<ov, A. A.;'Veselovskii, V. I. Russ. ,J, Phys. Chem. (Engl. Trans/.) 1961. 35. 2297. Fliskii, M. M. Elektrokhimjya 1985, 1 , 1377. Fabian, C. Monatshef. Chem. 1975, 106, 513. Fabian, C. Electrochim. Acta 1975, 20, 863. Fabian, C. J . Nectroanal. Chem. 1977, 76, 91. Johnson, J. D.; Dunn, J. F. "Proceedings of the Second International Symposium on Ozone Technology", Rice, Pichet, Vincent, Eds.; 1975, p 132. Mancy, K . H.; Okun, D. A.; Reilley, C. N. J . Electroanal. Chem. 1982, 4 , 65. Flato, J. D. Anal. Chem. 1972, 44, 75A. Smart, R. B. Ph.D. Dissertation, Universih. of Michigan Ann Arbor, Mich., 1978. Smart, R. B.; Lowry, J. I-.; Mancy, K. H. Environ. Sci. Techno/. 1979, 13, 89.
Robb, W. L. Ann. N . Y . Acad. Sci. 1988, 146, 119. Stumm, W. J . Boston SOC. Civ. Eng. 1958, 45, 68.
RECEIVED for review July 6, 1979. Accepted September 4, 1979.
Methionine Selective Enzyme Electrode
K. W. F u n g , ' S. S. K u a n , H. Y. Sung,* and G. G. Guilbault"
Department of Chemistry, University of New Orleans, New Orleans, Louisiana 70 722
A potentiometric enzyme electrode is described for the direct assay of free methionine in solution. An enzyme, methionine lyase, was successfully purified from P. ovalis. Among 22 naturally occuring amino acids, the final preparation catalyzed only L-methionine to liberate NH,. The immobilized enzyme Is stable for 3 months, with no loss of activity, and exhibits a linear response to Lmethionine over the range of lo-' to M. The optimum conditions for the measurement and for storage of the electrode have been evaluated. No interference from the common amino acids was observed.
'On Sabbatical leave from the Department of Chemistry, Univer-
'0, Sabbatical leave from the Department of Agricultural Chem- sit of Hong Kong, Hong Kong.
istry, National Science Council, Taiwan, Republic of China.
There is a keen interest in the development of a rapid, simple, and specific method for the determination of total methionine, since the essential sulfur amino acid is one of the deficient amino acids of many foods and feeds. Even though the available methionine in food is more appropriate in terms of nutritional value, the total methionine value is still widely used in the food industry. Microbiological ( I ) and animal methods (2) for methionine are time consuming, and chemical methods for available methionine (34) have not yet been well established.
There is no analytical method that is either specific or selective for methionine. The classical method for the deter- mination of total methionine involves acid hydrolysis of the protein, and subsequent determination with an amino acid analyzer. The method for the automated determination of
0003-2700/79/0351-2319$01 .OO/O C 1979 American Chemical Society

2320 ANALYTICAL CHEMISTRY, VOL. 51, NO. 14, DECEMBER 1979
methionine after decomposition of the protein has been de- veloped by Gehrke and Neuner (7). However, the reaction with nitroprusside is nonspecific, and cystine causes a rapid fading of the color. Other chemical methods have also been developed (8), but none of them is specific for methionine.
Enzymatic methods are more specific than most chemical reactions, and the product of the reaction can be determined by a sensitive analytical method, e.g., electrochemical or fluo- rometric method. Thus a sensitive and specific method can result. The application of enzymatic reactions for chemical analysis has been reviewed by Guilbault (9). A specific sensor for L-lysine based on the enzymatic reaction has been reported by White and Guilbault (10).
Recently methionine-lyase (EC 4.4.1.11) has been isolated by Soda and co-workers (11). The possibility of using this enzyme for the construction of a methionine sensor was stud- ied, and the results are presented in this paper. An ammonia gas electrode was used to determine the amount of ammonia generated by the following enzymatic reaction:
methionine + a-ketobutyrate + methyl mercaptan + ammonia
The optimum conditions for measurements and for storage of the sensor were studied.
EXPERIMENTAL Reagents. The chemicals used were analytical reagent grade
and were used without further purification. Amino acids, glu- taraldehyde (25%), bovine serum albumin (BSA), and pyridox- al-5'-phosphate (P-5'-P) were obtained from Sigman Chemical co.
The buffer solutions (phosphate, Tris, glycine, borate) were prepared as described elsewhere (12). Sodium pyrophosphate crystals and phosphoric acid were used for the preparation of pyrophosphate buffers.
Apparatus. A Radiometer carbon dioxide electrode (E-5036) was used as the ammonia gas sensing element. The Teflon film was replaced by a polypropylene microporous film (Celgard 2500, Celanese Corp., Summit, N.J.) and the internal filling solution was 0.1 M NH4C1. Potential measurements were made with an Orion 801A pH meter, and a Heath strip chart recorder with dc-off set (EU-205-11, EU-200-01, EU-200-02) was used to record the response curves. The measurements were carried out either at room temperature (26 "C) in a 5-mL beaker or in a thermostated cell (22 "C and 39 "C) with magnetic stirring. The pH of the solutions was measured with an Owens-Illinois pH 2000 combi- nation electrode.
Procedure. Enzyme Preparation. The microorganisms (Pseudomonas ovalis IF0 3738), obtained from Kyoto 1 Jniversity, Japan, were grown in a medium as reported by Soda and co- workers ( I I ) , except that 0.25% L-methionine was replaced by 0.59% DL-methionine. The harvested cells were washed twice with 0.85% NaCl solution and subsequently with 0.01 M phos- phate buffer (pH 7.2) containing M (P-5'-P) and 0.01% 2-mercaptoethanol. The washed cells were suspended in 10 mI, of the above buffer and sonified twice with a sonifier cell disruptor (Model W 140 Heat Systems Ultrasonics Inc.) for 10 min. The cell debris was removed by centrifugation a t 8000 g for 10 min and the supernatant was brought to 60 "C for 10 min, cooled immediately in an ice bath, and centrifuged to remove sediment formed during heat treatment. The enzyme solution was further fractionated with (NH4)$04 and the precipitate obtained between 20-50% saturation was dissolved in pH 8.0, 0.05 M phosphate buffer containing 10" M P-5'-P (Buffer A). The resultant solution was chromatographed on a Sephadex G-150 column (50 X 3 cm) pre-equilibrated and eluted with buffer A. The active fractions (Figure 1) were combined and concentrated with a Millipore concentrator (Pellicon Type PTGC, MW 10 000). The concen- trated solution was applied onto a pre-equilibrated DEAE cellulose column (30 X 2 cm), washed twice with buffer -4; gradient elution (0-0.5 M NaCl) was then started. The most active fractions (Figure 2) were pooled, freeze-dried and stored a t -20 " C until used.
methionine-lyase
Erizyme Assays. Three different methods were employed to measure the enzyme activity during purification.
Method I. The enzyme activity was determined spectropho- tometrically by monitoring the formation of NH, with Nessler reagent. The reaction was started by introducing 0.1 mI, of enzyme solution into a 2-mL reaction mixture contaiiiing 50 pM phosphate (pH 8.0), 10 pM methionine and 0.15 ph4 P-5'-P. After 20-min incubation at 30 "C, 0.2 mL of Nessler reagent was added and the absorbancy at 480 nm was read against the blank. This method was employed as standard procedure to assay the enzyme throughout the purification.
Method 11. The enzyme activity was estimated electiocherni- cally by measuring the rate of NH, formed kinetically with a gas membrane NH, electrode. The composition of the reaction mixture was the same as method I except that 50 pM methionine was used instead of 10 pM and the reaction was carried out at pH 8.5 for better response. The rate of m\7 change per minute was recorded. This method was often used to spot-check prepa- rations at different purification stages.
Method 111. The assay procedure was exactly the same as described by Soda (11). Since 3-methyl-2-benzothiazolillone hy- drazone reacts with many other a-ketoacids in addition to a-ke- tobutyrate, this method was not used for the specificity study and was occasionally employed to spot-check the enzyme activity of the final preparation.
The enzyme unit is defined as pmol of NH, liberated or pmol of' n-ketobutyrate formed per minute.
Estimation of Protein. Protein concentrations in different preparations were estimated by the method of Folin. Ciocalteu as outlined by Litwack (15) using egg albumin as reference.
Electrode Preparation. The electrode was prepared by coating a layer of the immobilized enzyme onto an ammonia gas sensing electrude, by a technique described by Giiilbault and co-workers (10, 13). Five mg of freeze-dried enzyme was dissolved in 28 pL, of 15% BSA, then 2.2 pL of 12.5% glutaraldehyde was added as cross-linking reagent. If 25% glutaraldehyde was used as in refs. 10 and 13, the mixture became sticky within 2-3 s; thus it was hard to spread the mixture well to form a uniform film on the top and around the side of the sensor. Also the film was thicker and the response time was longer, if 30 p L of BSA was used as in refs. 10 and 13. The electrode was placed in a solution of 10.' M methionine in 0.05 M pyrophosphate huffer (pH 8.7) containing
hl P-5'-P and stored at 4 O C when not in use. The immobi- lized enzyme film would peel off if the electrode was left in air for a few hours.
Electrode Measurements. Electrude measurements were made by allowing the electrodes to equilibrate in the appropriate huffer (2 mL), then injecting a few microliters of the amino acid in buffer. The electrode response was noted as the rate of change of milli- volts, or by the equilibrium pot,ential. The effective enzyme activity on the electrode was estimated from the rate of the response, which was converted into the amount of ammonia generated per minute from a calibration curve constructed with standard ammonia solutions using the same electrode.
RESULTS AND DlSClJYSZON The elution patterns of (NH4)$04 fractionated preparation
on the G-150 column and concentrated enzyme solution from G-150 on the DEAE cellulose column are illustrated in Figures 1 and 2, respectively. The most active fractions from DEAE chromatography were pooled, designated as final preparation. Table I indicates the substrate specificity of the final prepa- ration toward different amino acids listed. No liberation of NH, from any amino acids was observed with the exception of L-methionine. The overall purification scheme is summa- rized in Table 11.
The ammonia gas sensing electrode (modified E-5036 elec- trode) used in the present studies has a higher detection limit (the response is 20 mV less), a longer response time (3 rnin for 98% response compared to 2 rnin at 1 X 1W4 M NHJ, and a lnnger recovery time (15 min compared to 12 mill) than the commercial Orion 95-10 ammonia electrode. These result from a thicker filling solution layer in between the glass electrode and the membrane. The advantages of using the modified

ANALYTICAL CHEMISTRY, VOL. 51,
- Prote ,n
NO. 14, DECEMBER 1979 2321
. 0 20 30 40 50
Fractmr. IZ,n b e r
Flyure 1. Chromatography of 20- 50 % (NH&SO, fractionated enzyme solution on Sephadex G-150. t indicates fraction pooled
LO 20 30 40 50
Frac t ion Num.ber
Figure 2. Gradient elution diagram of pooled fractions from Sephadex G-100 separated on DEAE cellulose. ? indicates fractions pooled
E 5036 electrode, however, are: (a) the membrane of the electrode is held in place with silicone rubber (RTV 3145 now-Corning) to prevent any leakage from the internal solu- tion (N€I,Cl) to the sample. (This is always a problem for the Orion ammonia electrode), and (b) the rubber O-ring of the electrode is used to hold the immobilized enzyme film as discvssed in ref. I O .
M NH4Cl solution was used as the internal filling solution; how- ever, the response time would be longer. Different types of membranes were tested for use in the modified electrode. Very long response times were obtained by using a Radiometer Teflon membrane (D602) and a silicone rubber membrane (D606). A Celanese Celgard microporous polypropylene sheet 2500 (0.04-pm pore size) was found to be better than 2400 (0.02-wm pore size). The Orion porous Teflon membrane for the Model 95-10 electrode was found to be slightly better than Celgard 2500. The Celgard 2500 membrane and a 10-1 M
The response of the electrode would be higher if a
NH&1 (as filling solution) were used in subsequent studies. The response time of the electrode for free ammonia, after
coating the immobilized enzyme layer, was slightly longer than that before coating (4 min for 98% response compared to 3 min) and the recovery time was about the same (15 min).
The soluble enzyme was found to have maximum activity a t pH 8.0, which is the upper limit of HP04*-/H2P04- buffer system (12). At this pH, however, only one tenth of the total ammonium is in the form of ammonia gas to which the elec- trode responds. The detection limit of this method would be greatly improved if a higher pH buffer system, a t which the activity of the enzyme remains high, could be used. Several buffer systems which can be used a t pHs >8.0 were tested. Borate buffer (pH 8.5) was found to inactivate the immobilized enzyme. Tris buffer (pH 8.0-9.0) and glycine buffer (pH 8.0 and 8.5) were found to inhibit the immobilized enzyme. Tris-phosphate buffer (pH 8.5) ( 1 4 ) could be used for only short terms. The activity of the immobilized enzyme de-

2322 ANALYTICAL CHEMISTRY, VOL. 51, NO. 14, DECEMBER 1979
6
5'
$ 4'
Q
3c
1 C
10
8 0 a i 8 2 8 3 8 4 8 6 8 7 88 5 0
Figure 3. Effect of pH on the response of the electrode. Methionine = 1 X 0 = equilibrium method
M, 0.05 M pyrophosphate buffer. 0 = rate measurement;
Table I. Substrate Specificity of the Final Preparation
relative activity
substrate
L-me thionine D-methionine L-asparagine L-glutamine L-threonine L-cysteine L-cystine L -se r ine L-histidine L-alanine L-arginine L-aspartic acid L-glutamic acid L-glycine L-hydroxyproline L-isoleucine L-leucine L-lycine L-phenylalanine L-proline L-tryptophane L-tyrosine L-valine
a NM = not measurable.
method I (abs. at 480 nm)
0.345 0
0.005 0.075
0 0.002
0 0 0 0 0 0 0 0 0 0 0 0 0 0 0 0 0
method I1 (Amvimin)
21 0
NM" 4 0
NM 0 0 0 0 0 0 0 0 0 0 0 0 0 0 0 0 0
creased significantly after the electrode was immersed in the buffer solution overnight; however, the activity could be re- covered after the electrode wae placed in phosphate or pyro- phosphate buffer for a few hours. The immobilized enzyme was found to be stable in pyrophosphate buffer, and the ac- tivity a t pH 8.0 was found to be the same as in phosphate buffer.
The effect of pH on the activity of the immobilized enzyme in pyrophosphate buffer was studied. Figure 3 shows the variation of the electrode response a t the pH range of 8-9.
Table 11. Summary of the Purification Procedure
fold puri- yield
protein, specific fica- activ- fraction mg/mL activity tion ity, %
crude extract 26.81 0.062 1 100 heat treatment 4.15 0.43 7 73 (",),SO4 3.06 0.68 11 50
Sephadex G-150 1.09 1.56 25 39
DEAE cellulose 0.37 2.98 48 18
fractionation
chromatography
chromatography
0 os 0 10 0 84 0 13 Plr.?hosphare (n
Figure 4. Effect of the concentration of pyrophosphate on the response of the electrode. Methionine = 1.5 X M, pH 8.7, pyrophosphate buffer
A linear increase of the electrode response was obtained a t pH 8.G3.7. This indicates that the activity of the immobilized enzyme remains the same in this pH range. The pH range

ANALYTICAL CHEMISTRY, VOL. 51, NO. 14, DECEMBER 1979 2323
Table 111. toward Various Amino Acids
Relative Activity of the Immobilized Enzyme
relative re lati ve substrates activity substrates activity
L-methionine 100' L-glutamic acid OQ D-methionine Oa L-glycine OQ L-asparagine NM: L-hydroxyproline Oa L-glutamine 1 2 L-isoleucine OQ L-threonine ob L-leucine OQ L-cysteine NM L-lysine OQ L-cystine Od L-phenylalanine Oa L-serine 0' L-proline OQ L-histidine 1' L-tryptophane OQ L-alanine Oa L-tyrosine OQ L-arginine Oa L-valine OQ L-aspartic acid OQ
a Measurement was made in ' Measurement was made in M amino acid solution. Measurement was made in M amino acid solution. Measurement was made in saturated solution. e NM =
M amino acid solution.
not measurable,
due to the higher activity of the immobilized enzyme a t higher temperature. Since the enzyme is stable up to 60 "C, as discussed in the Experimental section, the measurements can be carried out a t higher temperature if higher sensitivity, a lower detection limit, and a wider linear range are desired. The slopes (42 mV a t 26 "C and 49 mV a t 39 "C) are lower than the theoretical values (59 and 62 mV, respectively). The apparent activity of the immobilized enzyme was found to be 3 units/mg. The response of two different electrodes were found to be close to each other, as shown in Figure 6. The electrode could be kept for 3 months without change of its activity.
The specificity of the electrode was studied by measuring the electrode response to various common amino acids in buffer solution. The relative activity of the immobilized en- zyme toward these acids is presented in Table 111. The only interferent (glutamine) present in food protein is decomposed to ammonium ion during acid hydrolysis, and the produced ammonium ion can be then removed by passing the resulting solution through a Dowex 5OW-X (50-100 mesh) column. Methionine will not be removed by this resin a t pH 8.7.
1 4 6 8 lo
Trne (win.)
Flgure 5. Response curves of the electrode at different concentrations of methionine
for maximum activity is broader for immobilized enzyme than soluble enzyme, and this is found to be true in most cases (9). The decrease in electrode response a t pHs beyond 8.8 is due to the decrease in activity of the immobilized enzyme. Hence p H 8.7 was used in all subsequent studies.
Very often the activity of the soluble enzyme depends on the ionic strength of the solution. The effect of ionic strength on the electrode response was thus studied. Figure 4 shows the electrode response a t different concentrations of pyro- phosphate. The electrode response remains the same; thus 0.05 M pyrophosphate (pH 8.7) was used as the electrolyte in subsequent studies.
The response curves of the electrode a t different concen- trations of methionine are shown in Figure 5. Two calibration curves a t two different temperatures are shown in Figure 6. The electrode response was higher, and the response time was faster, as shown in Figure 7, a t higher temperatures. This is
120 T 100
80
w 60
40
20
10 -2 10 - 3 10 -4 10
Methionine L.
Flgure 8. Calibration curves for the methionine electrode at two different temperatures. A = 26 "C; and 0 are two different electrodes; B = 39 OC

2324 ANALYTICAL CHEMISTRY, VOL. 51, NO. 14, DECEMBER 1979
ACKNOWLEDGMENT The authors thank K. Soda, Kyoto University, Japan, for
loo I the strain of Pseudomonas oualis.
2 4 6 8 10
TiHe MI^ ) Figure 7. Response curves at three different temperatures. Methionine = 1.5 X
CONCLUSIONS
M, pH 8.7, 0.05 M pyrophosphate buffer
LITERATURE CITED C. Shorrock and J. E. Ford, in "Proteins in Human Nutrition", J. W. G. Porter and B. A. Rolls. Eds., Academic Press, New York, 1973, pp 207-223. E. L. Miller, K. J. Cawenter, C. B. Moraan, and A. W. Bovne. Br. J . Nutr. 19, 249 (1965). D. Pieniazek. M. Rakowska, W. Szkilladziowa. and 2. Grabarek, Br. J . Nub. 34, 175 (1975). G. M. Ellinger and A. Duncan, Biochem. J., 155, 615 (1976). A. J. Finiayson and S. L. MacKenzie, Anal. Biochem., 70, 397 (1976). S. H. Lipton and C. E. Bodwell, J . Agric. Food Chem., 25, 1214 (1977). C. W. Gehrke and T. E. Neuner, J . Assoc. Off. Anal. Chem., 57, 682 ( 1974). J. P. Greenstein and M. Winkz, "Chemistry and the Amino Acids", Vol. 3, John Wiley, New York, 1961, pp 2131-2137. G. G. Guilbauk "Handbook of Enzymatic Methods of Analysis", Dekker, New York, 1977. W. C. White and G. G. Guilbault, Anal. Chem., 50, 1481 (1978). H. Tanaka, N. Esaki, and K. Soda, Biochemistry, 16, 100 (1977). Handbook of Biochemistry", 2nd ed., The Chemical Rubber Co.,
Cleveland, Ohio, 1970, pp J 234-J 235. M. Mascini and G. G. Guilbault, Anal. Chem., 49, 795 (1977). M. Meyerhoff and G. A. Rechnitz, Anal. Chim. Acta, 85, 277 (1976). G. Litwack, "Experimental Biochemistry", John Wiley and Sons, New York. 1962, p 147.
The optimum conditions for measurement of methionine have been evaluated. The electrode can be used for multi- determinations, and kept for more than 3 months without any change of activity. Results show that this potentiometric enzyme electrode is a useful device for a fast assay of total methionine in food samples.
RECEIVED for review February 5, 1979. Accepted September 7, 1979. The National Science Foundation (Grant No. DAR 7824889) provided financial support. One of us (K.W.F.) acknowledges the Research Grants Committee, University of Hong Kong, and H.Y.S. acknowledges the National Science Council of the Republic of China for financial support.
On-Line Reversed Phase Liquid Chromatography-Mass Spectrometry
B. L. Karger," D. P. Kirby, and Paul Vouros
Institute of Chemical Analysis, Northeastern University, Boston, Massachusetts 02 1 15
R. L. Folk and B. Hidy
Battelle Columbus Laboratories, Columbus, Ohio 4320 7
The addition of a modified segmented-flow extractor between a liquid chromatograph (LC) and a mass spectrometer (MS) permits the direct coupling of an LC, operated in the reversed phase mode, to an MS without compromising the operational characteristics of either. This combination is accomplished by the extraction of solutes into a volatile organic solvent, which is then transported into the MS via a moving belt lnter- face. The system has been tested with a mobile phase con- sisting of 40-60 (v/v) MeOH-H,O, 0.1 M NaH,PO,, pH 2.5 at a flow rate of 0.5 mL/min and was operated for a significant period of time with no deterioration of the performance of the MS. The applicability of the interface to the analysis of car- bamate pesticides has been examined. The effects of the interface on peak broadening and sample recovery have also been examined. This system provides a means of performing reversed phase liquid chromatography, even with nonvolatile buffers, in an on-line combination with an MS.
The direct coupling of a high performance liquid chroma-
tograph (HPLC) to a mass spectrometer has been the subject of a number of investigations during the past four to five years. In a recent review, Arpino and Guiochon (1) summarized the current state of the ar t on this subject. The following ap- proaches have been explored for a direct liquid chromato- graph-mass spectrometer (LC-MS) combination: (1) a moving wire/belt system that transports the LC effluent through a series of vacuum locks, where the solvent is evaporated and the sample is then introduced into the ion source for analysis by electron impact ionization (EI) or chemical ionization (CI) (2) ; (2) a 1% split of the LC effluent into the MS, the LC solvent being used as a CI reagent gas (3) ; (3) a vacuum nebulizing interface to introduce the total effluent from a micro LC into the ion source ( 4 ) ; (4) a system tha t converts the LC effluent into a molecular beam by forcing it through a nozzle restriction followed by flash vaporization using a laser beam ( 5 ) or sonic radiation (6) and then MS analysis in the E1 or CI mode; (5) the direct vaporization of the total effluent into the MS ion source followed by CI under atmospheric pressure ionization conditions (API) (7); and (6) a silicone membrane enrichment device which removes the solvent and
0003-2700/79/0351-2324$01,00/0 1979 American Chemical Society