meteorological conditions for the probable...
TRANSCRIPT

HYDROMETEOROLOGICAL REPORT NO. 42
-Meteorological Conditions for the Probable Maximum Flood
on the Yukon River Above Rampart, Alas~a
U.S. DEPARTMENT OF COMMERCE ENVIRONMENTAL SCIENCE SERVICES ADMINISTRATION
WEATHER BUREAU
Washington
May 1966

*No·. 1. *No. 2. *No. 3. *No. 4. *No. 5. *No. 6. *No. 7.
*No. 8.
*No. 9.
*No. 10. *No. 11.
*No. 12. *No. 13. *No. 14. *No. 15. *No. 16.
HYDROMETEOROLOGICAL REPORTS
(Nos. 6-22 Numbered Retroactively)
Maximum possible precipitation over the Ompompanoosuc Basin above Union Village, Vt. 1943. Maximum possible precipitation over the Ohio River Basin above Pittsburgh, Pa. 1942. Maximum possible· precipitation over the Sacramento Basin of California. 1943. Maximum possible-pre'cipitation over the Panama Camil Basin. 1943. Thunderstorm rainfall. 1947. A preliminary report on the probable occurrence of excessive precipitation over Fort Supply Basin, Okla. 1938, Worst probable meteorological condition on Mill Creek, Butler and Hamilton Counties, Ohio. 1937. (Unpub-
lished.) Supplement, 1938. · .,-· A hydrometeorological analysis of possible maximum precipitation over St. Francis River Basin above· Wappa-
pello, Mo. 1938. . · A report on the possible occurrence of maximum precipitation over White River Basin above Mud Mountain
Dam site, .Wash. 1939. Maximum possible rainfall over the Arkansas River Basin above Caddoa; Colo. 1939. Supplement, 1939 ..
·A preliminary report on the maximum possible precipitation over the Dorena, Cottage Grove, and Fern Ridge Basins in the ·willamette Bashi, Oreg. 1939. · ·
Maximum possible precipitation over the Red River Basin above Denison, Tex. 1939. A report on the. maximum possible precipitation over Cherry Creek Basin in Colorado. 1940. The frequency .of flood-producing rainfall over the Pajaro River Basin in California. 1940. A report on depth-frequency relations of thunderstorm rainfall on the Sevier Basin, Utah. 1941. A preliminary report on the maximum possible precipitation over the Potomac and Rappahannock River Basins.
1943. *No. 17. Maximum possible precipitation over the Pecos Basin of New Mexico. 1944. (Unpublished.) *No. 18. Tentative estimates of maximum possible flood-producing meteorological conditions in the Columbia River
Basin;· 1945. _ _ *No. 19. Preliminary report on depth-duration-frequency characteristics of precipitation over the Muskingum Basin for
1- to 9-week periods. 1945. *No. 20. An estimate of maximum possible flood-producing meteorological conditions in the Missouri River Basin above
·Garrison Dam site. 1945 . . *No. 21. A hydrometeorological study of the Los Angeles are!!-. 1939.
*No. 21A. Preliminary report on maximum possible precipitation, Los Angeles area, California. 1944. ~*No. 21B. Revised report on maximum possible--precipitation, Los Angeles area, California. 1945. · *No. 22. An estimate of maximum possible flood-producing meteorological conditions in the Missouri River Basin between
Garrison and Fort Randall. 1946, *No. 23. Generalized estimates of maximum possible precipitation over the United States east of the 105th meridian, for·
areas of 10,200, and 500 square miles. 1947. *No. 24; Maximum possible precipitation over the San Joaquin Basin, Calif. 1947. *No. 25. Representative 12-hour dewpointsin major United States storms east of the Continental Divide. 1947. *No. 25A. Representative 12-hour dewpoints in major United States storms east of the Continental Divide. 2d edition.
1949. *No. 26. Analysis of winds over Lake Okeechobee during tropical storm of August 26-27, 1949. 1951. *No. 27 Estimate of rriaximurri possible precipitation, Rio Grande Basin, Fort Quitman to Zapata. 1951. *No. 28. Generalized estimate of maximum possible precipitation over New England and New York. 1952. *No. 29. Seasonal variation of the standard project storm for areas of 200 and 1,000 square miles east of 105th meridian.
1953. *No. 30. Meteorology of floods at St. Louis. 1953. (Unpublished.) N~. 31. Analysis and synthesis of hurricane wind patterns over Lake Okeechobee, Florida. 1954. No. 32. Characteristics-of United States hurricanes pertinent to levee design.for Lake Okeechobee, Florida. 1954. No. 33. Seasonal variation Qnhe probable maximum precipitation east of the 105th meridian for areas from 10 to 1,000
square miles and durations of 6, 12, 24, and 48 hours. 1956. No. 34. Meteorology of flood-producing storms in the Mississippi River Basin. 1956. No.· 35. Meteorology of hypothetical flood sequences in the Mississippi River Basin. 1959 .
.. No. 36 .. Interimreporl;-,-:probable maximum precipitation in California. 1961. • .. No. 37 Meteorology of hydrologically critical storms in California. 1962. ~' No. 38. Meteorology of flood-producing storms in the Ohio River Basin. 1961. "<''No. 39. Probable maximum precipitation in the Hawaiian Islands. 1963.
No. 40. Probable maximum precipitation, Susquehanna River drainage above Harrisburg, Pa. 1965. No. 41. Probable maximum and TVA precipitation over the Tennessee River Basin above Chattanooga. 1965.
•out of pr!ut

U.S. DEPARTMENT OF COMMERCE
ENVIRONMENTAL SCIENCE SERVICES ADMINISTRATION
U.S. DEPARTMENT OF THE ARMY
CORPS OF ENGINEERS
HYDROMETEOROLOGICAL REPORT NO. 42
Meteorological Conditions for the Probable Maximum Flood
on the Yukon River Above Rampart, Alaska
Prepared by
Hydrometeorological Branch
Office of Hydrology
Weather Bureau
Washington, D.C.
May 1966
For sale by the Superintendent of Documents, U.S. Government Printing Office Washington, D.C., 20402 - Price 70 cents

TABLE OF CONTENTS
Page
CHAPTER I. INTRODUCTION 1
CHAPTER II. PROBABLE MAXIMUM SNOWPACK 5
CHAPTER III. WINDFLOW PATTERNS FOR HIGH OCTOBER-APRIL PRECIPITATION 21
CHAPTER IV. CONDITIONS FOR HIGH SNOWMELT TEMPERATURES 28
CHAPTER V. TEMPERATURES AND DEW POINTS 34
CHAPTER VI. WINDS 43
CHAPTER VII. RADIATION 48
CHAPTER VIII. METEOROLOGICAL SUMMARY OF ALASKAN INTERIOR AND YUKON STORMS 63
CHAPTER IX. 72-HOUR PMP 72
CHAPTER X. POST-PMP RAIN 82
CHAPTER XI. APPLICATION OF PRESENTED CRitERIA 87
EXAMPLES TABLE 11-1, UPPER BASIN SNOWMELT CRITERIA WITH PMP BEGINNING JUNE 1 93
TABLE 11-2, LONG;WAVE RADIATION COMPUTATIONS 94
ACKNOWLEDGMENTS 95
REFERENCES 96
iii

FIGURES
1-1. Yukon Basin location map
2-1. Maximum observed October-April precipitation,
2-2.
2-3.
2-4. 2-5.
2-6.
2-7.
2-8. 2-9.
Yukon Basin Log-normal plot, October-April precipitation, University Experiment Station Station 100-yr. October-April precipitation, Yukon Basin Mean October-April precipitation, Yukon Basin Ratio of maximum to mean October-April precipitation, Yukon Basin Relation of maximum to mean October-April precipitation, various stations Relation of maximum to mean precipitation, Yukon stations Synthetic season (October-April) precipitation Adopted precipitation-elevation relations, Yukon Basin
3-1. 700-mb composite - April, high precipitation
3-2.
3-3.
3-4.
3-5.
3-6.
3-7.
3-8.
4-1.
4-2.
4-3.
4-4.
4-5.
cases 700-mb composite - April, low precipitation cases 700-mb composite - spring, high precipitation cases 700-mb composite - spring, low precipitation cases 70Urmb composite - winter, high precipitation cas·es 700-mb composite - winter, low precipitation cases 700-mb composite - fall, high precipitation cases 700-mb composite - fall, low precipitation cases
Early spring warm period with east to sou the as t winds Early spring warm period with south to southeast winds Late spring warm period with thermal trough and High to northeast Late spring warm period with thermal Low under warm ridge Sea-level pressure composite, warm Aprils
iv
Referred to in paragraph Page
1.03
2.04
2.05
2.05 2.08
2.08
2.09
2.09 2.11
2.19
3.03
3.03
3.04
3.04
3.04
3.04
3.04
3.04
4.04
4.04
4.06
4.06 4.07
2
6
9
10 11
12
14
14 15
19
22
22
24
24
25
25
26
26
29
29
31
31 32
5-1.
5-2. 5-3. 5-4.
5-5.
6-1. 6-2.
7-1.
7-2.
7-3.
7-4.
7-5.
7-6.
7-7. 7-8.
7-9.
7-10.
FIGURES (Cont'd.)
Adopted seasonal and durational variation of snow-free temperatures, Fairbanks Enveloping 1-day station mean temperatures Enveloping 1-day basin mean temperatures Durational variation of temperature, basin above Rampart Daily temperatures during PMP storm
Maximum winds for the snowmelt season Average windspeed variation with basin width
Seasonal variation of daily, clear-sky, solar radiation in Alaska and northwest Canada Seasonal variation of maximum daily solar radiation, Fairbanks Seasonal variation of ratio of clear-sky, solar radiation received at ground to that at top of atmosphere Location of solar radiation stations near Yukon Basin ~urational variation of solar radiation, Fairbanks Enveloping solar radiation for 1, 7, 15, and 30 days - Fairbanks Black-body radiation Back radiation from the atmosphere with clear skies Variation in effective cloud amount with solar radiation Variation of solar radiation with elevation, Yukon Basin
8-1. Tracks of surface Lows in westerly-type fall
8-2.
8-3. 8-4. 8-5. 8-6.
storms Tracks of surface Lows in southwesterly-type storms Sea-level chart, September 11, 1915 Sea-level chart, September 12, 1915 Isohyetal map, September 10-12, 1915 Tracks of Lows in southerly-type storms
v
Referred to in paragraph Page
5.03 5.03 5.09
5.10 5.14
6.02 6.09
7.04
7.05
7.07
7.08
7.10
7.11 7.14
7.15
7.19
7.26
8.04
8.05 8.05 8.05 8.05 8.06
35 37 37
38 38
44 44
49
51
52
52
54
56 58
58
60
60
64
66 67 68 69 70

9-1.
9-2.
9-3. 9-4. 9-5. 9-6.
10-1. 10-2.
FIGURES (Cont'd.)
Maximum 12-hr. persisting 1000-mb dew points -May Maximum 12-hr. persisting 1000-mb dew points -June Barrier heights to the Yukon Basin Depth-area relations Synthetic 3-day storm isohyetal pattern Variation of 3-day PMP during snowmelt period
June maximum station precipitation, Yukon Basin Seasonal variation of summer 30-day precipitation
vi
Referred to in paragraph Page
9.05 74
9.05 75 9.07 77 9.11 79 9.12 81 9.14 81
10.03 84 10.04 85

Chapter I
INTRODUCTION
Purpose and authorization
1.01. The purpose of this report is to provide meteorological data needed ·to estimate the probable maximum flood from the Yukon River drainage basin above a proposed dam site at Rampart, Alaska.
1.02. This report was requested and authorized by the Office of the Chief, Corps of Engineers, in a memorandum dated July 12, 1961 addressed to the U. S. Weather Bureau, Hydrometeorological Branch.
Scope
1.03. The Yukon River drainage basin above Rampart covers approximately 200,000 square miles (fig. 1-1). In this report the portion above Woodchopper (121,000 sq. mi.) is called th~ upper basin, and the remainder (79,000 sq. mi.) is called the lower basin. Data presented for these areas include probable maximum snowpack, critical melt factors and probable maximum precipitation (PMP) values which may be expected during the snowmelt season. PMP is the greatest rainfall depth over the basin the atmosphere can produce for specified durations during the snowmelt season. Maximum values are given for air temperature and dew point, both over snow cover and snow-free ground, for anemometer-level winds, and for long- and shortwave radiation. Variation of snowmelt parameters for area, duration, and elevation are given where appropriate. · The PMP is determined for durations up to 72 ~ours and areas from 75,000 to 125,000 square miles and an isohyetal pattern given. Post-melt-season rainfall is given for 30 days duration. An example shows how the meteorological melt factors may be used in computing daily snowmelt. The effects of forest cover on melt and estimates of albedo of snow are not included in this report.
Specific requirements
1.04. Conferences between representatives of the Office of the Chief and the Hydrometeorological Branch developed a number of requirements based upon completed studies and the hydrology of the watershed. Briefly the major decisions were: 1) To determine probable maximum snowpack that would be available for melt averaged respectively over the upper and lower basins. Maximized snowpack over smaller sub-basins would not be required. 2) A single beginning date of melt was considered adequate for the whole drainage basin, this date to be comparatively late but not the latest possible. May 15 was determined as a reasonable selection. 3) PMP by 6-hr. increments of three days centered over the drainage above Woodchopper, followed by 3-day PMP over the intervening area between Woodchopper and Rampart placed most critically with respect to time, geography, and peak snowmelt

'1<5" 1..,. 135' N
BEAUFORT SEA
65'
I GULF OF ALASKA
155" 150' 145' 140' 13()'
Figure 1-1. Yukon Basin location map

runoff would determine the critical flood hydrograph. The PMP should be presented in such a way that its beginning date can be varied within the snowmelt period. 4) Snowmelt criteria should include all meteorological factors in the generalized snowmelt equations of "Runoff from Snowmelt"
3
(1). 5) Subordinate to the 3-day PMP requirement, long-duration rain immediately following the snowmelt and rain flood is required. It is believed that the long-duration rain need not be of PMP magnitude, but rather on the order of the most severe that has been observed in or near the basin.
General procedure
1.05. The various factors in a meteorological system defining the probable maximum spring flow on the Yukon at Rampart should be compatible. An example of compatibility is snowmelt temperatures consistent with a snow cover early in the melt period and with mostly bare ground late in the melt period. Complete compatibility is limited by what is known in snowmelt processes, sparse observational data, and the need for extrapolation beyond what has been observed.
1.06. Snowpack. Probable maximum snowpack available for melt on May 15 is developed from observed low-elevation October-April precipitation with a relatively slight increase for elevation. While water-equivalent measurements at observing stations and snow courses would be preferable basic data, such records are available for only a few seasons at Big Delta and in the Chena River Basin. Both of these locations, while adjacent to the basin, are insufficient for defining basin snowpack. The adopted adjustment for elevation does not allow for local orographic intensification by favored and steep slopes. Through maximization of basin wide average snowpack, local accumulations which can exceed the maximum basin average are compensated for by areas of less than the average.
1.07. PMP. The 3-day rain is based on seasonal and geographic transposition and moisture-adjustment of the largest 3•day storms of record. If the PMP is placed early in the snowmelt season the higher elevations may experience snow rather than rain (par. 5.15 and fig. 5-5). An elevation adjustment is included which is an approximation to orographic intensification by slopes. An example of a detailed study of orographic precipitation is contained in Hydrometeorological Report No. 36 (2). Two reasons why a similar treatment was not used in the Yukon are: 1) The mountains are not oriented to provide a general continuous lift that is prescribed by the orographic model. 2) The almost complete lack of high-elevation precipitation measurements in the Yukon Basin does not allow a check on the applicability of any particular mathematical model for computing orographic precipitation.
1.08. Temperature and dew point. Seasonal envelopes of highest observed daily mean temperatures over snow cover and over snow-free ground are determined for durations of 1 through 40 days for two long-record stations. Sequences of daily values are derived from these envelopes and adjusted for the size of the basin. During the occurrence of PMP storm,

4
adopted temperatures are based upon enveloping 12-hr. persisting dew point maps covering Alaska. For the primary snowmelt period dew points are derived from observed temperature-dew point differences during warm periods at Fairbanks.
1.09. Radiation. Envelopes of observed short-wave radiation at Fairbanks for 1 to 30 days duration are used to derive daily sequences. Net long-wave radiation estimates are based on surface temperatures.
1.10. Wind. An analysis of upper winds at Fairbanks gives 100-yr. return-period winds at pertinent levels and their durational variation. High winds during periods of below-freezing temperatures were excluded. A short record of winds at Gulkana Glacier in southern Alaska is used to transform free-air winds to surface winds.

5
Chapter II
PROBABLE MAXIMUM SNOWPACK
Introduction
2.01. Unusually high flows on the Yukon River above Rampart have resulted from an above-normal spring snowpack, critical melt factors or critical combinations of snowpack and melt factors. There is no evidence that, in the future, a greater snowpack cannot be followed by more critical melt factors to produce a flood flow considerably greater than what has been experienced. In this chapter, an estimate is given of the probable maximum snowpack available for a melting period beginning on May 15. Critical melt factors, compatible with this snow cover are developed in chapters V, VI and VII.
2.02. Basic data for determining probable maximum snowpack was accumulated precipitation from October 1 to April 30. While snow depth and quality give snowpack directly, their measurement is rare in the Yukon Basin. Precipitation values, although not uniformly spaced or representative of the basin elevation, are much more plentiful. Furthermore, an assumption of little or no melt from October to April is reasonable for determining probable maximum snowpack.
2.03. Several methods are used for estimating accumulated OctoberApril precipitation over the Yukon Basin. Results, summarized in table 2-4, show fairly good agreement. One value is then recommended. Because the data from which the estimates are derived come from low elevations, this estimate is increased to reflect the effect of higher elevations. Study of precipitation-elevation relations in analogous regions elsewhere in the United States is the basis for this adjustment.
Average station maximum observed seasonal precipitation
2.04. A lower estimate of maximum basin-wide snowpack would be to assume that the maximum-observed October-April precipitation of record at each station occurred in the same October to April period. These values are shown on figure 2-1 for all stations in and near the subject basin, along with the number of complete seasons of record. Records were surveyed through the 1960-1961 water year. Arithmetical averages of these values for stations with five or more years of record are 8.3 inches for the upper basin (above Woodchopper) and 7.9 inches for the lower (between Woodchopper and Rampart). Since the maximum observed precipitation is a function of length of record. it can be expected that these averages will be exceeded in the future. There is some maximization in the averages through the assumption that the maximum at each station occurs in a single season. However, this is limited by the fact that broad scale synoptic features of the heavy snow-accumulation season are effective over large areas. As an example, in the 1936-1937 season maximum or near maximum precipitation of record occurred at stations 400-500 miles apart.

8o7 (36)
To nona
7o7 (2)
Wi1eman
8 e3 Bettles
(17)
10.4
(S4) 13•4 Monle'Y Hot Spfing\ (2\)
Nenana 8o2 (24)
LOWER BASIN
7 e4 fort Yukor'l
(36)
Old Crow 2o8 (2)
Circle Hot Springs
12.7 (52)10o 0
(11)
Eielson field
s.31!.ig t: \Ia
(18)
Tanacross 5 e6 (11)
Eagle
5o8 (47)
l!.oundory 4e3 (4)
Northway 4.5 (18)
10o2 (42)
Dowsor'l
·o.s Snag
(16)
) NUMBER OF COMPLETE SEASONS
!JO 0 50 MILES
6eOAklavik
(25)
9• 6 Elsa
(4) 7e6 Mayo Londing
(32)
5e8fart Selkirk
(2)
100 I (9)
6 0 5 (2)
Pine Creek
Cormadcs
70 1 (18)
Figure 2-1. Maximum observed October-April precipitation (inches)
0'
UPPER BASIN
Frances lake IOo4
(8)
Watson lake 12o 8
White Haru (19)
6 •5 Care ross
(6)

7
100-yr. return period October-April precipitation
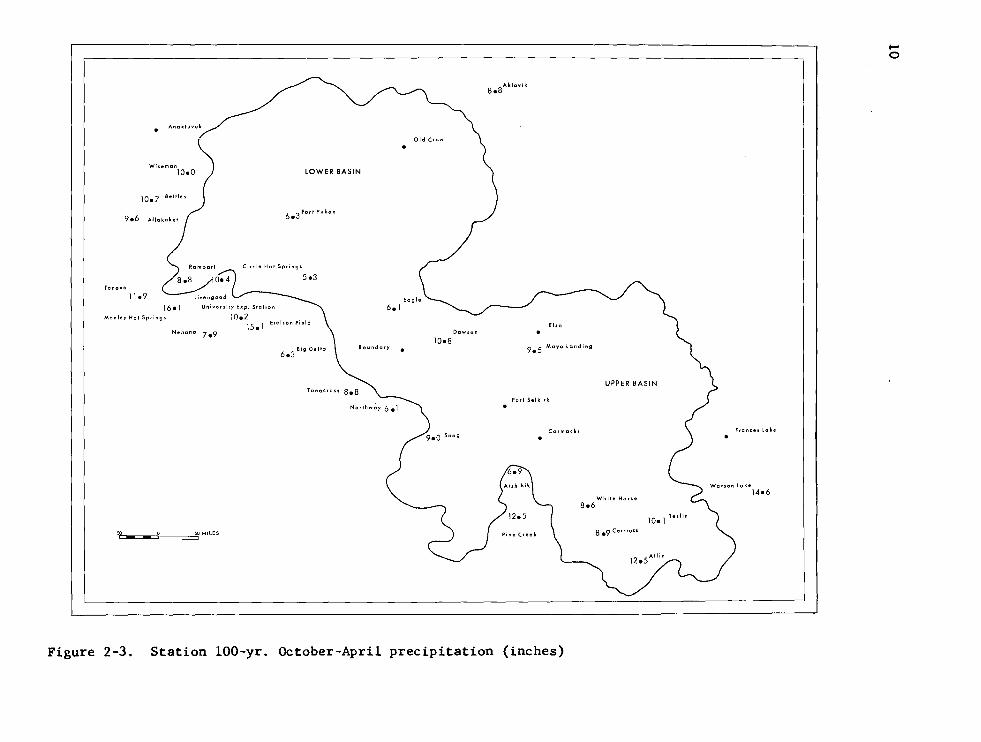
2.05. Station average. Observed seasonal precipitation amounts at stations with five or more years of record in the Yukon Basin were ranked and plotted on log-normal probability paper. Figure 2-2, the logarithmic plot of October-April precipitation for the period of record at University Experiment Station is given as an example of these frequency plots. From eye-fitted straight lines drawn to such plots, station 100-yr. return period October-April precipitation values were determined and plotted in figure 2-3. At several stations these values have been exceeded. University Ex?eriment Station has observed 11.3 and 12.7 inches, compared to the 100-yr. return value of 10.2 inches. Fort Yukon has observed 7.4 inches while its 100-yr. value is 6.3 inches. Six other stations have a significant "outlying" point on the frequency plots. Averages of the 100-yr. values at stations in and near the upper and lower basins are 9.9 and 9.5 inches, respectively.
2.06. Basin average. The upper- and lower-basin average October-April precipitation was determined for each season from 1930-1961. For each season the basin average is the average of station values in and near the basin. From these basin averages the 100-yr. return values were 9.5 and 7.9 inches, respectively, for the upper and lower basin. Here again an outlier (9.13 in. average for the 1936-1937 season) exceeded the 100-yr. return value for the lower basin.
2.07. The 100-yr. return value determined from averaging station 100-yr. values over the basin exceeds that derived from yearly basin precipitation. This is in part due to using the entire period of record for the former while the 1930-1961 period was used for the latter.
Enveloping ratio of maximum to mean accumulated precipitation
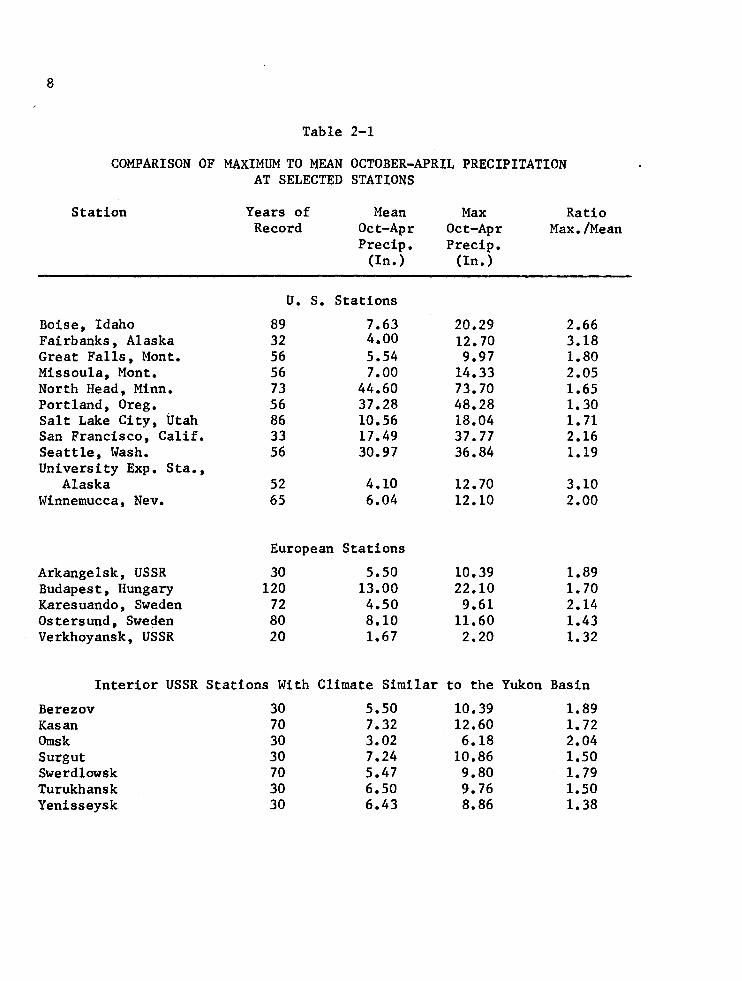
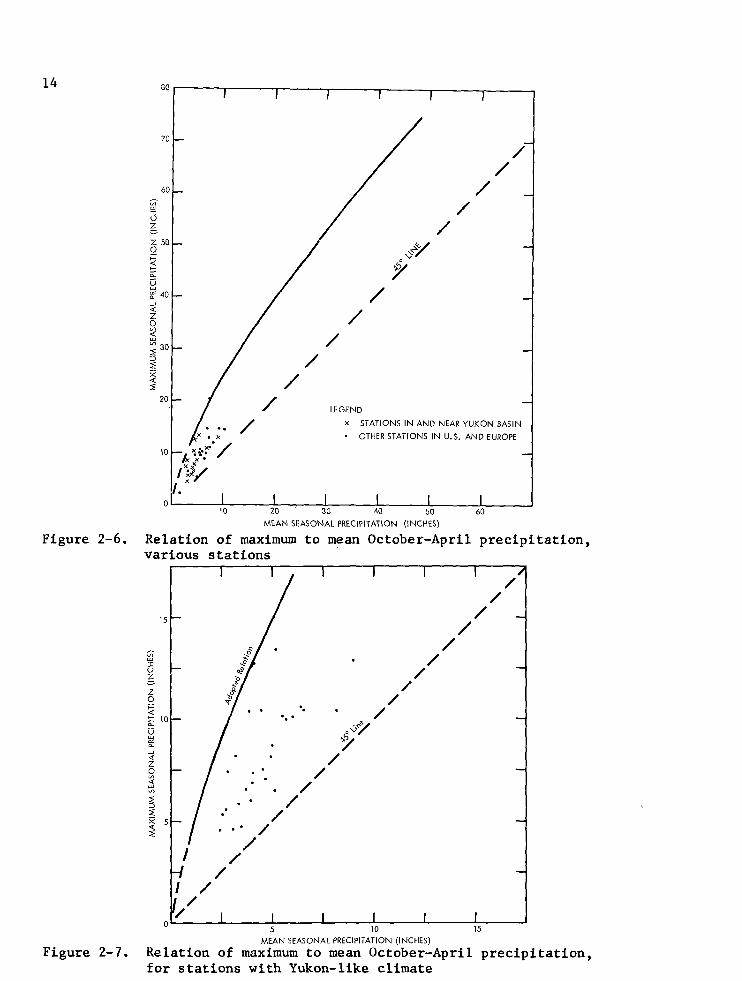
2.08. Comparison of maximum observed to mean October-April precipitation at stations gives insight as to how extreme the observed values in the basin are relative to other stations, and provides a method of maximizing basin precipitation. Figure 2-4 shows the mean October-April precipitation for all stations in and near the subject basin. On figure 2-5 are plotted the ratio of maximum (fig. 2-1) to mean (fig. 2-4) for stations with five or more years of record. The highest ratios shown are 3.1 at Fairbanks (not plotted) and at University Experiment Station. The extreme seasonal precipitation of 12.7 inches at University Experiment Station (1906-1907) is closely matched by the 11.4 inches wHich occurred during the 1936-1937 season. Records at a number of stations, mostly at high latitudes, were selected from "World Weather Records" (3 and 4) and comparisons made of the ma~imum-to-mean ratio. Pertinent data for these stations are given in table 2-1. None of these ratios is as high as at University Experiment Station or Fairbanks, indicating that these two seasons were extreme.
2.09. The maximum-to-mean ratio decreases with increasing mean values, figure 2-6. Stations with means greatly exceeding those in the Yukon Basin have been included to bring out the general trend in the relation. An
8
Table 2-1
COMPARISON OF MAXIMUM TO MEAN OCTOBER-APRIL PRECIPITATION AT SELECTED STATIONS
Station Years of Mean Max Ratio Record Oct-Apr Oct-Apr Max./Mean
Precip. Precip. (In.) (In.)
u. s. Stations
Boise, Idaho 89 7.63 20.29 2.66 Fairbanks, Alaska 32 4.00 12.70 3.18 Great Falls, Mont. 56 5.54 9.97 1.80 Missoula, Mont. 56 7.00 14.33 2.05 North Head, Minn. 73 44.60 73.70 1.65 Portland, Oreg. 56 37.28 48.28 1. 30 Salt Lake City, Utah 86 10.56 18.04 1.71 San Francisco, Calif. 33 17.49 37.77 2.16 Seattle, Wash. 56 30.97 36.84 1.19 University Exp. Sta.,
Alaska 52 4.10 12.70 3.10 Winnemucca, Nev. 65 6.04 12.10 2.00
European Stations
Arkangelsk, USSR 30 5.50 10.39 1.89 Budapest, Hungary 120 13.00 22.10 1.70 Karesuando, Sweden 72 4.50 9.61 2.14 Ostersund, Sweden 80 8.10 11.60 1.43 Verkhoyansk, USSR 20 1.67 2.20 1.32
Interior USSR Stations With Climate Similar to the Yukon Basin
Berezov 30 5.50 10.39 1.89 Kasan 70 7.32 12.60 1. 72 Omsk 30 3.02 6.18 2.04 Surgut 30 7.24 10.86 1.50 Swerdlowsk 70 5.47 9.80 1. 79 Turukhansk 30 6.50 9.76 1.50 Yenisseysk 30 6.43 8.86 1.38

-V') w :c u z -z 0 1-<( t-o.. u w e:::: 0..
20-------.----~r--r----~--~--~~~~~
..... • 0 •
.... 0
······· .. ..........
UNIVERSITY EXPERIMENT STATION, ALASKA
1~------------------------------------~----~~--._~--~ 1.01 1.1 1.5 2 5 10 25 50 100 200 RETURN PERIOD (YEARS)
Figure 2-2. Log-normal plot of October-April precipitation \0
Anaktuvuk
LOWER BASIN
10o7
6e3 fcrt Yukcn
Circle Hot Springs
5o3 Tcncnc
11o9 16•1 6 0 1
Men ley Hat Springs
Nencnc 7e9
10.2 15el Eielscn field
6e3 Big Del to Boundary
Tonccrcss Be8
50 0 50 MILES
Old Crow
Dawson
10o8
9e0 Snag
Aklovik 8o8
9o5
Else
Mayo landing
fort Selkirk
Cormocks
8o6
Figure 2-3. Station 100-yr. October-April precipitation (inches)
UPPER BASIN
White Horse
lOel Teslin
8 e9 Core ross
Frances Lake
Watson toke
14•6
...... 0

Anaktuvuk
Wilemon 3 o9
4 o9 Bettles
5•0
Tonono
4.4
Manley Hot Springs
Nenono 3o2
50 0 'f MILES
Old Crow
LOWER BASIN
2e7Fort Yukon
Cirtle Hoi Springs
4ol
5•7
3 ol
Eielsonfield
Big Delta 2o5
Tonocrou 2e7
Eagle
3•3
5oS Boundory 4eQ
Dawson
Figure 2-4. Mean October-April precipitation (inches)
3•
9Aklovik
Elsa 7ol
4e4 Mayo landing
Fort Selkirk
Cormocks
4o7
UPPER BASIN
While Horse
3e7Corcrou
Se2
frances loke
9o0
......
......

LOWER BASIN
lo7
lo7 2e7fort Yukon
Tonono
2o4
Nenono 2e6
2 el Big Delio Boundary
Tonocrou 2 el
50 0 SO MILES
Old Crow
Dow1on
lo9
Aklovik loS
lo7
Elsa
Mayo landing
Fort Sel.kirk
Cormoclr.s
loS
Figure 2-5. Ratio of maximum to mean October-April precipitation
lo3
White Hone
le8Corcrou
Frances Lake
lo4
..... N

13
expanded scale plot for low mean seasonal values (i.e., restriction to Yukonlike climate) is shown in figure 2-7 along with the enveloping curve from figure 2-6. Entering this relation with the mean seasonal precipitation, 4.6 inches for the total basin, gives maximum basin seasonal snowpack of 13.8 inches. Similarly determined upper and lower basin maximum values are 15.7 and 12.5 inches. As more observations become available the maximum observed will increase. Use of the station relation for basin average maximum, however, is assumed to compensate this effect.
Synthetic seasonal maximum precipitation
2.10. A traditional approach to the problem of estimating maximum seasonal precipitation is to assume that the maximum observed values for shorter periods, say a month, occurred in the same season of very high precipitation. For example, if the highest October precipitation occurred in 1950, the highest November in 1937, etc., these monthly maxima are added to give an accumulation for the synthetic season.
2.11. From station maximum monthly data. Synthetic seasonal precipitation made up of maximum monthly values from October through April for each station in and surrounding the Yukon River drainage was determined. Results are shown for each station in figure 2-8. Length of record varies from 6 to 54 years. Averages of station values in and near the upper and lower basins are 13.9 and 13.4 inches, respectively.
2.12. From basin average maximum monthly data. For the period 1931-1961 the highest average precipitation over each of the two sub-basins for each month was determined. Combining these highest monthly sub-basin averages gives 11.0 and 13.3 inches for the upper and lower basins, respectively.
2.13. Statistical support for the synthetic season method. To demonstrate non-randomness or persistence in monthly precipitation lends considerable support to combining highest values of record from different years. Two sets of Alaska data were tested to determine the degree of persistence in monthly values.
2.14. The fir~t test was on monthly precipitation at University Experiment Station, College, Alaska. Here we have 52 years of precipitation records, 1906 to 1960 with three seasons missing. If the monthly values which give the two outlying seasonal totals of 11.4 inches (1936-37) and 12.7 inches (1906-07) did not occur randomly, then it can be presumed that some persisting mechanism existed for several months in the two highest October-April seasons and supports the view that a synthetic season of high observed monthly precipitation is realistic.
2.15. Each of the 52 October precipitation values was assigned a number, randomly from 1 to 52. Similarly the numbers 1 to 52 were assigned randomly to the 52 November values, the 52 December values, etc. Summing the monthly values with like random numbers (October through April) gave 52 seasons of random precipitation. These were then ranked from lowest to
14
/
/ /
/ /
/
LEGEND
x STATIONS IN AND NEAR YUKON BASIN
• OTHER STATIONS IN U.S. AND EUROPE
MEAN SEASONAL PRECIPITATION (INCHES)
Figure 2-6. Relation of maximum to mean October-April precipitation, various stations
·. · ..
MEAN SEASONAL PRECIPITATION (INCHES)
Figure 2-7. Relation of maximum to mean October-April precipitation, for stations with Yukon-like climate

Anaktuvuk
Wiseman 13o1
14.0 Bettles
16o1
Tonono
18o2
Manley Hot Springs
Nenono l7e2
sow m? =
Old Crow
LOWER BASIN
Be9fort Yukon
Circle Hot Springs
9o6
23.6 lleB Eiehon Field
lOeO Big Del to
Eagle
8o9
Boundary 18o3
Dow son
Aklovik 12o1
15o9
Elsa
Mayo Landing
Fort Selkirk
Cormocks
10.9
Figure 2-8. Synthetic season (October-April) precipitation (inches)
UPPER BASIN
White Horse
l4e2 Teslin
17e3Corcrou
l4e0Fronces loke
Wohon lake 19o4
...... V1

16
Table 2-2
OBSERVED AND RANDOM OCT-APR PRECIPITATION AT UNIVERSITY EXPERIHENT STATION, ALASKA
Year Ranked Observed Ranked Random Year Ranked Observed Ranked Random Precipitation Precipitation Precipitation Precipitation
(In.) (In.) (In.) (In.)
1918 1.49 1.31 1943 3.92 3. 97 1952 1.54 1.71 1927 3.95 4.00 1953 1.88 1.89 1942 4.00 4.01 1923 2.23 2.00 1922 4.35 4.08 1938 2.37 2.00 1933 4.36 4.10 1940 2.37 2.06 1959 4.36 4.13 1930 2.61 2.46 1916 4.40 4.25 1909 2.64• 2.48 1913 4.42 4.37 1926 2.67 2.52 1934 4.49 4.38 1944 2.79 2.53 1951 4.49 . 4.39 1932 2.84 2.59 1950 4.52 4.43 1957 2.88 2.82 1948 4.55 4.48 1911 2.90 2.90 1956 4.58 4.49 1910 2.93 3.09 1915 4.73 4.58 1939 2.94 3.14 1955 4.80 4.91 1960 3.10 3.19 1914 4.88 4.95 1925 3.25 3.23 1919 4.96 4.97 1937 3.33 3.27 1921 4.98 5.16 1912 3.39 3.40 1907 5.16 5.85 1908 3.42 3.49 1947 5.35 6.02 1929 3.52 3.54 1920 5.95 6.06 1941 3. 77 3.59 1935 6.42 6.12 1954 3.79 3.70 1917 6.80 6.24 1924 3.84 3.80 1928 6.93 7.05 1949 3.88 3.80 1936 11.37 7.17 1958 3.90 3.81 1906 12.71 7.65

17
highest. A similar ranking of the 52 actual season totals was made and the two sets of numbers compared. Table 2-2 gives the series of observed and random values. For the first 50 pairs of numbers, there are only slight differences between the two numbers (the largest difference, 13 percent). However, the 1936-1937 and 1906-1907 seasons exceeded the highest and next highest random seasons by 58 and 65 percent. This result gives qualitative support to the synthetic season approach, since the assumption of persistence appears to be the most reasonable explanation for these two anomalous years.
2.16. A second test was on average monthly precipitation over the upper and lower Yukon River Basins. Persistence in precipitation, if it exists, can be revealed by computing the correlation between adjacent monthly basin averages. Average station monthly precipitation was used in this test since areal averages tend to smooth out non-representative single station values.
2.17. Correlations between monthly averages for pairs of adjacent months for the lower and upper basins are shown in table 2-3. The years of record ~re limited by selection of stations which have concurrent years of record. For the upper and lower basin, five and four stations, respectively, were used. All but one correlation coefficient is positive, indicating there probably is a slight tendency toward persistence of precipitation from month to month over the basin. It is surmised that, in a season of exceptionally large precipitation, the month-to-month persistence may be considerably greater than that shown by the average of the years of record.
Table 2-3
LAG-CORRELATIONS BETWEEN ADJACENT MONTHS OF AVERAGE PRECIPITATION OVER LOWER AND UPPER YUKON BASINS
Adjacent months Lower basin Upper basin r N r N
Oct - Nov .09 15 .12 17 Nov - Dec .17 13 .13 16 Dec - Jan .27 14 - .26 16 Jan - Feb .32 16 .06 15 Feb - Mar .07 14 .10 16 Mar - Apr .43 13 .04 17
(r is correlation coefficient and N is number of years of record.)

18
1. 2. 3. 4.
5. 6.
Table 2-4
ESTIMATES OF OCTOBER-APRIL MAXIMUM PRECIPITATION
Method
Average of station maximum (par. 2.04) Station average 100-yr. return (par. 2.05) Basin average 100-yr. return (par. 2.06) From enveloping relation of maximum to
mean (par. 2 .08)
Upper Basin Average Depth
(In.)
8.3 9.9 9.5
Lower Basin Average Depth
(In.)
7.9 9.5 7.9
Station-average synthetic season (par. 2.11) Basin-average synthetic season (par. 2.12)
15.7 (13. 8 13.9 11.0
12.5 for total basin)
13.4 13.3
Adopted probable maximum snowpack
2.18. Table 2-4 lists estimates of maximum October-April precipitation obtained by the various methods. Of these the 13.8-in. value for the total basin based on the maximum-to-mean relation (method 4) is adopted as the estimate of probable maximum snowpack. This value in good agreement with the synthetic season values (averaging 12.9 in. for the basin), is applicable to the average elevation of the stations providing basic data.
Adjustment of pack for elevation
2.19. Very few high-elevation precipitation records are available for Alaska from which an estimate of the variation with elevation could be made. A somewhat analogous region to that of the Yukon Basin but with more precipitation records was selected for such a study. This is the plateau region of western Colorado and eastern Utah, all above 4000 feet. Stations were chosen such that those influenced by strong local orographic effects were eliminated. Average November-March precipitation at these stations (mostly for years 19 31-1952) gave the following variation with elevation:
Elevation (1000's ft.) 4 Percent of 4000-ft. value 100
5 127
6 163
7 207
8 240
9 254
For elevations 2000-4000 ft. average Novernber-Harch precipitation at stations in southwest Idaho and southeast Oregon least affected by orography gave the following variation with elevation:
Elevation (1000's ft.) 2 Percent of 2000-ft. value 100
3 110
4 122
Combining and smoothing these precipitation-elevation relations into one and extrapolating to 1000 feet results in the variation adopted for OctoberApril precipitation in the Yukon Basin given by curve A in figure 2-9. The percent of 1000 feet and depths in each elevation band is given in table 2-5.

9 c B A
8
7
-+--- OCT. -APR.
----;-6 PRECIPITATION I-u.. Vl
0 0 0 .._..
z 0 I-<(
> UJ ...J UJ
5
4
3
2
BASED ON MAXIMUM 3-DAY, MONTHLY, AND NOVEMBERMARCH PRECIPITATION.
4000-9000 FT: DATA FROM N. W. COLORADO-N.E. UTAH 2000-4000 FT: DATA FROM S. W. IDAHO 1000-2000 FT: EXTRAPOLATED
1L---------~----------...J_----------L---------~------~ 100 150 200 250 300
PER CENT OF 1000-FT. PRECIPITATION
Figure 2-9. Adopted precipitation-elevation relations, Yukon Basin
19
20
Table 2-5
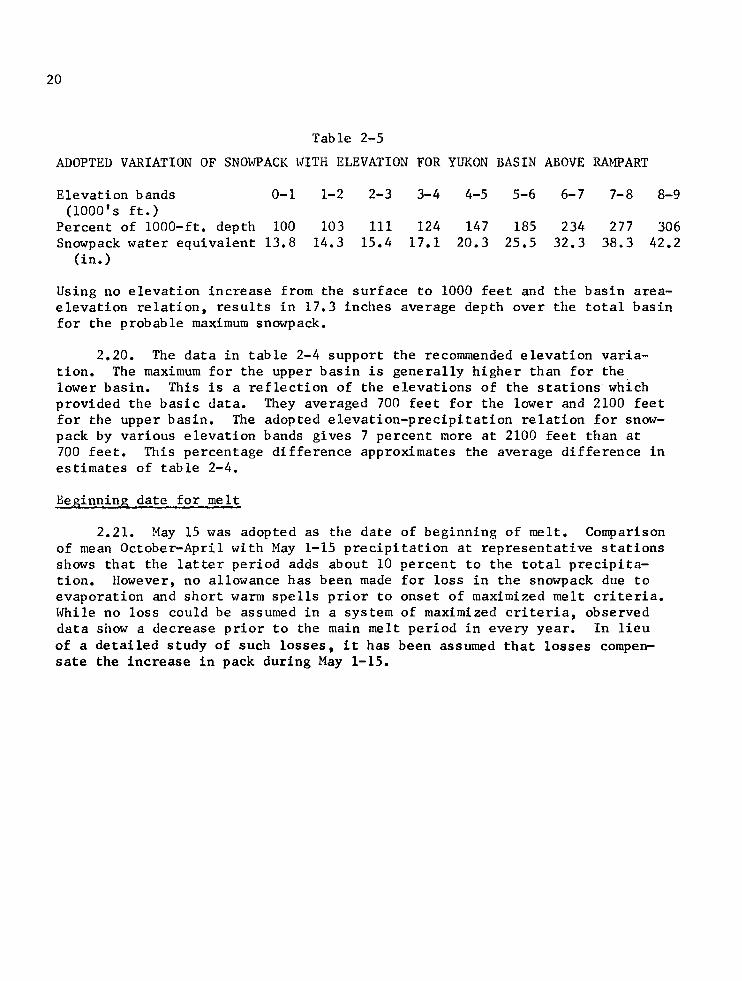
ADOPTED VARIATION OF SNOWPACK lHTH ELEVATION FOR YUKON BASIN ABOVE RAMPART
Elevation bands 0-1 1-2 2-3 3-4 4-5 5-6 6-7 7-8 8-9 (1000's ft.)
Percent of 1000-ft. depth 100 103 111 124 147 185 234 277 306 Snowpack water equivalent 13.8 14.3 15.4 17.1 20.3 25.5 32.3 38.3 42.2
(in.)
Using no elevation increase from the surface to 1000 feet and the basin areaelevation relation, results in 17.3 inches average depth over the total basin for the probable maximum snowpack.
2.20. The data in table 2-4 support the recommended elevation variation. The maximum for the upper basin is generally higher than for the lower basin. This is a reflection of the elevations of the stations which provided the basic data. They averaged 700 feet for the lower and 2100 feet for the upper basin. The adopted elevation-precipitation relation for snowpack by various elevation bands gives 7 percent more at 2100 feet than at 700 feet. This percentage difference approximates the average difference in estimates of table 2-4.
Beginning date for melt
2.21. May 15 was adopted as the date of beginning of melt. Comparison of mean October-April with May 1-15 precipitation at representative stations shows that the latter period adds about 10 percent to the total precipitation. However, no allowance has been made for loss in the snowpack due to evaporation and short warm spells prior to onset of maximized melt criteria. While no loss could be assumed in a system of maximized criteria, observed data show a decrease prior to the main melt period in every year. In lieu of a detailed study of such losses, it has been assumed that losses compensate the increase in pack during May 1-15.

21
Chapter III
WINDFLOW PATTERNS FOR HIGH OCTOBER-APRIL PRECIPITATION
Introduction
3.01. In chapter II, precipitation data are analyzed from a number of viewpoints to form judgments on the maximum seasonal snow accumulation. Additional basis for judgment is obtained by determining the windflow patterns associated with months and seasons of high precipitation and, in turn, investigating the persistence of these patterns. This material is the subject of the present chapter. The 700-mb (about 10,000 ft.) level is taken as a level of flow that is representative of the lower atmosphere. The use of this level has other advantages. It lies above most of the Yukon Basin terrain and many years of daily, mean monthly, and mean seasonal maps are available*.
Composite 700-mb maps
3.02. In order to focus on features accompanying periods of high precipitation, composite 700-mb maps were drawn. At this level, the wind direction is essentially parallel to the height contours. A composite map is the average map for a specified time, for example for five Octobers, three springs, etc. Composite 700-mb maps were constructed for monthly and seasonal precipitation periods in the Yukon Basin above Rampart. Differences between 700-mb patterns for heavy and light Yukon precipitation periods are discussed in the following paragraphs.
3.03. Monthly maps. Months of heavy precipitation in fall, winter and spring are characterized by mean southwest winds at 700 mb. By contrast, mean winds for low precipitation months are southerly~ with a 700-mb ridge east of the basin. Examples are shown in figure 3-1, a 700-mb .composite of four wet Aprils; and figure 3-2, the 700-mb pattern for a dry April.
The effect of wind direction on precipitation is undoubtedly linked with the topography. Much of the southern boundary of the basin is made up of high mountain barriers. A southerly inflow current must cross the St. Elias and ~-lrangell Ranges; hence evaporation on descent of the higher mountains has fullest effect with south winds of driest months. The southwesterly current of the high-precipitation months runs parallel to the Alaska Range and, consequently, crosses over a much lower average barrier.
The prominent 700-mb height contour ridge (fig. 3-2) immediately east of the basin is a contributing factor in promoting light precipitation. Such ridges are favored sites of descending air motion (irrespective of topography) and consequent clear skies and low relative humidity.
*Individual monthly and seasonal mean charts were furnished by the Extended Forecast Division of the Weather Bureau.

22
Figure 3-1. 700-mb composite - April, high precipitation cases (1943, 1948, 1956, 1959)
Figure 3-2. 700-mb composite - April, low precipitation cases (1953)

23
3.04. Seasonal maps. Differences in the windflow patterns for high and low precipitation seasons are only slightly less than for months. Figures 3-3 and 3-4 show the spring high- and low-precipitation 700-mb composites; 3-5 and 3-6, winter; and 3-7 and 3-8, fall, respectively. Spring is the average of the three calendar months of March, April, and May; winter is December, January, and February; and fall is September, October, and November.
Like the monthly charts, winds are southerly over the basin at 700mb in the low-precipitation cases. In high precipitation cases the basin lies, for the most part, in a WSW flow between a trough and ridge, but somewhat nearer the ridge. This location is associated with high precipitation in the central United States also (5). In the winter season high precipitation case (fig. 3-5), the northern portion of the basin is located in a zone of confluence where storm paths tend to concentrate (5).
Statistical measure of persistence of airflow over Yukon above Rampart
3.05. In chapter II the persistence of precipitation itself was analyzed. A small positive correlation was found to exist from one month to the next over the Yukon above Rampart. Similar month-to-month and seasonal correlations are found in the flow pattern, increasing confidence that the correlations are real. Lag correlations of mean monthly 700-mb height anomaly (departure from normal) are available for North America and adjacent oceans since 1932 as a 19-year summary (6) in map form.
If the Yukon Basin above Rampart is represented by the point 64°N-1400W, correlations (r) ta~en from these maps are:
r
Oct - Nov +0.40 Nov - Dec +0.25 Dec - Jan +0.10 Jan - Feb -0.10 Feb - Mar +0. 20 Mar - Apr +0.15 Apr - May -0.25
where r is the coefficient of linear correlation between pairs of successive monthly mean 700-mb heights. While these correlations appear low, they represent a sort of average persistence. In any particular year, it is fair to assume that fields of departures from normal of adjacent months may be very similar. Some areas near the basin show correlations of over +.60 for some pairs of months.
Fields of lag correlation between adjacent seasons have been studied also and some results are given by Namias (7). Here, 25 years of seasonallyaveraged 700-mb height provide the basic data.
The seasonal lag correlation charts show a surprising amount of longperiod persistence in the atmosphere. The highest seasonal persistence

24
I
HEIGHTS IN FEET
Figure 3-3. 700-mb composite - spring, high precipitation cases (1944, 1948, 1959)
Figure 3-4. 700-mb composite - spring, low precipitation cases (1933, 1938, 1947)
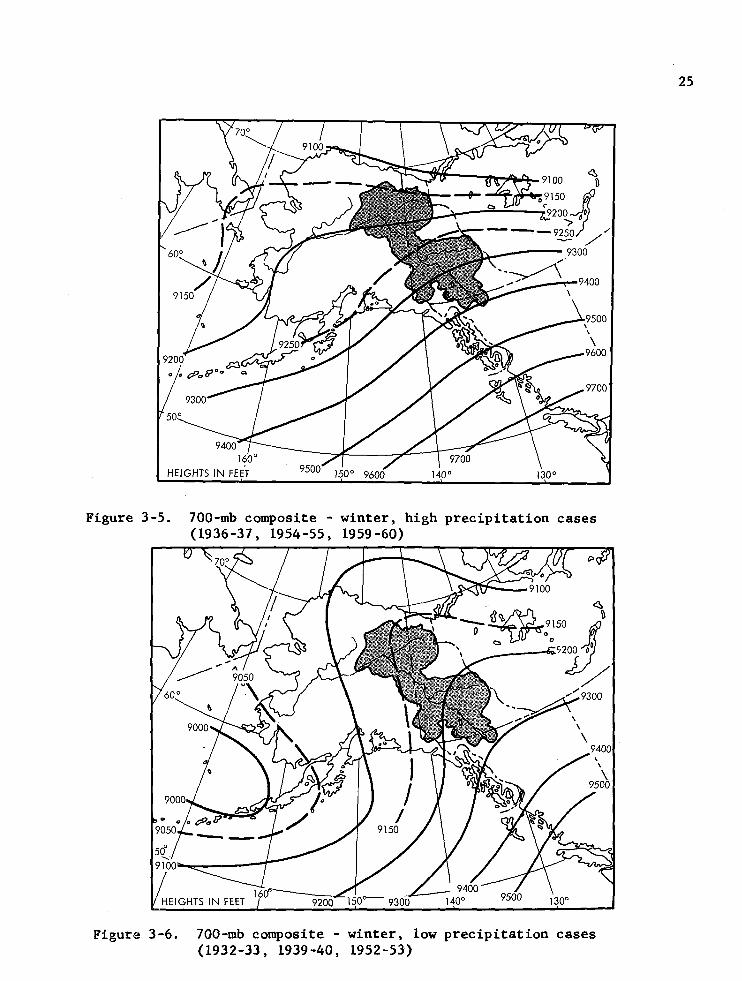
Figure 3-5. 700-mb composite - winter, high precipitation cases (1936-37, 1954-55, 1959-60)
Figure 3-6. 700-mb composite - winter, low precipitation cases {1932-33, 1939-40, 1952-53)
25

26
Figure 3-7. 700-mb composite - fall, high precipitation cases (1936, 1939, 1956)
Figure 3-8. 700-mb composite - fall, low precipitation cases (1940, 1949, 1953)

27
is centered in the sub-tropical high-pressure belt, but a secondary maximum is present over the polar region. The fall-to-winter and winter-to-spring correlations in the region of the subject basin are both about +.15. Here again, the correlation is small, indicating a slight preference, on the average, for the mean trough and ridges in the upper air to remain in the same area from fall to spring. It might be expected that, as in the monthly case, seasons may follow in which the degree of persistence is much more marked than in the average.
Similarity of seasonal to monthly precipitation-favoring flow
3.06. From the similarity of patterns of flow on high-precipitation 700-mb composite monthly and seasonal charts, it would seem that airflow typical of high precipitation can exist for an extended period of time over the Yukon Basin above Rampart. For the 3-month season, the direction of flow is almost identical to, and the mean intensity only a little less than, the middle month flow. Thus there does not appear to be a significant decay with time, up to at least three months, of features associated with high precipitation.
Causes of persistence of synoptic features associated with high precipitation
3.07. Long-period weather controls have been int~nsely investigated for several generations, dating back to mid-nineteenth century efforts to account for variations in monsoon rains in India, with only limited definitive. results. It is thought persistence may be due to anomalies of the underlying surface; for example, unusually large extent of snow cover or anomalously high sea-surface temperatures at northerly latitudes. Such anomalies tend to be self-perpetuating because they steer the storm tracks out of their usual path (on account of the anomalous air temperatures above them). The new storm tracks may, in turn, contribute to the anomalous underlying surface by increasing the snow fields, for example (6).

28
Chapter IV
CONDITIONS FOR HIGH SNOWMELT TEMPERATURES
Introduction
4.01. The most important weather features conducive to high surface temperatures in the Yukon during spring are high insolational heating, high temperatures in an upper-level High or pressure ridge, and warming due to subsidence of the air. These effects are mutually compatible. Of secondary importance is a concomitant southerly lower-level flow to advect warm air into the basin.
Data
4.02. Periods of unusual warmth over the Yukon Basin were selected from times when large temperature departures from normal prevailed both at Fairbanks, Alaska and Dawson, Yukon Territory or at each station. There is a good correlation between departures from normal at Fairbanks and at Dawson, indicating they quite well represent temperature over much of the basin. Prominent ·weather features of warm spells are discussed in this chapter.
Description of warm-weather types
4.03. The more extreme warm spells may be grouped according to similarity in pressure and wind fields over the basin. These fields, in turn, reflect the broad-scale circulation. There are characteristic early spring, transitional, and late-spring circulation types. Dates of warm spells in early and late spring are listed in figures 4-1 through 4-4. Arrows on the figures refer to surface geostrophic wind directions.
4.04. Early-spring type. During warm spells in April, the broad-scale circulation is vigorous, with fairly deep Lows and strong Highs. Lows are centered offshore to south or southwest; highest pressure is centered somewhere between the Arctic Ocean to the north and central Canada to the east. Between the deep Lows and strong Highs moderate to strong pressure gradient persists over all of Alaska and the Canadian Yukon. Geostrophic wind direction is typically SSE over the upper Yukon and ESE over the lower Yukon.
With a surface Low to the south in the Gulf of Alaska and high pressure to north and northeast (fig. 4-1), the flow over the lower and upper Yukon prevails from E and SE, respectively; positive temperature departures are greatest in the lower Yukon nearest the upper ridge of high pressure. Warm weather also results when the mean Low position is found farther west, near the Eastern Aleutians, and the surface High in northern Canada is also farther west (fig. 4-2). The ridge or High aloft is centered near the upper part of the basin and mean flow has a larger" southerly component, especially over the upper Yukon, than in figure.4-l.

170° 160° 150° 140° 130°
Figure 4-1. Early spring warm period with east to southeast winds
APRIL 18-19,1940 ..-APRIL 21-23, 1940
\ 130°
Figure 4-2. Early spring warm period with south to southeast winds
29

30
4.05. The transitional period. As the season progresses and Lows in the Gulf of Alaska become weaker, there is also a weakening of the circulation over the Yukon. Upper-level Highs remain strong but surface Highs are weakened over the interior as the change from ground cooling to warming of lower layers takes place.
During the transitional period from late April to early June, some warm spells are similar to the early period described above and illustrated in figures 4-1 and 4-2, e.g., May 26-28, 1947. But the weaker gradient between the comparatively weak Gulf Low or trough and a central Canadian ridge maintains relatively weaker surface winds under the warm upper ridge centered over the basin. Other warm spells during the transition period have pressure patterns similar to late spring (described below), but without its characteristic surface thermal Low, so that calm surface winds prevail under an upper ridge, e.g., May 12-14, 1942.
This transition period comes closest to the selected snowmelt period beginning May 15.
4.06. Late-spring type. By the end of May, a thermal trough in sealevel pressure due to heating of snow-free terrain is becoming apparent over the interior, figure 4-3. Aloft, the strong ridge or High continues to dominate during warm spells; at 500 mb it is located over the basin, oriented approximately northwest-southeast. Its surface counterpart is displaced toward cooler air to the north and east.
In some June warm spells there is a moderate SE flow over much of the basin between the marked surface thermal trough and a high pressure ridge to the northeast. The 500-mb ridge is parallel to the thermal trough and slightly to southwest.
More typical of June warm spells is light surface flow, shown in figure 4-4, about the thermal Low in the Alaskan interior. The upper ridge is oriented northwest-southeast over northern Alaska. This combination permits high temperatures, especially if the ground is snow-free.
Advective temperature feature
4.07. The deep early-May snow cover developed in chapter II would have a tendency to prolong the cold season in Alaska until a significant amount of snow melts to provide snow-free terrain necessary for full realization of solar heating. A summary of synoptic features that contribute to warmth in April (when thereis snow cover) is useful for making deductions regarding warming features that would be important for the postulated early May heavy snow cover. Composites of sea-level pressure charts for warm, normal and cold Aprils are shown in figure 4-5 for comparison. The warm April synoptic features are distinctive in that: (1) the Aleutian Low is displaced west of its normal position and (2) the flow to the east of the Low originates from a more southerly latitude. Thesame distinguishing characteristics appear also on the 700-mb composites (not shown). It is evident from figure 4-5

/ JUNE9-ll, 1957
170° -----JUNE 1\5, 1958
140° 130°
31
Figure 4-3. Late spring warm period with thermal trough and High to northeast
JUNE 9-12, 1937 JUNE 1-3, 1953 MAY 22-26, 1960
\
' '
140° 130°
Figure 4-4. Late spring warm period with thermal Low under warm ridge

0
LOW CENTER -~-~ (WARM APRILS) . ~ f::J
®/ .. LOW CENTER &:. (NORMAL APRIL)
180° ®
LOW CENTER (COLD APRILS)
1012~::.2'" 1
t~~~ cOt}--- \ _ ....____1006
1012- _ _,_ --
170° 160°
Sea-level pressure composites for April
150°
WARM APRILS 1951 ' 1953' 1956, 1957'
COLD APRILS 1954, 1955, 1959, 1960,
1958
1961
\,.o.) N

that persistence or persistent recurrence of synoptic features favoring warmth is sufficient to create significant departures for durations of a month.
Summary of characteristics of high temperature periods
33
4.08. High temperatures depend primarily on presence of a warm upper High or ridge in the vicinity of the basin. Under this High, subsidence reduces cloudiness to permit high daytime insolation. With snow-free terrain, high daytime surface temperatures are possible because of the stable lapse rate. In most early spring warm periods the surface temperature drop due to nocturnal radiation is not greatly restricted by vertical mixing in the weak low-level movement. Thus these periods of high temperatures are characterized by wide diurnal ranges.
Advection of warm air in a flow from more southerly latitudes also tends to increase temperatures in lower layers. With a snow cover over the basin, warm advection is from a latitude offshore more southerly than normal or from snow-free terrain to the south of the basin.
Downslope adiabatic heating with prevailing air movement from the upper toward the lower part of the basin further increases low-level temperatures.
Compatibility of high temperature with other snowmelt factors
4.09. The association of high temperature with high insolation is discussed in paragraph 7.12 and the compatibility of high temperature with maximum wind criteria in paragraph 6.12.

34
Chapter V
TEMPERATURES AND DEW POINTS
Introduction
5.01. The general approach to determine critical temperatures for snowmelt computations was to envelop temperatures for both snow-free and snow-on-ground conditions since this avoids the excessive maximization inherent in a single all-inclusive envelope. Gradual transition from snow-onground to snow-free temperatures is provided to permit melting of a partial snow cover by warmed air moving from over snow-free terrain and, on a lesser scale, by radiation from bare ground and rocks, etc., to the snow. In application, the snow-on-ground temperatures are used until three-fourths or more of the basin is snow free.
Dew points were derived from an empirically-determined temperaturedew-point spread except during the PMP storm when enveloping dew points of record were controlling.
Enveloping station temperature values
5.02. Index station. An inspection of daily temperature patterns over the Alaskan interior shows that the temperature data from Fairbanks, one of the few long unbroken station records in the interior (1905-1962) is a suitable index to the day-to-day temperature changes to be expected at a station in the Yukon above Rampart. These data at Fairbanks were used to obtain enveloping station values of snow-free and snow-on-ground temperatures. The station envelopes were areally reduced for application to the Yukon Basin (par. 5.08).
Enveloping snow-free station temperatures
5.03. The highest observed sequences of daily mean temperatures at Fairbanks in the season January through July for periods of 1, 2, 3, 5, 10, 15, 20, 30 and 40 days duration were searched out and located on a seasonal graph at the mid-period date. Extreme values in January through early April occurred with the basin snow cover virtually complete, whereas after midMay the basin was largely snow free during these occurrences. Figure 5-l shows the enveloping curves for the various durations during the period April 15 through July 15. Some of the long duration values from the extraordinarily warm June of 1913 were somewhat undercut for consistency in the envelopment of the other values. The upper curve of figure 5-2 reproduces the one-day enveloping curve for the period May 15 through June 23, and may be termed a "snow-free" curve.
Enveloping snow-on-ground station temperatures
5.04. Additional temperature values were collected to help establish snow-on-ground temperature curves late in the season, where the controlling

80~--------~------~--------~--------~--------~------~~
Duration y (Days) ear of ~ 0/rr:;-1.13 I 1l J
1.60/ 2 37 .. 2~60 2
· 13 ____ ---:-______ 5
3.13 I 3.37 1513
3.60 _/ 10 ~13 ' 2013 2.18 5.13/ 10.13r.:------l0 313
" 2013 I 5.37 3.18 \
~5-:'58 '· : . ..---20 15 5.18 ·
1 15 57. - 30 15. 18
75
70
rL
OBSERVED DATA
1.18
l
0
;:; 65 a10.58 3o.lK~·-40. 1,-ao.l3 20- 10. 1?
~~,.·11W 3·20:57 0::.,6 l'
01 J 19.6o 40.10 . 1_,6 DURATION !DAYSII
a::: ::::l 1-<C a::: LJ..I c... 2: 60
42 · 12 I
,.5, /\o.3o 20.15 ~ I
2.1.23 i.il~ 1 ,:/,~.1~ 30. 13 30 53 1...------- - ~ LJ..I
1-
ssr- ~ 5.42'5.42. 15.60 / I ,1:::j?-, 40/ r ,~~~t I I ~ 20.60 TEMPERATURE I
,Y-10.53 I/ 20-30.40 I
45 ... ,..5.53 I 15
APRIL
40.12
1 15 MAY
15 JUNE
15 JULY
1 1
DATE
Figure 5-l. Adopted seasonal and durational variation of snow-free temperatures, Fairbanks w VI

36
values for figure 5-l had been set by snow-free cases. Snow-on-ground temperatures were enveloped as described in paragraph 5.03. Evidence that the basin was virtually snow covered qualified a case as "snow-on-ground." This condition was assumed to be fulfilled when all higher level stations and some but not necessarily all valley floor stations reported snow on ground. Gaging station records generally show the main body of the spring snowmelt flood passing many days after the snow cover has disappeared at low-lying stations such as Fairbanks, Eagle and Dawson. This justifies treating the basin as snow covered for several days after snow has disappeared at most valley floor stations.
5.05. The difference between late spring warm temperatures for snowfree conditions and for extensive snow cover is less than one would expect if advection of warm air was considered to be the critical process for warming. However, in the Yukon Basin as pointed out in paragraph 4.08 subsidence associated with a warm upper-level ridge, with clear skies and downslope easterly air flow appears to largely offset advective cooling by snow. It is not unusual in late spring for daily maximums at stations within extensive snow fields to be in the 60's, or even the 70's. An example is the Yukon warm spell of April 28-May 1, 1960, in which the following daily maxi-mum temperatures were observed on April 29. ·
Fairbanks, temperature 74°, snow depth 1 inch College Magnetic Observatory, temperature 69°, snow depth 6 inches Fort Yukon, temperature 64°, snow depth 8 inches University Experiment Station, temperature 63° 1 snow depth 3 inches
5.06. After mid-May the ground has been bare at Fairbanks each year except 1937, so practically no data exist to support snow-on-ground curves for the most critical parts of the snowmelt season~ The solution adopted was to extrapolate the one-day snow cover curve, shaping it after the snow-free oneday curve, taking into account the high temperatures at Fairbanks on April 29, 1960, as well as the general considerations outlined in paragraph 4.05. The one-day snow-on-ground index curve appears on figure 5-2, for the period May 15 through June 23.
Basin-wide normals
5.07. Temperature variations over large regions are best dealt with in terms of departures from the normal. One reason is that departure patterns are transposable subject to synoptic limitations (in much the same way as rai~fall patterns), whereas the normal itself is to a large degree a function of fixed features such as latitude, elevation and other physiographic features. Basin-wide daily normals were established by use of station normals for April, May, and June. These averages were plotted at mid-month, connected by a smooth curve, and daily basin average temperatures determined.
The average elevation of stations in the basin was about 1500 feet compared to 500 feet at Fairbanks. In general average monthly or annual temperatures increase about 3°F per 1000 feet decrease in elevation. To adapt the basin-wide normal to the index station values (i.e. Fairbanks) the daily normal basin curve was increased 3°F.

37
SNOW-FREE
'\SNOW-ON-GROUND
16 18 20 22 24 26 28 30 9 ll 13 15 17 19 21 MAY JUNE
DATE
Figure 5-2. Enveloping 1-day station mean temperatures
SNOW-ON-GROUND
16 7 9 11 13 15 17 19 21 JUNE
DATE
Figure 5-3. Enveloping 1-day basin mean temperatures

38
SNOW-FREE
SNOW-ON-GROUND
Figure 5-4. Durational variation of temperature, basin above Rampart
Temperature for ~ 2nd day of PMP
DATE Figure 5-5. Daily temperatures during PMP storm
TO OBTAIN TEMPERATURE FOR OTHER DAYS OF PMP
lst DAY-- -2° F 2nd DAY-- Do F 3rd DAY-- -4° F 4th DAY-- -2o F 5th DAY-- Do F 6th DAY-- -4o F

Reduction of index station departures to basin-wide departures
5.08. Comprehensive treatment of variation of temperature departure with size of area, duration, and season for the entire Yukon interior is
39
a project of major proportions, not feasible for this report. The adopted approach uses an approximation developed from comparison of calendar month basin departures with the maximum station departures the same month. Basinwide departure patterns for the three warmest Mays and Junes of record were planimetered to obtain departure vs. area curves. Smoothed envelopment of these six curves showed the basin-wide departure to be about 0.7 of the greatest departure at a station. In other words, the highest average basinwide temperature is the sum of the basin-wide normal plus 0.7 times the greatest difference between station temperature and station normal.
Adopted basin temperature criteria
5.09. One-day enveloping snow-free basin temperatures were determined by adding 0.7 of the difference between one-day index station and basin daily normal temperature values to the basin normals. Figure 5-3, upper curve shows the values, which are also listed day by day in table 5-l.
To reduce one-day index snow-on-ground to one-day basin average snowon-ground values, a basin "normal" of 32°F was assumed, and the factor 0. 7 applied as above. The resulting curve also appears in figure 5-3, and table 5-l (par. 5.17).
Development of daily temperature sequences
5.10. The next step is to derive a sequence of daily differences between the one-day basin temperature value on a given date and the basin temperature on any other date in the sequence. This was accomplished by preparing first a curve of the durational differences between the one-day enveloping temperature and the durational average differences, for one through 40 days for a station from figure 5-l. These differences are identical and therefore applicable for any date between May 15 and June 23.
These durational differences, after reduction by the factor 0.7, were converted to the sequence of daily temperature differences for snow-free conditions shown on the upper curve of figure 5-4. The lower curve of daily snow-on-ground differences was obtained by a similar operation on station snow-on-ground station curves.
5.11. Sequences of daily temperatures for the basin are obtained by subtracting the differences of figure 5-4 from the enveloping one-day values of figure 5-3. For example, see lines 4, 5, and 6 of stepwise procedure in chapter XI (par. 11.02).
Critical arrangement of daily temperatures
5.12. From the beginning of melt, May 15, temperatures should in general rise day-by-day until shortly before the PMP storm date is reached.

40
It is suggested that the user avoid placing the highest daily temperature on the two days immediately prior to the PMP storm. In the example presented in chapter XI, the highest single-day temperature is placed five days prior to the PMP storm. Otherwise, it is considered meteorologically reasonable to place the single highest temperature on other days as long as a reasonable trend is preserved as in the example.
Procedure for progressing from snow-on-ground to snow-free temperatures
5.13. Most of the procedure for progressing from snow-on-ground to snow-free conditions is covered in chapter XI by stepwise explanations of an example. However, a certain amount of clarification is needed.
The procedure is based on the assumption that snow-free temperatures are applicable when 75 percent of the basin is snow free. Otherwise snowon-ground temperatures prevail. On a particular day, after 75 percent of the basin is snow free, the intermediate temperature (i.e., between the snow-free and snow-on-ground extremes) is derived on the basis of the percentage of the basin that is snow-free, based on an area-elevation curve for the basin. In application, the elevation of the snow line derives from snowmelt computations through the preceding days. The percentage of the basin·snow free may be assumed constant until snow is melted from the next higher elevation band.
The daily differences between the temperatures for the two categories are determined at a base elevation as explained in chapter XI. The resulting base temperature (line 15 in the example) is adjusted for elevation and is then used in formulas for computations of snowmelt.
Temperatures during PMP
5.14 During the six days of PMP the daily temperatures are fixed at 2°F above the seasonally controlled maximum daily inflow dew points for these dates. The PMP temperatures are determined from figure 5-S. The temperature for the 2nd day of the PMP is first read from the figure. Then the 6-day sequence of temperatures is derived by application of the adjustments shown on the figure in tabular form.
Elevation adjustment for temperatures
5.15. Based on observed stable atmospheric conditions in the lower levels, particularly under extensive snow-cover conditions, temperatures are assumed to be constant up to 2500 feet. Above 2500 feet a decrease of 3°F per thousand feet is assumed. These elevation adjustments apply to snow-free, snow-on-ground, and dew-point temperatures, at all durations.
Dew points
5.16. Except for the period of rainfall, daily dew points are l4°F less than daily temperatures. A study of selected warm periods at Fairbanks was the basis for this temperature-dew-point spread for non-rain days.

While the six days of rainfall are occurring, daily dew points are 2°F less than the daily temperatures.
Application of presented criteria
5.17. The application of the presented temperature criteria is covered in chapter XI in the form of an example with stepwise procedures. The data from figure 5-3 are given in tabular form in table 5-l to facilitate ,computations.
Table 5-l
BAS IN MAXIMUM DAILY MEAN TEMPERATURE (OF)
(For ground elevations up to 2500 ft.)
Temperature Temperature
Date Snow-free Snow-on-ground Date Snow-free Snow-on-ground
May 15 62.3 51.2 June 1 69.1 52.9 16 62.9 51.4 2 69.3 52.9 17 63.4 51.6 3 69.5 52.9 18 63.9 51.8 4 69.8 53.0 19 64.4 52.0 5 70.0 53.0 20 64.8 52.1 6 70.3 53.0 21 65.2 52.2 7 70.6 53.0 22 65.6 52.3 8 70.8 53.0 23 66.1 52.4 9 71.0 53.0 24 66.5 52.5 10 71.2 53.0 25 66.9 52.6 11 71.3 53.0 26 67.2 52.7 12 71.5 53.0 27 67.5 52.8 13 71.6 53.0 28. 67.8 52.8 14 71.8 53.0 29 68.2 52.8 15 71.9 53.0 30 68.5 52.8 16 72.0 53.0 31 68.8 52.8 17 72.2 53.0
18 72.3 53.0 19 72.4 53.0 20 72.5 53.0 21 72.6 53.0 22 72.7 53.0 23 72.8 53.0
41
42
Conversion of daily temperatures and dew points to half-day values
5.18. For all days other than the six days of PMP rainfall, daily mean temperatures may be converted to half-day values by adding and subtracting 6.5°F. During the six days of PMP the half-day temperatures are assumed to be the daily temperatures ~ 2°F.
Dew points for the half-day intervals are the daily dew points+ l°F for all days.

43
Chapter VI
WINDS
Maximum snowmelt winds
6.01. There are almost no surface wind data at elevations above 2000 feet suitable for snowmelt computations. Therefore, snowmelt winds above this level must be derived indirectly. The method used in this report is to convert measured upper-air winds (free-air) to surface winds (anemometer level).
6.02. Maximum snowmelt winds were derived by a study of the upper-air winds at Fairbanks, probably the best single upper-air station to represent the Yukon Basin because of its long length of record and relative freedom from topographic ~nfluences. Winds at standard levels from the surface to 700mb (about 10,000 ft.) were statistically analyzed. Fifteen years of observations were available. Winds accompanied by sub-freezing temperatures (at wind level) were excluded from the analysis. Values of windspeed were read at the 100-yr. return period, then smoothed over levels. Results are presented in figure 6-1, curve A, the 100-yr. above-freezing average freeair windspeed adjusted to 24 hours for the snowmelt season.
Transformation of free-air to anemometer-level winds
6.03. From a short record of measured winds on Gulkana glacier* (at 4800 ft. or about 850mb.) a series of comparisons was made between the glacier wind and the free-air wind at Fairbanks, 134 miles to the northwest. It was found that the average wind on the glacier during the day was 0.6 that of the free-air wind. (During the darker hours a strong downslope wind distorted the relationship.) This factor was applied to other levels from 950 to 700 mb. The results for anemometer-level winds are shown on figure 6-1, curve B.
6.04. Almost all of the Yukon Basin above Rampart has either a light forest cover or none. Since only a very small part of the basin can be termed heavily forested, wind is a significant variable in the snowmelt problem. The wind transformation factor, 0.6, was developed for a snow surface free of forest cover and is an average of lee and windward slopes. This factor can be adjusted downward slightly (at the discretion of the user) for computations in the lightly forested areas.
Durational variation of maximum winds
6.05. The average decrease of windspeed with time also was investigated for Fairbanks. Since the average elevation of the Yukon Basin above Rampart is nearly 3200 feet (900mb), this level was chosen for study and theresults used for all levels to 3200 feet. While the dropoff of wind with time is slightly greater at elevations below 3200 feet and less above 3200 feet, the errors in windspeed due to using the 3200-ft. variation for all elevations are negligible. * "Ablation an~ fet Total Radiation, Gulkana Glacier, Alaska,'' by L. Mayo
and T. L. Pewe, Univ. of Alaska, unpub. manuscript, 1962.

44
700
750
£0 800
~ -u.J 0::: 850 :J V) V)
u.J 0::: 900 a..
950
1000
CURVE A: 100-YR. 24-HR. FREE-AIR WINDSPEED, FAIRBANKS CURVE B: ESTIMATE OF 24-HR. MAXIMUM SURFACE WINDSPEED
,....--'T"""""_(,_A_N_EM__,O_M_E_TE_Rr-L_E"'TV_E L+)_O_V_E"TR_U_N_F...,O_R_ES...,TrTE_D_T_E_RRT"A_I N__, 1 OOOO
9000
8000
7000 -1--6000 ~
5000 ~ 1--
4000 ~ u.J
3000 u:: 2000
1000 500
0 10 20 70 80 90 lOO SURFACE==400' 30 40 50 60 SPEED (MPH)
Figure 6-1. Maximum 24-hr. winds for the snowmelt season
100
90
t-80
<{ -I
0 70 w 0 ...'.. 0 60 u.. 0 z 50 ~ u.. 0 40 t-z w
~ 30 w "-
20
10
0 50 100 150 I
0 2
200 I 3
STATUTE MI.
250 300 I 4
BASIN WIDTH
Figure 6-2. Average windspeed variation with basin width
DEG. LAT.

45
6.06. Windy periods of from 12 hours to 30 days were extracted from the May-June melt season for the period 1946-1960. For the durational study, only winds with temperatures considerably above freezing were considered (about 8°C and above at 900 mb) at the highest speeds, since an inverse relationship between temperature and windspeed seems to occur.
6.07. Table 6-1 gives the average durational variation of the maximum winds as a percent of the one-day value, and the daily (incremental) windspeed.
Table 6-1
DURATIONAL VARIATION OF MAXIMUM WINDS
Duration (Days)
1 2 3 4 5 6 7 8 9 10
Average wind (percent of 1st day) for duration in days
100 87 77 69 65 62 59 56 54 52
Incremental daily wind (percent of 1st day)
100 72 58 51 47 45 42 40 38 36
Duration (Days)
11 12 13 14 15 20 25 30
Average wind (percent of 1st day) for duration in days
51 50 49 47 46 44 41 38
Incremental daily wind (percent of 1st day)
34 33 32 31 30 27 26 26
Basin-width variation
6.08. The maximum winds derived from point observations are for practical purposes assumed to be representative of an airstream of finite width, namely 1 degree of latitude (60 n. mi.) on the average. The maximum winds apply to this width (or less).
6.09. In order to use the maximum winds for basins or areas of greater lateral extent than 60 n. mi., a correction is applied to the maximum winds, obtained from figure 6-2. For exampte, a basin with a lateral extent of 250 miles perpendicular to the inflowing moist airstream requires a width correction factor of 0.79. In general, the moisture-bearing wind direction would vary from south through west. The approximate inflow width and basin-width factor for both the upper basin (above Woodchopper) and lower basin is 300 miles and 0.75, respectively. The 300-mile width for the upper basin can be us.ed also for winds from other than the moisture-bearing direction ·for the non-rain days.

46
Critical sequence of snowmelt winds
6.10. Table 6-2 combines a) 24-hr. maximum snowmelt winds, (par. 6.02), b) the incremental durational decay (par. 6.07), and c) free-air to anemome-ter-level transformation factor (par. 6.04). It gives the maximum winds to be expected during the melt season in order of decreasing magnitude.
Table 6-2
MAXIMUM DAILY SNOWMELT WINDS AT ANEMOMETER LEVEL (MPH)
Elevation band (ft.)
500- 1000- 2000- 3000- 4000- 5000- 6000- 7000- 8000- 9000-1000 2000 3000 4000 5000 6000 7000 8000 9000 10,000
1st day 30 30 33 36 38 41 42 44 45 46 2nd II 21 21 24 26 28 29 30 32 32 33 3rd II 17 17 19 21 22 24 24 26 26 27 4th II 15 15 17 18 20 21 21 23 23 24 5th II 14 14 15 17 18 19 20 21 21 22 6th II 13 13 15 16 17 18 19 20 20 21 7th II 13 13 14 15 16 17 18 19 19 19 8th II 12 12 13 14 15 16 17 18 18 18 9th II 11 11 13 14 15 16 16 17 17 18
lOth II 11 11 12 13 14 15 15 16 16 17 11th II 10 10 ·u 12 13 14 14 15 15 16 12th II 10 10 11 12 13 14 14 15 15 15 13th II 10 10 11 12 12 13 13 14 14 15 14th II 9 9 10 11 12 13 13 14 14 14 15th II 9 9 10 11 12 12 13 13 14 14
20th II 8 8 9 10 10 11 11 12 12 12
25th II 8 8 9 9 10 11 11 12 12 12
30th II 8 8 9 9 10 11 11 12 12 12
The critical sequence of winds prior to, during, and following the probable maximum storm may be constructed from the maximum anemometer-level winds of table 6-2.
6.11. It is logical to assume that the maximum daily wind values will be associated with the 6-day PMP storm period described in chapter IX. The

47
six highest daily values will therefore be placed corresponding to the two adjacent 3-day PMP storms (over the upper and lower basins). For example at 4000-5000 feet the following sequence would be appropriate. A slight rearrangement of the numbers within the six-day period is admissible.
Day
Speed (mph) 18
1 2
20
3
17
4
28
5
38
6
22
6.12. For the three days prior to the PMP storm, lowest wind values of table 6-2 are used. This is done for synoptic consistency in the transition period, when weather conditions are changing into the PMP storm. The remaining winds are then ordered by the temperature, i.e., highest remaining wind (table 6-2) with highest remaining temperature (table 5-l) etc. If the sequence extends beyond 30 days the 30th day wind may be used.

48
Chapter VII
RADIATION
Introduction
7. 01. Radiant energy reaches the snow surface as solar radiation and as infrared radiation from the air, clouds, and trees. The first is commonly called short-wave radiation and the last long-wave radiation. The physical principles involved in the melt of snow by radiant energy are presented in "Snow Hydrology" (8), section 5-02 through 5-05.
7.02. Short-wave radiation. The maximum energy from solar radiation available for snowmelt in a given basin in a given season may be estimated in the following manner. Evaluate the insolation impinging on a horizontal plane at the top of the atmosphere, estimate the fraction reaching the bottom of the atmosphere in the absence of clouds, determine the fractional interception by clouds for various durations of interest, determine the fraction reflected by estimating the albedo, and evaluate the effects of forest cover which absorbs short-wave radiation but reradiates long-wave radiation. Criteria for maximum insolation reaching the snow surface over the Yukon Basin above Rampart Dam site are developed in this report by carrying out the first three steps. Fairbanks, Alaska, at the middle latitude of the basin is used as an index station. Albedo and the effect of forest cover, and also the differences in different slope aspects (e.g., south vs. north) are not included in this report. The principal maximizing step is to envelop the recorded insolation at Fairbanks, for duration~ of 1 to 30 days, based on the period 1932 through 1961 for 1 day and 1952-1961 for longer durations.
7.03. Long-wave radiation. It is assumed that the maximum radiant energy to the snow surface will be received during the snowmelt season under conditions of maximum insolation together with the long-wave radiation that will occur ~imultaneously. Therefore, the emphasis in developing long-wave radiation criteria is on consistency with the maximized short-wave radiation values. Estimates are made of the typical downward long-wave radiation from the air, including water vapor, plus the radiation from partial cloud cover required for the adopted insolation. The effects of trees are not evaluated. The long-wave radiation is.maximized only to the extent that it is derived from the maximum dew points.
Maximum short-wave radiation
7.04. Insolation at top of atmosphere. The insolation at the top of the atmosphere is a function of the solar constant, the distance from the earth to the sun, and the solar altitude. The daily insolation on a horizontal surface at the top of the atmosphere for latitudes 60°, 65°, and 70°N is shown by the upper curves of figure 7-1. The curves are computed from table 132 of Smithsonian Meteorological Tables (9) and the formulas on which this table is based. The computed values were increased by 3 percent to

~-0 ~>-UJ ...J () 700 z <( ...J ~ 600 z 0
~ 0 <( 0<:
0<:
~ 0 V)
AT TOP OF ATMOSPHERE 70° N LAT.
0 - ·- -- -- ·- -- -- ·- -- -- -- -- -- -- --
Figure 7-1. Seasonal variation of daily clear-sky solar radiation in Alaska and northwest Canada .p. \0

50
adjust from a solar constant of 1.94 langleys/minute to the value proposed by Johnson (10) of 2.00 langleys/minute. A similar curve for the latitude of the Central Sierra Snow Laboratory is found in figure 4 of plate 5-l of Snow Hydrology (8).
7.05. Maximum observed daily insolation at Fairbanks. Maximum daily insolation at Fairbanks and an enveloping curve are shown in figure 7-2. The plotted points are the highest observed insolation on March 15, on March 16, etc., for the years 1932· through 1961. (The August values are from 1952-1961 instead of the full 30 years of record). The observations are from an Eppley pyrheliometer at the U. S. Weather Bureau Station at Fairbanks, latitude 64° 49'N. longitude 147° 52'W, elevation 436 feet. About 2 percent of the daily totals had been omitted from the available records because 1 or a few hours were missing during the day. Most of these were filled in by interpolation of the missing hourly values. A few months were missing entit'ely from the 30-yr. record. Values for dates prior to July 1, 1957 were muftiplied by .98 before plotting to convert from the Smithsonian Pyrheliometric Scale to the International Pyrheliometric Scale. Begnining on the above date, published data are based on the International Scale (11).
7.06. Fritz (12) has made similar plots for pyrheliometric stations in the Continental United States exclusive of Alaska, and Mateer (13) for Canadian stations. The envelope for Fairbanks, included in Mateer's study, is also given in figure 7-2.
7.07. Smoothed ratios of I/I0 • The ratio of the insolation at the surface in the absence of clouds, I, to that at the top of the atmosphere, I 0 ,
would be expected to vary in a smooth manner from month to month and to show consistency between stations. The principal factors governing this ratio are the amount of water vapor in the atmosphere and the optical air mass which the solar beam must penetrate. Variable scattering factors such as dust also have some effect. Table 7-1 shows I/I0 for four stations from Mateer. The lower enveloping curve of figure 7-2 results from applying the "smoothed mean" ratios of table 7-1 to the 65°N curve of figure 7-1. The Fairbanks insolation envelope (fig. 7-2) is shifted slightly upward in the early spring months for a better fit for the data, marked "adopted." The I/I0 ratios associated with this .curve are shown in figure 7-3.
7.08. Check from other stations. As a check, maximum daily insolation values were abstracted, in a manner similar to that for Fairbanks, for the Alaskan stations of Barrow, Bethel, and Matanuska and the Canadian station of Aklavik {locations shown in fig. 7-4). Only the record from 1952 through 1961 was used for these stations, being readily available on punch cards. The resulting I/I0 ratios are depicted for comparison with Fairbanks in figure 7-3. Annette, Alaska was also analyzed but the ratios were not compatible with the other stations and are not shown.

900~--~------~--~--~--~~--~------~--~--~--~----~------~--~--~r---~~
?i BOO 0 -V')
~ 700 ...J
(.9 z <( 600 ...J _...
z Q 500 ~ ~ 400 0<!:
~ 200 ::J ~ x <(
~
0 --
-. -. ••• •• ••••• • • .. ""'... . .... ..
•• • •
HIGHEST OBSERVED • 1932- 1961 X 1952- 1961 ®AFTER MATEER (REF. 13)
Figure 7-2. Seasonal variation of maximum daily solar radiation, Fairbanks
X )(
\J1 .....

52
~.900r--,---r--~-,---r--~-,.--.--~--.--.--~--w-~~-r~ (/')
0 ~. 880 <( LJ..._
0 .860 0.... 0 1-Ci . 840 z '--::::l
~. 820 c.::> 1-
:5 . 800 0
~. 780 0::: z· ~. 760 1-<(
~. 740 0:::
~. 720 -' 0 Vl • 700 2~0~3~0--~~~~--~~~~--~~~~--L-~--~--L-~--~30
MAR DATE
Figure 7-3. Seasonal variation of ratio of clear-sky solar radiation received at ground to that at top of atmosphere
Figure 7-4. Location of solar radiation stations near Yukon Basin

53
Table 7-1
RATIO OF COMPUTED DAILY CLEAR-WEATHER INSOLATION (FROM MATEER) TO SOLAR RADIATION AT TOP OF ATMOSPHERE
15 Mar 15 AEr 15 May 15 Jun 15 Jul 15 Aug 15 SeE
Resolute, N.W.T. .769 .811 .797 .773 .757 .727 .764 Aklavik, N.W.T. .753 .800 .767 .750 .745 .751 .755 Fairbanks, Alaska .787 .784 .780 .754 .749 .736 .742 Edmonton, Alta. .792 .797 .790 .779 .770 .766 .764
mean .755 .798 .784 .764 .755 .745 .756
Smoothed mean .780 .794 .784 .766 .752 .745 .756
7.09. Maximum daily clear-weather insolation over basin. The I/I0
ratios for Fairbanks from figure 7-3 are recommended for the Yukon Basin above Rampart, Fairbanks having the longest and most internally consistent record, as well as being situated at the mid-latitude of the basin. Application of these ratios to the top-of-atmosphere intensities (upper curves of fig. 7-1) yields daily insolation in absence of clouds (lower curves of fig. 7-1). Daily tabular values from the 65°N curve are listed in table 7-2.
7.10. Durational variation. The recommended durational variation of solar radiation over the basin is presented in figure 7-5. expressing the maximum observed daily intensities as a ratio to clear-weather intensity. The upper curves of figure 7-5 show the maximum ratios for various durations up to 30 days, while the lower curves depict the maximum ratio on each succeeding day in order of radiation intensity.
7.11. The duration relations are derived by enveloping daily Fairbanks values for the 9-yr. period 1952-1961. The data were analyzed in the following manner. The maximum ratio was found of the total radiation over seven consecutive days to the standard clear-weather radiation from table 7-2 for the same seven days, for all 7-day periods beginning between March 1 and March 10. Similar maximum ratios were abstracted for other key durations and for each 10-day period during the March-August season. These maxima were, in turn, enveloped and checked by various smoothing techniques. Figure 7-6 shows, for each 10-day period, the maximum ratios which are partially enveloped by the dashed lines from which the upper curves·of figure 7-5 are developed.
7.12. AEElication of Fairbanks duration variation to basin. The Fairbanks enveloped insolation ratios are applied to the basin, taking into account the following factors. a) OVer a basin, maximum insolation ratios for a given duration are lower than at an individual station, which from time to time can experience less cloudiness than the concurrent basin average. b) The derived durational relations are minimal envelopes for Fairbanks, the record being for only nine years. c) In the recommended

V1 ~
1.0 z 0 1- .9r MAR 1 -APR 30 <( -I
~ 0 JUN J V'l
.8 z JUL J- AUG 30 -0:::: w :::c .7 1-<( w 3: 0:::: .6 <( 1 2 4 6 8 10 12 14 16 18 20 22 24 26 28 30 w -I DURATION (DAYS) u 0 1-
0 w > 1.0 0:::: w V'l 1:0
0 .9 ~ ::::> ~ MAR 1 -APR 30 X .8
- MAY 15 <( --~ JUN J----LL .7 - JUN 15 0 --0 JUL 1 - AUG3Q- - -1- .6 <( 0::::
0 1 2 4 6 8 10 12 14 16 18 20 22 24 26 28 30
SERIAL NUMBER OF DAY
Figure 7-5. Durational variation of solar radiation (based on data at Fairbanks, 1952-61)

55
Table 7-2
MAXIMUM DAILY SOLAR RADIATION (IN LANGLEYS) AT GROUND AT FAIRBANKS, ALASKA
(From 1932-1961 adopted envelope)
Day Month
March April May June July August
1 202 414 613 751 761 635 2 208 421 619 753 759 630 3 214 428 625 756 757 625 4 220 435 630 758 755 619 5 225 443 636 760 752 614 6 231 450 641 762 749 608 7 237 457 647 764 746 603 8 243 464 652 766 742 597 9 249 470 657 768 739 591
10 255 477 662 769 735 585 11 261 484 667 769 732 580 12 267 491 673 770 728 574 13 274 498 678 770 724 567 14 280 505 682 770 720 560 15 287 512 687 770 716 554 16 293 518 692 770 712 548 17 300 525 697 770 707 542 18 307 532 701 770 703 535 19 314 538 706 770 699 529 20 322 545 710 771 695 523 21 330 551 715 771 690 516 22 338 558 719 771 685 510 23 345 565 722 770 680 503 24 353 571 726 769 676 497 25 361 577 730 769 672 491 26 368 583 733 768 667 484 27 375 590 736 767 662 478 28 383 596 739 766 657 472 29 391 602 742 764 652 465 30 399 608 745 763 647 458 31 406 749 641 452

z 0
!< ...J
0 Vl
z e::: w :r: ~ w 3: e::: <( w ...J u 0 .1-
0 w
~ w Vl co 0 :E :::> :E x <(
:E u. 0 0 1-<( e:::
1.1
1.0
.9
.8
.7
.6
.5 - MAXIMUM OBSERVED RATIOS (SEE TEXT PARA. 7, 11)
---- SMOOTHED DURATION CURVES
10
DATE
Figure 7-6. Enveloping solar radiation for 1, 7, 15, and 30 days- Fairbanks
DATA FROM 1952-1961
30 10 20 30 AUG
VI 0"

57
procedure of this report the insolation values are aligned with the maximum temperature values, the greatest insolation on the warmest day, etc. The weather required to produce the warm temperatures includes high pressure areas and subsidence, as described in chapter IV, and thereby very little cloudiness. The basin-wide insolation therefore should be weighted toward little cloudiness for correlation with temperature sequences.
7.13. It is assumed that all the foregoing factors counterbalance and that the 9-yr. Fairbanks durational envelopes are appropriate to ap{)ly to the basin.
Maximum downward long-wave radiation
7.14. Black-body radiation. A useful standard for reference in longwave radiation calculations is the black-body emission. Integrated over all wave lengths, this emission is a function of temperature only. At normal terrestrial surface temperatures practically all of the emission is in the infrared portion of the spectrum. The black-body emission in langleys per 24 hours is shown in figure 7-7. This is the same curve as the upper curve of figure 2, plate 5-3, of Snow Hydrology (8), expressed in a different time unit.
7.15. Clear-sky radiation. The principal radiating gases in the lower atmosphere are water vapor and carbon dioxide. Several empirical relations for estimating the downward long-wave radiation from surface data only have been developed by different investigators. The surface vapor pressure is used as an index of the water vapor in the lower several thousand feet of the atmosphere. Figure 7-8 depicts one such empirical relation, and is the same as curve No. 3 in figure 3 of·plate 5-3 of Snow Hydrology (8), discussed in paragraph 5-04.03 of that report. TI1e radiation is expressed as a fraction of the black-body radiation at the corresponding air temperature.
7.16. To obtain clear-sky radiation for a 24-hr. period for any part of the Yukon Basin, first enter figure 7-7 with the daily surface air temperature and read the black-body radiation in langleys. Then multiply this value by the ratio read from figure 7-8 corresponding to the adopted mean daily surface dew point (the same up to 2500 ft.) for the particular day.
7.17. Cloud radiation. Clouds radiate downward as a black body at the temperature of the lower part of the cloud. For a given cloud base temperature, the cloud radiation intensity may be read from figure 7-7. Air between the cloud and the surfa~e of the earth, if warmer than the cloud, will slightly increase the net downward flux. However, for purposes of this study black-body radiation from the cloud base may be accepted without further adjustment as the total downward flux reaching the surface beneath the clouds.
7.18. Cloud temperature. A survey of Fairbanks and other Alaskan stations shows that, during the spring snowmelt season, the cloudiness is

58
~ <( Cl
Vl
800
~ 700 ....J <.::> z <( ....J
z ~ 600 1-<(
Cl <( 0:::
500
400
-20 -10 0 10 20 30 40 50 60 BLACKBODY TEMPERATURE (°F)
Figure 7-7. Black-body radiation
zz 0 0 .90 --1-t<C<C --
1----------, Rct /a-T: =. 740 + .0049 ea
70
· 6~40 -30 -20 -10 0 10 20 30 40 50 60 70 80 DEWPOINT (°F)
Figure 7-8. Back radiation from the atmosphere with clear skies

59
generally fairly high. Ceilings (more than half of sky covered at the ceiling height or lower) average over 10,000 feet. Lower scattered clouds at various elevations from several thousand feet upward are common. The warm weather and high insolation assumed for optimum snowmelt mitigate against low clouds (par. 7.12). For purposes of this report, it is recommended that the cloud-base temperature be assumed as l5°F less than the mean daily temperature for each particular day for the surface to 2500-ft. layer. This temperature criterion calls for most of the cloudiness between 5000 and 10,000 feet above sea level.
7.19. Cloud amount. Clouds lessen the short-wave solar radiation to the snowpack but increase the long-wave radiation. It is therefore desirable to relate the amount of cloudiness to the solar radiation since an error in cloud amount will then be partially self-compensating. The ratio of solar radiation for each day to clear-sky solar radiation (from fig. 7-5) is used as an index of the amount of cloudiness, applying the empirical relations in Snow Hydrology (8). Figure 7-9 shows the effective cloudiness in tenths of sky cover as a function of the insolation ratio referred to. It is derived from figure 5 of plate S-3 of Snow Hydrology (8), entering with a cloud height of 7500 feet.
7.20. Partial sky-cover procedure. The recommended procedure for partial sky covers is to compute long-wave radiation separately for clear air and for clouds. The two radiation intensities are then weighted in accordance with the "effective cloudiness" from figure 7-9. (It is recognized that two-tenths sky cover, for example, will influence more than two tenths of the underlying surface because the clouds radiate in all directions and not only straight down. This is taken care of in the empirical relation of figure 7-9, which uses the effective cloudiness rather than the actual cloudiness).
7.21. Steps for estimating long-wave radiation. These are summarized in the example in paragraph 11.02.
7.22. Radiation from clouds during 6 days of PMP. During the six days of PMP (first over upper basin followed by lower basin) low clouds are assumed to prevail throughout the entire basin. The temperature of the cloud base is close to the temperature of the air at the surface and is assumed to equal it for purposes of computing radiation. The total daily downward long-wave radiation is obtained by entering the black-body curve of figure 7-7 with the mean daily surface air temperature at each elevation band.
Upward radiation
7.23. A snow surface radiates as a blac~ body at its surface temperature. (Snow Hydrology, par. 5.04.01). At 32°F this is 0.4530 langleys/ minute (Table 129B, Smithsonian Meteorological Tables) (9) or 652 langleys/ day. For colder surface temperatures the daily emittance of the snow surface may be read from figure 7-7.

60
lO Cl Ll..J e::: 9 Ll..J
> 0 u >-~ V"l L..L.. 0 V"l I f-z Ll..J f-;::5 z ::::::> 04 ::2: <(
§33 0 -' u w2 > f-
~ 1 L..L.. L..L.. Ll..J
0
Figure 7-9. Variation in effective cloud amount with solar radiation
ILL. -N
3000
~ 2000 1-<(
> LLJ -I LLJ
1000
0~--------~----------~----------~----------~----------~. 1. 00 l. 05 l. 10 l. 15 l. 20 RATIO OF SOLAR RADIATION AT ELEVATION Z TO THAT AT SURFACE (436FT.)
l. 00
Figure 7-10. Variation of solar radiation with elevation, Yukon Basin

61
Net long-wave radiation
7.24. The net long-wave radiation, in the absence of vegetation, to the snow surface is obtained by subtracting the upward radiation flux (par. 7.23) from the downward flux.
Elevation variation of radiation
7.25. Short-wave radiation intensity increases with elevation because of lessening optical air mass and lessening interception by water vapor. The downward long-wave radiation received at the surface by contrast decreases with height, because of the lower temperature of the radiating gases and the lesser mass of water vapor. These opposite elevation effects are of the same order of magnitude and it is thought may be neglected if radiation is computed in 24-hr. units. The example in chapter XI is developed without taking into account elevation variation of radiation. For ready reference, however, if elevation variation of radiation should be desired, the basic criteria are expl~ined below.
7.26. Short wave. The elevation variation of insolation is shown in figure 7-10, as a percentage of the intensity at the elevation of Fairbanks. The curve is based on the data in table 7-3.
To obtain elevation-adjusted solar radiation, determine base-elevation solar radiation as in lines 22-24 (500-1000 ft. elevation band) of paragraph 11.02. Then multiply by ratio from figure 7-10.
~.27. Long wave, The elevation variation of long-wave radiation is accomplished by making the standard elevation adjustment to dew point (par. 5.15) at each elevation band before entering figure 7-8 for the vaporrelated radiation ratio, and making the elevation adjustment to the surface air temperature before entering the black-body curve of figure 7-7. These are for lines 18-19, 28-29, etc., paragraph 11.02.
The elevation adjustment is made only to the clear-air portion of the long-wave radiation. For the cloud portion of the long-wave radiation (steps 1, 4-6, lines 25, 35, etc., par. 11.02) l5°F is subtracted from the base surface-to-2500-ft. temperature, regardless of elevation of the ground. This implements the assumption that the cloud sheets are horizontal and do not vary with the terrain.
The amount of cloudiness (step 1, line 25) is determined only once, by use of the insolation ratio from line 23, paragraph 11.02, and is not varied with elevation.

Table 7-3
VARIATION OF SOLAR RADIATION WITH ELEVATION AT FAIRBANKS IN MID-JUNE
Standard Mean Monthly Clear-Weather Atmospheric Precipitable Precipitable Solar
Elevation Pressure (P) Water Water Air Mass Radiation (ft.) (mb.) P/P0 wp (em) .85wp (em) P/P0 x m0 I(ly/min)
0 1013(P0 ) 1.000 - - 1.34 (lllo) 436(sfc) 997 .984 1. 700 1.445 1.319 1.19(Is)
1000 2000 3000 4000
Notes:
1.
2.
3.
4.
5.
977 .964 1.664 1.414 1.292 942 .930 1.578 1.341 1.246 908 .896 1.508 1.282 1.201 875 .863 1.211 1.029 1.156
P = Standard pressure at sea-level. 0
Mean monthly precipitable water from Weather Bureau Technical Paper No. 32, Part I (14).
1.23 1.28 1.34 1.41
Precipitable water on clear days is assumed to average 85% of mean monthly W • p
m = Optical air mass at sea level at solar noon. 0
Solar radiation, I, from figure 2 by F~itz (12) for given air mass and clear-weather precipitable water; I = solar radiation at surface. s
Ratio !/Is
1.000 1.034 1.076 1.126 1.185
0\ N

63
Chapter VIII
METEOROLOGICAL SUMMARY OF ALASKAN INTERIOR AND YUKON STORMS
Spring and fall storms
8.01. The few large storms of record near the May snowmelt season in the Alaskan interior are similar to the more frequent early fall storms of August and September. Storms in both seasons represent the period of transition ~etween midsummer and winter. They feature passage of fairly deep Lows directly into the Alaskan interior, a path occasionally observed in winter but rarely in summer. The inland-area-heating effects on pressure and unstabilizing effects on precipitation--so.important in midsummer storms and absent in winter--are mildly evident in these t~ansitional season storms.
8.02. Storms may be classified by the direction of the approaching surface Low center, which also d~fines the inflow direction of predominant moisture. A track into central Alaska from the west or southwest, i.e., from the Bering Sea, permits mqist inflow without appreciable moisture depletion by mountain barriers compared to a track from the south. The more important storms, grouped in these three categories of direction of track, are shown in figures 8-1, 8-2, and 8-6, along with dates and central pressure of surface Lows, positions of Highs, and centers of precipitation areas.
Storms usually involve a single Low center, except as noted below in the westerly type. There is no reason, however, why repetition of Low centers could not occur in other types to increase greatly the duration and rainfall potential of the storm.
8.03. Typical storm characteristics during passage of a Low are: Moderate to strong southerly winds shifting to westerly, temperatures slightly below normal, and rather steady rain for up to two days, followed by showers. Fronts are well occluded and, because of the rugged terrain, diffuse above Rampart.
8.04. Westerly type. The predominant feature of the westerly type is the strong westerly flow between the Low centers in northern Alaska and the strong High in or near the Gulf of Alaska. This is apparent in figure 8-1. The W-E elongation of the Lows, somewhat to the north of the usually prevailing W-:E thermal trough, facilitates the westerly inflow. In some storms this elongation results from passage of a previous Low or occlusion along the same path; then the main Low center follows it as an occluding wave on the initial frontal system (1938 and 1953 storms of fig. 8-1). In others it results from sur'face heating effects in the interior. The elongation not only increases storm duration but assures favorable inflow direction from the west.

64
0 c:!) Cb 0
@ • 1032
@ • 1033
0
0
@ • 1030
LEGEND
LOWS HIGHS STORM NUMBER AND DATE
DATE/HR (AST) STORM NUMBER CD AUG. 27-29, 1930
PRESX(MB) PRES~MB) 0 JUL. 31-Aug. 1, 1938
1------...J..--------1@ AUG. 27-29, 1945 r::i""1 RAIN CENTER AND L.!.J STORM NUMBER 0 AUG. 22-24, 1953
Figure 8-1. Tracks of surface Lows in westerly-type fall storms

Moisture inflow in these storms is high because the air has been carried from middle latitudes northward around the Alaskan Gulf High prior to crossing the Bering Sea.
65
8.05. Southwesterly type. The tracks of these storms, as shown in figure 8-2, are essentially WSW-ENE across northern Alaska after northeastward movement through the Bering Sea. The Highs in the southern Gulf of Alaska, somewhat east of those in westerly-type storms, assure a strong SW flow over the Alaskan interior. As in the westerly type, very moist air flows rapidly from iniddle latitudes directly into the Alaskan interior.
In the 1951 and 1915 storms, deep Lows stagnated in the central Aleutian area as new centers formed and moved northeastward. In the 1955 storm, the primary Low center stagnated near Nome while a new center moved across the northern tip of Alaska.
Figures 8-3 and 8-4 are 0300 AST surface maps for the 11th and 12th of September 1915. The 3-day rain (fig. 8-5) exceeded that of other storms of record for any season. The heavy rain at Holy Cross included three inches in three hours during instability showers late on the morning of the 12th.
8.06. Southerly type. Tracks of two spring storms of this type are shown in figure 8-6. In the June 1955 storm, Lows crossed the south coast and adjacent Alaskan Range to enter the eastern Alaskan interior with moisture depleted by orographic lifting. Indicative of its meridional nature is the strong ridge over western Canada which forced Low centers northward into eastern Alaska. (Occasionally this track is taken by winter storms such as that of December 28-30, 1955, which brought record rainfall to the south coast and extreme winter snow to the southeast interior from a very moist, strong meridional flow from low latitudes.)
In figure 8-6 it is noted that the track of the Low in the 1929 storm skirted around the western border of the Alaskan Range; hence its moisture tvas less subject to depletion by coastal mountain terrain.
8.07. Seasonal transposition. Storms in the spring and fall transitional seasons are similar. The only examples cited of southwesterly- and westerly-type storms occurred in fall but they are compatible with and may be expected during the spring snowmelt season. Similarly the Hay and June southerly-type storms (fig. 8-6) could be expected in the fall.
Summer-- type storms
8.08. In contrast to the spring and fall storms just discussed, summer storms do not involve a sequence of cyclonic systems entering directly into the interior; rather, their cause is such that transposition is not appropriate to the period immediately following snotoJrnelt. This is evident from two important aspects. First, the broad-scale circulation of summer storms involves upper Lows which pass through or stagnate in the Gulf of Alaska;

66
LEGEND LOWS
DA TE/H R (AS T) X
PRES (MB)
HIGHS
STORM NUMBER
• PRES (MB)
OJ RAIN CENTER AND STORM NUMBER
0
0
® • 1028
• 1037
@ • 1035
LEGEND
AND DATE
G)SEPT. 10-12, 1915
@AUG. 24-27, 1951
@AUG. 22-24, 1955
Figure 8-2. Tracks of surface Lows in southwesterly-type storms

67
Figure 8-3. Sea-level chart, September 11, 1915 (0300 AST)

68
Figure 8-4. Sea-level chart, September 12, 1915 (0300 AST)

/ /."
,' 1
/~
\ ST. PAUL ISLAND
,J
I I
I
VALDE7 r:·03 00~~!? SEWARD
STATUTE MILES 50 0 50 100 150
HRH b=d I
Figure 8-5. Isohyeta1 map (inches), September 10-12, 1915
' '
\ I I
~ 0 68
EAGLE I
0•41
69

70
DATE/HR (AST)
X PRES (MB)
0
STORM NUMBER AND DATE
Q) MAY 28-30 I 1929
0 JUNE 11-13, 1955
Figure 8-6. Tracks of Lows in southerly-type storms

71
their surface counterpart is found over the Alaskan interior only because of the relatively high temperatures in lower levels there. Secondly, it is this interior heating with long days, and the evaporation from a moist land surface which supply the bulk of the moisture. The moisture accrued by advection into the storm area is much less than the moisture inflow through depth typical of the spring and fall storms. Midsummer storms do provide most cases of high precipitation for smaller areas and shorter durations where instability release rather than general storminess is the important mechanism.

72
Chapter IX
72-HOUR PMP
Introduction
9.01. A basic 3-day probable maximum precipitation (PMP) storm is developed as the main contribution of direct rainfall to the snowmeltseason flood hydrograph. The 3·-day PMP storm is assumed to occur first over the upper basin (above Woodchorper), followed by a repetition over the lower basin (between Woodchopper ~nd Rampart). The PMP depths over the two sub-basins are different only because of differing topographic effects.
Summary of 72-hr. PMP values
9.02. PMP for 72 hours beginning on May 26 (earliest starting date of PMP) for areas of 75,000 to 125,000 square miles is summarized in table 9-1. Accumulated values for 6 to 72 hours are given by 6-hr. time periods. From this table 6-hr. incremental basin values may be determined and rearranged in a sequential order for the PMP storm. For less than 72 hours, the values give a characteristic concentration distribution for 72-hr. PMP and are not themselves short-duration PMP depths; for example the 6-hr. PMP over 100,000 square miles exceeds the 0.7 inches of the table.
Table 9-1
7 2-HOUR PMP AND CONCENTRATION WITH DURATION
Area Duration (hr.)
(Sq. Mi.) 6 12 "18 24 30 36 42 48 54 60 66 72
Precipitation (in.)
75,000 0.9 1.3 1.6 1.8 1.9 2.1 2.2 2.3 2.4 2.5 2.6 2.6 100,000 0.7 1.1 1.4 1.6 1.8 1.9 2.0 2.1 2.2 2.2 2.3 2.4 125,000 0.6 1.0 1.3 1.5 1.7 1.8 1.8 1.9 2.0 2.1 2.2 2.2
Table 9-2 shows in summary form the method by which 72-hr. PMP was derived. Paragraph numbers are given for reference.

Table 9-2
SUMMARY OF 72-HOUR PMP DERIVATION
1) 3-day maximum spring or fall 100,000-sq. mi. observed precipitation (par. 9.04): 3.7 inches.
2) Adjustment of 3.7 inches to maximum May 26 moisture (par. 9.05): 2. 9 inches.
3) Adjustment for effective inflow barrier (par. 9.07): lower basin, 2.2 inches upper basin, 1.8 inches
4) Adjustment for elevation (par. 9.09): lower basin, 2.4 inches upper basin, 2.4 inches
Derivation of PMP
73
9.03. Basic data. Detailed depth-area analyses for 72 hours were carried out for the. eight largest storms of record in or near the basin occurring in the spring or fall storm trartsition seasons. Early fall storms were inc lud·ed because of their similarity to snowmelt season storms (pars. 8.01 and 8.07). All storms used depend on moisture inflow from a lower latitude offshore.
Summer-type storms are excluded to avoid storms dependent in part on high local moisture evaporated from the ground during the snow-free season (par. 8.08)·. Not only is this restriction synoptically realistic but storm experience indicates 3-day rains from the spring and"fall periods are higher than oT comparable to summer rains.
9.04. Table 9-3 lists the storms analyzed, 100,000-sq. mi. observed precipitation and other pertinent data. Tracks of the storms are shown in figures 8-1, 8-2, and 8-6.
9.05. Ad1ustment for moisture. The 100,000-sq. mi. depth for each storm was.adjusted to maximum moisture for May 26 by multiplying the storm precipitation by the ratio of the storm moisture to the maximum moisture for May 26. Moisture values were derived from surface dew points, assuming a saturated pseudo-adiabatic lapse rate. The adjusted 100,000-sq. mi. storm depths are given in the last column of table 9-3.
Figures 9-1 and 9-2 show maximum 12-hr. dew points for May and June. Maximum moisture adjustments were made from within the rectangular areas since maximum dew points there typify the moisture in depth advected from the southwest. Taking dew points in this area avoids maximizing to considerably bigher dew points in the interior that result from evaporation

~
150° 140°
Figure 9-1. Maximum ~2-hr. persisting 1000-mb. dew points (°F) - May
-...J .p..

150° 140°
Figure 9-2. Maximum 12-hr. persisting 1000-mb dew points (°F) - June ...... l.n

76
from moist snow-free terrain during high temperature periods. These interior dew points are higher than observed values resulting from moisture advection during a storm. The enveloping dew point within the rectangular box for mid-May is 50°F, to which storm precipitation {last column in table 9-3) has been.adjusted.
Table 9-3
DATA ON LARGER STORMS INVOLVED IN PMP ESTIMATES
100,000-Sg. Mi. Precipitation
Adjusted to 50°F Storm Date Dew Point Observed {May 26 max. dew point)
(OF) (in.) (in.)
l. Sept. 10-12, 1915 55 3.7 2.9 2. May 28-30, 1929 48 1.4 1.6 3. August 26-28, 1930 57 1.4 1.0 4. July 31, 1938-Aug. 1,
1938 53 1.5 1.3 5. August 25-27, 1951 58 1.3 0.9 6. August 21-23, 1953 52 1.6 1.4 7. June ll-13, 1955 46 1.8 2.2 8. August 22-24, 1955 53 1.6 1.4
It seems plausible that early fall storms can be more efficient for a given moisture charge than storms of the snowmelt period because ~f the contribution to instability of more effective surface heating in fall months. However, available storm data do not support the necessity for reduction beyond that for moisture or furnish a clue as to an appropriate magnitude. This omission, of limited importance because of the large size of the basin, is a slight maximizing step.
9.06. Geographical trans{Josttion. There is a tendency for storms of the fall and spring seasons to favor a location near or downstream from the lower part of the basin. This is because (1) western Alaska is closer to the moisture supply (from the southwest) and (2) with the anticyclonically curved storm track required to reach the upper basin from the Bering Sea, the strength of storm mechanisms is reduced. Transposition of storms upstream is, on these two counts, a slight maximizing step not easily evaluated.
9.07. ~arrier adjustment. To adjust for barriers to inflow, an average effective inflow barrier of 2000 feet was used for the lower basin (Rampart to Woodchopper). This is an adjustment from the actual average barrier (fig. 9-3) of about 2700 feet to take into account lower passes in the mountains and moisture recharge by evaporation from precipitation after

"'~ --
EFFECTIVE BARRIER
./ LOWER BASIN
'!.\\
~
DAWSON
Figure 9-3. Barrier heights (ft.) to the Yukon Basin
UPPER BASIN
-...! -...!

78
the air has passed the barrier. For the upper basin (above Woodchopper) an average barrier of 3500 feet is applied to inflow up the Yukon and Tanana Valleys. These two barriers of 2000 and 3500 feet reduce the column of available moisture by 24 and 39 percent respectively, for storms occurring at sea level and by lesser amounts for storms occurring farther inland. Transposition of the highest seasonally adjusted 72-hr. amount in table 9-3 (2.9 in. in the Sept. 10-12, 1915 storm) by reducing for barrier gives 2.2 and 1.8 inches for the lower and upper basin, respectively.
9.08. Elevation adjustments. The purpose of elevation adjustments is to account, in a general way, for the average increase in precipitation with elevation. Such an increase is not apparent in the precipitation from the predominantly low-level stations in the Yukon Basin.
An elevation-precipitation relation was developed from maximum 3-day rains in southwest Idaho and the Co~orado Plateau. This relation, given in figure 2-9, curve C, shows less increase with elevation relative to the monthly or seasonal curves. The latter reflect the greater frequency of precipitation at higher elevations.
9.09. Applying the 3-day rain variation with elevation to the highest maximized and barrier-adjusted 3-day PMP, 2.2 and 1.8 inches (par. 9.07) results in 2.4 inches for the 3-day PMP over both the lower and upper basins.
Since the elevation adjustment is derived from stations over a large area, it is useful for the basin as a whole but not for geographical distribution of 3-day PMP.
Depth-duration-area relation
9.10. In determining a depth-duration-area relationship to be applied to a basic 72-hr., 100,000-sq. mi. PMP, several groups of storm data were considered. These were 1) Twenty large storms in western Canada (15); 2) Alaska point rainfall for more than 80 cases of 24-hr. amounts of an inch or more; 3) forty large storms in the contiguous United States selected on the basis of storm dew points comparable to those in Alaska (16); and 4) analyses of largest 3-day storms in Alaska. In addition to individual or mean storm data, results of other large area PMP studies such as for the Colorado and Snake River Basins in the Western States, and the Chena River in Alaska, provided additional judgment factors.
9.11. An example of the derivation of depth-area relations for 24 hours is given in figure 9-4. This shows, in percent of 1000-sq. mi. values, the average depth-area relation from 1000 to 100,000 ~quare miles or 200,000 square miles for western Canada storms, and for 3-day Alaskan storms. The shaded region of the figure envelopes the range in deptharea relations used in PMP studies for other regions. The adopted relation is approximately the average of Canadian and Alaskan storms and near the upper limit of depth-area relations for other studies.

VI LU --'
~ LU
""' <( :J 0 ~
200,000 ..---r---r--""T""T-"'T"""r-..... --.-..---.--~--r--------,
100,000
50,000
ADOPTED RELATION FOR YUKON ABOVE RAMPART ( 24 HR. DURATION )
-------*""" AVERAGE OF 20 WESTERN CANADIAN STORMS (24-HRS.)
AVERAGE OF ALASKAN STORMS (72-HRS.)
~ 10,000 ""' <(
5,000 HATCHED AREA IS RANGE OF DEPTH-AREA RELATIONS FROM THE
U. S. STUDIES (24 HRS.)
1,000 0 -- ·- ·- -- ---
PERCENT OF 1,000-SQ. MI. DEPTH
Figure 9-4. Depth-area relations -..,J 1.0

80
Placement of May 26 PMP
9.12. It is assumed that the 3-day PMP (par. 9.09) can occur first over the upper basin (above Woodchopper) followed by a repetition over the lower basin. From the depth-area relation for PMP, a synthetic elliptical pattern has been constructed for guidance in rain distribution over each basin. This 3-day pattern, figure 9-5, is May 26 elevation-adjusted basin PMP. When the 3-day PMP is centered over the upper basin, some rainfall may extend over about one-third of the lower basin. Intense storms moving across the lower basin could miss all b~t the northern portion of the upper basin.
9.13. A sequence with no interval between the two 3-day PMP periods is permissible. However, a short interval of no rain has a higher probability of occurrence and should be used if an equally critical flood results.
9.14. Adjustment for variation in PMP date. Figure 9-6 gives the percentage adjustment to the PMP for occurrence after May 26. It represents the variation in precipitable water corresponding to snowmelt-season dew points adjusted to 24-hr: values. The smooth seasonal trend was based on moisture data from an area considered as the inflow-moisture source region of·the snowmelt season, as explained in paragraph 9.05. Procedure for moisture adjustment of 3-day PMP for a date other than May 26, the date assumed in table 9-1, is to multiply the May 26 values by a percentage from figure 9-6. This involves a re-labeling of the isohyets of figure 9-5.

-------------- -/..........- --o.s........_ / -.....,_
/ l ~ / ~
/ ~ I \
I \ I 0 \ \ I \ I \ I \ / ' / ' / ' /
0 100 liillllilll
' // '---. .,/'
STATUTE MILES 200
I
- ----------300
I
Figure 9-5. Synthetic 3-day storm isohyetal pattern (inches)
-'< 0
~ - 53~
"' 7 ~
Figure 9-6. Variation of 3-day PMP during snowmelt period
81

82
Chapter X
POST-PMP RAIN
Introduction
10.01. The magnitude of long-duration rain that may reasonably be expected immediately after the PMP in the Yukon Basin has been specified as a requirement for completing the maximum flood hydrograph. To fulfill this need, 30-day basin average rain was determined from maximum observed station rain in and near the basin. Snowmelt criteria are presented from May 15 to June 23. Post-PMP rain is given, after an elevation adjustment, for 30-day periods centered on any day between June 1 and June 30. The actual placement would be determined by the number of days required for snowmelt plus the 6 days of PMP rain; so that it is unlikely the post-PMP rain would begin much if any before June 1.
Meteorological features
10.02. Study of summer monthly precipitation sequences furnishes guidance to the prototype of heavy 30-day Yukon precipitation following the PMP storm period. This 30-day precipitation may be expected to include two or three summer storms, each of about 2 days duration (described briefly in par. 8.08), and may include also, early in the thirty days, a storm like those of spring or fall months (par. 8.01). Most of the precipitation over a given area will likely occur in only one of these three or four stormy periods. Yet the 30-day precipitation will be rather uniform over the basin.
Maximum calendar-month precipitation
10.03. Maximum calendar-month precipitation at most stations in and adjacent to the basin were selected from Climatological Data for Alaska (17) and the Yukon Territory of Canada (18). The arithmetic averages of station values for each month are given in table 10-1.
Table 10-1
AVERAGE OF MAXIMUM CALENDAR-MONTH STATION PRECIPITATION
Honth
May June July August
Precipitation (ins.)
2.0 3.1 4.1 3.8
Percent July
49 76
100 93
of

83
A map of June maximum values and year of occurrence is shown in figure 10-1. That they occurred in a number of different years demonstrates some maximization in the 3.1-inch basin average. However, more years appear in figure 10-1 than would be the case if all stations had a concurrent period of record.
Seasonal variation of basin precipitation
10.04. For seasonal variation, the average of three variables are used. Figure 10-2 shows smooth percent curves drawn through (1) average of maximum calendar-month station precipitation of table 10-1, (2) basin mean monthly precipitation and (3) the precipitable water corresponding to average enveloping 12-hour persisting dew points for selected stations near the basin. The similarity of the curves expressed as percent of the maximum led to averaging them to obtain a seasonal variation in the basin 30-day rain centered on each of three dates. The values thus obtained are given in table 10-2. For other placement~, values can be obtained by interpolation. The last column of.table 10-2 gives values adjusted for elevation as described in para-graph 10.06.
Table 10-2
BASIN 30-DAY RAIN FOR POST-PMP PERIOD FOR 3 DATES
30 Days centered on indicated date
June 1 June 15 June 30
Comparison with observed rain
Basin-average lowelevation depth
(ins.)
2.5 3.1 3.6
Elevati·on-adjusted basin rain
(ins.)
3.1 3.9 4.5
10.05. Highest 30-day rain periods over the basin were determined from a survey of daily values at key stations. Isohyetal maps were drawn for these periods, which were usually in June. Average depths over the basin are shown in table 10-3.
Table 10-3
OBSERVED BASIN-AVERAGE 30-DAY PRECIPITATION
Period Average Depth (ins.)
June 1-30' 1949 1.9 June 26-July 25, 1945 2.1 June 23-July 22, 1949 2.2 June 24-July 23, 1959 1.5 June 1-30, 1945 1.6

Wiseman 2.6
(42)
Bettles
4.2 Allakaket
(27)
Tanana
Manley Hot Springs
Nenana
2. 7farl Yukon
(45)
Circle Hal Springs
3o 7 (55) •
3. 7Big Della
(43)
Tanacross
) YEAR OF OCCURRENCE
50 0 50 MtL£5
Eagle
3o3 (15)
Boundory 2o5 (49)
Dow son
3.7 Snag
(58)
2. ]Akla¥ik
(43)
2• 1 Elsa
(49) 3.0 Moyo Lending
(32)
Fort Selkirk
Cormocks
Pine Creek
3o6 (53)
Figure 10-1. Maximum station precipitation for June (inches)
UPPER BASIN
While Horse
J.9Carcrau
(41)
frances Lake
3o5 (42)
CXl .p..

VARIATION OF MOISTURE (FROM ENVELOPING 12-HOUR PERSISTING DEWPOINTS NEAR
100 ~ BASIN) \. ~ ~:I'
~ /A ~ 80 I--
:c ~""VARIATION OF BASIN 1- ~/ MAXIMUM PRECIPITATION z / .
0 // ::E 1- 60 /// Vl LU :c / 0 / :c
/ u.. 0 / 1- 40 z LU u 0.:: LU c..
20
0~----------~----------~~----------~----------~------------~--~ MAY JUNE JULY AUG SEPT OCT
MID- MONTH
Figure 10-2. Seasonal variation of summer 30-day precipitation 00 1.11

86
The highest value is about 61 percent of the adopted June 30th lowelevation rain (table 10-2). This appears to be a considerable maximization. But because stations are so widespread it is certain that higher depths have occurred than those shown in table 10-3.
Adjustment for elevation
10.06. Most of the precipitation data for the basin comes from lowelevation stations averaging about 1000 feet. Rain studies for other regions show an increase with elevation due partly to more frequent rains and partly to intensification by slopes. The May and June elevation adjustment shown on figure 2-9, curve B, based on Colorado Plateau data is considered applicable to Yukon Basin May-June monthly rains. This gives approximately a 25 percent increase for the elevation-area distribution of the subject basin. Elevation-adjusted values are giyen in table 10-2.
Time distribution within 30-day rain period
10.07. Guidance for timing of rain within 30 days can be obtained from distribution within heavy rain months. The heaviest 30-day rains used in this study show that 40, 58, 72, 84 and 99 percent of the 30-day value has occurred in 5, 10, 15, 20 and 25 days respectively.

87
Chapter XI
APPLICATION OF PRESENTED CRITERIA
Introduction
11.01. To illustrate how the presented criteria are used, an example is given for the basin above Woodchopper Dam site. The first day of the Pl'1P is placed on June 1.
The example is based on daily values of the snowmelt factors. If halfday snowmelt computations are required, half-day temperatures and dew points may be obtained in accordance with paragraph 5.18. Daily short-wave radiation is divided into half-days by apportioning 90 percent of the daily value (on a particular day) to the half-day controlled. by maximum temperature and the remaining 10 percent to the half-day controlled by the minimum temperature. Long-wave radiation may be divided equally between the two half-days.
Hydrologic factors help to determine the most critical arrangement of PMP in relation to concomitant arrangements of other snowmelt factors. Starting with the May 15 beginning snowmelt date and recommended magnitude of temperature and winds prior to PMP, the user should place the PMP and adjust sequence of other parameters to give the most critical runoff, considering snowpack on that date.
Elevation of the snow line is assumed for each date of the snowmelt period; in practice, the user would determine snow lines by snowmelt computation.
Explanation of example
11.02. The procedure for determining daily snowmelt criteria follows. Line numbers are those of the example, table 11-1.
Line 2: PMP for Yukon above Woodchopper. The 3-day PMP for the 121,000 square-mile basin is interpolated from table 9-1 and adjusted seasonally to June 2d by figure 9-6 (114%). Six-hour increments are arranged in a hydrologically reasonable manner, with highest increments in the center of the 3-day storm period.
Line 3: Serial number. These numbers are for convenience in rearranging criteria in descending order after placement of maximum 1-day values on a desired date. In the example, the 1-day maximum final temperature is placed five days prior to beginning of PMP or on May 27. Preceding and succeeding temperatures in order of descending magnitude are arranged symmetrically and given progressively hi·gher serial numbers (lines 6 and 9). Dew points and winds are arranged analogo~sly.

88
Line 4: One-day snow-free temperatures are from snow-free curve of figure 5-3 for the dates of line 1. These can also be tabulated from table 5-l.
Line 5: Daily snow-free temperature departures are read from figure 5-4 for the serial numbers of line 3.
Line 6: Snow-free daily temperatures are obtained by subtracting the daily snow-free temperature departures of line 5 from the one-day snow-free temperatures of line 4.
Line 7: One-day snow-on-ground temperatures from snow-on-ground curve of figure 5-3 for the dates of line 1. These can also be tabulated from table 5-l.
Line 8. Daily snow-on-ground temperature departures are read from figure 5-4 for the serial numbers of line 3.
Line 9: Snow-on-ground daily temperatures are obtained by subtracting the daily snow-on-ground temperature departures o( line 8 front the one-day snow-on-ground temperatures of line 7.
Line 10: Snow-free minus snow-on-ground temperature is the difference for each day of the sequence between the snow-free and snow-on-ground temperatures. Subtract line 9 from line 6.
Line 11: Elevation of snow line. In this example, the elevation of the snow line on successive dates is assumed. In application, the elevation of the snow line on a particular day can be determined by computations of melt on previous days. The same elevation may be used until the next elevation band is snow free.
Line 12: Percentage of snow-free ground. The elevations of the snow line from line 11 (determined from snow-melt computations) are used in conjunction with an area-elevation curve for the basin to determine the percentage of snow-free ground. These percentages provide an orderly transition from snow-on-ground to snow-free temperatures. In the example, 75 percent of the basin is assumed snow-free on May 31.
Line•l3: Adjusted percentage. The percentages of line 12 are adjusted to ~he assumption that basin-wide snow-free temperatures can be fully realized when 75 percent of the basin is snow-free (in the example on May 31). On May 31, therefore, 100 percent of the snow-free minus snow-on-ground temperature difference is applicable. The other percentages of line 13 are obtained by multiplying the percentages of line 12 by the ratio 100/75.
Line 14: Adjustment to snow-on-ground temperatures. These adjustments to the snow-on-ground temperatures are obtained by multiplying the differences of line 10 by the adjusted percentages of line 13.

89
Line 15: Adjusted temperatures. Adding the adjustments of line 14 to the temperatures of line 9 gives the adjusted temperatures of line 15. Temperatures appropriate for the six days of PMP rainfall are also shown on line 15. The temperature appropriate to the 2nd day of PMP is read from the curve of figure 5-S, with the other days determined by applying the adjustments shown on the figure to this value.
Line 16: Elevation band being considered.
Line 17: Snowpack water-equivalent obtained for 500-1000 ft. elevation band from table 2-5, paragraph 2.19.
Line 18. Mean temperature at 750 feet. Same as line 15. (Temperature corrections for elevation needed only for elevations above 2500 ft., par. s. 15).
Line 19: Mean dew point at 7 SO feet. For non-rain days is 14 °_F less than the 750-ft. mean temperature. For the six days of rain, the mean dew point is 2°F less than the mean temperature.
Line 20: Average daily wind (750ft.) not arranged. Winds from lowest to highest of table 6-2 for the 500-1000 ft. elevation band, reduced for an upper-basin inflow-width adjustment of 0.75. (0.75 obtained from fig. 6-2 with basin width of 300 mi.)
Line 21: Average daily wind (750ft.) arranged. The six highest daily winds are placed in accordance with the magnitude of the six days of PMP, with the highest daily wind placed on the day of greatest PMP (i.e., 2nd day of 3-day PMP over lower basin) and other PMP winds assigned as shown in paragraph 6.11. Three days of lowest winds of sequence are placed immediately before the PMP. The remaining winds are arranged in accordance with the temperatures, i.e., highest remaining wind with highest remaining temperature, etc., to lowest remaining wind with lowest remaining temperature. (See par. 6.12)
Line 22: Clear-weather insolation. Daily clear-weather insolation values in langleys per day are taken from table 7-2. In this example, the values for May 15 through May 31 are tabulated.
Line 23: Daily short-wave radiation ratios. The ratios are read from the appropriate lower curve of figure 7-5, interpolating as necessary for date. The diagram is entered with the serial numbers of line 3. A ratio of 0.18 is assigned the six days of l'MP.
Line 24: Daily short-wave radiation. These values of daily solar radiation at the snow surface are obtained by multiplying the values of line 22 by the ratios of line 23. This is the daily solar radiation at the snow surface in langleys, before taking into account reflection, interception by trees, or terrain slope.

90
Line 25: Net daily long-wave radiation. Net daily long-wave radiation values are determined by the following stepwise procedure. (See long-wave radiation computation sheet, table 11-2.)
Cloud amount
Step l. Enter figure 7-9 with insolation ratio from line 23 (fig. 7-5) and read out effective cloudiness in tenths.
Clear-sky radiation
Step 2. Enter figure 7-8 with mean daily surface dew point from line 19 (base dew point applies up to 2500 ft.) and read out ratio.
Step 3. Enter black-body curve, figure 7-7, with mean daily surfaceair temperature from line 18 (for elevations up to 2500 ft.) and read blackbody radiation. Multiply the latter by ratio from step 2, obtain clear-sky long-wave radiation in langleys per day.
Cloud radiation
Step 4. Subtract l5°F from mean daily surface-air temperature at base elevation (surface to 2500 ft.)
Step 5. Enter black-body curve of figure 7-7 with temperature from step 4 and read out daily cloud radiation in langleys.
Total downward radiation
Step 6. Multiply cloud radiation from .step 5 by effective cloud amount of step 1.
Step 7. Multiply clear-sky radiation from step 3 by (1.0-N), where N is the effective cloud amount from step 1.
Step 8. Add radiation from steps 6 and 7 for daily total.
During PMP
Step 9. Instead of the foregoing procedure, enter figure 7-7 with the elevation-adjusted surface air temperature and read out the total daily radiation in langleys directly.
Upward radiation
Step 10. Use 652 langleys/day for a snow surface at 32°F. For radiation at other snow-surface temperatures, enter figure 7-7.

Net radiation
Step 11. Subtract upward daily radiation (step 10) from downward (step 8 or step 9). A plus sign on the result indicates net gain of heat at the snow surface by long-wave radiation, a minus sign a net loss.
Line 26: Elevation band being considered.
Line 27: Snowpack in water-equivalent obtained for 3000-4000 ft. elevation band from table 2-5, paragraph 2.19.
91
Line 28: Mean temperature at 3500 feet is derived by subtracting 3°F from the base (i.e., sao to 2500 ft.) temperatures (line 15) per thousand feet above 2500 feet. No variation in temperature is assumed between the surface and 2500 feet.
Line 29: Mean dew point at 3500 feet for the non-rain days is l4°F less than the 3500-ft. mean temperature. For the six days of rain, the dew point is 2°F less than the mean temperature.
Line 30: Average daily wind (3500 ft.) -not arranged. Winds from lowest to highest of table 6-2 for 3000-4000 ft. elevation band, reduced for an upper-basin inflow-width adjustment of 0.75. (See explanation of line 20.)
Line 31: Average daily wind (3500 ft.) -arranged. See explanation for line 21.
Lines 32, 33, and 34: The same values as determined for the 500-1000 ft. elevation band apply (i.e., lines 22, 23, and 24). This is based on assumed constant short-wave radiation with height.
Line 35: Long-wave radiation (3500 ft.). See explanation of line 25. In the example, long-wave radiation is assumed to' have no elevation variation, so that the values computed for the 500-1000 ft. elevation band are appropriate for all other elevation bands. See paragraphs 7.25-7.27 if it is desired that an elevation variation of radiation be applied.
Snowmelt parameters using interval between 3-day PMP periods
11.03. The example above assumes no interval ~eparating the two 3-day PMP periods. If one-day or two-day intervals are used between the 3-day PMP periods, then the following rules apply for selection of values of the snowmelt factors for the interval:
(1) Temperatures and dew points will be the same as on the last day of preceding 3-day PMP.
(2) Short-wave radiation will be 50 percent of that on day prior to first PMP period.

92
(3) The wind will be equal to the lowest daily wind of the snowmelt period.
(4) The long-wave radiation will be equal to the long-wave radiation on the last day of preceding 3-day PMP.
Additional snowmelt parameter values following placement of PMP
11.04. If additional temperature, radiation, and other values are needed for snowmelt computations following the PHP, they may be obtained as follows:
1. For temperatures, starting with the highest single-day temperature in the sequence, decrease the temperature 0.5°F the next day and an additional 0.5°F for each succeeding day.
2. For additional short-wave radiation values following the PMP, allow one day after PMP for a transitional value. Beginning the second day after the PrW ends, assign serial numbers consecutively, i. e., 1, 2, 3, etc. to allow for a sufficient number of days for melt requirements. Following the procedure in steps 22 through 24 of the example, additional short-wave radiation values are determined by multiplying the appropriate maximum one-day insolation from table 7-2 by the insolation ratio from figure 7-5. The short-wave radiation value for the day after the PMP (transitional day) can then be determined by interpolating between the value for the last day of the PMP and the computed value for the following day.
3. For additional winds, use daily velocities equal to lowest daily value in the sequence.

LINE
1 2
3
4
5
6
7
8
9
10
11
12 13
14
15 16
17 18 19
20 21
22 23 24
25
Date PMP for Yukon above Woodchopper (in.)
Serial number
One-day snow-free temperature (°F) (table 5-l)
Daily snow-free tmp departure (°F) (fig. 5-4)
Snow-free daily temperature (°F) (line 4-line 5) One-day snow-on-ground tmp (°F) (table 5-l)
Daily snow-on-grnd tmp departure (°F) (fig. 5-4) Snow-on-grnd daily temperature (°F) (line 7-line 8)
Snow-free minus snow-on-grnd tmp (°F) (line 6-line 9)
Elevation of snow line (ft) (assumed)
Percentage of snow-free ground Adjusted percentage
Adjustment to snow-on-grnd tmp (°F)(line 13xline 10)
Adjusted temperature (°F) (line 9 + line 14) Elevation band being considered
Snowpack water equivalent (in.) = 13.8 Mean daily temperature at 750 ft. (same as line 15) Mean daily dew point at 750 ft. ( 0 F')
Average daily wind-not arranged (m9h) Average daily wind-arranged (mph)
Daily clear-weather insolation (langleys) (table 7-2) Daily short-wave radiation ratios (fig. 7-5)
Daily short-wave radiatton (ly) (line 22 ~ line 23)
Net daily long-wave radiation (ly) {See table 11-2)
MAY
15
Table 11-1
EXAMPLE OF UPPER BAS IN SNOWMELT CRITERIA WITH PMP BEGINNING JUNE 1
16 17 18 19 20 21 22 23 24 25 26 27 28 29 30 31
JUNE
1 2 3 4
(121,000 sq. mi.) 6-Hr. Increments for June 1-3 Arranged in Storm Sequence 5 6
0.08 0.08 0.09 0.09 0.22 0.43 0.75 0.31 0.08 0.13 0.17 0.08
17 16 15 14 13 12 11 10 8 6 4 2 1 3 5 7 9 18 19 20 21 22 23 62.3 62.9 63.4 63.9 64.4 64.8 65.2 65.5 66.1 66.5 66.9 67.2 67.5 67.8 68.2 68.5 68.8 8.4 8.2 8.1 7.9 7.7 7.4 7.1 6.8 6,0 5.0 3.7 1.7 0 2.8 4.4 5.6 6.4
53.9 54.7 55,3 56.0 56.7 57.4 58.1 58.7 60.1 61.5 63.2 65.5 67.5 65.0 63.8 62.9 62.4 51.2 51.4 51.6 51.8 52.0 52.1 52.2 52.3 52.4 52.5 52.6 52.7 52.8 52.8 52.8 52.8 52.8
9.4 9.2 9.0 8.7 8.4 8.1 7.7 7.3 6.4 5.3 4.0 1.9 0 3.1 4.7 6.0 6.9 41.8 42.2 42,6 43.1 43,6 44,0 44.5 45,0 46,0 47.2 48.6 50.8 52.8 49.7 48.1 46.8 45.9
12.1 12.5 12.7 12.9 13.1 13.4 13,6 13.8 14.1 14.3 14.6 14.7 14.7 15.3 15.7 16.1 16.5 SFC SFC SFC SFC 750 1200 1500 2000 2500 2750 3000 3250 3500 3750 4000 4250 4400
0 0 0 0 6 12 16 23 31 35 41 47 54 61 67 73 75
0 0 0 0 8 16 21 31 41 47 55 63 72 81 89 97 100 0 0 0 0 1,0 2,1 2,9 4,3 5,8 6,7 8.0 9.3 10.6 12.4 14.0 15.6 16.5
41.8 42.2 42.6 43.1 44.6 46.1 47.4 49.3 51.8 53.9 56.6 60.1 63.4 62.1 62.1 62.4 62.4 51.6 53.6 49.6 51.6 53.6 49.6
Elevation band 500-1000 ft,
(Depth determined by snowmelt computation) 41.8 42,2 42,6 43,1 44.6 46,1 47,4 49.3 51,8 53.9 56.6 60.1 63.4 62.1 62.1 62.4 62.4 51.6 53.6 49.6 51.6 53.6 49.6
27.8 28.2 28.6 29.1 30.6 32.1 33.4 35.3 37.8 39.9 42.6 46.1 49.4 48.1 48.1 48.4 48.4 49.6 51.6 47.6 49.6 51.6 47.6
6 6 6' 6 7 7 7 7 7 7 8 8 8 8 8 9 10 10 10 11 13 16 22 6 7 7 7 7 7 7 8 8 8 8 8 9 8 6 6 6 10 11 10 16 22 13
687 692 697 701 706 710 715 719 722 726 730 733 736 739 742 745 749 751 753 756 758 760 762
0.78 0,78 0,78 0.79 0,80 0,81 0,82 0,83 0,85 0,8S 0.93 1.00 1,00 0.96 0.90 0.86 0.83 0.18 0,18 0.18 0.18 0.18 0.18 536 540 544 554 565 575 586 597 614 646 679 733 736 709 668 641 622 135 136 136 136 137 137
-83 -83 -79 -79 -78 -74 -69 -59 -38 -38 -16 -9 14 18 18 25 25 113 125 101 113 125 101
Elevation band 3000-4000 ft, 26 Elevation band being considered
27 Snowpack water equivalent (in.) 17.1 (Depth determined by snowmelt computation) 28 Mean daily temperature at 3500 ft. (°F)
29 Mean daily dew point at 3500 ft. (°F) 30 Average daily wind-not arranged (mph)
31 Average daily wind-arranged (mph)
32 Daily clear-weather insolation (langleys)
33 Daily short-wave radiation ratios 34 Daily short-wave radiation (langleys)
35 Daily long-wave radiation (langleys)
38.8 39.2 39.6 40,1 41.6 43.1 44.4 46,3 48.8 50,9 53.6 57.1 60.4 59.1 59.1 59.4 59.4 48.6 50.6 46.6 48.6 50.6 46.6
24.8 25.2 25.6 26,1 27.6 29,1 30,4 32,3 34,8 36.9 39.6 43.1 46.4 45.1 45.1 45.4 45.4 46.6 48.6 44.6 46.6 48.6 44.6 8 8 8 8 8 8 8 8 8 8 9 9 9 10 11 11 11 12 13 14 16 20 27
8 8 8 8 8 8 8 9 9 9 10 11 11 11 8 8 8 13 14 12 20 27 16
Same as line 22
Same as line 23 Same as line 24*
Same as line 25*
*Assuming no variation with elevation, (See par, 7.25- 7.27)

Table 11-2
EXAMPLE OF LONG-WAVE RADIATION COMPUTATION
LINE STEP
1
MAY 15 16 17 18 19 20 21 22 23 24 25
ELEVATION BAND 500-1000 FT. 2 3
4
5
6
7 8
9
10
11
12 13
14 15 16 17 18
19 20 21 22 23 24 25 26
27 28
29 30 31
32 33
34 35 36
37 38
CLOUD AMOUNT 1 Insolation Ratio
Effective Cldns = N 1-N CLEAR-SKY RADIATION
(Line 23E) .78
(Fig. 7-9) .3
.7
• 78
.3
.7
• 78
.3
.7
2 Mean Daily Sfc Dew Pt (°F) (Line 19E) 2S 2S 29 Ratio Back Rad.To Blackbody Rad.(Fig.7-S) .77 .77 .77
3 Mean Daily Sfc-Air Tmp (°F) (Line lSE) 42 42 43 Blackbody Radiation (ly/day) (Fig.7-7) 707 707 713
(Line 8 Clr-Sky Radiation (ly/day) X Line 10) 544 544 549
CLOUD RADIATION 4 Mean Daily Sfc-Air Tmp (Line 9) - l5°F 27 27 2S
5 Cloud Radiation (ly/day) (Fig.7-7) 627 627 631 TafAL DOWNWARD RADIATION
6 Cloud Radiation X N (Line 14 X Line 4) lSS
7 Clr-Sky Rad. X (1-N) {Line 11 X Line 5) 3Sl (Lin~ 16
S Tot. Downward Rad. {ly/day) + L1ne 17) 569 PMP DOWNWARD RADIATION
188 189 381 384 569 573
.79
.3
.7
29 .77
43 713
549
28 631
.80
.2
.8
.Sl
.2
.s
31 32
.77 .77
45 46 724 729
557 561
30 31 641 647
1S9 12S 129
3S4 446 449 .573 574 57S
9 Total Downward Radiation (PMP) {ly/day) UPWARD RADIATION
SAME AS LINE 10, JUN 1-6
10 Upward Radiation From Melting Snow = 652 langleys/day 11 NET RADIATION
.82
.2
.8
.S3
.2
.s
33 35
.77 .77
47 49 735 .747
566 575
32 34 652 663
.S5
.2
.s
38 .7S
52 765
597
37 679
130 133 136 453 460 47S 583 593 614
.S9
.1
.9
40 • 7S
54 777
606
39 690
69 545 614
.93
.1
.9
43 .79
57 795
628
42 707
71 565 636
Non-PMP Case (ly/day) (Line 18-Line 22) -83 -83 -79 -79 -78 -74 -69 -59 -38 -38 -16
PMP Case (ly/day) (Line 20-Line 22)
CLEAR-SKY RADIATION 2 Mean Daily Sfc Dew Pt (°F) (Line 29E) 25
Ratio Back Rad. to Blackbody Rad.(Fig.7-8).76 ~ Mean Daily Sfc-Air Tmp (°F) (Line 2SE) 39
Blackbody Radiation (ly/day) (Fig. 7-7) 690 . (Line 29
Clr-Sky Rad1ation (ly/day) X Line 31) TafAL DOWNWARD RADIATION
(Line 32 7 Clr-Sky Radiation X (1-N) X Lme 5) 8 Total Downward Radiation (~i£fn~634)
11 NET RADIATION
524
367 555
25
.76 39
690
524
367 555
26
.76 40
696
529
370 559
26
.76 40
696
529
370 559
ELEVATION BAND 3000-4000 FT.**
28 29
• 77 • 77 42 43
707 713
544 549
435 439 563 568
30 32 35
.77 .77 .77 44 46 49
718 729 747 533 561 575
442 449 460 572 582 596
37
• 78 51
759
592
533 602
40 .78 54
777 606
545 616
Non-PMP Case (ly/day)(Line 35-Line 22) PMP Case (ly/day) (Line 31-Line 22)
-97 -97 -93 -93 -89 -84 -so -70 -56 -50 -36
**IF VARIATION WITH ELEVATION IS ASSUMED NOTE: E FOLLOWING LINE NUMBER REFERS TO TABLE 11-1.
26 27 28 29 30
1. 00 1. 00 • 96 • 90 .86
0 0 .1 .1 0 2
l.O 1.0 .9 .9 .8
46 49 48 48 48 • 79 .so .80 .80 .so 60 63 62 62 62
814 833 827 827 827
643 666 662 662 662
45 48 47 47 47 724 741 735 735 735
0
643 643
-9
43
.79 57
795
62S
628 62S
-24
0 74 666 596 666 670
14 18
46 45
.79 .79 60 59
814 80S 643 63S
643 574 643 648
-9 -4
74 147 596 530 670 677
18
45 .79 59
sos 63S
574 MS
-4
25
45 . 79 59
sos 63S
510
657
5
31
.S3
.2
.s
4S .80 62
S27 662
47 735
147 530
677
25
45 .79 59
sos 63S
510
657
5
JUN 1
.lS
1.0
0
50 .so 52
765
2 3
• lS .lS
l.O 1.0
0 0
52 .80
54 777
4S .so 50
753
4
.18 l.O
0
50 .so 52
765
5
.18 1.0
0
52 .so 54
777
6
.lS 1.0
0
4S .so 50
753
765 777 753 765 777 753
113 125 101 113 125 101
49 747
51 759
95 107
47 735
S3
49 747
51 759
95 107
47 735
S3

95
ACKNOWLEDGMENTS
The project was under the general supervision of Vance A. Myers, Chief of the Hydrometeorological Branch. G. A. Lott, J. T. Riedel, F. K. Schwarz and R. L. Weaver were sub-project leaders responsible fo~ various chapters. S. Molansky assisted in editing and preparing the report for publication. Mr. Dwight Nunn, Office of the Chief, Corps of Engineers, gave helpful advice in many phases of the study.

96
REFERENCES
1. Corps of Engineers, U. S. Army, "Runoff From Snowmelt," Manual EM 1110-2-1406, 1960.
2. U. S. Weather Bureau, "Interim Report, Probable Maximum Precipitation in California," Hydrometeorological Report No. 36, 1961.
3. Smithsonian Institution, "World Weather Records," vols. 79, 90, and 105, 1927, 1944, 1947.
4. U. S. Weather Bureau, "World Weather Records, 1941-1950," 1959.
5. Klein, W. H., "An Objective Method of Forecasting Five-Day Precipitation for the Tennessee Valley," Weather Bureau Research Paper No. 29, 1948.
6. Namias, J., "Further Aspects of Month-to-Month Persistence in the MidTroposphere," Bulletin of the American Meteorological Society, vol. 35, March 1954, pp. 112-117.
7. Namias, J., "Persistence of Mid-Tropospheric Circulations Between Adjacent Months and Seasons," The Rossby Memorial Volume, The Rockefeller Institute Press, N. Y., 1959.
8. Corps of Engineers, U. S. Army, "Snow Hydrology," Portland, Oregon, 1956.
9. Smithsonian Institution, "Smithsonian Meteorological Tables," 6th rev. ed., 1951, pp. 417-418.
10. Johnson, Francis S., "The Solar Constant," Journal of Meteorology, vol. 11, December 1954, pp. 431-439.
11. Canadian Dept. of Transport, Meteorological Branch, ·~onthly Record, Meteorological Observations in Canada," July 1957, p. 112.
12. Fritz, Sigmund, "Solar Radiation During Cloudless Days," Heating and Ventilating, January 1949.
13. Mateer, c. L., "Average Insolation in Canada During Cloudless Days," Canadian Journal of Technology, vol. 33, 1955.
14. U. S. Weather Bureau, "Upper Air Climatology of the United States," Weather Bureau Technical Paper No. 32, Part I, 1957.
15. Canadian Dept. of Transport, Meteorological Branch, "Storm Rainfall in Canada," 1962.

97
REFERENCES (Cont'd.)
16. Corps of Engineers, U. S. Army, "Storm Rainfall in the United States," Washington, 1945-.
17. U. S. Weather Bureau, "Climatological Data for Alaska," Series.
18. Canadian Dept. of Transport, Meteorological Branch, ·~nthly Record, Meteorological Observations in Canada," various months.
« U. S. GOVERNMENT PRINTING OFFICE: 1966 0- 2!7-851