metagenomic as a tool to assess microbial diversity of ... · jimenez, francisco dini-andreote,...
TRANSCRIPT

Metagenomic as a tool to assess microbial diversity of:Sediment of São Paulo mangroves and Amazon soils
Vivian H. Pellizari ([email protected])Instituto Oceanográfico - USP


Metagenomic
Mangroves Amazon soil
Assessing microbial
diversity of sediments
and comparing with
other environments
Mangroves present
large potential for
methane production.
Link phylogeny to
function of active
methanotrophs
Land use change in the
Amazon can alter
microbial biodiversity
Distance-Decay
Patterns in
Biogeography

Biodiversity and functional activities of
microorganisms from mangrove of São Paulo
State
Itamar Soares de Melo
Embrapa Meio Ambiente (Coordenador),
Aline Aparecida Pizzirani-Kleiner Esalq/USP
Aline de H. Nunes Maia
Embrapa Meio Ambiente
Ana Olivia de Souza
Instituto Butantan
Célia Maria M. de Souza Silva
Embrapa Meio Ambiente
João Lúcio de Azevedo
Esalq/USP
Luiz Alberto B. de Morais
FFCLRP/USP
Marcos A. Vieira Ligo
Embrapa Meio Ambiente
Fernando Dini Andreote
Esalq/USP
Marli de Fátima Fiore
CENA/USP
Nilce Chaves Gattaz
Embrapa Meio Ambiente
Ricardo Harakava
Instituto Biolgóico
Rosana F. Vieira
Embrapa Meio Ambiente
Shirlei Scramin
Embrapa Meio Ambiente
Sui Mui Tsai
CENA/USP
Sonia C. N. de Queiroz
Embrapa Meio Ambiente
Vera L. Ferracini
Embrapa Meio Ambiente
Vivian H. Pellizari IO USP
METAGENOMIC ANALYSIS: Siu Mui Tsai, Lucas William Mendes, Fernando Dini Andreote, Diego Javier
Jimenez, Francisco Dini-Andreote, Armando Cavalcante Franco Dias, 1anice Mazzer Luvizotto, Rodrigo
Gouvêa Taketani, Diego Chaves, Sandra Baena, Itamar Soares de Melo, Rubens Duarte, Ana Carolina
Vieira.

Mangroves are tropical environments
Located in the intersection sea-land
Sediments are mostly anoxic and reductive
Very diverse and rich in animal species
Scarcely studied about the microbiology

Bertioga
Cananéia
N
Oil Mgv Ant Mgv Prs Mgv
Point 1
Point 2
Point 3
Sea
Land
SAO PAULO STATE
(Brazil)
COLOMBIA
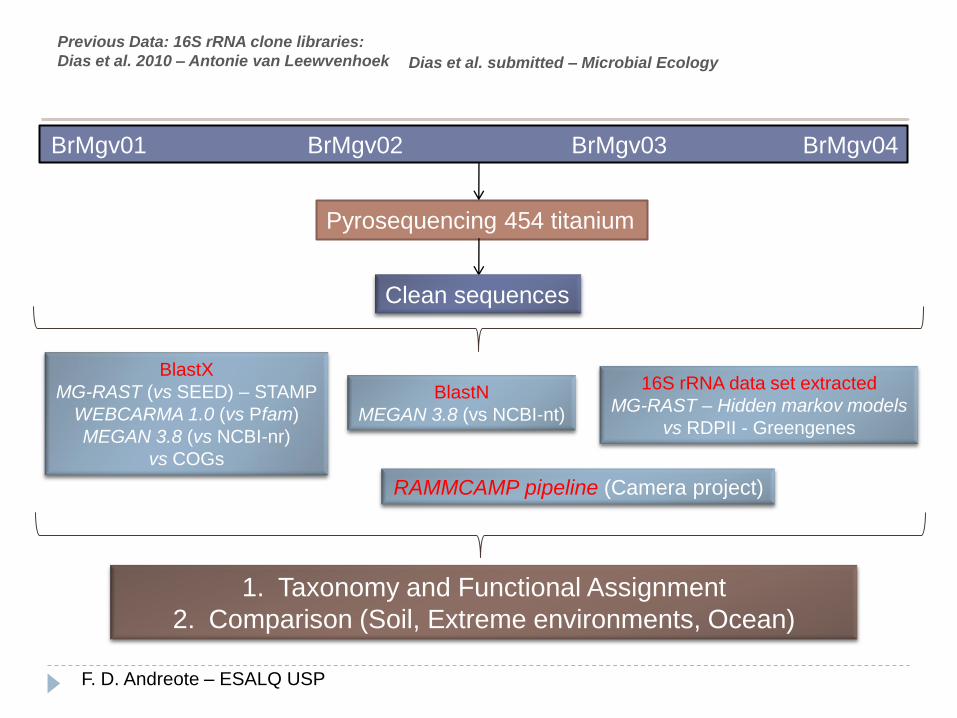
BrMgv01 BrMgv02 BrMgv03 BrMgv04
Pyrosequencing 454 titanium
Clean sequences
BlastX
MG-RAST (vs SEED) – STAMP
WEBCARMA 1.0 (vs Pfam)
MEGAN 3.8 (vs NCBI-nr)
vs COGs
BlastN
MEGAN 3.8 (vs NCBI-nt)
16S rRNA data set extracted
MG-RAST – Hidden markov models
vs RDPII - Greengenes
1. Taxonomy and Functional Assignment
2. Comparison (Soil, Extreme environments, Ocean)
RAMMCAMP pipeline (Camera project)
F. D. Andreote – ESALQ USP
Previous Data: 16S rRNA clone libraries:
Dias et al. 2010 – Antonie van Leewvenhoek Dias et al. submitted – Microbial Ecology
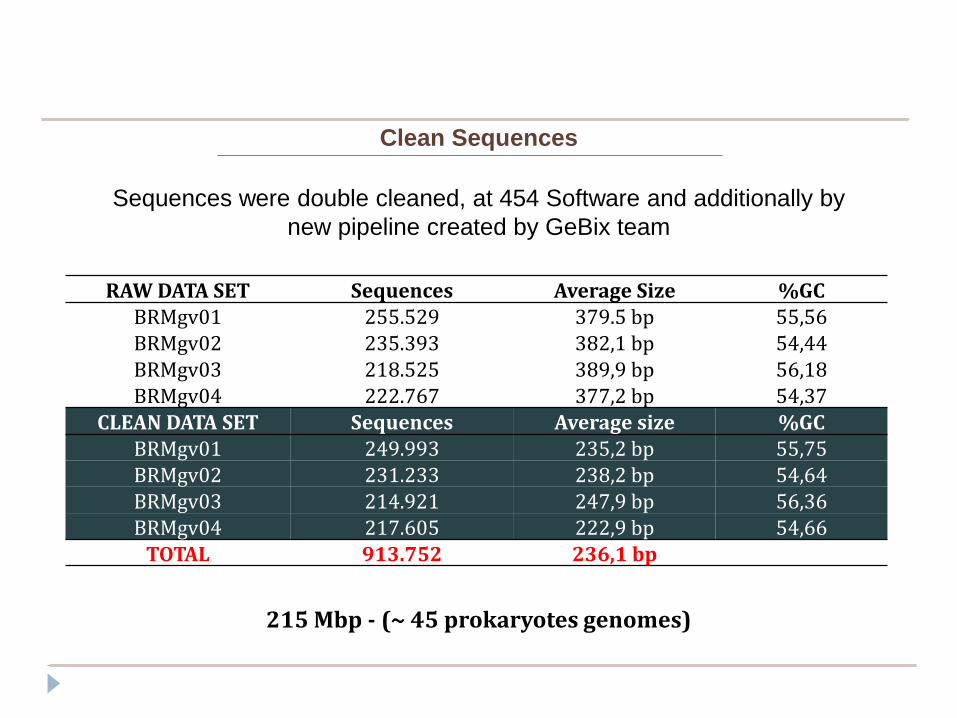
Clean Sequences
Sequences were double cleaned, at 454 Software and additionally by
new pipeline created by GeBix team
RAW DATA SET Sequences Average Size %GCBRMgv01 255.529 379.5 bp 55,56BRMgv02 235.393 382,1 bp 54,44BRMgv03 218.525 389,9 bp 56,18BRMgv04 222.767 377,2 bp 54,37
CLEAN DATA SET Sequences Average size %GC BRMgv01 249.993 235,2 bp 55,75BRMgv02 231.233 238,2 bp 54,64BRMgv03 214.921 247,9 bp 56,36BRMgv04 217.605 222,9 bp 54,66
TOTAL 913.752 236,1 bp
215 Mbp - (~ 45 prokaryotes genomes)

Metagenomes comparisons -Tags affiliation at MG-RAST
Metagenome MG-RAST code Sequences Average MethodologyTaxonomy
classified sequencesEvalue cutoff (1e-10)
Tropical Forest Soil (DeAngelis et al. 2010)
4446153.3 780.588 412 bp 454 50.8%
Cultivated Soil(Tringe et al. 2005)
4441091.3 138.347 1116 bp shotgun 66.21%
High Andean Forest Soil(GeBiX 2010)
4445417.3 618.540 310 bp 454 43.7%
Hot Spring(GeBiX 2010)
4449206.3 270.789 190 bp 454 10.11%
Acid Mine Drainge (Tyson et al. 2004)
4441137.3 180.713 1004 bp shotgun 80.24%
Atlantic Ocean (Rusch et al. 2007)
4441572.3 317.180 1012 bp shotgun 82.43%
Pacific Ocean (Rusch et al. 2007)
4441587.3 257.581 1092 bp shotgun 82.52%
Mangrove Surface (Rusch et al. 2007)
4441598.3 148.018 1036 bp shotgun 75.73%
BRAZILIAN MANGROVE (BrMgv01) 4451033.3 248,979 235 bp 454 32.51%
BRAZILIAN MANGROVE (BrMgv02) 4451034.3 230.051 238 bp 454 30.41%
BRAZILIAN MANGROVE (BrMgv03) 4451035.3 210.570 249 bp 454 33.05%
BRAZILIAN MANGROVE (BrMgv04) 4441036.3 215.921 223 bp 454 27.13%
evalue cutoff (1e-10)
F. D. Andreote – ESALQ USP

0% 20% 40% 60% 80% 100%
Gammaproteobacteria Deltaproteobacteria
Betaproteobacteria Alphaproteobacteria
Epsilonproteobacteria unclassified_"Proteobacteria"
16S rDNA Affiliation at Classifier vs RDP II – 396 sequences
BrMgv01
BrMgv02
BrMgv03
BrMgv04
0%
10%
20%
30%
40%
50%
60%
70%
80%
90%
100%
Crenarchaeota
WS3
Nitrospira
Fusobacteria
Firmicutes
Planctomycetes
Acidobacteria
Chloroflexi
Verrucomicrobia
OD1
Actinobacteria
Euryarchaeota
Bacteroidetes
Proteobacteria
unclassified
Rep
rese
nta
tio
n o
f p
hylo
ge
ne
tics g
roup
s (
%)
Representation of phylogenetics groups (%)
F. D. Andreote – ESALQ USP

Metagenomes comparisons -Tags affiliation at MG-RAST
F. D. Andreote – ESALQ USP

42.8
21.4
-0.8 0.8
-1.0
1.0
Eukaryota
Archaea
Alphaproteobacteria
BetaproteobacteriaGamaproteobacteria
delta/epsilon
Chlorobi
Cyanobacteria
Thermotogae
Actinobacteria
Chlamydiae/Verrucomicrobia
Planctomycetes
Spirochaetes
Chloroflexi
Synergistetes
Firmicutes
Fibrobacteres/
Acidobacteria
Deinococcus
Bacteroidetes
others
Hot Spring
AndeanForest
TropicalForest
BrazilianMangroves
EquatorianMangrove
Pacific
Sargasso Sea
BACTERIAL GROUPS
SAMPLES
Terrestrial
Marine
Aquatic
Mangrove
Metagenomes comparisons – Correspondence analysis
The interface sea-land is
also represented at
metagenomic level
F. D. Andreote – ESALQ USP

| Pirosequencing - Cananéia Tsai, S. M. and L.W. Mendes – CENA USP

STABLE ISOTOPE PROBING / SIP - DNA
Who are the active members of methanotrophic bacteria
in mangrove?(unculture)

O Ciclo do Metano
Thauer et al., 2008

Activecontrol
Methanotrophic bacteria – rRNA 16S
SIP-DNA

Proteobacteria

Distinct mangroves seems to have similar functional microbial community structure
The mangroves harbor a vast set of yet unknown genes
Comparing to other environments, mangroves are an ecotone area from sea to land
SIP-DNA allowed identification of active methanotrophic bacteria in sediments
It must be compared the phylogeny of genes described in each of mangrove
assessed
The metatranscriptome or metaproteome could add information on differential
mangroves functioning
We know that…
Still to be explored…

19
III. Application of microbial biogeography and biodiversity
approaches to the Amazon Rainforest

Land use change in the Amazon
can alter microbial biodiversity
(from Borneman&Triplett 1997)
ForestPasture} }
(from da C Jesus et al. 2009)

The Amazon Rainforest Microbial
Observatory (ARMO)
ARMO

A mosaic of land use types
ForestSecondary
Forest
Establish
ed
Pasture
Old
Pasture
New
Pasture
Amazon Land Use
Chronosequence

Forest Sites
Primary Secondary
Pasture Sites
✚✚
★
Established★1911✚19721987
2004
✚
5 km
Pasture Sites
✚✚
Established
✚19721987
✚
Sampling Design
100 m
10 m
1 m
0.1 m0.01 m
* *
*
*
*
*
*
*
*
**
* *

Bacterial Biodiversity Analysis
DNA extraction from multiple 0.5g
samples of homogenized soil cores.
PCR amplification of the V4 region of
bacterial 16S rDNA.
Pyrosequencing of amplicons
(~10,000 sequences per sample).
Taxonomic units defined as 95%
sequence similarity groups.

Predictions: Diversity
1. Loss of spatial structure
(biotic “randomization”).
Distance
Community
Similarity
Forest Pasture
Average
Community
Similarity
Diversity
2. Higher community similarity (biotic “homogenization”).
3. Lower diversity (both taxonomic and phylogenetic).

Primary P2004 P1987 P1972 P1911 Secondary
Soren
sen s
imila
rity
0.00
0.05
0.10
0.15
0.20
0.25
0.30
a
bc
cdde
e
F5,363 = 87.8
p < 0.001
Land use change does not
“homogenize” microbial
communitiesC
om
mu
nit
y S
imila
rity
Fores
t
Secondar
y
Forest
Establishe
d PastureOld
Pasture
New
Pasture
Amazon Land Use
Chronosequence

Primary P2004 P1987 P1972 P1911Secondary
Mean
OTU
richn
ess
0
100
200
300
400
500
600
F5,49
= 7.43
p < 0.001
a ab a
cbc
a
No
. of
un
iqu
e t
axa
pe
r co
re
Fores
t
Secondar
y
Forest
Establishe
d PastureOld
Pasture
New
Pasture
Amazon Land Use
Chronosequence
Land use change does not
significantly reduce the number of
taxa

Primary P2004 P1987 P1972 P1911Secondary
Faith
's PD
0
10
20
30
40
50
60
70
F5,49
= 10.79
p < 0.001
a
ab
cbc
a
ab
Land use change does not
significantly reduce phylogenetic
diversityFa
ith
’s P
D p
er
core
Fores
t
Secondar
y
Forest
Establishe
d PastureOld
Pasture
New
Pasture
Amazon Land Use
Chronosequence

Predictions: Community
Composition
1. Land use change alters
microbial community
composition.
Primary Forest
Pasture
++
++
+
xxx
x
x
x
Axis
1
Axis
2
Old Pasture
Secondary Forest++
++
+
xxx
x
x
x
++ +
+
Primary Forest
Axis
1
Axis 2
3. Pasture abandonment restores microbial community composition.
2. Community composition
varies with time since
conversion.
Primary Forest
Old Pasture
++
++
+
xxx
x
x
x
Axis
1
Axis
2
xxx
x
x
x New Pasture

Next steps: does land use change alter
microbial traits?
•Phylogenetic patterns
•Functional target genes
•Metagenome content

The ARMO TeamUniversity of Sao Paulo
Vivian Pellizari
Brigitte Feigl
Siu Mui Tsai
Wagner Piccinini
Fabiana Paula da Silva
Simone Tessaro
University of
Massachusetts
Klaus Nuesslein
. Kyung-Hwa Baek
George Hamaoui
University of Texas,
Arlington
Jorge Rodrigues
Babur Mirza
Michigan State University
JamesTiedje
Ederson da C. Jesus
University of Oregon
Brendan Bohannan
Rebecca Mueller
Fazenda Nova Vida
Ricardo Arantes
Sidney Rodrigues


Introduction Target AreaPrevious
KnowledgeMetagenomics
Data Conclusions
Clean Sequences
Sequences were double cleaned, at 454 Software and additionally by
new pipeline created by GeBix team
RAW DATA SET Sequences Average Size %GCBRMgv01 255.529 379.5 bp 55,56BRMgv02 235.393 382,1 bp 54,44BRMgv03 218.525 389,9 bp 56,18BRMgv04 222.767 377,2 bp 54,37
CLEAN DATA SET Sequences Average size %GC BRMgv01 249.993 235,2 bp 55,75BRMgv02 231.233 238,2 bp 54,64BRMgv03 214.921 247,9 bp 56,36BRMgv04 217.605 222,9 bp 54,66
TOTAL 913.752 236,1 bp
215 Mbp - (~ 45 prokaryotes genomes)

Introduction Target AreaPrevious
KnowledgeMetagenomics
Data Conclusions
Functional Mangroves Comparisons by STAMP (BlastX vs SEED-nr )
BrMgv01 vs BrMgv02
BrMgv02 vs BrMgv03
BrMgv01 vs BrMgv03
BrMgv02 vs BrMgv04
BrMgv01 vs BrMgv04
BrMgv03 vs BrMgv04

A - RNA processing and modification
B - Chromatin structure and dynamics
C - Energy production and conversion
D - Cell cycle control, cell division, chromosome partitioning
E - Amino acid transport and metabolism
F - Nucleotide transport and metabolism
G - Carbohydrate transport and metabolism
H - Coenzyme transport and metabolism
I - Lipid transport and metabolism
J - Translation, ribosomal structure and biogenesis
K - Transcription
L - Replication, recombination and repair
M - Cell wall/membrane/envelope biogenesis
N - Cell motilityO - Posttranslational modification, protein turnover, chaperones
P - Inorganic ion transport and metabolismQ - Secondary metabolites biosynthesis, transport and catabolism
R - General function prediction only
S - Function unknown
T - Signal transduction mechanisms
U - Intracellular trafficking, secretion, and vesicular transportV - Defense mechanisms
W - Extracellular structures
Y - Nuclear structure
Z - Cytoskeleton
Introduction Target AreaPrevious
KnowledgeMetagenomics
Data Conclusions
Tags affiliation at COGs (BlastX)

Introduction Target AreaPrevious
KnowledgeMetagenomics
Data Conclusions
Mangroves Comparisons by STAMP – BrMgv01 vs BrMgv02

Sediment
Biblioteca de clones
pmoA (A189F/mb661R)
16S rRNA (27F/1401R)
DNA+CsTF
A
Ultracentrifugaç
ãoFracionamento e
quantificação do
DNA
PCR e biblioteca
RNAr 16S
Gradiente
de
Densidade
12C/ 13C
Extração de DNA (t1 e
t2)
Microcosmos
Sediment and 40mL
NMS
5g 5g5g 5g Metano 8%
Alimentações com CH4 marcado
ou não
Consumo CH4 (GC-FID)
t1 t2
Bactérias Metanotróficas - Bertioga

T1
active
control
Bactérias Metanotróficas – SIP
T2

-0.4 -0.2 0.0 0.2 0.4 0.6
-0.4
-0.2
0.0
0.2
0.4
Primary
Secondary
Pasture1911
Pasture1972
Pasture1987
Pasture2004
R= 0.494p < 0.001
Forest communities are different
from pasture
Pasture
Forest
ANOSIM
Forest v. pasture
R = 0.530
P < 0.001

-0.4 -0.2 0.0 0.2 0.4 0.6
-0.4
-0.2
0.0
0.2
0.4
Primary
Secondary
Pasture1911
Pasture1972
Pasture1987
Pasture2004
R= 0.494p < 0.001
Pasture composition varies with
time
Pasture
Forest
P2004P1987
P1972P1911
ANOSIM
Pasture over time
R = 0.513
P < 0.001

-0.4 -0.2 0.0 0.2 0.4 0.6
-0.4
-0.2
0.0
0.2
0.4
Primary
Secondary
Pasture1911
Pasture1972
Pasture1987
Pasture2004
R= 0.494p < 0.001
Abandonment “restores”
composition
Pasture
ForestPrimary
Secondary
P2004P1987
P1972P1911

Primary P2004 P1987 P1972 P1911 Secondary
Relat
ive ab
unda
nce
0
20
40
60
80
100
Who is causing these differences?P
roport
ion o
f Tota
l O
TU
s
Planctomycete
s
Firmicutes
Actinobacteria
Proteobacteria
Acidobacteria
