metabolic implications of the lifewave x39 patch melinda h ... · which are released during injury...
TRANSCRIPT

Metabolic implications
of the
Lifewave X39 Patch
Melinda H. Connor, D.D., Ph.D., AMP, FAM
Caitlin A. Connor, MAcOM, DAOM
Naran Gombosuren, Ph.D.
Jens Eickhoff, Ph.D.
Introduction
This study explores the metabolic implications and physiologic results of wearing
the Lifewave X39 patch over the period of one week. Measures were taken at baseline,
24 hours and at 7 days of wearing the patch. A sample of convenience of 15 subjects
made up of both men and women aged 40-65 were selected to participate in this study.
Background
The Lifewave X39 patch focuses on stimulating the copper tripeptide GHK- Cu.
“Copper tripeptide-1(GHK-Cu) is a small protein composed of the three amino acids
(protein building blocks) glycine, histidine, and lysine combined in a specific geometric
configuration with the physiologically beneficial mineral (copper)” (DeHaven, C., 2014).
This tripeptide was first isolated from human plasma albumin in 1973 by Dr. Loren
Pickart. Pickart, noticed differences in the levels of fibrinogen based on age. He
additionally noticed that these differences stopped when the older liver cells were
incubated in blood from younger individuals. “In 1977, David Schlesinger of the Harvard
University Chemistry Department confirmed that the growth modulating peptide isolated
by Pickart was a glycyl-L-histidyl-L-lysine peptide.” It is interesting to note that this
peptide has also been found in saliva, urine, and collagen. Additional research has
established the strong affinity the GHK peptide has for copper, and exists in two forms,

as this was not covered in the initial experiment. These two forms are GHK and GHK-
Cu. It is also important to mention that none of the research around GHK has ever found
it to cause an issue. (DeHaven, C., 2014)
The “copper tripeptide-1 belongs to a group of emergency response molecules
which are released during injury and come to the body’s aid...” (DeHaven, C., 2014) It is
naturally released by the body when there is any type of injury to tissue. Research has
identified that the peptide is used to signal the beginning of the natural repair process.
This benefit has specifically been documented through research for post-laser or surgical
wounds, ischemic, burns, skin or hair transplants, and diabetic ulcers. “Diabetic wounds
healed three times faster in the presence of Copper tripeptide-1. Time to re-
epithelialization is shortened.” (DeHaven, C., 2014) The “copper tripeptide-1 has been
suggested to have a potential therapeutic role in age-related neurodegeneration and
cognitive decline. It improves axon survival and maintenance of nerves.” (DeHaven, C.,
2014)
The tripeptide has also been demonstrated to improve tissue remodeling. “It
increases keratinocyte proliferation and normal collagen synthesis, improves skin
thickness, skin elasticity and firmness, improves wrinkles, photodamage and uneven
pigmentation, improves skin clarity, and tightens protective barrier proteins.” (DeHaven,
C., 2014) This has an impact on both scars and other effects of damage to the skin, and
natural aging processes. The effects of tissue remodeling also appear to have an impact
on cancerous cells. “The fact that GHK was able to suppress 70% of genes involved in
the development of an aggressive metastatic form of colon cancer indicates that GHK is
capable of the regulation of various biochemical pathways on a gene level and it seems to

be resetting the gene activity back to health, which leads to the improvement of tissue
repair.” (Pickart, L., 2015)
GHK-Cu also has a demonstrated impact on other organs in the body after they
have been damaged. “A collaborative study conducted by scientists from Boston
University, University of Groningen, University of British Columbia, and University of
Pennsylvania established that the GHK peptide reverses the gene expression signature of
COPD, which is manifested by emphysema, inflammation, lung tissue destruction, and
significant reduction of lung capacity.” (Pickart, L., 2015) It is also important to note
that “…the level of GHK is about 200 ng/mL(10−7M) at age 20, but declines to 80
ng/mL by age 60.” (Pickart, L., 2015) This likely explains the increasing effects of aging.
It would also suggest that increased levels over time of GHK-Cu would have a positive
effect on both life expectancy and aging.
Non-transdermal Patch
All X39 patches are sealed so that none of the substances in the patch actually
penetrate the skin. This allows for consistent patch promotion of the light flow
throughout the time the patch is worn. In this study the initial baseline readings were
taken, and then the X39 patch was applied. The participant will be asked to wear the
patch 12 hours each day. The participant removed the patch at night and a fresh patch
was applied each morning prior to 8 am. The patch was worn for a minimum of 1 hour
before the additional data measures were taken. Patches were worn for a total of 7 days.
Data taking with the patch applied was done on day one, day two and day seven.

Phototherapy
Phototherapy has been defined as “the use of ultraviolet (UV) light for its healing
effects.” (Kakimoto, C., 2017) Supported by normal electro-dermal skin conductance
(Becker, (1985), Flick, (2004)), the human body gives off a number of materials
biochemically including particulate release, gas emission, ultraviolet light, near infrared
light, and visible spectrum light. The Lifewave patches have been specifically developed
to reflect this light back onto the skin where the patch has been placed. This then
stimulates the area of skin, producing improved physiological effects. Variations on
phototherapy have been used for at least 100 years. In that time there has been little
evidence of negative side effects. There is a theoretical concern about an increase in
cancer rates, but “there was no significant association found with basal cell carcinoma,
squamous cell carcinoma or melanoma.” (Kakimoto, C., 2017) This suggests that this is a
relatively untapped option for healing with relatively few risks.
Meridian Implications and Patch placement
The Lifewave patches are placed on specific meridian points to maximize
effectiveness. The theory of balancing the body based on the Chinese meridian system is
over 3000 years old. Current information now maps the meridian system to parts of the
lymphatic system. The concept of the release of “Qi” on an area of the lymphatic system
is consistent with the evidence that the body has a variety of electrical-dermal potentials
across its surface (Becker & Selden, 1985, Flick, 2004) and that acupuncture points are
(at least in part) strategic conductors of electromagnetic signals (Feinstein, 2010).
There are two options for patch placement which have been defined for the X39
patch. The first is a point on the back, also known as GV14, Du-14, or Tao Dao, which

may create a few relevant effects. It is a meeting point of the Governing vessel with all of
the Yang meridians. It is also the Point of the Sea of Qi. All of these mean that point
would have a direct impact on the Yang meridians of the body, and both generally Qi and
Yang in the body. It specifically expels wind and firms the exterior, which will help
prevent illness and reduce shaking. It also clears heat, which would include inflammation
and redness, which is a common sign of tissue damage. It also works specifically on
malaria, as well as building any bodily substance that is depleted and pacifies wind.
(Deadman, P., 2001)
The second is a point on the lower abdomen, also known as CV-6, Ren 6, or Qi
Hai. This point works in a slightly different direction. It fosters Original Qi, builds Qi
overall, supports the Kidneys and fortifies Yang, rescues collapsed Yang, regulates Qi,
and harmonizes blood. This means that it helps congenital problems or the general effects
of aging. It also helps with genital issues, such as impotence, prolapse of the uterus, and
infertility. It also helps with pain or masses in the abdomen. Between these two points
most, if not all, of the previously noted impacts of the X39 patch are supported.
(Deadman, P., 2001)
This study focused on the metabolic impact of patch usage, with half the
participants using the CV6 point and half using the GV14 point.
Metabolic Suite
For the purposes of this study the Sabre Sciences HPA2 metabolic suite has been
selected. The HPA 2 Profile includes both urine and saliva collection. The urine
evaluates: 5-HTP, Serotonin, Dopamine, Epinephrine, Norepinephrine, GABA,
Glutamate, Histamine, L-DOPA, Normetanephrine, Metanephrine, and 3-

Methoxytyramine. The saliva evaluates: Cortisol and DHEA. Several additional measures
have been added to the HPA2 suite, Glutathione, and a cysteine to cystine ratio will also
be tested using the urine sample. Three measures will be taken: baseline, 24 hours and
7days. (Sabre Sciences Laboratory, http://www.sabresciences.com/):
Metabolic testing consisted of one 10am urine taken at baseline/day one, day two
and day seven. Saliva Testing consisted of a six swabs taken in one day at baseline/day
one, day two and seven. Subjects self-administered the swab under the supervision of Dr.
Connor when in the laboratory, which was then placed back in the shipping container and
labeled with the subject number. Samples were kept in the freezer at -20F and were
shipped with ice by UPS to the Sabre Science lab in Carlsbad, CA on a daily basis.
Physiology Suite
All study participants had the following physiological testing done at base line, 24
hours and 7 days: Six minute recordings of EKG, pulse, respiration, heart rate variability
(HRV), temp, blood volume pulse, galvanic skin response, and 2 EMG (muscle) leads
(one on each shoulder area). At baseline testing, participants were checked for any
allergic reactions to the adhesive patches. Allergic reactions to physiological test patches
happen at a rate of 1:100,000 and if an allergic reaction was discovered participants
would be referred to the local urgent care for treatment and then dropped from the study.
No participants in this study had an adverse event of any type. Fresh adhesive patches
were used for each person tested. Adhesive patches are disposed of in bio hazard
containers after use.

Questionnaires
A series of questionnaires were administered to support the metabolic findings.
Marlowe Crowne
The Marlowe Crowne is a 13 Item true/false short form that is a measure of
subjects’ tendencies to give answers that they may perceive are desired by the interviewer
and/or reflect perceived positive social norms. This variable can produce inaccurate or
misleading findings unless properly controlled for in statistical analysis. Estimated
completion time 2 minutes. This instrument was normed by Reynolds in 1982.
McGill Pain Scale
This scale is comprised of three sections regarding a subject’s pain. Section
number one asks, “What Does Your Pain Feel Like?” and then lists 20 descriptive
categories that are numerically rated as 1 – 5. Section number two asks, “How Does Your
Pain Change with Time?” The first question asks the subject to describe the pattern of
their pain; and this is followed by 22 descriptive terms regarding their effects on
increasing or decreasing pain. The third section reflects upon the strength of the pain and
has six questions that give a context and comparison to the current pain compared to
other types of pain suffered in the past. Again this section is ranked numerically 1-5, with
one being mild and five being excruciating. (Melzack, R., 1975)
Pittsburg Sleep Quality Index
This scale is comprised of a mix of quantitative questions and five likert scale
questions 0-3. It explores the type and quality of sleep experienced by an individual over
the past month. It was normed by Cole et al. (2006).

Arizona Integrative Outcome Scale, Visual Analogue Scale (AIOS-VAS)
for Vitality
The AIOS- VAS rates subject’s “overall sense of well-being and vitality” over the
past 24 hours, using a 100mm one-line visual analogue scale. This instrument was
normed by Bell in 2004.
Profile of Mood States (POMS)
The POMS is a 37-item 5 factor scale which is a basic measure of affective state
in several dimensions including vigor, mood, anxiety and depression. 8 minutes
maximum completion time. It was normed by McNair et al., 1971/1981; Shacham, 1983.
WAS III
A subsection of the WAS III will be used to determine level of short and long
term memory and if there is an improvement in memory from baseline to 7 days.
Statistical Analysis
Data from questionnaires were collected on standard answer sheets and scored. Then the
data points were entered into an excel spread sheet for statistical evaluation. Standardized tests
were scored and reviewed for data trends and significant results. All questionnaires parameters
were summarized in terms of means and standard deviation, stratified by assessment time point.
Changes between assessment time points were evaluated using a paired t-test or nonparametric
Wilcoxon Signed Rank test. All physiology parameters were summarized in terms of means and
standard deviation, stratified and across the 6 study epochs. Changes from pre-to post patch
administration were evaluated using a paired t-test. Normal probability plots were examined to
verify the distribution assumptions. All reported P-values are two-sided and P<0.05 was used to
define statistical significance. All metabolic parameters were summarized in terms of means and

standard deviation, stratified by assessment time point. Changes from day 1 (pre-patch) to day 2,
day 2 to day 7, and day 1 to day 7 were evaluated using a paired t-test or nonparametric
Wilcoxon Signed Rank test. Cortisol levels were obtained at 8am, 12pm, 4pm, 8pm and 12am.
DHEAS levels were collected at 8am, 8pm and 12am. The area under the curve (AUC) for
Cortisol and DHEAS levels over the data collection periods were calculated using the trapezoid
rule. AUC levels were summarized in terms of means and standard deviations, stratified by
assessment time point. Changes between assessment time points were evaluated using a paired t-
test or Wilcoxon signed rank test.
Results
The complete data results of the testing are found in Appendix A. Significant
results of the Lifewave X39 patch testing are as follows:
Table 1: Demographics (N=15)
N (%)
Gender
Female
Male
10 (67%)
5 (33%)
Age (yrs), means ±
SD
61.9 ± 9.3
A sample of convenience of individuals who responded to locally placed flyers
consisted of 15 individuals. There were five men and 10 women in the study which had a
mean age of 61.9 ± 9.3 years.
Questionnaire Outcomes
• Marlowe-Crowne
• AIOS-VAS
• WAIS III
• Profile of Mood States (POMS)
• Modified Pittsburg Sleep Quality Index
• McGill Pain Instrument

Table 2: Summary of Marlowe-Crowne instrument scores, stratified by day
Day N Mean SD
1 15 16.0 2.1
7 15 15.5 2.4
Table 3: Changes in Marlowe-Crowne instrument scores from day 1 to day 7
Mean Change SD p-value
Change from day 1 to day 7 -0.47 0.2 0.4614
The Marlowe-Crowne looks at social desirability. It is used to measure the
reliability of the data. One common confounding variable in research is research subjects
telling the researchers the answers they think the researchers want. The middle range that
is being shown here suggests that this was not an issue with this particular group. It is
also interesting that this group had a non-significant negative mean change, indicating
that the responders became more honest.
Table 4: Summary of AIOS-VAS instrument scores, stratified by assessment time point
Time N Mean SD
Consent 15 62.7 22.8
1.2 14 67.1 22.8
2 14 71.1 27.3
6 15 78.0 23.1
Table 5: Changes in AIOS-VAS instrument scores from Consent to 1.2, Consent to day 2, and Consent to day 7 assessments
Mean Change SD p-value
Change from 1.1 to 2 7.6 15.3 0.0877
Change from 1.1 to 7 15.3 20.6 0.0151
The AIOS-VAS looks at the overall wellness of an individual. In this case there
was a clear, though not quite significant shift established by the second day of testing. It
had increased to significance by day 7 showing clear overall improvement in the feelings
of vitality and wellness.

Table 6: Summary of WAISIII instrument scores, stratified by assessment time point
Time Outcome N Mean SD
Day 1 # Short
# Mid
# Long
15
15
15
6.2
5.3
5.1
1.9
2.3
2.3
Day 7 # Short
# Mid
# Long
15
15
15
7.3
6.1
6.1
2.3
2.9
3.1
Table7: Changes in WAISIII instrument scores from day 1 to day 7
Outcome Mean Change SD p-value
Change from Day 1 to Day 7 # Short
# Mid
# Long
1.1
0.8
1.1
2.4
2.9
3.2
0.0872
0.3008
0.2170
Memory is a common issue for people above age 45. The WAIS III is a well
established intelligence test which includes a standard memory test. There was a clear,
though not significant, improvement in short term memory by day 7. It is likely that this
would get more significant with a larger group of people and a longer intervention period.
It is also interesting that there was improvement in both mid and long term memory as
well, though to a much lower degree. Further research should be done in this specific area
as a non-invasive support to memory as one ages has the potential to be of benefit to
many individuals.
Table8: Summary of modified PSQI instrument total scores, stratified by assessment time point
Time N Mean SD
Day 1 11 6.7 2.8
Day 2 11 5.2 2.7
Day 7 7 4.6 2.9
Table 9: Changes in modified PSQI instrument scores from day 1 to day 2 and from day 1 to day 7
Mean Change SD p-value
Change from Day 1 to Day 2 -1.0 1.3 0.0676
Change from Day 1 to Day 7 -3.0 2.9 0.0522

The Pittsburg Sleep Quality Index was used to look at sleep, which is also a
common issue once people get past 45. This questionnaire showed an immediate strong
shift the first night, though it was not quite significant. The shift by day 7 was significant.
This is particularly important as sleep strongly effects everything else related to health
and wellbeing.
There were no significant changes in the Profile of Mood States and the McGill
Pain scores from the baseline (pre-patch) assessment to close of study.
Metabolic Outcomes Table 10: Change from day 1 (pre-patch) to day 2, day 2 to day 7, and day 1 (pre-patch) to day 7
Marker Change
Mean
Change SD p-value
Alanine Day 1 to Day 2 -20.17 36.89 0.0526
Cystine Day 2 to Day 7 -16.07 23.86 0.0206
Epinephrine Day 1 to Day 2 -2.09 3.08 0.0197
Epinephrine Day 2 to Day 7 1.59 2.94 0.0552
GABA Day 1 to Day 7 -0.73 1.50 0.0818
Glutathione Day 2 to Day 7 -3.82 6.73 0.0453
Glutathione Day 1 to Day 7 -5.82 10.37 0.0475
Glycine Day 1 to Day 2 -72.54 117.73 0.0317
HCys2 Day 1 to Day 2 0.35 0.55 0.0296
Histamine Day 1 to Day 2 -46.32 75.35 0.0320
Histamine Day 1 to Day 7 -46.64 49.35 0.0026
Histamine (free) Day 1 to Day 2 -9.24 20.20 0.0981
Hydroxylysine Day 1 to Day 7 -0.80 1.75 0.0992
Leucine Day 1 to Day 2 -4.84 7.84 0.0313
Normetanephrine Day 2 to Day 7 -13.06 23.32 0.0479
PEA
Phenylethylamine Day 1 to Day 7 -0.59 1.12 0.0589
Phenylalanine Day 2 to Day 7 6.33 10.94 0.0418
Tryptophan Day 2 to Day 7 -10.81 18.55 0.0406 Alpha-aminobutyric
acid Day 1 to Day 7 -8.90 13.79 0.0256 Alpha-aminobutyric
acid Day 2 to Day 7 -5.29 7.79 0.0198

Amino acids and neurotransmitters play a critical role in the health and wellbeing
of individuals. If an individual’s amino acid and neurotransmitter production is broken,
the individual cannot maintain body health for long. The number of statistically
significant changes demonstrated in this study shows the powerful impact which can be
created by the use of phototherapy products and the clear positive changes produced by
the application of this specific non-transdermal Lifewave product X-39. Key findings are
Glutamate and Histamine as they show a distinct anti-inflammatory trend produced by
the patch.
Of note the amino acids Glycine and Glutamate, which are used in the process to
form Glutathione in a transsulfuration pathway, both showed a drop off at a level of
significance. This is very important. Gluthione is part of the body system which supports
reduction of inflammation pathways in a unique aspect. It specifically acts from the liver
to detoxify the blood. So for example, it clears heavy metals from the body rather than
acting as an anti-inflammatory agent directly. A decrease in the materials that produce the
glutathione as the result of patch usage means that more glutathione is being made. This
results in higher availability of the glutathione in the blood and allows the body to clear
more damaging material faster. This supports the overall reduction in inflammation
which was demonstrated in the data results.
Physiology Outcomes
Table 11: Change from pre-patch to last-patch (day 7) of HF, LF/HF NN50, PNN50, Power, RMSSD, and VLF, stratified by Epoch (1-6)
Source Outcome Epoch
Mean
Change SD p-value
EKG SDNN 2 -42.89 82.71 0.06430
BVP HF 5 -1085.13 2038.55 0.05830
BVP NN50 1 -3.13 5.34 0.03950

BVP NN50 2 -2.13 4.12 0.06470
BVP NN50 3 -1.73 2.89 0.03580
BVP NN50 5 -2.73 3.03 0.00360
BVP PNN50 1 -0.05 0.08 0.03820
BVP PNN50 2 -0.03 0.07 0.06880
BVP PNN50 3 -0.03 0.04 0.04290
BVP PNN50 5 -0.04 0.04 0.00360
BVP RMSSD 5 -21.13 36.49 0.04160
BVP SDNN 5 -19.42 27.08 0.01480
BVP VLF 5 -382.47 426.65 0.00370
Table 12: Change from pre-patch to last-patch (day 7) of HF, LF/HF NN50, PNN50, Power, RMSSD, and VLF, across all 6 Epochs
Source Outcome
Mean
Change SD
p-
value
EKG HF -1115.01 28492.47 0.7113
EKG LF 14424.43 104293.22 0.1929
EKG LF/HF 0.28 1.31 0.0487
BVP HF -786.72 3852.92 0.0559
BVP LF 205.48 4414.61 0.6599
BVP LF/HF -0.08 5.93 0.9004
BVP NN50 -1.96 3.80 <.0001
BVP PNN50 -0.03 0.06 <.0001
BVP RMSSD -21.78 76.48 0.0083
BVP SDNN -18.60 63.27 0.0065
Table 13: Change from pre-patch to last-patch (day 7) of BVP-HR, EMG, Skin-Condition, Temperature and Respiratory Rate for Average, Mode, and Area, stratified by Epoch (1-6)
Source Outcome Epoch
Mean
Change SD
p-
value
BVPHR Average 2 4.51 7.83 0.0426
BVPHRMaxMin Average 5 -2.23 3.13 0.0153
BVPHRMaxMin Mode 1 -1.18 2.17 0.0533
BVPHRMaxMin Mode 2 -0.73 1.57 0.0917
EKGHRMaxMin Mode 6 -33.34 67.42 0.0871
RespRate Mode 1 1.92 4.03 0.0868

Table 14: Change from pre-patch to last-patch (day 7) of BVP-HR, EMG, Skin-Condition, Temperature and Respiratory Rate for Average, Mode, and Area, across all 6 Epochs
Source Outcome
Mean
Change SD p-value
BVPHR Average 2.54 8.31 0.0047
BVPHR Mode 2.31 9.60 0.0249
BVPHRMaxMin Average -1.67 5.50 0.0049
EMG Average -39.44 124.62 0.0035
EMG Mode -38.45 128.72 0.0057
EMG Area -2366.63 7477.30 0.0035
Reduction in blood pressure and improved muscle relaxation are consistent changes
which are present in the physiology data. Greater flexibility in HRV in the over age 60
population is an important finding.
Discussion
It is important to recognize that this was both a sample of convenience and a
short-term study with a small sample size. However, there are several areas that showed
significant change, as well as a few that showed a clear tendency to change, though not
quite to the level of significance. It should also be noted that the shift in sleep is
especially interesting given that the research subjects sleep was being interrupted every
four hours for the saliva testing on the days those questionnaires were administered. This
means that the results may have been stronger without the confounding variable. The lack
of shift in POM, which looks at overall mood, is also interesting. The patch itself was not
expected to shift the research subjects’ mood, but there was a possibility of it being a
secondary effect. Improved sleep and energy often improve people’s mood.
There are several key pieces of information in this data. The first is the
improvement in blood pressure. For a non-invasive process like photo-therapy in

comparison with the challenging side-effects caused by most blood pressure medications
and a more vulnerable population with those who are aging, further exploration of this
parameter should be a priority.
The second is the impact of the metabolic changes shown in amino acid
production. While amino acid production and metabolism changes on a daily basis and is
strongly impacted by what foods we eat and our daily activities, the data taken over
several days gives a snap-shot of change. Key findings are Glutathione and Histamine
results as they show a distinct anti-inflammatory trend produced by the patch. This is
further confirmed when looking at Glycine and Glutamate in combination. They are used
in the metabolic processes to form Glutathione through the transsulfuration pathway.
Since both showed a drop off at a level of significance it shows that they are being used
for the purpose of the production of Glutathione. This is very important. Gluthione is part
of the body system which supports reduction of inflammation pathways in a unique
aspect. It specifically acts from the liver to detoxify the blood.
In addition, the third finding shows that flexibility in the gut systems may be able
to be restored. As one ages there is often less flexibility in all the body systems.
Flexibility is key in human survival. We must be able to adapt moment to moment in
order to survive. This patch triggers change in the gut and what may be determined in
studies of longer duration to be restoring fitness and adaptability to change. It is
important to note as the fourth finding that changes were in most of the types of amino
acids and not limited to a single type of amino acid. We saw changes in essential, non-
essential, branched chain essential, aromatic and non- proteinogenic amino acids instead
of a single amino acid or area of amino acid production.

The fifth interesting finding is the almost as significant (0.08) improved short
term memory within a week. Memory loss in aging is a significant issue around the
world. Longer studies of larger size which explore the impact of this phototherapy
product should be explored.
Summary
This study explored the metabolic and physiologic aspects of the Lifewave X39
patch. In addition, questionnaires which were administered concurrently cover a range of
previously reported experiences with the X39 patches. These include quality of sleep
improvement, memory improvement, feelings of vitality, reduction of pain and
inflammation, and an overall sense of well-being. This study provides a short term
picture of the lived experience of participants who are wearing the Lifewave X39 patch.
The data results of improvement in blood pressure, 17 statistically significant
amino acid changes over the 7 days, significant improvement in anti-inflammatory
response, improvement in sleep levels, reduction in blood pressure, improvement in short
term memory, improvement in reported feelings of vitality and consistency in reporting
across the study suggest that further research with a larger sample size be done and
confirm the previously reported anecdotal responses in the testing of earlier subjects.
Since this study was done on an aging population it is also important to note that
the patch appears to support the movement back toward fitness of the gut system and
improved adaptability to change. The human body must live on the edge of chaos so that
it can adapt and respond to change moment to moment in order to survive. One of the
first areas of the body that shows a lack of adequate responsiveness to change as we age
is the gut. While this is only a one week period, the oscillatory effect shown in the data

over the three samples taken during that period on each subject, show improved response
promoting fitness and adaptability to change. If one can change in response to the
environment, one can survive longer. Combined with the anti-inflammatory response
shown in this data, there is a potential for impact on longevity. Further longitudinal
studies need to be undertaken to determine if these effects are maintained or improved
over time.
The Lifewave X39 patch shows clear, significant metabolic, blood pressure,
memory improvement, sleep and other changes over the course of one week which
should be explored over longer periods of time in future studies so that a better
understanding of the comprehensive nature and effects of the phototherapy produced by
this patch may be demonstrated.

References
Becker, R., Selden, G., “The Body Electric”, William Morrow Pub., New York, NY,
1985.
Bell, I., Cunningham, V., Caspi, O., Meek, P., Ferro, L., (2004) “Development and
validation of a new global well-being outcomes rating scale for integrative medicine
research.” BMC Complementary and Alternative Medicine. 2004; 4: 1.
Deadman, P., Al-Khafaji, M., Baker, K., (2001) A Manual of Acupuncture. Eastland
Press. 1240 Activity Dr., #D Vista, CA, 92083.
DeHaven, C., (2014) Copper Tripeptide-1. Science of Skincare.
Feinstein, D., “Rapid Treatment of PTSD: Why Psychological Exposure with Acupoint
Tapping May Be Effective”, Psychotherapy: Theory, Research, Practice, Training. 47(3),
385-402, 2010, American Psychological Association.
Flick, A. B., “Silver and Wound Healing”, CAM Research Symposium, Hershey Medical
School, Hershey PA, July 2004.
Geo Peptides Staff. (2015) What are Copper Peptides? Retrieved August 5, 2018.
https://www.geopeptides.com/copperpep.html
Kakimoto, C., (2017) What is phototherapy, and how does it work?
https://www.dermatologistoncall.com/blog/what-is-phototherapy-and-how-does-it-work/
Melzack R. (1975) The McGill Pain Questionnaire: Major properties and scoring
methods. Pain. 1: 277-299.
Pickart, L., Vasquez-Soltero, J., Margolina, A. (2015) GHK Peptide as a Natural
Modulator of Multiple Cellular Pathways in Skin Regeneration. Hindawi Publishing
Corporation BioMed Research International Volume 2015, Article ID 648108, 7 pages
http://dx.doi.org/10.1155/2015/648108.
Reynolds, W. (1982) Development of reliable and valid short forms of the Marlowe‐Crowne social desirability scale. Journal of Clinical Psychology. January 1982
https://doi.org/10.1002/1097-4679(198201)38:1<119::AID-JCLP2270380118>3.0.CO;2-
I
Appendix A: Complete Statistical Results
Statistical Analysis Report

GHK- CU Study – Questionnaire Data
Table 1: Demographics (N=15) ....................................................................................................... 20
Table 2: Summary of Marlowe-Crowne instrument scores, stratified by day ............................... 21
Table 3: Changes in Marlowe-Crowne instrument scores from day 1 to day 7 ............................ 21
Table 4: Summary of POMS instrument scores, stratified by assessment time point ................... 21
Table 5: Changes in POMS instrument scores from 1.1 to 1.2, 1.1 to 2, and 1.1 to 7 assessment
time points ..................................................................................................................................... 21
Table 6: Summary of AIOS-VAS instrument scores, stratified by assessment time point ............. 21
Table 7: Changes in AIOS-VAS instrument scores from Consent to 1.2, Consent to 2, and Consent
to 7 assessments ............................................................................................................................ 21
Table 8: Summary of WAISIII instrument scores, stratified by assessment time point ................. 22
Table 9: Changes in WAISIII instrument scores from day 1 to day 7 .............................................. 22
Table 10: Summary of PSQI instrument total scores, stratified by assessment time point ........... 22
Table 11: Changes in PSQI instrument scores from day 1 to day 7 ................................................ 22
Table 12: Summary of modified PSQI instrument total scores, stratified by assessment time
point ............................................................................................................................................... 22
Table 13: Changes in modified PSQI instrument scores from day 1 to day 2 and from day 1 to day
7 ...................................................................................................................................................... 22
Table 14: Summary of modified McGill total pain scores, stratified by assessment time point ... 22
Table 15: Changes in modified McGill total pain scores from day 1 to day 2 and from day 1 to
day 7 ............................................................................................................................................... 23
Study Design: Single arm study with 2 – 4 assessment time points.
Sample Size: N=15
Statistical Methods: All physiology suite parameters were summarized in terms of
means and standard deviation, stratified by assessment time point. Changes between
assessment time points were evaluated using a paired t-test or nonparametric Wilcoxon
Signed Rank test.
Questionnaire Outcomes
• Marlowe-Crowne
• AIOS-VAS
• WAIS III
• Profile of Mood States (POMS)
• Pittsburgh Sleep Quality Index (PSQI)
• Modified PSQI
• McGill Pain Instrument
Table 4: Demographics (N=15)
N (%)
Gender

Female
Male
10 (67%)
5 (33%)
Age (yrs), means ±
SD
61.9 ± 9.3
Table 5: Summary of Marlowe-Crowne instrument scores, stratified by day
Day N Mean SD
1 15 16.0 2.1
7 15 15.5 2.4
Table 6: Changes in Marlowe-Crowne instrument scores from day 1 to day 7
Mean Change SD p-value
Change from day 1 to day 7 -0.47 0.2 0.4614
Table 7: Summary of POMS instrument scores, stratified by assessment time point
Time N Mean SD
1.1 15 28.4 19.3
1.2 14 29.3 20.6
2 13 30.6 20.0
7 14 27.2 19.2
Table 8: Changes in POMS instrument scores from 1.1 to 1.2, 1.1 to 2, and 1.1 to 7 assessment time points
Mean Change SD p-value
Change from 1.1 to 1.2 4.4 11.2 0.1622
Change from 1.1 to 2 4.4 16.2 0.3490
Change from 1.1 to 7 1.2 19.2 0.8162
Table 9: Summary of AIOS-VAS instrument scores, stratified by assessment time point
Time N Mean SD
Consent 15 62.7 22.8
1.2 14 67.1 22.8
2 14 71.1 27.3
7 15 78.0 23.1
Table 10: Changes in AIOS-VAS instrument scores from Consent to 1.2, Consent to 2, and Consent to day 7 assessments
Mean Change SD p-value
Change from 1.1 to 1.2 2.6 12.8 0.3146

Change from 1.1 to 2 7.6 15.3 0.0877
Change from 1.1 to 7 15.3 20.6 0.0151
Table 11: Summary of WAISIII instrument scores, stratified by assessment time point
Time Outcome N Mean SD
Day 1 # Short
# Mid
# Long
15
15
15
6.2
5.3
5.1
1.9
2.3
2.3
Day 7 # Short
# Mid
# Long
15
15
15
7.3
6.1
6.1
2.3
2.9
3.1
Table 12: Changes in WAISIII instrument scores from day 1 to day 7
Outcome Mean Change SD p-value
Change from Day 1 to Day 7 # Short
# Mid
# Long
1.1
0.8
1.1
2.4
2.9
3.2
0.0872
0.3008
0.2170
Table 13: Summary of PSQI instrument total scores, stratified by assessment time point
Time N Mean SD
Day 1 14 6.3 2.8
Day 7 11 5.3 2.5
Table 14: Changes in PSQI instrument scores from day 1 to day 7
Mean Change SD p-value
Change from Day 1 to Day 7 -0.4 1.6 0.5152
Table 15: Summary of modified PSQI instrument total scores, stratified by assessment time point
Time N Mean SD
Day 1 11 6.7 2.8
Day 2 11 5.2 2.7
Day 7 7 4.6 2.9
Table 16: Changes in modified PSQI instrument scores from day 1 to day 2 and from day 1 to day 7
Mean Change SD p-value
Change from day 1 to day 2 -1.0 1.3 0.0676
Change from day 1 to day 7 -3.0 2.9 0.0522
Table 17: Summary of modified McGill total pain scores, stratified by assessment time point
Time N Mean SD
Day 1.1 15 6.2 6.7

Day 1.2 15 9.2 16.1
Day 2 15 5.9 9.8
Day 7 15 6.1 9.0
Table 18: Changes in modified McGill total pain scores from day 1 to day 2 and from day 1 to day 7
Mean Change SD p-value
Change from Day 1.1 to Day
1.2
3.0 16.9 0.8867
Change from Day 1.1 to Day
2
-0.3 9.5 0.7480
Change from Day 1.1 to Day
7
-0.1 7.7 0.6328
There are no changes in the McGill pain scores from the baseline (pre-patch) assessment.
GHK- CU Study – Physiology Suite Data
Table 1: Summary statistics for pre- vs. Last-patch (day 7) of HF, LF/HF NN50, PNN50, Power,
RMSSD, and VLF , stratified by Epoch (1-6) .................................................................................... 24
Table 2: Change from pre-patch to Last-patch (day 7) of HF, LF/HF NN50, PNN50, Power,
RMSSD, and VLF , stratified by Epoch (1-6) .................................................................................... 27
Table 3: Summary statistics for pre- vs. Last patch (day 7) of HF, LF/HF NN50, PNN50, Power,
RMSSD, and VLF , across all 6 Epochs ............................................................................................. 29
Table 4: Change from pre-patch to Last-patch (day 7) of HF, LF/HF NN50, PNN50, Power,
RMSSD, and VLF , across all 6 Epochs ............................................................................................. 30
Table 5: Summary statistics for pre- vs. Last patch (day 7) of BVP-HR, EMG, Skin-Condition,
Temperature and Respiratory Rate for all distribution characteristics outcomes, stratified by
Epoch (1-6) ..................................................................................................................................... 31
Table 6: Change from pre-patch to Last patch (day 7) of BVP-HR, EMG, Skin-Condition,
Temperature and Respiratory Rate for Average,Mode,and Area, stratified by Epoch (1-6) ......... 38
Table 7: Summary statistics for pre- vs. Last patch (day 7) of BVP-HR, EMG, Skin-Condition,
Temperature and Respiratory Rate for all distribution characteristics outcomes, across all 6
epochs ............................................................................................................................................ 41
Table 8: Change from pre-patch to Last patch (day 7) of BVP-HR, EMG, Skin-Condition,
Temperature and Respiratory Rate for Average, Mode,and Area, across all 6 Epochs ................. 42
Study Design: Pre-post study comparing physiology suite outcome measures before
patch vs. last (day 7) patch administration.
Sample Size: N=15

Statistical Methods: All physiology suite parameters were summarized in terms of
means and standard deviation, stratified and across the 6 study epochs. Changes from
pre-to post patch administration were evaluated using a paired t-test. Normal probability
plots were examined to verify the distribution assumptions. All reported P-values are
two-sided and P<0.05 was used to define statistical significance.
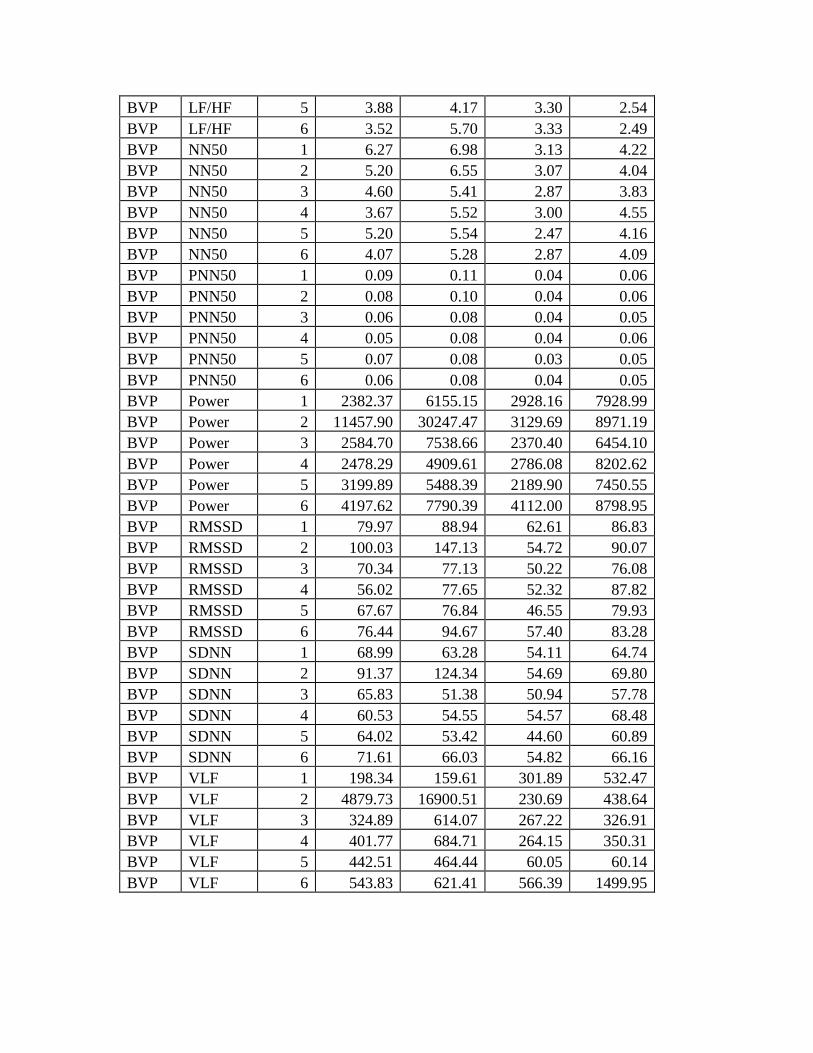
Table 19: Summary statistics for pre- vs. Last patch (day 7) of HF, LF/HF NN50, PNN50, Power, RMSSD, and VLF, stratified by Epoch (1-6)
Pre-Patch Last-Patch (Day 7)
Source Outcome Epoch Mean SD Mean SD
EKG HF 1 14818.66 9397.29 17973.25 27036.86
EKG HF 2 19618.35 13617.93 15433.62 16379.32
EKG HF 3 18536.86 14170.61 24555.99 37015.79
EKG HF 4 22390.90 16673.95 25806.19 21887.15
EKG HF 5 29227.28 18814.59 24136.17 20423.67
EKG HF 6 40386.93 25806.00 28767.37 22120.55
EKG LF 1 13122.89 14872.21 56825.53 186770.11
EKG LF 2 19743.73 32193.75 22908.82 49147.72
EKG LF 3 8202.70 6462.20 17442.07 33209.36
EKG LF 4 10094.09 10374.86 38185.46 103669.27
EKG LF 5 9950.67 8720.13 13949.08 22320.38
EKG LF 6 43733.30 91322.00 39360.51 88028.98
EKG LF/HF 1 0.81 0.61 1.31 1.57
EKG LF/HF 2 0.79 0.70 1.01 0.90
EKG LF/HF 3 0.52 0.38 0.62 0.28
EKG LF/HF 4 0.52 0.36 1.06 1.54
EKG LF/HF 5 0.32 0.14 0.47 0.37
EKG LF/HF 6 0.98 1.46 1.08 1.02
EKG NN50 1 43.07 5.18 41.20 6.66
EKG NN50 2 40.00 3.78 42.40 5.62
EKG NN50 3 39.73 4.95 39.60 5.96
EKG NN50 4 36.87 5.26 38.73 6.17
EKG NN50 5 36.27 4.73 38.27 4.51
EKG NN50 6 33.50 3.55 34.73 4.01
EKG PNN50 1 0.43 0.03 0.42 0.03
EKG PNN50 2 0.42 0.03 0.43 0.03
EKG PNN50 3 0.44 0.04 0.44 0.03
EKG PNN50 4 0.44 0.03 0.45 0.04
EKG PNN50 5 0.45 0.03 0.45 0.03

EKG PNN50 6 0.45 0.03 0.44 0.04
EKG Power 1 34860.17 32520.80 86493.20 248715.39
EKG Power 2 46274.43 55655.64 44593.55 74597.54
EKG Power 3 29563.30 19470.34 50064.10 89856.45
EKG Power 4 34334.22 26054.82 96776.73 225900.85
EKG Power 5 44102.87 30199.38 41466.28 43405.32
EKG Power 6 102250.40 144643.37 101064.63 209062.72
EKG RMSSD 1 437.24 133.90 461.26 271.09
EKG RMSSD 2 475.06 123.75 427.67 145.70
EKG RMSSD 3 510.85 157.72 528.37 234.82
EKG RMSSD 4 562.71 162.39 564.50 170.37
EKG RMSSD 5 619.63 144.43 555.78 167.73
EKG RMSSD 6 684.76 166.62 630.29 146.81
EKG SDNN 1 301.56 92.65 329.64 218.09
EKG SDNN 2 332.29 83.30 289.39 99.00
EKG SDNN 3 339.39 98.53 360.14 177.10
EKG SDNN 4 376.69 108.60 382.27 129.24
EKG SDNN 5 410.20 94.19 377.77 117.90
EKG SDNN 6 481.73 118.18 430.35 93.09
EKG VLF 1 6918.61 16050.31 11694.41 36194.08
EKG VLF 2 6912.34 12947.88 6251.11 13237.60
EKG VLF 3 2823.74 2898.34 8066.03 20471.14
EKG VLF 4 1849.23 1976.73 32785.09 109783.63
EKG VLF 5 4924.92 5852.22 3381.04 4844.60
EKG VLF 6 18130.17 44250.75 32936.76 103944.26
BVP HF 1 1597.97 5153.98 1478.97 4384.89
BVP HF 2 3709.23 7997.67 963.81 2638.35
BVP HF 3 1213.70 3841.98 817.30 2292.51
BVP HF 4 1191.28 3220.91 1731.82 5853.33
BVP HF 5 1788.10 4174.04 702.97 2473.38
BVP HF 6 2699.85 6288.95 1622.39 3902.76
BVP LF 1 586.06 1059.94 1147.30 3098.88
BVP LF 2 2868.95 6006.49 1935.19 6356.28
BVP LF 3 1046.10 3120.94 1285.88 3993.02
BVP LF 4 885.25 1525.61 790.12 2046.57
BVP LF 5 969.28 1348.37 1426.88 4933.93
BVP LF 6 953.94 1637.05 1923.23 4178.71
BVP LF/HF 1 1.93 2.34 2.74 2.83
BVP LF/HF 2 4.50 8.23 4.21 3.17
BVP LF/HF 3 3.37 3.92 4.08 4.33
BVP LF/HF 4 5.20 6.14 4.15 4.06
BVP LF/HF 5 3.88 4.17 3.30 2.54
BVP LF/HF 6 3.52 5.70 3.33 2.49
BVP NN50 1 6.27 6.98 3.13 4.22
BVP NN50 2 5.20 6.55 3.07 4.04
BVP NN50 3 4.60 5.41 2.87 3.83
BVP NN50 4 3.67 5.52 3.00 4.55
BVP NN50 5 5.20 5.54 2.47 4.16
BVP NN50 6 4.07 5.28 2.87 4.09
BVP PNN50 1 0.09 0.11 0.04 0.06
BVP PNN50 2 0.08 0.10 0.04 0.06
BVP PNN50 3 0.06 0.08 0.04 0.05
BVP PNN50 4 0.05 0.08 0.04 0.06
BVP PNN50 5 0.07 0.08 0.03 0.05
BVP PNN50 6 0.06 0.08 0.04 0.05
BVP Power 1 2382.37 6155.15 2928.16 7928.99
BVP Power 2 11457.90 30247.47 3129.69 8971.19
BVP Power 3 2584.70 7538.66 2370.40 6454.10
BVP Power 4 2478.29 4909.61 2786.08 8202.62
BVP Power 5 3199.89 5488.39 2189.90 7450.55
BVP Power 6 4197.62 7790.39 4112.00 8798.95
BVP RMSSD 1 79.97 88.94 62.61 86.83
BVP RMSSD 2 100.03 147.13 54.72 90.07
BVP RMSSD 3 70.34 77.13 50.22 76.08
BVP RMSSD 4 56.02 77.65 52.32 87.82
BVP RMSSD 5 67.67 76.84 46.55 79.93
BVP RMSSD 6 76.44 94.67 57.40 83.28
BVP SDNN 1 68.99 63.28 54.11 64.74
BVP SDNN 2 91.37 124.34 54.69 69.80
BVP SDNN 3 65.83 51.38 50.94 57.78
BVP SDNN 4 60.53 54.55 54.57 68.48
BVP SDNN 5 64.02 53.42 44.60 60.89
BVP SDNN 6 71.61 66.03 54.82 66.16
BVP VLF 1 198.34 159.61 301.89 532.47
BVP VLF 2 4879.73 16900.51 230.69 438.64
BVP VLF 3 324.89 614.07 267.22 326.91
BVP VLF 4 401.77 684.71 264.15 350.31
BVP VLF 5 442.51 464.44 60.05 60.14
BVP VLF 6 543.83 621.41 566.39 1499.95
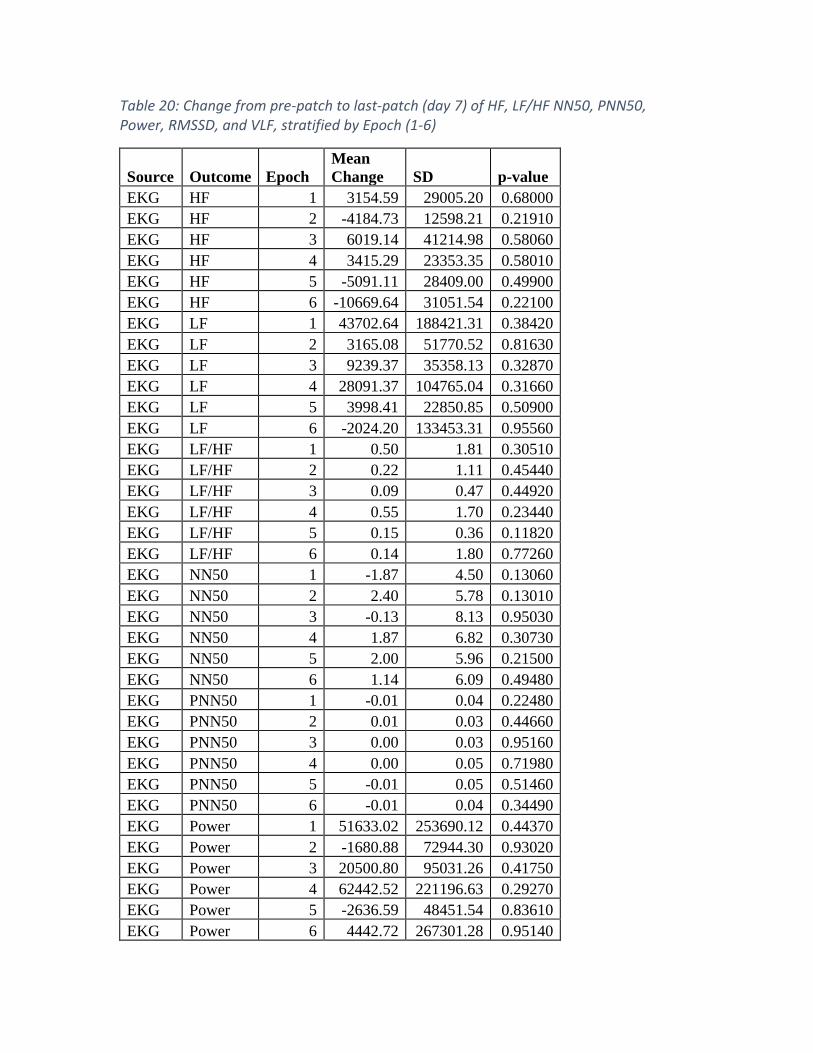
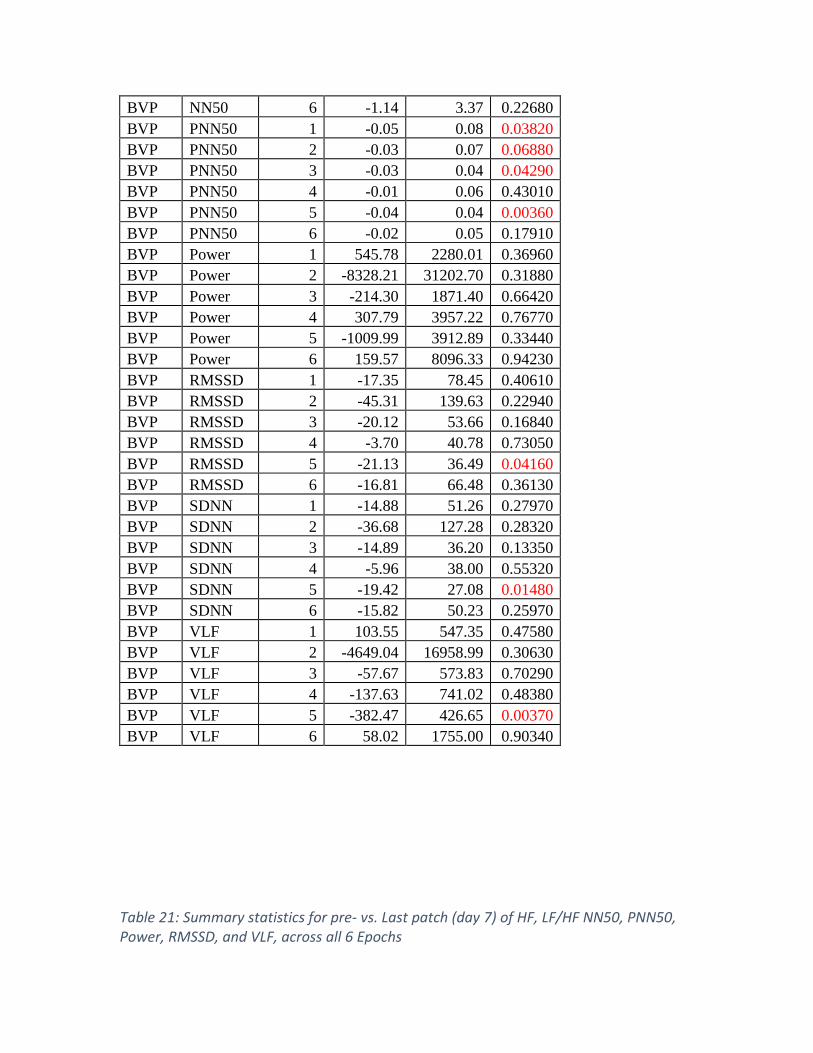
Table 20: Change from pre-patch to last-patch (day 7) of HF, LF/HF NN50, PNN50, Power, RMSSD, and VLF, stratified by Epoch (1-6)
Source Outcome Epoch
Mean
Change SD p-value
EKG HF 1 3154.59 29005.20 0.68000
EKG HF 2 -4184.73 12598.21 0.21910
EKG HF 3 6019.14 41214.98 0.58060
EKG HF 4 3415.29 23353.35 0.58010
EKG HF 5 -5091.11 28409.00 0.49900
EKG HF 6 -10669.64 31051.54 0.22100
EKG LF 1 43702.64 188421.31 0.38420
EKG LF 2 3165.08 51770.52 0.81630
EKG LF 3 9239.37 35358.13 0.32870
EKG LF 4 28091.37 104765.04 0.31660
EKG LF 5 3998.41 22850.85 0.50900
EKG LF 6 -2024.20 133453.31 0.95560
EKG LF/HF 1 0.50 1.81 0.30510
EKG LF/HF 2 0.22 1.11 0.45440
EKG LF/HF 3 0.09 0.47 0.44920
EKG LF/HF 4 0.55 1.70 0.23440
EKG LF/HF 5 0.15 0.36 0.11820
EKG LF/HF 6 0.14 1.80 0.77260
EKG NN50 1 -1.87 4.50 0.13060
EKG NN50 2 2.40 5.78 0.13010
EKG NN50 3 -0.13 8.13 0.95030
EKG NN50 4 1.87 6.82 0.30730
EKG NN50 5 2.00 5.96 0.21500
EKG NN50 6 1.14 6.09 0.49480
EKG PNN50 1 -0.01 0.04 0.22480
EKG PNN50 2 0.01 0.03 0.44660
EKG PNN50 3 0.00 0.03 0.95160
EKG PNN50 4 0.00 0.05 0.71980
EKG PNN50 5 -0.01 0.05 0.51460
EKG PNN50 6 -0.01 0.04 0.34490
EKG Power 1 51633.02 253690.12 0.44370
EKG Power 2 -1680.88 72944.30 0.93020
EKG Power 3 20500.80 95031.26 0.41750
EKG Power 4 62442.52 221196.63 0.29270
EKG Power 5 -2636.59 48451.54 0.83610
EKG Power 6 4442.72 267301.28 0.95140

EKG RMSSD 1 24.02 241.70 0.70620
EKG RMSSD 2 -47.39 118.28 0.14300
EKG RMSSD 3 17.51 294.04 0.82090
EKG RMSSD 4 1.79 198.97 0.97270
EKG RMSSD 5 -63.85 214.48 0.26820
EKG RMSSD 6 -42.95 211.64 0.46120
EKG SDNN 1 28.08 208.21 0.60960
EKG SDNN 2 -42.89 82.71 0.06430
EKG SDNN 3 20.75 209.31 0.70680
EKG SDNN 4 5.58 147.42 0.88550
EKG SDNN 5 -32.43 145.93 0.40390
EKG SDNN 6 -43.01 148.53 0.29830
EKG VLF 1 4775.80 41081.08 0.65940
EKG VLF 2 -661.23 17028.51 0.88260
EKG VLF 3 5242.29 21025.80 0.35060
EKG VLF 4 30935.86 109560.83 0.29260
EKG VLF 5 -1543.89 3669.04 0.12540
EKG VLF 6 17136.56 120381.27 0.60330
BVP HF 1 -119.00 1129.86 0.68950
BVP HF 2 -2745.42 7692.69 0.18860
BVP HF 3 -396.41 1771.01 0.40060
BVP HF 4 540.54 2849.49 0.47470
BVP HF 5 -1085.13 2038.55 0.05830
BVP HF 6 -969.55 3551.06 0.32560
BVP LF 1 561.24 2192.12 0.33820
BVP LF 2 -933.75 8693.08 0.68370
BVP LF 3 239.78 1035.47 0.38500
BVP LF 4 -95.13 948.78 0.70360
BVP LF 5 457.61 4474.31 0.69800
BVP LF 6 1071.09 4533.33 0.39270
BVP LF/HF 1 0.82 4.23 0.46800
BVP LF/HF 2 -0.29 8.11 0.89130
BVP LF/HF 3 0.71 6.18 0.66280
BVP LF/HF 4 -1.06 8.15 0.62380
BVP LF/HF 5 -0.58 3.98 0.57940
BVP LF/HF 6 -0.27 4.10 0.80980
BVP NN50 1 -3.13 5.34 0.03950
BVP NN50 2 -2.13 4.12 0.06470
BVP NN50 3 -1.73 2.89 0.03580
BVP NN50 4 -0.67 3.60 0.48490
BVP NN50 5 -2.73 3.03 0.00360
BVP NN50 6 -1.14 3.37 0.22680
BVP PNN50 1 -0.05 0.08 0.03820
BVP PNN50 2 -0.03 0.07 0.06880
BVP PNN50 3 -0.03 0.04 0.04290
BVP PNN50 4 -0.01 0.06 0.43010
BVP PNN50 5 -0.04 0.04 0.00360
BVP PNN50 6 -0.02 0.05 0.17910
BVP Power 1 545.78 2280.01 0.36960
BVP Power 2 -8328.21 31202.70 0.31880
BVP Power 3 -214.30 1871.40 0.66420
BVP Power 4 307.79 3957.22 0.76770
BVP Power 5 -1009.99 3912.89 0.33440
BVP Power 6 159.57 8096.33 0.94230
BVP RMSSD 1 -17.35 78.45 0.40610
BVP RMSSD 2 -45.31 139.63 0.22940
BVP RMSSD 3 -20.12 53.66 0.16840
BVP RMSSD 4 -3.70 40.78 0.73050
BVP RMSSD 5 -21.13 36.49 0.04160
BVP RMSSD 6 -16.81 66.48 0.36130
BVP SDNN 1 -14.88 51.26 0.27970
BVP SDNN 2 -36.68 127.28 0.28320
BVP SDNN 3 -14.89 36.20 0.13350
BVP SDNN 4 -5.96 38.00 0.55320
BVP SDNN 5 -19.42 27.08 0.01480
BVP SDNN 6 -15.82 50.23 0.25970
BVP VLF 1 103.55 547.35 0.47580
BVP VLF 2 -4649.04 16958.99 0.30630
BVP VLF 3 -57.67 573.83 0.70290
BVP VLF 4 -137.63 741.02 0.48380
BVP VLF 5 -382.47 426.65 0.00370
BVP VLF 6 58.02 1755.00 0.90340
Table 21: Summary statistics for pre- vs. Last patch (day 7) of HF, LF/HF NN50, PNN50, Power, RMSSD, and VLF, across all 6 Epochs

Pre-patch Last-patch (Day 7)
Source Outcome Mean SD Mean SD
EKG HF 23893.77 18487.28 22778.77 24740.27
EKG LF 17020.81 39992.04 31445.25 96188.86
EKG LF/HF 0.65 0.74 0.92 1.08
EKG NN50 38.32 5.43 39.16 5.93
EKG PNN50 0.44 0.03 0.44 0.03
EKG Power 47640.73 67916.09 70076.42 166485.72
EKG RMSSD 546.19 166.44 527.98 201.30
EKG SDNN 372.10 112.67 361.59 148.66
EKG VLF 6726.15 19705.90 15852.41 63648.29
BVP HF 2006.26 5250.16 1219.54 3722.92
BVP LF 1212.62 3001.00 1418.10 4216.50
BVP LF/HF 3.71 5.33 3.64 3.27
BVP NN50 4.86 5.79 2.90 4.04
BVP PNN50 0.07 0.09 0.04 0.05
BVP Power 4346.12 13669.71 2919.37 7809.44
BVP RMSSD 75.74 94.85 53.97 81.91
BVP SDNN 70.89 71.80 52.28 63.04
BVP VLF 1127.24 6929.44 281.73 698.56
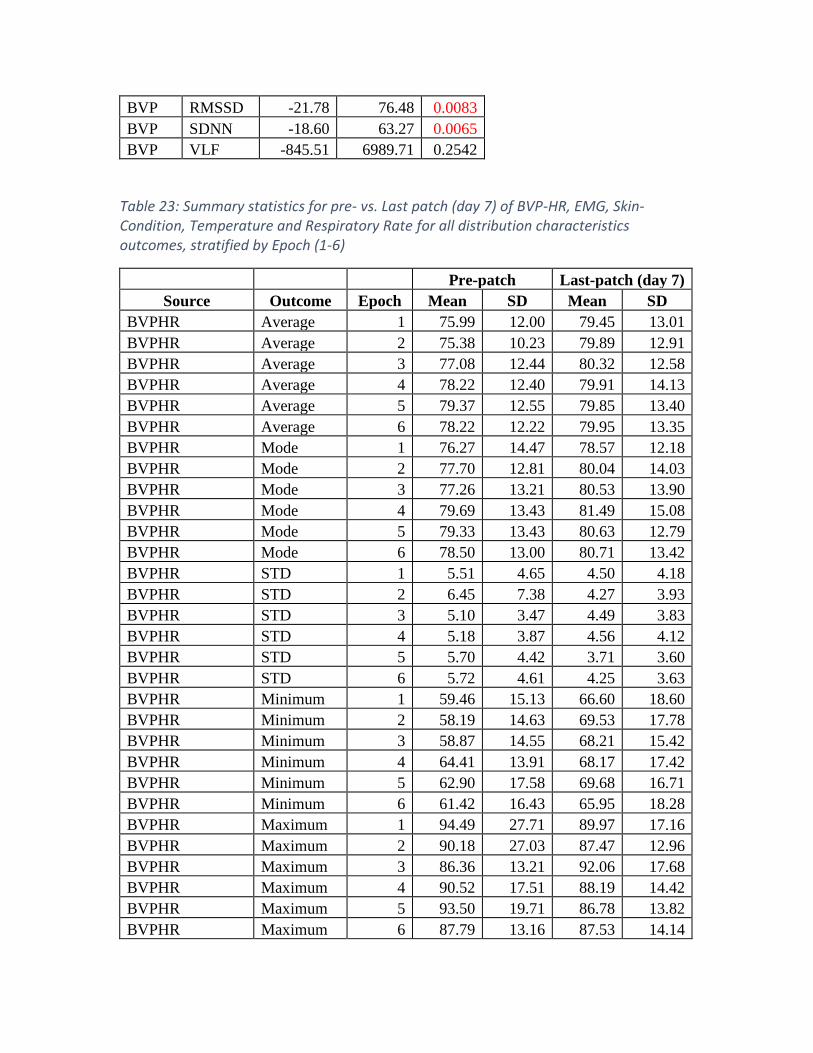
Table 22: Change from pre-patch to last-patch (day 7) of HF, LF/HF NN50, PNN50, Power, RMSSD, and VLF, across all 6 Epochs
Source Outcome
Mean
Change SD
p-
value
EKG HF -1115.01 28492.47 0.7113
EKG LF 14424.43 104293.22 0.1929
EKG LF/HF 0.28 1.31 0.0487
EKG NN50 0.83 6.31 0.2133
EKG PNN50 0.00 0.04 0.3994
EKG Power 22435.68 177642.61 0.2340
EKG RMSSD -18.22 214.87 0.4234
EKG SDNN -10.50 160.20 0.5356
EKG VLF 9126.26 67230.39 0.2012
BVP HF -786.72 3852.92 0.0559
BVP LF 205.48 4414.61 0.6599
BVP LF/HF -0.08 5.93 0.9004
BVP NN50 -1.96 3.80 <.0001
BVP PNN50 -0.03 0.06 <.0001
BVP Power -1426.75 13373.42 0.3142
BVP RMSSD -21.78 76.48 0.0083
BVP SDNN -18.60 63.27 0.0065
BVP VLF -845.51 6989.71 0.2542
Table 23: Summary statistics for pre- vs. Last patch (day 7) of BVP-HR, EMG, Skin-Condition, Temperature and Respiratory Rate for all distribution characteristics outcomes, stratified by Epoch (1-6)
Pre-patch Last-patch (day 7)
Source Outcome Epoch Mean SD Mean SD
BVPHR Average 1 75.99 12.00 79.45 13.01
BVPHR Average 2 75.38 10.23 79.89 12.91
BVPHR Average 3 77.08 12.44 80.32 12.58
BVPHR Average 4 78.22 12.40 79.91 14.13
BVPHR Average 5 79.37 12.55 79.85 13.40
BVPHR Average 6 78.22 12.22 79.95 13.35
BVPHR Mode 1 76.27 14.47 78.57 12.18
BVPHR Mode 2 77.70 12.81 80.04 14.03
BVPHR Mode 3 77.26 13.21 80.53 13.90
BVPHR Mode 4 79.69 13.43 81.49 15.08
BVPHR Mode 5 79.33 13.43 80.63 12.79
BVPHR Mode 6 78.50 13.00 80.71 13.42
BVPHR STD 1 5.51 4.65 4.50 4.18
BVPHR STD 2 6.45 7.38 4.27 3.93
BVPHR STD 3 5.10 3.47 4.49 3.83
BVPHR STD 4 5.18 3.87 4.56 4.12
BVPHR STD 5 5.70 4.42 3.71 3.60
BVPHR STD 6 5.72 4.61 4.25 3.63
BVPHR Minimum 1 59.46 15.13 66.60 18.60
BVPHR Minimum 2 58.19 14.63 69.53 17.78
BVPHR Minimum 3 58.87 14.55 68.21 15.42
BVPHR Minimum 4 64.41 13.91 68.17 17.42
BVPHR Minimum 5 62.90 17.58 69.68 16.71
BVPHR Minimum 6 61.42 16.43 65.95 18.28
BVPHR Maximum 1 94.49 27.71 89.97 17.16
BVPHR Maximum 2 90.18 27.03 87.47 12.96
BVPHR Maximum 3 86.36 13.21 92.06 17.68
BVPHR Maximum 4 90.52 17.51 88.19 14.42
BVPHR Maximum 5 93.50 19.71 86.78 13.82
BVPHR Maximum 6 87.79 13.16 87.53 14.14

BVPHRMaxMin Average 1 9.64 9.75 9.10 10.49
BVPHRMaxMin Average 2 11.32 12.49 8.03 9.49
BVPHRMaxMin Average 3 9.37 8.36 8.04 8.21
BVPHRMaxMin Average 4 8.97 8.17 8.34 9.25
BVPHRMaxMin Average 5 9.21 8.51 6.98 6.97
BVPHRMaxMin Average 6 10.00 10.85 8.16 8.97
BVPHRMaxMin Mode 1 7.27 11.25 6.09 11.16
BVPHRMaxMin Mode 2 7.52 11.82 6.79 11.22
BVPHRMaxMin Mode 3 4.98 3.55 6.87 10.80
BVPHRMaxMin Mode 4 7.08 11.08 7.25 11.03
BVPHRMaxMin Mode 5 7.64 11.65 6.58 10.58
BVPHRMaxMin Mode 6 7.53 12.04 6.49 10.57
BVPHRMaxMin STD 1 7.26 6.74 5.98 7.28
BVPHRMaxMin STD 2 7.90 11.18 4.26 4.46
BVPHRMaxMin STD 3 6.65 6.04 5.53 6.42
BVPHRMaxMin STD 4 6.01 6.82 4.43 5.02
BVPHRMaxMin STD 5 6.96 6.55 4.32 5.47
BVPHRMaxMin STD 6 6.04 6.01 4.81 5.32
BVPHRMaxMin Minimum 1 2.64 1.92 2.08 2.34
BVPHRMaxMin Minimum 2 2.54 2.81 1.87 0.92
BVPHRMaxMin Minimum 3 2.48 2.65 2.05 1.63
BVPHRMaxMin Minimum 4 3.01 2.30 2.36 2.20
BVPHRMaxMin Minimum 5 2.23 1.47 1.87 1.65
BVPHRMaxMin Minimum 6 2.80 2.05 2.08 2.61
BVPHRMaxMin Maximum 1 26.71 23.26 20.79 22.32
BVPHRMaxMin Maximum 2 26.85 32.23 14.99 12.29
BVPHRMaxMin Maximum 3 23.55 15.58 19.43 20.18
BVPHRMaxMin Maximum 4 21.30 19.80 15.63 13.79
BVPHRMaxMin Maximum 5 24.39 21.09 14.86 14.52
BVPHRMaxMin Maximum 6 22.54 16.95 17.73 16.94
EMG Average 1 73.73 147.15 26.37 38.59
EMG Average 2 62.98 136.67 21.32 26.87
EMG Average 3 53.38 130.88 20.44 26.37
EMG Average 4 54.91 138.45 17.39 24.66
EMG Average 5 54.77 133.63 19.50 30.49
EMG Average 6 56.37 116.57 13.53 17.62
EMG Mode 1 88.48 192.35 16.98 26.42
EMG Mode 2 53.96 136.32 22.29 28.61
EMG Mode 3 54.69 138.62 17.93 24.91
EMG Mode 4 52.50 130.22 15.97 23.43
EMG Mode 5 51.44 127.80 19.13 31.35

EMG Mode 6 34.90 62.74 13.34 18.16
EMG Area 1 4423.89 8828.48 1581.98 2315.16
EMG Area 2 3778.68 8200.12 1278.93 1612.16
EMG Area 3 3203.01 7853.07 1226.24 1582.10
EMG Area 4 3294.39 8306.75 1043.60 1479.42
EMG Area 5 3286.20 8017.55 1170.05 1829.65
EMG Area 6 3382.44 6993.89 811.79 1057.38
EMG STD 1 13.00 20.72 14.54 43.83
EMG STD 2 15.68 41.10 3.76 6.59
EMG STD 3 4.53 6.93 4.98 10.52
EMG STD 4 3.71 6.56 3.58 5.68
EMG STD 5 6.89 9.77 3.77 8.27
EMG STD 6 20.60 47.69 2.00 1.79
EMG Minimum 1 15.56 18.27 12.55 21.69
EMG Minimum 2 28.80 73.99 14.71 23.93
EMG Minimum 3 42.99 111.72 14.22 22.04
EMG Minimum 4 47.15 122.87 12.08 20.81
EMG Minimum 5 43.12 114.12 9.31 17.09
EMG Minimum 6 24.77 44.54 9.94 15.24
EMG Maximum 1 192.25 244.06 103.39 172.63
EMG Maximum 2 155.35 237.25 63.62 82.52
EMG Maximum 3 99.71 164.04 74.06 155.55
EMG Maximum 4 92.75 161.73 87.60 144.18
EMG Maximum 5 128.73 188.45 73.03 155.09
EMG Maximum 6 123.22 212.92 41.55 36.64
EMG Average 1 28.81 55.86 41.70 93.73
EMG Average 2 44.06 99.54 35.15 70.91
EMG Average 3 30.77 68.94 20.33 30.85
EMG Average 4 24.10 56.73 25.32 53.58
EMG Average 5 25.06 64.03 25.62 55.95
EMG Average 6 33.05 92.75 30.84 69.95
EMG Mode 1 19.34 33.17 38.98 99.90
EMG Mode 2 32.81 80.55 15.36 22.12
EMG Mode 3 32.48 74.52 20.35 34.43
EMG Mode 4 23.25 57.01 19.20 36.53
EMG Mode 5 24.23 64.31 22.08 46.41
EMG Mode 6 32.19 94.53 32.10 76.54
EMG Area 1 1728.66 3351.40 2501.91 5623.55
EMG Area 2 2643.37 5972.58 2108.70 4254.80
EMG Area 3 1846.15 4136.32 1219.72 1850.73
EMG Area 4 1446.25 3403.70 1518.91 3214.78
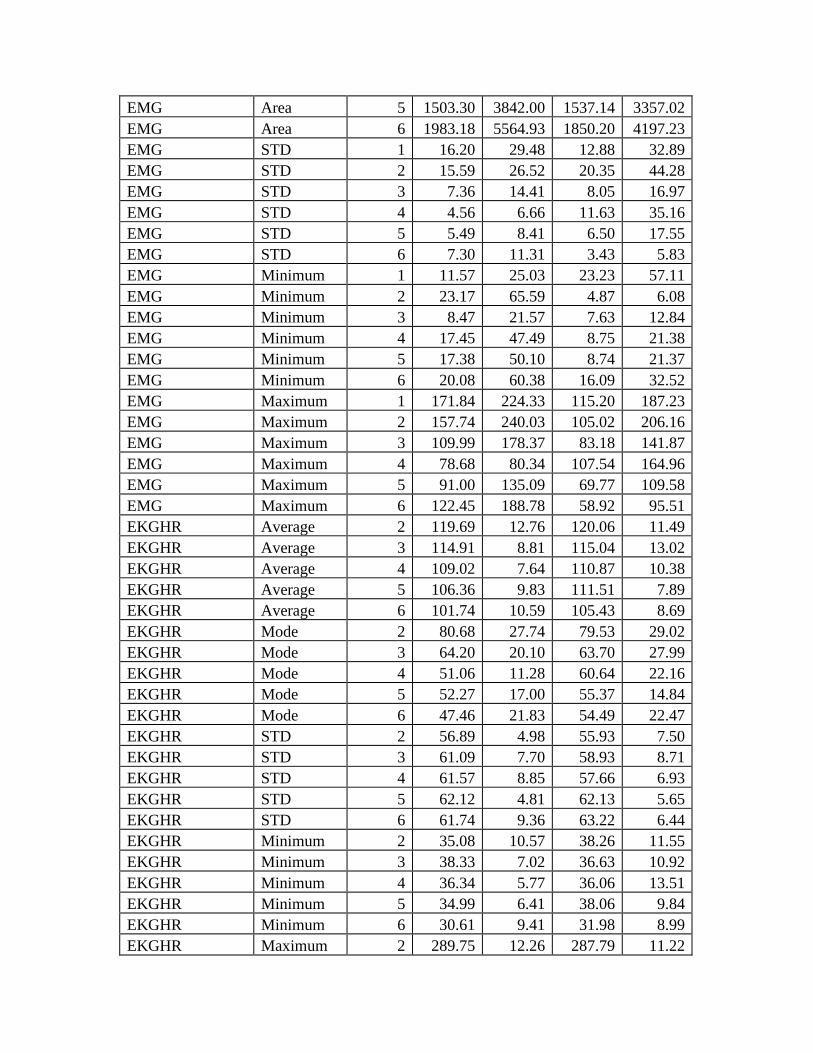
EMG Area 5 1503.30 3842.00 1537.14 3357.02
EMG Area 6 1983.18 5564.93 1850.20 4197.23
EMG STD 1 16.20 29.48 12.88 32.89
EMG STD 2 15.59 26.52 20.35 44.28
EMG STD 3 7.36 14.41 8.05 16.97
EMG STD 4 4.56 6.66 11.63 35.16
EMG STD 5 5.49 8.41 6.50 17.55
EMG STD 6 7.30 11.31 3.43 5.83
EMG Minimum 1 11.57 25.03 23.23 57.11
EMG Minimum 2 23.17 65.59 4.87 6.08
EMG Minimum 3 8.47 21.57 7.63 12.84
EMG Minimum 4 17.45 47.49 8.75 21.38
EMG Minimum 5 17.38 50.10 8.74 21.37
EMG Minimum 6 20.08 60.38 16.09 32.52
EMG Maximum 1 171.84 224.33 115.20 187.23
EMG Maximum 2 157.74 240.03 105.02 206.16
EMG Maximum 3 109.99 178.37 83.18 141.87
EMG Maximum 4 78.68 80.34 107.54 164.96
EMG Maximum 5 91.00 135.09 69.77 109.58
EMG Maximum 6 122.45 188.78 58.92 95.51
EKGHR Average 2 119.69 12.76 120.06 11.49
EKGHR Average 3 114.91 8.81 115.04 13.02
EKGHR Average 4 109.02 7.64 110.87 10.38
EKGHR Average 5 106.36 9.83 111.51 7.89
EKGHR Average 6 101.74 10.59 105.43 8.69
EKGHR Mode 2 80.68 27.74 79.53 29.02
EKGHR Mode 3 64.20 20.10 63.70 27.99
EKGHR Mode 4 51.06 11.28 60.64 22.16
EKGHR Mode 5 52.27 17.00 55.37 14.84
EKGHR Mode 6 47.46 21.83 54.49 22.47
EKGHR STD 2 56.89 4.98 55.93 7.50
EKGHR STD 3 61.09 7.70 58.93 8.71
EKGHR STD 4 61.57 8.85 57.66 6.93
EKGHR STD 5 62.12 4.81 62.13 5.65
EKGHR STD 6 61.74 9.36 63.22 6.44
EKGHR Minimum 2 35.08 10.57 38.26 11.55
EKGHR Minimum 3 38.33 7.02 36.63 10.92
EKGHR Minimum 4 36.34 5.77 36.06 13.51
EKGHR Minimum 5 34.99 6.41 38.06 9.84
EKGHR Minimum 6 30.61 9.41 31.98 8.99
EKGHR Maximum 2 289.75 12.26 287.79 11.22

EKGHR Maximum 3 292.72 9.34 289.50 11.15
EKGHR Maximum 4 288.53 13.01 286.77 16.66
EKGHR Maximum 5 286.46 17.62 288.23 10.54
EKGHR Maximum 6 278.81 19.88 294.45 4.15
EKGHRMaxMin Average 2 149.43 21.62 145.76 22.80
EKGHRMaxMin Average 3 155.05 13.59 149.86 13.95
EKGHRMaxMin Average 4 152.38 24.86 143.01 23.95
EKGHRMaxMin Average 5 154.93 21.73 153.72 19.80
EKGHRMaxMin Average 6 143.16 28.85 147.05 15.49
EKGHRMaxMin Mode 2 77.04 53.27 94.10 64.44
EKGHRMaxMin Mode 3 95.38 68.18 65.49 53.18
EKGHRMaxMin Mode 4 64.18 29.38 70.20 64.86
EKGHRMaxMin Mode 5 89.36 66.60 86.20 44.44
EKGHRMaxMin Mode 6 81.64 67.36 50.42 32.38
EKGHRMaxMin STD 2 59.35 8.66 56.69 13.89
EKGHRMaxMin STD 3 62.24 9.62 61.67 14.11
EKGHRMaxMin STD 4 61.38 8.95 60.50 10.86
EKGHRMaxMin STD 5 60.83 11.90 61.78 14.01
EKGHRMaxMin STD 6 62.13 12.79 69.43 8.42
EKGHRMaxMin Minimum 2 55.38 32.74 58.32 37.28
EKGHRMaxMin Minimum 3 52.16 18.12 47.72 25.92
EKGHRMaxMin Minimum 4 53.76 27.95 48.74 34.97
EKGHRMaxMin Minimum 5 59.60 33.62 63.48 35.49
EKGHRMaxMin Minimum 6 58.48 41.86 44.07 26.02
EKGHRMaxMin Maximum 2 239.95 17.21 232.74 23.85
EKGHRMaxMin Maximum 3 243.42 15.10 240.36 21.29
EKGHRMaxMin Maximum 4 241.38 18.73 240.92 25.28
EKGHRMaxMin Maximum 5 242.32 18.77 242.68 17.09
EKGHRMaxMin Maximum 6 242.12 21.17 251.81 10.15
SkinCond Average 1 1.03 0.92 1.12 0.83
SkinCond Average 2 1.06 0.96 1.15 0.92
SkinCond Average 3 1.16 1.08 1.18 0.95
SkinCond Average 4 1.25 1.19 1.21 1.02
SkinCond Average 5 1.32 1.45 1.28 1.13
SkinCond Average 6 1.39 1.41 1.31 1.22
SkinCond Mode 1 0.96 0.71 1.09 0.81
SkinCond Mode 2 1.02 0.83 1.15 0.93
SkinCond Mode 3 1.11 1.00 1.17 0.93
SkinCond Mode 4 1.23 1.16 1.19 0.99
SkinCond Mode 5 1.24 1.22 1.27 1.11
SkinCond Mode 6 1.38 1.39 1.30 1.20
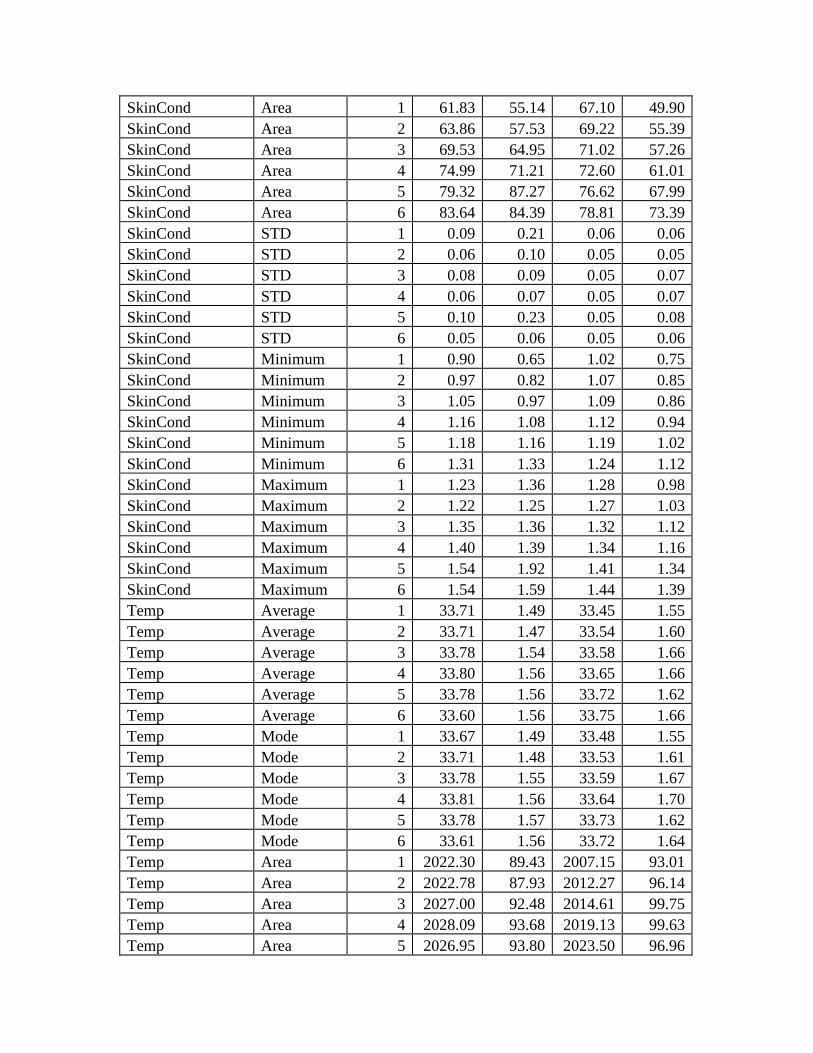
SkinCond Area 1 61.83 55.14 67.10 49.90
SkinCond Area 2 63.86 57.53 69.22 55.39
SkinCond Area 3 69.53 64.95 71.02 57.26
SkinCond Area 4 74.99 71.21 72.60 61.01
SkinCond Area 5 79.32 87.27 76.62 67.99
SkinCond Area 6 83.64 84.39 78.81 73.39
SkinCond STD 1 0.09 0.21 0.06 0.06
SkinCond STD 2 0.06 0.10 0.05 0.05
SkinCond STD 3 0.08 0.09 0.05 0.07
SkinCond STD 4 0.06 0.07 0.05 0.07
SkinCond STD 5 0.10 0.23 0.05 0.08
SkinCond STD 6 0.05 0.06 0.05 0.06
SkinCond Minimum 1 0.90 0.65 1.02 0.75
SkinCond Minimum 2 0.97 0.82 1.07 0.85
SkinCond Minimum 3 1.05 0.97 1.09 0.86
SkinCond Minimum 4 1.16 1.08 1.12 0.94
SkinCond Minimum 5 1.18 1.16 1.19 1.02
SkinCond Minimum 6 1.31 1.33 1.24 1.12
SkinCond Maximum 1 1.23 1.36 1.28 0.98
SkinCond Maximum 2 1.22 1.25 1.27 1.03
SkinCond Maximum 3 1.35 1.36 1.32 1.12
SkinCond Maximum 4 1.40 1.39 1.34 1.16
SkinCond Maximum 5 1.54 1.92 1.41 1.34
SkinCond Maximum 6 1.54 1.59 1.44 1.39
Temp Average 1 33.71 1.49 33.45 1.55
Temp Average 2 33.71 1.47 33.54 1.60
Temp Average 3 33.78 1.54 33.58 1.66
Temp Average 4 33.80 1.56 33.65 1.66
Temp Average 5 33.78 1.56 33.72 1.62
Temp Average 6 33.60 1.56 33.75 1.66
Temp Mode 1 33.67 1.49 33.48 1.55
Temp Mode 2 33.71 1.48 33.53 1.61
Temp Mode 3 33.78 1.55 33.59 1.67
Temp Mode 4 33.81 1.56 33.64 1.70
Temp Mode 5 33.78 1.57 33.73 1.62
Temp Mode 6 33.61 1.56 33.72 1.64
Temp Area 1 2022.30 89.43 2007.15 93.01
Temp Area 2 2022.78 87.93 2012.27 96.14
Temp Area 3 2027.00 92.48 2014.61 99.75
Temp Area 4 2028.09 93.68 2019.13 99.63
Temp Area 5 2026.95 93.80 2023.50 96.96
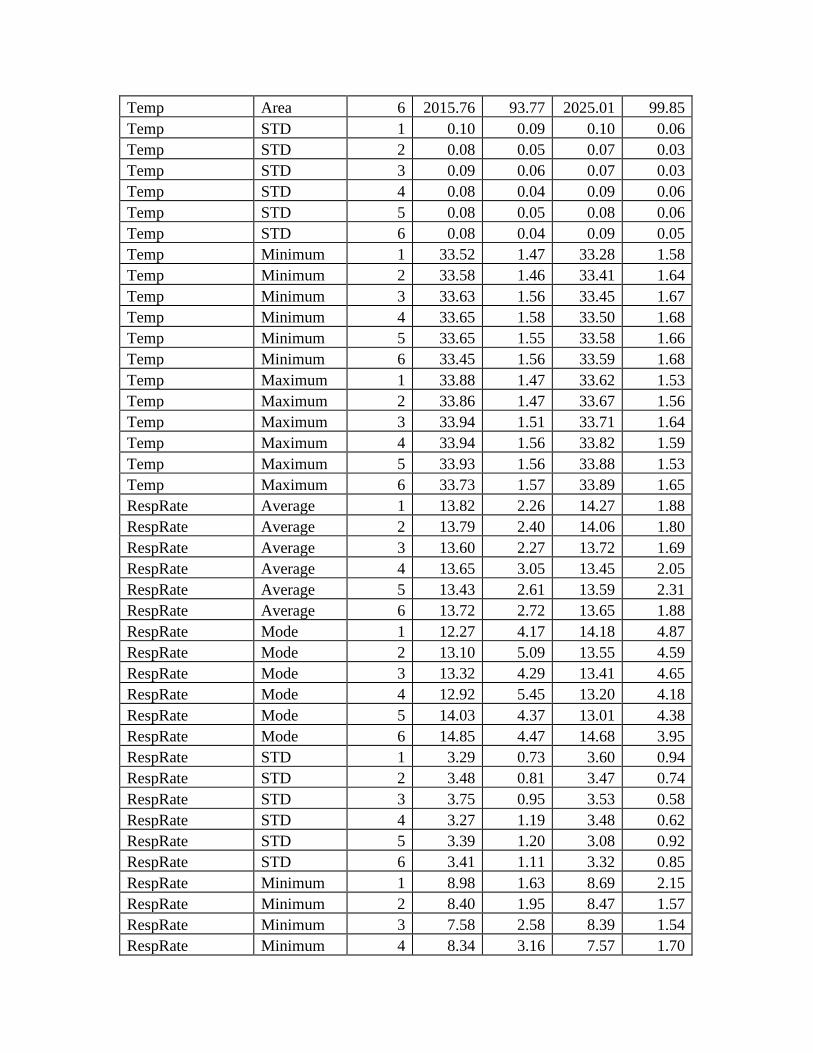
Temp Area 6 2015.76 93.77 2025.01 99.85
Temp STD 1 0.10 0.09 0.10 0.06
Temp STD 2 0.08 0.05 0.07 0.03
Temp STD 3 0.09 0.06 0.07 0.03
Temp STD 4 0.08 0.04 0.09 0.06
Temp STD 5 0.08 0.05 0.08 0.06
Temp STD 6 0.08 0.04 0.09 0.05
Temp Minimum 1 33.52 1.47 33.28 1.58
Temp Minimum 2 33.58 1.46 33.41 1.64
Temp Minimum 3 33.63 1.56 33.45 1.67
Temp Minimum 4 33.65 1.58 33.50 1.68
Temp Minimum 5 33.65 1.55 33.58 1.66
Temp Minimum 6 33.45 1.56 33.59 1.68
Temp Maximum 1 33.88 1.47 33.62 1.53
Temp Maximum 2 33.86 1.47 33.67 1.56
Temp Maximum 3 33.94 1.51 33.71 1.64
Temp Maximum 4 33.94 1.56 33.82 1.59
Temp Maximum 5 33.93 1.56 33.88 1.53
Temp Maximum 6 33.73 1.57 33.89 1.65
RespRate Average 1 13.82 2.26 14.27 1.88
RespRate Average 2 13.79 2.40 14.06 1.80
RespRate Average 3 13.60 2.27 13.72 1.69
RespRate Average 4 13.65 3.05 13.45 2.05
RespRate Average 5 13.43 2.61 13.59 2.31
RespRate Average 6 13.72 2.72 13.65 1.88
RespRate Mode 1 12.27 4.17 14.18 4.87
RespRate Mode 2 13.10 5.09 13.55 4.59
RespRate Mode 3 13.32 4.29 13.41 4.65
RespRate Mode 4 12.92 5.45 13.20 4.18
RespRate Mode 5 14.03 4.37 13.01 4.38
RespRate Mode 6 14.85 4.47 14.68 3.95
RespRate STD 1 3.29 0.73 3.60 0.94
RespRate STD 2 3.48 0.81 3.47 0.74
RespRate STD 3 3.75 0.95 3.53 0.58
RespRate STD 4 3.27 1.19 3.48 0.62
RespRate STD 5 3.39 1.20 3.08 0.92
RespRate STD 6 3.41 1.11 3.32 0.85
RespRate Minimum 1 8.98 1.63 8.69 2.15
RespRate Minimum 2 8.40 1.95 8.47 1.57
RespRate Minimum 3 7.58 2.58 8.39 1.54
RespRate Minimum 4 8.34 3.16 7.57 1.70

RespRate Minimum 5 7.85 1.74 8.18 2.40
RespRate Minimum 6 8.31 2.87 8.35 2.16
RespRate Maximum 1 19.06 1.35 19.35 1.25
RespRate Maximum 2 19.04 2.24 19.11 1.66
RespRate Maximum 3 18.88 1.77 19.48 1.24
RespRate Maximum 4 18.37 2.50 19.38 1.15
RespRate Maximum 5 18.03 3.02 18.30 2.08
RespRate Maximum 6 18.92 2.45 18.69 1.59
Table 24: Change from pre-patch to last patch (day 7) of BVP-HR, EMG, Skin-Condition, Temperature and Respiratory Rate for Average, Mode, and Area, stratified by Epoch (1-6)
Source Outcome Epoch
Mean
Change SD
p-
value
BVPHR Average 1 3.47 8.57 0.1393
BVPHR Average 2 4.51 7.83 0.0426
BVPHR Average 3 3.23 7.87 0.1338
BVPHR Average 4 1.69 9.18 0.4866
BVPHR Average 5 0.48 8.92 0.8378
BVPHR Average 6 2.69 7.87 0.2231
BVPHR Mode 1 2.29 9.69 0.3754
BVPHR Mode 2 2.35 10.46 0.3998
BVPHR Mode 3 3.26 9.99 0.2261
BVPHR Mode 4 1.80 11.77 0.5641
BVPHR Mode 5 1.30 9.01 0.5847
BVPHR Mode 6 3.34 7.79 0.1329
BVPHRMaxMin Average 1 -0.54 4.61 0.6583
BVPHRMaxMin Average 2 -3.29 10.09 0.2272
BVPHRMaxMin Average 3 -1.33 2.98 0.1047
BVPHRMaxMin Average 4 -0.63 4.94 0.6286
BVPHRMaxMin Average 5 -2.23 3.13 0.0153
BVPHRMaxMin Average 6 -1.73 4.52 0.1763
BVPHRMaxMin Mode 1 -1.18 2.17 0.0533
BVPHRMaxMin Mode 2 -0.73 1.57 0.0917
BVPHRMaxMin Mode 3 1.89 10.29 0.4894
BVPHRMaxMin Mode 4 0.17 2.56 0.8021
BVPHRMaxMin Mode 5 -1.06 2.63 0.1390
BVPHRMaxMin Mode 6 -0.77 2.13 0.2016
EMG Average 1 -47.37 156.16 0.2597
EMG Average 2 -41.66 134.35 0.2497

EMG Average 3 -32.95 120.86 0.3090
EMG Average 4 -37.51 128.11 0.2758
EMG Average 5 -35.27 112.16 0.2434
EMG Average 6 -42.30 116.23 0.1964
EMG Mode 1 -71.50 198.24 0.1842
EMG Mode 2 -31.67 128.86 0.3573
EMG Mode 3 -36.76 133.32 0.3036
EMG Mode 4 -36.54 123.10 0.2696
EMG Mode 5 -32.31 105.53 0.2554
EMG Mode 6 -21.01 63.91 0.2405
EMG Area 1 -2841.91 9369.34 0.2597
EMG Area 2 -2499.75 8061.27 0.2497
EMG Area 3 -1976.78 7251.87 0.3090
EMG Area 4 -2250.79 7686.36 0.2758
EMG Area 5 -2116.15 6729.75 0.2434
EMG Area 6 -2538.04 6974.02 0.1964
EMG Average 1 12.89 105.67 0.6440
EMG Average 2 -8.91 100.16 0.7356
EMG Average 3 -10.44 74.71 0.5969
EMG Average 4 1.21 82.31 0.9553
EMG Average 5 0.56 90.21 0.9810
EMG Average 6 -2.70 121.61 0.9351
EMG Mode 1 19.63 99.86 0.4590
EMG Mode 2 -17.45 78.42 0.4033
EMG Mode 3 -12.13 83.13 0.5810
EMG Mode 4 -4.05 71.81 0.8302
EMG Mode 5 -2.15 83.96 0.9225
EMG Mode 6 -0.54 127.42 0.9876
EMG Area 1 773.25 6340.13 0.6440
EMG Area 2 -534.67 6009.89 0.7355
EMG Area 3 -626.43 4482.69 0.5969
EMG Area 4 72.67 4938.74 0.9554
EMG Area 5 33.84 5412.35 0.9810
EMG Area 6 -161.92 7296.73 0.9351
EKGHR Average 2 0.37 13.68 0.8827
EKGHR Average 3 0.13 14.53 0.9736
EKGHR Average 4 1.85 13.49 0.6037
EKGHR Average 5 5.15 11.79 0.1130
EKGHR Average 6 3.93 15.74 0.3666
EKGHR Mode 2 -1.15 34.63 0.8569
EKGHR Mode 3 -0.49 30.98 0.9519

EKGHR Mode 4 9.58 21.99 0.1137
EKGHR Mode 5 3.09 22.59 0.6041
EKGHR Mode 6 6.18 33.79 0.5061
EKGHRMaxMin Average 2 -3.68 29.92 0.5063
EKGHRMaxMin Average 3 -5.19 20.06 0.3338
EKGHRMaxMin Average 4 -9.37 35.70 0.3267
EKGHRMaxMin Average 5 -1.20 16.30 0.7793
EKGHRMaxMin Average 6 3.92 36.00 0.6905
EKGHRMaxMin Mode 2 17.06 88.11 0.2976
EKGHRMaxMin Mode 3 -29.89 80.06 0.1701
EKGHRMaxMin Mode 4 6.02 77.88 0.7690
EKGHRMaxMin Mode 5 -3.16 79.37 0.8798
EKGHRMaxMin Mode 6 -33.34 67.42 0.0871
SkinCond Average 1 0.09 0.85 0.6960
SkinCond Average 2 0.09 0.82 0.6779
SkinCond Average 3 0.02 0.98 0.9231
SkinCond Average 4 -0.04 0.92 0.8692
SkinCond Average 5 -0.05 1.03 0.8678
SkinCond Average 6 -0.03 0.97 0.9008
SkinCond Mode 1 0.12 0.74 0.5349
SkinCond Mode 2 0.13 0.77 0.5148
SkinCond Mode 3 0.07 0.95 0.7922
SkinCond Mode 4 -0.04 0.92 0.8594
SkinCond Mode 5 0.03 0.89 0.9042
SkinCond Mode 6 -0.03 0.97 0.8988
SkinCond Area 1 5.27 51.27 0.6963
SkinCond Area 2 5.36 49.02 0.6785
SkinCond Area 3 1.49 58.64 0.9231
SkinCond Area 4 -2.39 55.13 0.8691
SkinCond Area 5 -2.70 61.68 0.8677
SkinCond Area 6 -1.97 58.15 0.9011
Temp Average 1 -0.25 1.51 0.5273
Temp Average 2 -0.18 1.50 0.6576
Temp Average 3 -0.21 1.48 0.5966
Temp Average 4 -0.15 1.54 0.7128
Temp Average 5 -0.06 1.45 0.8797
Temp Average 6 0.17 1.41 0.6557
Temp Mode 1 -0.19 1.46 0.6293
Temp Mode 2 -0.18 1.52 0.6535
Temp Mode 3 -0.19 1.46 0.6150
Temp Mode 4 -0.16 1.54 0.6851

Temp Mode 5 -0.06 1.52 0.8907
Temp Mode 6 0.12 1.38 0.7519
Temp Area 1 -15.15 90.55 0.5274
Temp Area 2 -10.51 89.84 0.6574
Temp Area 3 -12.39 88.59 0.5966
Temp Area 4 -8.96 92.41 0.7128
Temp Area 5 -3.45 86.90 0.8800
Temp Area 6 10.36 84.89 0.6555
RespRate Average 1 0.45 1.52 0.2686
RespRate Average 2 0.26 2.15 0.6419
RespRate Average 3 0.12 2.22 0.8423
RespRate Average 4 -0.20 2.83 0.7899
RespRate Average 5 0.16 1.81 0.7435
RespRate Average 6 0.10 2.12 0.8571
RespRate Mode 1 1.92 4.03 0.0868
RespRate Mode 2 0.45 4.49 0.7032
RespRate Mode 3 0.08 4.34 0.9409
RespRate Mode 4 0.28 5.94 0.8556
RespRate Mode 5 -1.02 3.57 0.2859
RespRate Mode 6 -0.06 4.32 0.9582
Table 25: Summary statistics for pre- vs. Last patch (day 7) of BVP-HR, EMG, Skin-Condition, Temperature and Respiratory Rate for all distribution characteristics
outcomes, across all 6 epochs
Pre-patch
Last-patch (Day
7)
Source Outcome Mean SD Mean SD
BVPHR Average 77.35 11.67 79.90 12.87
BVPHR Mode 78.02 13.04 80.33 13.24
BVPHR STD 5.71 4.85 4.30 3.79
BVPHR Minimum 60.70 15.14 68.02 16.96
BVPHR Maximum 91.06 20.82 88.67 14.81
BVPHRMaxMin Average 9.78 9.50 8.11 8.73
BVPHRMaxMin Mode 6.98 10.32 6.68 10.59
BVPHRMaxMin STD 6.98 7.41 4.89 5.61
BVPHRMaxMin Minimum 2.61 2.18 2.05 1.92
BVPHRMaxMin Maximum 24.84 22.28 17.24 16.72
EMG Average 59.20 130.01 19.76 27.63
EMG Mode 56.05 133.55 17.61 25.23

EMG Area 3552.07 7800.39 1185.43 1657.62
EMG STD 10.59 27.06 5.44 18.98
EMG Minimum 33.88 87.88 12.14 19.88
EMG Maximum 135.41 202.29 73.88 131.16
EMG Average 30.80 72.46 29.82 63.93
EMG Mode 27.23 67.56 24.68 58.06
EMG Area 1848.17 4347.81 1789.43 3835.60
EMG STD 9.35 18.43 10.47 28.32
EMG Minimum 16.30 46.42 11.55 29.90
EMG Maximum 120.96 179.72 89.94 152.99
EKGHR Average 112.05 12.28 113.83 11.66
EKGHR Mode 62.81 25.24 65.54 26.41
EKGHR STD 60.11 7.19 58.97 7.58
EKGHR Minimum 35.18 8.62 36.54 11.13
EKGHR Maximum 287.79 14.64 289.09 11.44
EKGHRMaxMin Average 150.88 22.16 147.53 20.04
EKGHRMaxMin Mode 82.18 58.59 76.75 56.55
EKGHRMaxMin STD 61.09 10.19 61.13 13.16
EKGHRMaxMin Minimum 55.50 31.15 53.44 33.24
EKGHRMaxMin Maximum 241.60 17.62 240.21 21.49
SkinCond Average 1.19 1.15 1.21 1.00
SkinCond Mode 1.14 1.05 1.19 0.98
SkinCond Area 71.52 69.18 72.56 59.72
SkinCond STD 0.07 0.14 0.05 0.06
SkinCond Minimum 1.08 1.00 1.12 0.91
SkinCond Maximum 1.37 1.45 1.34 1.15
Temp Average 33.75 1.49 33.62 1.58
Temp Mode 33.75 1.49 33.62 1.59
Temp Area 2024.94 89.35 2016.94 95.02
Temp STD 0.08 0.06 0.08 0.05
Temp Minimum 33.60 1.49 33.47 1.61
Temp Maximum 33.90 1.48 33.77 1.54
RespRate Average 13.66 2.48 13.79 1.91
RespRate Mode 13.37 4.59 13.67 4.36
RespRate STD 3.43 0.99 3.41 0.78
RespRate Minimum 8.26 2.35 8.28 1.93
RespRate Maximum 18.73 2.24 19.05 1.55
Table 26: Change from pre-patch to last patch (day 7) of BVP-HR, EMG, Skin-Condition, Temperature and Respiratory Rate for Average, Mode, and Area, across all 6 Epochs

Source Outcome
Mean
Change SD p-value
BVPHR Average 2.54 8.31 0.0047
BVPHR Mode 2.31 9.60 0.0249
BVPHRMaxMin Average -1.67 5.50 0.0049
BVPHRMaxMin Mode -0.31 4.67 0.5361
EMG Average -39.44 124.62 0.0035
EMG Mode -38.45 128.72 0.0057
EMG Area -2366.63 7477.30 0.0035
EMG Average -0.98 93.72 0.9213
EMG Mode -2.55 89.76 0.7881
EMG Area -58.74 5623.21 0.9213
EKGHR Average 1.78 13.68 0.2212
EKGHR Mode 2.73 29.70 0.3857
EKGHRMaxMin Average -3.36 28.34 0.2641
EKGHRMaxMin Mode -5.43 82.06 0.5317
SkinCond Average 0.02 0.90 0.8557
SkinCond Mode 0.05 0.85 0.5926
SkinCond Area 1.04 54.01 0.8560
Temp Average -0.13 1.45 0.3849
Temp Mode -0.13 1.45 0.3941
Temp Area -8.00 86.95 0.3851
RespRate Average 0.13 2.09 0.5621
RespRate Mode 0.30 4.44 0.5281
GHK- CU Study – Metabolic Data
Table 1: Summary statistics for metabolic markers, stratified by assessment time point ............ 43
Table 2: Change from time 1 to time 2, time 2 to time 3 and time 1 to time 3 ............................. 49
Study Design: Single arm study with 3 assessment time points.
Sample Size: N=15
Statistical Methods: All physiology suite parameters were summarized in terms of
means and standard deviation, stratified by assessment time point. Changes from day 1
(pre-patch) to day 2, day 2 to day 7, and day 1 to day 7 were evaluated using a paired t-
test or nonparametric Wilcoxon Signed Rank test.
Table 27: Summary statistics for metabolic markers, stratified by assessment time point

Marker
N Assessment
Time point Mean SD
2-amino
15 Day 1 (pre-
patch) 11.82 11.65
2-amino 15 Day 2 13.26 10.88
2-amino 15 Day 7 14.70 12.27
3-MT
15 Day 1 (pre-
patch) 64.46 45.27
3-MT 15 Day 2 55.99 39.14
3-MT 15 Day 7 52.33 26.14
5-HT
15 Day 1 (pre-
patch) 76.14 37.36
5-HT 15 Day 2 80.52 43.01
5-HT 15 Day 7 82.99 57.52
5-HT/DA
15 Day 1 (pre-
patch) 0.87 0.90
5-HT/DA 15 Day 2 0.69 0.62
5-HT/DA 15 Day 7 0.63 0.44
5-HTP
15 Day 1 (pre-
patch) 49.21 26.41
5-HTP 15 Day 2 59.70 67.25
5-HTP 15 Day 7 46.89 25.25
Age
15 Day 1 (pre-
patch) 61.27 8.65
Age 15 Day 2 61.27 8.65
Age 15 Day 7 61.27 8.65
Ala
15 Day 1 (pre-
patch) 117.66 45.05
Ala 15 Day 2 97.49 42.89
Ala 15 Day 7 119.53 74.69
Arg
15 Day 1 (pre-
patch) 5.97 1.69
Arg 15 Day 2 5.13 2.79
Arg 15 Day 7 7.36 6.59
Asn
15 Day 1 (pre-
patch) 18.09 15.41
Asn 15 Day 2 15.58 10.84
Asn 15 Day 7 16.07 11.14
Asp
15 Day 1 (pre-
patch) 4.99 2.86
Asp 15 Day 2 5.29 2.31
Asp 15 Day 7 4.88 2.45
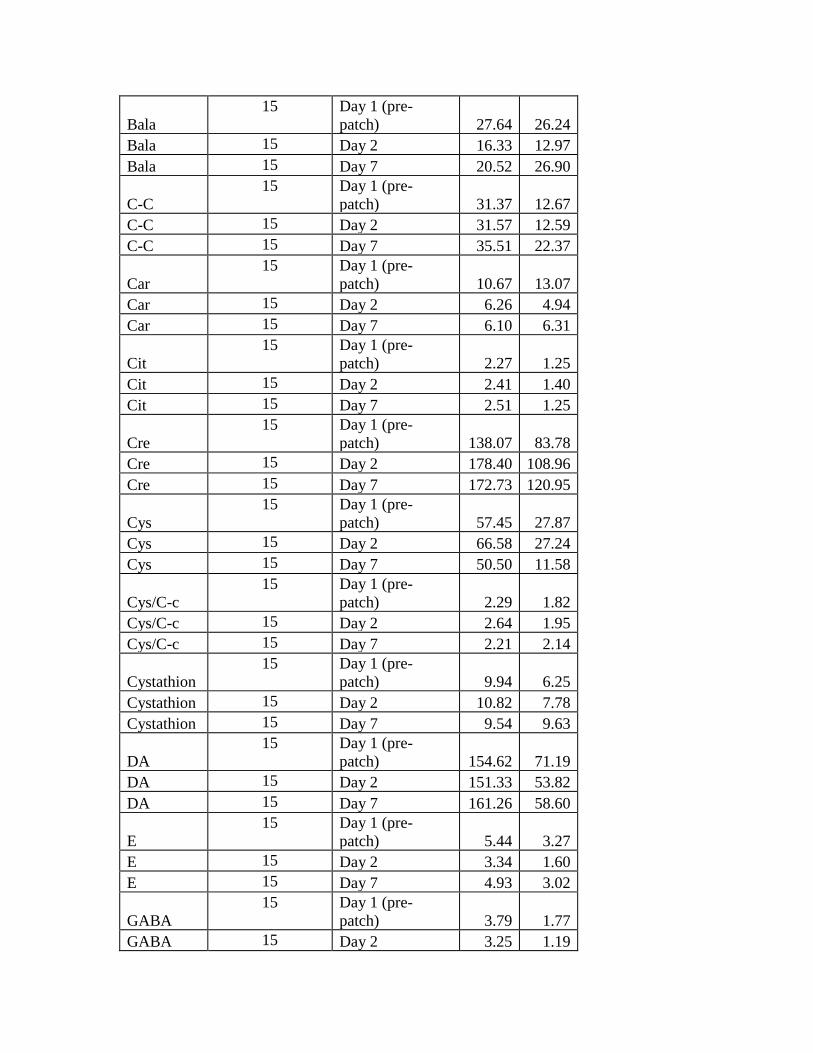
Bala
15 Day 1 (pre-
patch) 27.64 26.24
Bala 15 Day 2 16.33 12.97
Bala 15 Day 7 20.52 26.90
C-C
15 Day 1 (pre-
patch) 31.37 12.67
C-C 15 Day 2 31.57 12.59
C-C 15 Day 7 35.51 22.37
Car
15 Day 1 (pre-
patch) 10.67 13.07
Car 15 Day 2 6.26 4.94
Car 15 Day 7 6.10 6.31
Cit
15 Day 1 (pre-
patch) 2.27 1.25
Cit 15 Day 2 2.41 1.40
Cit 15 Day 7 2.51 1.25
Cre
15 Day 1 (pre-
patch) 138.07 83.78
Cre 15 Day 2 178.40 108.96
Cre 15 Day 7 172.73 120.95
Cys
15 Day 1 (pre-
patch) 57.45 27.87
Cys 15 Day 2 66.58 27.24
Cys 15 Day 7 50.50 11.58
Cys/C-c
15 Day 1 (pre-
patch) 2.29 1.82
Cys/C-c 15 Day 2 2.64 1.95
Cys/C-c 15 Day 7 2.21 2.14
Cystathion
15 Day 1 (pre-
patch) 9.94 6.25
Cystathion 15 Day 2 10.82 7.78
Cystathion 15 Day 7 9.54 9.63
DA
15 Day 1 (pre-
patch) 154.62 71.19
DA 15 Day 2 151.33 53.82
DA 15 Day 7 161.26 58.60
E
15 Day 1 (pre-
patch) 5.44 3.27
E 15 Day 2 3.34 1.60
E 15 Day 7 4.93 3.02
GABA
15 Day 1 (pre-
patch) 3.79 1.77
GABA 15 Day 2 3.25 1.19
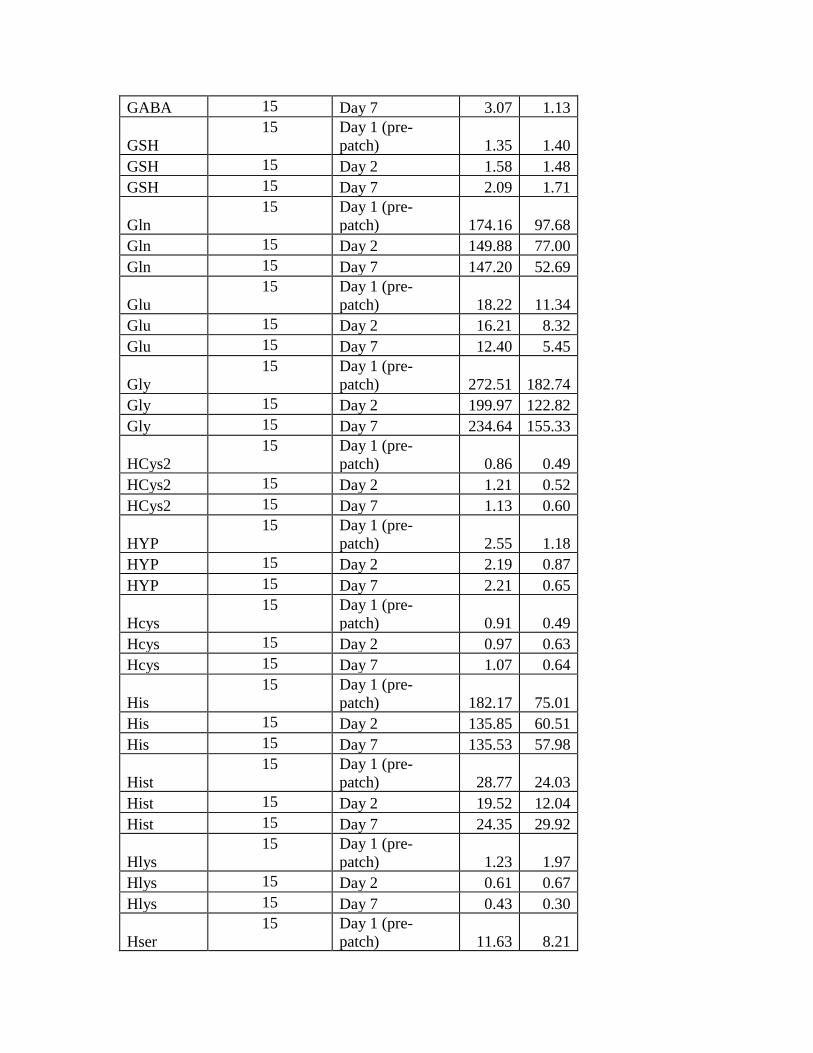
GABA 15 Day 7 3.07 1.13
GSH
15 Day 1 (pre-
patch) 1.35 1.40
GSH 15 Day 2 1.58 1.48
GSH 15 Day 7 2.09 1.71
Gln
15 Day 1 (pre-
patch) 174.16 97.68
Gln 15 Day 2 149.88 77.00
Gln 15 Day 7 147.20 52.69
Glu
15 Day 1 (pre-
patch) 18.22 11.34
Glu 15 Day 2 16.21 8.32
Glu 15 Day 7 12.40 5.45
Gly
15 Day 1 (pre-
patch) 272.51 182.74
Gly 15 Day 2 199.97 122.82
Gly 15 Day 7 234.64 155.33
HCys2
15 Day 1 (pre-
patch) 0.86 0.49
HCys2 15 Day 2 1.21 0.52
HCys2 15 Day 7 1.13 0.60
HYP
15 Day 1 (pre-
patch) 2.55 1.18
HYP 15 Day 2 2.19 0.87
HYP 15 Day 7 2.21 0.65
Hcys
15 Day 1 (pre-
patch) 0.91 0.49
Hcys 15 Day 2 0.97 0.63
Hcys 15 Day 7 1.07 0.64
His
15 Day 1 (pre-
patch) 182.17 75.01
His 15 Day 2 135.85 60.51
His 15 Day 7 135.53 57.98
Hist
15 Day 1 (pre-
patch) 28.77 24.03
Hist 15 Day 2 19.52 12.04
Hist 15 Day 7 24.35 29.92
Hlys
15 Day 1 (pre-
patch) 1.23 1.97
Hlys 15 Day 2 0.61 0.67
Hlys 15 Day 7 0.43 0.30
Hser
15 Day 1 (pre-
patch) 11.63 8.21

Hser 15 Day 2 8.53 6.01
Hser 15 Day 7 9.12 6.65
Ile
15 Day 1 (pre-
patch) 14.10 7.32
Ile 15 Day 2 12.11 4.04
Ile 15 Day 7 11.30 4.75
LDOPA
15 Day 1 (pre-
patch) 21.31 13.72
LDOPA 15 Day 2 23.32 10.67
LDOPA 15 Day 7 22.80 12.70
Leu
15 Day 1 (pre-
patch) 19.98 8.16
Leu 15 Day 2 15.13 4.94
Leu 15 Day 7 17.10 7.83
Lys
15 Day 1 (pre-
patch) 49.09 32.44
Lys 15 Day 2 40.21 29.33
Lys 15 Day 7 41.45 34.56
ME
15 Day 1 (pre-
patch) 23.52 16.61
ME 15 Day 2 19.24 8.73
ME 15 Day 7 17.79 7.79
Met
15 Day 1 (pre-
patch) 7.08 5.74
Met 15 Day 2 6.65 3.93
Met 15 Day 7 6.36 3.88
NE
15 Day 1 (pre-
patch) 26.29 13.51
NE 15 Day 2 25.52 15.95
NE 15 Day 7 36.02 38.37
NE/E
15 Day 1 (pre-
patch) 7.44 6.59
NE/E 15 Day 2 10.35 9.99
NE/E 15 Day 7 12.07 13.78
NorM
15 Day 1 (pre-
patch) 89.67 52.78
NorM 15 Day 2 89.67 41.19
NorM 15 Day 7 76.61 27.62
Orn
15 Day 1 (pre-
patch) 13.57 10.95
Orn 15 Day 2 10.27 7.72
Orn 15 Day 7 11.77 11.33
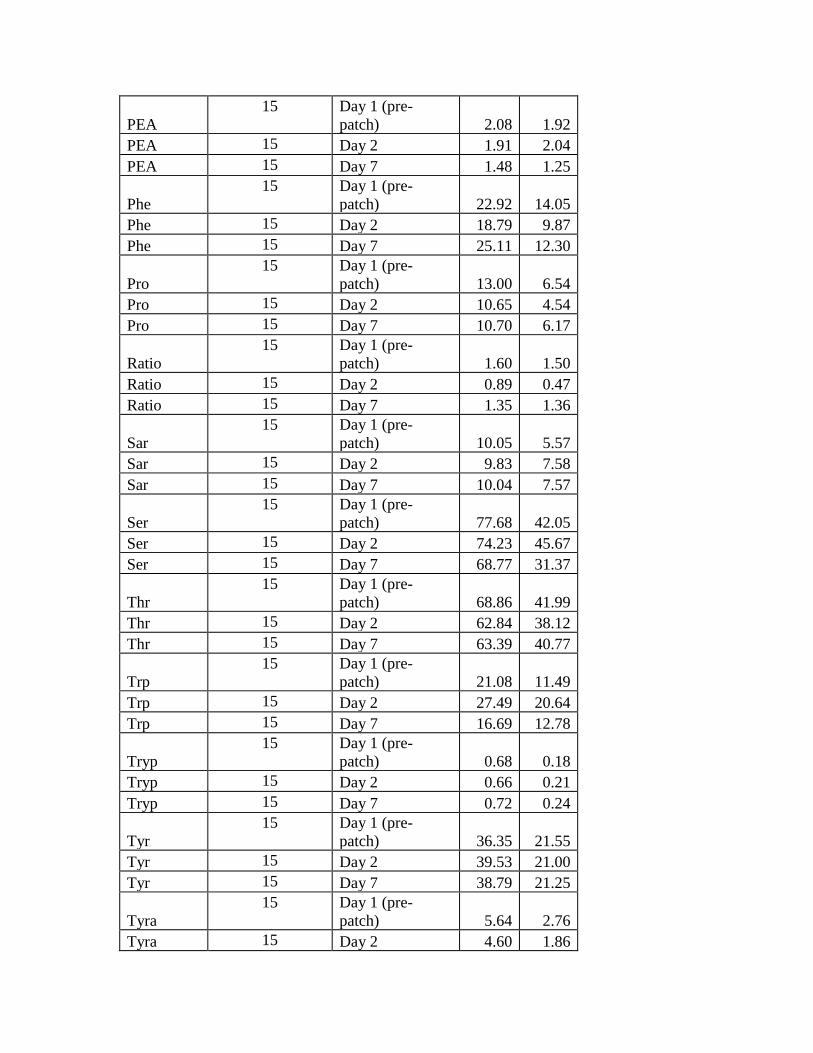
PEA
15 Day 1 (pre-
patch) 2.08 1.92
PEA 15 Day 2 1.91 2.04
PEA 15 Day 7 1.48 1.25
Phe
15 Day 1 (pre-
patch) 22.92 14.05
Phe 15 Day 2 18.79 9.87
Phe 15 Day 7 25.11 12.30
Pro
15 Day 1 (pre-
patch) 13.00 6.54
Pro 15 Day 2 10.65 4.54
Pro 15 Day 7 10.70 6.17
Ratio
15 Day 1 (pre-
patch) 1.60 1.50
Ratio 15 Day 2 0.89 0.47
Ratio 15 Day 7 1.35 1.36
Sar
15 Day 1 (pre-
patch) 10.05 5.57
Sar 15 Day 2 9.83 7.58
Sar 15 Day 7 10.04 7.57
Ser
15 Day 1 (pre-
patch) 77.68 42.05
Ser 15 Day 2 74.23 45.67
Ser 15 Day 7 68.77 31.37
Thr
15 Day 1 (pre-
patch) 68.86 41.99
Thr 15 Day 2 62.84 38.12
Thr 15 Day 7 63.39 40.77
Trp
15 Day 1 (pre-
patch) 21.08 11.49
Trp 15 Day 2 27.49 20.64
Trp 15 Day 7 16.69 12.78
Tryp
15 Day 1 (pre-
patch) 0.68 0.18
Tryp 15 Day 2 0.66 0.21
Tryp 15 Day 7 0.72 0.24
Tyr
15 Day 1 (pre-
patch) 36.35 21.55
Tyr 15 Day 2 39.53 21.00
Tyr 15 Day 7 38.79 21.25
Tyra
15 Day 1 (pre-
patch) 5.64 2.76
Tyra 15 Day 2 4.60 1.86

Tyra 15 Day 7 4.97 2.31
Val
15 Day 1 (pre-
patch) 45.11 41.02
Val 15 Day 2 34.25 24.67
Val 15 Day 7 41.84 28.03
a-amino
15 Day 1 (pre-
patch) 18.79 16.63
a-amino 15 Day 2 15.18 9.86
a-amino 15 Day 7 9.90 5.57
b-aminoiso
15 Day 1 (pre-
patch) 80.13 76.39
b-aminoiso 15 Day 2 98.49 178.48
b-aminoiso 15 Day 7 59.81 51.33
Table 28: Change from day 1 (pre-patch) to day 2, day 2 to day 7, and day 1 (pre-patch) to day 7
Marker Change
Mean
Change SD p-value
2-amino Day 1 to Day 2 1.44 11.94 0.6474
2-amino Day 2 to Day 7 1.44 9.32 0.5585
2-amino Day 1 to Day 7 2.88 12.91 0.4017
3-MT Day 1 to Day 2 -8.47 23.61 0.1862
3-MT Day 2 to Day 7 -3.66 20.89 0.5080
3-MT Day 1 to Day 7 -12.14 29.06 0.1281
5-HT Day 1 to Day 2 4.37 37.33 0.6569
5-HT Day 2 to Day 7 2.47 68.38 0.8908
5-HT Day 1 to Day 7 6.84 63.59 0.6832
5-HT/DA Day 1 to Day 2 -0.18 0.83 0.4202
5-HT/DA Day 2 to Day 7 -0.06 0.68 0.7305
5-HT/DA Day 1 to Day 7 -0.24 0.89 0.3117
5-HTP Day 1 to Day 2 10.48 72.69 0.5852
5-HTP Day 2 to Day 7 -12.80 74.71 0.5176
5-HTP Day 1 to Day 7 -2.32 31.99 0.7830
Ala Day 1 to Day 2 -20.17 36.89 0.0526
Ala Day 2 to Day 7 22.04 55.11 0.1437
Ala Day 1 to Day 7 1.87 64.03 0.9115
Arg Day 1 to Day 2 -0.84 2.32 0.1850
Arg Day 2 to Day 7 2.22 5.27 0.1246
Arg Day 1 to Day 7 1.39 6.37 0.4138
Asn Day 1 to Day 2 -2.51 10.74 0.3802

Asn Day 2 to Day 7 0.49 14.07 0.8942
Asn Day 1 to Day 7 -2.02 16.81 0.6488
Asp Day 1 to Day 2 0.30 2.31 0.6174
Asp Day 2 to Day 7 -0.41 2.88 0.5869
Asp Day 1 to Day 7 -0.11 2.84 0.8830
Bala Day 1 to Day 2 -11.31 27.09 0.1283
Bala Day 2 to Day 7 4.19 21.26 0.4578
Bala Day 1 to Day 7 -7.12 33.99 0.4309
C-C Day 1 to Day 2 0.20 8.83 0.9302
C-C Day 2 to Day 7 3.94 14.15 0.2991
C-C Day 1 to Day 7 4.14 11.81 0.1958
Car Day 1 to Day 2 -4.41 14.24 0.2499
Car Day 2 to Day 7 -0.15 4.45 0.8949
Car Day 1 to Day 7 -4.57 13.87 0.2228
Cit Day 1 to Day 2 0.14 1.39 0.6968
Cit Day 2 to Day 7 0.09 1.29 0.7854
Cit Day 1 to Day 7 0.24 1.61 0.5800
Cre Day 1 to Day 2 40.33 110.05 0.1776
Cre Day 2 to Day 7 -5.67 94.86 0.8204
Cre Day 1 to Day 7 34.67 107.60 0.2326
Cys Day 1 to Day 2 9.12 27.62 0.2215
Cys Day 2 to Day 7 -16.07 23.86 0.0206
Cys Day 1 to Day 7 -6.95 20.99 0.2205
Cys/C-c Day 1 to Day 2 0.35 1.58 0.4053
Cys/C-c Day 2 to Day 7 -0.43 1.77 0.3677
Cys/C-c Day 1 to Day 7 -0.07 0.80 0.7244
Cystathion Day 1 to Day 2 0.88 8.71 0.7009
Cystathion Day 2 to Day 7 -1.28 9.25 0.5989
Cystathion Day 1 to Day 7 -0.40 8.28 0.8533
DA Day 1 to Day 2 -3.28 48.13 0.7954
DA Day 2 to Day 7 9.93 54.17 0.4893
DA Day 1 to Day 7 6.65 65.22 0.6990
E Day 1 to Day 2 -2.09 3.08 0.0197
E Day 2 to Day 7 1.59 2.94 0.0552
E Day 1 to Day 7 -0.51 3.93 0.6264
GABA Day 1 to Day 2 -0.54 1.20 0.1034
GABA Day 2 to Day 7 -0.19 1.20 0.5558
GABA Day 1 to Day 7 -0.73 1.50 0.0818
GSH Day 1 to Day 2 0.23 0.71 0.2262
GSH Day 2 to Day 7 0.51 1.37 0.1737
GSH Day 1 to Day 7 0.74 1.68 0.1099

Gln Day 1 to Day 2 -24.29 69.86 0.1996
Gln Day 2 to Day 7 -2.67 60.13 0.8657
Gln Day 1 to Day 7 -26.96 86.37 0.2467
Glu Day 1 to Day 2 -2.00 6.71 0.2674
Glu Day 2 to Day 7 -3.82 6.73 0.0453
Glu Day 1 to Day 7 -5.82 10.37 0.0475
Gly Day 1 to Day 2 -72.54 117.73 0.0317
Gly Day 2 to Day 7 34.67 107.20 0.2308
Gly Day 1 to Day 7 -37.87 83.70 0.1016
HCys2 Day 1 to Day 2 0.35 0.55 0.0296
HCys2 Day 2 to Day 7 -0.08 0.55 0.5806
HCys2 Day 1 to Day 7 0.27 0.79 0.2125
HYP Day 1 to Day 2 -0.37 1.02 0.1856
HYP Day 2 to Day 7 0.02 0.93 0.9262
HYP Day 1 to Day 7 -0.34 1.31 0.3281
Hcys Day 1 to Day 2 0.06 0.68 0.7225
Hcys Day 2 to Day 7 0.10 0.76 0.6112
Hcys Day 1 to Day 7 0.17 0.66 0.3446
His Day 1 to Day 2 -46.32 75.35 0.0320
His Day 2 to Day 7 -0.33 56.38 0.9824
His Day 1 to Day 7 -46.64 49.35 0.0026
Hist Day 1 to Day 2 -9.24 20.20 0.0981
Hist Day 2 to Day 7 4.82 25.30 0.4724
Hist Day 1 to Day 7 -4.42 18.90 0.3804
Hlys Day 1 to Day 2 -0.62 1.36 0.1000
Hlys Day 2 to Day 7 -0.18 0.43 0.1301
Hlys Day 1 to Day 7 -0.80 1.75 0.0992
Hser Day 1 to Day 2 -3.10 8.41 0.1751
Hser Day 2 to Day 7 0.60 8.42 0.7873
Hser Day 1 to Day 7 -2.50 9.34 0.3169
Ile Day 1 to Day 2 -2.00 5.96 0.2157
Ile Day 2 to Day 7 -0.80 6.14 0.6207
Ile Day 1 to Day 7 -2.80 8.50 0.2232
LDOPA Day 1 to Day 2 2.01 11.54 0.5111
LDOPA Day 2 to Day 7 -0.52 9.83 0.8408
LDOPA Day 1 to Day 7 1.49 10.18 0.5798
Leu Day 1 to Day 2 -4.84 7.84 0.0313
Leu Day 2 to Day 7 1.97 8.21 0.3681
Leu Day 1 to Day 7 -2.87 11.54 0.3515
Lys Day 1 to Day 2 -8.88 32.44 0.3070
Lys Day 2 to Day 7 1.24 30.39 0.8768

Lys Day 1 to Day 7 -7.64 34.89 0.4106
ME Day 1 to Day 2 -4.29 14.51 0.2718
ME Day 2 to Day 7 -1.45 6.17 0.3775
ME Day 1 to Day 7 -5.74 14.29 0.1421
Met Day 1 to Day 2 -0.43 4.04 0.6863
Met Day 2 to Day 7 -0.28 3.88 0.7816
Met Day 1 to Day 7 -0.71 4.61 0.5582
NE Day 1 to Day 2 -0.78 16.15 0.8544
NE Day 2 to Day 7 10.50 44.57 0.3769
NE Day 1 to Day 7 9.72 40.68 0.3702
NE/E Day 1 to Day 2 2.92 6.55 0.1064
NE/E Day 2 to Day 7 1.72 14.81 0.6605
NE/E Day 1 to Day 7 4.63 13.58 0.2074
NorM Day 1 to Day 2 0.00 28.16 0.9996
NorM Day 2 to Day 7 -13.06 23.32 0.0479
NorM Day 1 to Day 7 -13.06 33.37 0.1519
Orn Day 1 to Day 2 -3.30 9.38 0.1949
Orn Day 2 to Day 7 1.50 9.82 0.5632
Orn Day 1 to Day 7 -1.80 7.13 0.3456
PEA Day 1 to Day 2 -0.17 1.16 0.5730
PEA Day 2 to Day 7 -0.42 1.61 0.3262
PEA Day 1 to Day 7 -0.59 1.12 0.0589
Phe Day 1 to Day 2 -4.13 9.28 0.1067
Phe Day 2 to Day 7 6.33 10.94 0.0418
Phe Day 1 to Day 7 2.19 15.37 0.5889
Pro Day 1 to Day 2 -2.35 8.45 0.2989
Pro Day 2 to Day 7 0.05 5.99 0.9747
Pro Day 1 to Day 7 -2.30 8.15 0.2921
Ratio Day 1 to Day 2 -0.71 1.40 0.0700
Ratio Day 2 to Day 7 0.46 1.25 0.1782
Ratio Day 1 to Day 7 -0.25 1.32 0.4732
Sar Day 1 to Day 2 -0.22 6.88 0.9038
Sar Day 2 to Day 7 0.22 3.86 0.8301
Sar Day 1 to Day 7 0.00 5.17 0.9996
Ser Day 1 to Day 2 -3.44 49.51 0.7915
Ser Day 2 to Day 7 -5.47 31.29 0.5096
Ser Day 1 to Day 7 -8.91 38.25 0.3821
Thr Day 1 to Day 2 -6.02 41.35 0.5819
Thr Day 2 to Day 7 0.55 37.91 0.9563
Thr Day 1 to Day 7 -5.47 29.80 0.4887
Trp Day 1 to Day 2 6.41 21.61 0.2699

Trp Day 2 to Day 7 -10.81 18.55 0.0406
Trp Day 1 to Day 7 -4.40 17.07 0.3355
Tryp Day 1 to Day 2 -0.03 0.15 0.5022
Tryp Day 2 to Day 7 0.06 0.20 0.2341
Tryp Day 1 to Day 7 0.04 0.26 0.5873
Tyr Day 1 to Day 2 3.19 12.77 0.3503
Tyr Day 2 to Day 7 -0.75 12.29 0.8175
Tyr Day 1 to Day 7 2.44 12.23 0.4527
Tyra Day 1 to Day 2 -1.04 3.18 0.2259
Tyra Day 2 to Day 7 0.37 2.36 0.5546
Tyra Day 1 to Day 7 -0.67 2.96 0.3963
Val Day 1 to Day 2 -10.85 24.39 0.1068
Val Day 2 to Day 7 7.58 31.90 0.3728
Val Day 1 to Day 7 -3.27 43.87 0.7772
a-amino Day 1 to Day 2 -3.61 9.26 0.1534
a-amino Day 2 to Day 7 -5.29 7.79 0.0198
a-amino Day 1 to Day 7 -8.90 13.79 0.0256
b-aminoiso Day 1 to Day 2 18.36 177.75 0.6952
b-aminoiso Day 2 to Day 7 -38.68 150.08 0.3351
b-aminoiso Day 1 to Day 7 -20.32 51.24 0.1468
GHK- CU Study – Cortisol and DHEAS
Table 1: Summary statistics for AUC of Cortisol and DHEAS, stratified by assessment time point
........................................................................................................................................................ 54
Table 2: Change from R1 to R2, R2 to R3 and R1 to R3 .................................................................. 54
Study Design: Single arm study with 3 assessment time points.
Sample Size: N=15
Statistical Methods: Cortisol levels were obtained at 8am, 12pm, 4pm, 8pm and 12am.
DHEAS levels were collected at 8am, 8pm and 12am. The area under the curve (AUC)
for Cortisol and DHEAS levels over the data collection periods were calculated using the
trapezoid rule. AUC levels were summarized in terms of means and standard deviations,
stratified by assessment time point. Changes between assessment time points were
evaluated using a paired t-test or Wilcoxon signed rank test.

Table 29: Summary statistics for AUC of Cortisol and DHEAS, stratified by assessment time point
Marker
Assessment
Time point
Mean
AUC SD
Cortisol R1 (pre-patch) 109.1 36.9
Cortisol R2 120.6 28.4
Cortisol R3 141.7 76.4
DHEAS R1 (pre-patch) 178,2 154,5
DHEAS R2 180.7 117.7
DHEAS R3 291.0 378.4
Table 30: Change from R1 to R2, R2 to R3 and R1 to R3
Marker Change
Mean
Change in
AUC SD p-value
Cortisol R1 to R2 11.5 41.9 0.7615
R2 to R3 21.1 90.2 0.9780
R1 to R3 32.6 87.9 0.2769
DHEAS R1 to R2 1.2 97.7 0.7148
R2 to R3 111.6 362.6 0.7609
R1 to R3 112.8 345.7 0.5016
There are no significant changes in Cortisol or DHEAS levels between assessment time
points.

Appendix B: Graphs of Amino Acids Showing Significance
You will note that Glycine and Glutamate which are used in the process to form
Glutathione both showed a drop off at a level of significance. Gluthione is part of the
reduction of inflammation pathway in a unique aspect. It specifically acts from the liver
to detoxify the blood. So for example it clears heavy metals from the body rather than
acting as an anti-inflammatory agent directly. A decrease in the materials that produce the
glutathione means that more glutathione is being made. This results in higher availability
of the glutathione in the blood. This allows the body to clear more material which is
damaging to the body faster.
Each of the graphs presented below are Box-Whisker plots for the changes in the
various lab parameter values from baseline. The middle line represents the median
change; the lower and upper lines of the box represent the 25th and 75th percentiles.


Appendix C: General Study Protocol
1. IRB submission
2. IRB approval
3. Distribute flyers and email announcements
4. Begin recruiting as people call in for study information
5. Schedule participants that meet inclusion and exclusion criterion
6. Consent a participant and administer baseline questionnaires, metabolic tests and
baseline physiology test.
7. Schedule participant for next am and issue one patch for application 8 am.
8. Call participant to confirm patch application.
9. Meet participant at laboratory for initial testing at 9:00 am
a. First salivary swab
b. Physiology suite testing
c. Memory test part 1
d. 10 am urine
e. Questionnaires
f. Memory test part 2
10. Schedule for next day and issue salivary kit and patch for next morning
11. Call and confirm salivary test and patch application 8 am
12. Repeat 9a-f
13. Issue salivary kit and 5 patches and remind participant to freeze salivary samples
or bring them in the next morning if local.
14. The 6th night of study period, call and remind participant of appointment. Remind
them to bring salivary kit.
15. Repeat 9 a-f. Issue new salivary kit. Receive participant’s second salivary kit.
16. Arrange for participant to deliver salivary kit the next day.

17. Ship kits and urines received once a week to Sabre Sciences.
18. Do ongoing data entry of physiology data and questionnaire data to maximize
study turn around.
19. When study is complete email spreadsheets to statistics analysis.
20. Receive analysis and submit report.
Appendix D: Study Team
Dr. Melinda H. Connor, D.D., Ph.D., AMP, FAM: PI
Dr. Melinda Connor, has trained as a clinical psychologist, neuropsychologist, and is board certified in alternative medicine and a Fellow of the American Alternative Medicine Association. Dr. Connor holds an A.A. in Humanities from Harvard University, a B.A. in Theatre and English from Wellesley College. Her training includes master’s degrees from programs at University of San Francisco and American Public University and a Ph.D. in clinical psychology from California Coast University with a one-year rotation in neuropsychology. As a National Institutes of Health T-32 post-doctoral fellow, Dr. Connor received her training as a research scientist at the University of Arizona under Dr. Andrew Weil and Dr. Iris Bell and was director of the Optimal Healing Research Program at the Laboratory for Advances in Consciousness and Health under Dr. Gary E. Schwartz. Dr. Connor is currently the CEO of Earthsongs Holistic Consulting and holds faculty positions at several universities. Dr. Connor has a research laboratory in Arizona and is the author of ten books.
Dr. Caitlin C. Connor, MAcOM, DAOM: Co-I
Dr. Caitlin Connor holds a bachelors degree from Mount Holyoke College with a
dual focus in political science and anthropology, a master’s degree in acupuncture and
oriental medicine from Arizona School of Acupuncture and Oriental Medicine and a
doctorate in Acupuncture and Oriental Medicine from California Institute for Integral
Studies/American College of Traditional Chinese Medicine. Dr. Connor’s research
training began in high school in a special program at the University of Arizona where she
was mentored by Dr. Gary Schwartz at the Laboratory for the Advancement in
Consciousness and Health in the Department of Psychology. Dr. Connor was the
ISSSEEM 2011 gold medal winner of the Rustum Roy Emerging Scientist Award for
undergraduates, a 2014 Bernard Grad Emerging Scientist silver medal winner for
graduate students and a 2018 Patricia Norris Award gold medal winner. Dr. Connor is

currently doing additional research training at University of Oxford, UK and commuting
between countries.
Dr. Naran Gombosuren, Ph.D.: Metabolic Analysis
Dr. Naran Gombosuren, Ph.D., is technical director and lead research scientist at
Sabre Sciences Laboratory/EndoSciences in Carlsbad, CA. Originally from Mongolia and
trained in Hungary, Dr. Gomobsuren received her Ph.D. from Eotvos University in
Budapest. Dr. Gombosuren has worked with such prestigious groups as Scripps Research
Institute and Sanford-Burnham Prebys Medical Discovery Institute. A specialist in
complex metabolic process Dr. Gombosuren has participated in studies with topics
ranging from virology to gut-brain interactions.
Dr. Jens Eickhoff, Ph.D: Statistics
Dr. Jens Eickhoff earned his Ph.D. in 2002 in statistics from Iowa State
University. He is a senior scientist in the Department of Biostatistics and Medical
Informatics at University of Wisconsin Madison where he teaches Biostatistics. A
specialist in complex research statistics he has participated in studies ranging from
oncology to endocrinology and published extensively on bio-statistical modeling.