metabolic engineering -...
TRANSCRIPT

1
Metabolic Engineering
Department of Bioinformatic Engineering,Graduate School of Information Science and Technology,
Osaka University
Dr. Hiroshi Shimizu Professor
SubjectsIntroduction of Metabolic Engineering (4/14)Metabolic Pathway (MP) Modeling and Observability of MP (4/21)Metabolic Flux Analysis (cell capability analysis) (5/12)Experimental Determination Method of Flux Distribution with Isotope Labeling(5/19)Metabolic Control Analysis (5/26)Metabolic Engineering with Bioinformatics (6/2)
April 14th – June 2nd, 2004
Lactate
rF
rLAC=85
Answer 5r1:Gluc+2ADP+2NAD=2PYR+2ATP+2NADH
⎥⎥⎥⎥⎥⎥⎥⎥⎥⎥⎥
⎦
⎤
⎢⎢⎢⎢⎢⎢⎢⎢⎢⎢⎢
⎣
⎡
=
⎥⎥⎥⎥⎥⎥⎥⎥
⎦
⎤
⎢⎢⎢⎢⎢⎢⎢⎢
⎣
⎡
⎥⎥⎥⎥⎥⎥⎥⎥⎥⎥⎥
⎦
⎤
⎢⎢⎢⎢⎢⎢⎢⎢⎢⎢⎢
⎣
⎡
−−−−
−−−
70552285
100000
654321
100000010000000100000010000001200112111100
001112
rrrrrr
ArC=rm
rC=[ATA]-1ATrm
Pyruvate
Formate
NADH NAD
Acetyl-CoA
NADH
NAD
CO2NADH
NAD
Acetyl-P
Acetate
ADP
ATP
rAc=55
NADH
NAD
rGluc=100
rCO2=22
r1=101.8
r2=84.1
r3=21.1
r4=100.2
r5=53.2 r6=70.0
rEtOH=70
Acetaldehyde
⎥⎥⎥⎥⎥⎥⎥⎥
⎦
⎤
⎢⎢⎢⎢⎢⎢⎢⎢
⎣
⎡
==
⎥⎥⎥⎥⎥⎥⎥⎥
⎦
⎤
⎢⎢⎢⎢⎢⎢⎢⎢
⎣
⎡
−
0.702.532.1001.211.848.101
)(
654321
1m
TT rAAA
rrrrrr
Fig. Metabolism from glucose in homo- and hetero-fermentativeLactococci.
Function of ExcelTRANSPOSE : transpose of matrixMINVERSE: inverse of matrixMMULTI: multiplication of matrix

2
Lactate
Acetaldehyde
Ethanol
rF
rLAC
rEtOH
Answer 5Balance eq. of pyruvate
2r1-r2-r3-r4=0Balance eq. of AcCoA
r3+r4-r5-r6=0Balance eq. of NAD/NADH
2r1-r2+r3-2r6=0Glucose consumption rate
r1=rGluc=100r2=rL=85r3=rCO2=22r5=rAc=55r6=rEtOH=70
Pyruvate
Formate
NADH NAD
Acetyl-CoA
NADH
NAD
CO2NADH
NAD
Acetyl-P
Acetate
ADP
ATP
rAc
NADH
NAD
rGluc
rCO2
r1
r2
r3 r4
r5 r6
r1:Gluc+2ADP+2NAD=2PYR+2ATP+2NADH
⎥⎥⎥⎥⎥⎥⎥⎥⎥⎥⎥
⎦
⎤
⎢⎢⎢⎢⎢⎢⎢⎢⎢⎢⎢
⎣
⎡
=
⎥⎥⎥⎥⎥⎥⎥⎥
⎦
⎤
⎢⎢⎢⎢⎢⎢⎢⎢
⎣
⎡
⎥⎥⎥⎥⎥⎥⎥⎥⎥⎥⎥
⎦
⎤
⎢⎢⎢⎢⎢⎢⎢⎢⎢⎢⎢
⎣
⎡
−−−−
−−−
70552285
100000
654321
100000010000000100000010000001200112111100
001112
rrrrrr
To be continued
Fig. Metabolism from glucose in homo- and hetero-fermentativeLactococci.
Gluc
Gluc6P
Fruc6P
GAP
G3P
PEP
AcCoA
IcCyt
AKG
SucCoASuc
Fum
Mal
OxA
Ribu5P
Pyr
AcCoA
GlyOx
EtOH
AC
42
12
14
14
11
8
129
5858
91
66
79
81
94
7
0
6
13
0
0
Metabolic Flux Distribution Analysis
Analysis of distribution of reaction rates in metabolic pathway
Use of information of stoichiometry of the cell and measurements
Many applicationsUnderstanding cell physiologyProcess operationMolecular breeding
3
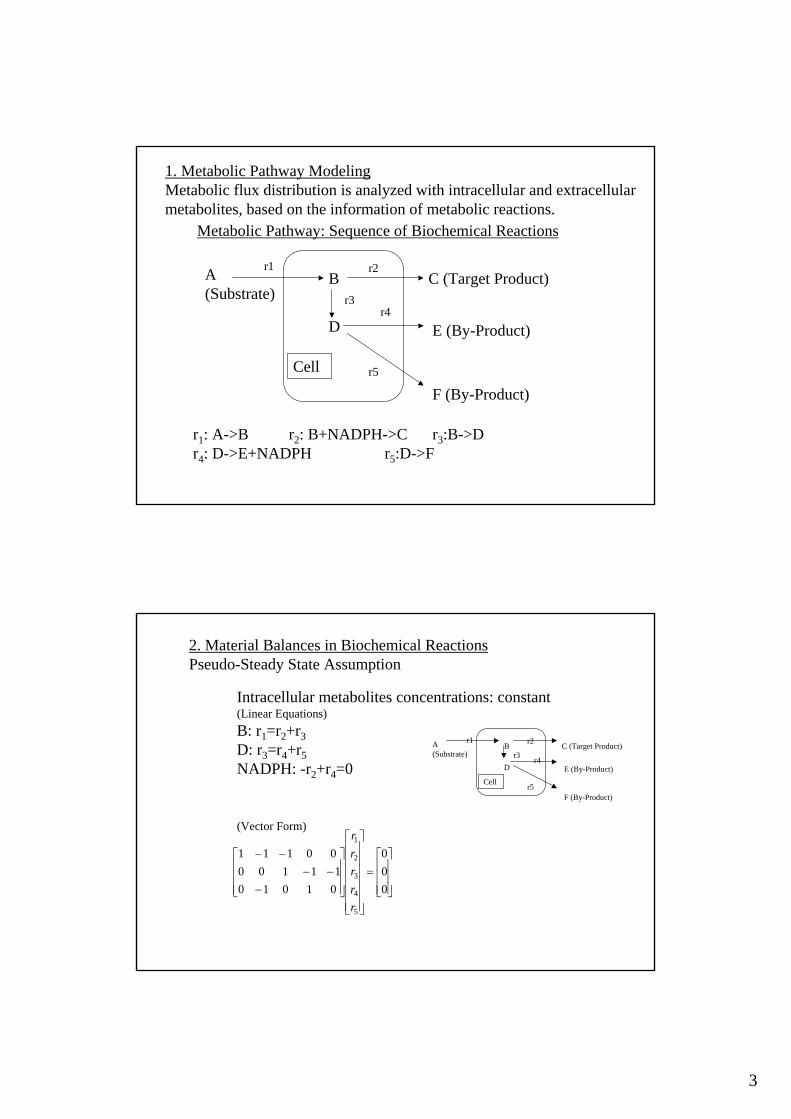
1. Metabolic Pathway ModelingMetabolic flux distribution is analyzed with intracellular and extracellular metabolites, based on the information of metabolic reactions.
Metabolic Pathway: Sequence of Biochemical Reactions
A(Substrate)
B C (Target Product)
D E (By-Product)
F (By-Product)
Cell
r1 r2
r3r4
r5
r1: A->B r2: B+NADPH->C r3:B->Dr4: D->E+NADPH r5:D->F
2. Material Balances in Biochemical ReactionsPseudo-Steady State Assumption
Intracellular metabolites concentrations: constant(Linear Equations)B: r1=r2+r3D: r3=r4+r5NADPH: -r2+r4=0
⎥⎥⎥
⎦
⎤
⎢⎢⎢
⎣
⎡=
⎥⎥⎥⎥⎥⎥
⎦
⎤
⎢⎢⎢⎢⎢⎢
⎣
⎡
⎥⎥⎥
⎦
⎤
⎢⎢⎢
⎣
⎡
−−−
−−
000
0101011100
00111
5
4
3
2
1
rrrrr
(Vector Form)
A(Substrate)
B C (Target Product)
D E (By-Product)
F (By-Product)
Cell
r1 r2
r3 r4
r5

4
3. Observability of Metabolic Pathway(Category of System)
(1)Determined System: d=0Metabolic fluxes are uniquely determined by measured fluxes.
(2) Over-determined System: d<0Metabolic fluxes are determined with redundancy.
(3) Under-determined System: d>0Metabolic fluxes cannot be determined uniquely.
Degree of Freedom of the Metabolic Pathway:dd=k-n-mWhere k: number of unknown fluxes
n: number of balance equations (constraints)m: number of measured fluxes
(3-3) Under-Determined System (Cell Capability Analysis)Number of unknown fluxes:5, Number of balance eq.: 3Number of measured fluxe:1 (d=1)(ex.) rA: consumption rate of substrate
⎥⎥⎥⎥
⎦
⎤
⎢⎢⎢⎢
⎣
⎡
=
⎥⎥⎥⎥⎥⎥
⎦
⎤
⎢⎢⎢⎢⎢⎢
⎣
⎡
⎥⎥⎥⎥
⎦
⎤
⎢⎢⎢⎢
⎣
⎡
−−−
−−
Arrrrrr
000
000010101011100
00111
5
4
3
2
1
ArC=rm
Linear Programming
A(Substrate)
B C (Target Product)
D E (By-Product)
F (By-Product)
Cell
r1 r2
r3 r4
r5
100 50
50
0
r4: necessary to regenerateNADPH
deleted based on copyright concern.
Palsson et al;Biotech Bioeng 42, 59-73(1993)

5
(3) Under-Determined System (2)Number of unknown fluxes:5, Number of balance eq.: 3Number of measured fluxe:1 (d=1)(ex.) rA: consumption rate of substrate
A(Substrate)
B C (Target Product)
D E (By-Product)
F (By-Product)
Cell
r1 r2
r3 r4
r5
100 50
50
0
r4: necessary to regenerateNADPH
r3=r1-r2r1-r2=r4+r5r2=r1-r4-r5…(relationship ex. metabolites)
=r1-r5-r22r2=r1-r5r2=1/2r1…(r5=0)….Max Yield(r3=1/2r1, r4=1/2r1, (r1=rA))
⎥⎥⎥⎥
⎦
⎤
⎢⎢⎢⎢
⎣
⎡
=
⎥⎥⎥⎥⎥⎥
⎦
⎤
⎢⎢⎢⎢⎢⎢
⎣
⎡
⎥⎥⎥⎥
⎦
⎤
⎢⎢⎢⎢
⎣
⎡
−−−
−−
Arrrrrr
000
000010101011100
00111
5
4
3
2
1
Question 6In hetero-fermentative metabolism, determine all the ri fluxes so that ethanol production was maximized.
r1:Gluc+2ADP+2NAD=2PYR+2ATP+2NADH
Lactate
rF
rLAC
Pyruvate
Formate
NADH NAD
Acetyl-CoA
NADH
NAD
CO2NADH
NAD
Acetyl-P
Acetate
ADP
ATP
rAc
NADH
NAD
rGluc=100
rCO2
r1=100
r2
r3
r4
r5 r6
rEtOH ↓(Max)
Acetaldehyde
Fig. Metabolism from glucose in homo- and hetero-fermentativeLactococci.

6
Lactate
Acetaldehyde
Ethanol
rF
rLAC
rEtOH
Pyruvate
Formate
NADH NAD
Acetyl-CoA
NADH
NAD
CO2NADH
NAD
Acetyl-P
Acetate
ADP
ATP
rAc
NADH
NAD
rGluc
rCO2
r1
r2
r3 r4
r5 r6
Stoichiometric Equations
r1:Gluc+2ADP+2NAD=2PYR+2ATP+2NADH
r2:PYR+NADH=LAC
r3: PYR=AceCoA+NADH+CO2
r4: PYR=FOR+AcCoA
r5:AcCoA=Ac+ATP
r6: AcCoA+2NADH=EtOHFig. Metabolism from glucose in homo- and hetero-fermentativeLactococci.
Question 6In hetero-fermentative metabolism, determine all the ri fluxes so that ethanol production was maximized.
r1:Gluc+2ADP+2NAD=2PYR+2ATP+2NADH
2-1 Balance eq. of pyruvate2r1-r2-r3-r4=0
2-2 Balance eq. of AcCoAr3+r4-r5-r6=0
2-3 Balance eq. of NAD/NADH 2r1-r2+r3-2r6=0
Pyruvate
Formate
NADH NAD
Acetyl-CoA
NADH
NAD
CO2NADH
NAD
Acetyl-P
Acetate
ADP
ATP
rAc
NADH
NAD
rGluc
rCO2
r1
r2
r3 r4
r5 r6
rEtOH
Fig. Metabolism from glucose in homo- and hetero-fermentativeLactococci.
Question 6In hetero-fermentative metabolism, determine all the ri fluxes so that ethanol production was maximized.

7
Answer 6In heterofermentative metabolism, determine all the ri fluxes such that
rEtOH->max
when rGluc=100
Balance eq. of pyruvate2r1-r2-r3-r4=0
Balance eq. of AcCoAr3+r4-r5-r6=0
Balance eq. of NAD/NADH 2r1-r2+r3-2r6=0
Glucose consumption rater1=rGluc=100
r2=0, r4=0, r5=0
r1=100, r3=200, r6=200
r1:Gluc+2ADP+2NAD=2PYR+2ATP+2NADH
Lactate
rF
rLAC
Pyruvate
Formate
NADH NAD
Acetyl-CoA
NADH
NAD
CO2NADH
NAD
Acetyl-P
Acetate
ADP
ATP
rAc
NADH
NAD
rGluc=100
rCO2
r1=100
r2=0
r3=200
r4=0
r5=0 r6=200
rEtOH=200(Max)
Acetaldehyde
Fig. Metabolism from glucose in homo- and hetero-fermentativeLactococci.
Schematic Representation of Genomically Metabolic Models(Edward and Palsson, Biotechnol. Bioeng., 58, 162-169 (1998)
Application of Metabolic Flux Analysis 1
deleted based on copyright concern.

8
Application of Metabolic Flux Analysis 2
Physiological State Recognition* Application MFA to Process Operation* Comparison of MFD among several strains (MCA)
Simulation and in silico Analysis* Prediction of Cell Capability in Genetic Modification* Prediction of Redundancy and Robustness of the Cell
against Gene Deletion *Adaptation of Cell against Environmental Changes
Metabolic Pathway Analysis of a Recombinant YeastsFor Rational Strain DevelopmentR. Carison, D. Fell, F. Srienc, Biotechnol Bioeng. 79(2), 121-134 (2002)
Elementary mode analysisConvex analysis to identify all possible unique
nondecomposable biochemical pathways for a steady state-> Independent pathway in MP
Range Azero
Kernel A
k-dimension space
k-(n+m)
dim A=(n+m)n: constraintm: measurement

9
Material Balances in Biochemical ReactionsPseudo-Steady State Assumption
Intracellular metabolites concentrations: constant(Linear Equations)B: r1=r2+r3D: r3=r4+r5NADPH: -r2+r4=0
⎥⎥⎥
⎦
⎤
⎢⎢⎢
⎣
⎡=
⎥⎥⎥⎥⎥⎥
⎦
⎤
⎢⎢⎢⎢⎢⎢
⎣
⎡
⎥⎥⎥
⎦
⎤
⎢⎢⎢
⎣
⎡
−−−
−−
000
0101011100
00111
5
4
3
2
1
rrrrr
(Vector Form)
A(Substrate)
B C (Target Product)
D E (By-Product)
F (By-Product)
Cell
r1 r2
r3 r4
r5
dim A=3
A
Dimension of biochemical space: 5
dim(Kernel A)=2
Independent Biochemical ReactionsAt Steady State Assumption
A(Substrate)
B C (Target Product)
D E (By-Product)
F (By-Product)
Cell
r1 r2
r3 r4
r5
dim(Kernel A)=2
r1: A->B r2: B+NADPH->C r3:B->Dr4: D->E+NADPH r5:D->F
A B B E+NADPH (Eliminate D)
B F(Eliminate D)
(r1)
(r3, r5)
( r3, r4)
B+NADPH->C(r2)
Step 1
Step 2
A B B F(r1) (r3, r5)
2B->E+C (Eliminate NADPH)(r2, r3. r4)
Step 32A->E+C (Eliminate B) A F(Eliminate B)
Mavrobouniotis et al., BB, 36, 1119-1132 (1990)
(r1, r3, r5)(2r1, r2, r3. r4)

10
Metabolic Pathway of Saccharomyces cerevisiae
Rational Strain Development for PHB
PHB pathway (Ralstonia eutropha)
PHB pathway (Ralstonia eutropha) phbA: 2AceCOA_cyt=AcAcCoA +CoAphbB: AcAcCoA+NADPH=hBCoA+NADPpHBC:hBCoA=PHB+CoA_cyt
Requirement to enhance PHB synthesis1. Supply of AceCoA(ATP Regeneration)
Acetate_cyt+CoA_cyt+2ATP_cyt=AceCoA_cyt2. Regeneration of NADPH
AcAcCoA+NADPH=hBCoA+NADP3. Recovery of C-Source
deleted based on copyright concern.unspecified quotation.

11
1. Supply of ATPNADH produced in TCA and oxidative phosphorelation
2. Regenerate of NADPH(ICD_Cyt(NADPH dependent))AcAcCoA+NADPH=hBCoA+NADPR74: IC_cyt=AKG_cyt+NADPH (selected)IC_mit=AKG_mit +NADH
MAX Yield of PHB: 67%
1. Supply of ATPACL : CIT_cyt+ATP+CoA_cyt=AceCoA_cyt+OXA_cyt(Selected)Acetate_cyt+CoA_cyt+2ATP_cyt=AceCoA_cyt
2. Regenerate of NADPH(ICD_Cyt(NADPH dependent))AcAcCoA+NADPH=hBCoA+NADPR66:AceAde_cyt=Acetate_cyt+ NADPH (selected)
MAX Yield of PHB: 83%
deleted based on copyright concern.unspecified quotation.
deleted based on copyright concern.unspecified quotation.

12
Supply of ATPACL : CIT_cyt+ATP+CoA_cyt=
AceCoA_cyt+OXA_cyt(Selected)Regenerate of NADPH(ICD_Cyt(NADPH
dependent))AcAcCoA+NADPH=hBCoA+NADPR66:NADH+NADP=NAD+NADPH (selected)Glycerol_P=DHAP+NADH
MAX Yield of PHB: 83%
deleted based on copyright concern.unspecified quotation.
deleted based on copyright concern.unspecified quotation.

13
Gluc
Gluc6P
Fruc6P
GAP
G3P
PEP
AcCoA
IcCyt
AKG
SucCoASuc
Fum
Mal
OxA
Ribu5P
Pyr
AcCoA
GlyOx
EtOH
AC
0
29
25
26
29
8
179
100100
70
50
113
115
179
6
0
32
64
0
39
Gluc
Gluc6P
Fruc6P
GAP
G3P
PEP
AcCoA
IcCyt
AKG
SucCoASuc
Fum
Mal
OxA
Ribu5P
Pyr
AcCoA
GlyOx
EtOH
AC
42
12
14
14
11
8
129
5858
91
66
79
81
94
7
0
6
13
0
0
Gluc
Gluc6P
Fruc6P
GAP
G3P
PEP
AcCoA
IcCyt
AKG
SucCoASuc
Fum
Mal
OxA
Ribu5P
Pyr
AcCoA
GlyOx
EtOH
AC
100
50
66
69
63
30
64
00
53
36
35
36
38
23
10
0
0
13
(a) Glucose:100% (b)Glucose:42%, EtOH: 58% (c)EtOH:100%
338
Example 3 Flux distribution to maximize ATP formation in S. cerevisiae with different carbon sources. van Gulik, W.M. and Heijnen, J.J. Biotechnol.Bioeng., 48, 681-698 (1995)
Relationship between specific growth rate andby-product formation rate with limited oxygen supplyin E. coli fermentation (Palsson et al. AEM, 59, 2465 (1993)
deleted based on copyright concern.

14
Metabolic flux change in the case of limited oxygen supply in E. coli fermentation (Palsson et al. AEM, 59, 2465 (1993)
(a): anaerobic↓
(e): aerobic
Schematic Representation of Genomically Metabolic Models(Edward and Palsson, Biotechnol. Bioeng., 58, 162-169 (1998)
deleted based on copyright concern.
deleted based on copyright concern.

15
Glucose ( extracellular)
r g Glucose ( intracellular)
r 1 Glucose-6-phosphate r 2
Fructose-6-phosphate r 6
r 3
r 10 Glyceraldehyde-3-phosphate r 4 3CO 2CO 2 3-Phosphoglycerate r 5 PhosphoenolpyruvateGlycine r 8 Acetate CO 2 r9 (intracellular) r 13
Histidine BiomassAcetate
3 CO 2 TCA ( extracellular)
r7
ATP ADP NADH 2 NAD+ATP r 11 r 12
ATP consumptionfor cell maintenance
AnabolismHistidine
production
rA
Fig.1 Simplified model of histidine production by B. flavum. H. Shimizu et al.
Acetyl-CoA
I II III IVHigh GlucoseHigh AcetateHighUracil
High Glucose
Low Uracil
Time(h)
012345
Ace
tate
(g/L
)G
luco
se(g
/L)
Ura
cil(g
/L)
Bio
mas
s(g/
L)H
istid
ine(
g/L)
2 03 04 05 06 0
00 . 0 20 . 0 40 . 0 60 . 0 8
0 . 1
0
5
1 0
0 1 2 2 4 3 6 4 8012345
Acetate depletion
Uracil depletion
Phase
Fig. 2 Time course of L-histidine production in mixed substrate culture.H. Shimizu et al

16
0
2 0
4 0
6 0
0
2
4
6
0 3 0 6 0 9 0 1 2 001234
Glu
cose
(g/L
)B
iom
ass(
g/L
)H
istid
ine(
g/L
)T i m e ( h )
Fig. 3 Time course of L-histidine production in a glucose culture (a) and acetate culture (b).Hiroshi Shimizu et al.
0123456
0
0 . 5
1
1 . 5
0 1 5 3 0 4 5 6 0 7 500 . 0 10 . 0 20 . 0 30 . 0 40 . 0 5
Ace
tate
(g/L
)B
iom
ass(
g/L
)H
istid
ine(
g/L
)
T i m e ( h )
(a)
(b)
34/414.8/15
Fig. 4a Metabolic flux distribution in mixed substrate culture (Phase I/Phase III).Numbers indicate mole fluxes of metabolic pathways.Fluxes are normalized by total consumption rate of glucose and acetate as 100.Hiroshi Shimizu et al.
Glucose(extracellular)
r g
Glucose(intracellular)
r 1Glucose -6 -phosphate
r 2
Fruc tose -6 - phosphate r 6
r 3
r 10 Glyceraldehyde -3 -phosph ate
r 4 3CO 2
CO 2 3 -Phosphoglycerate
r 5Phosphoenolpyruvate
Glycine
r 8 AcetateCO 2 r 9 (intracellular) r 13
Histidine Biomass
Acetate3 CO 2 (extracellular)
r 7
ATP ADP NADH 2 NAD+ATPr 11 r 12
34/99
Phase I / III
-12/4.6
0 /20
6.4/47
1.9/605.7/13
33/ 0
66/ 0
29/84
540/1195
34/100
123/228
TCA

17
Fig. 4b Metabolic flux distribution in glucose culture. Hiroshi Shimizu et al.
Glucose(extracellular)
r g
Glucose(intracellular)
r 1Glucose -6 -phosphate
r 2
Fruc tose -6 - phosphate r 6
r 3
r 10 Glyceraldehyde -3 -phosp hate
r 4 3CO 2
CO 2 3 -Phosphoglycerate
r 5Phosphoenolpyruvate
Glycine
r 8 AcetateCO 2 r 9 (intracellular) r 13
Histidine Biomass
Acetate3 CO 2 (extracellular)
r 7
ATP ADP NADH 2 NAD+ATPr 11 r 12
Glucose cultivation
99
41
44
8997
7.4
0
103
282
0
100
1711
274.3
TCA
Fig.4 c Metabolic flux distribution in acetate culture. Hiroshi Shimizu et al.
Acetate cultivation
Glucose (extracellular)
rg Glucose (intracellular)
r1 Glucose-6-phosphate r2 Fructose-6-phosphate r6 r3 r10 Glyceraldehyde-3-phosphate r4 3CO2 CO2 3-Phosphoglycerate r5 Phosphoenolpyruvate Glycine r8 Acetate CO2 r9 (intracellular) r13 Histidine Biomass Acetate 3CO2 (extracellular) r7 ATP ADP NADH2 NAD+ATP r11 r12
-0.34
-17
-17
-34-36
1.8
110.54100
49
9.5
0
7172
TCA

18
Fig.3 Shimizu
Maintenance
Cell Histidine
Glucose (100%)
MaintenanceCell Histidine
Acetate (100%)
66x0.85%
9.7 %8.2 %57%34% 4.7%85%
Glucose (34%) Acetate (66%)
HistidineCell
Maintenance
34x0.57%34x 0.34%
66x0.047%
34x0.082%
66x0.097%
Glucose culture
Mixed substrate culture
Acetate culture
(a) (b)
(c)