metabolic differences in the steatosis induced by a high...
TRANSCRIPT

Advances in Biochemistry 2015; 3(6): 86-95 Published online December 9, 2015 (http://www.sciencepublishinggroup.com/j/ab) doi: 10.11648/j.ab.20150306.14 ISSN: 2329-0870 (Print); ISSN: 2329-0862 (Online)
Metabolic Differences in the Steatosis Induced by a High-Fat Diet and High-Protein-Fat Diet in Rats
Daphne Santoro Leonardi-Carvalho1, Sergio Zucoloto
1, Paula Payão Ovidio
2, Renato Heidor
3,
Thomas Prates Ong3, Fernando Salvador Moreno
3, Alceu Afonso Jordao
2, *
1Department of Pathology, Faculty of Medicine de Ribeirão Preto, University of São Paulo, Avenida Bandeirantes, Ribeirão Preto-SP, Brasil 2Department of Internal Medicine, Faculty of Medicine of Ribeirão Preto, University of São Paulo, Avenida Bandeirantes, Ribeirão Preto-SP,
Brasil 3Department of Food, Faculty of Pharmaceutical Science, University of São Paulo, Avenida Prof. Lineu Prestes, São Paulo-SP, Brasil
Email address: [email protected] (A. A. Jordao)
To cite this article: Daphne Santoro Leonardi-Carvalho, Sergio Zucoloto, Paula Payão Ovidio, Renato Heidor, Thomas Prates Ong, Fernando Salvador Moreno, Alceu Afonso Jordao. Metabolic Differences in the Steatosis Induced by a High-Fat Diet and High-Protein-Fat Diet in Rats. Advances in
Biochemistry. Vol. 3, No. 6, 2015, pp. 86-95. doi: 10.11648/j.ab.20150306.14
Abstract: The study aim was to evaluate some effects of a high-fat diet and a high-protein-fat diet in the hepatic steatosis development in rats. Twenty nine Wistar rats were divided at random into three groups: Control: a control diet with soybean oil; HF: a high-fat diet with 50% of lard; HPF: a high-protein-fat diet with about 40% of protein and 50% of lard. The groups were fed with these diets during four weeks. The following parameters were analyzed: hepatic steatosis, serum and hepatic lipid profile, lipid peroxidation, antioxidants concentration and hepatocytes damage. The HF group showed the highest caloric intake per day and the highest weight gain (p<0.05). The hepatic cholesterol concentration was highest in the HF group and the serum total cholesterol concentration was highest in the HPF group (p<0.05). The macrovesicular steatosis was predominant in the HF group, with ballooning hepatocytes and Mallory bodies and in the HPF group predominant microvesicular steatosis was found, without ballooning hepatocytes and Mallory bodies. An increase in TBARS and a decrease in Vitamin E in the HF and HPF groups (p<0.05) was also found. The HF group showed the highest acid oleic deposit in the liver, followed by the HPF group. The SFA hepatic concentration was similar among the groups (p>0.05), whereas the MUFA concentration was higher in the HF and HPF (p>0.05) than the control group (p<0.05). Therefore, the experimental model used is an efficient model to study hepatic steatosis. The HF and HPF groups had the same behaviors for oxidative stress, serum glucose and hepatic damage in responses to the experimental diets, but these groups showed different esteatosis features.
Keywords: Hepatic Steatosis, Microvesicular Steatosis, High Fat Diet, High Protein Diet
1. Introduction
Hepatic steatosis is characterized by the intracellular accumulation of fat in the hepatocytes cytoplasm causing histological changes in the liver [1]. Also known as fatty liver disease, it is a common type of hepatic pathology, considered an important illness in public health [2]. Nonalcoholic fat liver disease (NAFLD) has been identified as the most common cause of chronic liver disease in developed countries such as United States, Japan and European countries [3].
Nowadays, the NAFLD has been associated with metabolic disorders, such as insulin resistance, including abdominal obesity, dyslipidemia, hypertension, and
hyperglycemia. Therefore, hepatic steatosis is also a hepatic manifestation of the metabolic syndrome [4, 5].
Inadequate diets, such as high-carbohydrate or high-fat diets, may increase the serum glucose, insulin and free fatty acid (FFA) concentrations. These poor dietary conditions contribute to insulin resistance [6]. Insulin resistance also contributes to steatosis pathogenesis, enhancing the fat accumulation in the hepatocytes through the intrahepatic synthesis of fatty acids from glucose [5]. In the insulin resistance state, the glucose uptake in the adipose tissue and skeletal muscle is impaired. The excess of insulin also stimulates the adipocytokines secretion from the adipocytes, so it decreases lipolysis and increases the FFA output from the adipose tissue into the bloodstream, specifically in the

87 Daphne Santoro Leonardi-Carvalho et al.: Effects of High-Fat and High-Protein-Fat Diets in Liver
portal circulation. Together, the increased concentrations of both glucose and FFA in the blood contribute to the excessive accumulation of neutral lipids in the liver [6].
Moreover, the raise of FFA oxidation in the liver contributes to the generation of reactive species oxygen (ROS) in the mitochondria [7]. The free radical excess leads to the stress oxidative state, and contributes to the lipid peroxidation. Therefore, the oxidative stress and lipid peroxidation damage the plasmatic membrane making hepatic cells vulnerable to apoptosis [8]. This mechanism favors the inflammatory response in the liver. There is good evidence of an association between the oxidative stress and progression of NAFLD to non-alcoholic esteatohepatitis [9].
The overconsumption of calories, fats and carbohydrates and sedentary life style are also responsible for the development of hepatic steatosis [10]. It is common to observe in obese people or in those with insulin resistance the ectopic triglycerides accumulation in the hepatocytes [11]. Changes in the macronutrients composition in the diet may also indulge hepatic fat deposit and NAFLD, even without changes in the body weight [12].
Dietary changes, such as carbohydrate decrease and fat enhance, as in the Atkins and South Beach diets [6], could impair the hepatic metabolism as the major source of energy is the carbohydrate. Great portions of fatty acids in the diet can induce the overproduction of ROS in the mitochondria, where the oxidation enhance may promote the hepatocelular steatosis, as well as obesity and NASH [13].
The low-carbohydrate diet offers higher concentration of fat and protein, where a high-fat and a high-protein diet is an important risk factor to cardiovascular disease. The high fat intake, mainly saturated fatty acids (SFA), is responsible in enhancing the blood lipid concentration, insulin resistance, glucose intolerance and obesity [14]. Studies show that the high fat intake may be limited in patients with NAFLD and consumption should be around 7% to 10% of the total energy intake [6]. Other authors have associated the high protein intake with insulin resistance and glucose intolerance [10, 15].
According to what was exposed, diet changes may promote the hepatic steatosis, oxidative stress increase and hepatic injury. Therefore, it is very important to check the impact of several diets on the liver. The aim of the present study was to evaluate some deleterious effect of high-fat diets and high-protein-fat diets in the hepatic steatosis development, through the following parameters: hepatic steatosis level, hepatic and serum lipid profile, oxidative stress and hepatic damage.
2. Materials and Methods
2.1. Experimental Design
The present study was approved by the institution’s Ethics Committee of Animal Experimentation (protocol number 163/2008) of the Faculty of Medicine of Ribeirão Preto, University of São Paulo. Twenty nine Wistar rats weighing
about 100g each, from the Central Animal House of the Faculty of Medicine of Ribeirão Preto, University of São Paulo, were kept in individual cages on a 12 hour light –12 hour dark cycle at a mean temperature of 22°C and were divided at random into three groups: Control: control diet with vegetal oil (soybean oil); HF: high-fat diet with 50% of animal fat (lard); HPF: high-protein-fat diet with about 40% of protein (casein) and 50% of animal fat (lard).
The control diet was based on AIN-93 diet by Reeves et al. [16,17] and the HF and HPF diets were prepared with animal fat (lard) instead of vegetal oil (soybean oil). The diet compositions are shown in Table 1.
Initially the animals had an adaption period to the diets, where the experimental diets were mixed with the commercial diet at a 1:1 ratio (commercial diet: experimental diet) during seven days, and later the ratio increased to 2:1 for more seven days. At the end of these two weeks, each group was fed only with their experimental diets and water ad libitum during four weeks. The animals received fresh food every 2 days. Food intake and weight were measured weekly throughout the study period to estimate the weight gain. The total caloric value of the control diet, high-fat diet and high-protein-fat diet were respectively 1651.84kJ (394.8Kcal), 2551.40kJ (609.8Kcal), 2551.40kJ (609.8Kcal) per 100g.
At the end of four weeks, the animals were sacrified by decapitation and the blood and liver were collected. The blood was centrifuged and the plasma was stored at -80°C. The livers were removed, weighed, immediately frozen in liquid N2 (-196°C) and stored at -80°C. A sample of fresh liver was collected and submerged in formaldehyde for histopathologic analysis.
Table 1. The percentage composition of diets.
Nutrient Control HF HPF
Carbohydrate (Starch) 62.95% 29.95% 0%
Protein (Casein) 20.0% 20.0% 39.95%
Fat (Soybean oil) 7.0% --- ---
Fat (Lard) --- 50.0% 50.0%
Fiber (Cellulose) 5.0% 5.0% 5.0%
Minerals 3.5% 3.5% 3.5%
Vitamins 1% 1% 1%
Choline 0.25% 0.25% 0.25%
Cystine 0.3% 0.3% 0.3%
BHT 0.0014% 0.0014% 0.0014%
BHT: Butylated hydroxytoluene. Control: AIN-93 diet(16,17). HF: High-fat diet. HPF: High-protein-fat diet.
2.2. Biochemistries Determinations
The total liver fat content was extracted and quantified by the method proposed by Bligh & Dyer [18]. The lard fatty acids and soybean oil fatty acids were determined by the Andrioli et al. [19] method; however, the hepatic fat acids were determined by the Jung et al. [20] method.

Advances in Biochemistry 2015; 3(6): 86-95 88
The vitamin E concentration was determined by HPLC (LC-20A; Shimadzu) according to a previous method described by Jordão et al. [21]. The total reduced glutathione (GSH) was determined in the liver as described by Sedlack & Lindsay [22] and the serum GSH was determined by the method of Costa et al [23].
The thiobarbituric acid reactive substances (TBARS), as parameters of lipid peroxidation, were determined in the plasma and liver by the methods of Buege & Austi [24]. And the hepatic protein carbonyl content (PCC), as parameter of protein oxidation was determined by Levine et al. [25].
Hepatic and serum protein, serum glucose, serum alanine aminotransferase (ALT) and aspartate aminotransferase (AST), hepatic and serum total cholesterol, hepatic and serum triglycerides, serum fructosamine and serum high density lipoprotein (HDL) were determined by Labtest
® commercial kits. Before determining the hepatic cholesterol and hepatic triglycerides it was necessary to extract the fat by the Bligh & Dyer [18] method. Finally the low density lipoprotein (LDL) and very low density lipoprotein (VLDL) were calculated by Friedewald et at. [26].
The DNA damage in the hepatocytes was determined by the comet assay method described by Ong et al. [27].
2.3. Hepatic Histopathologic Evaluation
The liver sample collected immediately after the animals were sacrificed, was divided into fragments, which were submerged in 4% buffered formaldehyde for 24 hours. After the fragments were washed with an alcohol solution (alcohol 70%), they were embedded in paraffin, cut into 4-mm thick sections and stained with hematoxylin and eosin (HE) for semi-quantitative determination of the hepatic steatosis, using a standard light microscope (400x) by a qualified pathologist. This semi-quantification of the hepatic steatosis was scored with crosses [28]: 0 – 25% (1+); 26 – 50% (2+); 51 – 75% (3+); and 76 – 100% (4+).
The hepatic steatosis was also classified microscopically by Burt el al. [29] in macrovesicular and microvesicular. In macrovesicular steatosis there is usually a large fat droplet, which distends the hepatocyte that displaces the nucleus to one side or to hepatocyte periphery, by contrast in
microvesicular steatosis there are multiple small droplets which are dispersed in cytoplasm usually without nuclear displacement. Also the presence of Mallory body and ballooned hepatocytes were assessed by a semi-quantitative method, described by Hanada et al. [30]. Hepatocyte ballooning was scored as 0-3 (0, none; 1, rare; 2, frequent; 3, abundant) and Mallory-Denk body and were both as 0-4 (0, none; 1, rare; 2, moderate; 3, frequent; 4, abundant).
2.4. Statistical Analysis
Data are reported as mean values and standard deviations, and the groups were compared by ANOVA followed by the Tukey post test. In all analysis, the level of significance was set at p<0.05.
3. Results
3.1. Caloric Intake, Weight Gain and Diet Efficiency Rate
The HF group showed the highest caloric intake per day and the highest weight gain among the three groups (p<0.05). The diet efficiency rate was similar between the HF and HPF groups (p>0.05), Table 2.
Table 2. Caloric intake, weight gain and diet efficiency rate per group.
Control Group HF Group HPF Group
Mean SD Mean SD Mean SD
Caloric intake (KJ/day)
302.75 a 69.03 513.08 b 63.47 400.53 b 66.44
Caloric intake (Kcal/day)
72.36 a 16.50 122.63 b 15.17 95.73 c 15.88
Weight gain (g)
210.70 a 43.18 522.89 b 63.59 427.10 c 73.08
Diet efficiency rate
0.39 a 0.10 0.86 b 0.04 0.90 b 0.05
Control: AIN-93 diet(16,17). HF: High-fat diet. HPF: High-protein-fat diet. Weight gain: Difference between final weight and initial weight. Diet efficiency rate: Express the diet efficiency to provide weight gain. a,b,c: Different letters in the same line means p<0.05.
3.2. Liver Weight, Hepatic Fat and Serum Lipids
Table 3. Lipid parameters of hepatic tissue and serum.
Control Group HF Group HPF Group
Mean SD Mean SD Mean SD
Liver weight (g) 7.71 a 1.42 23.58 b 3.89 18.26 c 3.15
Liver weight/Animal weight (%) 2.58 a 0.13 3.83 b 0.45 3.54 b 0.25
Total hepatic fat (mg/g of tissue) 68.67 a 21.64 172.99 b 35.81 137.91 b 39.65
Hepatic cholesterol (mg/g of tissue) 3.66 a 1.80 9.34 b 1.54 5.91 c 1.81
Hepatic triglycerides (mg/g of tissue) 20.71 a 33.53 63.58 b 22.57 56.36 b 28.22
Serun total cholesterol (mg/dL) 62.21 a 12.28 70.58 a 10.93 92.65 b 22.71
Serum triglycerides (mg/dL) 53.26 a 26.73 122.02 b 61.08 109.20 b 33.67
Serum HDL (mg/dL) 15.67 a 3.60 14.67 a 4.18 17.08 a 2.25
Serum LDL (mg/dL) 35.95 ab 14.10 36.05 a 12.02 53.73 a 22.81
Serum VLDL (mg/dL) 10.65 a 5.14 24.40 b 12.21 21.84 b 6.74

89 Daphne Santoro Leonardi-Carvalho et al.: Effects of High-Fat and High-Protein-Fat Diets in Liver
Table 3 presents the final liver and animal weight, liver weight/animal weight rate, hepatic fat and serum lipid concentration of each group. The group fed with a high-fat diet showed the highest liver weight (p<0.05). Furthermore the liver weight/animal weight rate, hepatic fat, fat liver percentage, hepatic and serum triglycerides and serum VLDL were higher in the HF and HPF groups than in the control group (p<0.05). The hepatic cholesterol concentration was the highest in the HF group and the serum total cholesterol concentration was the highest in the HPF group (p<0.05). The serum LDL concentration was the smallest in the HF group (p<0.05) and no significant differences in the serum HDL concentration were detected among the groups (p>0.05).
3.3. Hepatic Steatosis
Hepatic steatosis was identified in all animals fed with a high-fat diet and a high-protein-fat diet. Most animals (6/9) of the HF group developed steatosis 4+ (76-100%), 50% (5/10) of the animals in the HPF group showed steatosis 3+ (51-75%), Figure 1. The characteristics of steatosis in the HF group were predominantly macrovesicular and in the HPF group were microvesicular, Figure 2.
Ballooned hepatocytes were abundant (score 3) in the HF group and rare (score 1) in the HPF group. The hepatocytes’ cytoplasm in the HF group was full of large fat droplets. The
Mallory-Denk bodies were frequent (score 3) in the HF group and rare (score 2) in the HPF group. The control group, however, showed normal steatosis resulting normal fat metabolism in normal hepatocityes and no ballooned hepatocytes were found (score 0) and Mallory-Denk bodies (score 0).
Figure 1. Histological analysis of hepatic steatosis.
1+: 0-25% of hepatic steatosis. 2+: 26-50% of hepatic steatosis. 3+: 51-75% 0f hepatic steatosis. 4+: 76-100% of hepatic steatosis. Control group: AIN-93 diet(16,17). HF group: High-fat diet. HPF group: High-protein-fat diet
Figure 2. Photomicrographs of liver tissue (magnification 200x). 2a: Control group without steatosis. 2b: High-fat group with predominantly macrovesicular
steatosis and ballooning hepatocytes. 2c: High-protein-fat group with predominantly microvesicular steatosis.

Advances in Biochemistry 2015; 3(6): 86-95 90
3.4. TBARS, PCC, GSH and Vitamin E
Hepatic free TBARS and hepatic total TBARS levels were higher in the HF and HPF groups compared with the control group (p<0.05). No significant differences in serum free TBARS and serum total TBARS concentrations were detected among the groups (p>0.05).
The hepatic PCC level were higher in HPF group than HF
group (p<0.05) and no significant differences were observed in control group compared with HF or HPF groups (p>0,05).
No significant differences were observed in hepatic GSH and serum vitamin E (p>0.05), but serum GSH levels were smaller in the HF and HPF groups and hepatic vitamin E was higher in the HPF compared with the control group (p<0.05).
These results are presented in Table 4.
Table 4. TBARS, GSH and vitamin E levels of hepatic tissue and serum.
Control Group HF Group HPF Group
Mean SD Mean SD Mean SD
Hepatic free TBARS (nmol/g of protein) 45.51 a 17,94 148,47 b 55,49 143,05 b 59,00
Serum free TBARS (nmol/g of protein) 31.68 a 6,96 26,19 ab 5,61 22,62 b 4,75
Hepatic total TBAR (nmol/g of protein) 279.16 a 123,25 781,81 b 301,85 635,21 b 224,02
Serum total TBARS (nmol/g of protein) 132.02 a 28,98 109,13 ab 23,36 94,25 b 19,77
Hepatic free-iron TBARS (nmol/g of protein) 212.73 a 70,59 452,79 b 246,22 393,70 ab 234,68
Hepatic PCC (nmol/mg protein) 1,07 ab 0,31 0,89 a 0,31 1,58 b 0,55
Hepatic GSH (nmol/g of protein) 13.66 a 6,61 16,98 a 7,49 19,91 a 10,55
Serum GSH (mmol/g of protein) 0.84 a 0.25 0,71 ab 0,21 0,54 b 0,15
Hepatic vitamin E (nmol/g of tissue) 59.79 a 10.63 51,10 b 7,98 65,11 ab 9,70
Hepatic vitamin E (nmol/g of fat) 0.94 a 0.32 0,31 b 0,11 0,50 b 0,12
Serum Vitamin E (µmol/L) 7.03 a 2.40 6,85 a 3,19 8,78 a 3,79
TBARS: Thiobarbituric acid reactive substances. PCC: Protein carbonyl content. GSH: reduced glutathione. Control: AIN-93 diet(16,17). HF: High-fat diet. HPF: High-protein-fat diet. a,b,c: Different letters in the same line means p<0.05.
3.5. Glucose, Fructosamine, Total Proteins and Hepatic
Enzymes
Table 5 presents glucose, fructosamine, proteins and hepatic enzymes results. Glucose levels were higher in the HF and HPF groups and fructosamine level was smaller in the group fed with a high-protein-fat diet compared with the
control group (p<0.05). No significant differences were observed in the serum and hepatic protein concentration among the groups (p>0.05). The HPF group showed higher serum ALT concentration than the control group (p<0.05), but no significant differences were observed in the serum AST concentration among the groups (p>0.05).
Table 5. Glucose, fructosamine, total protein and hepatic enzymes levels per group.
Control Group HF Group HPF Group
Mean SD Mean SD Mean SD
Glucose (mg/dL) 119.35 a 13.99 179.15 b 22.62 166.82 b 18.45
Fructosamine (mM) 327.84 a 61.65 256.78 ab 152.64 153.70 b 62.14
Serum total protein (g/dL) 7.74 a 0.86 8.04 a 0.93 8.68 a 1.22
Hepatic total protein (g/g of tissue) 0.31 a 0.09 0.32 a 0.12 0.28 a 0.13
AST (UI/L) 24.98 a 1.95 26.11 a 2.31 26.76 a 1.89
ALT (UI/L) 24.22 a 2.21 26.72 ab 2.70 30.20 b 4.52
AST/ALT 1.04 a 0.13 0.98 ab 0.09 0.90 b 0.09
AST: Aspartate aminotransferase. ALT: Alanine aminotransferase. UI: International units. Control: AIN-93 diet(16,17). HF: High-fat diet. HPF: High-protein-fat diet. a,b,c: Different letters in the same line means p<0.05.
91 Daphne Santoro Leonardi-Carvalho et al.: Effects of High-Fat and High-Protein-Fat Diets in Liver
3.6. Comet Assay
The comet length in the control, HF and HPF groups were respectively: 59.33 ± 14.19 µm, 68.47 ± 8.81 µm e 75.29 ± 8.21 µm. However, no significant differences were observed in length comet (p=0,1023).
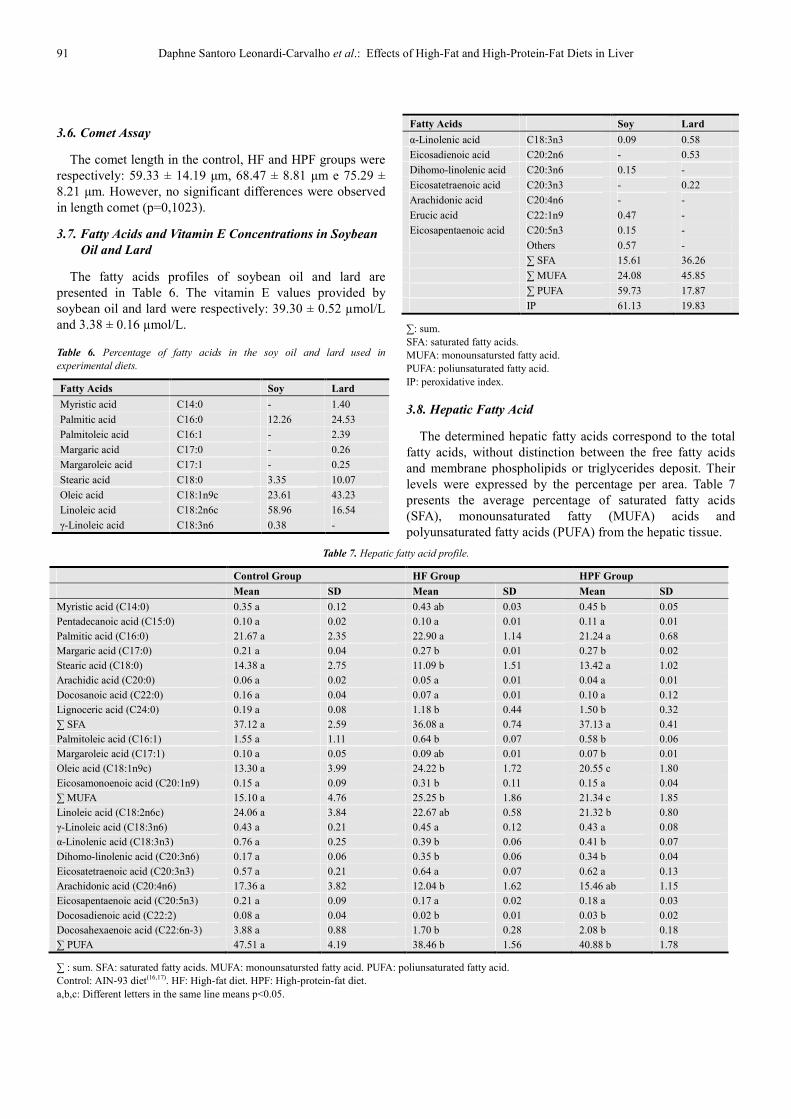
3.7. Fatty Acids and Vitamin E Concentrations in Soybean
Oil and Lard
The fatty acids profiles of soybean oil and lard are presented in Table 6. The vitamin E values provided by soybean oil and lard were respectively: 39.30 ± 0.52 µmol/L and 3.38 ± 0.16 µmol/L.
Table 6. Percentage of fatty acids in the soy oil and lard used in
experimental diets.
Fatty Acids Soy Lard
Myristic acid C14:0 - 1.40
Palmitic acid C16:0 12.26 24.53
Palmitoleic acid C16:1 - 2.39
Margaric acid C17:0 - 0.26
Margaroleic acid C17:1 - 0.25
Stearic acid C18:0 3.35 10.07
Oleic acid C18:1n9c 23.61 43.23
Linoleic acid C18:2n6c 58.96 16.54
γ-Linoleic acid C18:3n6 0.38 -
Fatty Acids Soy Lard
α-Linolenic acid C18:3n3 0.09 0.58
Eicosadienoic acid C20:2n6 - 0.53
Dihomo-linolenic acid C20:3n6 0.15 -
Eicosatetraenoic acid C20:3n3 - 0.22
Arachidonic acid C20:4n6 - -
Erucic acid C22:1n9 0.47 -
Eicosapentaenoic acid C20:5n3 0.15 -
Others 0.57 -
∑ SFA 15.61 36.26
∑ MUFA 24.08 45.85
∑ PUFA 59.73 17.87
IP 61.13 19.83
∑: sum. SFA: saturated fatty acids. MUFA: monounsatursted fatty acid. PUFA: poliunsaturated fatty acid. IP: peroxidative index.
3.8. Hepatic Fatty Acid
The determined hepatic fatty acids correspond to the total fatty acids, without distinction between the free fatty acids and membrane phospholipids or triglycerides deposit. Their levels were expressed by the percentage per area. Table 7 presents the average percentage of saturated fatty acids (SFA), monounsaturated fatty (MUFA) acids and polyunsaturated fatty acids (PUFA) from the hepatic tissue.
Table 7. Hepatic fatty acid profile.
Control Group HF Group HPF Group
Mean SD Mean SD Mean SD
Myristic acid (C14:0) 0.35 a 0.12 0.43 ab 0.03 0.45 b 0.05
Pentadecanoic acid (C15:0) 0.10 a 0.02 0.10 a 0.01 0.11 a 0.01
Palmitic acid (C16:0) 21.67 a 2.35 22.90 a 1.14 21.24 a 0.68
Margaric acid (C17:0) 0.21 a 0.04 0.27 b 0.01 0.27 b 0.02
Stearic acid (C18:0) 14.38 a 2.75 11.09 b 1.51 13.42 a 1.02
Arachidic acid (C20:0) 0.06 a 0.02 0.05 a 0.01 0.04 a 0.01
Docosanoic acid (C22:0) 0.16 a 0.04 0.07 a 0.01 0.10 a 0.12
Lignoceric acid (C24:0) 0.19 a 0.08 1.18 b 0.44 1.50 b 0.32
∑ SFA 37.12 a 2.59 36.08 a 0.74 37.13 a 0.41
Palmitoleic acid (C16:1) 1.55 a 1.11 0.64 b 0.07 0.58 b 0.06
Margaroleic acid (C17:1) 0.10 a 0.05 0.09 ab 0.01 0.07 b 0.01
Oleic acid (C18:1n9c) 13.30 a 3.99 24.22 b 1.72 20.55 c 1.80
Eicosamonoenoic acid (C20:1n9) 0.15 a 0.09 0.31 b 0.11 0.15 a 0.04
∑ MUFA 15.10 a 4.76 25.25 b 1.86 21.34 c 1.85
Linoleic acid (C18:2n6c) 24.06 a 3.84 22.67 ab 0.58 21.32 b 0.80
γ-Linoleic acid (C18:3n6) 0.43 a 0.21 0.45 a 0.12 0.43 a 0.08
α-Linolenic acid (C18:3n3) 0.76 a 0.25 0.39 b 0.06 0.41 b 0.07
Dihomo-linolenic acid (C20:3n6) 0.17 a 0.06 0.35 b 0.06 0.34 b 0.04
Eicosatetraenoic acid (C20:3n3) 0.57 a 0.21 0.64 a 0.07 0.62 a 0.13
Arachidonic acid (C20:4n6) 17.36 a 3.82 12.04 b 1.62 15.46 ab 1.15
Eicosapentaenoic acid (C20:5n3) 0.21 a 0.09 0.17 a 0.02 0.18 a 0.03
Docosadienoic acid (C22:2) 0.08 a 0.04 0.02 b 0.01 0.03 b 0.02
Docosahexaenoic acid (C22:6n-3) 3.88 a 0.88 1.70 b 0.28 2.08 b 0.18
∑ PUFA 47.51 a 4.19 38.46 b 1.56 40.88 b 1.78
∑ : sum. SFA: saturated fatty acids. MUFA: monounsatursted fatty acid. PUFA: poliunsaturated fatty acid. Control: AIN-93 diet(16,17). HF: High-fat diet. HPF: High-protein-fat diet. a,b,c: Different letters in the same line means p<0.05.

Advances in Biochemistry 2015; 3(6): 86-95 92
4. Discussion
Through the experimental model it was possible to establish that the excessive consumption of saturated fat contained in lard lead to hepatic steatosis development in rats.
The daily diet consumption in gram was almost the same among the groups. However, the energy consumption was different once the experimental diets were not isocalorics, as both the high-fat diet and high-protein-fat diet provided over 55% of the energy than that of the control group. Consequently, the experimental diets with high fat (lard) showed higher diet efficiency rate inducing over weight gain and increased hepatic weight. This fact suggests that the diet composition was responsible for the histological and biochemical changes found.
The experimental diets contain more fat, mainly SFA and MUFA, compared with the control diet, consequently more free fatty acids (FFA) sources to the bloodstream and liver, so the liver is exposed to an excess of fat, stimulating unbalance between the hepatic synthesis and a turnover of triglycerides [6]. The excess fat consumption explains the increased hepatic total fat, hepatic cholesterol and hepatic triglycerides in the HF and HPF groups. However, the HPF presented less hepatic cholesterol concentration than the HF group, which could be explained by the fact that the HPF diet being carbohydrate free [31], therefore there was probably an increased fat mobilization to the energy synthesis, through ketone bodies synthesis, as there was not enough energy supply in the glucose form.
The serum triglycerides were superior in the HF and HPF groups, because of the excess of fat in diets. Moreover, studies report that the serum triglycerides levels also increased in insulin resistance condition and can at the same time develop hepatic fat deposit, thus the excess of insulin stimulates triglycerides output from adipose tissue by lipoprotein lipase pathway, increasing serum triglycerides [6].
The hepatic and serum cholesterol concentration were different in the HF and HPF, the HF group had more hepatic cholesterol and less serum cholesterol than the HPF group. The HPF behavior can be explained by a higher protein consumption which led to an increase in low density lipoprotein synthesis, an important lipid carrier, whose function is to carry cholesterol from the liver to other tissues, through the bloodstream, as well as increasing serum total cholesterol concentration.
In the present study, no significant difference (p>0.05) was observed in the serum HDL concentration among the three groups, in contradiction to literature findings [32]. Probably, the HDL levels did not change because the high-fat diet and high-protein-fat diet contained a high concentration of MUFA and the animals in the HF and HPF groups ate enough MUFAs able to keep the serum HDL levels, since the MUFA beneficial effect is to increase the serum HDL
concentration[33]. The serum VLDL concentration in the HF and HPF had no
significant difference (p>0.05), but it was higher than the control group, perhaps the excess of SFA and increased hepatic fat led to an improvement in the VLDL output from the liver to the bloodstream, in order to avoid the hepatic fat accumulation. Nevertheless, the improved VLDL output in these groups was not enough to keep the triglycerides turnover in the liver and prevent the hepatic steatosis development.
Notably, the HF and HPF groups developed hepatic steatosis (Figure 2), however the histological features were different: macrovesicular steatosis was predominant in the HF group and microvesicular steatosis was predominant in the HPF group.
According to Brunt & Tiniakos [34], in NAFLD it is normal to find macrovesicular steatosis, generally just one fat droplet involves almost all cytoplasm of hepatocytes, pushing the nucleus to periphery. Although microvesicula steatosis can be presented in NAFLD, it is not common to find.
Macrovesicular and microvesicular steatosis are reversible degenerative injuries, but apparently the pathogenesis is different [35,36]. Possibly, the microvesicular steatosis reason is some dysfunction in the mitochondria of the hepatocytes, followed by defects in β-oxidation and urea synthesis [37,38], leading to fat deposit in the liver. The macrovesicular steatosis development is related to some changes at any point in the hepatic lipid metabolism pathway, resulting in hepatic triglycerides deposit [29]. Charlton et al. [39] suggest a dysfunction in the cytoplasmatic secretion of the lipoproteins is one way of developing macrovesicular steatosis.
The macrovesicular and microvesicular steatosis have different prognostics, apart from their etiology [35]. In humans, macrovesicular steatosis has a longer prognostic, uncommonly progresses to fibrosis and cirrhosis. In contrast, microvesicular steatosis is generally related to clinical features, such as hepatic encephalopathy and liver failure and also related to an advanced fatty liver disease state [36].
In the HF group, along with the predominantly macrovesicular steatosis a higher presence of ballooning hepatocyte and Mallory-Denk bodies were found. Caldwell et
al. [40], suggest that fat droplets deposit results in the ballooned hepatocytes formation, stimulating Mallory-Denk bodies formation, once the accumulation of fat droplets in hepatocytes can damage the endoplasmatic reticulum and injure the cytoskeleton and, as a consequence, may change in the fatty acids elimination in the hepatocytes, favoring underlying hepatic fat accumulation, which is lipotoxic. And the injury of cytoskeleton is evident as loss cytokeratin elements and formation of Mallory-Denk bodies.
The presence of microvesicular steatosis in the HPF group, probably occurred due to the increased protein consumption and absence of carbohydrate in the high-protein-fat diet, thus there was an increase in protein oxidation and an increase in gluconeogenesis [41], consequently increased the synthesis

93 Daphne Santoro Leonardi-Carvalho et al.: Effects of High-Fat and High-Protein-Fat Diets in Liver
of free radicals and nitrogen compounds, such as ammonia and urea, which are toxic to the body and damage the mitochondria.
The excessive consumption of fat was also responsible for the increased glucose in the HF and HPF groups, in agreement with previous studies [42]. Fructosamine is a marker of the levels of glycated serum protein and the levels were smaller in the HF and HPF groups compared with the control group, as the serum fructosamine levels directly reflect the glucose intake by the diet, because the fructosamine concentration may reflect the plasma concentrations of glucose over the last 20 days [43].
Even with the higher protein supply in the high-protein-fat diet, no significant differences were observed in the serum and hepatic total protein, because all excess of protein which the body does not use for the synthesis of hormone, enzymes and plasma proteins or in gluconeogenesis or in maintaining muscle mass, is excreted by the body as urea [44], or is oxidized to provide energy, because there is no place in the body for permanent storage of protein [45]. Probably, the excess of protein from high-protein-fat diet were oxidized because there was an increase in protein carbonyl concentration in the liver of HPF group.
In the present study, the experimental diets, high-fat and high-protein-fat, were able to increase the concentration of total TBARS, free TBARS and free/iron TBARS. These findings indicate that the highest supply of fat is directly related to the lipid peroxidation enhanced and raised production of reactive oxygen species (ROS), which are able to damage the DNA, the proteins and the membrane phospholipids, leading to disturbances in cellular homeostasis [46]. In hepatic antioxidant defense, the vitamin E levels were smaller in the groups that the TBARS enhanced, specifically the HF and HPF groups, and this fact shows that there was a raise in vitamin E utilization in attempt to reduce the lipid peroxidation and maintain a balance between free radicals and antioxidants, but the vitamin E consumption was not enough to avoid the presence of oxidative stress.
In the GSH storage there was no change possibly because the experimental period was short, only four weeks, therefore only the vitamin E storage was used by the liver. Probably if the study was held for a longer period, the GSH storage would be depleted in the HF and HPF group, due to the constant increase in the free radicals production caused by the consumption of the high-fat and high-protein-fat diets. The oxidative stress was higher in the hepatic tissue than in the serum level, because no enhance in the serum TBARS concentration and no change in the vitamin E concentration were observed in the HF and HPF groups, and it was possible to maintain the balance between the free radicals and antioxidants only through the serum GSH consumption.
In the HPF group, the increased of production of reactive oxygen species in the liver, mainly by increasing protein oxidation, possibly damage the hepatic mitochondria [46]. According to authors [35,37], some dysfunction in the mitochondria of the hepatocytes possibly is one of the
reasons of the microvesicular steatosis development. The hepatic damage was analyzed first through assessment
of the liver function by the serum liver enzymes determination, but no significant differences were observed in the AST levels among the three groups at the end of the study, while only the HPL group showed an increase in the ALT levels. Previous studies fed the Sprague-Dawley [47] rats and rabbits [48] with high-fat diets, during long periods, respectively 46 weeks and 24 weeks, and also did not detect any difference between the AST and ALT levels at any time of the experiment. Later, the comet assay was executed to measure the DNA damage in hepatocytes, although the high-fat diets of lard were not able to harm the hepatocytes DNA, probably because the study lasted only four weeks.
There are few studies [49, 50] evaluating fatty acids profile in the liver tissue of rats fed with a high-fat diet made with lard, usually the studies seek to determine the serum and adipose tissue fatty acids profile.
Newly, Vial et al. [50] in their study fed the animals with a high-fat diet with 50% of lard plus 4% de soybean oil over eight weeks. The serum and hepatic fatty acids concentration were measured, and the hepatic levels found of palmitoleic acid (C16:1), oleic acid (18:1n9c), eicosamonoenoic acid (C20:1n9), Linoleic acid (C18:2n6c) and arachidonic acid (C20:4n6), were near to those found in the present study.
The hepatic steatosis has been associated to excessive accumulation of oleic acid in humans [51]. The oleic acid is monounsaturated fatty acid of omega-9 family and the final product of de novo lipogenesis (DNL). According to this, the HF group showed the highest steatosis degree (4+, 76-100%) in most animals, and the oleic acid content was also the highest, followed by the HPF group, which steatosis prevalent was 3+ (51-75%) and the oleic acid deposit was under the HF group (p<0.05). In the control group no ectopic steatosis was observed, thus the oleic acid deposit was the lowest among the groups (p<0.05).
Even with greater saturated fat supply in the HF and HPF groups, no significant difference was observed in the hepatic saturated fat concentration among the groups. According to Almeida et al. [49], it is expected that saturated fat had been stored in a large amount in the adipose tissue, because in a previous study this author found a correlation between saturated fat intake and tissue deposition in animal models. However, in the present study no analysis of fat acid composition of the adipose tissue was done to prove this hypothesis. The animals fed with high-fat and high-protein-fat diets showed high concentrations of hepatic MUFA and low concentration of hepatic PUFA compared with the control group. Thus these results suggest that food fat acids content exert strong influence on the tissue deposition of fatty acids, as it was also found in other studies [49]. But not all fatty acids follow accumulation pattern according to their consumption, some fatty acids may originate from de novo
lipogenesis or from elongation (carbon pair insertion) and desaturation (insertion of double bond) reaction. An example is the palmitoleic acid (C16:1), these fatty acids do not exist in soybean oil, but they were found in the liver of animals fed

Advances in Biochemistry 2015; 3(6): 86-95 94
with the control diet, maybe the palmitoleic acid was synthesized from the palmitic acid (C16:0) by the desaturation reaction [52].
Nevertheless, the experimental model used in the present study is an efficient model to study the hepatic alterations in non-alcoholic fat liver disease. Through the study it was observed that the high-fat and high-protein-fat diets showed the same effects on the lipid peroxidation, antioxidant concentration, glucose levels and hepatic damage. Although the steatosis features were different between the HF and HPF groups, more studies are necessary to evaluate the effect of a high-protein diet in the liver.
Acknowledgements
To Professor Sergio Zucoloto (in memoriam) for their dedication and presence in this work, rest in peace.
References
[1] Grattagliano I, Vendemiale G, Caraceni P, et al. (2000) Starvation impairs antioxidant defense in fatty livers of rats fed a choline-deficient diet. J Nutr 130(9): 2131-6.
[2] Zou Y, Li J, Wang J, et al. (2006) High-fat emulsion-induced rat model of nonalcoholic steatohepatitis. Life Sci 79(11): 1100-7.
[3] He Y, Zhang H, Fu FH. (2008) The effects of swimming exercise on high-fat-diet induced steatohepatitis. J Sports Med Phys Fitnes 48(2): 259-265.
[4] Kim H, Park J, Lee K, et al. (2009) Effect of body weight and lifestyle changes on long-term course of nonalcoholic fatty liver disease in koreans. Am J Med Sci 337(2): 98-102.
[5] Patrick L. (2002) Nonalcoholic fatty liver disease: relationship to insulin sensitivity and oxidative stress. Treatment approaches using vitamin E, magnesium, and betaine. Altern Med Rev 7(4): 276-91.
[6] Zivkovic AM, German JB, Sanyal AJ. (2007) Comparative review of diets for the metabolic syndrome: implications for nonalcoholic fatty liver disease. Am J Clin Nutr 86(2): 285–300.
[7] Pessayre D, Mansouri A, Fromenty B. (2002) Nonalcoholic steatosis and steato-hepatitis. V. Mitochondrial dysfunction in steatohepatitis. Am J Physiol Gastrointest Liver Physiol 282(2): 193-9.
[8] Medina J, Fernandez-Salazara LI, Garcia-Buey L, et al. (2004) Approach to the pathogenesis and treatment of nonalcoholic steatohepatitis. Diabetes Care 27(8): 2057-6.
[9] Choi SS, Diehl AM. (2008) Hepatic triglyceride synthesis and nonalcoholic fatty liver disease. Curr Opin Lipidol 19(3): 295–300.
[10] Tessari P, Coracina A, Cosma A, et al. (2009) Hepatic lipid metabolism and non-alcoholic fatty liver disease. Nutr Metab Cardiovasc Dis 19(4): 291-302.
[11] Valtuena S, Pellegrini N, Ardigò D, et al. (2006) Dietary glycemic index and liver steatosis. Am J Clin Nutr 84(1): 136-42; quiz 268-9.
[12] Cave M, Deaciuc I, Mendez C, et al. (2007) Nonalcoholic fatty liver disease: predisposing factors and the role of nutrition. J J Nutr Biochem 18(3): 184–195.
[13] Birkner E, Kasperczyk S, Kasperczyk A, et al. (2005) Metabolic and antioxidative changes in liver steatosis induced by high-fat, low-carbohydrate diet in rabbits. J Physiol Pharmacolm 56 Suppl 6: S45-58.
[14] Brehm BJ, Seeley RJ, Daniels SR, et al. (2003) A randomized trial comparing a very low carbohydrate diet and a calorie-restricted low fat diet on body weight and cardiovascular risk factors in healthy women. J Clin Endocrinol Metab 88(4): 1617-23.
[15] Linn T, Geyer R, Prassek S, et al. (1996) Effect of dietary protein intake on insulin secretion and glucose metabolism in insulindependent diabetes mellitus. J Clin Endocrinol Metab 81(11): 3938-43.
[16] Reeves PG, Nielsen FH, Fahey GC Jr. (1993) AIN-93 purified diets for laboratory rodents: final report of the American Institute of Nutrition ad hoc writing committee on the reformulation of the AIN-76A rodent diet. J Nutr 123(11): 1939-51.
[17] Reeves PG. (1997) Components of the AIN-93 diets as improvements in the AIN-76A diet. J Nutr 127(5): S838-84.
[18] Bligh EGE, Dyer WJ. (1959) A rapid method of total lipid extraction and purification. Can J Biochem Physiol 37(8): 911-7.
[19] Andreoli MF, Scalerandi MV, Borel IM, et al. (2007) Effects of CLA at different dietary fat levels on the nutritional status of rats during protein repletion. Nutrition 23(11-12): 827–835.
[20] Jung MY, Kim GB, Jang ES, et al. (2006) Technical note: Improved extraction method with hexane for gas chromatographic analysis of conjugated linoleic acids. J Dairy Sci 89(1): 90-4.
[21] Jordão AAJr, Chiarello PG, Arantes MR, et al. (2004) Effect of an acute dose of ethanol on lipid peroxidation in rats: action of vitamin E. Food Chem Toxicol 42(3): 459-64.
[22] Sedlack KJ, Lindsay RH. (1968) Estimation of total protein bound and nonprotein sulfydryl groups in tissue with Ellman’s reagent. Anal. Biochem 25(1): 192-205.
[23] Costa CM, Santos RCC, Lima SEA. (2006) Simple automated procedure for thiol measurement in human serum samples. J Bras Patol Med Lab 42(5): 345-50.
[24] Buege JA, Aust SD. (1978) Microsomal lipid peroxidation. Methods Enzymol 52: 302-10.
[25] Levine RL, Garland D, Oliver CN, et al. (1990) Determination of carbonyl content in oxidatively modified proteins. Methods Enzymol 186: 464-78.
[26] Friedewald WT, Levi Fredrickson DS. (1972) Estimation of the concentration of low density lipoproteins cholesterol in plasma without use of the ultracentrifuge. Clin Chem 18: 499-502.
[27] Ong TP, Heidor R, de Conti A, et al. (2006) Farnesol and geraniol chemopreventive activities during the initial phases of hepatocarcinogenesis involve similar actions on cell proliferation and DNA damage, but distinct actions on apoptosis, plasma cholesterol and HMGCoA reductase. Carcinogenesis 27(6): 1194-1203.

95 Daphne Santoro Leonardi-Carvalho et al.: Effects of High-Fat and High-Protein-Fat Diets in Liver
[28] Oh SI, Kim CI, Chun HJ, et al. (1998) Chronic ethanol consumption affects glutathione status in rat liver. J Nutr 128(4): 758-63.
[29] Burt AD, Mutton A, Day CP. (1998) Diagnosis and interpretation of steatosis and steatohepatitis. Semin Diagn Pathol 5(4): 246–58.
[30] Hanada S, Strnad P, Brunt EM, et al. (2008) The Genetic Background Modulates Susceptibility to Mouse Liver Mallory-Denk Body Formation and Liver Injury. Hepatology 48(3): 943-52.
[31] Galgani J, Ravussin E. (2008) Energy metabolism, fuel selection and body weight regulation. Int J Obes (Lond) 32(7): S109–S19.
[32] Preiss D, Sattar N. (2008) Non-alcoholic fatty liver disease: an overview of prevalence, diagnosis, pathogenesis and treatment considerations. Clin Sci (Lond) 115(5): 141-50.
[33] Cintra DEC, Costa AGV, Peluzio MCG, et al. (2006) Lipid profile of rats fed high-fat diets based on flaxseed, peanut, trout, or chicken skin. Nutrition 22(2): 197–205.
[34] Brunt EM, Tiniakos DG. (2010) Histopathology of nonalcoholic fatty liver disease. World J Gastroenterol 16(42): 5286-96.
[35] Oleszczuk A, Spannbauera M, Tannapfel A, et al. (2007) Regenerative capacity differs between micro- and macrovesicular hepatic steatosis. Exp Toxicol Pathol 59(3-4): 205-13.
[36] Tandra S, Yeh MM, Brunt EM, et al. (2010) Presence and Significance of Microvesicular Steatosis in Nonalcoholic Fatty Liver Disease. J Hepatol (Epublication ahead of print).
[37] Freneaux E, Labbe G, Letteron P, The LD, et al. (1988) Inhibition of the mitochondrial oxidation of fatty acids by tetracycline in mice and in man: possible role in microvesicular steatosis induced by this antibiotic. Hepatology 8(5): 1056–62.
[38] Fromenty B, Berson A, Pessayre D. (1997) Microvesicular steatosis and steatohepatitis: role of mitochondrial dysfunction and lipid peroxidation. J Hepatol 26 Suppl 1S: 13–22.
[39] Charlton M, Sreekumar R, Rasmussen D, et al. (2002) Apolipoprotein synthesis in nonalcoholic steatohepatitis. Hepatology 35(4): 898–904.
[40] Caldwell S, Ikura Y, Dias D, et al. (2010) Hepatocellular ballooning in NASH. J Hepatol 53(4): 719–723.
[41] Halton TL, Hu FB. (2004) The effects of high protein diets on thermogenesis, satiety and weight loss: a critical review. J Am Coll Nutr 23(5): 373-85.
[42] Leonardi DS, Feres MBC, Portari GV, et al. (2010) Low-carbohydrate and high-fat diets on the promotion of hepatic steatosis in rats. Exp Clin Endocrinol Diabetes 118(10): 724-9.
[43] Misciagna G, Logroscino G, De Michele G, et al. (2004) Fructosamine, glycated hemoglobin, and dietary carbohydrates. Clinica Chimica Acta 340(1-2): 139-47.
[44] Morens C, Gaudichon C, Cornelia CM, et al. (2000) A high-protein meal exceeds anabolic and catabolic capacities in rats adapted to a normal protein diet. J Nutr 130(9): 2312-21.
[45] Tovar AR, Torres N. (2010) The role of dietary protein on lipotoxicity. Biochim Biophys Acta 1801(3): 367-71.
[46] Milagro FI, Campión J, Martínez JÁ. (2006) Weight gain Induced by high-fat feeding involves increased liver oxidative stress. Obesity (Silver Spring) 14(7): 1118-23.
[47] Omagari K, Kato S, Tsuneyama K, et al. (2008) Effects long-term high-fat diet and switching from a high-fat to low-fat, stanard diet on hepatic fat accumulation in Sprague-Dawley rats. Dig Dis Sci 53(12): 3206-12.
[48] Birkner E, Kasperczyk S, Kasperczyk A, et al. (2005) Metabolic and antioxidative changes in liver steatosis induced by high-fat, low-carbohydrate diet in rabbits. J Physiol Pharmacol 56 Suppl 6: S45-58.
[49] Almeida MEF, Queiroz JH, Queiroz MELR, et al. Perfil lipídico tecidual de ratos alimentados com diferentes fontes lipídicas. Rev Nutr 22(1): 51-60.
[50] Vial G, Dubouchaud H, Couturier K, et al. (2011) Effects of a high-fat diet on energy metabolism and ROS production in rat liver. J Hepatol 54(2): 348-56.
[51] Cui W, Chen SL, Hu K. (2010) Quantification and mechanisms of oleic acid-induced esteatosis in HepG2 cells. Am J Transl 2(1): 95-104.
[52] Vaz JS, Deboni F, Azevedo MJ, et al. (2006) Ácidos graxos como marcadores biológicos da ingestão de gorduras. Rev Nutr 19(4): 489-500.