meta‐cart: a tool to identify interactions between ... · meta-analysis programs do not allow...
TRANSCRIPT
British Journal of Mathematical and Statistical Psychology (2017), 70, 118–136
© 2017 The British Psychological Society
www.wileyonlinelibrary.com
Meta-CART: A tool to identify interactionsbetween moderators in meta-analysis
Xinru Li1* , Elise Dusseldorp2 and Jacqueline J. Meulman1
1Mathematical Institute, Leiden University, The Netherlands2Institute of Psychology, Leiden University, The Netherlands
In the framework of meta-analysis, moderator analysis is usually performed only
univariately. When several study characteristics are available that may account for
treatment effect, standard meta-regression has difficulties in identifying interactions
between them. To overcome this problem, meta-CART has been proposed: an approach
that applies classification and regression trees (CART) to identify interactions, and then
subgroupmeta-analysis to test the significance ofmoderator effects. The previous version
of meta-CART has its shortcomings: when applying CART, the sample sizes of studies are
not taken into account, and the effect sizes are dichotomized around the median value.
Therefore, this article proposes newmeta-CART extensions, weighting study effect sizes
by their accuracy, and using a regression tree to avoid dichotomization. In addition, new
pruning rules are proposed. The performance of all versions ofmeta-CARTwas evaluated
via a Monte Carlo simulation study. The simulation results revealed that meta-regression
trees with random-effects weights and a 0.5-standard-error pruning rule perform best.
The required sample size for meta-CART to achieve satisfactory performance depends
on the number of study characteristics, themagnitude of the interactions, and the residual
heterogeneity.
1. Introduction
In psychology and medicine, meta-analysis is a powerful tool to quantitatively integrate
findings frommultiple studies in a systematic way. The effect size is usually chosen as the
standard representative of the study results. By combining the effect sizes, meta-analysis
computes a weighted mean of the study effect sizes as a representative (called a summary
effect size) for all studies. However, if there is substantial heterogeneity between the
studies, the summary effect size is not a good representative for all studies. In such cases, it
is important to identify possible causes of the heterogeneity (Normand, 1999; Thompson,
1994; Thompson & Sharp, 1999). The search for study characteristics (e.g., quality of thedesign) that might account for effect size heterogeneity is called moderator analysis, and
such study characteristics are called ‘moderators’. The most popular types of moderator
analysis are subgroupmeta-analysis (for a categorical moderator) andmeta-regression (for
a continuous one).
*Correspondence should be addressed to Xinru Li, Mathematical Institute, LeidenUniversity, POBox 9512, 2300RA Leiden, The Netherlands (email: [email protected]).
DOI:10.1111/bmsp.12088
118
In most meta-analytic studies only univariate moderator analysis is carried out (e.g.,
Huisman, DeGucht, Dusseldorp, &Maes, 2009). A plausible reason for this is that popular
meta-analysis programs do not allow multiple moderators to be included in one analysis
(e.g., comprehensive meta-analysis; Borenstein, Hedges, Higgins, & Rothstein, 2009).However, some recently developed programs allow for meta-regression with multiple
moderators (e.g., the R-package metafor; Viechtbauer, 2010).
Besides the need to include multiple moderator variables in one analysis, recent meta-
analyses emphasize the need to model interaction effects between moderators. When
interventions consist of several components, the researcher might be interested not only
in a research question such as ‘Are the interventions generally effective?’ but also in
‘Which combinations of components have the greatest probability of being most
effective?’ (Welton, Caldwell, Adamopoulos, & Vedhara, 2009). For example, in a meta-analysis of the influence of behaviour change techniques (BCTs) on the effect of physical
activity and healthy eating interventions, the authors said that the data strongly suggest
that inclusion of a specific BCT (i.e., self-monitoring) in combination with other BCTs
(e.g., self-regulation techniques) is likely to enhance the effectiveness of interventions
(Michie, Abraham, Whittington, McAteer, & Gupta, 2009). When a priori hypotheses
exist, standard meta-regression can be used to investigate interaction effects. However,
interaction effects between moderators are seldom investigated in meta-analysis. One
possible reason is the lack of theory and previous findings on possible interaction effects.When no a priori hypotheses exist, the nature of the study is usually exploratory. In such
cases, standard meta-regression often lacks enough power for interaction detection
between multiple moderators. Furthermore, it is difficult for standard meta-regression to
investigate higher-order interaction effects. For example, in a meta-analysis of 50 studies
with 10 study characteristics that might account for the heterogeneity (i.e., potential
moderators), there are 102
� � ¼ 45 possible two-way interaction terms and 103
� �¼ 120
possible three-way interaction terms. In such cases, it is not possible for a standard meta-
regression to include all the interaction terms simultaneously.Recently, a new approach called meta-CART was proposed to overcome these
difficulties (Dusseldorp, vanGenugten, van Buuren, Verheijden,&vanEmpelen, 2014). In
a situation with many available study characteristics, meta-CART searches for those
combinations of characteristics that might account for effect size heterogeneity. The
method is a combination of classification and regression trees (CART; Breiman, Friedman,
Stone,&Olshen, 1984) and subgroupmeta-analysis. In the first step ofmeta-CART, a tree is
fitted by CART using the study effect sizes as response variable, and the study
characteristics as predictor variables. In the second step, the terminal nodes of the treeare used to create a new subgroup variable (with categories referring to the labels of the
leaves which the studies were assigned to by CART) and a standard subgroup meta-
analysis is carried out using the new subgrouping variable as moderator. Initial results of
meta-CART were promising from a substantial point of view (Dusseldorp et al., 2014),
that is, the results could be easily interpreted and were meaningful. Also, the potential of
the approach has been acknowledged (Michie, Johnson, & Johnston, 2015; O’Brien et al.,
2015). However, the recovery performance of meta-CART has not yet been investigated.
Furthermore, the previous version of meta-CART has several shortcomings. Firstly, it usesa classification tree in the first step of the analysis. To obtain a distinction between more
successful and less successful interventions, the study effect sizes are dichotomized,
which implies loss of information (Hunter& Schmidt, 1990). Secondly, the sample sizes of
studies are not taken into account when applying CART, which means that CART ignores
the accuracy of the effect size estimates.
Meta-CART for moderators in meta-analysis 119
In this paper, the first goal is to address possible solutions to overcome these
shortcomings, by omitting the dichotomization of the response variable, and byweighting
study effect sizes by their estimate accuracy. In addition, new pruning rules are proposed
to improve the performance of meta-CART. The proposed methodology results in twotypes of tree (i.e., meta-classification trees andmeta-regression trees), and several options
of weights and pruning rules for each type of tree. The second goal is to compare the
performance of all the options formeta-classification trees andmeta-regression trees, and,
if possible, choose the best options for each type of tree. In addition, the conditions for
each type of tree to achieve satisfactory performance are explored. In this paper,we focus
on the interaction effects between dichotomous study characteristics (e.g., BCTs). The
outline of this paper is as follows. First,we introducemeta-analysis, CART andmeta-CART.
Next,wedescribe the proposed extensions ofmeta-CART.We then evaluate and comparetheperformance of all the options formeta-classification trees and also formeta-regression
trees in an extensive simulation study. Depending on the results of the extensive
simulation study, the best options for each type of tree are selected. Finally,we summarize
and discuss the results.
2. Meta-analysis
The main purpose of meta-analysis can be summarized in three objectives: to synthesize
the results of the studies; to assess the heterogeneity in the studies; and to search for
moderators that can explain the heterogeneity (S�anchez-Meca & Mar�ın-Mart�ınez, 1998).Depending on the type of studies, a variety of different effect sizemeasures can be used for
a meta-analysis, including odds ratio, relative risk, correlation coefficient, and (standard-
ized) mean difference. In this paper, we focus on studies that compare treatment and
control groups with respect to some continuous response variable, and Hedges’ g
(Hedges, 1981) is used as the measure of effect size. Several tests can be employed to
determine whether heterogeneity exists in the effect sizes, of which theQ-test is themost
frequently used. The formulas for the effect size and the Q-statistic can be found in
Appendix S2.
2.1. Meta-regression and subgroup meta-analysis
Meta-regression investigates whether particular study characteristics explain any of theheterogeneity between studies. It can beperformedunder the fixed-effects or the random-
effects model. Fixed-effects meta-regression assumes that the influential study character-
istics (i.e., moderators) explain all the heterogeneity between studies. Denote the true
effect size in the kth study by dk, and denote the observed effect size in the kth study by gk.Under the fixed-effects assumption, the observed effect size is given by
gk ¼ dk þ ek ¼ b0 þ b1x1k þ b2x2k þ . . .þ bMxMk þ ek; ð1Þ
where the xmk (m = 1, . . ., M) specify the study characteristics of the kth study, and the bare the corresponding regression coefficients. The sampling error ek is assumed to be
distributed as Nð0; r2�kÞ, where r2ekis the sampling variance.
Random-effects meta-regression allows for heterogeneity unexplained bymoderators.
In a random-effectsmodel, there are two sources to account for the total variance of dk: thevariability introduced by the moderators in the model, and the additional variability
120 Xinru Li et al.
introduced by other unmeasured factors. Such additional variability is called ‘residual
heterogeneity’ (Viechtbauer, 2007a), which will be denoted by r2s . Under the random-
effects assumption gk is given by
gk ¼ dk þ ek ¼ b0 þ b1x1k þ b2x2k þ . . .þ bMxMk þ sk þ ek; ð2Þ
where sk is distributed asNð0; r2sÞ and reflects that the true effect sizemay vary from study
to study.
Subgroupmeta-analysis assesses the relationship between subgroupmembership and
effect size, and is similar to meta-regression with one categorical study characteristic. In
subgroup meta-analysis, we consider two types of models, depending on the within-
subgroup and between-subgroups assumptions. The first one is the fixed-effects model,
which assumes fixed effects within subgroups and also across subgroups. Thismeans thatthe difference in effect sizes between subgroups can be explained by the subgroup
membership, and within each subgroup the studies share a common effect size. The
second one is the mixed effects model, which is generally advocated in subgroup meta-
analysis (Borenstein et al., 2009; Viechtbauer, 2010). The mixed effects model assumes a
random-effects model within subgroups and a fixed-effects model across subgroups. In
such a model, the difference in effect sizes between subgroups are all explained by the
subgroup membership, and within each subgroup the model allows heterogeneity
between studies. The details concerning the heterogeneity test in mixed effects modelscan be found in Appendix S2.
3. CART
3.1. Building the treeCART is a recursive partitioning method that was proposed by Breiman et al. (1984). The
method can be used for modelling the relationships between predictor variables and a
categorical response variable by a classification tree or a continuous response variable by
a regression tree. For classification trees, trees are built by finding the split on a predictor
variable that best discriminates between different classes of the response variable. This
‘best-discriminating split’ is defined in terms of a partitioning criterion called the impurity
function. For regression trees, the partitioning criterion is defined as the split that
minimizes the squared difference between the observed and predicted values of theresponse variable. For a useful introduction to CART we refer to Merkle and Shaffer
(2011), andmore details concerning the partitioning criteria can be found inAppendix S3.
3.2. Pruning the tree
To prevent overfitting, a recommended strategy is to first grow an initial tree by
continuing the splitting process until all terminal nodes are either small (e.g., containing
only one or two subjects, that is, one or two studies in our case) or with zero impurity.Then the initial tree is reduced to a final tree of smaller size by ‘pruning’ the non-influential
splits (Breiman et al., 1984).
In most applications, cross-validation is the preferred method to estimate the
misclassification rate or sumof squared error. In thisway, overfitting canbeprevented and
the best size of the tree can be selected. Sometimes the minimum cross-validation rule is
used, by which the tree with the minimum cross-validation error is selected as the final
Meta-CART for moderators in meta-analysis 121

tree. But the minimum cross-validation error may be unstable due to the uncertainty of its
estimate. Therefore, Breiman et al. (1984) suggested using the one-standard-error rule to
reduce the instability, which selects the smallest tree whose cross-validation error is
within the minimum cross-validation error plus one standard error. To generalize thepruning rules, a pruning parameter c can be introduced to select the pruned tree by using
the c � SE rule (Dusseldorp, Conversano, & Van Os, 2010). The c � SE rule selects the
smallest tree whose cross-validation error is within the minimum cross-validation error
plus the standard error multiplied by c. The one-standard-error rule and the minimum
cross-validation error rule can be regarded as special cases of the c � SE rule when c = 1
and c = 0, respectively.
4. Meta-CART
4.1. Previous version of meta-CART
The previous version of meta-CART as proposed in Dusseldorp et al. (2014) is a two-
step procedure. In the first step, a classification tree is fitted to detect interaction
effects between multiple moderators using the dichotomized effect sizes as response
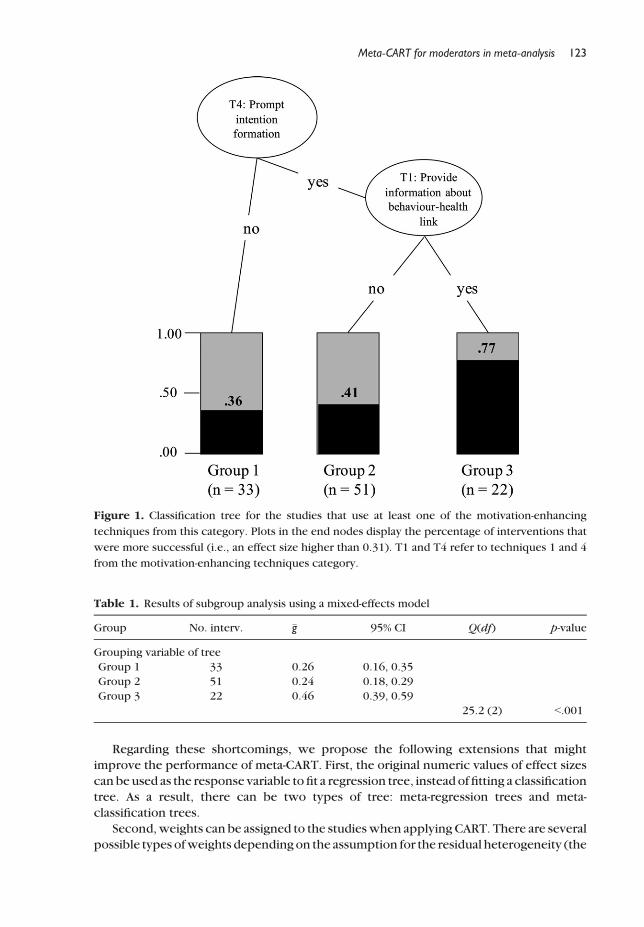
variable. As an example of such a tree, Figure 1 shows a result from Dusseldorp et al.
(2014). The aim of this study was to identify particular combinations of behaviour
change techniques that explain intervention success (defined as an effect size higher
than the overall effect size of all studies). The tree in Figure 1 represents an interaction
between the BCTs ‘prompt intention formation’ and ‘provide information about
behaviour–health links’. According to the classification tree, when the two BCTs are
both included in the intervention, the percentage of more successful interventions is
higher (77%) than interventions that include only one or none of the two BCTs (41 and
36%, respectively).In the second step, a standard subgroup meta-analysis is performed to investigate
whether the subgroup membership obtained from the pruned tree accounts for the
heterogeneity between the studies. If the pruned tree obtained by the first step has two or
more terminal nodes, and the subgroup meta-analysis indicates significance between
subgroups heterogeneity, meta-CART indicates the presence of one or more moderator
effects. For example, the tree in Figure 1 results in three subgroups defined by the
terminal nodes of the tree (rectangles). Consequently, one new variable was added, with
three categories referring to these three terminal nodes. A subgroup meta-analysis wasemployed to test the significance of the new subgroup variable (see Table 1). As a result,
the between-subgroupsQ-statistic indicates that the difference between these subgroups
in mean effect sizes was highly significant. Interventions that included both ‘prompt
intention formation’ and ‘provide information about behaviour-health links’ were, on
average,more effective (�g ¼ 0:46) than the other twogroups of interventions (�g ¼ 0:24or�g ¼ 0:26).
4.2. Extensions of meta-CART
As mentioned before, the previous version of meta-CART has two shortcomings: the
dichotomization of the effect sizes; and the ignorance of the difference in accuracy of the
effect sizes. In addition, the previous version uses the ‘one-standard-error’ rule (see
Section 3.2) to prune the classification tree, and the performance of the pruning rule in
meta-CART has not yet been investigated.
122 Xinru Li et al.
Regarding these shortcomings, we propose the following extensions that might
improve the performance of meta-CART. First, the original numeric values of effect sizes
can be used as the response variable to fit a regression tree, instead of fitting a classificationtree. As a result, there can be two types of tree: meta-regression trees and meta-
classification trees.
Second,weights can be assigned to the studieswhen applying CART. There are several
possible types ofweights dependingon the assumption for the residual heterogeneity (the
Table 1. Results of subgroup analysis using a mixed-effects model
Group No. interv. �g 95% CI Q(df) p-value
Grouping variable of tree
Group 1 33 0.26 0.16, 0.35
Group 2 51 0.24 0.18, 0.29
Group 3 22 0.46 0.39, 0.59
25.2 (2) <.001
Figure 1. Classification tree for the studies that use at least one of the motivation-enhancing
techniques from this category. Plots in the end nodes display the percentage of interventions that
were more successful (i.e., an effect size higher than 0.31). T1 and T4 refer to techniques 1 and 4
from the motivation-enhancing techniques category.
Meta-CART for moderators in meta-analysis 123
fixed-effects or random-effectsmodel). Under the fixed-effects assumption, theweight for
each study can be computed as
wk ¼ 1
r̂2ek
=XKk¼1
1
r̂2ek
: ð3Þ
The fixed-effects weights do not take into account the residual heterogeneity. The
weights under the random-effects assumption are given by: (Cohen, 1988)
wk ¼ 1
r̂2ekþ r̂2
s
=XKk¼1
1
r̂2ekþ r̂2
s
: ð4Þ
In total, there can be three types ofweights formeta-CART: all weights equal to 1,which is
equivalent to applying noweights; fixed-effects weights; and random-effects weights. For
convenience, these three types of weights will be denoted by W0, W1 and W2,
respectively.
Third, the c � SE pruning rules (see Section 3.2) can be employed in the partitioning
procedure ofmeta-CART. The pruning rulemay influence the detection rate of interactioneffects. A pruning rulewith a small value of cmight be too liberal: the pruned tree obtained
by CART appears to be too large, implying toomany interaction terms. On the other hand,
a pruning rule with a large value of c might be too conservative: the pruned tree is too
small, resulting in too few or even no interaction terms. In order to find the optimal
pruning rule for meta-CART, three values of c were chosen: 0, 0.5, 1.0.
Taking all the options into account, there are three options for the weights, and three
options for the pruning rules. As a result, 3 9 3 = 9 possible options were proposed for
each type of tree (meta-regression tree and meta-classification tree).
5. Simulation
5.1. Motivation
In the simulation study, we were interested in two questions. Firstly, which meta-CART
options generally perform best for each type of tree? Secondly, given the best options,what conditions are influencing the performance of each type of tree? The conditions
included observable features of meta-analytic data sets, such as the number of studies, the
within-study sample sizes, and the number of study characteristics, as well as
unobservable structures and parameters underlying the data, such as the complexity of
the interaction effects, the magnitude of the interaction effects, and the residual
heterogeneity.
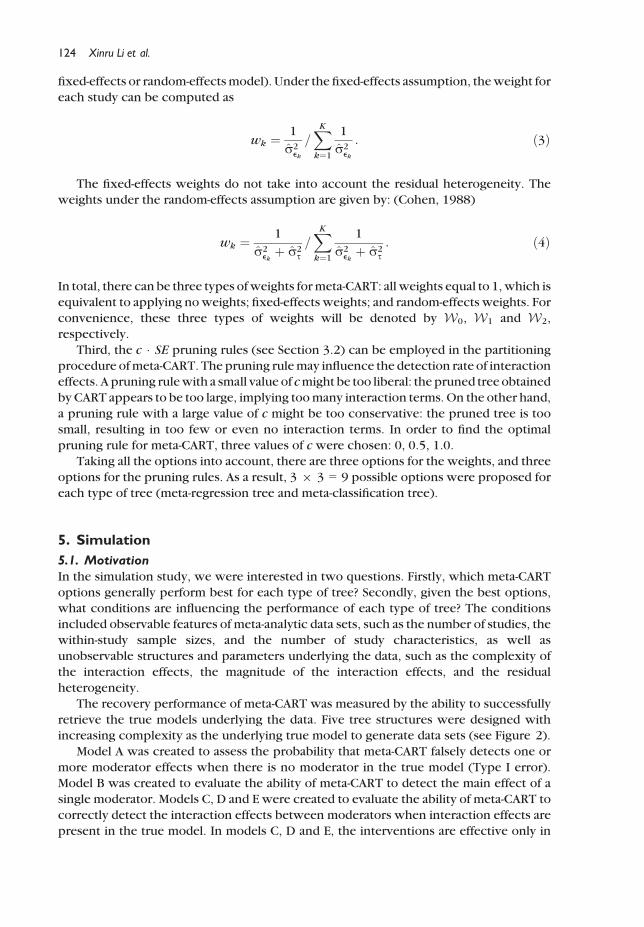
The recovery performance of meta-CART was measured by the ability to successfully
retrieve the true models underlying the data. Five tree structures were designed withincreasing complexity as the underlying true model to generate data sets (see Figure 2).
Model A was created to assess the probability that meta-CART falsely detects one or
more moderator effects when there is no moderator in the true model (Type I error).
Model B was created to evaluate the ability of meta-CART to detect the main effect of a
single moderator. Models C, D and E were created to evaluate the ability of meta-CART to
correctly detect the interaction effects between moderators when interaction effects are
present in the true model. In models C, D and E, the interventions are effective only in
124 Xinru Li et al.
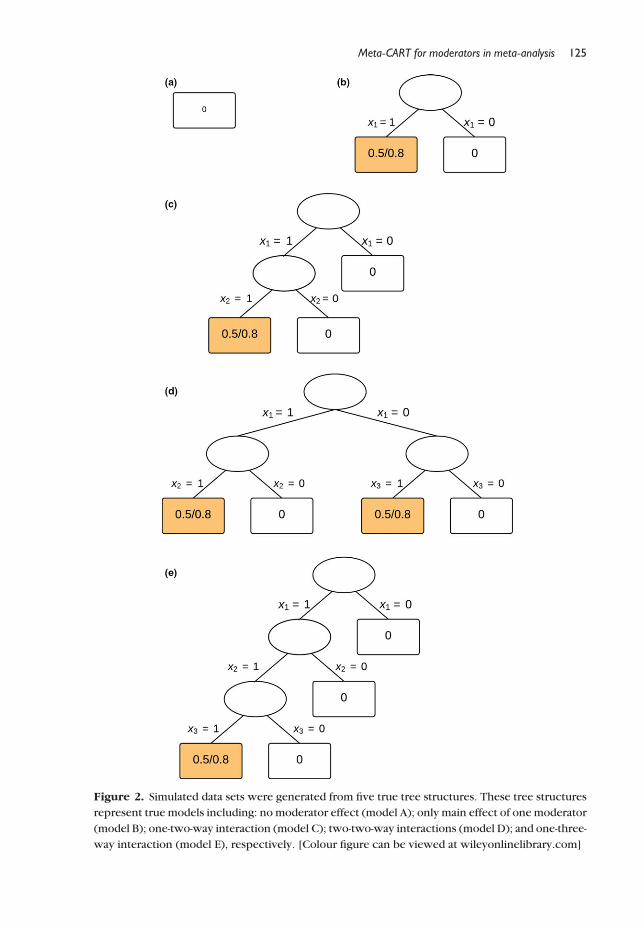
Figure 2. Simulated data sets were generated from five true tree structures. These tree structures
represent true models including: no moderator effect (model A); only main effect of one moderator
(model B); one-two-way interaction (model C); two-two-way interactions (model D); and one-three-
way interaction (model E), respectively. [Colour figure can be viewed at wileyonlinelibrary.com]
Meta-CART for moderators in meta-analysis 125

studies with certain combination(s) of study characteristics. For example, in model C the
interventions are effective onlywhen study characteristics x1 and x2 are both present. The
studies are thus split on moderators into subgroups. The average effect size in the
ineffective subgroups was fixed to be 0. The average effect size in the effective subgroupswas made a design factor and denoted by dI.
5.2. Design factors
Inspired by previous simulation studies by Viechtbauer (2007b) and Higgins and
Thompson (2004), the influence on recovery performance of five design factors was
examined: (1) the number of studies (K); (2) the average within-study sample size (�n); (3)the residual heterogeneity (r2
s ); (4) the number of study-level covariates (M); and (5) themagnitude of the interaction effect (dI). For each truemodel with each combination of the
design factors, 1,000 data sets were generated and analysed using each of the options for
each type of tree, implying 9 9 2 versions of meta-CART.
In a pilot simulation study, it was found that all versions of meta-CART applied to data
sets with K = 20 studies result in poor power rates (≤.30). Therefore, K = 20 was not
included in our final simulation. Instead, three values of K were chosen: 40, 80, 120.
By adjusting the value of thewithin-study sample sizenk, the amount of sampling error
r2ekcan bemanipulated.We used the samemethod as in Viechtbauer (2007b) to generate
nk, by which the values of nk were sampled from a normal distribution with mean �n and
standard deviation �n=3. Three levels of the average within-study sample size �n were
chosen as 40, 80, 160. The resulting nk ranged roughly between 15 and 420, which are
values encountered in practice.
When searching for the combinations of covariates (e.g., BCTs) that result in the most
effective interventions, the covariates are usually coded as binary variables, that is, 0 for
‘not included’ and 1 for ‘included’. Therefore, in the simulation study we focused on the
detection of interaction effects between binary moderators. To assess how manycovariates (i.e., potential moderators) meta-CART can deal with to successfully identify
the true moderators and the interaction effect(s) between them, three values of the
number of covariates M were chosen: 5, 10, 20.
Unfortunately, the values of residual heterogeneity are rarely reported in the literature
on meta-analysis. In a very few papers that reported values of residual heterogeneity, r2sranges between 0 and .05 (Dusseldorp et al., 2014; Viechtbauer, 2007a). Thus, the values
of r2s were chosen as 0, .025, .05.
The magnitude of the interaction effect was measured by the average effect size of thestudies in the effective subgroups dI. The pilot simulation study showed that all versions of
meta-CART failed to achieve enough power (≤.70) to detect a small interaction effect with
dI = .2. Therefore, two values of dIwere chosen as .5 and .8, corresponding to a medium
and a large effect size, respectively (Cohen, 1988).
5.3. Monte Carlo simulation
Artificial data sets were generated from each true model with each combination of thedesign factors. As mentioned before, in each cell of the design, 1,000 meta-analytic data
sets were generated. Eachmeta-analytic data set consists of two subsets of the same size: a
training data set for fitting themodel, and a test data set for estimating the prediction error.
Within each data set, binary study characteristics were generated independently from
a Bernoulli distribution with a probability of .50. For a single study, the true effect size dk
126 Xinru Li et al.

was sampled from a normal distribution with mean D and variance r2s , where D is the
average population effect size. The value of D depends on the moderators and the
corresponding true model. Then the observed effect size gk was sampled from a non-
central t-distribution (see Appendix S1).The 9 9 2 versions of meta-CART were applied to each generated data set. The
interaction effects were investigated in the first step, and the significance was tested
by the between-subgroups Q-statistic with a = .05 in the second step on the same
data set.
5.4. The evaluation criteria for success
Three criteria are employed to judge whether meta-CART successfully retrieved the truemodel underlying the data:
Criterion 1. Meta-CART correctly detects the presence of moderator effect(s) in the
data sets generated from model B, C, D or E (power).
Criterion 2.Meta-CART obtains a pruned treewith exactly the samenumber of terminalnodes as the true structure underlying the data (recovery of tree complexity).
Criterion 3. Meta-CART successfully selects the study characteristics used in the true
model (recovery of moderator(s)).
Each of the three criteria was evaluated and coded 0 for ‘not satisfied’ and 1 for
‘satisfied’ for each data set. Subsequently, for each cell of the design, the proportion of
successful (i.e., ‘satisfied’) solutions was computed per criterion.
6. Results
6.1. The best options on average
The first goal of the simulation study was to find the best combination of options of each
type of meta-CART that has the best overall performance in most conditions (i.e., across
different design factors). The performance of meta-CART was evaluated in terms of the
Type I error rates and the three evaluation criteria. Table 2 shows the estimated Type Ierror rates averaged over all design factors for the 9 9 2 versions of meta-CART. The
average Type I error rates of meta-regression trees range from .014 to .118, and the
standard deviations range from .013 to .029. The averaged Type I error rates of meta-
classification trees range from .347 to .485 and the standard deviations range from .112 to
.189. In general, the Type I error rates mainly depend on the type of tree (meta-regression
trees outperform meta-classification trees) and the pruning rule, but not on the type of
weights.
Table 2. Type I error rates of meta-CART, averaged over design factors
Model c
Meta-regression tree Meta-classification tree
W0 W1 W2 W0 W1 W2
A 0.0 .114 (.029) .118 (.028) .117 (.029) .485 (.179) .447 (.173) .477 (.189)0.5 .041 (.021) .044 (.022) .042 (.022) .447 (.156) .398 (.141) .432 (.159)1.0 .014 (.013) .015 (.014) .014 (.013) .391 (.130) .347 (.112) .380 (.132)
Type I error rates higher than .05 are in boldface.
Meta-CART for moderators in meta-analysis 127
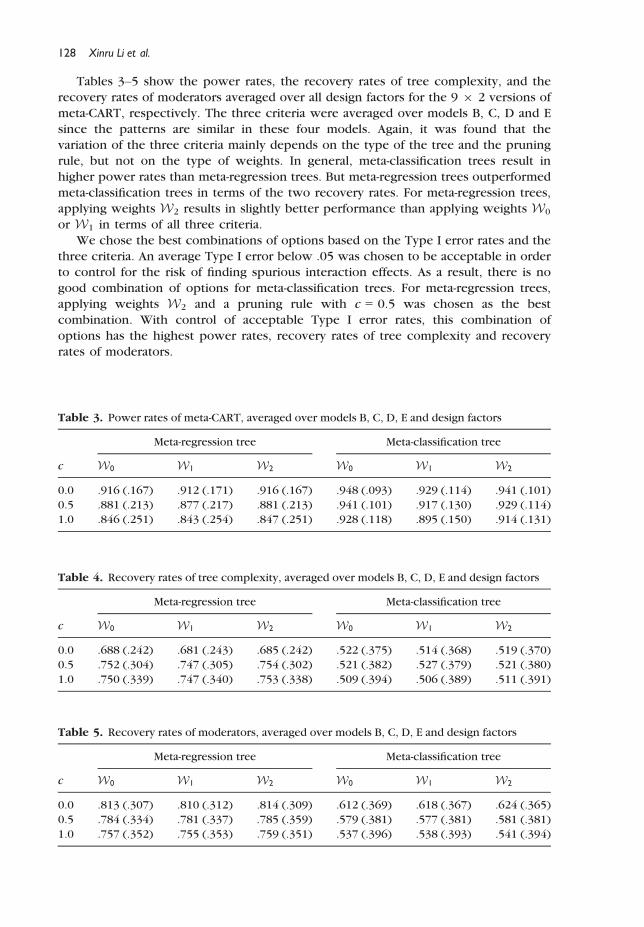
Tables 3–5 show the power rates, the recovery rates of tree complexity, and the
recovery rates of moderators averaged over all design factors for the 9 9 2 versions of
meta-CART, respectively. The three criteria were averaged over models B, C, D and E
since the patterns are similar in these four models. Again, it was found that thevariation of the three criteria mainly depends on the type of the tree and the pruning
rule, but not on the type of weights. In general, meta-classification trees result in
higher power rates than meta-regression trees. But meta-regression trees outperformed
meta-classification trees in terms of the two recovery rates. For meta-regression trees,
applying weights W2 results in slightly better performance than applying weights W0
or W1 in terms of all three criteria.
We chose the best combinations of options based on the Type I error rates and the
three criteria. An average Type I error below .05 was chosen to be acceptable in orderto control for the risk of finding spurious interaction effects. As a result, there is no
good combination of options for meta-classification trees. For meta-regression trees,
applying weights W2 and a pruning rule with c = 0.5 was chosen as the best
combination. With control of acceptable Type I error rates, this combination of
options has the highest power rates, recovery rates of tree complexity and recovery
rates of moderators.
Table 3. Power rates of meta-CART, averaged over models B, C, D, E and design factors
c
Meta-regression tree Meta-classification tree
W0 W1 W2 W0 W1 W2
0.0 .916 (.167) .912 (.171) .916 (.167) .948 (.093) .929 (.114) .941 (.101)
0.5 .881 (.213) .877 (.217) .881 (.213) .941 (.101) .917 (.130) .929 (.114)
1.0 .846 (.251) .843 (.254) .847 (.251) .928 (.118) .895 (.150) .914 (.131)
Table 4. Recovery rates of tree complexity, averaged over models B, C, D, E and design factors
c
Meta-regression tree Meta-classification tree
W0 W1 W2 W0 W1 W2
0.0 .688 (.242) .681 (.243) .685 (.242) .522 (.375) .514 (.368) .519 (.370)
0.5 .752 (.304) .747 (.305) .754 (.302) .521 (.382) .527 (.379) .521 (.380)
1.0 .750 (.339) .747 (.340) .753 (.338) .509 (.394) .506 (.389) .511 (.391)
Table 5. Recovery rates of moderators, averaged over models B, C, D, E and design factors
c
Meta-regression tree Meta-classification tree
W0 W1 W2 W0 W1 W2
0.0 .813 (.307) .810 (.312) .814 (.309) .612 (.369) .618 (.367) .624 (.365)
0.5 .784 (.334) .781 (.337) .785 (.359) .579 (.381) .577 (.381) .581 (.381)
1.0 .757 (.352) .755 (.353) .759 (.351) .537 (.396) .538 (.393) .541 (.394)
128 Xinru Li et al.

6.2. The influence of the design factors
The secondgoal of the simulation study is to evaluate the influence of the design factors on
the Type I error and the three criteria. We focus on the results of meta-regression trees
using only the best combination of options (as defined above). The Type I error rates andthe three criteria were computed separately for each model and each combination of the
design factors. The resulting proportions were subjected to an analysis of variance
(ANOVA) with the five design factors and their interactions as independent variables and
the five-way interaction used as an error term.
Formodel A, the ANOVA results reveal that only the number of studies (K) has a strong
influence (partialg2 > .80) on the Type I error rates. The Type I error rates decrease with
increasing K (.069, .035, .021 when K = 40, 80, 120, respectively).
For models B, C, D and E, the ANOVA results reveal that all the design factors andmostof their interactions have strong influence (partial g2 > .80) on the three criteria. Despite
some noise, in general, the three criteria are positively related to the number of studies
(K), the averagewithin-study sample size (�n), and themagnitude of interaction effects (dI).On the other hand, the three criteria are negatively influenced by the number of potential
moderators (M) and the residual heterogeneity (r2s ). The plots representing the three
criteria have similar patterns. Because the recovery rate of tree complexity is the strictest
criterion among the three, these plots are represented in Figures 3–5 for each cell of the
design. The plots representing the power rates and the recovery rates of moderators canbe found in Appendices S4 and S5. Note that the figures are ordered from K = 120 to
K = 40 (left to right).
When there is only one main effect in the true model (model B), the recovery rates are
satisfactory (≥ .80; not shown) in all cases except one: it is .75 in the case of a medium-
sized main effect, a small number of studies, a small within-study sample size, a large
number of moderators and large residual heterogeneity (K ¼ 40; �n ¼ 40; dI ¼ 0:8,M ¼ 20;r2
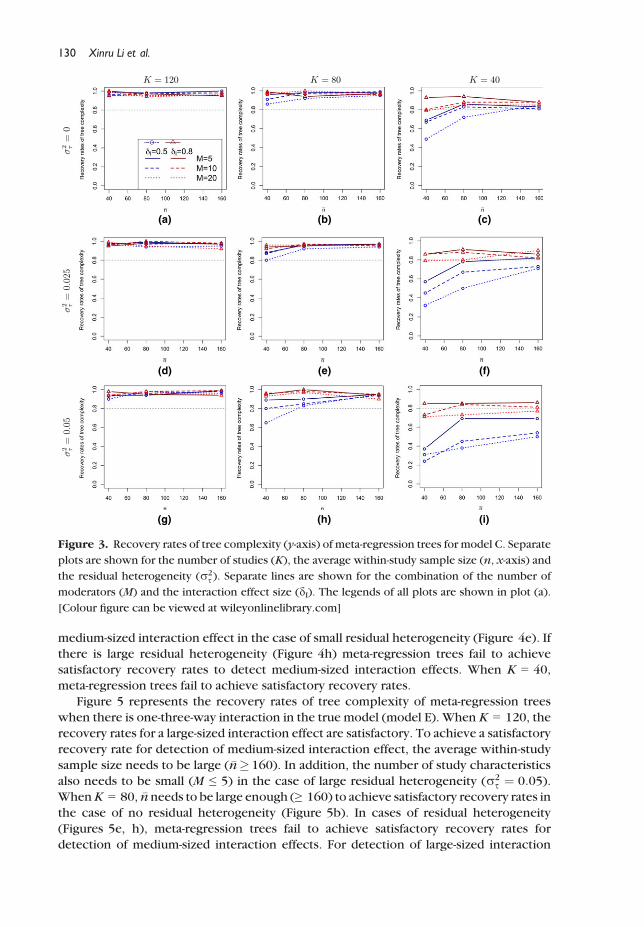
s ¼ 0:05).Figure 3 represents the recovery rates of tree complexity of meta-regression trees
when there is one-two-way interaction in the truemodel (model C).WhenK = 120,meta-
regression trees can always achieve a satisfactory recovery rate (≥ .80).WhenK = 80, the
recovery rates are satisfactory in most cases, with one exception: the recovery rates for
detecting a medium-sized interaction effect (dI = 0.5) are between .60 and .80 in cases of
large residual heterogeneity and a large number of study characteristics (r2s ¼ 0:05,
M = 20). When K = 40, the average within-study sample size needs to be large enough
(�n� 160Þ to achieve a satisfactory recovery rate in cases of no residual heterogeneity
(Figure 3c). In cases of residual heterogeneity (Figures 3f, i), meta-regression trees canachieve a satisfactory recovery rate for a medium-sized interaction effect only if the
residual heterogeneity is relatively small (r2s ¼ 0:025), the within-study sample size is
large (�n ¼ 160), and the number of moderators is small (M = 5). If the average within-
study sample size is large enough and thenumber of study characteristics is relatively small
(�n� 80, M ≤ 10), the recovery rates are satisfactory for a large-sized interaction effect
(dI = 0.8).
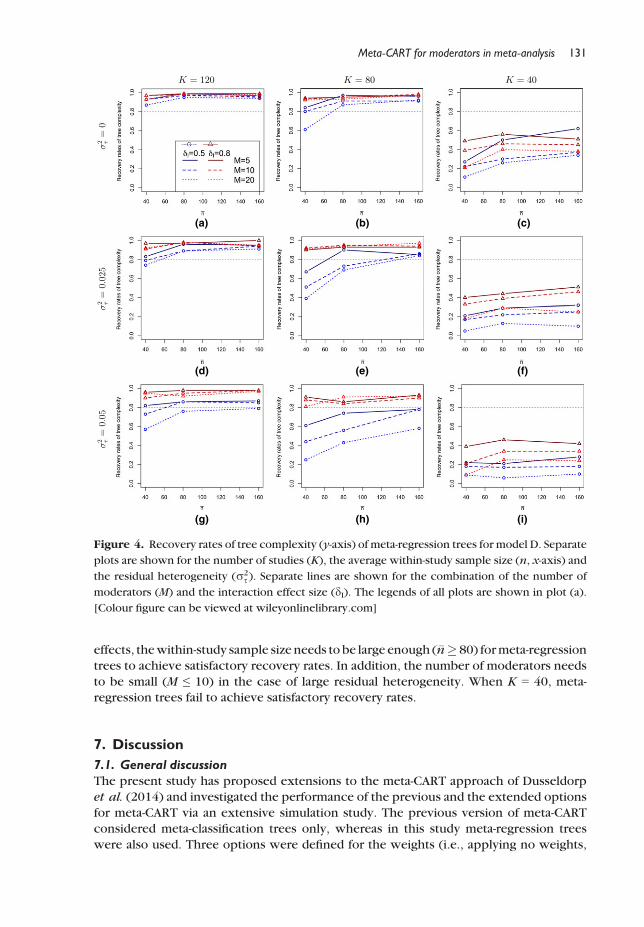
Figure 4 represents the recovery rates of tree complexity of meta-regression trees
when there are two-two-way interactions in the true model (model D). When K = 120,meta-regression trees achieve satisfactory recovery rates in most cases, with four
exceptions: the recovery rates for amedium-sized interaction effect are between .5 and .8
in the case of residual heterogeneity (r2s � 0:025) andM ≥ 10 (Figure 4g). WhenK = 80,
the picture is more complex. The recovery rates for detection of large-sized interaction
effects are satisfactory. If �n� 160, the recovery rate is satisfactory to detect a
Meta-CART for moderators in meta-analysis 129
medium-sized interaction effect in the case of small residual heterogeneity (Figure 4e). If
there is large residual heterogeneity (Figure 4h) meta-regression trees fail to achievesatisfactory recovery rates to detect medium-sized interaction effects. When K = 40,
meta-regression trees fail to achieve satisfactory recovery rates.
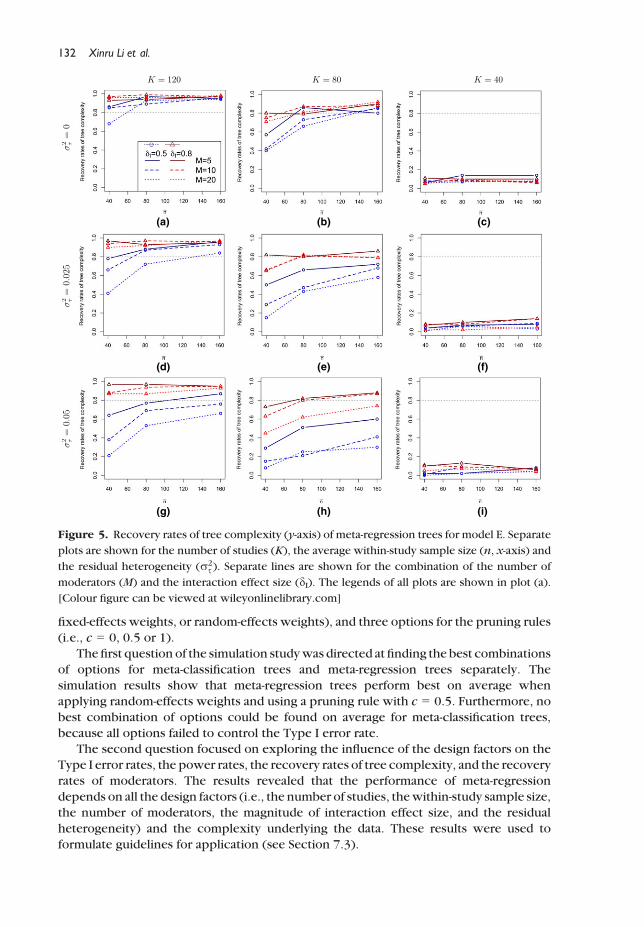
Figure 5 represents the recovery rates of tree complexity of meta-regression trees
when there is one-three-way interaction in the true model (model E). When K = 120, the
recovery rates for a large-sized interaction effect are satisfactory. To achieve a satisfactory
recovery rate for detection of medium-sized interaction effect, the average within-study
sample size needs to be large (�n� 160). In addition, the number of study characteristics
also needs to be small (M ≤ 5) in the case of large residual heterogeneity (r2s ¼ 0:05).
WhenK = 80, �n needs to be large enough (≥ 160) to achieve satisfactory recovery rates in
the case of no residual heterogeneity (Figure 5b). In cases of residual heterogeneity
(Figures 5e, h), meta-regression trees fail to achieve satisfactory recovery rates for
detection of medium-sized interaction effects. For detection of large-sized interaction
(a)
(d)
(g)
(b)
(e)
(h)
(c)
(f)
(i)
Figure 3. Recovery rates of tree complexity (y-axis) of meta-regression trees for model C. Separate
plots are shown for the number of studies (K), the average within-study sample size (n, x-axis) and
the residual heterogeneity (r2s ). Separate lines are shown for the combination of the number of
moderators (M) and the interaction effect size (dI). The legends of all plots are shown in plot (a).
[Colour figure can be viewed at wileyonlinelibrary.com]
130 Xinru Li et al.
effects, thewithin-study sample size needs to be large enough (�n� 80) formeta-regression
trees to achieve satisfactory recovery rates. In addition, the number of moderators needs
to be small (M ≤ 10) in the case of large residual heterogeneity. When K = 40, meta-regression trees fail to achieve satisfactory recovery rates.
7. Discussion
7.1. General discussion
The present study has proposed extensions to the meta-CART approach of Dusseldorpet al. (2014) and investigated the performance of the previous and the extended options
for meta-CART via an extensive simulation study. The previous version of meta-CART
considered meta-classification trees only, whereas in this study meta-regression trees
were also used. Three options were defined for the weights (i.e., applying no weights,
(a)
(d)
(g)
(b)
(e)
(h)
(c)
(f)
(i)
Figure 4. Recovery rates of tree complexity (y-axis) of meta-regression trees for model D. Separate
plots are shown for the number of studies (K), the average within-study sample size (n, x-axis) and
the residual heterogeneity (r2s ). Separate lines are shown for the combination of the number of
moderators (M) and the interaction effect size (dI). The legends of all plots are shown in plot (a).
[Colour figure can be viewed at wileyonlinelibrary.com]
Meta-CART for moderators in meta-analysis 131
fixed-effects weights, or random-effects weights), and three options for the pruning rules
(i.e., c = 0, 0.5 or 1).
The first question of the simulation studywas directed at finding the best combinations
of options for meta-classification trees and meta-regression trees separately. The
simulation results show that meta-regression trees perform best on average when
applying random-effects weights and using a pruning rule with c = 0.5. Furthermore, no
best combination of options could be found on average for meta-classification trees,
because all options failed to control the Type I error rate.The second question focused on exploring the influence of the design factors on the
Type I error rates, the power rates, the recovery rates of tree complexity, and the recovery
rates of moderators. The results revealed that the performance of meta-regression
depends on all the design factors (i.e., the number of studies, thewithin-study sample size,
the number of moderators, the magnitude of interaction effect size, and the residual
heterogeneity) and the complexity underlying the data. These results were used to
formulate guidelines for application (see Section 7.3).
(a)
(d)
(g)
(b)
(e)
(h)
(c)
(f)
(i)
Figure 5. Recovery rates of tree complexity (y-axis) of meta-regression trees for model E. Separate
plots are shown for the number of studies (K), the average within-study sample size (n, x-axis) and
the residual heterogeneity (r2s ). Separate lines are shown for the combination of the number of
moderators (M) and the interaction effect size (dI). The legends of all plots are shown in plot (a).
[Colour figure can be viewed at wileyonlinelibrary.com]
132 Xinru Li et al.
Meta-CART was proposed to overcome the difficulties of standard meta-regression to
dealwithmultiple study characteristics and higher-order interactions in exploratorymeta-
analytic studies. However, if there are a priori hypotheses about possible interactions
between moderators (i.e., in confirmatory studies), the advantage of standard meta-regression is that the interaction(s) can be specified beforehand and tested. Thus, meta-
regression is the recommended tool for confirmatory meta-analytic studies. On the other
hand, meta-CART is recommended for exploratory studies, especially for studies with
multiple study characteristics and for studies interested in higher-order interactions.
Another difference between meta-CART and meta-regression is the interpretation of
the interaction effects. The interaction effects in meta-CART are presented in a
parsimonious tree structure. In meta-regression, interaction effects are represented by
strictly additive functions. For example, model D in Figure 2 with a medium-sizedinteraction effect can be expressed as
dk ¼ 0:5 � x3k þ 0:5 � x1kx2k � 0:5 � x1kx3k: ð5Þ
It is worth noting that, without looking at the interactions, researchers might draw the
falseconclusion that interventionswith thecharacteristicx3have apositive treatmenteffect
in general. Compared to a linear regression model, the tree model directly shows that the
intervention is effective only in those interventions with x1 and x2 both present, and those
with x3 present but x1 absent. Although the tree structure provides a straightforward visualrepresentationwitheasy interpretability, a downsideofmeta-CARTmaybe thatmaineffects
and interaction effects between multiple moderators are hardly distinguished. In contrast,
regressionmodels arewell suited for representing strictly additive functions butmay not be
able to represent complex interaction patterns and non-linear effects (Little, 2013).
7.2. Strengths, shortcomings, and remaining issues
One strength of our study is that the design factors of the simulation covered most valuesthathavebeenencounteredinpractice.Ourresults showthat thepowerrates, therecovery
rates of tree complexity and the recovery rates ofmoderators arewell discriminated by the
differentvaluesofdesign factors, that is, theconditions resulting inhighperformance inthe
three criteria and those resulting in low performance are both encountered.
There are still some shortcomings in our study, some concerning the simulation design
and others concerning the meta-CART algorithm. Firstly, the potential moderators in the
simulation study only contain binary variables, and were independently generated. For
binary moderators, there is only one possible split point for each moderator. As a result,meta-regression trees were found to be stable in the simulation study. However, the
stability of meta-regression trees might be an issue when dealing with nominal or
continuous moderator variables, since there are more possible split points. Secondly, the
true models that we designed to generate the data sets contained only one or two
interaction effects between moderators. However, interactions can be much more
complex in real-world data Dusseldorp et al., 2014). Furthermore, the true intervention
effect sizes in the ineffective subgroupswere designed to be all 0s, and the true effect sizes
for the effective subgroups only contained two values: .5 or .8. This might be toosimplistic. We intend to investigate the performance of meta-CART on nominal or
continuous predictors and more complex scenarios in future work.
There are also some shortcomings concerning the meta-CART algorithm. First, in our
pilot simulation study, it was found that all implementations of meta-CART had limited
Meta-CART for moderators in meta-analysis 133

detection rates (≤.30) when applied to data sets with K = 20 studies. This means that
meta-CART is not recommended for meta-analytic data with K ≤ 20 studies. Second, the
procedure follows a stepwise approach. As a result, it lacks efficiency, and it uses a local
optimization procedure, which is a general shortcoming of recursive partitioningmethods. The two-step procedure also raises the issue of statistical inference. It would be
interesting in future work to integrate the two steps, and to investigate whether a global
optimizationprocedure is possible.Onepossible solution is tomaximize a test statistic, for
example, the chi-square statistic, over all possible combinations of covariates Boulesteix,
2006). Another possible solution is to implement a statistical test within the recursive
partitioning to determine the best size of the tree (Hothorn, Hornik, & Zeileis, 2006).
Third, the improvement in the performance of meta-CART by applying random-effects
weights was small. One possible reason is that the current partitioning criterion is basedon the CART algorithm, and it does not take into account the residual heterogeneity (i.e.,
r2s ). A possible improvement might be to apply random-effects weights together with a
partitioning criterion that maximizes the between-subgroups Q-statistic or minimizes the
residual heterogeneity in meta-CART.
Thesimulationresults revealedthatalloptions formeta-classificationtreesresult inhigh
average Type I error rates (ranging from .347 to .485). A possible explanation is that the
dichotomization of the response variable (i.e., study effect sizes) in classification trees
produces spurious results and inflates the Type I error rates. In Maxwell and Delaney(1993), ithasbeenshownthatdichotomizingmultiplepredictorvariablesmaydramatically
increase the probability of Type I errors in some situations. This study shows that
dichotomizing the response variablemay also increase this probability. Another reason for
theType Ierror inflation is that the subgroupmeta-analysis in the secondstepdoesnothold
the nominal alpha level. Meta-CART detects and then tests interaction effects between
moderators by using the same data set. Such subgroupmeta-analyses are post hoc tests and
raise problems of statistical inference. In the two-step procedure, the Type I error rates are
controlled by two things: the pruning parameter and the nominal alpha level of thesubgroup Q-statistic. To control the Type I error, we fixed the nominal alpha level at .05
since this is themost commonly used value inpractice, andwe chose the best pruning rule
that results in acceptable Type I error rates. For meta-regression trees, this approach finds
c = 0.50 as the best pruning parameter. Formeta-classification trees, however, nopruning
parameter can prevent the inflation of Type I error.
7.3. Guidelines for application of meta-CARTAccording to the simulation results, we recommend the use of meta-regression trees
rather thanmeta-classification trees. Furthermore, applying random-effects weights and a
pruning rule with c = 0.50 was chosen as the best combination of options for meta-
regression trees. There is, however, a shortcoming for applying random-effects weights in
a practical application: the computation of the random-effects weights requires the value
of the residual heterogeneity r2s , which is not known a priori. There are two possible
solutions for this problem. One suggested solution is to apply a meta-regression tree
without weights and a pruning rule with c = 0.50 instead, since the simulation studyshows that there is only a slight difference in the performance between the two
combinations of options. An alternative solution is to first estimate the r2s by employing a
meta-regression tree without weights, and then use the estimated residual heterogeneity
r̂2s to compute the random-effects weights.
134 Xinru Li et al.
Based on the simulation study results, recommendations can be made about the
number of studies included in a meta-analysis using meta-CART to achieve satisfactory
performance. This number depends on the complexity of the data and the number of
study characteristics. In general, 40 is the minimum number of studies required formeta-CART to perform well in detecting simple interaction effects, that is, only one-
two-way interaction. To detect more complex interaction effects, such as more than
one-two-way interactions, or higher-order interactions, at least 80 studies are needed
for meta-CART to achieve a power higher than .80. Data sets with 120 or more studies
would be ideal since meta-CART performs well in most cases, even in cases with
residual heterogeneity or complex interaction effects. In the case of large residual
heterogeneity (≥ 0.025) and complex interaction effects, meta-CART requires more
studies and larger within-study sample size (K ≥ 120, �n� 160) for data sets with morethan five study characteristics. However, the performance of meta-CART is not much
influenced by the number of study characteristics in the case of small residual
heterogeneity or a two-way interaction effect.
Acknowledgements
The authors gratefully acknowledge Dr. Wolfgang Viechtbauer for his helpful advice, and
the nominee reviewers for their inspiring suggestions to previous versions of this paper.
References
Borenstein, M., Hedges, L. V., Higgins, J. P., & Rothstein, H. R. (2009). Introduction to meta-
analysis. Hoboken, NJ: Wiley.
Boulesteix, A.-L. (2006). Maximally selected chi-square statistics and binary splits of nominal
variables. Biometrical Journal, 48, 838–848. doi:10.1002/bimj.200510191
Breiman, L., Friedman, J., Stone, C. J., & Olshen, R. A. (1984). Classification and regression trees.
Belmont, CA: Wadsworth.
Cohen, J. (1988). Statistical power analysis for the behavioral sciences. Hillsdale, NJ: Lawrence
Erlbaum Associates.
Dusseldorp, E., Conversano, C., & Van Os, B. J. (2010). Combining an additive and tree-based
regression model simultaneously: STIMA. Journal of Computational and Graphical Statistics,
19(3), 514–530. doi:10.1198/jcgs.2010.06089Dusseldorp, E., van Genugten, L., van Buuren, S., Verheijden, M. W., & van Empelen, P. (2014).
Combinations of techniques that effectively change health behavior: Evidence frommeta-CART
analysis. Health Psychology, 33(12), 1530–1540. doi:10.1037/hea0000018Hedges, L. V. (1981). Distribution theory for Glass’s estimator of effect size and related estimators.
Journal of Educational and Behavioral Statistics, 6, 107–128. doi:10.3102/
10769986006002107
Higgins, J.,&Thompson, S.G. (2004). Controlling the risk of spurious findings frommeta-regression.
Statistics in Medicine, 23(11), 1663–1682. doi:10.1002/sim.1752
Hothorn, T., Hornik, K., & Zeileis, A. (2006). Unbiased recursive partitioning: A conditional
inference framework. Journal of Computational and Graphical Statistics, 15(3), 651–674.doi:10.1198/106186006X133933
Huisman, S. D., De Gucht, V., Dusseldorp, E., & Maes, S. (2009). The effect of weight reduction
interventions for persons with type 2 diabetes: A meta-analysis from a self-regulation
perspective. Diabetes Educator, 35, 818–835. doi:10.1177/0145721709340929Hunter, J. E., & Schmidt, F. L. (1990). Dichotomization of continuous variables: The implications for
meta-analysis. Journal of Applied Psychology, 75(3), 334. doi:10.1037/0021-9010.75.3.334
Meta-CART for moderators in meta-analysis 135

Little, T. D. (2013). TheOxford handbook of quantitativemethods, Volume 2: Statistical analysis.
Oxford, UK: Oxford University Press.
Maxwell, S. E., & Delaney, H. D. (1993). Bivariate median splits and spurious statistical significance.
Psychological Bulletin, 113(1), 181. doi:10.1037/0033-2909.113.1.181
Merkle, E. C., & Shaffer, V. A. (2011). Binary recursive partitioning: Background, methods, and
application to psychology. British Journal of Mathematical and Statistical Psychology, 64(1),
161–181. doi:10.1348/000711010X503129Michie, S., Abraham, C., Whittington, C., McAteer, J., & Gupta, S. (2009). Effective techniques in
healthy eating and physical activity interventions: A meta-regression. Health Psychology, 28,
690–701. doi:10.1037/a0016136Michie, S., Johnson, B. T., & Johnston, M. (2015). Advancing cumulative evidence on behaviour
change techniques and interventions: A comment on Peters, de Bruin, and Crutzen. Health
Psychology Review, 9(1), 25–29. doi:10.1080/17437199.2014.912538Normand, S.-L. T. (1999). Tutorial in biostatisticsmeta-analysis: Formulating, evaluating, combining,
and reporting. Statistics in Medicine, 18, 321–359. doi:10.1002/(SICI)1097-0258(20000315)19:53.0.CO;2-F
O’Brien, N., McDonald, S., Ara�ujo-Soares, V., Lara, J., Errington, L., Godfrey, A., . . . Sniehotta, F. F.(2015). The features of interventions associatedwith long-term effectiveness of physical activity
interventions in adults aged 55-70 years: A systematic review and meta-analysis. Health
Psychology Review, 9, 417–433. doi:10.1080/17437199.2015.1012177S�anchez-Meca, J., & Mar�ın-Mart�ınez, F. (1998). Testing continuous moderators in meta- analysis: A
comparison of procedures. British Journal of Mathematical and Statistical Psychology, 51(2),
311–326. doi:10.1111/j.2044-8317.1998.tb00683.xThompson, S. G. (1994). Systematic review:Why sources of heterogeneity inmeta-analysis should be
investigated. British Medical Journal, 309(6965), 1351–1355. doi:10.1136/bmj.309.6965.1351
Thompson, S. G., & Sharp, S. J. (1999). Explaining heterogeneity in meta-analysis: A comparison of
methods. Statistics in Medicine, 18(20), 2693–2708. doi:10.1002/(SICI)1097-0258(19991030)18:20%3C2693::AID-SIM235%3E3.0.CO;2-V
Viechtbauer, W. (2007a). Accounting for heterogeneity via random-effects models and moderator
analyses in meta-analysis. Zeitschrift f€ur Psychologie/Journal of Psychology, 215, 104–121.doi:10.1027/0044-3409.215.2.104
Viechtbauer, W. (2007b). Hypothesis tests for population heterogeneity in meta-analysis. British
Journal of Mathematical and Statistical Psychology, 60(1), 29–60. doi:10.1348/
000711005X64042
Viechtbauer, W. (2010). Conducting meta-analyses in R with the metafor package. Journal of
Statistical Software, 36(3), 1–48. doi:10.18637/jss.v036.i03Welton, N. J., Caldwell, D., Adamopoulos, E., & Vedhara, K. (2009). Mixed treatment comparison
meta-analysis of complex interventions: Psychological interventions in coronary heart disease.
American Journal of Epidemiology, 169(9), 1158–1165. doi:10.1093/aje/kwp014
Received 22 December 2015; revised version received 13 October 2016
Supporting Information
The following supporting informationmay be found in the online edition of the article:
Appendix S1. The SMD effect size in meta-analysis.
Appendix S2. Test of heterogeneity.Appendix S3. Partitioning criterion in CART.
Appendix S4. Plots displaying the power rates.
Appendix S5. Plots displaying recovery rates of moderators.
136 Xinru Li et al.