meta-analysis of graduated driver licensing laws · jiaquan, 2012). graduated driver licensing...
TRANSCRIPT

DOT HS 812 211 November 2015
Meta-Analysis of Graduated Driver Licensing Laws
This publication is distributed by the U.S. Department of
Transportation, National Highway Traffic Safety Administration, in the interest of information exchange. The opinions, findings, and conclusions expressed in this publication are those of the authors and not necessarily those of the Department of Transportation or the National Highway Traffic Safety Administration. The United States Government assumes no liability for its contents or use thereof. If trade or manufacturers’ names or products are mentioned, it is because they are considered essential to the object of the publication and should not be construed as an endorsement. The United States Government does not endorse products or manufacturers.
Suggested APA Format Citation: Masten, S. V., Thomas, F. D., Korbelak, K. T., Peck, R. C., & Blomberg, R. D. (2015, November).
Meta-analysis of graduated driver licensing laws. (Report No. DOT HS 812 211). Washington, DC: National Highway Traffic Safety Administration.
i
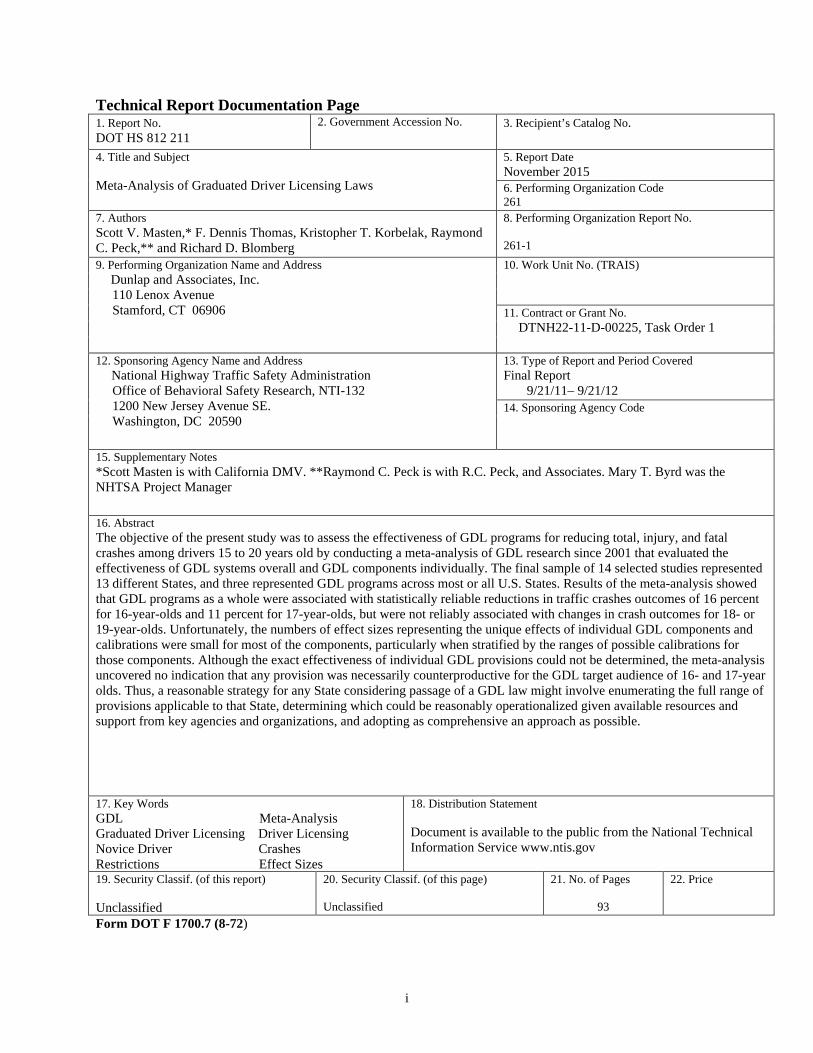
Technical Report Documentation Page 1. Report No. DOT HS 812 211
2. Government Accession No. 3. Recipient’s Catalog No.
4. Title and Subject Meta-Analysis of Graduated Driver Licensing Laws
5. Report Date November 2015 6. Performing Organization Code 261
7. Authors Scott V. Masten,* F. Dennis Thomas, Kristopher T. Korbelak, Raymond C. Peck,** and Richard D. Blomberg
8. Performing Organization Report No. 261-1
9. Performing Organization Name and Address Dunlap and Associates, Inc. 110 Lenox Avenue Stamford, CT 06906
10. Work Unit No. (TRAIS)
11. Contract or Grant No. DTNH22-11-D-00225, Task Order 1
12. Sponsoring Agency Name and Address National Highway Traffic Safety Administration Office of Behavioral Safety Research, NTI-132 1200 New Jersey Avenue SE. Washington, DC 20590
13. Type of Report and Period Covered Final Report 9/21/11– 9/21/12 14. Sponsoring Agency Code
15. Supplementary Notes *Scott Masten is with California DMV. **Raymond C. Peck is with R.C. Peck, and Associates. Mary T. Byrd was the NHTSA Project Manager
16. Abstract The objective of the present study was to assess the effectiveness of GDL programs for reducing total, injury, and fatal crashes among drivers 15 to 20 years old by conducting a meta-analysis of GDL research since 2001 that evaluated the effectiveness of GDL systems overall and GDL components individually. The final sample of 14 selected studies represented 13 different States, and three represented GDL programs across most or all U.S. States. Results of the meta-analysis showed that GDL programs as a whole were associated with statistically reliable reductions in traffic crashes outcomes of 16 percent for 16-year-olds and 11 percent for 17-year-olds, but were not reliably associated with changes in crash outcomes for 18- or 19-year-olds. Unfortunately, the numbers of effect sizes representing the unique effects of individual GDL components and calibrations were small for most of the components, particularly when stratified by the ranges of possible calibrations for those components. Although the exact effectiveness of individual GDL provisions could not be determined, the meta-analysis uncovered no indication that any provision was necessarily counterproductive for the GDL target audience of 16- and 17-year olds. Thus, a reasonable strategy for any State considering passage of a GDL law might involve enumerating the full range of provisions applicable to that State, determining which could be reasonably operationalized given available resources and support from key agencies and organizations, and adopting as comprehensive an approach as possible.
17. Key Words GDL Meta-Analysis Graduated Driver Licensing Driver Licensing Novice Driver Crashes Restrictions Effect Sizes
18. Distribution Statement Document is available to the public from the National Technical Information Service www.ntis.gov
19. Security Classif. (of this report) Unclassified
20. Security Classif. (of this page) Unclassified
21. No. of Pages
93
22. Price
Form DOT F 1700.7 (8-72)

ii
ACKNOWLEDGEMENTS
The authors thank Neil Chaudhary of Preusser Research Group, Brian Tefft of AAA
Foundation for Traffic Safety, Jean Shope of the University of Michigan Transportation Research Institute, and David Neyens of Clemson University, Department of Industrial Engineering, for providing additional information and data without which many of the effect sizes could not have been coded. In addition they thank Michael Borenstein and Steven Tarlow of Comprehensive Meta-Analysis for providing technical help with modeling-related issues.
The opinions, findings, and conclusions expressed in this publication are those of the
authors and do not necessarily reflect the views of the National Highway Traffic Safety Administration, the above listed contributors, or the authors of the studies included in the meta-analysis.

iii
EXECUTIVE SUMMARY
Motor vehicle crashes continue to be the leading cause of death for 15- to 20-year-olds (Hoyert & Jiaquan, 2012). Graduated driver licensing (GDL) programs, which are specialized driver licensing systems for beginner drivers, have been implemented in United States to reduce young teen drivers’ exposure to high-risk driving situations while they gain driving experience. GDL programs include three different stages of licensure: (a) a mandatory minimum learner permit period during which new drivers are only allowed to drive under the supervision of a licensed adult; (b) an intermediate period during which the new drivers are allowed to drive unsupervised, but are subject to licensing restrictions regarding passenger ages and the times during which they may drive; and (c) a final stage of unrestricted licensure allowing driving under all conditions. GDL programs in the U.S. hardly represent a single homogeneous intervention; rather, programs vary characteristics such as age and time criteria, lengths of the learner permit and restricted license stages, required hours of supervised practice, and types and lengths of license restrictions included (IIHS, 2012).
While there is a growing body of evidence that supports GDL systems as effective for reducing young driver crashes, little is collectively known about which specific characteristics or provisions of GDL programs, such as minimum learner permit holding periods, and what parameters or calibrations of the provisions are associated with the largest crash reductions. Thus, the objective of this study was to conduct a meta-analysis to systematically synthesize research findings regarding the effectiveness of GDL programs and varied components (e.g., learner entry ages, nighttime driving restrictions) for reducing total, injury, and fatal crashes among drivers aged 15 to 20 years.
Fourteen studies were included in the meta-analysis and the findings suggest that GDL laws create a safety benefit for 16-year-old drivers and potentially have a safety benefit for 17-year-old drivers, although to a lesser extent. Given the diversity in the configuration of GDL provisions among the States, the individual contributions of these characteristics to the overall observed effect was also of interest, however, insufficient studies with suitable information available existed to answer this question. Further, a valid study of individual GDL provisions may be prohibited by practical limitations on the level of experimental control one could obtain. For example, the mere existence of a curfew provision does not mean it was truly operationalized unless it can be shown the affected population was aware of it, adhered to it, and the police actually enforced it at a meaningful level. Few studies quantified these important process factors. Although the exact effectiveness of individual GDL provisions could not be determined, the meta-analysis uncovered no indication that any provision was necessarily counterproductive for the GDL target audience of 16- and 17-year olds. Thus, a reasonable strategy for any State considering passage of a GDL law might involve enumerating the full range of provisions applicable to that State, determining which could be reasonably operationalized given available resources and support from key agencies and organizations, and adopting as comprehensive an approach as possible.

iv
TABLE OF CONTENTS 1. Background ............................................................................................................................ 1
2. Objective ................................................................................................................................ 2
3. Brief Description of Meta-Analysis ....................................................................................... 3
4. Method ................................................................................................................................... 3
4.1 Literature Search ............................................................................................................. 3
4.2 Relevance Screening ....................................................................................................... 4
4.3 Quality Screening............................................................................................................ 5
4.4 Selected Studies .............................................................................................................. 9
4.5 Effects and Moderator Variables Coded for the Selected Studies ................................ 13
4.6 Analysis......................................................................................................................... 14
5. Results .................................................................................................................................. 16
5.1 Description of effect sizes ............................................................................................. 16
5.2 Overall GDL Effect Sizes Stratified by Crash Types and Denominator Choices ........ 18
5.2.1 Individual Age Overall GDL Effect Sizes Stratified by Crash Types and
Denominator Choices ............................................................................................................ 19
5.2.2 Age Group Overall GDL Effect Sizes Stratified by Crash Types and
Denominator Choices ............................................................................................................ 21
5.3 Overall GDL Effect Sizes Stratified by IIHS GDL Program Strength Ratings and
Teen Licensing System Types .................................................................................................. 22
5.3.1 Overall GDL Effect Sizes Stratified by IIHS GDL Program Strength Ratings ........ 23
5.3.2 Overall GDL Effect Sizes Stratified by Teen Licensing System Types ................... 24
5.4 Overall GDL Effect Sizes Stratified by GDL Component Calibrations ....................... 25
5.4.1 Overall GDL Effect Sizes Stratified by Learner Entry Age ..................................... 26
5.4.2 Overall GDL Effect Sizes Stratified by Learner Permit Holding Period ................ 27
5.4.3 Overall GDL Effect Sizes Stratified by Supervised Driving Hours ......................... 28
5.4.4 Overall GDL Effect Sizes Stratified by Intermediate License Entry Age ................ 29
5.4.5 Overall GDL Effect Sizes Stratified by Nighttime Driving Restriction ................... 30
5.4.6 Overall GDL Effect Sizes Stratified by Passenger Driving Restriction ................... 31
5.4.7 Overall GDL Effect Sizes Stratified by Unrestricted Licensure Age ....................... 33
5.4.8 Overall GDL Effect Sizes Stratified by Contingent Advancement Requirements .... 34

v
5.5 Overall GDL Effect Sizes Stratified by Publication and Methodological Factors ....... 35
5.5.1 Overall GDL Effect Sizes Stratified by Publication Factors .................................... 35
5.5.2 Overall GDL Effect Sizes Stratified by Methodological Factors ............................. 36
5.5.3 Overall GDL Effect Sizes Stratified by Follow-Up Time ........................................ 37
5.5.4 Overall GDL Effect Sizes Stratified by Overall Study Quality and Validity ........... 38
5.6 Component-Specific Effect Sizes Stratified by GDL Component Calibrations ........... 40
5.6.1 GDL Learner Permit Holding Period Effect Sizes .................................................. 40
5.6.2 GDL Nighttime Driving Restriction Effect Sizes ..................................................... 41
5.6.3 GDL Passenger Driving Restriction Effect Sizes .................................................... 44
6. Summary and Discussion ..................................................................................................... 48
6.1 Study Findings Regarding Effects of GDL Programs Overall ..................................... 48
6.2 Study Findings Regarding Specific Effects of GDL Components ............................... 49
6.3 Limitations .................................................................................................................... 50
6.4 Conclusions ................................................................................................................... 51
7. References ............................................................................................................................ 52
8. Appendix A: RST, QST, and MAC Forms .......................................................................... 56
9. Appendix B: Relevance and Quality Ratings by Study ....................................................... 63
10. Appendix C: Coding Outcomes for the 14 Studies Included in the Meta-Analysis ............ 77

vi
LIST OF TABLES Table 1. The 14 Primary Studies Included in the GDL Meta-Analysis, Quality Ratings,
States Studied, and Types of Effect Sizes Coded ..................................................... 10 Table 2. Crash Metric and Denominators of Coded Effect Sizes ........................................... 17 Table 3. Individual Age Overall GDL Effect Sizes Stratified by Crash Types and
Denominator Choices ................................................................................................ 19 Table 4. Age Group Overall GDL Effect Sizes Stratified by Crash Types and
Denominator Choices ................................................................................................ 21 Table 5. Overall GDL Effect Sizes Stratified by IIHS GDL Program Ratings ...................... 23 Table 6. Overall GDL Effect Sizes Stratified by Teen Licensing System Types ................... 24 Table 7. Overall GDL Effect Sizes Stratified by Learner Entry Age ..................................... 26 Table 8. Overall GDL Effect Sizes Stratified by Learner Permit Holding Period ................ 27 Table 9. Overall GDL Effect Sizes Stratified by Supervised Driving Requirement ............... 28 Table 10. Overall GDL Effect Sizes Stratified by Intermediate License Entry Age ................ 29 Table 11. Overall GDL Effect Sizes Stratified by Nighttime Driving Restriction ................... 30 Table 12. Overall GDL Effect Sizes Stratified by Passenger Driving Restriction ................... 32 Table 13. Overall GDL Effect Sizes Stratified by Unrestricted Licensure Age ....................... 33 Table 14. Overall GDL Effect Sizes Stratified by Contingent Advancement Requirement ..... 34 Table 15. Overall GDL Effect Sizes Stratified by Publication Factors .................................... 35 Table 16. Overall GDL Effect Sizes Stratified by Methodological Factors ............................. 36 Table 17. Overall GDL Effect Sizes Stratified by Follow-Up Time (years) ............................ 37 Table 18. Overall GDL Effect Sizes Stratified by Study Quality and Validity ........................ 39 Table 19. GDL Learner Permit Holding Period Effect Sizes by Crash Types and
Denominator Choices ................................................................................................ 40 Table 20. GDL Learner Permit Holding Period Effect Sizes Stratified by Calibration .......... 41 Table 21. GDL Nighttime Driving Restriction Effect Sizes by Crash Types and
Denominator Choices ................................................................................................ 42 Table 22. GDL Nighttime Driving Restriction Effect Sizes Stratified by Calibration ............. 43 Table 23. GDL Passenger Driving Restriction Effect Sizes by Crash Types and
Denominator Choices ................................................................................................ 46 Table 24. GDL Passenger Driving Restriction Effect Sizes Stratified by Calibration ............. 47
LIST OF FIGURES Figure 1. Annual California driver fatal crash involvement rates for 16, 17, 18, and 19 year
olds, along with those for selected combinations of adults, 1986–1997 (pre-GDL). . 6

1
1. BACKGROUND
Motor vehicle crashes continue to be the leading cause of death for 15- to 20-year-olds (Hoyert & Jiaquan, 2012). Graduated driver licensing (GDL) programs, specialized driver licensing systems for novice drivers, have been implemented in U.S. States to reduce young teen drivers’ exposure to high-risk driving situations while they gain driving experience. GDL programs include three different stages of licensure: (a) a mandatory minimum learner permit period during which new drivers are only allowed to drive under the supervision of a licensed adult; (b) an intermediate period during which the new drivers are allowed to drive unsupervised, but are subject to licensing restrictions regarding passenger ages and the times during which they may drive; and (c) a final stage of unrestricted licensure allowing driving under all conditions. As novice drivers systematically move through these stages and gain more on-road driving experience, the restrictions that limit their exposure to risky driving conditions are gradually removed.
The seven components generally considered to be the core of GDL programs are:
(1) learner stage minimum entry ages, (2) required learner permit minimum holding time periods, (3) numbers of required supervised driving hours, (4) minimum intermediate licensing ages, (5) intermediate licensing stage nighttime driving restrictions, (6) intermediate licensing stage passenger driving restrictions, and (7) minimum unrestricted licensing ages. Another less recognized component is the requirement to maintain a crash- and conviction-free driving record in order to progress through the GDL stages, sometimes referred to as “contingent advancement.” Various combinations of these licensing components and quantitative/qualitative differences in how they are applied (i.e., calibrated) form the teen driver licensing systems in every U.S. State. GDL programs in the United States hardly represent a single homogeneous intervention. Rather there are many different GDL programs that vary program components including age and time criteria, lengths of the learner permit and restricted license stages, required hours of supervised practice, and types and lengths of license restrictions included (IIHS, 2012).
The overwhelming majority of single-State (i.e., one State or province) GDL studies have
found positive safety effects for young teens ranging from 20–40 percent reduction in crash rates (Senserrick & Haworth, 2005; Shope, 2007). Several multi-State studies of GDL programs have been completed to obtain more global estimates of GDL effectiveness and to avoid some problems associated with limited generalizability of heterogeneous single-State studies by using centralized crash data sources (Chen, Baker, & Li, 2006; Dee, Grabowski, & Morrisey, 2005; McCartt, Teoh, Fields, Braitman, & Hellinga, 2010; Vanlaar et al., 2009). The results from these multi-jurisdiction studies of fatal crashes generally suggest smaller effects that range from 6–19 percent reduction in crash rates. It should be noted that many of these multi-State studies of overall GDL program effects and GDL program components have significant limitations. Particularly, the main criticisms of these studies include weak study design, lack of experimental control over confounding factors, findings subject to statistical artifacts, and findings that appear impractical.
Research has compared crash rates between States with and without GDL showing
support for GDL. Specifically, Chen, Baker, and Li (2006) found that the 16-year-old driver-

2
involved fatal crash rate in States with GDL was 11 percent lower than that compared to States without GDL. Additionally, this study found the 16-year-old driver-involved fatal crash rate to be 16–21 percent lower in States that included (1) a minimum waiting period of at least three months following attainment of a learner permit, (2) a nighttime restriction, and (3) either a passenger restriction (21% lower), 30 hours of supervised driving in the learner period (18% lower), or both (16% lower). Additionally, McCartt, Teoh, Fields, Braitman, and Hellinga (2010) conducted a national study of the effectiveness of U.S. GDL laws for reducing fatal crashes among 15-, 16-, and 17-year-olds employing Fatality Analysis Reporting System (FARS) crash data from 1996–2007. The evaluation found the following associations when comparing States with and without certain provisions: (1) 7 percent lower fatal crash rate when licensing was delayed by 6 months and 13 percent lower when delayed by 1 year; (2) 21 percent lower fatal crash rate when no teenage passengers allowed and 7 percent lower with one teenage passenger allowed compared to no passenger restriction; and (3) 20 percent lower fatal crash rate when driving was restricted after 8 pm, 18 percent after 9 pm, 16 percent after 10 pm, 14 percent after 11 pm, 12 percent after 12 am, and 9 percent after 1 am. A similar effort conducted by Vanlaar et al. (2009) measured changes in fatal crash rates after GDL implementation by analyzing 1992–2006 data from FARS and the Traffic Accident Information Database (Canadian fatality data). After adjusting for the crash trend of an older age group of drivers, they found a 19.1 percent reduction in 16-year-old driver fatal crash rates after GDL system implementation. Vanlaar et al. (2009) were also interested in evaluating the contributions of individual provisions. Most notably, the study reported an 88 percent reduction in 16-year-old relative fatal crash risk when passenger restrictions were present during intermediate stages, which is surprisingly large and warrants further examination.
In 2010, the U.S. Government Accountability Office (GAO) issued a report of the National Highway Traffic Safety Administration’s (NHTSA’s) teen driver safety programs and research. The report stated that “gaps still exist in researching the effectiveness of specific GDL provisions including specific provisions for minimum entry age, the learner’s permit stage, nighttime and passenger restrictions, bans on electronic devices, driver education, and parental involvement” (U.S. GAO, 2010). The GAO recommended that NHTSA conduct research to fill these gaps in the literature and better inform States regarding specific provision effectiveness. The practical limitations of studying the specific provisions of GDL programs (e.g., inability to ensure implementations in real-world setting) restrict the methods that may be implemented by researchers. Thus, a systematic synthesis of the research findings available in the literature is an appropriate method to yield estimates of GDL program and specific provisions effectiveness in reducing young driver fatal crash rates.
2. OBJECTIVE
The objective of the present study was to assess the effectiveness of GDL programs for reducing total, injury, and fatal crash rates among drivers 15 to 20 years old by conducting a meta-analysis of GDL research since 2001 that evaluated the effectiveness of GDL systems overall and the following GDL components.
• Learner entry ages • Learner permit holding periods

3
• Supervised driving hours requirements • Intermediate license entry ages • Nighttime driving restrictions • Passenger driving restrictions • Unrestricted licensure ages
3. BRIEF DESCRIPTION OF META-ANALYSIS Meta-analysis can be thought of as a mathematical synthesis of the research literature (Cooper, Hedges, & Valentine, 2009). The goal is to combine the results from disparate studies that address the same intervention using an objective, structured protocol to obtain combined effect sizes associated with interventions that are more stable, valid, and generalizable. After scouring the literature for studies on the topic of interest, the candidate studies are scored for relevancy and quality by the research team. For those that meet the inclusion criteria, the study results are converted into a common effect size metric (e.g., rate ratios or Cohen’s d). Other factors that can potentially bias or moderate the size of the effects are coded for each study, such as the age groups studied, level of control for confounding, and the individual components of the GDL programs. The inverse variance weight is calculated to combine the effect sizes (a method of applying greater weight to effect sizes that are based on higher levels of statistical precision). These combined weighted effect sizes are then stratified by the potential moderator variables in a series of analyses (1) to determine which factors are associated with heterogeneity or bias, and (2) to estimate separate weighted effect sizes for these stratification variables (e.g., the GDL components included in the programs or types of crash outcomes). In the current context, the meta-analysis was used to systematically combine the results of all GDL studies conducted since 2001 that meet the inclusion criteria to estimate combined weighted effect sizes associated with overall GDL programs and individual GDL components. One advantage to meta-analysis is that the pooling of effect estimates from a number of individual studies can sometimes reveal significant effects that are missed in individual studies because of inadequate sample size.
4. METHOD The following subsections describe the identification of the studies included in the meta-
analysis, the coding of information from those studies, and the analysis approach used. The reader should note that all ratings of relevance and quality were based on the judgments of researchers who are young driver subject matter experts and familiar with statistical techniques appropriate for the analysis of crash data.
4.1 Literature Search
The literature search focused on studies of GDL and GDL components published from 2001–2011. Researchers searched for studies from peer-reviewed journals, conference proceedings, monographs, dissertations, and other sources that were not necessarily part of the peer-review literature in order to avoid biasing the results of the meta-analysis towards positive effects. Researchers identified candidate studies by searching for keywords related to GDL and GDL components using MEDLINE, PsycINFO, PsycARTICLES, PsycEXTRA, TRIS Online,

4
NTIS Bibliographic Database, NHTSA’s Behavioral Safety Research Reports Library, Psychology and Behavioral Sciences Collection, Web of Science, Dissertation Abstracts, Google Scholar, and sources of relevant conference proceedings. The search terms used were wildcard variations as follows.
• Graduated driver licensing; GDL; graduated licensing system; GLS; provisional
licensing program; PLP • Novice driver; young driver; provisional driver; teenage driving; teen drivers • Licensing age; learner age; license age; driving age; age of licensure • Learner permit; instruction permit; driving permit; learner stage; permit period • Supervised driving; driving practice; driving hours; practice hours • Nighttime restriction; nighttime curfew; driving curfew • Passenger restriction; teen passengers • Provisional license; intermediate license; provisional stage; intermediate stage • Contingent advancement; post-license control; point system
The reference lists of identified manuscripts were further used to identify pertinent
literature. Researchers also utilized their network of contacts to identify unpublished research papers or papers under review to the extent such works could be made available. Studies of international GDL programs were excluded.
4.2 Relevance Screening Researchers identified 157 GDL-related research documents in the literature and screened
them using the relevance screening tool (RST) created for this project (see Appendix A for the RST form). Appendix B includes a listing of all 157 identified studies and the researchers’ final rating of relevance. The purpose of the RST was to help researchers identify the studies that were relevant based on the following criteria: (1) empirical evaluation of overall GDL programs or one or more GDL program components, (2) included police-reported crashes as at least one outcome, (3) examined at least one age from 15 to 20 years old, (4) used United States data, and (5) completed or first published after January 1, 2001.
An informal pilot of the RST was conducted with two senior researchers and differences
in interpretation were clarified prior to implementation and independent rating of the studies. The results of their ratings were compared by a third researcher and consensus was reached through three-way discussions. The raters were able to agree on relevance ratings for all 157 of the documents. Of the 157 GDL-related research documents identified:
• Researchers deemed 82 documents not relevant for inclusion for the following reasons. o 1 did not include a requisite age group separately o 15 were not crash studies o 51 were not empirical studies of a GDL program or component o 5 were not studies of GDL in the United States o 8 were completed/published before 2001 o 1 study had an updated version o 1 document did not exist

5
• Researchers deemed 75 documents relevant for inclusion, but further review revealed
that some of the documents actually presented the same or a very similar research study. Therefore, researchers determined that:
o 49 unique studies were represented in the sample; and o 26 of the documents were other versions of these studies (e.g., earlier monographs
of peer-reviewed studies), and any new information from these documents was combined with the 49 unique primary study documents.
4.3 Quality Screening
Given practical limitations, all empirical studies of GDL have used quasi-experimental research designs, specifically pretest-posttest nonequivalent group and time series designs, which are at increased risk for confounding and bias than are true experimental designs (Campbell & Stanley, 1963). An important issue concerning meta-analyses of quasi-experiments is the likelihood of residual confounding of the effect estimates (Colliver, Kucera, & Verhulst, 2008). Failure to control for potential sources of confounding and sources of bias resulted in a prior meta-analysis of the GDL literature being severely limited (Russell, Vandermeer, & Hartling, 2011). The earliest U.S. evaluations of GDL (i.e., Foss, Feaganes, & Rodgman, 2001; Shope, Molnar, Elliott, & Waller, 2001) used the crash rates of adults in the same States as a counterfactual for what would have been expected to occur to teen crash rates in the absence of the GDL programs. However, these were preliminary studies of GDL and this method was deemed to be appropriate for an early look at the potential effects of GDL programs. This method, however, became common practice for most subsequent evaluations of GDL programs. Of the numerous GDL studies using this method to control for confounding, there are only a handful that actually provided any evidence that the underlying assumption was reasonable: That the crash rates of the adults and teens behaved similarly prior to the GDL intervention, suggesting that changes in adult crash rates are a reasonable expectation for what would have happened to teen crash rates in the absence of GDL. The method of standardizing pre-post GDL differences in teen crash rates to those for a sample of older drivers as a panacea for all potential sources of historical confounding in teen crash rates has yet to be shown as valid, yet it is the primary, and in most cases, the only method used to control for confounding in studies of GDL. This method is just a disguised pretest-posttest nonequivalent groups design (Campbell & Stanley, 1963), which is subject to numerous threats to research validity. While the approach of using adults as a counterfactual would be expected to model some historical variability in teen crash rates, it assumes that changes in adult crashes are reasonable expected values for changes in teen crashes, which may not be true. The validity of the resulting effect estimates depends to a large extent on the degree to which using changes in adult driver crash rates as the counterfactual expectation actually removed the confounding effects associated with trends, seasonality, changes in other highway-related laws, and other unmeasured historical factors (e.g., fuel prices). The assumption of this method is that adults would not be affected by the GDL programs and so changes in adult crash rates represent a good counterfactual for what would have been expected to occur for each teen age group in the absence of the GDL programs. There is no evidence that it actually removes all the confounding by these factors, and there is ample evidence that it probably does not.

6
The adults-as-counterfactual method assumes that pre-post GDL changes in adult driver crash rates in each State/province embody all the combined effects associated with trends, seasonality, changes in other highway-related laws, and numerous other unmeasured historical factors that would have affected teen driver crash rates in those States/provinces in the absence of GDL. Furthermore, it assumes that the magnitude of the effects of these confounding factors would have been the same for adults and teens. Among other things for this method to work, the pre-GDL trends in crash rates for the adults in each State/province must be the same as those for the teen age group. This can easily be shown to not be true for all U.S. States. For example, the California GDL program was implemented in July 1998 and Figure 1 shows the California 1990–1997 (pre-GDL) annual per capita driver fatality rates for 16-, 17-, 18-, and 19-year olds, along with those for selected combinations of adult age groups that might be used as counterfactuals for the teens per the adults-as-counterfactual method.
0
1
2
3
4
5
6
1986 1987 1988 1989 1990 1991 1992 1993 1994 1995 1996 1997
Year
Cal
iforn
ia D
river
Fat
al C
rash
Invo
lvem
ent R
ate
per 1
0,00
0 Po
pula
tion
.
Age 16 Age 17 Age 18 Age 19 Ages 20-24 Ages 25-39 Ages 40-59
Figure 1. Annual California driver fatal crash involvement rates for 16-, 17-, 18-, and
19-year-olds, along with those for selected combinations of adults, 1986–1997 (pre-GDL).
The trends in California driver fatal crash involvements for the teen age groups in the figure are different than those for the adult age groups during this pre-GDL time period. This is particularly evident from 1995 to 1997, which would be a typical pre-GDL period used to calculate a standardized rate ratio. Hence, the method of standardizing the changes in teen rate ratios to those observed for adults would not have removed all confounding in the California teen rate ratios due to trends, because the adult and teen trends were different. This is likely also true for other North American States/provinces where it is sometimes the case that the pre-GDL teen
7
and adult driver crash trends moved in opposite directions. When dichotomous (pre versus post) outcome data are analyzed rather than using continuous data (e.g., using multiple snapshots pre versus post), it is not possible to use another approach to adjust for trends in teen crash rates. For the studies with only one pre-GDL data point, is it not possible to remove the effects of preexisting trends because most of the trend estimate is based on data points when the effects of GDL were confounded with the trend estimate. Because of these reasons, it seems likely that many of the GDL effect estimates in the literature are confounded by residual trends in teen crash rates.
The adults-as-counterfactual method also assumes that any effects associated with
changes in other highway-related laws (e.g., seat belt laws, speed limits, and alcohol-related driving laws) and unmeasured historical factors (e.g., fuel prices and macroeconomic forces) would be the same for teens as for adult drivers. This is a strong assumption and there is empirical evidence of age-specific differences in effect sizes suggesting that it is not correct for at least some of these confounders (e.g., admin per se laws, primary enforcement seat belt laws, maximum speed limits, fuel prices, and unemployment; Grabowski & Morrisey, 2004). The method also would not remove the confounding effects associated with other highway-related law changes aimed specifically at teen drivers, such those of minimal legal drinking ages and zero-tolerance laws, given that these laws have been shown to have larger effects on teens than on adult drivers (e.g., McCartt, Hellinga, & Kirley, 2010; Villaveces, Cummings, Koepsell, Rivara, Lumley, & Moffat, 2003). To the extent that the use of adults as counterfactuals fails to control for changes in other highway-related laws and unmeasured historical factors, the GDL program effect estimates in the literature based on this method would still be confounded by these factors.
In an attempt to avoid biasing the meta-analysis by including studies with residual
confounding and bias, the researchers screened the 49 unique studies meeting the RST criteria using the quality screening tool (QST) created for this project (see Appendix A for the QST form). Researchers used the QST to code the extent to which each study adequately addressed the most serious threats to construct, internal, statistical, and external validity, relying heavily on the classic work of Campbell and Stanley (1963), and the most common threats for traffic safety intervention studies generally and GDL studies in particular. Specifically, for each study the QST assessed the following.
• Construct Validity for Crash Outcomes (DV)
o Are the crash data representative of the entire State (i.e., statewide crashes)? o Are crashes measured reliably across all time? o Were enough years of data before and after the intervention analyzed to provide
stable estimates of both the pre- and post-intervention periods? • Construct Validity for GDL Program/Components (IV)
o Did the GDL program/component exposure variables apply to all teens licensed in the State?

8
• Internal Validity o Were crash counts adjusted for changes in the underlying population of teens? o Were the effects of teens transitioning into the program explicitly modeled,
reasonably shown to not be a threat to validity, or accounted for in the study design?
o Were the effects of age-specific trends explicitly modeled, reasonably shown to not be a threat to validity, or accounted for in the design? If a surrogate was used to implicitly adjust for trend, was evidence given that the surrogate was likely adequate to remove it?
o Were the effects of seasonality explicitly modeled, reasonably shown to not be a threat to validity, or accounted for in the design? If a surrogate was used to implicitly adjust for seasonality, was evidence given that the surrogate was likely adequate to remove it?
o Were the effects of other historical factors (e.g., other traffic safety laws, weather, gas prices, etc.) explicitly modeled, reasonably shown to not be a threat to validity, or accounted for in the design? If a surrogate was used to implicitly adjust for unmeasured historical factors, was evidence given that the surrogate was likely adequate to remove these effects?
• Statistical Validity o Was an appropriate analysis conducted using statistical testing or confidence
estimates? o Are estimates of variability/dispersion included or calculable from the data? o Are estimates of effect size included or calculable from the data? o Are sample sizes for weighting effect sizes included or easily obtainable?
• Other Serious Threats to Research Validity o Are there other threats to the validity of the study that could result in bias or
confounding of the effect estimates (e.g., combining data across multiple States without adjusting for baseline differences between States teen crash rates)?
As with the RST, researchers first piloted the QST to determine any differences in
interpretation and resolved any differences. The two researchers then independently rated all of the remaining documents. The results of their ratings were compared by a third researcher and consensus was reached during three-way discussions. Appendix B includes a table of the 49 studies and researchers’ final quality ratings. Studies were rated as being of “High” quality if they adequately addressed all the listed threats to validity. Studies were rated as being “Good” quality if they addressed all the threats, with the possible exceptions of seasonality and other historical factors (e.g., other traffic safety laws, weather, and gas prices). They were rated as being “Moderate” quality if all threats to construct and statistical validity were addressed, but there was the possibility of residual confounding due to threats to internal validity. This typically occurred because studies used the adults-as-counterfactual approach without demonstrating similarity between the pre-GDL crash rates of the teen and adult age groups. Studies that did not, at a minimum, address all threats to construct and statistical validity were rated as being of “Low” quality. The studies were rated based on the highest quality analysis they contained, when different analysis methods and data sources were used. Of the 49 unique studies that met the RST criteria:

9
• 34 were deemed to be of insufficient quality to be included in the meta-analysis: o 31 were Low quality (major confounders and other threats not addressed), o 3 were found to not result in effect estimates that could be compared to the others,
• 15 were of high enough quality to be included in the meta-analysis: o 7 were Moderate quality (some major confounders and other threats addressed), o 2 were Good quality (most major confounders and other threats addressed), o 6 were High quality (all major confounders and other threats addressed).
Here “quality” refers to the suitability of the study for inclusion in this meta-analysis. Many of the studies that were ultimately rated as Low quality may have been good pieces of research and are useful contributions to the literature, but did not necessarily meet the criteria for inclusion in this meta-analysis.
4.4 Selected Studies
Although the original intention was to include in the meta-analysis only studies of High or Good quality to ensure the meta-analysis effect estimates would represent the actual impact of GDL programs or components, those rated as Moderate quality were included due to the small number of Good and High quality studies. The studies coded as Moderate all used the adults-as-counterfactual approach, but the adequacy of this method for actually removing confounding due to trends and other historical factors is not well supported as discussed at length above. Comparisons of effect sizes as a function of study quality ratings were investigated as part of the moderator variable analyses to determine whether the inclusion of Moderate quality studies negatively impacted the overall meta-analysis results. One set of studies (Friedlander et al., 2002, 2004) was coded as being of Moderate quality, but was eventually excluded because additional information necessary to code effect sizes could not be obtained from the authors. Failure to consider or control for preexisting trends in teen crash rates was by far the single most frequent reason that studies were rated as being Low quality and excluded from the meta-analysis. Table 1 lists the 14 studies included in the meta-analysis, their quality ratings, the States studied, and the types of effect sizes that could be coded from each. Table 1 also shows how the documents were grouped to create 14 primary studies in cases where there were multiple documents covering the same or very similar material. Data from the 14 selected studies represented 13 different States, (California, Connecticut, Florida, Georgia, Iowa, Massachusetts, Maryland, Michigan, Minnesota, North Carolina, New Jersey, South Carolina, and Virginia) and three represented GDL programs across most or all U.S. States. The studies contained effect estimates of the following.
• 14 provided effect estimates of overall GDL programs • 10 provided effect estimates of specific GDL components:
o 1 estimated effects of Learner Entry Ages o 3 estimated effects of Learner Permit Holding Periods o 2 estimated effects of Supervised Driving Hours Requirements o 1 estimated effects of Intermediate License Entry Ages o 7 estimated effects of Nighttime Driving Restrictions o 7 estimated effects of Passenger Driving Restrictions o 1 estimated effects of Unrestricted Licensure Ages.
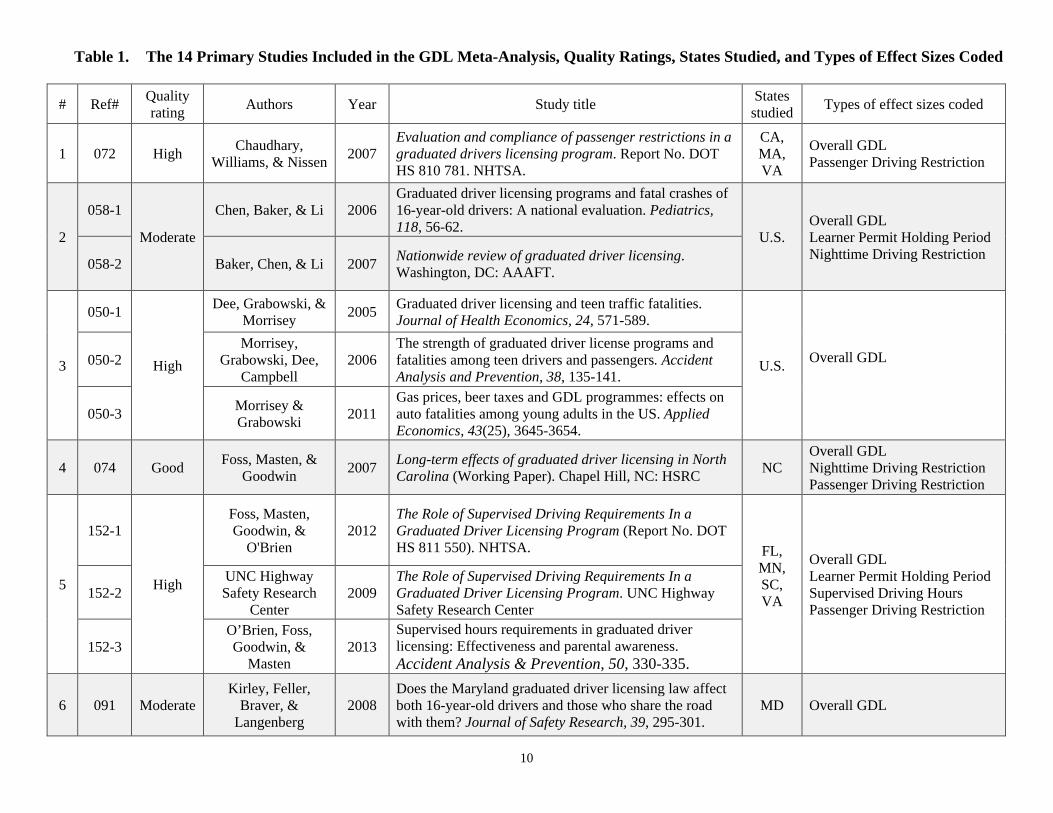
10
Table 1. The 14 Primary Studies Included in the GDL Meta-Analysis, Quality Ratings, States Studied, and Types of Effect Sizes Coded
# Ref# Quality rating Authors Year Study title States
studied Types of effect sizes coded
1 072 High Chaudhary, Williams, & Nissen 2007
Evaluation and compliance of passenger restrictions in a graduated drivers licensing program. Report No. DOT HS 810 781. NHTSA.
CA, MA, VA
Overall GDL Passenger Driving Restriction
2
058-1
Moderate
Chen, Baker, & Li 2006 Graduated driver licensing programs and fatal crashes of 16-year-old drivers: A national evaluation. Pediatrics, 118, 56-62.
U.S. Overall GDL Learner Permit Holding Period Nighttime Driving Restriction
058-2 Baker, Chen, & Li 2007 Nationwide review of graduated driver licensing. Washington, DC: AAAFT.
3
050-1
High
Dee, Grabowski, & Morrisey 2005 Graduated driver licensing and teen traffic fatalities.
Journal of Health Economics, 24, 571-589.
U.S. Overall GDL
050-2 Morrisey,
Grabowski, Dee, Campbell
2006 The strength of graduated driver license programs and fatalities among teen drivers and passengers. Accident Analysis and Prevention, 38, 135-141.
050-3 Morrisey & Grabowski 2011
Gas prices, beer taxes and GDL programmes: effects on auto fatalities among young adults in the US. Applied Economics, 43(25), 3645-3654.
4 074 Good Foss, Masten, & Goodwin 2007 Long-term effects of graduated driver licensing in North
Carolina (Working Paper). Chapel Hill, NC: HSRC NC Overall GDL Nighttime Driving Restriction Passenger Driving Restriction
5
152-1
High
Foss, Masten, Goodwin, &
O'Brien 2012
The Role of Supervised Driving Requirements In a Graduated Driver Licensing Program (Report No. DOT HS 811 550). NHTSA. FL,
MN, SC, VA
Overall GDL Learner Permit Holding Period Supervised Driving Hours Passenger Driving Restriction
152-2 UNC Highway Safety Research
Center 2009
The Role of Supervised Driving Requirements In a Graduated Driver Licensing Program. UNC Highway Safety Research Center
152-3 O’Brien, Foss, Goodwin, &
Masten 2013
Supervised hours requirements in graduated driver licensing: Effectiveness and parental awareness. Accident Analysis & Prevention, 50, 330-335.
6 091 Moderate Kirley, Feller,
Braver, & Langenberg
2008 Does the Maryland graduated driver licensing law affect both 16-year-old drivers and those who share the road with them? Journal of Safety Research, 39, 295-301.
MD Overall GDL
11
# Ref# Quality rating Authors Year Study title States
studied Types of effect sizes coded
7
077-1
Good
Males 2007 California’s graduated driver license law: Effect on teenage drivers’ deaths through 2005. Journal of Safety Research, 38, 651–659.
CA Overall GDL Passenger Driving Restriction
077-2 Males 2006 California’s graduated driver license law: Effects on older teenagers. Californian Journal of Health Promotion, 4, 207-221.
8
045-1
High
Masten & Hagge 2004 Evaluation of California’s graduated driver licensing program. Journal of Safety Research, 35, 523-535.
CA Overall GDL Nighttime Driving Restriction Passenger Driving Restriction
045-2 Masten & Hagge 2003 Evaluation of California’s Graduated Driver Licensing Program (Report No. 205). California Department of Motor Vehicles.
9
134-1
High
Masten, Foss, & Marshall 2011
Graduated Driver Licensing and Fatal Crashes Involving 16- to 19-Year-Old Drivers. Journal of the American Medical Association, 306(10), 1098-1103.
U.S.
Overall GDL Learner Entry Age Learner Permit Holding Period Supervised Driving Hours Intermediate License Entry Age Nighttime Driving Restriction Passenger Driving Restriction Unrestricted Licensure Age
134-2 Masten 2011 National study of teen driver licensing systems and graduated driver licensing program core components (Dissertation). University of North Carolina.
10 147 High Neyens, Donmez, & Boyle 2008
The Iowa graduated driver licensing program: effectiveness in reducing crashes in teenage drivers. Journal of Safety Research, 39(4), 383-390.
IA Overall GDL
11
066-1
Moderate
Rios, Wald, Nelson, Dark,
Price, & Kellerman 2006
Impact of Georgia’s teenage and adult driver responsibility act. Annals of Emergency Medicine, 47, 361-369.
GA Overall GDL Nighttime Driving Restriction
066-2 Kellermann, Rios,
Wald, Nelson, Dark, & Price
2007 Graduated driver licensing in Georgia: The impact of the teenage and adult driver responsibility act (TADRA) (Report No. DOT HS-810-715). NHTSA.

12
# Ref# Quality rating Authors Year Study title States
studied Types of effect sizes coded
12 157 Moderate
Rogers, Bentley, Campbell, Borrup, Saleheen, Wang, &
Lapidus
2011 Impact of Connecticut’s Graduated Driver Licensing System on Teenage Motor Vehicle Crash Rates, Journal of Trauma, 71(5), S527-S530.
CT Overall GDL
13
048-1
Moderate
Shope & Molnar 2004 Michigan’s graduated driver licensing program: Evaluation of the first four years, Journal of Safety Research, 35, 337-344.
MI Overall GDL Nighttime Driving Restriction 048-2 Shope, Molnar,
Elliott, & Waller 2001
Graduated driver licensing in Michigan: Early impact on motor vehicle crashes among 16-year-old drivers. Journal of the American Medical Association, 286, 1593-1598.
048-3 Elliott & Shope 2003 Use of a Bayesian change point model to estimate effects of a graduated driver’s licensing program. Journal of Data Science, 1, 43-63.
14
122-1
Moderate
Williams, Chaudhary, Tefft,
& Tison 2010 Evaluation of New Jersey's graduated driver licensing
program. Traffic Injury Prevention, 11, 1–7. NJ
Overall GDL Nighttime Driving Restriction Passenger Driving Restriction
122-2 Williams,
Chaudhary, & Tison
2010 Evaluation of New Jersey’s Graduated Driver Licensing Program. AAAFTS.

13
4.5 Effects and Moderator Variables Coded for the Selected Studies Researchers coded separate rate ratio effect sizes from the included studies to estimate
the impact of overall GDL programs on 15-, 16-, 17-, 18-, 19-, and 20-year-olds, as well as any combinations of these age groups available in the included studies. Separate effect sizes were calculated for total crash outcomes, injury crash outcomes, and fatal crash outcomes, when available. The effect sizes were also coded separately when estimates based on using different rate denominators (e.g., per capita versus per licensed driver) were available. In addition, effect sizes were coded to estimate the unique impact of variations in the key parameters (e.g., start times for nighttime restrictions) of the various GDL components of interest. From this point forward in the report, these variations in key parameters are referred to as “calibrations” of the following individual GDL components.
• Learner entry ages • Learner permit holding periods • Supervised driving hours requirements • Intermediate license entry ages • Nighttime driving restrictions • Passenger driving restrictions • Unrestricted licensure ages
Given the choice of multiple possible time periods upon which to base the effect size
estimates, researchers coded the longest post-GDL time period possible to reflect the long-term impact of the GDL programs or program components. The effect sizes were coded using a Meta-Analysis Coding Sheet (MACS) created for the study (see Appendix A for the MACS form). In addition to the effect sizes and information necessary to code estimates of precision (variances), the following data elements were coded for each selected study and/or effect size for use as moderator variables in the meta-analysis.
• Primary Moderator Variables
o Whether the effect size represented the overall effect of a GDL program or the unique effect of a specific component
o The age groups represented by each effect size o Crash outcome type for each effect size (total, injury, or fatal crashes) o Denominator choice for each effect size (e.g., per capita, per licensed driver)
• Secondary Moderator Variables o Program Components/Calibrations, Strength, and Type of Licensing System
The GDL components and calibrations of the components represented by each effect size
Program strength ratings for overall effect sizes (McCartt, Teoh, Fields, Braitman, and Hellinga, 2010)
Teen licensing system types for overall effect sizes (Masten, Foss, & Marshall, 2011)
o Publication Factors Researcher type (e.g., public/government versus academic)
14
Publication mode (e.g., peer-review, monograph, conference proceeding) o Methodological Factors
Type of study design (from QST) Comparison/control type (from QST) Length of the follow-up period (e.g., 1 year-post GDL implementation)
o Study Quality and Validity Overall study quality ratings (from QST) Validity compared to a true experiment (from QST)
Note that the age-specific effect sizes are based on cross-sectional comparisons of drivers involved in crashes of a particular age rather than on longitudinally following a single group of teens licensed under GDL as they grew older. This is important because it means that effect sizes for 18, 19, and 20 year olds reflect the driving of a mixed population consisting of some persons who were actually licensed under the GDL programs as well as persons who were licensed at ages that were not subject to the GDL programs (18 or older in most States). It is therefore not possible to disentangle from the effect sizes of these older age groups the relative contributions of persons being licensed under the GDL programs versus effects due to younger teens delaying licensure until an age when the GDL programs do not apply. In addition, the effect sizes for all age groups include crash contributions of drivers who were completely unlicensed, as crashes were typically categorized in the contributing studies based on the age of the driver, regardless of whether they were licensed to operate motor vehicles. It is possible that implementing GDL programs changed the percentages of teens who delay licensure or who choose to drive unlicensed. The 156 total, injury, and fatal crash effect sizes coded from the 14 primary studies are presented in Appendix C along with a description of the GDL program components represented by the effect sizes and coding outcomes for selected moderator variables. The effect sizes are organized by the study of origin and are presented alphabetically by author. The notes below the table identify idiosyncrasies that occurred during the coding of the effect sizes and explanations of the abbreviations used in the table.
4.6 Analysis The effect sizes in the form of adjusted rate ratios, estimates of their precision, and
coding outcomes for the moderator variables were entered into a Comprehensive Meta-Analysis (version 2.0) database, which is a program specifically created to conduct meta-analyses (Biostat, 2012). Rate ratios are normally distributed on the log scale, so each rate ratio was transformed by taking its natural logarithm (Borenstein, Hedges, Higgins, & Rothstein, 2009). In cases where a study provided multiple effect sizes, each representing changes in crash rates for a single post-GDL year, the effect sizes were first combined using weighted meta-analysis techniques to create a single estimate across the years. For 10 of the 14 primary studies it was necessary to obtain additional data from the authors in order to calculate some or all of the effect sizes. For example, in order to convert the effect sizes in studies that used an autoregressive integrated moving average (ARIMA) model of time series data to rate ratios that could be combined with the other studies it was necessary to obtain estimates of the pre-GDL mean crash rates, which were frequently not available in the original manuscripts. In other cases estimates of

15
precision or comparison/control rate ratios for creating adjusted rate ratios needed to be obtained from the authors. The challenges encountered when coding effect sizes and other coding-related notes for each study are presented in Appendix C.
As a first step, funnel plots were used to check for bias (e.g., publication bias). The funnel plots were examined to determine how the effect sizes distributed as a function of each age group by type of GDL intervention (overall GDL versus specific GDL component) combination. Where there was consistency apparent among the estimates stratified by these primary moderator variables, it was deemed appropriate to combine the effect sizes into weighted estimates.
Meta-analyses are based on either a fixed-effects or random-effects model. In some cases, a mixed-effects model is appropriate, as was employed in this study. Fixed-effect models assume that all effect sizes from the included studies are estimates of the same population parameter effect size (i.e., that all estimates represent the same average change in crash rates). When there is systematic heterogeneity in the effect size estimates, they cannot be seen to represent the same average effect size and random effects models are more appropriate. Random-effects models assume that the effect sizes from the studies are estimates of distributions of different population parameter effect sizes (Borenstein, Hedges, & Rothstein, 2007). Random-effects models include both within- and between-study sources of error in the model, which tend to result in lower weighted effect size estimates and wider confidence intervals. However, inferences based on random-effects models can be generalized to studies beyond just those included in the meta-analysis, which is not the case for fixed-effect models (Hedges & Vevea, 1998). The approach used in the present study was mixed effects analysis whereby random effects models were used to combine studies within subgroups (e.g., strata formed by moderator variables) and fixed effect models were used to compare subgroups and yield overall effect estimates.
In the next step the effect sizes for each type of GDL intervention (overall GDL versus specific GDL component) were combined for each age group, but stratified by crash outcome types and denominator choices (primary moderator variables). This resulted in estimates of the overall effects of the various GDL interventions for each age group, along with separate estimates for each crash outcome type and denominator choice. The effect sizes were weighted by the inverse of their variances to give greater weight in the combined estimates to effect sizes that were based on higher levels of statistical precision. The statistical significance of the combined weighted effect sizes was assessed using one-sample z-tests testing the null hypothesis that the population effect size parameter is equal to zero (at α = .05) and by using the 95 percent confidence intervals for the weighted effect sizes. The effect sizes were also expressed as percent changes (∆%) to make the results accessible to a larger audience. There is no minimum number of effect sizes required for meta-analysis, but if the number of studies is too small, the resulting effect size can be unstable, and vary depending on which studies are included (Rosenthal, 1995). In general only effect estimates based on at least two independent studies were considered to be meaningful and worthy of discussion, because those based on a single effect size do not provide information about the consistency of findings across multiple replications.
In the next step, primary moderator variable analyses were conducted using the QB statistic to determine whether the combined effect sizes systematically varied across strata

16
formed by the crash outcome types and denominator choices (Borenstein, Hedges, Higgins, & Rothstein, 2009; Borenstein & Rothstein, 1999; Cooper, Hedges, & Valentine, 2009; Hedges & Pigott, 2004). This statistic indicates whether the effect estimates across strata formed by a moderator variable significantly differ from each other, analogous to between-groups ANOVA. The QB statistic has an approximate chi square distribution with k –1 degrees of freedom, k being equal to the number of strata formed by the moderator variable. A non-significant p value for the QB statistic indicates homogeneity of effect sizes across strata formed by the moderator variable, meaning that it is appropriate to combine the effect sizes across those strata (Borenstein, Hedges, Higgins, & Rothstein, 2009; Cooper, Hedges & Valentine, 2009; Hedges & Olkin, 1985; Hedges & Pigott, 2004). Heterogeneity was also assessed by using Forrest plots of the 95 percent confidence intervals of the effect sizes to identify outliers and patterns among the effect sizes. When the effect sizes did not differ reliably across crash outcome types or denominator choices (at α = .05), the effect sizes were then combined across those strata to create more robust combined effect size estimates. When crash outcome types or denominator choices were found to reliably moderate the effect sizes, the effect sizes were not combined across strata.
Next, sensitivity analyses were conducted to test whether a single study exerted a
particularly strong influence on the combined effect estimates and to test for publication bias. The former was assessed by omitting each study, one at a time, from the calculation of the combined effect estimates and determining whether these one-off estimates fell within the confidence interval of the original combined estimate based on all studies. Publication bias was assessed using the trim-and-fill method (Duval, 2005). Using this nonparametric procedure, the funnel plots of effect sizes were reviewed to establish that the tails of the data points were relatively symmetric, indicating the likely absence of publication bias.
Finally, secondary moderator variable analyses were conducted for the subset of the
overall GDL effect estimates that provided the largest homogenous sample. These were conducted similarly to the primary moderator variable analyses in that combined effect estimates were created for each stratum formed by the secondary moderator variable, and these were then compared using the QB statistic to determine if the effect sizes reliably differed across the strata formed by the moderator variable (using α = .05).
5. RESULTS
5.1 Description of effect sizes
The coded effect sizes covered three different broad crash outcome categories based on the information available in each manuscript: Total crash outcomes (25.0%), injury crash outcomes (41.0%), and fatal crash outcomes (34.0%; Table 2). The preferred metric for coded effect sizes were rates of driver involvements in total, injury, or fatal crashes. Driver crash involvements were coded for 100 percent of the total crash outcome effect sizes, 87.5 percent of the injury outcome effect sizes, and 73.6 percent of the fatal outcome effect sizes. If effect sizes for driver crash involvements were not available in a manuscript, then the next closest approximation was coded instead. The most common of these were effect sizes representing changes in rates of driver injuries, fatalities, or injuries/fatalities, meaning that the events only included drivers who were actually injured/killed in the crash, rather than all those involved in a crash, injured or not. The most common denominator used for the rates was the age-specific

17
population at risk, which best captures any overall public health effect of GDL programs (73.1% of effect sizes). Other rate denominators used were numbers of age-specific licensed drivers and proportional incidence rates (e.g., nighttime or passenger crashes / total crashes), the latter being used only to estimate the specific impact of nighttime or passenger restriction components. Differences in effect sizes resulting from differences in the denominators used for the rates were investigated as part of the moderator variable analyses.
Table 2. Crash Metric and Denominators of Coded Effect Sizes Outcome category Specific crash metric (denominator) N %
Total crash outcomes 39 25.0 Driver crash involvements (per capita) 17 68.0 Driver crash involvements (per licensed driver) 12 48.0 Driver crash involvements (proportional incidence) 10 40.0 Injury crash outcomes 64 41.0 Driver fatal/injury crash involvements (per capita) 47 73.4 Driver fatal/injury crash involvements (proportional incidence) 6 9.4 Driver non-fatal injury crash involvements (per capita) 2 3.1 Driver single-vehicle fatal/injury crash involvements (proportional incidence) 1 1.6 Traffic fatalities/injuries (per capita) 6 9.4 Driver serious injuries (per capita) 1 1.6 Driver serious injuries (per licensed driver) 1 1.6 Fatal crash outcomes 53 34.0 Driver fatal crash involvements (per capita) 32 60.4 Driver fatal crash involvements (proportional incidence) 7 13.2 Driver fatalities (per capita) 7 13.2 Driver fatalities (per licensed driver) 1 1.9 Driver fatalities (proportional incidence) 4 7.5 Traffic fatalities (per capita) 2 3.8 Total 156 100.0
The age group most represented among the effect sizes was 16-year-olds (37.2%; n = 58),
followed by 17-year-olds (21.2%; n = 33), mixed teen ages (17.9%; n = 28), 18-year-olds (12.8%; n = 20), 19-year-olds (10.3%; n = 16), and 20-year-olds (0.6%; n = 1). None of the studies examined 15-year-olds as a standalone age group. A majority of the effect sizes represented the overall impact of GDL programs as a whole (59.0%; n = 92). The remainder represented the specific effect of a GDL program component: (1) passenger driving restrictions (22.4%; n = 35); (2) nighttime driving restrictions (11.5%; n = 18); (3) learner permit holding periods (4.5%; n = 7); (4) learner entry ages (1.3%; n = 2); and (5) supervised driving hours requirements (1.3%; n = 2). No effect sizes represented the specific effects of intermediate license entry ages or unrestricted licensure entry ages. Note that the effect sizes for 18- to 20-year-olds reflect a mixed population of persons, some of whom were originally licensed under GDL and others who acquired a license at an age at which GDL requirements are not applied.
18
Because the effect sizes from the source studies are based on cross-sectional age cohorts rather than on longitudinally comparing cohorts of drivers licensed under GDL to those who were not, it is not possible to disentangle the relative contribution of these populations to the effect estimates for these age groups, but it is important to keep this in mind when interpreting the results.
Thirteen different individual States were represented in the effect sizes (California, Connecticut, Florida, Georgia, Iowa, Massachusetts, Maryland, Michigan, Minnesota, North Carolina, New Jersey, South Carolina, and Virginia), along with the U.S as a whole. A majority of the effects sizes came from studies that used time series designs (71.8%; n = 112); the remainder came from studies that used simple pre-post designs (28.2%; n = 44). The covariate/comparison groups used in the studies from which the effect sizes were coded were other contemporaneous age groups (59.0%; n = 92), other States (14.1%; n = 22), or both (16.7%; n = 26). In terms of overall study quality, 71.8% of the effect sizes came from studies judged to be of high 51.3 percent (n = 80) or good 20.5 percent (n = 32) experimental validity, with 28.2 percent (n = 44) coming from studies judged as having only moderate validity. Two-thirds (67.3%; n = 105) of the effect sizes came from studies conducted by authors affiliated with academic institutions and the remainder (32.7%; n = 51) were from federal or State government research studies. Peer-reviewed journals were the source for 47.4 percent (n = 74) of the effect sizes, with the remainder (52.6%; n = 82) coming from research reports/monographs.
5.2 Overall GDL Effect Sizes Stratified by Crash Types and Denominator Choices
The overall effects of GDL programs (RRw) on total, injury, and fatal crash outcomes are tabulated in the following sections for individual ages (i.e., single years of age) and then for various age groupings as a function of the crash numerator and denominator choices. Nine of the overall GDL effect sizes were excluded from the estimates in the tables to avoid biasing the weighted estimates. These excluded effect sizes were redundant with others from the same study and were the less-desirable outcome choice, such as traffic injuries/fatalities (i.e., anyone injured in the crash) instead of driver-based injuries/fatalities. Hence the estimates in the following sections are based on 83 (90.2%) of the 92 overall GDL effect sizes. The shaded rows in the tables represent the net weighted effect size for the overall impact of GDL across all included effect sizes for an age group. The QB statistics for these combined effects represent tests of strata heterogeneity across the various numerator and denominator choices used for the effect sizes, which is analogous to conducting between-subjects ANOVAs using these combined numerator and denominator choices as the levels of an independent variable (Borenstein, Hedges, Higgins, & Rothstein, 2009; Cooper, Hedges & Valentine, 2009; Hedges & Pigott, 2004). All QB statistics are based on a mixed effects analysis whereby a random effects model is used to combine studies within each subgroup and a fixed effect model is used to compare subgroups and yield the overall effect estimate (Borenstein, Hedges, Higgins, & Rothstein, 2009). Separate combined effect sizes are also shown for total, injury, and fatal crash outcomes, where data were available. The QB statistics for these combined effects test whether the estimates differed across the denominator choice strata (i.e., per capita versus per licensed driver), again analogous to conducting a between-subjects ANOVA with the denominator choice as the independent variable. The effect sizes expressed as percent changes (∆%) are shown in the eighth column of the tables.

19
5.2.1 Individual Age Overall GDL Effect Sizes Stratified by Crash Types and Denominator Choices
Table 3 shows the overall GDL effect estimates for individual ages stratified by crash outcome type and denominator choice.
Table 3. Individual Age Overall GDL Effect Sizes Stratified by Crash Types and Denominator Choices
Age group Outcome type Denominator
Test of effect size Tests of strata heterogeneity 95% CI
N RRw Lower Upper z p ∆% QB df p 16-year-olds 28 0.84 0.81 0.88 -7.38 .000 -15.7 7.57 4 .109 Total crashes 9 0.91 0.84 0.98 -2.63 .009* -9.5 1.58 1 .209 Per capita 5 0.83 0.71 0.97 -2.37 .018* -16.9 Per licensed driver 4 0.93 0.85 1.01 -1.69 .091 -7.1 Injury crashes 13 0.81 0.76 0.87 -6.13 .000* -18.6 0.01 1 .933 Per capitaa 12 0.81 0.76 0.87 -6.08 .000* -18.7 Per licensed driver 1 0.83 0.52 1.32 -0.78 .433 -17.0 Fatal crashes 6 0.79 0.70 0.88 -4.01 .000* -21.3 – – – Per capita 6 0.79 0.70 0.88 -4.01 .000* -21.3 17-year-olds 14 0.89 0.87 0.91 -9.26 .000 -10.7 29.98 3 .000* Total crashes 5 0.89 0.87 0.92 -8.84 .000* -10.8 29.71 1 .000* Per capita 2 0.82 0.79 0.86 -9.96 .000* -17.5 Per licensed driver 3 0.95 0.92 0.98 -2.94 .003* -5.0 Injury crashes 5 0.91 0.83 1.00 -2.00 .046* -8.7 – – – Per capita 5 0.91 0.83 1.00 -2.00 .046* -8.7 Fatal crashes 4 0.88 0.78 1.00 -2.00 .045* -11.8 – – – Per capita 4 0.88 0.78 1.00 -2.00 .045* -11.8 18-year-olds 12 1.00 0.97 1.02 -0.44 .662 -0.5 4.92 3 .178 Total crashes 4 0.99 0.97 1.02 -0.43 .665 -0.5 1.03 1 .310 Per capita 2 0.95 0.86 1.04 -1.09 .275 -5.3 Per licensed driver 2 1.00 0.97 1.02 -0.17 .862 -0.2 Injury crashes 4 0.96 0.90 1.03 -1.19 .236 -3.9 – – – Per capita 4 0.96 0.90 1.03 -1.19 .236 -3.9 Fatal crashes 4 1.08 0.98 1.19 1.58 .115 +8.1 – – – Per capita 4 1.08 0.98 1.19 1.58 .115 +8.1 19-year-olds 11 1.00 0.98 1.01 -0.72 .470 -0.4 10.41 3 .015* Total crashes 3 0.99 0.98 1.01 -1.03 .302 -0.8 8.61 1 .003* Per capita 2 0.98 0.96 1.00 -2.37 .018* -2.0 Per licensed driver 1 1.03 1.00 1.06 2.02 .044* +3.1 Injury crashes 4 1.00 0.98 1.02 -0.18 .858 -0.2 – – – Per capita 4 1.00 0.98 1.02 -0.18 .858 -0.2 Fatal crashes 4 1.03 0.97 1.10 1.10 .269 +3.5 – – – Per capita 4 1.03 0.97 1.10 1.10 .269 +3.5 20-year-olds 1 0.94 0.80 1.10 -0.78 .434 -6.1 – – – Fatal crashes 1 0.94 0.80 1.10 -0.78 .434 -6.1 – – – Per capita 1 0.94 0.80 1.10 -0.78 .434 -6.1
Note. Effect estimates for 18 or older reflect both drivers licensed under GDL and others who never had GDL licenses. aFour effect estimates were excluded from the 16-year-old per capita injury estimate to maintain independence; one was based on non-fatal driver injuries and the other three were based on traffic injuries.*p < .05.

20
Effects for 16-year-olds. For 16-year-olds, GDL programs overall were associated with a 16 percent reduction (RRw = 0.84 [95% CI = 0.81-0.88]) in crashes combined across all outcome types and denominator choices. With regard to the three major categories of crash outcomes, GDL programs overall were associated with reductions of 9 percent for total crashes (RRw = 0.91 [95% CI = 0.84-0.98]), 19 percent for injury crashes (RRw = 0.81 [95% CI = 0.76-0.87]), and 21 percent for fatal crashes (RRw = 0.79 [95% CI = 0.70-0.88]). The effect estimates for 16-year-olds did not reliably vary across crash outcomes or denominator choices (p > .05). Nonetheless, the reduction in per capita 16-year-old total crashes (17%) was larger and statistically reliable (p < .05), whereas that for per licensed driver total crashes (7%) was not (p > .05). Effect sizes based on per capita rates would capture effects associated with delayed licensing in addition to other exposure-reducing factors of GDL programs, whereas those based on per licensed driver rates would underestimate changes in crashes that result from reduced licensure (McKnight, Peck, & Foss, 2002). Effects for 17-year-olds. For 17-year-olds, a smaller reduction (11%) across all crash outcome types combined was found (RRw = 0.89 [95% CI = 0.87-0.91]). For the three major categories of crash outcomes GDL programs overall were associated with reductions of 11 percent for total crashes (RRw = 0.89 [95% CI = 0.87-0.92]), 9 percent for injury crashes (RRw = 0.91 [95% CI = 0.83-1.00]), and 12 percent for fatal crashes (RRw = 0.88 [95% CI = 0.78-1.00]). The heterogeneity analyses indicated that GDL programs overall were associated with larger reductions in 17-year-old crash rates per capita (17%) than those based on per licensed driver rates (5%; p < .05).
Effects for 18-year-olds. With regard to 18-year-olds, no reliable change was found associated with GDL programs overall for crashes combined across all outcome types (RRw = 1.00 [95% CI = 0.97-1.02]), or for total crashes (RRw = 0.99 [95% CI = 0.97-1.02]), injury crashes (RRw = 0.96 [95% CI = 0.90-1.03]), or fatal crashes (RRw = 1.08 [95% CI = 0.98-1.19]). The heterogeneity analyses did not indicate that there was reliable variation across outcome types or denominator choices (p > .05) Effects for 19-year-olds. Reliable reductions associated with GDL overall were also not found for 19-year-olds across all crash outcome types combined (RRw = 1.00 [95% CI = 0.98-1.01]), or for total crashes (RRw = 0.99 [95% CI = 0.98-1.01]), injury crashes (RRw = 1.00 [95% CI = 0.98-1.02]), or fatal crashes (RRw = 1.03 [95% CI = 0.97-1.10]). Although the heterogeneity analyses suggested that GDL programs are associated with a 2 percent decrease in 19-year-old per population total crash rates, but a small increase in total per licensed driver crash rates, the number of effect sizes involved in this comparison is very small. Effects for 20-year-olds. Only one effect size was available for 20-year-olds, which prohibits drawing any conclusions about pooled potential effects of GDL programs on this age group. The reader is reminded that any rate increases or decreases for 18 or older drivers represent (a) the effects of GDL provisions imposed at age 15 to 17 that no longer apply to these older age groups, and (b) the crash rates of drivers who chose to avoid GDL by delaying licensure until 18 or older. Significant increases in crash rates among these older age groups

21
would therefore suggest that any crash reductions observed at age 15 to 17 are at least partially offset by delayed negative effects.
5.2.2 Age Group Overall GDL Effect Sizes Stratified by Crash Types and Denominator Choices
Table 4 shows the overall GDL effect estimates for combined age groups (e.g., 15-17) stratified by crash outcome type and denominator choice. The numbers of effect sizes available for these age groups were generally small, so the discussion here is limited to cases where at least two effect sizes were available to create combined effect estimates.
Table 4. Age Group Overall GDL Effect Sizes Stratified by Crash Types and Denominator Choices
Age group Outcome type Denominator
Test of effect size Tests of strata heterogeneity 95% CI
N RRw Lower Upper z p ∆% QB df p 15- to 17-year-olds 6 0.95 0.91 0.98 -2.85 .004* -5.4 7.24 2 .027* Total crashes 1 1.06 0.97 1.17 1.30 .195 +6.4 – – – Per capita 1 1.06 0.97 1.17 1.30 .195 +6.4 Injury crashes 4 0.92 0.84 1.01 -1.77 .077 -8.1 – – – Per capitaa 4 0.92 0.84 1.01 -1.77 .077 -8.1 Fatal crashes 1 0.93 0.88 0.97 -3.25 .001* -7.5 – – – Per capitab 1 0.93 0.88 0.97 -3.25 .001* -7.5 16-17-year-olds 1 0.86 0.82 0.91 -5.61 .000* -14.0 – – – Fatal crashes 1 0.86 0.82 0.91 -5.61 .000* -14.0 – – – Per capita 1 0.86 0.82 0.91 -5.61 .000* -14.0 16-19-year-olds 3 1.04 0.97 1.12 1.23 .220 +4.4 0.95 1 .329 Fatal crashes 3 1.04 0.97 1.12 1.23 .220 +4.4 0.95 1 .329 Per capita 2 1.02 0.93 1.11 0.35 .725 +1.6 Per licensed driver 1 1.09 0.98 1.22 1.53 .127 +9.0 18-19-year-olds 6 1.09 1.06 1.12 5.57 .000* +9.0 7.61 2 .022* Total crashes 1 1.19 1.08 1.32 3.46 .001* +19.5 – – – Per capita 1 1.19 1.08 1.32 3.46 .001* +19.5 Injury crashes 4 1.02 0.95 1.09 0.55 .582 +1.8 – – – Per capita 4 1.02 0.95 1.09 0.55 .582 +1.8 Fatal crashes 1 1.10 1.06 1.14 5.13 .000* +10.0 – – – Per capita 1 1.10 1.06 1.14 5.13 .000* +10.0 18- to 20-year-olds 1 0.97 0.94 1.00 -1.70 .090 -2.9 – – – Fatal crashes 1 0.97 0.94 1.00 -1.70 .090 -2.9 – – – Per capitac 1 0.97 0.94 1.00 -1.70 .090 -2.9
Note. Effect estimates for 18 or older reflect both drivers licensed under GDL and others who never had GDL licenses. aThree effect estimates for 15- to 17-year-olds were excluded from this estimate to maintain independence; all were for traffic injuries. bOne effect estimate for 15- to 17-year-olds was excluded from this estimate to maintain independence; it was for traffic fatalities. cOne effect estimate for 18- to 20-year-olds was excluded from this estimate to maintain independence; it was for traffic fatalities. *p < .05.

22
Effects for 15- to 17-year-olds. For 15- to 17-year-olds, GDL programs overall were associated with a 5 percent reduction (RRw = 0.95 [95% CI = 0.91-0.98]) in crashes combined across all outcome types and denominator choices. This overall reduction was driven by a suggestive reduction in injury crashes (p = .08) and a reliable reduction in fatal crashes (p < .05), given that the heterogeneity analysis indicated that there was reliable variation among effects by crash outcome type (p < .05). No net change associated with GDL overall was found for 16-19-year-old fatal crashes (RRw = 1.04 [95% CI = 0.97-1.12]). Effects for 18- and 19-year-olds. When only 18- and 19-year-olds were considered, GDL programs overall were found to be associated with a 9 percent increase combined across all crash outcome types (RRw = 1.09 [95% CI = 1.06-1.12]). The heterogeneity analysis indicated that there was variation in effects among the crash outcome types (p < .05), with no reliable increase associated with GDL overall being found for injury crashes.
5.3 Overall GDL Effect Sizes Stratified by IIHS GDL Program Strength Ratings and Teen Licensing System Types
Although GDL programs overall were found to be associated with reductions in 16- and 17-year-old crash outcomes, determining whether the reductions varied systematically as a function of the strength and types of the GDL programs was explored using moderator variable analyses. This was done by coding each of the programs represented by the overall GDL effects using two different methods from the literature and then comparing combined estimates across rating categories. The first rating scheme used was that from the IIHS, as described in McCartt, Teoh, Fields, Braitman, and Hellinga (2010). Briefly, this method assigns points to each program based on the components present (e.g., learner permit holding period) and also the calibrations of those components (e.g., < 3 months = 0 points, 3–5 months = 1 point, and 6+ months = 2 points). Based on the summed points the programs are rated as being Good, Fair, Marginal, or Poor.
The other method used was the licensing system rating scheme described in Masten, Foss, and Marshall (2011) in which programs are classified as GDL programs only if 16-year-old drivers are required to hold a learner permit for at least 3 months, followed by an intermediate period with either a nighttime restriction starting before 1 a.m. or a passenger restriction allowing no more than 1 passenger younger than 18 years. GDL programs are further classified as having only one or both of these restrictions during the intermediate licensing phase. For both rating systems the GDL programs were coded as they existed during the first post-intervention time point in each study; changes to the program after that point were not taken into account. Only per capita effect sizes were used for these moderator analyses because the overall GDL effect sizes sometimes differed as a function of denominator choice and the numbers of per capita effects sizes were larger. To insure independence of the estimates given that some studies contributed more than one per capita effect size for a particular GDL program (e.g., total and injury crash effect sizes), a single average per capita effect size was used for each program from each study. The QB statistics for these analyses test whether the strength ratings or program types reliably moderate the effect sizes. Only results based on at least two independent effect estimates are discussed below.

23
5.3.1 Overall GDL Effect Sizes Stratified by IIHS GDL Program Strength Ratings Table 5 shows the per capita effect sizes stratified by the IIHS ratings GDL program strength. The IIHS ratings of GDL program strength were not found to be a reliable moderator of the effect sizes for either 16- or 17-year-olds (p > .05). GDL programs rated as Fair were associated with a 28 percent reduction in crashes for 16-year-olds, whereas those rated as Good were associated with only an 18 percent reduction (p < .05). None of the individual IIHS ratings were reliably associated with changes in 17-year-old crash rates (p > .05). The IIHS ratings were found to be a reliable moderator of the effect sizes for both 18- and 19-year-olds (p < .05). However, the heterogeneity for 18-year-olds was based on an effect estimate from a single study combined across different GDL programs (hence the IIHS rating of ‘varies’), which differed from the others. For 19-year-olds GDL programs with Fair IIHS ratings were found to be associated with a 3 percent reduction in crashes, whereas those with Good ratings were associated with a 6 percent increase (p < .05).
Table 5. Overall GDL Effect Sizes Stratified by IIHS GDL Program Ratings
Age group Rating
Test of effect size Tests of strata heterogeneity 95% CI
Ni RRw Lower Upper z p ∆% QB df p
16-year-olds 15 0.83 0.79 0.87 -7.77 .000* -17.4 2.97 3 .396 Marginal 1 0.88 0.78 1.01 -1.86 .063 -11.7 Fair 5 0.72 0.59 0.87 -3.33 .001* -28.0 Good 7 0.82 0.77 0.88 -5.94 .000* -17.7 Varies 2 0.83 0.75 0.92 -3.66 .000* -16.9 17-year-olds 8 0.95 0.91 0.99 -2.33 .020* -4.7 1.93 3 .587 Marginal 1 0.97 0.89 1.05 -0.84 .398 -3.0 Fair 3 0.84 0.69 1.03 -1.66 .098 -16.0 Good 3 0.92 0.80 1.05 -1.23 .218 -8.0 Varies 1 0.96 0.91 1.01 -1.54 .124 -4.0 18-year-olds 8 1.01 0.99 1.03 0.78 .437 +0.8 12.36 3 .006* Marginal 1 0.98 0.88 1.10 -0.33 .742 -1.9 Fair 3 0.99 0.97 1.02 -0.49 .626 -0.5 Good 3 1.03 0.89 1.19 0.43 .667 +3.2 Varies 1 1.11 1.05 1.17 3.53 .000* +10.6 19-year-olds 8 0.99 0.97 1.01 -1.21 .225 -1.1 11.49 3 .009* Marginal 1 1.00 0.90 1.12 0.08 .934 +0.5 Fair 3 0.97 0.95 0.99 -2.72 .007* -2.9 Good 3 1.06 1.00 1.11 2.13 .033* +5.7 Varies 1 1.03 0.97 1.08 1.01 .312 +2.8
Note. Effect estimates for 18 or older reflect both drivers licensed under GDL and others who never had GDL licenses. Ni = Number of independent effect sizes; effect sizes from the same study of the same GDL program were averaged to maintain independence. Varies = effect estimates were based on multiple State GDL programs so a single rating could not be coded. IIHS ratings of GDL strength were coded using the method described in McCartt, Teoh, Fields, Braitman, and Hellinga (2010). Programs were coded as they existed during the first post-GDL time period. *p < .05.

24
5.3.2 Overall GDL Effect Sizes Stratified by Teen Licensing System Types Table 6 shows the per capita effect sizes stratified by the Masten, Foss, and Marshall (2010) teen licensing system types. The teen licensing system classification was found to be a reliable moderator of effect sizes for 16-, 18-, and 19-year-olds (p < .05), but not those for 17-year-olds (p > .05). However, while all the teen licensing system classifications were associated with decreased crashes for 16-year-olds (p < .05), the results counter intuitively indicate that stronger GDL programs with two license restrictions during the intermediate stage were associated with smaller reductions in 16-year-old crashes (18%) than weaker GDL programs with only one such restriction (23%). Neither type of GDL program was reliably associated with changes in 17-year-old crashes (p > .05). The heterogeneity for 18-year-olds was again based on a single effect estimate differing from the others. Among 19-year-olds GDL programs with one intermediate license restriction were associated with a 3 percent reduction in crashes, whereas those with two such restrictions were associated with a 6 percent increase in crashes (p < .05).
Table 6. Overall GDL Effect Sizes Stratified by Teen Licensing System Types
Age group Category
Test of effect size Tests of strata heterogeneity 95% CI
Ni RRw Lower Upper z p ∆% QB df p
16-year-olds 15 0.80 0.77 0.84 -8.75 .000* -19.6 8.12 3 .044* Learner stage only 1 0.64 0.53 0.76 -5.10 .000* -36.4 GDL 1 restriction 5 0.77 0.66 0.91 -3.15 .002* -22.6 GDL 2 restrictions 7 0.82 0.77 0.88 -5.94 .000* -17.7 Varies 2 0.83 0.75 0.92 -3.66 .000* -16.9 17-year-olds 8 0.94 0.90 0.98 -2.90 .004* -6.2 3.91 3 .272 Learner stage only 1 0.82 0.70 0.96 -2.46 .014* -18.2 GDL 1 restriction 3 0.91 0.81 1.03 -1.54 .124 -8.8 GDL 2 restrictions 3 0.92 0.80 1.05 -1.23 .218 -8.5 Varies 1 0.96 0.91 1.01 -1.54 .124 -4.0 18-year-olds 8 1.01 0.99 1.03 0.78 .437 +0.8 12.34 3 .006* Learner stage only 1 0.98 0.84 1.14 -0.27 .789 -2.0 GDL 1 restriction 3 0.99 0.97 1.02 -0.51 .611 -0.5 GDL 2 restrictions 3 1.03 0.89 1.19 0.43 .667 +3.2 Varies 1 1.11 1.05 1.17 3.53 .000* +10.6 19-year-olds 8 0.99 0.97 1.01 -1.21 .225 -1.1 11.47 3 .009* Learner stage only 1 0.93 0.80 1.08 -0.95 .344 -7.1 GDL 1 restriction 3 0.97 0.95 0.99 -2.54 .011* -2.7 GDL 2 restrictions 3 1.06 1.00 1.11 2.13 .033* +5.7 Varies 1 1.03 0.97 1.08 1.01 .312 +2.8
Note. Effect estimates for 18 or older reflect both drivers licensed under GDL and others who never had GDL licenses. Ni = Number of independent effect sizes; effect sizes from the same study of the same GDL program were averaged to maintain independence. Varies = effect estimates were based on multiple State GDL programs so a single rating could not be coded. Licensing system ratings were coded using the method described in Masten, Foss, and Marshall (2011). Programs were coded as they existed during the first post-GDL time period. *p < .05.

25
5.4 Overall GDL Effect Sizes Stratified by GDL Component Calibrations
The specific components (e.g., learner permit holding period lengths and required supervised driving hours) and calibrations of the components (e.g., 6 months and 40 hours, respectively) of the GDL programs represented by the overall GDL effect sizes were also coded as they existed during the first post-intervention time period. This section presents the overall GDL effect sizes stratified by the calibrations of each GDL program component. Again only the per capita effect estimates were used and single average effect sizes were used to represent studies with multiple per capita effect sizes (e.g., total and fatal) for a particular GDL program. Note that while this exercise has some merit, the estimates are confounded by the fact that other GDL components and calibrations also varied besides those shown in a particular table, which could account for the observed differences in the effect sizes. With regard to the nighttime and passenger restriction components, note that the effect sizes presented here are not based on the specific types of crashes targeted by these restrictions; the latter are presented later in the section on component-specific effect sizes. Only results based on independent effect sizes from at least two different sources are discussed.
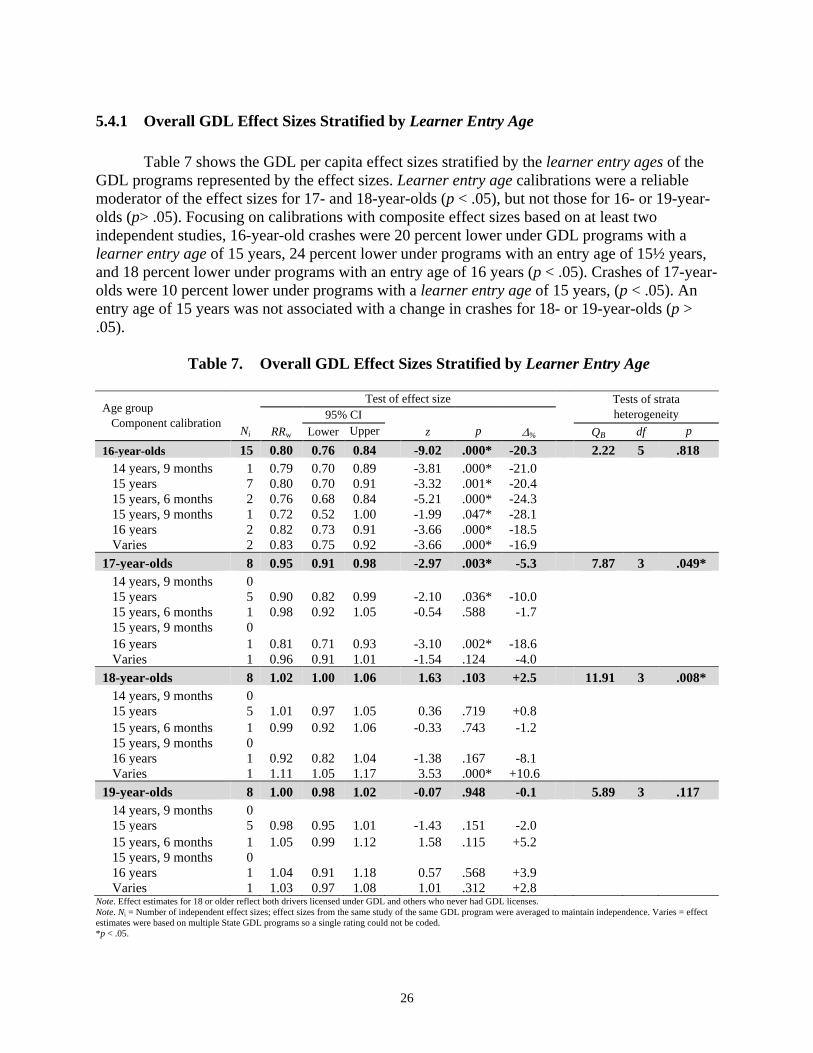
26
5.4.1 Overall GDL Effect Sizes Stratified by Learner Entry Age Table 7 shows the GDL per capita effect sizes stratified by the learner entry ages of the GDL programs represented by the effect sizes. Learner entry age calibrations were a reliable moderator of the effect sizes for 17- and 18-year-olds (p < .05), but not those for 16- or 19-year-olds (p> .05). Focusing on calibrations with composite effect sizes based on at least two independent studies, 16-year-old crashes were 20 percent lower under GDL programs with a learner entry age of 15 years, 24 percent lower under programs with an entry age of 15½ years, and 18 percent lower under programs with an entry age of 16 years (p < .05). Crashes of 17-year-olds were 10 percent lower under programs with a learner entry age of 15 years, (p < .05). An entry age of 15 years was not associated with a change in crashes for 18- or 19-year-olds (p > .05).
Table 7. Overall GDL Effect Sizes Stratified by Learner Entry Age
Age group Component calibration
Test of effect size Tests of strata heterogeneity 95% CI
Ni RRw Lower Upper z p ∆% QB df p
16-year-olds 15 0.80 0.76 0.84 -9.02 .000* -20.3 2.22 5 .818 14 years, 9 months 1 0.79 0.70 0.89 -3.81 .000* -21.0 15 years 7 0.80 0.70 0.91 -3.32 .001* -20.4 15 years, 6 months 2 0.76 0.68 0.84 -5.21 .000* -24.3 15 years, 9 months 1 0.72 0.52 1.00 -1.99 .047* -28.1 16 years 2 0.82 0.73 0.91 -3.66 .000* -18.5 Varies 2 0.83 0.75 0.92 -3.66 .000* -16.9 17-year-olds 8 0.95 0.91 0.98 -2.97 .003* -5.3 7.87 3 .049* 14 years, 9 months 0 15 years 5 0.90 0.82 0.99 -2.10 .036* -10.0 15 years, 6 months 1 0.98 0.92 1.05 -0.54 .588 -1.7 15 years, 9 months 0 16 years 1 0.81 0.71 0.93 -3.10 .002* -18.6 Varies 1 0.96 0.91 1.01 -1.54 .124 -4.0 18-year-olds 8 1.02 1.00 1.06 1.63 .103 +2.5 11.91 3 .008* 14 years, 9 months 0 15 years 5 1.01 0.97 1.05 0.36 .719 +0.8 15 years, 6 months 1 0.99 0.92 1.06 -0.33 .743 -1.2 15 years, 9 months 0 16 years 1 0.92 0.82 1.04 -1.38 .167 -8.1 Varies 1 1.11 1.05 1.17 3.53 .000* +10.6 19-year-olds 8 1.00 0.98 1.02 -0.07 .948 -0.1 5.89 3 .117 14 years, 9 months 0 15 years 5 0.98 0.95 1.01 -1.43 .151 -2.0 15 years, 6 months 1 1.05 0.99 1.12 1.58 .115 +5.2 15 years, 9 months 0 16 years 1 1.04 0.91 1.18 0.57 .568 +3.9 Varies 1 1.03 0.97 1.08 1.01 .312 +2.8
Note. Effect estimates for 18 or older reflect both drivers licensed under GDL and others who never had GDL licenses. Note. Ni = Number of independent effect sizes; effect sizes from the same study of the same GDL program were averaged to maintain independence. Varies = effect estimates were based on multiple State GDL programs so a single rating could not be coded. *p < .05.

27
5.4.2 Overall GDL Effect Sizes Stratified by Learner Permit Holding Period Table 8 shows the GDL per capita effect sizes stratified by the learner permit holding periods of the GDL programs represented by the effect sizes. Learner permit holding period calibrations were a reliable moderator of the effect sizes for all of the age groups (p < .05). Based on composite effect sizes representing two or more two independent estimates, 16-year-old crashes were lower under GDL programs with learner permit holding periods of 6 months or longer (p < .05). GDL programs with longer holding periods were associated with even larger 16-year-old crash reductions, ranging from 12 percent for those lasting 6 months to 40 percent for those lasting 12 months. Programs with learner permit holding periods of 6 months were not associated with changes in crash rates for 17-, 18-, or 19-year olds (p > .05). However, crashes of 17-year-olds were 23 percent lower and those of 19-year-olds were 3 percent lower under GDL programs with permit holding periods lasting 12 months (p < .05), though those for 18-year-olds were not different (p > .05).
Table 8. Overall GDL Effect Sizes Stratified by Learner Permit Holding Period
Age group Component calibration
Test of effect size Tests of strata heterogeneity 95% CI
Ni RRw Lower Upper z p ∆% QB df p
16-year-olds 15 0.83 0.80 0.86 -10.89 .000* -17.1 39.05 4 .000* 4 months 1 0.72 0.52 1.00 -1.99 .047* -28.1 6 months 8 0.87 0.84 0.91 -6.46 .000* -12.5 9 months 2 0.76 0.68 0.84 -5.21 .000* -24.3 12 months 2 0.60 0.53 0.67 -8.45 .000* -40.1 Varies 2 0.83 0.75 0.92 -3.66 .000* -16.9 17-year-olds 8 0.95 0.92 0.98 -2.96 .003* -5.0 10.42 3 .015* 4 months 0 6 months 4 0.94 0.87 1.01 -1.60 .110 -6.0 9 months 1 0.98 0.92 1.05 -0.54 .588 -1.7 12 months 2 0.77 0.67 0.88 -3.73 .000* -23.2 Varies 1 0.96 0.91 1.01 -1.54 .124 -4.0 18-year-olds 8 1.01 0.99 1.04 1.12 .263 +1.3 11.49 3 .009* 4 months 0 6 months 4 1.02 0.93 1.11 0.32 .747 +1.5 9 months 1 0.99 0.92 1.06 -0.33 .743 -1.2 12 months 2 1.00 0.97 1.02 -0.32 .752 -0.4 Varies 1 1.11 1.05 1.17 3.53 .000* +10.6 19-year-olds 8 0.99 0.97 1.01 -1.21 .225 -1.1 9.63 3 .022* 4 months 0 6 months 4 1.00 0.97 1.04 0.14 .891 +0.3 9 months 1 1.05 0.99 1.12 1.58 .115 +5.2 12 months 2 0.97 0.94 0.99 -2.75 .006* -3.3 Varies 1 1.03 0.97 1.08 1.01 .312 +2.8
Note. Effect estimates for 18 or older reflect both drivers licensed under GDL and others who never had GDL licenses. Ni = Number of independent effect sizes; effect sizes from the same study of the same GDL program were averaged to maintain independence. Varies = effect estimates were based on multiple State GDL programs so a single rating could not be coded. *p < .05.

28
5.4.3 Overall GDL Effect Sizes Stratified by Supervised Driving Hours Table 9 shows the GDL per capita effect sizes stratified by the supervised driving hours requirements of the GDL programs represented by the effect sizes. Supervised driving hours calibrations were a reliable moderator of the effect sizes for 18- and 19-year-olds (p < .05), but not those for 16- or 17-year-olds (p > .05). Based on calibrations with at least two independent studies contributing to the composite effect size, 16-year-old crashes were 29 percent lower under GDL programs without a minimum number of required supervised driving hours, 21 percent lower under those requiring 40 hours of supervised driving, and 15 percent lower under those requiring 50 hours (p < .05). Crashes of 17-year-olds were 16 percent lower and those of 19-year-olds were 3 percent lower under programs without minimum required hours of supervised driving, (p < .05), but those for 18-year-olds were not different (p > .05). Programs with 40 hours of required supervised driving were not associated with changes in crash rates for 17-, 18- or 19-year-olds (p > .05).
Table 9. Overall GDL Effect Sizes Stratified by Supervised Driving Requirement
Age group Component calibration
Test of effect size Tests of strata heterogeneity 95% CI
Ni RRw Lower Upper z p ∆% QB df p
16-year-olds 15 0.82 0.78 0.86 -8.06 .000* -17.8 2.21 4 .697 None Required 4 0.71 0.54 0.94 -2.36 .018* -28.7 12 hours 1 0.82 0.73 0.91 -3.50 .000* -18.4 40 hours 4 0.79 0.72 0.87 -4.70 .000* -20.6 50 hours 4 0.85 0.78 0.93 -3.72 .000* -14.8 Varies 2 0.83 0.75 0.92 -3.66 .000* -16.9 17-year-olds 8 0.96 0.93 1.00 -2.22 .027* -3.8 3.40 3 .334 None Required 4 0.84 0.72 0.98 -2.23 .026* -16.3 12 hours 0 40 hours 2 0.98 0.93 1.03 -0.95 .343 -2.3 50 hours 1 0.96 0.73 1.26 -0.29 .771 -3.9 Varies 1 0.96 0.91 1.01 -1.54 .124 -4.0 18-year-olds 8 1.01 0.99 1.03 0.75 .454 +0.7 20.99 3 .000* None Required 4 0.99 0.97 1.01 -0.72 .471 -0.8 12 hours 0 40 hours 2 0.99 0.93 1.05 -0.45 .650 -1.4 50 hours 1 1.24 1.07 1.44 2.90 .004* +24.5 Varies 1 1.11 1.05 1.17 3.53 .000* +10.6 19-year-olds 8 0.99 0.97 1.01 -1.21 .225 -1.1 10.44 3 .015* None Required 4 0.97 0.95 0.99 -2.59 .010* -2.7 12 hours 0 40 hours 2 1.04 0.98 1.10 1.41 .159 +4.0 50 hours 1 1.10 0.97 1.24 1.48 .138 +9.8 Varies 1 1.03 0.97 1.08 1.01 .312 +2.8
Note. Effect estimates for 18 or older reflect both drivers licensed under GDL and others who never had GDL licenses. Ni = Number of independent effect sizes; effect sizes from the same study of the same GDL program were averaged to maintain independence. Varies = effect estimates were based on multiple State GDL programs so a single rating could not be coded. *p < .05.

29
5.4.4 Overall GDL Effect Sizes Stratified by Intermediate License Entry Age Table 10 shows the GDL per capita effect sizes stratified by the intermediate license entry ages of the GDL programs represented by the effect sizes. Intermediate license entry age calibrations were a reliable moderator of the effect sizes for 18-year-olds (p < .05), but not those for 16-, 17-, or 19-year-olds (p > .05). Few calibrations had composite effect sizes based on two or more independent studies, but among them 16-year-old crashes were 22 percent lower under GDL programs with an intermediate license entry age of 16 years and 24 percent lower under programs with an entry age of 16¼ years (p < .05). While the crash rates of 17-, 18-, and 19-year-olds were not reliably different under programs with an intermediate license entry age of 16 years (p > .05), there was some suggestion that 17-year-old crashes may be 13 percent lower under such programs (p =.08).
Table 10. Overall GDL Effect Sizes Stratified by Intermediate License Entry Age
Age group Component calibration
Test of effect size Tests of strata heterogeneity 95% CI
Ni RRw Lower Upper z p ∆% QB df p
16-year-olds 15 0.81 0.77 0.85 -8.36 .000* -19.2 4.36 6 .629 15 years, 6 months 1 0.88 0.78 1.01 -1.86 .063 -11.7 16 years 7 0.78 0.68 0.90 -3.58 .000* -21.7 16 years, 1 month 1 0.72 0.52 1.00 -1.99 .047* -28.1 16 years, 3 months 2 0.76 0.68 0.84 -5.21 .000* -24.3 16 years, 6 months 1 0.82 0.73 0.91 -3.50 .000* -18.4 17 years 1 0.80 0.54 1.20 -1.06 .288 -19.6 Varies 2 0.83 0.75 0.92 -3.66 .000* -16.9 17-year-olds 8 0.95 0.92 0.99 -2.80 .005* -4.7 8.11 4 .088 15 years, 6 months 1 0.97 0.89 1.05 -0.84 .398 -3.4 16 years 4 0.86 0.73 1.02 -1.72 .085 -13.5 16 years, 1 month 0 16 years, 3 months 1 0.98 0.92 1.05 -0.54 .588 -1.7 16 years, 6 months 0 17 years 1 0.81 0.71 0.93 -3.10 .002* -18.6 Varies 1 0.96 0.91 1.01 -1.54 .124 -4.0 18-year-olds 8 1.03 1.00 1.06 1.67 .096 +2.6 12.07 4 .017* 15 years, 6 months 1 0.98 0.88 1.10 -0.33 .742 -1.9 16 years 4 1.01 0.97 1.06 0.54 .589 +1.4 16 years, 1 month 0 16 years, 3 months 1 0.99 0.92 1.06 -0.33 .743 -1.2 16 years, 6 months 0 17 years 1 0.92 0.82 1.04 -1.38 .167 -8.1 Varies 1 1.11 1.05 1.17 3.53 .000* +10.6 19-year-olds 8 1.01 0.98 1.03 0.45 .653 +0.6 4.85 4 .303 15 years, 6 months 1 1.00 0.90 1.12 0.08 .934 +0.5 16 years 4 0.98 0.95 1.02 -1.10 .273 -1.9 16 years, 1 month 0 16 years, 3 months 1 1.05 0.99 1.12 1.58 .115 +5.2 16 years, 6 months 0 17 years 1 1.04 0.91 1.18 0.57 .568 +3.9 Varies 1 1.03 0.97 1.08 1.01 .312 +2.8
Note. Effect estimates for 18 or older reflect both drivers licensed under GDL and others who never had GDL licenses. All estimates for the 17-year-old intermediate license age are based on New Jersey, which is the only State to have a minimum intermediate age of 17 years. Ni = Number of independent effect sizes; effect sizes from the same study of the same GDL program were averaged to maintain independence. Varies = effect estimates were based on multiple State GDL programs so a single rating could not be coded. *p < .05.

30
5.4.5 Overall GDL Effect Sizes Stratified by Nighttime Driving Restriction Table 11 shows the per capita GDL effect sizes stratified by the intermediate stage nighttime driving restriction calibrations of the GDL programs represented by the effect sizes. Nighttime driving restriction calibrations were a reliable moderator of the effect sizes for all of the age groups (p < .05). However, the only calibration with at least two independent studies contributing to the composite effect size was for GDL programs with a nighttime restriction starting at 12 a.m. Under such programs 16-year-old crashes were 19 percent lower and 19-year-old crashes were 6 percent higher (p < .05), and the rates for 17- and 18-year-olds were not different (p > .05).
Table 11. Overall GDL Effect Sizes Stratified by Nighttime Driving Restriction
Age group Component calibration
Test of effect size Tests of strata heterogeneity 95% CI
Ni RRw Lower Upper z p ∆% QB df p
16-year-olds 15 0.83 0.81 0.86 -10.95 .000* -16.8 40.80 5 .000* 6 p.m. 1 0.88 0.78 1.01 -1.86 .063 -11.7 9 p.m. 1 0.57 0.48 0.67 -6.80 .000* -43.2 11 p.m. 1 0.90 0.86 0.96 -3.60 .000* -9.5 12 a.m. 9 0.81 0.77 0.86 -7.65 .000* -18.6 1 a.m. 1 0.64 0.53 0.76 -5.10 .000* -36.4 Varies 2 0.83 0.75 0.92 -3.66 .000* -16.9 17-year-olds 8 0.96 0.93 0.99 -2.96 .003* -4.2 15.68 5 .008* 6 p.m. 1 0.97 0.89 1.05 -0.84 .398 -3.4 9 p.m. 1 0.71 0.59 0.85 -3.62 .000* -29.0 11 p.m. 1 0.98 0.94 1.02 -0.84 .401 -1.8 12 a.m. 3 0.92 0.80 1.05 -1.23 .218 -8.5 1 a.m. 1 0.82 0.70 0.96 -2.46 .014* -18.2 Varies 1 0.96 0.91 1.01 -1.54 .124 -4.0 18-year-olds 8 1.01 0.99 1.03 0.78 .437 +0.8 12.41 5 .030* 6 p.m. 1 0.98 0.88 1.10 -0.33 .742 -1.9 9 p.m. 1 1.00 0.97 1.02 -0.27 .786 -0.4 11 p.m. 1 0.99 0.96 1.03 -0.39 .699 -0.7 12 a.m. 3 1.03 0.89 1.19 0.43 .667 +3.2 1 a.m. 1 0.98 0.84 1.14 -0.27 .789 -2.0 Varies 1 1.11 1.05 1.17 3.53 .000* +10.6 19-year-olds 8 0.99 0.97 1.01 -1.21 .225 -1.1 12.32 5 .031* 6 p.m. 1 1.00 0.90 1.12 0.08 .934 +0.5 9 p.m. 1 0.97 0.94 0.99 -2.63 .008* -3.2 11 p.m. 1 0.99 0.94 1.03 -0.61 .542 -1.4 12 a.m. 3 1.06 1.00 1.11 2.13 .033* +5.7 1 a.m. 1 0.93 0.80 1.08 -0.95 .344 -7.1 Varies 1 1.03 0.97 1.08 1.01 .312 +2.8
Note. Effect estimates for 18 or older reflect both drivers licensed under GDL and others who never had GDL licenses. Ni = Number of independent effect sizes; effect sizes from the same study of the same GDL program were averaged to maintain independence. Varies = effect estimates were based on multiple State GDL programs so a single rating could not be coded. *p < .05.

31
5.4.6 Overall GDL Effect Sizes Stratified by Passenger Driving Restriction Table 12 shows the per capita GDL effect sizes stratified by the intermediate stage passenger driving restriction calibrations of the GDL programs represented by the effect sizes. Passenger driving restriction calibrations were a reliable moderator of the effect sizes for 16-, 18-, and 19-year-olds (p < .05), but not for 17-year-olds (p > .05). Based on the composite effect sizes representing two or more two independent estimates, 16-year-old crash rates were 26 percent lower under GDL programs without a passenger restriction, 24 percent lower under those allowing only one teen passenger for a period of 6 months or longer, and 14 percent lower under those disallowing any teen passengers for 6 months or longer (p < .05). GDL programs without passenger restrictions were not reliably associated with changes in 17- or 18-year-old crash rates (p > .05), but 19-year-old crashes were 3 percent lower under such programs (p < .05). While the crash rates of 17-, 18-, and 19-year-olds were not reliably different under programs allowing only one teen passenger for 6 months or longer (p > .05), there was some suggestion that 19-year-old crashes were 5 percent higher under such programs (p = .09). Given that the heterogeneity of the results and confusing pattern of findings it is important to note that the “No restriction” category does not represent a valid baseline for assessing the causal impact of passenger restrictions; this is better suited for studies which isolate changes in passenger-related crashes, as is presented later in the section on component-specific effect estimates.

32
Table 12. Overall GDL Effect Sizes Stratified by Passenger Driving Restriction
Age group Component calibration
Test of effect size Tests of strata heterogeneity 95% CI
Ni RRw Lower Upper z p ∆% QB df p
16-year-olds 15 0.81 0.78 0.85 -9.01 .000* -18.6 13.89 5 .016* No restriction 4 0.74 0.60 0.92 -2.74 .006* -25.7 3 pass, ≥ 6 months 1 0.64 0.53 0.76 -5.10 .000* -36.4 2 pass, ≥ 6 months 1 0.88 0.78 1.01 -1.86 .063 -11.7 1 pass, ≥ 6 months 3 0.76 0.69 0.84 -5.31 .000* -24.1 0 pass, ≥ 6 months 4 0.86 0.80 0.92 -4.06 .000* -14.2 Varies 2 0.83 0.75 0.92 -3.66 .000* -16.9 17-year-olds 8 0.95 0.91 0.99 -2.64 .008* -5.3 4.48 5 .483 No restriction 2 0.85 0.62 1.16 -1.03 .302 -15.4 3 pass, ≥ 6 months 1 0.82 0.70 0.96 -2.46 .014* -18.2 2 pass, ≥ 6 months 1 0.97 0.89 1.05 -0.84 .398 -3.4 1 pass, ≥ 6 months 2 0.90 0.75 1.08 -1.09 .275 -9.7 0 pass, ≥ 6 months 1 0.96 0.73 1.26 -0.29 .771 -3.9 Varies 1 0.96 0.91 1.01 -1.54 .124 -4.0 18-year-olds 8 1.01 0.99 1.03 0.76 .445 +0.7 21.58 5 .001* No restriction 2 1.00 0.97 1.02 -0.45 .650 -0.5 3 pass, ≥ 6 months 1 0.98 0.84 1.14 -0.27 .789 -2.0 2 pass, ≥ 6 months 1 0.98 0.88 1.10 -0.33 .742 -1.9 1 pass, ≥ 6 months 2 0.97 0.91 1.03 -0.98 .329 -3.1 0 pass, ≥ 6 months 1 1.24 1.07 1.44 2.90 .004* +24.5 Varies 1 1.11 1.05 1.17 3.53 .000* +10.6 19-year-olds 8 0.99 0.97 1.01 -1.21 .225 -1.1 12.25 5 .032* No restriction 2 0.97 0.95 0.99 -2.61 .009* -2.8 3 pass, ≥ 6 months 1 0.93 0.80 1.08 -0.95 .344 -7.1 2 pass, ≥ 6 months 1 1.00 0.90 1.12 0.08 .934 +0.5 1 pass, ≥ 6 months 2 1.05 0.99 1.11 1.67 .095 +4.9 0 pass, ≥ 6 months 1 1.10 0.97 1.24 1.48 .138 +9.8 Varies 1 1.03 0.97 1.08 1.01 .312 +2.8
Note. Effect estimates for 18 or older reflect both drivers licensed under GDL and others who never had GDL licenses. Ni = Number of independent effect sizes; effect sizes from the same study of the same GDL program were averaged to maintain independence. Varies = effect estimates were based on multiple State GDL programs so a single rating could not be coded. *p < .05.
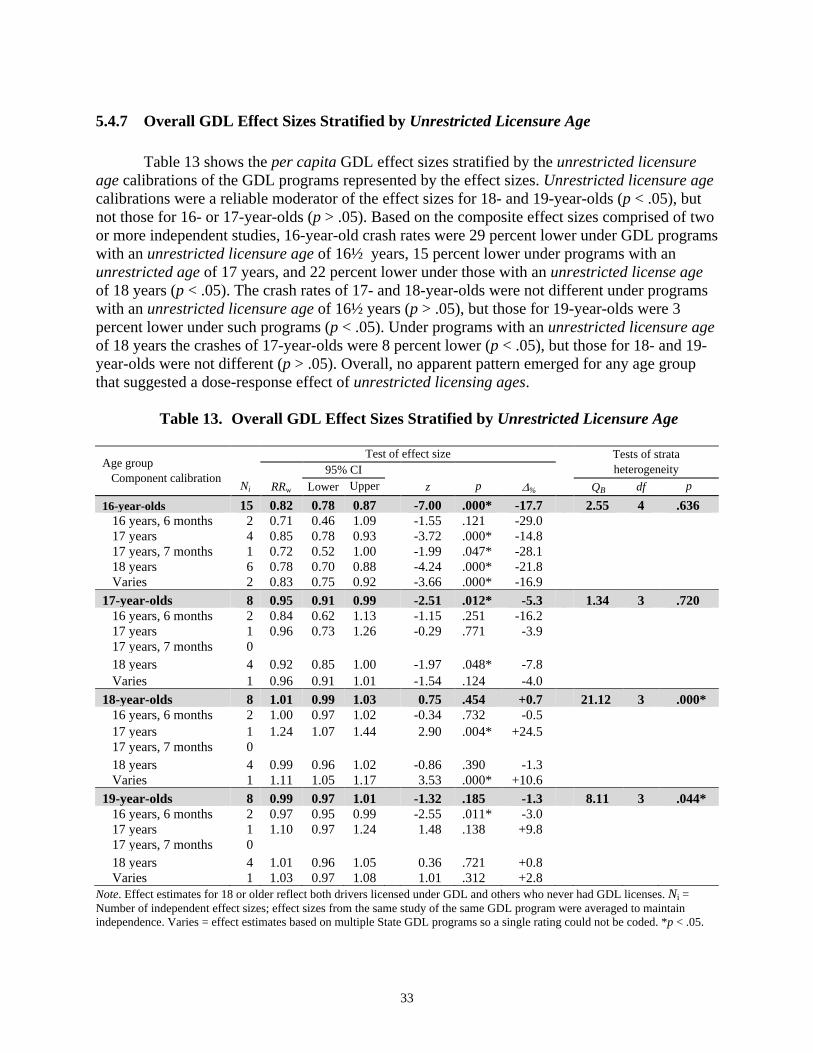
33
5.4.7 Overall GDL Effect Sizes Stratified by Unrestricted Licensure Age Table 13 shows the per capita GDL effect sizes stratified by the unrestricted licensure age calibrations of the GDL programs represented by the effect sizes. Unrestricted licensure age calibrations were a reliable moderator of the effect sizes for 18- and 19-year-olds (p < .05), but not those for 16- or 17-year-olds (p > .05). Based on the composite effect sizes comprised of two or more independent studies, 16-year-old crash rates were 29 percent lower under GDL programs with an unrestricted licensure age of 16½ years, 15 percent lower under programs with an unrestricted age of 17 years, and 22 percent lower under those with an unrestricted license age of 18 years (p < .05). The crash rates of 17- and 18-year-olds were not different under programs with an unrestricted licensure age of 16½ years (p > .05), but those for 19-year-olds were 3 percent lower under such programs (p < .05). Under programs with an unrestricted licensure age of 18 years the crashes of 17-year-olds were 8 percent lower (p < .05), but those for 18- and 19-year-olds were not different (p > .05). Overall, no apparent pattern emerged for any age group that suggested a dose-response effect of unrestricted licensing ages.
Table 13. Overall GDL Effect Sizes Stratified by Unrestricted Licensure Age
Age group Component calibration
Test of effect size Tests of strata heterogeneity 95% CI
Ni RRw Lower Upper z p ∆% QB df p
16-year-olds 15 0.82 0.78 0.87 -7.00 .000* -17.7 2.55 4 .636 16 years, 6 months 2 0.71 0.46 1.09 -1.55 .121 -29.0 17 years 4 0.85 0.78 0.93 -3.72 .000* -14.8 17 years, 7 months 1 0.72 0.52 1.00 -1.99 .047* -28.1 18 years 6 0.78 0.70 0.88 -4.24 .000* -21.8 Varies 2 0.83 0.75 0.92 -3.66 .000* -16.9 17-year-olds 8 0.95 0.91 0.99 -2.51 .012* -5.3 1.34 3 .720 16 years, 6 months 2 0.84 0.62 1.13 -1.15 .251 -16.2 17 years 1 0.96 0.73 1.26 -0.29 .771 -3.9 17 years, 7 months 0 18 years 4 0.92 0.85 1.00 -1.97 .048* -7.8 Varies 1 0.96 0.91 1.01 -1.54 .124 -4.0 18-year-olds 8 1.01 0.99 1.03 0.75 .454 +0.7 21.12 3 .000* 16 years, 6 months 2 1.00 0.97 1.02 -0.34 .732 -0.5 17 years 1 1.24 1.07 1.44 2.90 .004* +24.5 17 years, 7 months 0 18 years 4 0.99 0.96 1.02 -0.86 .390 -1.3 Varies 1 1.11 1.05 1.17 3.53 .000* +10.6 19-year-olds 8 0.99 0.97 1.01 -1.32 .185 -1.3 8.11 3 .044* 16 years, 6 months 2 0.97 0.95 0.99 -2.55 .011* -3.0 17 years 1 1.10 0.97 1.24 1.48 .138 +9.8 17 years, 7 months 0 18 years 4 1.01 0.96 1.05 0.36 .721 +0.8 Varies 1 1.03 0.97 1.08 1.01 .312 +2.8
Note. Effect estimates for 18 or older reflect both drivers licensed under GDL and others who never had GDL licenses. Ni = Number of independent effect sizes; effect sizes from the same study of the same GDL program were averaged to maintain independence. Varies = effect estimates based on multiple State GDL programs so a single rating could not be coded. *p < .05.
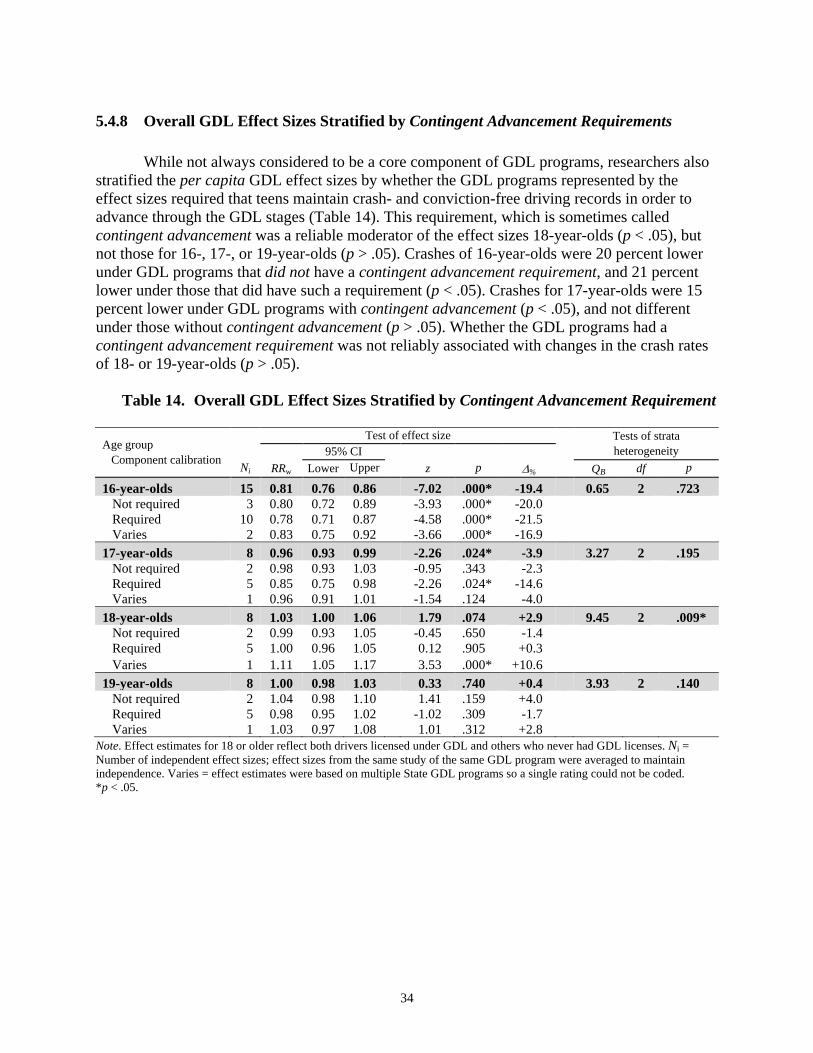
34
5.4.8 Overall GDL Effect Sizes Stratified by Contingent Advancement Requirements While not always considered to be a core component of GDL programs, researchers also stratified the per capita GDL effect sizes by whether the GDL programs represented by the effect sizes required that teens maintain crash- and conviction-free driving records in order to advance through the GDL stages (Table 14). This requirement, which is sometimes called contingent advancement was a reliable moderator of the effect sizes 18-year-olds (p < .05), but not those for 16-, 17-, or 19-year-olds (p > .05). Crashes of 16-year-olds were 20 percent lower under GDL programs that did not have a contingent advancement requirement, and 21 percent lower under those that did have such a requirement (p < .05). Crashes for 17-year-olds were 15 percent lower under GDL programs with contingent advancement (p < .05), and not different under those without contingent advancement (p > .05). Whether the GDL programs had a contingent advancement requirement was not reliably associated with changes in the crash rates of 18- or 19-year-olds (p > .05).
Table 14. Overall GDL Effect Sizes Stratified by Contingent Advancement Requirement
Age group Component calibration
Test of effect size Tests of strata heterogeneity 95% CI
Ni RRw Lower Upper z p ∆% QB df p
16-year-olds 15 0.81 0.76 0.86 -7.02 .000* -19.4 0.65 2 .723 Not required 3 0.80 0.72 0.89 -3.93 .000* -20.0 Required 10 0.78 0.71 0.87 -4.58 .000* -21.5 Varies 2 0.83 0.75 0.92 -3.66 .000* -16.9 17-year-olds 8 0.96 0.93 0.99 -2.26 .024* -3.9 3.27 2 .195 Not required 2 0.98 0.93 1.03 -0.95 .343 -2.3 Required 5 0.85 0.75 0.98 -2.26 .024* -14.6 Varies 1 0.96 0.91 1.01 -1.54 .124 -4.0 18-year-olds 8 1.03 1.00 1.06 1.79 .074 +2.9 9.45 2 .009* Not required 2 0.99 0.93 1.05 -0.45 .650 -1.4 Required 5 1.00 0.96 1.05 0.12 .905 +0.3 Varies 1 1.11 1.05 1.17 3.53 .000* +10.6 19-year-olds 8 1.00 0.98 1.03 0.33 .740 +0.4 3.93 2 .140 Not required 2 1.04 0.98 1.10 1.41 .159 +4.0 Required 5 0.98 0.95 1.02 -1.02 .309 -1.7 Varies 1 1.03 0.97 1.08 1.01 .312 +2.8
Note. Effect estimates for 18 or older reflect both drivers licensed under GDL and others who never had GDL licenses. Ni = Number of independent effect sizes; effect sizes from the same study of the same GDL program were averaged to maintain independence. Varies = effect estimates were based on multiple State GDL programs so a single rating could not be coded. *p < .05.

35
5.5 Overall GDL Effect Sizes Stratified by Publication and Methodological Factors
To determine if the overall GDL effect sizes differed as a function of the coded publication and methodological factors of the studies, the per capita effect sizes were stratified separately by a number of different factors. The resulting effect sizes are presented in the following sections.
5.5.1 Overall GDL Effect Sizes Stratified by Publication Factors Table 15 shows the per capita overall GDL effect sizes stratified by the mode of publication and type of researcher. Neither of these factors was a reliable source of heterogeneity among the overall GDL effect sizes (p > .05), with the exception of researcher type for 17-year-olds (p < .05). This heterogeneity for the 17-year-old effect sizes, however, was based on only one study.
Table 15. Overall GDL Effect Sizes Stratified by Publication Factors
Age group Factor Level
Test of effect size Tests of strata heterogeneity 95% CI
Ni RRw Lower Upper z p ∆% QB df p
16-year-olds Publication mode 15 0.80 0.75 0.85 -6.82 .000* -20.1 0.01 1 .920 Monograph 7 0.80 0.72 0.88 -4.26 .000* -20.5 Peer review 8 0.80 0.74 0.87 -5.32 .000* -19.9 Researcher type 15 0.81 0.76 0.86 -6.74 .000* -19.3 1.14 1 .285 Academic 10 0.78 0.71 0.85 -5.49 .000* -22.0 Public 5 0.83 0.76 0.91 -4.05 .000* -16.5 17-year-olds Publication mode 8 0.93 0.87 0.98 -2.50 .012* -7.4 0.91 1 .341 Monograph 4 0.94 0.88 1.02 -1.55 .122 -5.6 Peer review 4 0.89 0.80 0.99 -2.19 .029* -11.3 Researcher type 8 0.92 0.88 0.97 -3.26 .001* -7.6 4.20 1 .040* Academic 7 0.94 0.90 0.99 -2.28 .023* -5.8 Public 1 0.81 0.71 0.93 -3.10 .002* -18.6 18-year-olds Publication mode 8 1.00 0.98 1.02 -0.41 .678 -0.4 1.00 1 .317 Monograph 4 0.99 0.97 1.01 -0.58 .562 -0.6 Peer review 4 1.06 0.94 1.19 0.91 .360 +5.6 Researcher type 8 1.01 0.97 1.05 0.58 .561 +1.2 2.82 1 .093 Academic 7 1.03 0.98 1.07 1.12 .263 +2.5 Public 1 0.92 0.82 1.04 -1.38 .167 -8.1 19-year-olds Publication mode 8 1.01 0.98 1.04 0.51 .610 +0.7 1.52 1 .218 Monograph 4 0.99 0.96 1.03 -0.39 .699 -0.7 Peer review 4 1.03 0.98 1.08 1.28 .202 +2.9 Researcher type 8 1.01 0.97 1.04 0.33 .740 +0.5 0.26 1 .614 Academic 7 1.00 0.97 1.04 0.20 .845 +0.3 Public 1 1.04 0.91 1.18 0.57 .568 +3.9
Note. Effect estimates for 18 or older reflect both drivers licensed under GDL and others who never had GDL licenses. Ni = Number of independent effect sizes; effect sizes from the same study of the same GDL program were averaged to maintain independence. *p < .05.

36
5.5.2 Overall GDL Effect Sizes Stratified by Methodological Factors Table 16 shows the per capita overall GDL effect sizes stratified by the research design and type of comparison or control used to remove confounding. Neither of these factors was a reliable source of heterogeneity among the overall GDL effect sizes (p > .05), with the exception of research design for 17-year-olds (p < .05). Specifically, effect sizes based on pre-post research designs indicate that GDL programs are reliably associated with decreased crashes for 17-year-olds (p < .05), whereas those from time series designs suggest only a small or no reduction (p > .05).
Table 16. Overall GDL Effect Sizes Stratified by Methodological Factors
Age group Factor Level
Test of effect size Tests of strata heterogeneity 95% CI
Ni RRw Lower Upper z p ∆% QB df p
16-year-olds Research design 15 0.79 0.75 0.85 -7.25 .000* -20.6 2.36 1 .125 Pre-post 4 0.73 0.64 0.83 -4.96 .000* -27.0 Time series 11 0.82 0.76 0.88 -5.51 .000* -18.3 Comparison/control 15 0.80 0.75 0.86 -6.66 .000* -19.9 0.28 2 .870 Other age groups 9 0.80 0.72 0.89 -4.08 .000* -20.0 Other States 3 0.81 0.74 0.90 -4.09 .000* -18.6 Both 3 0.78 0.67 0.90 -3.36 .001* -22.4 17-year-olds Research design 8 0.93 0.89 0.97 -3.36 .001* -7.1 7.80 1 .005* Pre-post 2 0.82 0.74 0.90 -3.96 .000* -18.4 Time series 6 0.96 0.91 1.00 -1.85 .065 -4.4 Comparison/control 8 0.92 0.86 0.98 -2.57 .010* -8.2 0.06 1 .814 Other age groups 6 0.92 0.86 0.99 -2.22 .026* -7.9 Other States 0 Both 2 0.90 0.78 1.05 -1.31 .189 -9.7 18-year-olds Research design 8 1.01 0.97 1.05 0.53 .599 +1.1 2.72 1 .099 Pre-post 2 0.94 0.86 1.03 -1.25 .213 -5.8 Time series 6 1.03 0.98 1.08 1.20 .229 +2.9 Comparison/control 8 1.00 0.97 1.04 0.27 .788 +0.5 1.08 1 .299 Other age groups 6 1.00 0.96 1.04 -0.07 .941 -0.1 Other States 0 Both 2 1.06 0.95 1.19 1.07 .285 +6.3 19-year-olds Research design 8 1.01 0.97 1.04 0.33 .742 +0.6 0.10 1 .758 Pre-post 2 0.99 0.89 1.10 -0.19 .848 -1.1 Time series 6 1.01 0.97 1.04 0.41 .683 +0.7 Comparison/control 8 1.00 0.97 1.04 0.25 .804 +0.4 0.00 1 .977 Other age groups 6 1.00 0.97 1.04 0.24 .811 +0.5 Other States 0 Both 2 1.00 0.92 1.09 0.07 .942 +0.3
Note. Effect estimates for 18 or older reflect both drivers licensed under GDL and others who never had GDL licenses. Ni = Number of independent effect sizes; effect sizes from the same study of the same GDL program were averaged to maintain independence. *p < .05.

37
5.5.3 Overall GDL Effect Sizes Stratified by Follow-Up Time Table 17 shows the per capita overall GDL effect sizes stratified by the length of post-GDL follow-up time used in the source studies. Length of follow-up time was a reliable source of heterogeneity among the overall GDL effect sizes for 17- and 18-year-olds (p < .05), but not those for 16- or 19-year-olds (p > .05). However, it was not possible to interpret the meaning of the effect moderation for 17- and 18-year-olds because too few of the follow-up intervals included more than one effect size. In contrast, the crash reductions for 16-year-olds were strikingly homogeneous across the 6-year follow-up range.
Table 17. Overall GDL Effect Sizes Stratified by Follow-Up Time (years)
Age group Follow-up years
Test of effect size Tests of strata heterogeneity 95% CI
Ni RRw Lower Upper z p ∆% QB df p
16-year-olds 15 0.81 0.76 0.86 -7.09 .000* -19.1 0.97 5 .965 2 2 0.81 0.67 0.97 -2.28 .023* -19.3 3 3 0.83 0.71 0.97 -2.29 .022* -17.1 4 2 0.79 0.70 0.89 -3.96 .000* -20.9 5 3 0.78 0.66 0.92 -2.93 .003* -22.0 6+ 3 0.74 0.54 1.03 -1.76 .079 -25.6 Varies 2 0.83 0.75 0.92 -3.66 .000* -16.9 17-year-olds 8 0.96 0.94 0.99 -2.91 .004* -3.8 13.15 5 .022* 2 1 0.97 0.89 1.05 -0.84 .398 -3.4 3 1 0.98 0.92 1.05 -0.54 .588 -1.7 4 1 0.81 0.71 0.93 -3.10 .002* -18.6 5 3 0.81 0.69 0.94 -2.81 .005* -19.4 6+ 1 0.98 0.94 1.02 -0.84 .401 -1.8 Varies 1 0.96 0.91 1.01 -1.54 .124 -4.0 18-year-olds 8 1.02 0.99 1.04 1.17 .240 +1.5 11.72 5 .039* 2 1 0.98 0.88 1.10 -0.33 .742 -1.9 3 1 0.99 0.92 1.06 -0.33 .743 -1.2 4 3 1.03 0.91 1.17 0.48 .628 +3.2 5 1 0.98 0.84 1.14 -0.27 .789 -2.0 6+ 1 0.99 0.96 1.03 -0.39 .699 -0.7 Varies 1 1.11 1.05 1.17 3.53 .000* +10.6 19-year-olds 8 1.00 0.98 1.02 -0.11 .914 -0.1 8.87 5 .114 2 1 1.00 0.90 1.12 0.08 .934 +0.5 3 2 1.06 1.00 1.12 2.08 .038* +6.1 4 2 0.97 0.94 1.01 -1.51 .132 -2.7 5 1 0.93 0.80 1.08 -0.95 .344 -7.1 6+ 1 0.99 0.94 1.03 -0.61 .542 -1.4 Varies 1 1.03 0.97 1.08 1.01 .312 +2.8
Note. Effect estimates for 18 or older reflect both drivers licensed under GDL and others who never had GDL licenses. Ni = Number of independent effect sizes; effect sizes from the same study of the same GDL program were averaged to maintain independence. Varies = effect estimates were based on multiple State GDL programs so a single rating could not be coded. *p < .05.

38
5.5.4 Overall GDL Effect Sizes Stratified by Overall Study Quality and Validity The overall study quality ratings were based on the extent to which each study adequately addressed the most serious threats to construct, internal, statistical, and external validity. Although the ratings ranged from Low to High, only studies deemed to be of Moderate, Good, or High quality were used in the meta-analysis. The overall study validity rating was a subjective judgment of each study’s validity and freedom of ambiguity compared to a perfect randomized design. Again, although the ratings assigned to studies considered for inclusion ranged from < 50% to ≥ 90%, only studies with ratings of 50 percent or higher were incidentally included in the meta-analysis. Table 18 shows the per capita overall GDL effect sizes stratified by the overall quality and validity of the source studies. Neither overall study quality nor study validity was found to be reliable sources of heterogeneity among the overall GDL effect sizes for 16-, 18-, or 19-year-olds (p > .05). However, both of these factors were found to moderate the effect sizes for 17-year-olds (p < .05). Specifically, only studies of moderate quality or 60-74 percent comparability to the validity of a randomized design were found to be reliably associated with a reduction in 17-year-old per capita crashes (p < .05).

39
Table 18. Overall GDL Effect Sizes Stratified by Study Quality and Validity
Age group Factor Level
Test of effect size Tests of strata heterogeneity 95% CI
Ni RRw Lower Upper z p ∆% QB df p
16-year-olds Overall quality 15 0.82 0.78 0.87 -7.17 .000* -17.5 3.37 2 .186 Moderate 5 0.77 0.68 0.88 -3.96 .000* -23.0 Good 2 0.66 0.47 0.92 -2.48 .013* -34.0 High 8 0.84 0.79 0.89 -5.74 .000* -15.7 Overall validity 15 0.81 0.76 0.86 -6.81 .000* -19.3 3.80 3 .284 50-59% 1 0.79 0.70 0.89 -3.81 .000* -21.0 60-74% 4 0.76 0.62 0.92 -2.75 .006* -24.3 75-89% 9 0.80 0.73 0.87 -5.29 .000* -20.3 ≥90% 1 0.96 0.79 1.16 -0.40 .687 -3.9 17-year-olds Overall quality 8 0.96 0.94 0.99 -2.94 .003* -3.8 12.44 2 .002* Moderate 2 0.82 0.74 0.90 -3.96 .000* -18.4 Good 2 0.81 0.60 1.09 -1.38 .167 -18.8 High 4 0.97 0.95 1.00 -1.87 .062 -2.5 Overall validity 8 0.93 0.89 0.97 -3.36 .001* -7.1 7.80 1 .005* 50-59% 0 60-74% 2 0.82 0.74 0.90 -3.96 .000* -18.4 75-89% 6 0.96 0.91 1.00 -1.85 .065 -4.4 ≥90% 0 18-year-olds Overall quality 8 1.00 0.95 1.05 0.06 .948 +0.2 2.70 2 .260 Moderate 2 0.94 0.86 1.03 -1.25 .213 -5.8 Good 2 1.10 0.89 1.37 0.86 .390 +10.0 High 4 1.02 0.96 1.08 0.64 .522 +2.0 Overall validity 8 1.01 0.97 1.05 0.53 .599 +1.1 2.72 1 .099 50-59% 0 60-74% 2 0.94 0.86 1.03 -1.25 .213 -5.8 75-89% 6 1.03 0.98 1.08 1.20 .229 +2.9 ≥90% 0 19-year-olds Overall quality 8 1.01 0.98 1.04 0.87 .386 +1.2 0.18 2 .912 Moderate 2 0.99 0.89 1.10 -0.19 .848 -1.1 Good 2 1.02 0.90 1.15 0.25 .803 +1.5 High 4 1.01 0.98 1.04 0.91 .361 +1.4 Overall validity 8 1.01 0.97 1.04 0.33 .742 +0.6 0.10 1 .758 50-59% 0 60-74% 2 0.99 0.89 1.10 -0.19 .848 -1.1 75-89% 6 1.01 0.97 1.04 0.41 .683 +0.7 ≥90% 0
Note. Effect estimates for 18 or older reflect both drivers licensed under GDL and others who never had GDL licenses. Ni = Number of independent effect sizes; effect sizes from the same study of the same GDL program were averaged to maintain independence. *p < .05.
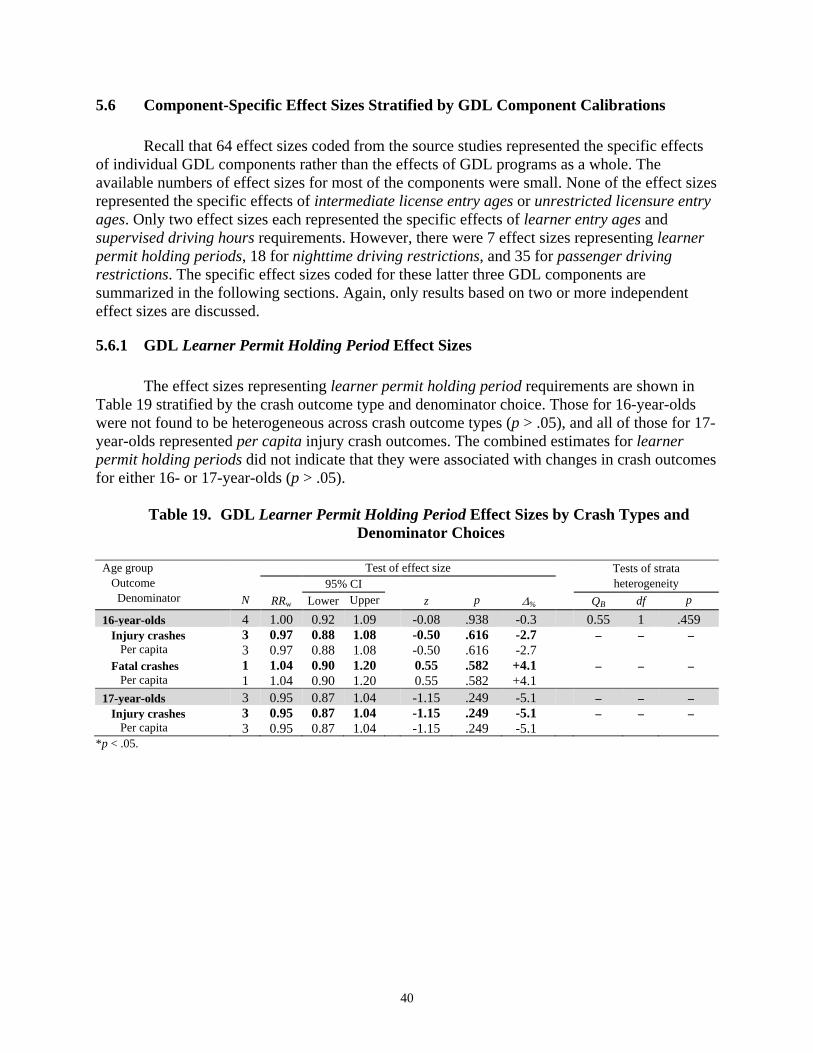
40
5.6 Component-Specific Effect Sizes Stratified by GDL Component Calibrations
Recall that 64 effect sizes coded from the source studies represented the specific effects of individual GDL components rather than the effects of GDL programs as a whole. The available numbers of effect sizes for most of the components were small. None of the effect sizes represented the specific effects of intermediate license entry ages or unrestricted licensure entry ages. Only two effect sizes each represented the specific effects of learner entry ages and supervised driving hours requirements. However, there were 7 effect sizes representing learner permit holding periods, 18 for nighttime driving restrictions, and 35 for passenger driving restrictions. The specific effect sizes coded for these latter three GDL components are summarized in the following sections. Again, only results based on two or more independent effect sizes are discussed.
5.6.1 GDL Learner Permit Holding Period Effect Sizes The effect sizes representing learner permit holding period requirements are shown in Table 19 stratified by the crash outcome type and denominator choice. Those for 16-year-olds were not found to be heterogeneous across crash outcome types (p > .05), and all of those for 17-year-olds represented per capita injury crash outcomes. The combined estimates for learner permit holding periods did not indicate that they were associated with changes in crash outcomes for either 16- or 17-year-olds (p > .05).
Table 19. GDL Learner Permit Holding Period Effect Sizes by Crash Types and Denominator Choices
Age group Outcome Denominator
Test of effect size Tests of strata heterogeneity 95% CI
N RRw Lower Upper z p ∆% QB df p
16-year-olds 4 1.00 0.92 1.09 -0.08 .938 -0.3 0.55 1 .459 Injury crashes 3 0.97 0.88 1.08 -0.50 .616 -2.7 – – – Per capita 3 0.97 0.88 1.08 -0.50 .616 -2.7 Fatal crashes 1 1.04 0.90 1.20 0.55 .582 +4.1 – – – Per capita 1 1.04 0.90 1.20 0.55 .582 +4.1 17-year-olds 3 0.95 0.87 1.04 -1.15 .249 -5.1 – – – Injury crashes 3 0.95 0.87 1.04 -1.15 .249 -5.1 – – – Per capita 3 0.95 0.87 1.04 -1.15 .249 -5.1
*p < .05.

41
The learner permit holding period effect sizes were next stratified as a function of the specific holding period calibration that they represented, as is shown in Table 20. The specific calibration of the learner permit holding periods was not found to be a source of heterogeneity among the effect sizes for either 16- or 17-year-olds (p > .05). None of the learner permit holding period calibrations were reliably associated with a change in crashes for either of the age groups (p > .05).
Table 20. GDL Learner Permit Holding Period Effect Sizes Stratified by Calibration
Age group Component calibration
Test of effect size Tests of strata heterogeneity 95% CI
N RRw Lower Upper z p ∆% QB df p
16-year-olds 4 1.00 0.92 1.09 -0.08 .938 -0.3 0.98 2 .611 3 mo. 1 0.93 0.80 1.10 -0.83 .408 -6.6 ≥ 3 mo. 1 1.04 0.90 1.20 0.55 .582 +4.1 6 mo. 2 1.00 0.87 1.16 0.06 .955 +0.4 17-year-olds 3 0.96 0.88 1.04 -1.00 .315 -4.3 0.15 1 .701 3 mo. 1 0.97 0.87 1.07 -0.65 .518 -3.3 ≥ 3 mo. 0 6 mo. 2 0.93 0.79 1.10 -0.86 .390 -6.9
*p < .05.
5.6.2 GDL Nighttime Driving Restriction Effect Sizes The specific effect sizes representing nighttime driving restrictions on crashes during the restricted nighttime hours are shown in Table 21 stratified by the crash outcome type and denominator choice. Nighttime driving restrictions in general were found to be associated with reductions combined across nighttime crash outcome types of 9 percent for 15- to 17-year-olds (RRw = 0.91 [95% CI = 0.84-0.97]) and 9 percent for 18-year-olds (RRw = 0.91 [95% CI = 0.87-0.96]). They were not associated with a change in the combined nighttime crash outcomes of 17-year-olds (p > .05). The effect sizes for 16-year-olds were found to be heterogeneous across nighttime crash outcomes (total versus fatal crashes), indicating that is was not appropriate to combine effects across outcome types for this age group (p < .05). The outcome-specific effects sizes for 16-year-olds indicate that nighttime restrictions in general were associated with a 31 percent reduction in total nighttime crashes (RRw = 0.69 [95% CI = 0.64-0.74]), but no change in nighttime fatal crashes (RRw = 1.02 [95% CI = 0.91-1.15]). Crash outcome types and denominator choices were not found to be reliable sources of heterogeneity for any of the other age groups (p > .05).

42
Table 21. GDL Nighttime Driving Restriction Effect Sizes by Crash Types and Denominator Choices
Age group Outcome Denominator
Test of effect size Tests of strata heterogeneity 95% CI
N RRw Lower Upper z p ∆% QB df p
15- to 17-year-olds 2 0.91 0.84 0.97 -2.72 .007* -9.4 0.00 1 .965 Total crashes 1 0.91 0.82 1.00 -1.99 .047* -9.3 – – – Proportional 1 0.91 0.82 1.00 -1.99 .047* -9.3 Injury crashes 1 0.90 0.81 1.01 -1.85 .064 -9.6 – – – Proportional 1 0.90 0.81 1.01 -1.85 .064 -9.6 16-year-olds 7 0.77 0.73 0.83 -7.71 .000* -22.5 30.39 2 .000* Total crashes 3 0.69 0.64 0.74 -9.44 .000* -31.1 – – – Proportional 3 0.69 0.64 0.74 -9.44 .000* -31.1 Fatal crashes 4 1.02 0.91 1.15 0.39 .698 +2.4 0.63 1 .428 Per capita 2 1.03 0.91 1.16 0.44 .659 +2.7 Proportional 2 0.51 0.09 2.90 -0.76 .445 -49.3 16-17-year-olds 1 0.90 0.82 1.00 -1.99 .047* -9.6 – – – Injury crashes 1 0.90 0.82 1.00 -1.99 .047* -9.6 – – – Proportional 1 0.90 0.82 1.00 -1.99 .047* -9.6 17-year-olds 4 0.88 0.71 1.09 -1.18 .239 -12.1 1.27 2 .531 Total crashes 2 0.82 0.61 1.10 -1.33 .184 -18.4 – – – Proportional 2 0.82 0.61 1.10 -1.33 .184 -18.4 Fatal crashes 2 0.95 0.70 1.30 -0.32 .748 -4.9 0.79 1 .375 Per capita 1 1.02 0.72 1.44 0.11 .911 +2.0 Proportional 1 0.72 0.36 1.43 -0.94 .349 -28.0 18-year-olds 3 0.91 0.87 0.96 -3.29 .001* -8.6 1.55 2 .461 Total crashes 1 0.92 0.87 0.97 -2.99 .003* -8.0 – – – Proportional 1 0.92 0.87 0.97 -2.99 .003* -8.0 Fatal crashes 2 0.78 0.60 1.02 -1.82 .068 -21.7 0.17 1 .683 Per capita 1 0.81 0.60 1.10 -1.34 .179 -19.0 Proportional 1 0.72 0.43 1.18 -1.30 .194 -28.4 19-year-olds 1 1.10 0.89 1.36 0.87 .386 +10.0 – – – Fatal crashes 1 1.10 0.89 1.36 0.87 .386 +10.0 – – – Per capita 1 1.10 0.89 1.36 0.87 .386 +10.0
Note. Effect estimates for 18 or older reflect both drivers licensed under GDL and others who never had GDL licenses. Effect sizes represent changes in crashes occurring during restricted hours. *p < .05.

43
The nighttime driving restriction effect sizes were next stratified by the start time of the restrictions, as is shown in Table 22. Note that effect sizes for 16-year-olds are presented separately for total and fatal nighttime crashes because outcome type was found to be a reliable source of heterogeneity for this age group. For the other age groups the various nighttime crash outcomes were combined into composite estimates across crash outcome types. Single mean effect sizes were used when a study contributed more than one effect size for a particular calibration to maintain independence.
Table 22. GDL Nighttime Driving Restriction Effect Sizes Stratified by Calibration
Age group Component calibration
Test of effect size Tests of strata heterogeneity 95% CI
Ni RRw Lower Upper z p ∆% QB df p 15- to 17-year-olds 1 0.91 0.82 1.00 -1.91 .056 -9.4 – – – 9 p.m. 0 12 a.m. 1 0.91 0.82 1.00 -1.91 .056 -9.4 1 a.m. 0 Any 0 16-year-olds 7 – – – – – – – – – Total crashes 3 0.68 0.65 0.71 -18.77 .000* -32.1 0.65 1 .420 9 p.m. 1 0.68 0.65 0.71 -18.75 .000* -32.3 12 a.m. 2 0.79 0.54 1.16 -1.19 .235 -20.7 1 a.m. 0 Any 0 Fatal crashes 4 1.02 0.89 1.17 0.25 .803 +1.8 0.60 2 .742 9 p.m. 0 12 a.m. 2 0.52 0.09 2.93 -0.75 .455 -48.4 1 a.m. 1 1.04 0.61 1.78 0.14 .888 +3.9 Any 1 1.02 0.88 1.18 0.28 .776 +2.1 16-17-year-olds 1 0.90 0.82 1.00 -1.99 .047* -9.6 – – – 9 p.m. 0 12 a.m. 1 0.90 0.82 1.00 -1.99 .047* -9.6 1 a.m. 0 Any 0 17-year-olds 3 0.95 0.91 0.99 -2.18 .029* -5.1 0.15 1 .703 9 p.m. 1 0.95 0.91 1.00 -2.11 .035* -5.0 12 a.m. 2 0.89 0.63 1.25 -0.67 .500 -11.2 1 a.m. 0 Any 0 18-year-olds 2 0.81 0.64 1.02 -1.76 .078 -18.9 – – – 9 p.m. 0 12 a.m. 2 0.81 0.64 1.02 -1.76 .078 -18.9 1 a.m. 0 Any 0 19-year-olds 1 1.10 0.89 1.36 0.87 .386 +10.0 – – – 9 p.m. 0 12 a.m. 1 1.10 0.89 1.36 0.87 .386 +10.0 1 a.m. 0 Any 0
Note. Effect estimates for 18 or older reflect both drivers licensed under GDL and others who never had GDL licenses. Ni = Number of independent effect sizes; effect sizes from the same study of the same GDL program were averaged to maintain independence. Effect sizes represent changes in crashes occurring during restricted hours. *p < .05.

44
The start time of the nighttime driving restrictions was not found to be a reliable moderator of the effects sizes for any age group (p > .05). Interestingly, when only independent effect sizes were considered and the effect sizes were stratified by start time, nighttime restrictions in general were found to be associated with about a 5 percent reduction in 17-year-old nighttime crash rates (p < .05). Among the age groups with two or more effect sizes for a particular start time very little can be interpreted because of small sample sizes. At best it can be stated that for 16-, 17-, and 18-year-olds, nighttime restrictions with 12 a.m. start times were not reliably associated with reduced nighttime crashes (p > .05).
5.6.3 GDL Passenger Driving Restriction Effect Sizes The specific effect sizes representing passenger driving restrictions on crashes prohibited under the passenger restrictions are shown in Table 23 stratified by the crash outcome type and denominator choice. Passenger driving restrictions in general were found to be associated with reductions combined across all passenger crash outcome types of 9 percent for 15- to 17-year-olds (RRw = 0.91 [95% CI = 0.86-0.98]) and 6 percent for 18-year-olds (RRw = 0.94 [95% CI = 0.92-0.96]). The effect sizes for 16-, 17-, and 19-year-olds were found to be heterogeneous across crash outcomes, meaning that is was not appropriate to combine effects across outcome types for these age groups (p < .05). For 16-year-olds, the effects sizes for total crash outcomes also varied as a function of the denominator. Specifically, the estimate based on proportional incidence (restricted passenger crashes divided by total crashes) was quite different from those based on per capita and per licensed driver denominators. The total effect estimate based on proportional incidence was therefore not combined with the others. The total passenger crash outcome estimate based on combined per capita and per licensed driver effect sizes (not shown in the table) suggested that passenger restrictions in general were associated with a 6 percent reduction in 16-year-old total passenger crashes (RRw = 0.94 [95% CI = 0.90-0.97]). As far as the other 16-year-old crash outcomes were concerned, passenger restrictions in general were not associated with a reliable change in injury passenger crashes (RRw = 0.96 [95% CI = 079-1.15]), but a 16 percent reduction in fatal passenger crashes (RRw = 0.84 [95% CI = 0.75-0.95]). The total passenger crash effect sizes for 17-year-olds also differed across denominator choices, with that based on proportional incidence again being the outlying effect size (p < .05). Excluding this effect (not shown in table), passenger restrictions were associated with a 5 percent reduction in total passenger crashes for 17-year-olds (RRw = 0.95 [95% CI = 0.92-0.98]). However, passenger restrictions overall were not reliably associated with a change in 17-year-old injury (RRw = 0.98 [95% CI = 0.93-1.04]) or fatal passenger crash outcomes (RRw = 0.93 [95% CI = 0.84-1.02]). The heterogeneity for 19-year-olds was based on the difference between total and fatal crash outcomes—the effect for total passenger outcomes suggested that passenger restrictions were associated with fewer total passenger crashes, but that for fatal passenger crashes suggested no effect—but the total effect was based on only a single effect size.
45
The passenger driving restriction effect sizes were next stratified by their specific calibrations (numbers of allowed passengers and length), as is shown in Table 24. Note that those for 16-, 17-, and 19-year-olds are presented separately by passenger outcome type because outcome type was found to be a reliable source of heterogeneity for these age groups. Also, the total passenger effect sizes based on proportional incidence were excluded for 16- and 17-year-olds due to heterogeneity. Mean effect sizes were used when a study contributed more than one effect size for a particular calibration to maintain independence. The specific calibration of the passenger driving restriction was not found to be a reliable moderator of the effects sizes for any age group (p > .05). Among the calibrations with two or more independent effect sizes, passenger restrictions allowing no more than one teen passenger that lasts for 6 months or longer were not reliably associated with a change in injury passenger crash rates (p > .05), but were reliably associated with a 20 percent reduction in fatal passenger crashes for 16-year-olds (p < .05). The results also suggested, though they did not quite reach the conventional level of statistical reliability, that passenger restrictions allowing no more than one passenger for a period of 6 months or longer were associated with an 11 percent reduction in 17-year-old fatal passenger crashes (p = .06), though there was no reliable change in their injury passenger crash rates associated with this calibration (p > .05). Restrictions allowing one teen passenger were also associated with a 6 percent decrease in passenger crashes for 18-year-olds (p < .05). Interestingly, restrictions disallowing any passengers for 6 months or longer were not reliably associated with changes in fatal or injury passenger crash rates for 16-year-olds, passenger crash rates for 18-year-olds, or fatal passenger crash rates for 19-year-olds (p > .05).

46
Table 23. GDL Passenger Driving Restriction Effect Sizes by Crash Types and Denominator Choices
Age group Outcome Denominator
Test of effect size Tests of strata heterogeneity 95% CI
N RRw Lower Upper z p ∆% QB df p 15- to 17-year-olds 2 0.91 0.86 0.98 -2.70 .007* -8.6 1.04 1 .308 Total crashes 1 0.93 0.86 1.00 -1.84 .066 -6.8 – – – Proportional 1 0.93 0.86 1.00 -1.84 .066 -6.8 Injury crashes 1 0.86 0.75 0.98 -2.22 .026* -13.9 – – – Proportional 1 0.86 0.75 0.98 -2.22 .026* -13.9 16-year-olds 13 0.85 0.82 0.87 -10.95 .000* -15.1 93.73 6 .000* Total crashes 3 0.85 0.82 0.87 -10.62 .000* -15.4 91.72 2 .000* Per capita 1 0.94 0.90 0.99 -2.42 .015* -5.9 Per licensed driver 1 0.94 0.88 0.99 -2.27 .023* -6.5 Proportional 1 0.68 0.64 0.72 -13.91 .000* -32.0 Injury crashes 6 0.96 0.79 1.15 -0.48 .630 -4.5 0.03 1 .856 Per capita 3 0.96 0.78 1.19 -0.33 .739 -3.6 Proportional 3 0.93 0.63 1.36 -0.39 .696 -7.4 Fatal crashes 4 0.84 0.75 0.95 -2.91 .004 -15.6 0.39 1 .534 Per capita 2 0.84 0.74 0.94 -2.97 .003* -16.5 Proportional 2 0.95 0.64 1.40 -0.26 .795 -5.0 16-17-year-olds 1 0.86 0.75 0.98 -2.22 .027* -14.1 – – – Injury crashes 1 0.86 0.75 0.98 -2.22 .027* -14.1 – – – Proportional 1 0.86 0.75 0.98 -2.22 .027* -14.1 17-year-olds 10 0.94 0.92 0.96 -5.34 .000* -6.1 15.48 5 .008* Total crashes 3 0.93 0.91 0.95 -5.39 .000* -7.0 12.26 2 .002* Per capita 1 0.96 0.92 1.01 -1.69 .091 -3.9 Per licensed driver 1 0.95 0.91 0.98 -2.81 .005* -5.4 Proportional 1 0.85 0.80 0.90 -5.53 .000* -15.1 Injury crashes 3 0.98 0.93 1.04 -0.57 .568 -1.6 – – – Per capita 3 0.98 0.93 1.04 -0.57 .568 -1.6 Fatal crashes 4 0.93 0.84 1.02 -1.49 .135 -7.1 0.09 1 .765 Per capita 2 0.92 0.83 1.03 -1.49 .135 -7.7 Proportional 2 0.96 0.75 1.24 -0.30 .763 -3.8 18-year-olds 5 0.94 0.92 0.96 -5.98 .000* -6.3 1.06 2 .588 Total crashes 1 0.94 0.92 0.96 -6.03 .000* -6.5 – – – Per capita 1 0.94 0.92 0.96 -6.03 .000* -6.5 Fatal crashes 4 0.98 0.89 1.08 -0.43 .667 -2.2 0.32 1 .573 Per capita 2 1.00 0.89 1.12 -0.08 .937 -0.5 Proportional 2 0.93 0.77 1.13 -0.70 .481 -6.7 19-year-olds 4 0.94 0.92 0.96 -5.90 .000* -6.1 8.82 2 .012* Total crashes 1 0.93 0.91 0.95 -6.52 .000* -7.1 – – – Per capita 1 0.93 0.91 0.95 -6.52 .000* -7.1 Fatal crashes 3 1.03 0.96 1.09 0.78 .438 +2.5 0.49 1 .486 Per capita 2 1.02 0.95 1.09 0.57 .570 +1.9 Proportional 1 1.12 0.87 1.42 0.87 .382 +11.5
Note. Effect estimates for 18 or older reflect both drivers licensed under GDL and others who never had GDL licenses. Effect sizes represent changes in crashes prohibited by the passenger restrictions. *p < .05.

47
Table 24. GDL Passenger Driving Restriction Effect Sizes Stratified by Calibration
Age group Component calibration
Test of effect size Tests of strata heterogeneity 95% CI
Ni RRw Lower Upper z p ∆% QB df p
15- to 17-year-olds 1 0.90 0.80 1.00 -2.01 .044* -10.4 – – – 3 pass, ≥ 6 mo. 0 1 pass, ≥ 6 mo. 0 0 pass, ≥ 6 mo. 1 0.90 0.80 1.00 -2.01 .044* -10.4 16-year-olds 11 – – – – – – – – – Total crashes 1 0.94 0.89 0.99 -2.33 .020* -6.2 – – – 3 pass, ≥ 6 mo. 0 1 pass, ≥ 6 mo. 1 0.94 0.89 0.99 -2.33 .020* -6.2 0 pass, ≥ 6 mo. 0 Injury crashes 6 0.97 0.86 1.10 -0.41 .680 -2.5 1.54 2 .462 3 pass, ≥ 6 mo. 1 0.98 0.85 1.14 -0.25 .804 -1.8 1 pass, ≥ 6 mo. 3 1.05 0.81 1.36 0.35 .729 +4.7 0 pass, ≥ 6 mo. 2 0.77 0.51 1.16 -1.24 .216 -22.8 Fatal crashes 4 0.83 0.76 0.91 -4.03 .000* -16.7 1.59 1 .207 3 pass, ≥ 6 mo. 0 1 pass, ≥ 6 mo. 2 0.80 0.72 0.89 -4.07 .000* -19.7 0 pass, ≥ 6 mo. 2 0.91 0.77 1.07 -1.11 .265 -8.9 16-17-year-olds 1 0.86 0.75 0.98 -2.22 .027* -14.1 – – – 3 pass, ≥ 6 mo. 0 1 pass, ≥ 6 mo. 0 0 pass, ≥ 6 mo. 1 0.86 0.75 0.98 -2.22 .027* -14.1 17-year-olds 8 – – – – – – – – – Total crashes 1 0.95 0.91 1.00 -2.19 .028* -4.6 – – – 3 pass, ≥ 6 mo. 0 1 pass, ≥ 6 mo. 1 0.95 0.91 1.00 -2.19 .028* -4.6 0 pass, ≥ 6 mo. 0 Injury crashes 3 0.99 0.94 1.03 -0.66 .507 -1.5 2.08 1 .149 3 pass, ≥ 6 mo. 1 1.02 0.96 1.08 0.56 .577 +1.8 1 pass, ≥ 6 mo. 2 0.95 0.90 1.02 -1.49 .137 -4.6 0 pass, ≥ 6 mo. 0 Fatal crashes 4 0.93 0.85 1.01 -1.70 .089 -7.3 0.94 1 .333 3 pass, ≥ 6 mo. 0 1 pass, ≥ 6 mo. 2 0.89 0.79 1.00 -1.90 .057 -11.0 0 pass, ≥ 6 mo. 2 0.97 0.85 1.10 -0.46 .645 -3.0 18-year-olds 5 0.94 0.92 0.96 -5.98 .000* -6.3 0.72 1 .396 3 pass, ≥ 6 mo. 0 1 pass, ≥ 6 mo. 3 0.94 0.92 0.96 -6.04 .000* -6.4 0 pass, ≥ 6 mo. 2 0.99 0.87 1.12 -0.16 .872 -1.0 19-year-olds 4 – – – – – – – – – Total crashes 1 0.93 0.91 0.95 -6.52 .000* -7.1 – – – 3 pass, ≥ 6 mo. 0 1 pass, ≥ 6 mo. 1 0.93 0.91 0.95 -6.52 .000* -7.1 0 pass, ≥ 6 mo. 0 Fatal crashes 3 1.03 0.96 1.09 0.78 .438 +2.5 0.01 1 .903 3 pass, ≥ 6 mo. 0 1 pass, ≥ 6 mo. 1 1.03 0.94 1.13 0.60 .548 +3.0 0 pass, ≥ 6 mo. 2 1.02 0.94 1.11 0.51 .613 +2.2
Note. Effect estimates for 18 or older reflect both drivers licensed under GDL and others who never had GDL licenses. Ni = Number of independent effect sizes; effect sizes from the same study of the same GDL program were averaged to maintain independence. Total crash effects based on proportional incidence were excluded for 16- and 17-year-olds due to heterogeneity. Effect sizes represent changes in crashes prohibited by the passenger restrictions. *p < .05.

48
6. SUMMARY AND DISCUSSION
6.1 Study Findings Regarding Effects of GDL Programs Overall GDL programs as a whole were associated with statistically reliable reductions in traffic crash outcomes of 16 percent for 16-year-olds and 11 percent for 17-year-olds, but were not reliably associated with changes in crash outcomes for 18- or 19-year-olds. The crash reductions for 16- and 17-year-olds were larger for effect sizes based on per capita rates, which would capture effects associated with delayed licensing in addition to other exposure-reducing factors of GDL programs, than those based on per licensed driver rates, which underestimate changes in crashes that result from reduced licensure (McKnight, Peck, & Foss, 2002). In fact, GDL programs were not reliably associated with reductions in per licensed driver crash rates for either of these age groups. This suggests that factors such as reductions in the percentages of teens licensed in these younger age groups, along with factors that reduce the lengths of time they are allowed to drive independently while these ages (e.g., extended learner permit holding periods), are very important factors driving the crash reductions associated with GDL programs. Although GDL programs were not found to be reliably associated with increases in crash outcomes for older teens as has been suggested by some studies (e.g., Masten, Foss, & Marshall, 2011), the numbers of effect sizes analyzed for these age groups were small, so this controversy should not be considered resolved. While the effect sizes for 16-year-olds were invariant with regard to various publication and methodological factors and overall study quality/validity, this was not the case for 17-year-old effect estimates. Specifically, effect sizes based on time series designs, which are some of the strongest quasi-experimental designs (Campbell & Stanley, 1963), suggest that GDL programs overall are associated with smaller 17-year-old crash reductions than those based on weaker pre-post designs. This finding was mirrored with regard to ratings of overall study quality and validity, with only the effect sizes based on lower quality studies or those with lower ratings of validity suggesting that GDL programs were associated with reductions in crashes for 17-year-olds. It is worth noting that the quality and validity of the included studies was restricted in the meta-analysis by only including those of moderate or higher quality, so it is unknown how effect sizes for either age group would differ in studies with even less rigor. The IIHS ratings of GDL program strength were not found to be a reliable moderator of the effect sizes for 16- or 17-year-olds. That being said, the effect sizes in the present study did not reflect the full range of potential IIHS ratings (i.e., no effect sizes for poor studies were included), which would tend to attenuate any relationship between the IIHS ratings and crash reductions. The teen licensing system classification used by Masten, Foss, and Marshall (2011) was found to be a reliable moderator of effect sizes for 16-year-olds, but not 17-year-olds. However, stronger GDL programs with two restrictions during the intermediate licensing phase (i.e., both a nighttime and passenger restriction) were associated with smaller reductions in 16-year-old crashes than those with only one of these restrictions. Effect estimates representing the full range of the teen licensing system classifications used under this method were not present in the analysis, which would again tend to attenuate any relationship of the classification method to crash reductions. Even though the results did not provide much support for either of these

49
methods of classifying GDL programs, they may still have merit when the complete ranges of ratings and classifications are considered.
6.2 Study Findings Regarding Specific Effects of GDL Components One of the primary goals of this meta-analysis was to provide empirical support for
including particular components in GDL programs and provide guidance about what calibrations of the various components appear to be associated with the largest crash reductions. Unfortunately the numbers of effect sizes representing the unique effects of individual GDL components and calibrations were small for most of the components, particularly when stratified by the ranges of possible calibrations for those components. Large enough numbers of effect sizes representing the unique components effects were not available for all of the age-based GDL components and supervised driving hours requirements. The numbers of available component-specific effect sizes only allowed tentative conclusions to be made with regard to learner permit holding periods and nighttime restrictions, as they were not reflective of the full range of calibrations for these components. In general, learner permit holding periods, as represented by the calibrations for which effect sizes were available, were not associated with reductions in crashes for 16- or 17-year-olds. Nighttime driving restrictions in general were associated with a reduction in at least some types of nighttime crashes for both 16- and 17-year-olds. However, besides suggesting that starting nighttime restrictions at 12 a.m. is not the most ideal time, based on the analyses, little else could be stated about specific calibrations of nighttime restrictions. The numbers of available component-specific effect sizes were the largest for passenger restrictions. Passenger restrictions in general were found to be associated with reductions in some types of passenger-related crashes for both 16- and 17-year-olds. While the evidence was not particularly clear, the results suggest that passenger restrictions allowing no more than one teen passenger that lasts for 6 months or longer may be superior to those that disallow any teen passengers. Given the limited conclusions that could be drawn based on the analyses of component-specific effect sizes because of the small numbers of effect sizes available and the limited range of possible calibrations that they represented, one additional set of analyses was undertaken in an attempt to provide additional guidance regarding the specific GDL components calibrations that were associated with the largest crash reductions. In these analyses a subset of the effect sizes representing the overall impact of GDL programs were stratified, one at a time, as a function of the calibrations of the components present in the GDL programs those effect sizes reflected. While these analyses have the potential to provide some useful information about component calibrations that, when present as part of the larger GDL program, are reliably associated with reductions in crashes, these analyses are inherently confounded by the fact that the calibrations of other GDL components also vary and could account for any observed differences in effect sizes. Hence, they should at best be viewed as supporting specific component calibrations only when they complement the findings from the analyses of the component-specific effect sizes, or when other factors suggest a causal relationship such as an apparent dose-response effect. To summarize these findings, there was no evidence supporting specific component calibrations for most of the GDL components. One exception was learner permit holding periods for which there was an apparent dose-response relationship supporting longer holding periods, particularly those lasting 12 months, which was reliably associated with crash reductions for both 16- and 17-year-

50
olds. While the passenger restriction results somewhat collaborated the findings from the component-specific analyses suggesting that restrictions allowing no more than 1 teen passenger are associated with larger reductions than those disallowing any teen passengers, the results were also supportive of not having a passenger restriction. While there was apparent variation in nighttime restriction effect sizes for both age groups as a function of the start time of the restriction, the results were unclear due to small numbers of effects. There was also no evidence supporting specific ages for any of the three age-based GDL components. With regard to numbers of supervised driving hours and requirements to keep crash- and conviction-free records to advance through GDL stages, there was no evidence that having these components was at all beneficial.
6.3 Limitations A tremendous amount of effort was taken in this study to include only the most rigorous evaluations of GDL programs that removed as many potential sources of confounding from the effect estimates as possible, given the limitations of the quasi-experimental designs. Arguably, the requirements for inclusion were too high resulting in the exclusion of important studies. Given that only 14 of the 49 studies (28%) deemed to be relevant were eventually included in the meta-analysis, such criticism would not be without merit. The exclusion of specific studies should not be interpreted negatively; rather that the excluded studies did not meet the specific criteria delineated for these factors, which in our opinion, were deemed to be important for producing the least biased and most valid estimates of GDL program and component effects.
Although the original intention was to include in the meta-analysis only studies rated as being of “High” or “Good” quality, those rated as being of “Moderate” quality were also reluctantly included because the number of better quality studies was low. The studies coded as “Moderate” all used the adults-as-counterfactual approach, but the adequacy of this method for actually removing confounding due to trends and other historical factors was not well supported in the manuscripts. Comparisons of effect sizes as a function of study quality ratings was investigated as part of the moderator variable analyses to determine whether the inclusion of “Moderate” quality studies impacted the overall meta-analysis results, and was indeed found to be an important factor with regard to estimates of GDL effects for 17-year-olds. However, excluding the studies coded as “Moderate” would have severely reduced the numbers of available effect sizes for analysis and negatively impacted the extent to which the findings could be generalized to other jurisdictions. The age-specific effect sizes are based on cross-sectional comparisons of drivers involved in crashes of a particular age rather than on longitudinally following a single group of teens licensed under GDL as they grew older. This is important because it means that effect sizes for 18, 19, and 20 year olds reflect the driving of a mixed population consisting of some persons who were actually licensed under the GDL programs as well as persons who were licensed at ages that were not subject to the GDL programs (18 or older in most States). It is therefore not possible to disentangle from the effect sizes of these older age groups the relative contributions of persons being licensed under the GDL programs versus effects due to younger teens delaying licensure until an age when the GDL programs do not apply. In addition, the effect sizes for all age groups include crash contributions of drivers who were completely unlicensed, as crashes
51
were typically categorized in the contributing studies based on the age of the driver, regardless of whether they were licensed to operate motor vehicles. It is possible that implementing GDL programs changed the percentages of teens who delay licensure or who choose to drive unlicensed.
6.4 Conclusions
This meta-analysis supports a conclusion that GDL laws create a safety benefit for 16-year-old drivers and potentially have a safety benefit for 17-year-old drivers, although to a lesser extent. Given the diversity in the configuration of GDL provisions among the States, an additional interest relates to which of the various provisions contributed to the observed effect. Insufficient studies with suitable information available existed to answer this question. Further, an authoritative study of individual GDL provisions might not even be possible given the practical limitations associated with researching this topic in a real world setting. For example, the mere existence of a curfew provision does not mean it was truly operationalized unless it can be shown the affected population was aware of it, adhered to it, and the police actually enforced it at a meaningful level. Few studies quantified these important process factors. Although the exact effectiveness of individual GDL provisions could not be determined, the meta-analysis uncovered no indication that any provision was necessarily counterproductive for the GDL target audience of 16- and 17-year olds. Thus, a reasonable strategy for any State considering passage of a GDL law might involve enumerating the full range of provisions applicable to that State, determining which could be reasonably operationalized given available resources and support from key agencies and organizations, and adopting as comprehensive an approach as possible.
52
7. REFERENCES Baker, S. P., Chen, L. H., & Li, G. (2007). Nationwide review of graduated driver licensing.
Washington, DC: Automobile Association of America Foundation for Traffic Safety. Borenstein, M., Hedges, L. V., Higgins, J. P. T., & Rothstein, H. R. (2009). Introduction to meta-
analysis. Chichester, UK: John Wiley & Sons. Borenstein, M., Hedges, L., & Rothstein, H. (2007). Meta-analysis: Fixed effect vs. random
effects. Englewood, NJ: Biostat, Inc. Available:at www.meta-analysis.com/downloads/Meta-analysis%20fixed%20effect%20vs%20random%20effects.pdf
Borenstein, M., & Rothstein, H. (1999). Comprehensive meta-analysis: A computer program for research synthesis [Software manual]. Englewood, NJ: Biostat, Inc..
Campbell, D. T., & Stanley, J. C. (1963). Experimental and quasi-experimental designs for research. Chicago, IL: Rand McNally.
Chaudhary, N. K., Williams, A. F., & Nissen, W. (2007). Evaluation and compliance of passenger restrictions in a graduated driver licensing program (Report No. DOT No. DOT HS 810 781). Washington, DC: National Highway Traffic Safety Administration.
Chen L. H, Baker, S. P., & Li, G. (2006). Graduated driver licensing programs and fatal crashes of 16-year-old drivers: A national evaluation. Pediatrics, 118, 56–62.
Colliver, J. A., Kucera, K., & Verhulst, S. J. (2008). Meta-analysis of quasi-experimental research: Are systematic narrative reviews indicated? Medical Education, 42, 858-865.
Cooper, H., Hedges, L. V., & Valentine, J. C. (eds.) (2009). The handbook of research synthesis and meta-analysis (Second edition). New York: Russell Sage Foundation.
Dee, T. S., Grabowski, D. C., & Morrisey, M. A. (2005). Graduated driver licensing and teen traffic fatalities. Journal of Health Economics, 24, 571–589.
Duval, S. (2005). The Trim and Fill Method. In H. Rothstein, A. J. Sutton, & M. Borenstein, eds., Publication Bias in Meta-Analysis: Prevention, Assessment and Adjustments (), pp. 127–144, Chichester, UK: John Wiley & Sons.
Elliott, M. R., & Shope, J. T. (2003). Use of a Bayesian changepoint model to estimate effects of a graduated driver’s licensing program. Journal of Data Science, 1(1), 43-63.
Foss, R. D., Feaganes, J. R., & Rodgman, E. A. (2001). Initial effects of graduated driver licensing on 16-year-old driver crashes in North Carolina. Journal of the American Medical Association, 286, 1588–1592.
Foss, R. D., Masten, S. V., & Goodwin, A. H. (2007). Long-term effects of graduated driver licensing in North Carolina (working paper). Chapel Hill, NC: Nighway Safety Research Center.
Foss, R. D., Masten, S. V., Goodwin, A. H., & O'Brien, N. P. (2012). The role of supervised driving requirements in a graduated driver licensing program (Report No. DOT No. HS 811 550). Washington, DC: National Highway Traffic Safety Administration.
Friedlander, B., Kane, L. R., Raleigh, R., & Joyce, J. (2004). Reduction in young fatal and disabling driver crashes in Maryland: Assessment of three years experience with graduated licensing for 16-year-olds. Glen Burnie, MD: Motor Vehicle Administration.
Friedlander, B., Raleigh, R. & Joyce, J. (2002). Assessment of early effects of graduated driver licensing in Maryland: Impact on crashes of 16-year-old drivers. Glen Burnie, MD: Motor Vehicle Administration.
53
Grabowski, D. C. & Morrisey, M. A. (2004). Gasoline prices and motor vehicle fatalities. J Policy Anal Manag, 23(3), 575-593.
Hedges, L. V., & Olkin, I. (1985). Statistical methods for meta-analysis. San Diego, CA: Academic Press.
Hedges, L. V., & Pigott, T. D. (2004). The power of statistical tests for moderators in meta-analysis. Psychological Methods, 9(4), 426–445.
Hedges, L. V., & Vevea, J. L. (1998). Fixed- and random-effects models in meta-analysis. Psychological Methods, 3(4), 486-504.
Hoyert, D., & Jiaquan, Xu. (2012). Deaths: Preliminary data for 2011. National Vital Statistics Reports, 61(6). Hyattsville, MD: National Center for Health Statistics. Available at www.cdc.gov/nchs/data/nvsr/nvsr61/nvsr61_06.pdf
Insurance Institute for Highway Safety. (2012). Summary table: Young driver licensing systems in the U.S. Retrieved from the IIHS website at www.iihs.org/laws/GraduatedLicenseCompare.aspx
Kellerman, A. L., Rios, A., Wald, M., Nelson, S. R., Dark, K. J., & Price, M. E. (2007). Graduated driver licensing in Georgia: The impact of the teenage and adult driver responsibility act (TADRA) (Report No. DOT HS 810 715). Washington, DC: National Highway Traffic Safety Administration.
Kirley, B. B., Feller, A., Braver, E., & Langenberg, P. (2008). Does the Maryland graduated driver licensing law affect both 16-year-old drivers and those who share the road with them? Journal of safety research, 39(3), 295-301.
Males, M. (2007). California's graduated driver license law: Effect on teenage drivers' deaths through 2005. Journal of Safety Research, 38(6), 651-659.
Males, M. (2006). California's graduated driver license law: Effects on older teenagers. Californian Journal of Health Promotion, 4(3), 207-221.
Masten, S. V. (2011). National study of teen driver licensing systems and graduated driver licensing program core components (Unpublished doctoral dissertation). University of North Carolina at Chapel Hill.
Masten, S. V., Foss, R. W., & Marshall, S. W. (2011). Graduated driver licensing and fatal crashes involving 16- to 19-year-old drivers. Journal of the American Medical Association, 306(10), 1098-1103.
Masten, S. V., & Hagge, R. A. (2003). Evaluation of California's graduated driver licensing program (Report No. 205). Sacramento, CA: Department of Motor Vehicles.
Masten, S. V., & Hagge, R. A. (2004). Evaluation of California's graduated driver licensing program. Journal of Safety Research, 35(5), 523-535.
McCartt, A. T., Hellinga, L. A., & Kirley, B. B. (2010). The effects of minimum legal drinking age 21 laws on alcohol-related driving in the United States. Journal of Safety Research, 41(2), 173-181.
McCartt, A. T., Teoh, E. R., Fields, M., Braitman, K. A., & Hellinga, L. A. (2010). Graduated licensing laws and fatal crashes of teenage drivers: A national study. Traffic Injury Prevention, 11, 240–248.
McKnight, A. J., Peck, R. C., & Foss, R. D. (2002). Graduated driver licensing: What works? Injury Prevention, 8(2S), ii32–ii36.
Morrisey, M. A., & Grabowski, D. C. (2011). Gas prices, beer taxes and GDL programmes: effects on auto fatalities among young adults in the US. Applied Economics, 43(25), 3645-3654.

54
Morrisey, M. A., Grabowski, D. C., Dee, T. S., & Campbell, C. (2006). The strength of graduated drivers license programs and fatalities among teen drivers and passengers. Accident Analysis & Prevention, 38(1), 135-141.
Neyens, D. M., Donmez, B., & Boyle, L. N. (2008). The Iowa graduated driver licensing program: effectiveness in reducing crashes of teenage drivers. Journal of Safety Research, 39(4), 383-390.
O’Brien, N. P., Foss, R. D., Goodwin, A. H., & Masten, S. V. (2013). Supervised hours requirements in graduated driver licensing: Effectiveness and parental awareness. Accident Analysis & Prevention, 50, 330-335.
Rios, A., Wald, M., Nelson, S. R., Dark, K. J., Price, M. E., & Kellermann, A. L. (2006). Impact of Georgia’s teenage and adult driver responsibility act. Annals of emergency medicine, 47(4), 369-e1.
Rogers, S. C., Bentley, G. C., Campbell, B., Borrup, K., Saleheen, H., Wang, Z., & Lapidus, G. (2011). Impact of Connecticut's graduated driver licensing system on teenage motor vehicle crash rates. The Journal of Trauma and Acute Care Surgery, 71(5), S527-S530.
Rosenthal, R. (1995). Writing meta-analytic reviews. Psychological Bulletin, 118(2), 183–192. Russell, K. F.,Vandermeer, B., & Hartling, L. (2011). Graduated driver licensing for reducing
motor vehicle crashes among young drivers. Cochrane Database of Systematic Reviews, Issue 10. Art. No. CD003300. DOI: 10.1002/14651858.CD003300.pub3.
Senserrick, T., & Haworth, N. (2005). Review of literature regarding national and international young driver training, licensing and regulatory systems (RFQ No. DPC803). Victoria, AU: Western Australia Office of Road Safety, Monash University Accident Research Centre.
Shope, J. T. (2007). Graduated driver licensing: Review of evaluation results since 2002. Journal of Safety Research, 38, 165–175.
Shope, J. T., & Molnar, L. J. (2004). Michigan's graduated driver licensing program: evaluation of the first four years. Journal of Safety Research, 35(3), 337-344.
Shope, J. T., Molnar, L. J., Elliott, M. R., & Waller, P. F. (2001). Graduated driver licensing in Michigan. JAMA: The Journal of the American Medical Association, 286(13), 1593-1598.
U.S. Government Accountability Office (2010). Teen driver safety: Additional research could help states strengthen graduated driver licensing systems (GAO Report No. GAO-10-544). Retrieved from the GAO website at www.gao.gov/new.items/d10544.pdf
University of North Carolina. (2009). The Role of Supervised Driving Requirements in a Graduated Driver Licensing Program. Chapel Hill, NC: UNC Highway Safety Research Center.
Vanlaar, W., Mayhew, D., Marcoux, K., Wets, G., Brijs, T., & Shope, J. (2009). An evaluation of graduated driver licensing programs in North America using a meta-analytic approach. Accident Analysis and Prevention, 41, 1104–1111.
Villaveces, A., Cummings, P., Koepsell, T. D., Rivara, F. P., Lumley, T., & Moffat, J. (2003). Association of alcohol-related laws with deaths due to motor vehicle and motorcycle crashes in the United States, 1980–1997. American Journal of Epidemiology, 157(2), 131-140.

55
Williams, A. F., Chaudhary, N. K., Tefft, B. C., & Tison, J. (2010). Evaluation of New Jersey's graduated driver licensing program. Traffic injury prevention, 11(1), 1-7.
Williams, A. F., Chaudhary, N. K., Tefft, B. C., & Tison, J. (2010). Evaluation of New Jersey's Graduated Driver Licensing Program. Washington, DC: AAAFTS.

56
8. APPENDIX A: RST, QST, AND MAC FORMS
Appendix A
RST, QST, and MAC Forms

57
Meta-Analysis Relevance Screening Tool (RST)
Study Descriptive Information 1a. Authors: 1b. Year:
2. Title or Citation: 3. Source:
Journal Article Monograph/Report Dissertation/Thesis Conference Paper/Presentation Other (specify):
Study Inclusion Criteria 4. Is this study an original empirical investigation of overall GDL systems or one or more Key GDL Component(s)?
Yes No
Original Empirical: Analysis of data from an original source.
Key Components: 1. Minimum learner stage entry ages; 2. learner permit holding periods; 3. Supervised driving hours requirements; 4. Intermediate stage entry ages; 5. Nighttime driving restrictions; 6. Passenger driving restrictions; 7. Minimum ages of unrestricted licensure
Exclude: Re-analyses or summaries of already completed works; studies of only zero-tolerance alcohol laws, cell phone restrictions, speed or roadway restrictions, accelerated post-license controls, driver education/training requirements, choice of vehicles.
5. Is at least one of the outcome measures police-reported total crashes, injury crashes, and/or fatal crashes, crash involvements, or driver crash involvements?
Yes No
Exclude: Hospitalizations, self-reported crashes, traffic violations/tickets, licensure, arrests, subsets of crashes such as only at-fault, motorcycle, passengers, or alcohol-involved crashes.
6. Is the population examined one or more ages between 15-20-years-old?
Yes No Exclude: Studies of statewide crash rates aggregated across all or most age groups.
7. Are data from one or more U.S. jurisdictions?
Yes No Exclude: Studies that do not include data from at least one U.S. jurisdiction.
8. Was the study completed or first published after January 1, 2001?
Yes No Note: Studies completed or first published before 2001 may possibly still be included.
9. Initial decision based on relevance criteria:
Include Include;
combine Exclude Possibly Include
Exclude: If "no" answer to any item 4-7 above. Possibly Include: If "yes" to 4-7, but "no" to item 8.
Comments:

58
Meta-Analysis Quality Screening Tool (QST)
Study Descriptive Information Ref #: Authors: Year: Title: Type:
Primary
Secondary
Secondary
Study Focus Overall GDL: Yes No Maybe
GDL Component(s): (check all that apply)
Minimum learner stage entry ages Learner permit holding periods Supervised driving hours requirements Intermediate stage entry ages Nighttime driving restrictions Passenger driving restrictions Minimum ages of unrestricted licensure
Were component effects estimated through modeling or design, or were component-related outcomes (e.g., nighttime or passenger crashes) just analyzed?
Modeling/Design Outcome(s) Both Other:
Study Design One-group post-only One-group pre-post Other: Multiple group post-only Multiple group pre-post Time series
Note: Time series is defined as including 3 or more data points and incorporating a time component. If there are multiple designs used in the study, code the strongest design used.
Comparison/control type: Internal (other age group) External (other state) Both None Other:
Note: Use "Other" control for different type of crashes by same age group.
Outcome Metric Check all that apply:
Total crashes Fatal/Injury crashes Injury crashes (not including fatal) Fatal crashes Nighttime crashes Passenger crashes Proportional crash incidence (e.g., night/day) At fault or induced exposure crashes Property damage only (PDO) crashes Other: Other: Other: Other: Other: Other: Other: Other: Other:
Construct Validity for Crash Outcomes (DV) 1. Are the crash data representative of the entire state (i.e., statewide crashes)?
Exclude: Studies that did not analyze statewide 16 or 17-year-old crashes (e.g., driver records of a sample of the statewide population such as students from high schools, persons presenting at hospitals, or a subset of counties).
Yes No Maybe N/A

59
2. Are crashes measured reliably across all time?
Exclude: Studies with missing/incomplete data for some or all time points.
Yes No Maybe N/A
3. Were enough years of data before and after the intervention analyzed to provide stable estimates of both the pre- and post-intervention periods?
Note: For annual data 'Yes' is at least 2 years pre and 2 years post. For quarterly data 'Yes' is at least 8 quarters pre and 8 quarters post. For monthly data 'Yes' is 24 months pre and 24 months post. Studies that used only a single year of pre- or post-intervention data (mono-operation bias) are always 'No.' Do not include "skipped" time points.
Yes No Maybe N/A
Construct Validity for GDL Program/Components (IV) 4. Did the GDL program/component exposure variable(s) apply to all teens licensed in the state?
Exclude: Studies that only include components that apply to a subset of the 16 or 17-year-old population (e.g., only a nighttime driving restriction that could be avoided if the teens enrolled in driver education), unless it was demonstrated that the majority of 16- or 17-year-olds were indeed subject to the intervention.
Yes No Maybe N/A
Internal Validity 5. Were crash counts adjusted for changes in the underlying population of teens?
Exclude: Studies of raw crash counts not adjusted for population-level exposure using age-specific population, licensed drivers, or mileage either by computing rates or including exposure estimates in the statistical models.
Yes No Maybe N/A
6. Were the effects of teens transitioning into the program explicitly modeled, reasonably shown to not be a threat to validity, or accounted for in the study design?
Note: Include effects of both increased numbers of teens rushing to be licensed prior to the intervention as well as allowing adequate numbers of teens to transition into the treatment. If effects averaged over multiple years were analyzed such that temporary transition effects should be minimized, code ‘Yes.’
Yes No Maybe N/A
7. Were the effects of age-specific trends explicitly modeled, reasonably shown to not be a threat to validity, or accounted for in the design? If a surrogate was used to implicitly adjust for trend, was evidence given that the surrogate was likely adequate to remove it?
Note: If crash rates of another unaffected age group or another state were used to implicitly remove trend, but it was not demonstrated that the trends were similar prior to the intervention, code Maybe.
Yes No Maybe N/A
8. Were the effects of seasonality explicitly modeled, reasonably shown to not be a threat to validity, or accounted for in the design? If a surrogate was used to implicitly adjust for seasonality, was evidence given that the surrogate was likely adequate to remove it?
Note: If crash rates of another unaffected age group or another state were used to implicitly remove these effects, but it was not demonstrated that the crash rates were correlated prior to the intervention, code Maybe.
Yes No Maybe N/A
9. Were the effects of other historical factors (e.g., other traffic safety laws, weather, gas prices, etc.) explicitly modeled, reasonably shown to not be a threat to validity, or accounted for in the design? If a surrogate was used to implicitly adjust for unmeasured historical factors, was evidence given that the surrogate was likely adequate to remove these effects?
Note: If crash rates of another unaffected age group or another state were used to implicitly remove these effects, but it was not demonstrated that the crash rates were correlated prior to the intervention, code Maybe.
Yes No Maybe N/A
Statistical Validity

60
10a. Was an appropriate analysis conducted using statistical testing or confidence estimates?
Exclude: Studies lacking appropriate statistical analysis or without estimates of precision.
Yes No Maybe N/A
10b. Are estimates of variability/dispersion included or calculable from the data?
Note. Estimates of variability/dispersion include confidence intervals, actual p values for the effect estimates, standard deviations, or standard errors.
Yes No Maybe N/A
10c. Are estimates of effect size included or calculable from the data?
Note. Examples include adjusted crash rates, rate ratios, rate differences, hazard ratios, odds ratios, or model parameters.
Yes No Maybe N/A
10d. Are sample sizes for weighting effect sizes included or easily obtainable? Note. Examples include population sizes, numbers of licensed drivers, and crash counts.
Yes No Maybe N/A
Other Serious Threats to Research Validity 11. Is the study free from other serious threats to research validity not otherwise named above?
If "No" or "Maybe," describe the threat(s) to research validity:
Yes No Maybe N/A
Overall Quality Rating
High: Yes to all Items 1-11 . Good: Yes to all Items 1-7 & 10-11 .
Moderate: Yes to all Items 1-4 & 10-11, but Maybe to at least one Item 5-7 . Low: No to any Item 1-7 or 10-11 .
High Good Moderate Low N/A
Overall Research Validity Relative to a True Experiment
Confidence in study validity and freedom of ambiguity compared to a perfect randomized design:
< 50% 50-59% 60-74% 75-89% ≥ 90% N/A
Comments and Explanations
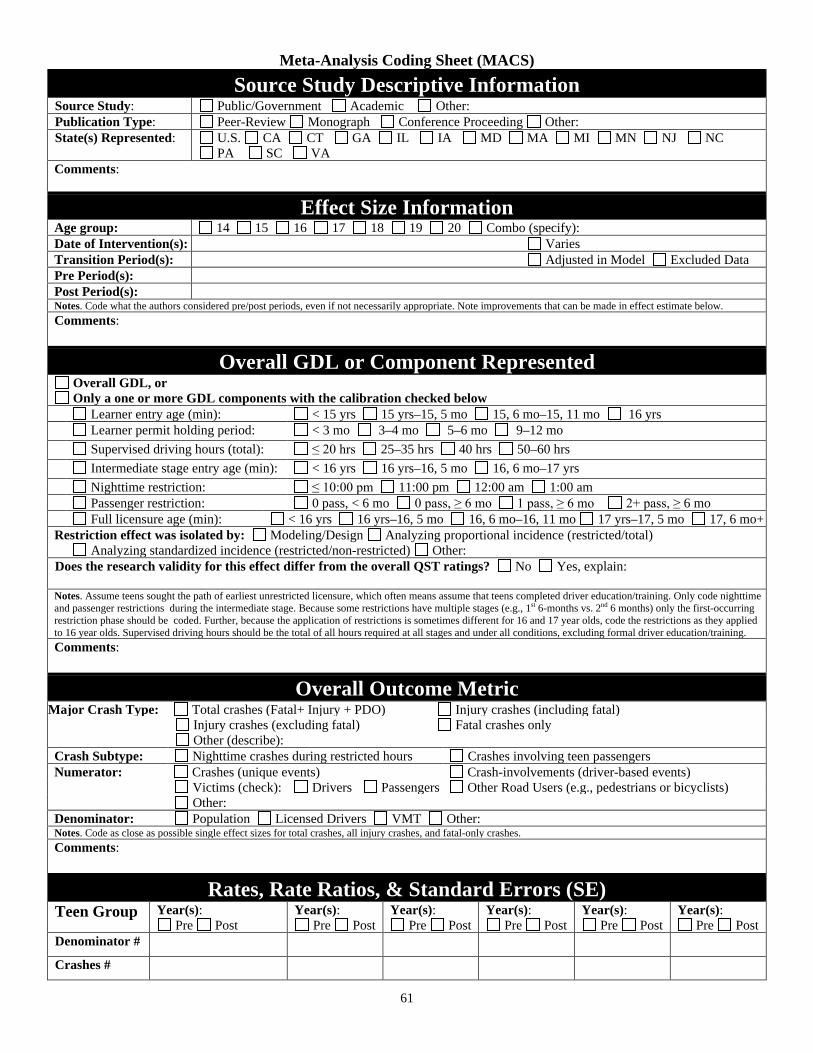
61
Meta-Analysis Coding Sheet (MACS) Source Study Descriptive Information
Source Study: Public/Government Academic Other: Publication Type: Peer-Review Monograph Conference Proceeding Other: State(s) Represented: U.S. CA CT GA IL IA MD MA MI MN NJ NC
PA SC VA Comments:
Effect Size Information Age group: 14 15 16 17 18 19 20 Combo (specify): Date of Intervention(s): Varies Transition Period(s): Adjusted in Model Excluded Data Pre Period(s): Post Period(s): Notes. Code what the authors considered pre/post periods, even if not necessarily appropriate. Note improvements that can be made in effect estimate below. Comments:
Overall GDL or Component Represented
Overall GDL, or Only a one or more GDL components with the calibration checked below
Learner entry age (min): < 15 yrs 15 yrs–15, 5 mo 15, 6 mo–15, 11 mo 16 yrs Learner permit holding period: < 3 mo 3–4 mo 5–6 mo 9–12 mo Supervised driving hours (total): ≤ 20 hrs 25–35 hrs 40 hrs 50–60 hrs Intermediate stage entry age (min): < 16 yrs 16 yrs–16, 5 mo 16, 6 mo–17 yrs Nighttime restriction: ≤ 10:00 pm 11:00 pm 12:00 am 1:00 am Passenger restriction: 0 pass, < 6 mo 0 pass, ≥ 6 mo 1 pass, ≥ 6 mo 2+ pass, ≥ 6 mo Full licensure age (min): < 16 yrs 16 yrs–16, 5 mo 16, 6 mo–16, 11 mo 17 yrs–17, 5 mo 17, 6 mo+ Restriction effect was isolated by: Modeling/Design Analyzing proportional incidence (restricted/total)
Analyzing standardized incidence (restricted/non-restricted) Other: Does the research validity for this effect differ from the overall QST ratings? No Yes, explain: Notes. Assume teens sought the path of earliest unrestricted licensure, which often means assume that teens completed driver education/training. Only code nighttime and passenger restrictions during the intermediate stage. Because some restrictions have multiple stages (e.g., 1st 6-months vs. 2nd 6 months) only the first-occurring restriction phase should be coded. Further, because the application of restrictions is sometimes different for 16 and 17 year olds, code the restrictions as they applied to 16 year olds. Supervised driving hours should be the total of all hours required at all stages and under all conditions, excluding formal driver education/training. Comments:
Overall Outcome Metric Major Crash Type: Total crashes (Fatal+ Injury + PDO) Injury crashes (including fatal)
Injury crashes (excluding fatal) Fatal crashes only Other (describe):
Crash Subtype: Nighttime crashes during restricted hours Crashes involving teen passengers Numerator: Crashes (unique events) Crash-involvements (driver-based events)
Victims (check): Drivers Passengers Other Road Users (e.g., pedestrians or bicyclists) Other:
Denominator: Population Licensed Drivers VMT Other: Notes. Code as close as possible single effect sizes for total crashes, all injury crashes, and fatal-only crashes. Comments:
Rates, Rate Ratios, & Standard Errors (SE) Teen Group Year(s):
Pre Post Year(s):
Pre Post Year(s):
Pre Post Year(s):
Pre Post Year(s):
Pre Post Year(s):
Pre Post Denominator #
Crashes #

62
Rate, per X
SE Rate
CI (LL,UL)
RR vs. X
Crude RR
Crude RR CI
Adjusted RR
Adjusted CI Notes. Fill-in data for multiple post-years where available. Note below if CI is not 95%. Comments:
Comparison Group
Describe the comparison group/outcome:
N/A
Year(s): Pre Post
Year(s): Pre Post
Year(s): Pre Post
Year(s): Pre Post
Year(s): Pre Post
Year(s): Pre Post
Denominator #
Crashes #
Rate, per X
SE Rate
CI (LL,UL)
RR vs. X
Crude RR
Crude RR CI
Adjusted RR
Adjusted CI Notes. Fill-in data for multiple pre and post-years where available. Note below is CI is not 95%. Comments:
ARIMA Results Pre-series Level = Post Series Level = Log transformed? Yes No Was the series: Proportion of total Standardized to another rate N/A Intervention Model: Sudden Permanent Gradual Permanent Other (specify):
Change in series
ω = t value = p = SE = CI = δ = t value = p = SE = CI = Crude post change = CI = % post change = CI =
Notes. For log-transformed series the ω parameter indicates the % change in the post-treatment series. For untransformed series, ω indicates the change in the raw series and estimates of the pre- and post-intervention levels are needed. Given the choice of multiple intervention points or models, choose that which provides the most valid estimate of the GDL/component effect and justify below. Note below if CI is not 95%. Comments:
Comments and Explanations

63
9. APPENDIX B: RELEVANCE AND QUALITY RATINGS BY STUDY
Appendix B
Relevance and Quality Ratings by Study

64
The 157 GDL Studies Identified During the Literature Search, and Relevance Screening Ratings, and States Studied
Ref# Relevance rating Authors Year Title States studied
001 Exclude (Pre-2001) McKnight, Hyle, & Albrecht 1983 Youth License Control Demonstration Project (Report No. DOT-806-616).
NHTSA. MD
002 Exclude (Pre-2001) McKnight 1986 Safety Effects of Provisional Driver Licensing Programs. In Provisional Licensing Programs for Young Drivers. NHTSA.
PA, LA, NY, MD, CA, MI
003 Exclude (Pre-2001) Hagge & Marsh 1988 The traffic safety impact of provisional licensing (Report 116). California Department of Motor Vehicles. CA
004 Exclude (Pre-2001) Jones 1994 The Effectiveness of Provisional Licensing in Oregon: An Analysis of Traffic Safety Benefits. Journal of Safety Research, 25, 33-46. OR
005 Exclude Not Empirical Study of GDL Foss & Evenson 1999 Effectiveness of Graduated Driver Licensing in Reducing Motor Vehicle Crashes.
American Journal of Preventative Medicine, 16(1S).
006 Exclude (Pre-2001) Ulmer, Preusser, Ferguson, & Williams 1999 Teenage crash reduction associated with delayed licensure in Louisiana. Journal of
Safety Research, 30, 31-38. LA
007 Exclude Not Empirical Study of GDL Chen, Braver, Baker, & Li 2000 Carrying Passengers and a risk factor for crashes fatal to 16- and 17-year-old
drivers U.S.
008 Include but Combine with Ref# 013 Foss 2000 Preliminary Evaluation of the North Carolina Graduated Driver Licensing System:
Effects on Young Driver Crashes. Chapel Hill, NC: HSRC NC
009 Exclude (Pre-2001) Ulmer, Preusser, Williams, Ferguson, & Farmer 2000 Effect of Florida's graduated licensing program on the crash rate of teenage drivers.
Accident Analysis and Prevention, 32, 527-532. FL
010 Include Agent, Steenbergen, Pigman, Kidd, McCoy, & Pollack
2001 Impact of the partial graduated driver’s license program on teen motor vehicle crashes in Kentucky. Transportation Research Record, 1779, 54–61. Transportation Research Board.
KY
011 Exclude Not Empirical Study of GDL Chen, Braver, Baker, & Li 2001 Potential benefits of restrictions on the transport of teenage passengers by 16 and
17 year old drivers. Injury Prevention, 7, 129-134. U.S.
012 Exclude Not Empirical Study of GDL Dee & Evans 2001 Behavioral policies and teen traffic safety. AEA Papers and Proceedings, 91(2), 91-
96.
48 States (AK, DC, & HI omitted)
013 Include Foss, Feaganes, & Rodgman. 2001 Initial effects of graduated driver licensing on 16-year-old driver crashes in North
Carolina. JAMA, 286, 1588-1592. NC
014 Exclude Not Empirical Study of GDL McCartt 2001 Graduated driver licensing systems: Reducing crashes among teenage drivers
JAMA, 286, 1631–1632. NC & MI
015 Include Ohio Department of Public Safety 2001
An Evaluation of Ohio’s Graduated Driver License Law. Columbus, OH: Office of the Governor’s Highway Safety Representative, Ohio Department of Public Safety.
OH
016 Include but Combine with Ref# 048
Shope, Molnar, Elliott, & Waller 2001 Graduated driver licensing in Michigan: Early impact on motor vehicle crashes
among 16-year-old drivers.JAMA 286, 1593-1598. MI
017 Include Smith, Pierce, Ray, & Murrin 2001
Motor vehicle occupant crashes among teens: Impact of the graduated licensing law in San Diego. 45th Annual Proceedings of the Association for the Advancement of Automotive Medicine, pp. 379-385. San Antonio, TX: AAAM.
CA
018 Include Ulmer, Ferguson, Williams, & Preusser 2001 Teenage crash reduction associated with delayed licensure in Connecticut. Journal
of Safety Research, 32, 31-41. CT

65
Ref# Relevance rating Authors Year Title States studied
019 Include but Combine with Ref# 145 Atkins, Cooper, & Gillen 2002 Measuring the impact of changes in graduated licensing laws: The case of
California CA
020 Exclude Not Empirical Study of GDL Ballesteros, & Dischinger 2002 Characteristics of traffic crashes in Maryland (1996–1998): Differences among the
youngest drivers. Accident Analysis and Prevention, 34, 279–284. MD
021 Include Bloch, Shin, & Labin 2002 Does graduated driver licensing reduce drinking and driving?: An examination of California’s teen driving restrictions. Paper presented at the 16th International Conference on Alcohol, Drugs and Traffic Safety. Montreal, Canada.
CA
022 Include but Combine with Ref# 150
Friedlander, Raleigh, & Joyce 2002 Assessment of early effects of graduated driver licensing in Maryland: Impact on
crashes of 16-year-old drivers. Glen Burnie, MD: Motor Vehicle Administration. MD
023 Exclude Not Empirical Study of GDL McKnight, Peck, & Foss 2002 Graduated driver licensing: What works? Injury Prevention, 8(Supp. II), ii32-ii36. Multiple
024 Exclude Not Empirical Study of GDL Williams & Ferguson 2002 Rationale for graduated licensing and risks it should address. Injury Prevention,
8(Supplement II), ii9-ii16. U.S.
025 Exclude Not Crash Study Williams, Nelson, & Leaf 2002 Responses of teenagers and their parents to California’s graduated licensing
system. Accident Analysis and Prevention, 34, 835-842. CA
026 Include Coben & McKay 2003 Evaluation of the effectiveness of Pennsylvania's graduated driver licensing program. Pennsylvania Department of Transportation. PA
027 Include Elliott & Shope 2003 Use of a Bayesian change point model to estimate effects of a graduated driver’s licensing program. Journal of Data Science, 1, 43-63. MI
028 Exclude Not Empirical Study of GDL Ferguson 2003 Other high-risk factors for young drivers—how graduated licensing does, doesn’t,
or could address them. Journal of Safety Research, 34, 71-77.
029 Exclude Not Empirical Study of GDL Foss & Goodwin 2003 Enhancing the effectiveness of graduated driver licensing legislation. Journal of
Safety Research, 34, 79-84.
030 Exclude Not Empirical Study of GDL Lin & Fearn 2003 The provisional license: Nighttime and passenger restrictions—a literature review.
Journal of Safety Research, 34, 51-61.
031 Include but Combine with Ref# 045 Masten & Hagge 2003 Evaluation of California’s Graduated Driver Licensing Program (Report No. 205).
California Department of Motor Vehicles. CA
032 Exclude Not Empirical Study of GDL Mayhew 2003 The learner’s permit. Journal of Safety Research, 34, 35-43.
033 Exclude Not Empirical Study of GDL Mayhew, Simpson, & Pak 2003 Changes in collision rates among novice drivers during the first months of driving.
Accident Analysis and Prevention, 35, 683-691.
034 Exclude Not Empirical Study of GDL
McCartt, Shabanova, & Leaf 2003 Driving experience, crashes, and traffic citations of teenage beginning drivers.
Accident Analysis and Prevention, 35, 311-320.
035 Exclude Not Empirical Study of GDL McKnight & McKnight 2003 Young novice drivers: Careless or clueless? Accident Analysis and Prevention, 35,
921-925. CA & MD
036 Exclude Not Empirical Study of GDL McKnight & Peck 2003 Graduated driver licensing and safer driving. Journal of Safety Research, 34, 85-89. Multiple
037 Exclude Not Empirical Study of GDL Rice, Peek-Asa, & Kraus 2003 Nighttime driving, passenger transport, and injury crash rates of young drivers.
Injury Prevention, 9, 245-250. CA
038 Exclude Not Empirical Study of GDL Shope & Molnar 2003 Graduated driver licensing in the United States: evaluation results from the early
programs. Journal of Safety Research, 34, 63–69. Multiple

66
Ref# Relevance rating Authors Year Title States studied
039 Exclude Not Empirical Study of GDL Simpson 2003 The evolution and effectiveness of graduated licensing. Journal of Safety Research,
34, 25-34.
040 Exclude Not Empirical Study of GDL Waller 2003 The genesis of GDL. Journal of Safety Research, 34, 17-23.
041 Exclude Not Empirical Study of GDL Williams 2003 Teenage drivers: Patterns of risk. Journal of Safety Research, 34, 5-15.
042 Exclude Not Empirical Study of GDL
Williams, Ferguson, & Wells 2003 Sixteen-Year-Old Drivers in Fatal Crashes,
United States, 2003, Traffic Injury Prevention, 6, 202-206. U.S.
043 Exclude Not Crash Study Goodwin & Foss 2004 Graduated driver licensing restrictions: Awareness, compliance, and enforcement
in North Carolina. Journal of Safety Research, 35, 367–374. NC
044 Exclude Not Empirical Study of GDL Hedlund & Compton 2004 Graduated driver licensing research in 2003 and beyond. Journal of Safety
Research, 35, 5-11.
045 Include Masten & Hagge 2004 Evaluation of California’s graduated driver licensing program. Journal of Safety Research, 35, 523-535. CA
046 Include but Combine with Ref# 093
Raymond, Johns, Golembiewski, Seifert, Nichols, & Knoblauch
2004 Evaluation of Oregon's Graduated Driver Licensing Program: Final Report. DTNH22-99-D-15099 OR
047 Include Rice, Peek-Asa, & Kraus 2004 Effects of the California graduated licensing program. Journal of Safety Research, 35, 375-381. CA
048 Include Shope & Molnar 2004 Michigan’s graduated driver licensing program: Evaluation of the first four years, Journal of Safety Research, 35, 337-344. MI
049 Exclude Not U.S. Study Adams 2005 Probationary and non-probationary drivers' nighttime crashes in Western Australia,
1996-2000, Journal of Safety Research, 36, 33-37.
050 Include Dee, Grabowski, & Morrisey 2005 Graduated driver licensing and teen traffic fatalities. Journal of Health Economics,
24, 571-589. U.S.
051 Include Falb 2005 Graduated Driver License: Iowa’s Experience Since the Law’s Inception. Iowa Department of Transportation. IA
052 Include Fohr, Layde, & Guse 2005 Graduated driver licensing in Wisconsin: Does it create safer drivers? Wisconsin Medical Journal, 104(7), 31-36. WI
053 Exclude Not Crash Study
Hartos, Simons-Morton, Beck, & Leaf 2005 Parent-imposed limits on high-risk adolescent driving: Are they stricter with
graduated driver licensing? Accident Analysis and Prevention, 37, 557-562. MD, CT
054 Exclude Not Empirical Study of GDL Hedlund & Compton 2005 Graduated driver licensing research in 2004 and 2005. Journal of Safety Research,
36, 4-14. Multiple
055 Include Hyde, Cook, Knight, & Olson 2005 Graduated driver licensing in Utah: Is it effective? Annals of Emergency Medicine,
45(2), 147-154. UT
056 Exclude Not Crash Study McIntosh 2005 Wisconsin's Experience with the graduated driver licensing law. Wisconsin
Medical Journal, 104(1), 52-56. WI
057 Exclude Not Empirical Study of GDL
Simons-Morton, Lerner, & Singer 2005 The observed effects of teenage passengers on the risk driving behavior of teenage
drivers. Accident Analysis and Prevention, 37, 973-982.
058 Include Chen, Baker, & Li 2006 Graduated driver licensing programs and fatal crashes of 16-year-old drivers: A national evaluation. Pediatrics, 118, 56-62. U.S.

67
Ref# Relevance rating Authors Year Title States studied
059 Exclude Not Empirical Study of GDL
Chen, Durbin, Elliot, Senserrick, & Winston 2006
Child passenger injury risk in motor vehicle crashes: A comparison of nighttime and daytime driving by teenage and adult drivers. Journal of Safety Research, 37, 299-306.
060 Exclude Not Crash Study
Goodwin, Wells, Foss, & Williams 2006 Encouraging compliance with graduated driver licensing restrictions. Journal of
Safety Research, 37, 343–351.
061 Include but Combine with Ref# 089
Hallmark, Witt, & Veneziano 2006 Evaluation of Iowa's graduated driver's licensing program. Iowa DOT and MTC. IA
062 Exclude Not Empirical Study of GDL
Hedlund, Shults, & Compton 2006 Graduated driver licensing and teenage driver research in 2006. Journal of Safety
Research, 37, 107-121. Multiple
063 Include but Combine with Ref# 077 Males 2006 California’s graduated driver license law: Effects on older teenagers. Californian
Journal of Health Promotion, 4, 207-221. CA
064 Include but Combine with Ref# 050
Morrisey, Grabowski, Dee, & Campbell 2006 The strength of graduated drivers license programs and fatalities among teen
drivers and passengers. Accident Analysis and Prevention, 38, 135-141. U.S.
065 Exclude; not valid citation
066 Include Rios, Wald, Nelson, Dark, Price, & Kellerman 2006 Impact of Georgia’s teenage and adult driver responsibility act. Annals of
Emergency Medicine, 47, 361-369. GA
067 Exclude Not Empirical Study of GDL Simons-Morton & Ouimet 2006 Parent involvement in novice teen driving: A review of the literature. Injury
Prevention, 12(Suppl I), i30–i37.
068 Exclude Not Empirical Study of GDL
Simons-Morton, Hartos, Leaf, & Preusser 2006 The effect on teen driving outcomes of the Checkpoints
Program in a statewide trial, Accident Analysis and Prevention, 38, 907-912.
069 Include Willis 2006 Fatal Crashes Involving 16-year-old Texas Drivers Pre- and Post-GDL: Who, When, Where, and Why? College Station, TX: Texas Transportation Institute.
TX
070 Include Zwicker, Williams, Chaudhary, & Farmer 2006 Evaluation of California’s Graduated Licensing System. Arlington, VA: IIHS. CA
071 Include but Combine with Ref# 058 Baker, Chen, & Li 2007 Nationwide review of graduated driver licensing. Washington, DC: AAAFST U.S.
072 Include Chaudhary, Williams, & Nissen 2007 Evaluation and compliance of passenger restrictions in a graduated drivers
licensing program. Report No. DOT HS 810 781. NHTSA CA, MA, VA
073 Exclude Not Empirical Study of GDL
Ferguson, Teoh, & McCartt 2007 Progress in teenage crash risk during the last decade. Journal of Safety Research,
38, 137–145. U.S.
074 Include Foss, Masten, & Goodwin 2007 Long-term effects of Graduated Driver Licensing in North Carolina (Working Paper). Chapel Hill, NC: HSRC NC
075 Exclude Not Empirical Study of GDL Foss 2007 Improving graduated driver licensing systems: a conceptual approach and its
implications. Journal of Safety Research, 38, 185–192.
076 Include but Combine with Ref# 066
Kellermann, Rios, Wald, Nelson, Dark, & Price 2007 Graduated driver licensing in Georgia: The impact of the teenage and adult driver
responsibility act (TADRA) (Report No. DOT HS 810 715). NHTSA. GA
077 Include Males 2007 California’s graduated driver license law: Effect on teenage drivers’ deaths through 2005. Journal of Safety Research, 38, 651–659. CA
078 Exclude Not Crash Study Margolis, Masten, & Foss 2007 The effects of graduated driver licensing on hospitalization rates and charges for
16- and 17-year-olds in North Carolina. Traffic Injury Prevention, 8, 35-38. NC

68
Ref# Relevance rating Authors Year Title States studied
079 Exclude Not Crash Study McCartt, Hellinga, & Haire 2007 Age of licensure and monitoring teenagers' driving: Survey of parents of novice
teenage drivers. Journal of Safety Research, 38, 697-706.
080 Include O'Connor, Lin, Tinkoff, & Ellis 2007
Effect of a graduated licensing system on motor vehicle crashes and associated injuries involving drivers less than 18 years of age. Prehospital Emergency Care, 11(4), 389-393.
DE
081 Exclude Not Empirical Study of GDL
Pezoldt, Womack, & Morris 2007 Parent-Taught Driver Education in Texas: A Comparative Evaluation (Report No.
DOT HS 810 760). NHTSA
082 Include Preusser & Tison 2007 GDL then and now. Journal of Safety Research, l38, 159–163. U.S.
083 Include Raymond, Johns, Golembiewski, Seifert, Nichols, & Knoblauch
2007 Evaluation of Oregon's Graduated Driver Licensing Program. (Report No. DOT HS 810 830). NHTSA. OR
084 Include René Ewing & Associates 2007 Teenage Driving Study: Final Report with Executive Summary. y Washington State Joint Transportation Committee.
085 Exclude Not Empirical Study of GDL Shope 2007 Graduated driver licensing: review of evaluation results since 2002. Journal of
Safety Research, 38, 165–175.
086 Exclude Not Empirical Study of GDL Williams 2007 Contribution of the components of graduated licensing to crash reductions. Journal
of Safety Research, 38, 177-184.
087 Exclude Not Empirical Study of GDL
Williams, Ferguson, & McCartt 2007 Passenger effects on teenage driving and opportunities for
reducing the risks of such travel, Journal of Safety Research, 38, 381-390.
088 Exclude Not Empirical Study of GDL
Braitman, Kirley, McCartt, & Chaudhary 2008 Crashes of novice teen drivers: Characteristics and contributing factors. Journal of
Safety Research, 39, 47–54.
089 Include Hallmark, Veneziano, Falb, Pawlovich, & Witt
2008 Evaluation of Iowa’s graduated driver’s licensing program. Accident Analysis and Prevention, 40, 1401-1405. IA
090 Include but Combine with Ref# 115
Karaca-Mandic & Ridgeway 2008 Behavioral impact of graduated driver licensing on teenage driving risk and
exposure. Multiple
091 Include Kirley, Feller, Braver, & Langenberg 2008
Does the Maryland graduated driver licensing law affect both 16-year-old drivers and those who share the road with them? Journal of Safety Research, 39, 295-301.
MD
092 Exclude Not Empirical Study of GDL
New Jersey Teen Driver Study Commission 2008 New Jersey Teen Driver Study Commission: Recommendation Report. NJ
093 Include Ross 2008 Effectiveness of Oregon's teen licensing program. Oregon Department of Transportation. OR
094 Include but Combine with Ref# 108 Williams 2008 Licensing Age and Teenage Driver Crashes: A Review of the Evidence, Arlington,
VA: IIHS. NJ
095 Exclude Not Empirical Study of GDL Williams & Mayhew 2008 Graduated licensing and beyond. American Journal of Preventative Medicine,
35(3S), S324–S333.
096 Exclude Not U.S. Study Begg & Langley 2009 A Critical Examination of the Arguments Against Raising the Car Driver Licensing
Age in New Zealand. Traffic Injury Prevention, 10, 1-8.
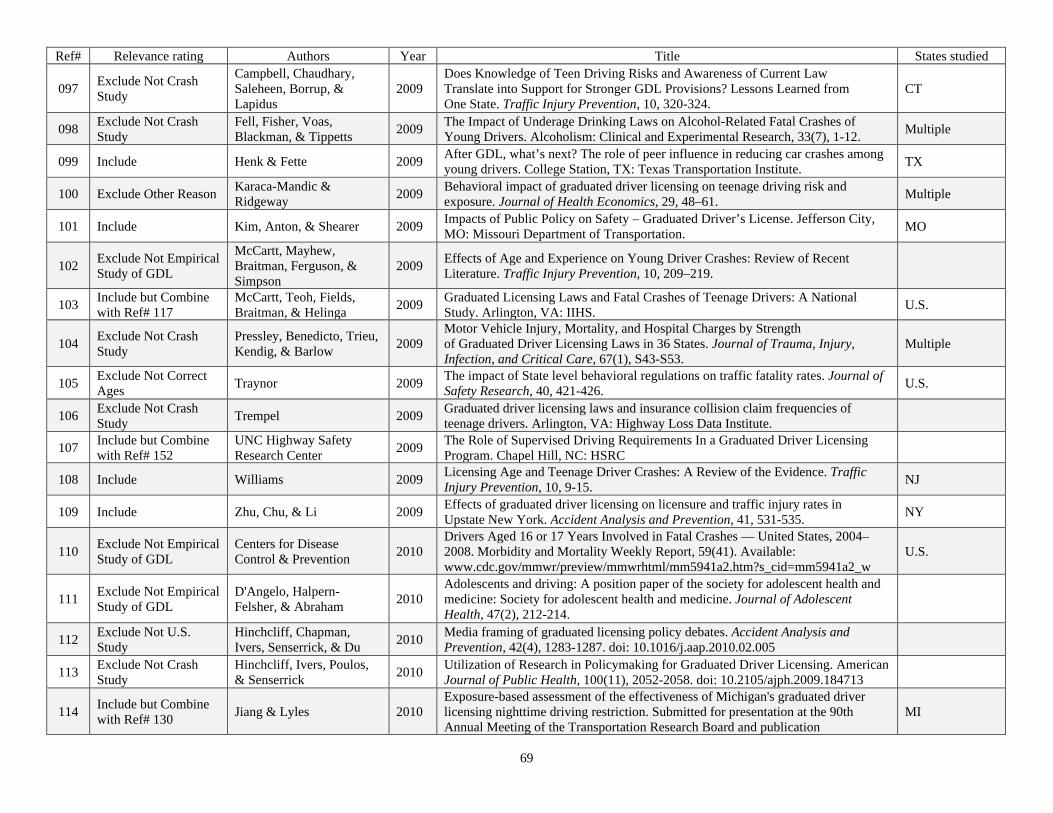
69
Ref# Relevance rating Authors Year Title States studied
097 Exclude Not Crash Study
Campbell, Chaudhary, Saleheen, Borrup, & Lapidus
2009 Does Knowledge of Teen Driving Risks and Awareness of Current Law Translate into Support for Stronger GDL Provisions? Lessons Learned from One State. Traffic Injury Prevention, 10, 320-324.
CT
098 Exclude Not Crash Study
Fell, Fisher, Voas, Blackman, & Tippetts 2009 The Impact of Underage Drinking Laws on Alcohol-Related Fatal Crashes of
Young Drivers. Alcoholism: Clinical and Experimental Research, 33(7), 1-12. Multiple
099 Include Henk & Fette 2009 After GDL, what’s next? The role of peer influence in reducing car crashes among young drivers. College Station, TX: Texas Transportation Institute. TX
100 Exclude Other Reason Karaca-Mandic & Ridgeway 2009 Behavioral impact of graduated driver licensing on teenage driving risk and
exposure. Journal of Health Economics, 29, 48–61. Multiple
101 Include Kim, Anton, & Shearer 2009 Impacts of Public Policy on Safety – Graduated Driver’s License. Jefferson City, MO: Missouri Department of Transportation. MO
102 Exclude Not Empirical Study of GDL
McCartt, Mayhew, Braitman, Ferguson, & Simpson
2009 Effects of Age and Experience on Young Driver Crashes: Review of Recent Literature. Traffic Injury Prevention, 10, 209–219.
103 Include but Combine with Ref# 117
McCartt, Teoh, Fields, Braitman, & Helinga 2009 Graduated Licensing Laws and Fatal Crashes of Teenage Drivers: A National
Study. Arlington, VA: IIHS. U.S.
104 Exclude Not Crash Study
Pressley, Benedicto, Trieu, Kendig, & Barlow 2009
Motor Vehicle Injury, Mortality, and Hospital Charges by Strength of Graduated Driver Licensing Laws in 36 States. Journal of Trauma, Injury, Infection, and Critical Care, 67(1), S43-S53.
Multiple
105 Exclude Not Correct Ages Traynor 2009 The impact of State level behavioral regulations on traffic fatality rates. Journal of
Safety Research, 40, 421-426. U.S.
106 Exclude Not Crash Study Trempel 2009 Graduated driver licensing laws and insurance collision claim frequencies of
teenage drivers. Arlington, VA: Highway Loss Data Institute.
107 Include but Combine with Ref# 152
UNC Highway Safety Research Center 2009 The Role of Supervised Driving Requirements In a Graduated Driver Licensing
Program. Chapel Hill, NC: HSRC
108 Include Williams 2009 Licensing Age and Teenage Driver Crashes: A Review of the Evidence. Traffic Injury Prevention, 10, 9-15. NJ
109 Include Zhu, Chu, & Li 2009 Effects of graduated driver licensing on licensure and traffic injury rates in Upstate New York. Accident Analysis and Prevention, 41, 531-535. NY
110 Exclude Not Empirical Study of GDL
Centers for Disease Control & Prevention 2010
Drivers Aged 16 or 17 Years Involved in Fatal Crashes — United States, 2004–2008. Morbidity and Mortality Weekly Report, 59(41). Available: www.cdc.gov/mmwr/preview/mmwrhtml/mm5941a2.htm?s_cid=mm5941a2_w
U.S.
111 Exclude Not Empirical Study of GDL
D'Angelo, Halpern-Felsher, & Abraham 2010
Adolescents and driving: A position paper of the society for adolescent health and medicine: Society for adolescent health and medicine. Journal of Adolescent Health, 47(2), 212-214.
112 Exclude Not U.S. Study
Hinchcliff, Chapman, Ivers, Senserrick, & Du 2010 Media framing of graduated licensing policy debates. Accident Analysis and
Prevention, 42(4), 1283-1287. doi: 10.1016/j.aap.2010.02.005
113 Exclude Not Crash Study
Hinchcliff, Ivers, Poulos, & Senserrick 2010 Utilization of Research in Policymaking for Graduated Driver Licensing. American
Journal of Public Health, 100(11), 2052-2058. doi: 10.2105/ajph.2009.184713
114 Include but Combine with Ref# 130 Jiang & Lyles 2010
Exposure-based assessment of the effectiveness of Michigan's graduated driver licensing nighttime driving restriction. Submitted for presentation at the 90th Annual Meeting of the Transportation Research Board and publication
MI

70
Ref# Relevance rating Authors Year Title States studied
115 Include Karaca-Mandic & Ridgeway 2010
Behavioral impact of graduated driver licensing on teenage driving risk and exposure. Journal of Health Economics, 29(1), 48-61. doi: 10.1016/j.jhealeco.2009.10.002
Multiple
116 Include Masten & Foss 2010 Long-term effect of the North Carolina graduated driver licensing system on licensed driver crash incidence: A 5-year survival analysis. Accident Analysis and Prevention, 47, 1647–1652.
NC
117 Include McCartt, Teoh, Fields, Braitman, & Hellinga 2010 Graduated licensing laws and fatal crashes of teenage drivers: A national study.
Traffic Injury Prevention, 11, 240–248. U.S.
118 Exclude Not Empirical Study of GDL Paleti, Eluru, & Bhat 2010 Examining the influence of aggressive driving behavior on driver injury severity in
traffic crashes. Accident Analysis and Prevention, 42(6), 1839-1854.
119 Exclude Not Empirical Study of GDL
Prato, Toledo, Lotan, & Taubman-Ben-Ari 2010 Modeling the behavior of novice young drivers during the first year after licensure.
Accident Analysis and Prevention, 42(2), 480-486.
120 Exclude Not Empirical Study of GDL Thor & Gabler 2010 Assessing the residual teen crash risk factors after graduated drivers license
implementation, Las Vegas, NV, United States.
121 Exclude Not Empirical Study of GDL Williams & Shults 2010 Graduated Driver Licensing Research, 2007–Present: A Review and Commentary,
Journal of Safety Research, 41, 77-84.
122 Include Williams, Chaudhary, Tefft, & Tison 2010 Evaluation of New Jersey's graduated driver licensing program. Traffic Injury
Prevention, 11, 1–7. NJ
123 Exclude Not Empirical Study of GDL Williams, Ali, & Shults 2010 The Contribution of Fatal Crashes Involving Teens Transporting Teens, Traffic
Injury Prevention, 11, 567-572.
124 Include but Combine with Ref# 122
Williams, Chaudhary, & Tison 2010 Evaluation of New Jersey’s Graduated Driver Licensing Program. Washington,
DC: AAAFTS. NJ
125 Exclude Not Crash Study Bernstein 2011
A review of automobile mortality data among novice drivers: Do objective ratings suggest a best practice methodology for graduated drivers license programs. (71), ProQuest Information & Learning.
126 Exclude Not U.S. Study Brookland & Begg 2011
Adolescent, and their parents, attitudes towards graduated driver licensing and subsequent risky driving and crashes in young adulthood. Journal of Safety Research, 42, 109-115.
127 Exclude Not Empirical Study of GDL
Curry, Hafetz, Kallan, Winston, & Durbin 2011 Prevalence of teen driver errors leading to serious motor vehicle crashes, Accident
Analysis and Prevention, 43, 1285-1290.
128 Include Fell, Todd, & Voas 2011 A national evaluation of the nighttime and passenger restriction components of graduated driver licensing. Journal of Safety Research, 42(4), 283-290. U.S.
129 Include Fell, Jones, Romano, & Voas 2011 An evaluation of graduated driver licensing effects on fatal crash involvements of
young drivers in the United States. Traffic Injury Prevention, 12(5), 423-431. U.S.
130 Include Jiang & Lyles 2011 Exposure-based assessment of the effectiveness of Michigan's graduated driver licensing nighttime driving restriction. Safety Science, 49(3), 484-490. MI
131 Exclude Not Empirical Study of GDL Knapp 2011 Reducing crash fatalities on rural roadways. Transportation Research Record
(2213), 29-36.
132 Include Lyon, Pan, & Li 2011 National Evaluation of the Effect of Graduated Driver Licensing Laws on Teenager Fatality and Injury Crashes. Submitted to the Journal of Safety Research. U.S.

71
Ref# Relevance rating Authors Year Title States studied
133 Include but Combine with Ref# 134 Masten 2011
National study of teen driver licensing systems and graduated driver licensing program core components. (Dissertation) Chapel Hill, North Carolina: University of North Carolina.
U.S.
134 Include Masten, Foss, & Marshall 2011 Graduated Driver Licensing and Fatal Crashes Involving 16- to 19-Year-Old Drivers. JAMA, 306(10), 1098-1103. U.S.
135 Include Morrisey & Grabowski 2011 Gas prices, beer taxes and GDL programmes: effects on auto fatalities among young adults in the US. Applied Economics, 43(25), 3645-3654. U.S.
136 Exclude Not Empirical Study of GDL National Safety Council 2011 Safer Teen Driving is Goal of New Education Initiative Business Wire (English).
137 Exclude Other Reason O’Brien, Foss, Goodwin, & Masten 2011
Parents’ opinions of supervised driving requirements in a graduated driver licensing program. University of North Carolina, Highway Safety Research Center: Chapel Hill, NC.
138 Exclude Not Empirical Study of GDL
Russell, Vandermeer, & Hartling 2011 Graduated driver licensing for reducing motor vehicle crashes
among young drivers (Review)
139 Exclude Not Crash Study
Scott, Monroe, Gibbs, Nichols, & King 2011 Teenage driving safety and awareness of graduated drivers license programs: What
you don't know can't deter you. Journal of Investigative Medicine, 59(2), 475-475.
140 Exclude Not U.S. Study Taubman-Ben-Ari 2011
The contribution of perceived parental and familial characteristics to attitudes toward accompanied driving among young drivers. Accident Analysis and Prevention, 43(5), 1720-1729.
141 Include Unknown 2011 Evaluating the Relative Effectiveness of Graduated Driver License Provisions: A Focus on Fatalities Involving 16 Year Olds (and 15 & 18). Paper submitted to the Journal of Safety Research, apparently never published.
U.S.
142 Exclude Not Empirical Study of GDL Williams 2011 Commentary: Graduated Licensing-Moving Forward or Standing Still? Traffic
Injury Prevention, 12(3), 207-209. doi: 10.1080/15389588.2011.573353
143 Exclude Not Crash Study
Williams, Braitman, & McCartt 2011 Views of Parents of Teenagers About Licensing Policies: A National Survey.
Traffic Injury Prevention, 12(1), 1-8. doi: 10.1080/15389588.2010.515631
144 Include Cooper, Atkins, & Gillen 2005 Measuring the impact of passenger restrictions on new teenage drivers. Accident Analysis and Prevention, 34, 19-23. CA
145 Include but Combine with Ref# 19 Cooper & Gillen 2005
Long term impacts of California’s graduated licensing law of 1998. Available: www.path.berkeley.edu/PATH/Publications/PDF/PRR 2005/PRR-2005-25.pdf.
CA
146 Exclude; not valid citation
147 Include Neyens, Donmez, & Boyle 2008b The Iowa graduated driver licensing program: effectiveness in reducing crashes in teenage drivers. Journal of Safety Research, 39(4), 383-390. IA
148 Include but Combine with Ref# 149
Vanlaar, Mayhew, Marcoux, Wets, Brijs, & Shope
2009a An evaluation of graduated driver licensing programs in North America: An Analysis of Relative Fatality Risks of 16, 17, 18 and 19 Year Old Drivers Using a Meta-Analytic Approach
U.S.
149 Include Vanlaar, Mayhew, Marcoux, Wets, Brijs, & Shope
2009b An evaluation of graduated driver licensing programs in North America using a meta-analytic approach. Accident Analysis and Prevention, 41, 1104–1111. U.S.

72
Ref# Relevance rating Authors Year Title States studied
150 Include Freidlander, Kane, Raleigh, & Joyce 2004
Reduction in young fatal and disabling driver crashes in Maryland: Assessment of three years experience with graduated licensing for 16-year-olds. Glen Burnie, MD: Motor Vehicle Administration.
OR
151 Include Massachusetts Traffic Safety Research Program
Unknown
Review and recommendations for young driver licensing practices in Massachusetts. Amherst, MA: University of Massachusetts at Amherst. MA
152 Include Foss, Masten, Goodwin, & O'Brien 2012 The Role of Supervised Driving Requirements In a Graduated Driver Licensing
Program U.S.; Multiple
153 Exclude (Pre-2001) Levy 1988 The effects of driving age, driver education, and curfew laws on traffic fatalities of 15-17 year olds. Risk Analysis, 8(4), 569-574.
47 States (Excl. AL, MA, VT, & DC)
154 Exclude (Pre-2001) Preusser, Williams, Zador, & Blomberg 1984 The effect of curfew laws on motor vehicle crashes. Law & Policy, 6(1), 115-128. PA, LA, NY,
MD
155 Include Mayhew, Simpson, Singhal, & Desmond 2006 Reducing the crash risk for young drivers. AAA Foundation for Traffic Safety:
Washington D.C. OR, ONT
156 Include Eisenberg 2003 Evaluating the effectiveness of policies related to drunk driving. Journal of Policy Analysis and Management, 22(2), 249-274. U.S.
157 Include
Rogers, Bentley, Campbell, Borrup, Saleheen, Wang, & Lapidus
2011 Impact of Connecticut’s Graduated Driver Licensing System on Teenage Motor Vehicle Crash Rates, Journal of Trauma, 71(5), S527-S530. CT
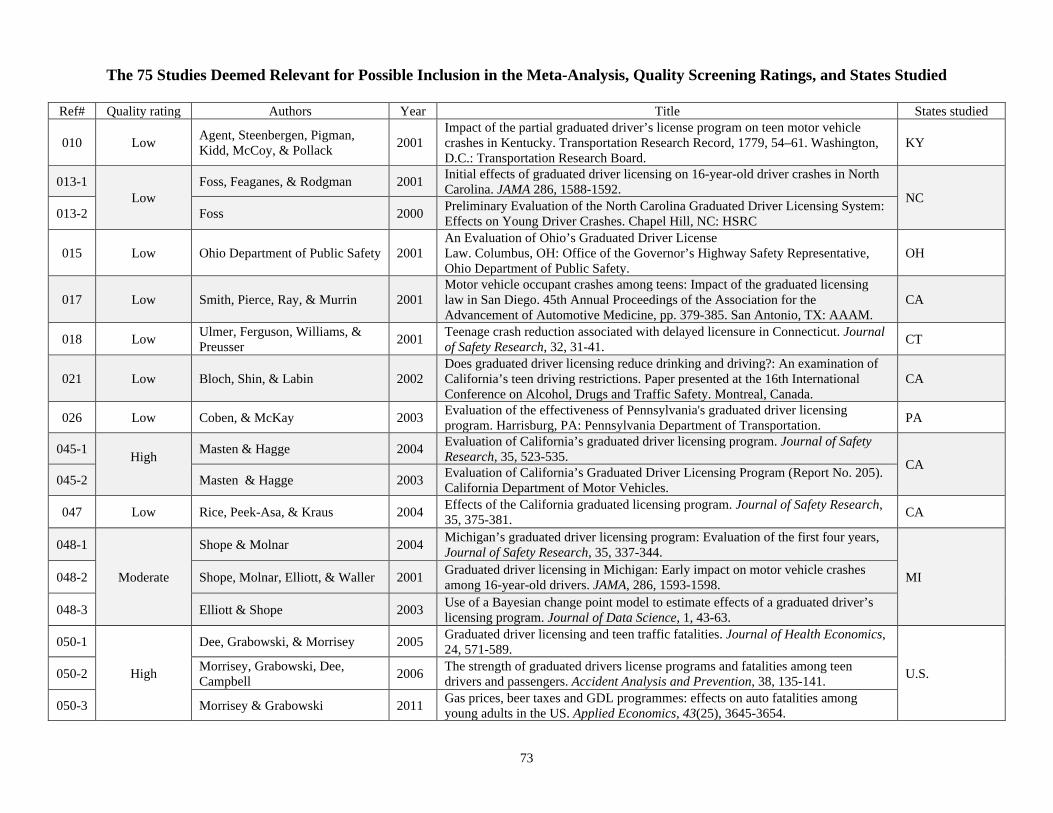
73
The 75 Studies Deemed Relevant for Possible Inclusion in the Meta-Analysis, Quality Screening Ratings, and States Studied
Ref# Quality rating Authors Year Title States studied
010 Low Agent, Steenbergen, Pigman, Kidd, McCoy, & Pollack 2001
Impact of the partial graduated driver’s license program on teen motor vehicle crashes in Kentucky. Transportation Research Record, 1779, 54–61. Washington, D.C.: Transportation Research Board.
KY
013-1 Low
Foss, Feaganes, & Rodgman 2001 Initial effects of graduated driver licensing on 16-year-old driver crashes in North Carolina. JAMA 286, 1588-1592. NC
013-2 Foss 2000 Preliminary Evaluation of the North Carolina Graduated Driver Licensing System: Effects on Young Driver Crashes. Chapel Hill, NC: HSRC
015 Low Ohio Department of Public Safety 2001 An Evaluation of Ohio’s Graduated Driver License Law. Columbus, OH: Office of the Governor’s Highway Safety Representative, Ohio Department of Public Safety.
OH
017 Low Smith, Pierce, Ray, & Murrin 2001 Motor vehicle occupant crashes among teens: Impact of the graduated licensing law in San Diego. 45th Annual Proceedings of the Association for the Advancement of Automotive Medicine, pp. 379-385. San Antonio, TX: AAAM.
CA
018 Low Ulmer, Ferguson, Williams, & Preusser 2001 Teenage crash reduction associated with delayed licensure in Connecticut. Journal
of Safety Research, 32, 31-41. CT
021 Low Bloch, Shin, & Labin 2002 Does graduated driver licensing reduce drinking and driving?: An examination of California’s teen driving restrictions. Paper presented at the 16th International Conference on Alcohol, Drugs and Traffic Safety. Montreal, Canada.
CA
026 Low Coben, & McKay 2003 Evaluation of the effectiveness of Pennsylvania's graduated driver licensing program. Harrisburg, PA: Pennsylvania Department of Transportation. PA
045-1 High
Masten & Hagge 2004 Evaluation of California’s graduated driver licensing program. Journal of Safety Research, 35, 523-535. CA
045-2 Masten & Hagge 2003 Evaluation of California’s Graduated Driver Licensing Program (Report No. 205). California Department of Motor Vehicles.
047 Low Rice, Peek-Asa, & Kraus 2004 Effects of the California graduated licensing program. Journal of Safety Research, 35, 375-381. CA
048-1
Moderate
Shope & Molnar 2004 Michigan’s graduated driver licensing program: Evaluation of the first four years, Journal of Safety Research, 35, 337-344.
MI 048-2 Shope, Molnar, Elliott, & Waller 2001 Graduated driver licensing in Michigan: Early impact on motor vehicle crashes among 16-year-old drivers. JAMA, 286, 1593-1598.
048-3 Elliott & Shope 2003 Use of a Bayesian change point model to estimate effects of a graduated driver’s licensing program. Journal of Data Science, 1, 43-63.
050-1
High
Dee, Grabowski, & Morrisey 2005 Graduated driver licensing and teen traffic fatalities. Journal of Health Economics, 24, 571-589.
U.S. 050-2 Morrisey, Grabowski, Dee, Campbell 2006 The strength of graduated drivers license programs and fatalities among teen
drivers and passengers. Accident Analysis and Prevention, 38, 135-141.
050-3 Morrisey & Grabowski 2011 Gas prices, beer taxes and GDL programmes: effects on auto fatalities among young adults in the US. Applied Economics, 43(25), 3645-3654.

74
Ref# Quality rating Authors Year Title States studied
052 Low Fohr, Layde, & Guse 2005 Graduated driver licensing in Wisconsin: Does it create safer drivers? Wisconsin Medical Journal, 104(7), 31-36. WI
055 N/A Hyde, Cook, Knight, & Olson 2005 Graduated driver licensing in Utah: Is it effective? Annals of Emergency Medicine, 45(2), 147-154. UT
058-1 Moderate
Chen, Baker, & Li 2006 Graduated driver licensing programs and fatal crashes of 16-year-old drivers: A national evaluation. Pediatrics, 118, 56-62.
U.S. 058-2 Baker, Chen, & Li 2007 Nationwide review of graduated driver licensing. AAAFST.
066-1 Moderate
Rios, Wald, Nelson, Dark, Price, & Kellerman 2006 Impact of Georgia’s teenage and adult driver responsibility act. Annals of
Emergency Medicine, 47, 361-369. GA 066-2 Kellermann, Rios, Wald, Nelson,
Dark, & Price 2007 Graduated driver licensing in Georgia: The impact of the teenage and adult driver responsibility act (TADRA) (Report No. DOT HS 810 715). NHTSA.
069 Low Willis 2006 Fatal Crashes Involving 16-year-old Texas Drivers Pre- and Post-GDL: Who, When, Where, and Why? College Station, TX: Texas Transportation Institute.
TX
070 Low Zwicker, Williams, Chaudhary, & Farmer 2006 Evaluation of California’s Graduated Licensing System. Arlington, VA: IIHS. CA
072 High Chaudhary, Williams, & Nissen 2007 Evaluation and compliance of passenger restrictions in a graduated drivers licensing program. Report No. DOT HS 810 781. NHTSA CA, MA, VA
074 Good Foss, Masten, & Goodwin 2007 Long-term effects of Graduated Driver Licensing in North Carolina (Working Paper). Chapel Hill, NC: HSRC NC
077-1 Good
Males 2007 California’s graduated driver license law: Effect on teenage drivers’ deaths through 2005. Journal of Safety Research, 38, 651–659. CA
077-2 Males 2006 California’s graduated driver license law: Effects on older teenagers. Californian Journal of Health Promotion, 4, 207-221.
080 Low O'Connor, Tinkoff, & Ellis 2007 Effect of a graduated licensing system on motor vehicle crashes and associated injuries involving drivers less than 18 years-of-age. Prehospital Emergency Care, 11(4), 389-393.
DE
082 Low Preusser & Tison 2007 GDL then and now. Journal of Safety Research, l38, 159–163. U.S.
083-1 Low
Raymond, Johns, Golembiewski, Seifert, Nichols, & Knoblauch 2007 Evaluation of Oregon's Graduated Driver Licensing Program: Final Report (Report
No. DOT HS 810 830). OR 083-2 Raymond, Johns, Golembiewski,
Seifert, Nichols, & Knoblauch 2004 Evaluation of Oregon's Graduated Driver Licensing Program: Final Report. DTNH22-99-D-15099
084 Low René Ewing & Associates 2007 Teenage Driving Study: Final Report with Executive Summary. Washington StateJoint Transportation Committee. WA
089-1
Low
Hallmark, Veneziano, Falb, Pawlovich, & Witt 2008 Evaluation of Iowa’s graduated driver’s licensing program. Accident Analysis and
Prevention, 40, 1401-1405.
IA 089-2 Hallmark, Witt, & Veneziano 2006 Evaluation of Iowa's graduated driver's licensing program. Iowa DOT and MTC.
089-3 Falb 2005 Graduated Driver License: Iowa’s Experience Since the Law’s Inception. Iowa Department of Transportation.

75
Ref# Quality rating Authors Year Title States studied
091 Moderate Kirley, Feller, Braver, & Langenberg 2008 Does the Maryland graduated driver licensing law affect both 16-year-old drivers
and those who share the road with them? Journal of Safety Research, 39, 295-301. MD
093 Low Ross 2008 Effectiveness of Oregon's teen licensing program. Oregon Department of Transportation. OR
099 Low Henk & Fette 2009 After GDL, what’s next? The role of peer influence in reducing car crashes among young drivers. College Station, TX: Texas Transportation Institute. TX
101 Low Kim, Anton, & Shearer 2009 Impacts of Public Policy on Safety – Graduated Driver’s License. Jefferson City, MO: Missouri Department of Transportation. MO
108-1 Low
Williams 2009 Licensing Age and Teenage Driver Crashes: A Review of the Evidence. Traffic Injury Prevention, 10, 9-15. NJ
NJ 108-2 Williams 2008 Licensing Age and Teenage Driver Crashes: A Review of the Evidence, Arlington, VA: IIHS.
109 Low Zhu, Chu, & Li 2009 Effects of graduated driver licensing on licensure and traffic injury rates in Upstate New York. Accident Analysis and Prevention, 41, 531-535. NY
115-1 Low
Karaca-Mandic & Ridgeway 2010 Behavioral impact of graduated driver licensing on teenage driving risk and exposure. Journal of Health Economics, 29(1), 48-61. doi: 10.1016/j.jhealeco.2009.10.002 Multiple
115-2 Karaca-Mandic & Ridgeway 2008 Behavioral impact of graduated driver licensing on teenage driving risk and exposure.
116 Low Masten & Foss 2010 Long-term effect of the North Carolina graduated driver licensing system on licensed driver crash incidence: A 5-year survival analysis. Accident Analysis and Prevention, 47, 1647–1652.
NC
117-1 Low
McCartt, Teoh, Fields, Braitman, & Hellinga 2010 Graduated licensing laws and fatal crashes of teenage drivers: A national study.
Traffic Injury Prevention, 11, 240–248. U.S. 117-2 McCartt, Teoh, Fields, Braitman,
& Hellinga 2009 Graduated Licensing Laws and Fatal Crashes of Teenage Drivers: A National Study. Arlington, VA: IIHS.
122-1 Moderate
Williams, Chaudhary, Tefft, & Tison 2010 Evaluation of New Jersey's graduated driver licensing program. Traffic Injury
Prevention, 11, 1–7. NJ 122-2 Williams, Chaudhary, & Tison 2010 Evaluation of New Jersey’s Graduated Driver Licensing Program. Washington,
DC: AAAFTS.
129-1 Low
Fell, Jones, Romano, & Voas 2011 An evaluation of graduated driver licensing effects on fatal crash involvements of young drivers in the United States. Traffic Injury Prevention, 12(5), 423-431. U.S.
129-2 Fell, Todd, & Voas 2011 A national evaluation of the nighttime and passenger restriction components of graduated driver licensing. Journal of Safety Research, 42(4), 283-290.
130-1
N/A
Jiang & Lyles 2011 Exposure-based assessment of the effectiveness of Michigan's graduated driver licensing nighttime driving restriction. Safety Science, 49(3), 484-490.
MI 130-2 Jiang & Lyles 2010
Exposure-based assessment of the effectiveness of Michigan's graduated driver licensing nighttime driving restriction. Submitted for presentation at the 90th Annual Meeting of the Transportation Research Board and publication
132 Low Lyon, Pan, & Li 2011 National Evaluation of the Effect of Graduated Driver Licensing Laws on Teenager Fatality and Injury Crashes. Submitted to the Journal of Safety Research. U.S.

76
Ref# Quality rating Authors Year Title States studied
134-1
High
Masten, Foss, & Marshall 2011 Graduated Driver Licensing and Fatal Crashes Involving 16- to 19-Year-Old Drivers. JAMA, 306(10), 1098-1103.
U.S. 134-2 Masten 2011
National study of teen driver licensing systems and graduated driver licensing program core components. (Dissertation) Chapel Hill, North Carolina: University of North Carolina.
141 Low Unknown 2011 Evaluating the Relative Effectiveness of Graduated Driver License Provisions: A Focus on Fatalities Involving 16-Year-Olds (and 15 & 18). Unpublished. U.S.
144-1
Low
Cooper, Atkins, & Gillen 2005 Measuring the impact of passenger restrictions on new teenage drivers. Accident Analysis and Prevention, 34, 19-23.
CA 144-2 Atkins, Cooper, & Gillen 2002 Measuring the impact of changes in graduated licensing laws: The case of California
144-3 Cooper & Gillen 2005 Long term impacts of California’s graduated licensing law of 1998. Available: www.path.berkeley.edu/PATH/Publications/PDF/ PRR/2005/PRR -2005-25.pdf.
147 High Neyens, Donmez, & Boyle 2008 The Iowa graduated driver licensing program: effectiveness in reducing crashes in teenage drivers. Journal of Safety Research, 39(4), 383-390. IA
149-1
Low
Vanlaar, Mayhew, Marcoux, Wets, Brijs, & Shope
2009b
An evaluation of graduated driver licensing programs in North America using a meta-analytic approach. Accident Analysis and Prevention, 41, 1104–1111.
U.S. 149-2 Vanlaar, Mayhew, Marcoux,
Wets, Brijs, & Shope 2009a An evaluation of graduated driver licensing programs in North America: An Analysis of Relative Fatality Risks of 16-, 17-, 18- and 19-Year-Old Drivers Using a Meta-Analytic Approach
150-1 Moderate
Friedlander, Kane, Raleigh, & Joyce 2004
Reduction in young fatal and disabling driver crashes in Maryland: Assessment of three years experience with graduated licensing for 16-year-olds. Glen Burnie, MD: Motor Vehicle Administration. MD
150-2 Friedlander, B., Raleigh, R., & Joyce, J. 2002 Assessment of early effects of graduated driver licensing in Maryland: Impact on
crashes of 16-year-old drivers. Glen Burnie, MD: Motor Vehicle Administration.
151 Low Massachusetts Traffic Safety Research Program
Unknown
Review and recommendations for young driver licensing practices in Massachusetts. Amherst, MA: University of Massachusetts at Amherst. MA
152-1 High
Foss, Masten, Goodwin, & O'Brien 2012 The Role of Supervised Driving Requirements In a Graduated Driver Licensing
Program U.S.; Multiple 152-2 UNC Highway Safety Research
Center 2009 The Role of Supervised Driving Requirements In a Graduated Driver Licensing Program. Chapel Hill, NC: HSRC
155 Low Mayhew, Simpson, Singhal, & Desmond 2006 Reducing the crash risk for young drivers. AAAFTS OR, ONT
156 N/A Eisenberg 2003 Evaluating the effectiveness of policies related to drunk driving. Journal of Policy Analysis and Management, 22(2), 249-274. U.S.
157 Moderate Rogers, Bentley, Campbell, Borrup, Saleheen, Wang, & Lapidus
2011 Impact of Connecticut’s Graduated Driver Licensing System on Teenage Motor Vehicle Crash Rates, Journal of Trauma, 71(5), S527-S530. CT

77
10. APPENDIX C: CODING OUTCOMES FOR THE 14 STUDIES INCLUDED IN THE META-ANALYSIS
Appendix C
Coding Outcomes for 14 Studies Included in the Meta-Analysis

78
Effect Sizes, Descriptions of GDL Program Components, and Coding Outcomes for Selected Moderator Variables for the 14 Studies Included in the Meta-Analysis
Study authors and moderator coding State Age Comparison Outcome
Follow-up time
(years) Rate ratio
Standard error
Learner entry age
Learner permit holding period
Supervised driving hours
required
Intermediate license entry
age
Nighttime driving
restriction
Passenger driving
restriction
Unrestricted licensure entry age
Contingent advancement
Teen Licensing System IIHS rating
1. Chaudhary, Williams, & Nissen, 2007a Peer review: No Author: Public/Government Design: Time series Control: Other States, see note Quality: High Validity: 75-89%
CA 16 Overall GDL F/I Driver Involvements PC 5.5 0.88 0.06 15 6 mo. 50 hr. 16 12 a.m. 0 pass, ≥ 6 mo. 17 Yes GDL2R Good
16 Overall GDL Traffic Fatalities/Injuries PC 5.5 0.90 0.05 15 6 mo. 50 hr. 16 12 a.m. 0 pass, ≥ 6 mo. 17 Yes GDL2R Good
16 Passenger Restriction F/I Driver Involvements PI 5.5 0.93 0.13
0 pass, ≥ 6 mo.
15-17 Overall GDL F/I Driver Involvements PC 5.5 0.94 0.04 15 6 mo. 50 hr. 16 12 a.m. 0 pass, ≥ 6 mo. 17 Yes GDL2R Good
15-17 Overall GDL Traffic Fatalities/Injuries PC 5.5 0.99 0.03 15 6 mo. 50 hr. 16 12 a.m. 0 pass, ≥ 6 mo. 17 Yes GDL2R Good
18-19 Overall GDL F/I Driver Involvements PC 5.5 1.03 0.02 15 6 mo. 50 hr. 16 12 a.m. 0 pass, ≥ 6 mo. 17 Yes GDL2R Good MA
16 Overall GDL F/I Driver Involvements PC 5.1 0.82 0.06 16 6 mo. 12 hr. 16, 6 mo. 12 a.m. 0 pass, ≥ 6 mo. 18 Yes GDL2R Good
16 Overall GDL Traffic Fatalities/Injuries PC 5.1 0.90 0.02 16 6 mo. 12 hr. 16, 6 mo. 12 a.m. 0 pass, ≥ 6 mo. 18 Yes GDL2R Good
16 Passenger Restriction F/I Driver Involvements PI 5.1 0.61 0.20
0 pass, ≥ 6 mo.
15-17 Overall GDL F/I Driver Involvements PC 5.1 0.87 0.05 16 6 mo. 12 hr. 16, 6 mo. 12 a.m. 0 pass, ≥ 6 mo. 18 Yes GDL2R Good
15-17 Overall GDL Traffic Fatalities/Injuries PC 5.1 0.84 0.04 16 6 mo. 12 hr. 16, 6 mo. 12 a.m. 0 pass, ≥ 6 mo. 18 Yes GDL2R Good
18-19 Overall GDL F/I Driver Involvements PC 5.1 0.95 0.02 16 6 mo. 12 hr. 16, 6 mo. 12 a.m. 0 pass, ≥ 6 mo. 18 Yes GDL2R Good VA
16 Overall GDL F/I Driver Involvements PC 2.5 0.73 0.08 15, 6 mo. 9 mo. 40 hr. 16, 3 mo. 12 a.m. 1 pass, ≥ 6 mo. 18 No GDL2R Good
16 Overall GDL Traffic Fatalities/Injuries PC 2.5 0.81 0.06 15, 6 mo. 9 mo. 40 hr. 16, 3 mo. 12 a.m. 1 pass, ≥ 6 mo. 18 No GDL2R Good
16 Passenger Restriction F/I Driver Involvements PI 2.5 1.27 0.08
1 pass, ≥ 6 mo.
15-17 Overall GDL F/I Driver Involvements PC 2.5 0.83 0.06 15, 6 mo. 9 mo. 40 hr. 16, 3 mo. 12 a.m. 1 pass, ≥ 6 mo. 18 No GDL2R Good
15-17 Overall GDL Traffic Fatalities/Injuries PC 2.5 0.89 0.02 15, 6 mo. 9 mo. 40 hr. 16, 3 mo. 12 a.m. 1 pass, ≥ 6 mo. 18 No GDL2R Good
18-19 Overall GDL F/I Driver Involvements PC 2.5 0.99 0.04 15, 6 mo. 9 mo. 40 hr. 16, 3 mo. 12 a.m. 1 pass, ≥ 6 mo. 18 No GDL2R Good 2. Chen, Baker, & Li, 2006b Peer review: Some, see note Author: Academic Design: Time series Control: Other States & Ages Quality: Moderate Validity: 60-74%
US 16 Learner Holding Period Fatal Driver Involvements PC Varies 1.04 0.07
≥ 3 mo.
16 Nighttime Restriction Fatal Driver Involvements PC Varies 1.02 0.07
Any
16 Overall GDL F/I Driver Involvements PC Varies 0.84 0.06 Varies Varies Varies Varies Varies Varies Varies Varies Varies Varies
16 Overall GDL Fatal Driver Involvements PC Varies 0.92 0.05 Varies Varies Varies Varies Varies Varies Varies Varies Varies Varies 3. Dee, Grabowski, & Morrisey, 2005c Peer review: Yes Author: Academic
US 15-17 Overall GDL Driver Fatalities PC Varies 0.93 0.02 Varies Varies Varies Varies Varies Varies Varies Varies Varies Varies
15-17 Overall GDL Traffic Fatalities PC Varies 0.91 0.02 Varies Varies Varies Varies Varies Varies Varies Varies Varies Varies
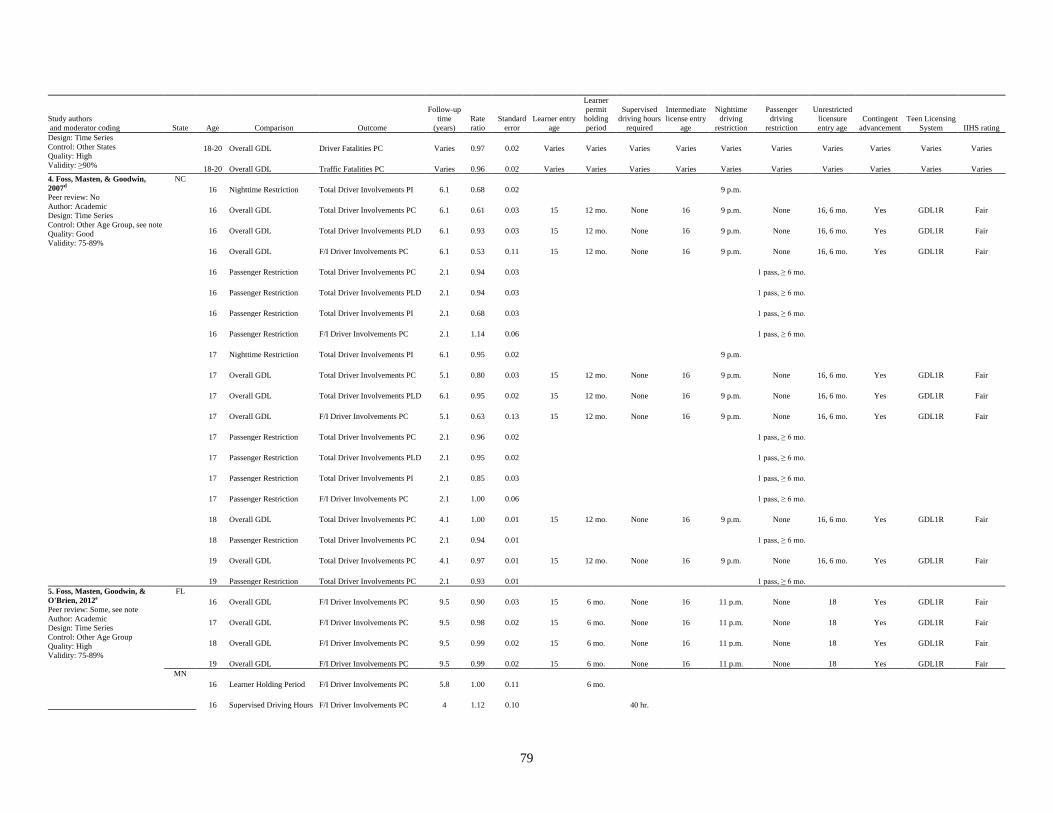
79
Study authors and moderator coding State Age Comparison Outcome
Follow-up time
(years) Rate ratio
Standard error
Learner entry age
Learner permit holding period
Supervised driving hours
required
Intermediate license entry
age
Nighttime driving
restriction
Passenger driving
restriction
Unrestricted licensure entry age
Contingent advancement
Teen Licensing System IIHS rating
Design: Time Series Control: Other States Quality: High Validity: ≥90%
18-20 Overall GDL Driver Fatalities PC Varies 0.97 0.02 Varies Varies Varies Varies Varies Varies Varies Varies Varies Varies
18-20 Overall GDL Traffic Fatalities PC Varies 0.96 0.02 Varies Varies Varies Varies Varies Varies Varies Varies Varies Varies 4. Foss, Masten, & Goodwin, 2007d Peer review: No Author: Academic Design: Time Series Control: Other Age Group, see note Quality: Good Validity: 75-89%
NC 16 Nighttime Restriction Total Driver Involvements PI 6.1 0.68 0.02
9 p.m.
16 Overall GDL Total Driver Involvements PC 6.1 0.61 0.03 15 12 mo. None 16 9 p.m. None 16, 6 mo. Yes GDL1R Fair
16 Overall GDL Total Driver Involvements PLD 6.1 0.93 0.03 15 12 mo. None 16 9 p.m. None 16, 6 mo. Yes GDL1R Fair
16 Overall GDL F/I Driver Involvements PC 6.1 0.53 0.11 15 12 mo. None 16 9 p.m. None 16, 6 mo. Yes GDL1R Fair
16 Passenger Restriction Total Driver Involvements PC 2.1 0.94 0.03
1 pass, ≥ 6 mo.
16 Passenger Restriction Total Driver Involvements PLD 2.1 0.94 0.03
1 pass, ≥ 6 mo.
16 Passenger Restriction Total Driver Involvements PI 2.1 0.68 0.03
1 pass, ≥ 6 mo.
16 Passenger Restriction F/I Driver Involvements PC 2.1 1.14 0.06
1 pass, ≥ 6 mo.
17 Nighttime Restriction Total Driver Involvements PI 6.1 0.95 0.02
9 p.m.
17 Overall GDL Total Driver Involvements PC 5.1 0.80 0.03 15 12 mo. None 16 9 p.m. None 16, 6 mo. Yes GDL1R Fair
17 Overall GDL Total Driver Involvements PLD 6.1 0.95 0.02 15 12 mo. None 16 9 p.m. None 16, 6 mo. Yes GDL1R Fair
17 Overall GDL F/I Driver Involvements PC 5.1 0.63 0.13 15 12 mo. None 16 9 p.m. None 16, 6 mo. Yes GDL1R Fair
17 Passenger Restriction Total Driver Involvements PC 2.1 0.96 0.02
1 pass, ≥ 6 mo.
17 Passenger Restriction Total Driver Involvements PLD 2.1 0.95 0.02
1 pass, ≥ 6 mo.
17 Passenger Restriction Total Driver Involvements PI 2.1 0.85 0.03
1 pass, ≥ 6 mo.
17 Passenger Restriction F/I Driver Involvements PC 2.1 1.00 0.06
1 pass, ≥ 6 mo.
18 Overall GDL Total Driver Involvements PC 4.1 1.00 0.01 15 12 mo. None 16 9 p.m. None 16, 6 mo. Yes GDL1R Fair
18 Passenger Restriction Total Driver Involvements PC 2.1 0.94 0.01
1 pass, ≥ 6 mo.
19 Overall GDL Total Driver Involvements PC 4.1 0.97 0.01 15 12 mo. None 16 9 p.m. None 16, 6 mo. Yes GDL1R Fair
19 Passenger Restriction Total Driver Involvements PC 2.1 0.93 0.01
1 pass, ≥ 6 mo. 5. Foss, Masten, Goodwin, &
O'Brien, 2012e Peer review: Some, see note Author: Academic Design: Time Series Control: Other Age Group Quality: High Validity: 75-89%
FL 16 Overall GDL F/I Driver Involvements PC 9.5 0.90 0.03 15 6 mo. None 16 11 p.m. None 18 Yes GDL1R Fair
17 Overall GDL F/I Driver Involvements PC 9.5 0.98 0.02 15 6 mo. None 16 11 p.m. None 18 Yes GDL1R Fair
18 Overall GDL F/I Driver Involvements PC 9.5 0.99 0.02 15 6 mo. None 16 11 p.m. None 18 Yes GDL1R Fair
19 Overall GDL F/I Driver Involvements PC 9.5 0.99 0.02 15 6 mo. None 16 11 p.m. None 18 Yes GDL1R Fair MN
16 Learner Holding Period F/I Driver Involvements PC 5.8 1.00 0.11
6 mo.
16 Supervised Driving Hours F/I Driver Involvements PC 4 1.12 0.10
40 hr.

80
Study authors and moderator coding State Age Comparison Outcome
Follow-up time
(years) Rate ratio
Standard error
Learner entry age
Learner permit holding period
Supervised driving hours
required
Intermediate license entry
age
Nighttime driving
restriction
Passenger driving
restriction
Unrestricted licensure entry age
Contingent advancement
Teen Licensing System IIHS rating
17 Learner Holding Period F/I Driver Involvements PC 5.8 0.85 0.07
6 mo.
17 Supervised Driving Hours F/I Driver Involvements PC 4 1.08 0.07
40 hr. SC
16 Learner Holding Period F/I Driver Involvements PC 6.5 0.93 0.08
3 mo.
16 Overall GDL F/I Driver Involvements PC 2.8 0.88 0.07 15 6 mo. 40 hr. 15, 6 mo. 6 p.m. 2 pass, ≥ 6 mo 16, 6 mo. No GDL1R Marginal
17 Learner Holding Period F/I Driver Involvements PC 6.5 0.97 0.05
3 mo.
17 Overall GDL F/I Driver Involvements PC 2.8 0.97 0.04 15 6 mo. 40 hr. 15, 6 mo. 6 p.m. 2 pass, ≥ 6 mo 16, 6 mo. No GDL1R Marginal
18 Overall GDL F/I Driver Involvements PC 2.8 0.98 0.06 15 6 mo. 40 hr. 15, 6 mo. 6 p.m. 2 pass, ≥ 6 mo 16, 6 mo. No GDL1R Marginal
19 Overall GDL F/I Driver Involvements PC 2.8 1.00 0.06 15 6 mo. 40 hr. 15, 6 mo. 6 p.m. 2 pass, ≥ 6 mo 16, 6 mo. No GDL1R Marginal VA
16 Learner Entry Age F/I Driver Involvements PC 9.5 0.88 0.10 15
16 Learner Holding Period F/I Driver Involvements PC 8.5 1.01 0.09
6 mo.
16 Overall GDL F/I Driver Involvements PC 3.5 0.78 0.07 15, 6 mo. 9 mo. 40 hr. 16, 3 mo. 12 a.m. 1 pass, ≥ 6 mo. 18 No GDL2R Good
16 Passenger Restriction F/I Driver Involvements PC 6.5 0.98 0.07
3 pass, ≥ 6 mo
16 Passenger Restriction F/I Driver Involvements PC 1.5 0.78 0.09
1 pass, ≥ 6 mo.
17 Learner Entry Age F/I Driver Involvements PC 9.5 0.92 0.04 15
17 Learner Holding Period F/I Driver Involvements PC 8.5 1.00 0.04
6 mo.
17 Overall GDL F/I Driver Involvements PC 3.5 0.98 0.03 15, 6 mo. 9 mo. 40 hr. 16, 3 mo. 12 a.m. 1 pass, ≥ 6 mo. 18 No GDL2R Good
17 Passenger Restriction F/I Driver Involvements PC 6.5 1.02 0.03
3 pass, ≥ 6 mo
17 Passenger Restriction F/I Driver Involvements PC 1.5 0.93 0.04
1 pass, ≥ 6 mo.
18 Overall GDL F/I Driver Involvements PC 3.5 0.99 0.04 15, 6 mo. 9 mo. 40 hr. 16, 3 mo. 12 a.m. 1 pass, ≥ 6 mo. 18 No GDL2R Good
19 Overall GDL F/I Driver Involvements PC 3.5 1.05 0.03 15, 6 mo. 9 mo. 40 hr. 16, 3 mo. 12 a.m. 1 pass, ≥ 6 mo. 18 No GDL2R Good 6. Kirley, Feller, Braver, & Langenberg, 2008f Peer review: Yes Author: Academic Design: Pre-Post Control: Other Age Group Quality: Moderate Validity: 60-74%
MD 16 Overall GDL Total Driver Involvements PC 3 0.82 0.08 15, 9 mo. 4 mo. 40 hr. 16, 1 mo. 12 a.m. None 17, 7 mo. Yes GDL1R Fair
16 Overall GDL Total Driver Involvements PLD 3 1.09 0.08 15, 9 mo. 4 mo. 40 hr. 16, 1 mo. 12 a.m. None 17, 7 mo. Yes GDL1R Fair
16 Overall GDL Driver Serious Injuries PC 3 0.63 0.22 15, 9 mo. 4 mo. 40 hr. 16, 1 mo. 12 a.m. None 17, 7 mo. Yes GDL1R Fair
16 Overall GDL Driver Serious Injuries PLD 3 0.83 0.24 15, 9 mo. 4 mo. 40 hr. 16, 1 mo. 12 a.m. None 17, 7 mo. Yes GDL1R Fair 7. Males, 2007g Peer review: Yes Author: Academic Design: Time Series & Pre-Post, see note Control: Other Age Group, see note Quality: Good Validity: 75-89%
CA 16 Overall GDL Driver Fatalities PC 6.5 0.80 0.14 15 6 mo. 50 hr. 16 12 a.m. 0 pass, ≥ 6 mo. 17 Yes GDL2R Good
16 Passenger Restriction Driver Fatalities PI 6.5 0.91 0.21
0 pass, ≥ 6 mo.
17 Overall GDL Driver Fatalities PC 5.5 0.96 0.14 15 6 mo. 50 hr. 16 12 a.m. 0 pass, ≥ 6 mo. 17 Yes GDL2R Good
17 Passenger Restriction Driver Fatalities PI 5.5 0.93 0.15
0 pass, ≥ 6 mo.

81
Study authors and moderator coding State Age Comparison Outcome
Follow-up time
(years) Rate ratio
Standard error
Learner entry age
Learner permit holding period
Supervised driving hours
required
Intermediate license entry
age
Nighttime driving
restriction
Passenger driving
restriction
Unrestricted licensure entry age
Contingent advancement
Teen Licensing System IIHS rating
18 Overall GDL Driver Fatalities PC 4.5 1.24 0.08 15 6 mo. 50 hr. 16 12 a.m. 0 pass, ≥ 6 mo. 17 Yes GDL2R Good
18 Passenger Restriction Driver Fatalities PI 4.5 0.97 0.11
0 pass, ≥ 6 mo.
19 Overall GDL Driver Fatalities PC 3.5 1.10 0.06 15 6 mo. 50 hr. 16 12 a.m. 0 pass, ≥ 6 mo. 17 Yes GDL2R Good
19 Passenger Restriction Driver Fatalities PI 3.5 1.12 0.12
0 pass, ≥ 6 mo.
16-17 Overall GDL Fatal Driver Involvements PC 4.5-5.5 0.86 0.03 15 6 mo. 50 hr. 16 12 a.m. 0 pass, ≥ 6 mo. 17 Yes GDL2R Good
16-19 Overall GDL Driver Fatalities PC 3.5 1.08 0.05 15 6 mo. 50 hr. 16 12 a.m. 0 pass, ≥ 6 mo. 17 Yes GDL2R Good
16-19 Overall GDL Driver Fatalities PLD 3.5 1.09 0.06 15 6 mo. 50 hr. 16 12 a.m. 0 pass, ≥ 6 mo. 17 Yes GDL2R Good
18-19 Overall GDL Fatal Driver Involvements PC 2.5-3.5 1.10 0.02 15 6 mo. 50 hr. 16 12 a.m. 0 pass, ≥ 6 mo. 17 Yes GDL2R Good 8. Masten & Hagge, 2004h Peer review: Some, see note Author: Public/Government Design: Time Series Control: Other Age Group, see note Quality: High Validity: ≥90%
CA 16 Overall GDL Total Driver Involvements PC 3 1.02 0.07 15 6 mo. 50 hr. 16 12 a.m. 0 pass, ≥ 6 mo. 17 Yes GDL2R Good
16 Overall GDL F/I Driver Involvements PC 3 0.90 0.12 15 6 mo. 50 hr. 16 12 a.m. 0 pass, ≥ 6 mo. 17 Yes GDL2R Good
15-17 Nighttime Restriction Total Driver Involvements PI 2.5 0.91 0.05
12 a.m.
15-17 Nighttime Restriction F/I Driver Involvements PI 2.5 0.90 0.05
12 a.m.
15-17 Overall GDL Total Driver Involvements PC 3 1.06 0.05 15 6 mo. 50 hr. 16 12 a.m. 0 pass, ≥ 6 mo. 17 Yes GDL2R Good
15-17 Overall GDL F/I Driver Involvements PC 3 1.05 0.06 15 6 mo. 50 hr. 16 12 a.m. 0 pass, ≥ 6 mo. 17 Yes GDL2R Good
15-17 Passenger Restriction Total Driver Involvements PI 2.5 0.93 0.04
0 pass, ≥ 6 mo.
15-17 Passenger Restriction F/I Driver Involvements PI 2.5 0.86 0.07
0 pass, ≥ 6 mo.
16-17 Nighttime Restriction F/I Driver Involvements PI 2.5 0.90 0.05
12 a.m.
16-17 Passenger Restriction F/I Driver Involvements PI 2.5 0.86 0.07
0 pass, ≥ 6 mo.
18-19 Overall GDL Total Driver Involvements PC 3 1.19 0.05 15 6 mo. 50 hr. 16 12 a.m. 0 pass, ≥ 6 mo. 17 Yes GDL2R Good
18-19 Overall GDL F/I Driver Involvements PC 3 1.18 0.06 15 6 mo. 50 hr. 16 12 a.m. 0 pass, ≥ 6 mo. 17 Yes GDL2R Good 9. Masten, Foss, & Marshall, 2011i Peer review: Some, see note Author: Academic Design: Time Series Control: Other States & Ages Quality: High Validity: 75-89%
US 16 Nighttime Restriction Fatal Driver Involvements PC Varies 1.04 0.11
12 a.m.
16 Overall GDL Fatal Driver Involvements PC Varies 0.80 0.04 Varies Varies Varies Varies Varies Varies Varies Varies Varies Varies
16 Passenger Restriction Fatal Driver Involvements PC Varies 0.91 0.09
0 pass, ≥ 6 mo.
16 Passenger Restriction Fatal Driver Involvements PC Varies 0.80 0.05
1 pass, ≥ 6 mo.
17 Nighttime Restriction Fatal Driver Involvements PC Varies 1.02 0.18
12 a.m.
17 Overall GDL Fatal Driver Involvements PC Varies 0.96 0.03 Varies Varies Varies Varies Varies Varies Varies Varies Varies Varies
17 Passenger Restriction Fatal Driver Involvements PC Varies 0.98 0.07
0 pass, ≥ 6 mo.
17 Passenger Restriction Fatal Driver Involvements PC Varies 0.88 0.06
1 pass, ≥ 6 mo.
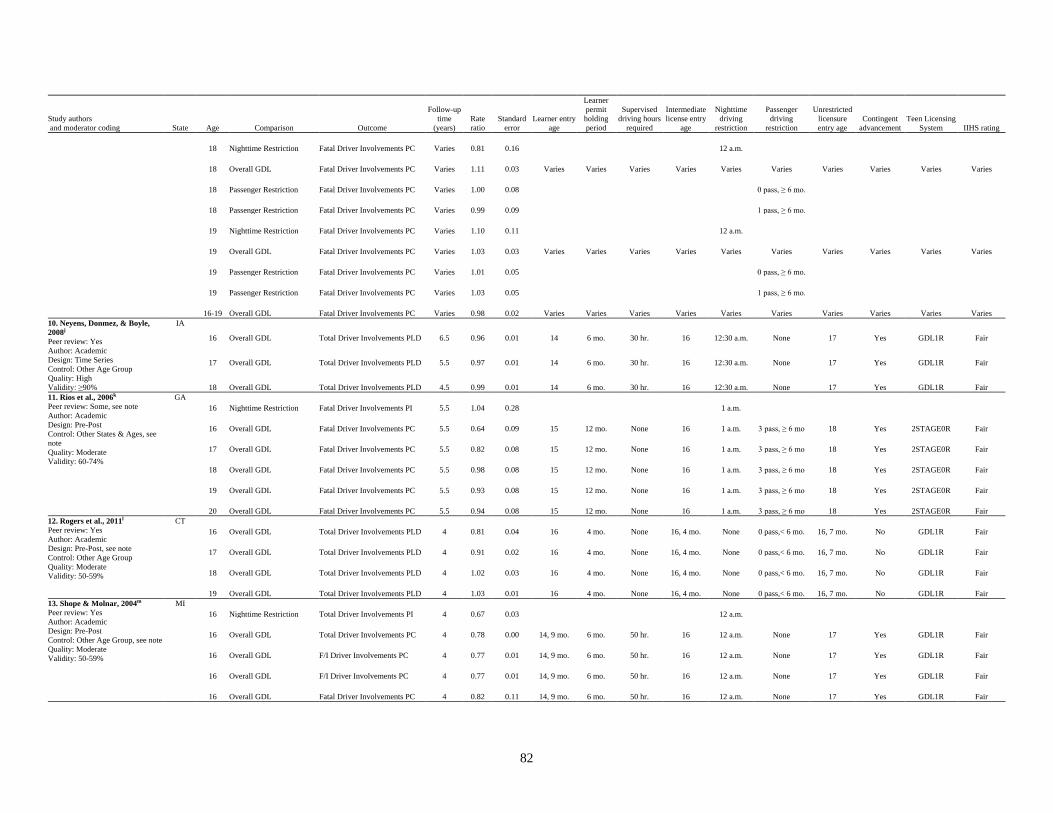
82
Study authors and moderator coding State Age Comparison Outcome
Follow-up time
(years) Rate ratio
Standard error
Learner entry age
Learner permit holding period
Supervised driving hours
required
Intermediate license entry
age
Nighttime driving
restriction
Passenger driving
restriction
Unrestricted licensure entry age
Contingent advancement
Teen Licensing System IIHS rating
18 Nighttime Restriction Fatal Driver Involvements PC Varies 0.81 0.16
12 a.m.
18 Overall GDL Fatal Driver Involvements PC Varies 1.11 0.03 Varies Varies Varies Varies Varies Varies Varies Varies Varies Varies
18 Passenger Restriction Fatal Driver Involvements PC Varies 1.00 0.08
0 pass, ≥ 6 mo.
18 Passenger Restriction Fatal Driver Involvements PC Varies 0.99 0.09
1 pass, ≥ 6 mo.
19 Nighttime Restriction Fatal Driver Involvements PC Varies 1.10 0.11
12 a.m.
19 Overall GDL Fatal Driver Involvements PC Varies 1.03 0.03 Varies Varies Varies Varies Varies Varies Varies Varies Varies Varies
19 Passenger Restriction Fatal Driver Involvements PC Varies 1.01 0.05
0 pass, ≥ 6 mo.
19 Passenger Restriction Fatal Driver Involvements PC Varies 1.03 0.05
1 pass, ≥ 6 mo.
16-19 Overall GDL Fatal Driver Involvements PC Varies 0.98 0.02 Varies Varies Varies Varies Varies Varies Varies Varies Varies Varies 10. Neyens, Donmez, & Boyle, 2008j Peer review: Yes Author: Academic Design: Time Series Control: Other Age Group Quality: High Validity: ≥90%
IA
16 Overall GDL Total Driver Involvements PLD 6.5 0.96 0.01 14 6 mo. 30 hr. 16 12:30 a.m. None 17 Yes GDL1R Fair
17 Overall GDL Total Driver Involvements PLD 5.5 0.97 0.01 14 6 mo. 30 hr. 16 12:30 a.m. None 17 Yes GDL1R Fair
18 Overall GDL Total Driver Involvements PLD 4.5 0.99 0.01 14 6 mo. 30 hr. 16 12:30 a.m. None 17 Yes GDL1R Fair 11. Rios et al., 2006k Peer review: Some, see note Author: Academic Design: Pre-Post Control: Other States & Ages, see note Quality: Moderate Validity: 60-74%
GA 16 Nighttime Restriction Fatal Driver Involvements PI 5.5 1.04 0.28
1 a.m.
16 Overall GDL Fatal Driver Involvements PC 5.5 0.64 0.09 15 12 mo. None 16 1 a.m. 3 pass, ≥ 6 mo 18 Yes 2STAGE0R Fair
17 Overall GDL Fatal Driver Involvements PC 5.5 0.82 0.08 15 12 mo. None 16 1 a.m. 3 pass, ≥ 6 mo 18 Yes 2STAGE0R Fair
18 Overall GDL Fatal Driver Involvements PC 5.5 0.98 0.08 15 12 mo. None 16 1 a.m. 3 pass, ≥ 6 mo 18 Yes 2STAGE0R Fair
19 Overall GDL Fatal Driver Involvements PC 5.5 0.93 0.08 15 12 mo. None 16 1 a.m. 3 pass, ≥ 6 mo 18 Yes 2STAGE0R Fair
20 Overall GDL Fatal Driver Involvements PC 5.5 0.94 0.08 15 12 mo. None 16 1 a.m. 3 pass, ≥ 6 mo 18 Yes 2STAGE0R Fair 12. Rogers et al., 2011l Peer review: Yes Author: Academic Design: Pre-Post, see note Control: Other Age Group Quality: Moderate Validity: 50-59%
CT 16 Overall GDL Total Driver Involvements PLD 4 0.81 0.04 16 4 mo. None 16, 4 mo. None 0 pass,< 6 mo. 16, 7 mo. No GDL1R Fair
17 Overall GDL Total Driver Involvements PLD 4 0.91 0.02 16 4 mo. None 16, 4 mo. None 0 pass,< 6 mo. 16, 7 mo. No GDL1R Fair
18 Overall GDL Total Driver Involvements PLD 4 1.02 0.03 16 4 mo. None 16, 4 mo. None 0 pass,< 6 mo. 16, 7 mo. No GDL1R Fair
19 Overall GDL Total Driver Involvements PLD 4 1.03 0.01 16 4 mo. None 16, 4 mo. None 0 pass,< 6 mo. 16, 7 mo. No GDL1R Fair 13. Shope & Molnar, 2004m Peer review: Yes Author: Academic Design: Pre-Post Control: Other Age Group, see note Quality: Moderate Validity: 50-59%
MI 16 Nighttime Restriction Total Driver Involvements PI 4 0.67 0.03
12 a.m.
16 Overall GDL Total Driver Involvements PC 4 0.78 0.00 14, 9 mo. 6 mo. 50 hr. 16 12 a.m. None 17 Yes GDL1R Fair
16 Overall GDL F/I Driver Involvements PC 4 0.77 0.01 14, 9 mo. 6 mo. 50 hr. 16 12 a.m. None 17 Yes GDL1R Fair
16 Overall GDL F/I Driver Involvements PC 4 0.77 0.01 14, 9 mo. 6 mo. 50 hr. 16 12 a.m. None 17 Yes GDL1R Fair
16 Overall GDL Fatal Driver Involvements PC 4 0.82 0.11 14, 9 mo. 6 mo. 50 hr. 16 12 a.m. None 17 Yes GDL1R Fair

83
Study authors and moderator coding State Age Comparison Outcome
Follow-up time
(years) Rate ratio
Standard error
Learner entry age
Learner permit holding period
Supervised driving hours
required
Intermediate license entry
age
Nighttime driving
restriction
Passenger driving
restriction
Unrestricted licensure entry age
Contingent advancement
Teen Licensing System IIHS rating
14. Williams, Chaudhary, Tefft, & Tison, 2010n Peer review: Yes Author: Public/Government Design: Pre-Post Control: Other Age Group, see note Quality: Moderate Validity: 60-74%
NJ 16 Nighttime Restriction Total Driver Involvements PI 4 1.00 0.17
12 a.m.
16 Nighttime Restriction Fatal Driver Involvements PI 6 0.17 0.88
12 a.m.
16 Overall GDL Total Driver Involvements PC 4 1.00 0.03 16 6 mo. None 17 12 a.m. 1 pass, ≥ 6 mo. 18 Yes GDL2R Good
16 Overall GDL F/I Driver Involvements PC 4 0.91 0.06 16 6 mo. None 17 12 a.m. 1 pass, ≥ 6 mo. 18 Yes GDL2R Good
16 Overall GDL Fatal Driver Involvements PC 6 0.57 0.35 16 6 mo. None 17 12 a.m. 1 pass, ≥ 6 mo. 18 Yes GDL2R Good
16 Passenger Restriction Fatal Driver Involvements PI 6 1.49 0.71
1 pass, ≥ 6 mo.
17 Nighttime Restriction Total Driver Involvements PI 4 0.70 0.03
12 a.m.
17 Nighttime Restriction Fatal Driver Involvements PI 6 0.72 0.35
12 a.m.
17 Overall GDL Total Driver Involvements PC 4 0.84 0.01 16 6 mo. None 17 12 a.m. 1 pass, ≥ 6 mo. 18 Yes GDL2R Good
17 Overall GDL F/I Driver Involvements PC 4 0.86 0.01 16 6 mo. None 17 12 a.m. 1 pass, ≥ 6 mo. 18 Yes GDL2R Good
17 Overall GDL Fatal Driver Involvements PC 6 0.75 0.11 16 6 mo. None 17 12 a.m. 1 pass, ≥ 6 mo. 18 Yes GDL2R Good
17 Passenger Restriction Fatal Driver Involvements PI 6 1.06 0.25
1 pass, ≥ 6 mo.
18 Nighttime Restriction Total Driver Involvements PI 4 0.92 0.03
12 a.m.
18 Nighttime Restriction Fatal Driver Involvements PI 6 0.72 0.26
12 a.m.
18 Overall GDL Total Driver Involvements PC 4 0.90 0.01 16 6 mo. None 17 12 a.m. 1 pass, ≥ 6 mo. 18 Yes GDL2R Good
18 Overall GDL F/I Driver Involvements PC 4 0.90 0.01 16 6 mo. None 17 12 a.m. 1 pass, ≥ 6 mo. 18 Yes GDL2R Good
18 Overall GDL Fatal Driver Involvements PC 6 0.96 0.11 16 6 mo. None 17 12 a.m. 1 pass, ≥ 6 mo. 18 Yes GDL2R Good
18 Passenger Restriction Fatal Driver Involvements PI 6 0.75 0.25
1 pass, ≥ 6 mo.
19 Overall GDL Total Driver Involvements PC 4 0.99 0.01 16 6 mo. None 17 12 a.m. 1 pass, ≥ 6 mo. 18 Yes GDL2R Good
19 Overall GDL F/I Driver Involvements PC 4 0.99 0.01 16 6 mo. None 17 12 a.m. 1 pass, ≥ 6 mo. 18 Yes GDL2R Good
19 Overall GDL Fatal Driver Involvements PC 6 1.15 0.11 16 6 mo. None 17 12 a.m. 1 pass, ≥ 6 mo. 18 Yes GDL2R Good Note. Teen licensing system ratings were coded as the programs existed on the first day of follow-up using the method described in Masten, Foss, and Marshall (2011) where GDL1R = 3-stage GDL with 1 restriction (nighttime or passenger) during the intermediate license stage; GDL2R = GDL with 2 such restrictions; and 2STAGE0R = 2-stage licensing system with no intermediate stage. IIHS ratings of GDL rigor were coded as the programs existed on the first day of follow-up using the method described in McCartt, Teoh, Fields, Braitman, and Hellinga (2010). For peer review: Yes = published in a peer-reviewed journal. For author: Academic = completed by authors with primary academic affiliation; Public/Government = completed for a government agency. For research design: Pre-Post = Simple ratios of before and after rates; Time Series = included three or more data points and incorporated a time component in the analysis. For control group: Other Age Group = Contemporaneous crash rates for another age group in the same State were used as a control; Other States = contemporaneous crash rates for the same age group one or more States were used. Overall quality ratings ranged from Low to High, based on rater judgments regarding the extent to which the study addressed threats to research validity. Overall validity ratings ranged from < 50% to ≥90%, based on rater confidence in study validity and freedom of ambiguity compared to a perfect randomized design. Effect estimates for 18 or older reflect both drivers licensed under GDL and others who never had GDL licenses. aAdditional data was obtained from the authors in order to calculate the effect sizes. Component effects estimated through proportional incidence calculated as Restricted/Total Rate; the MA passenger restriction effect is based on single-vehicle crashes due to data limitations. bIncludes Baker, Chen, & Li (2007). The fatal/injury effect was only present in the non-peer-reviewed monograph and was not correct. The correct 16-year-old F/I effect size and additional data for the comparisons series were obtained from the authors. Component effects estimated through Modeling/Design.

84
c Includes Morrisey, Grabowski, Dee, Campbell (2006) and Morrisey & Grabowski (2011). Effects were combined across the separate estimates for GDL programs with marginal, fair, and good IIHS ratings to obtain single weighted effect sizes. dAdditional data were obtained from the authors in order to calculate some of the effect sizes. Component effects estimated through both Modeling/Design and proportional incidence calculated as Restricted/Total Rate.. eIncludes UNC Highway Safety Research Center (2009) and O’Brien, Foss, Goodwin, & Masten (2013). The MN effect sizes were from the peer-reviewed article; all others are from the monograph. Additional data were obtained from the authors in order to calculate some of the effect sizes. Component effects estimated through Modeling/Design. fFatal involvements (alone) were not coded. gIncludes Males (2006). The overall GDL estimates for the individual age cohorts are based on the ARIMA analyses; all other effects are based on the pre-post comparisons. Additional data were obtained from the author in order to calculate some of the effect sizes. Component effects estimated through proportional incidence calculated as Restricted/Non-Restricted Rate. hIncludes Masten & Hagge (2003). Additional data were obtained from the authors in order to calculate some of the effect sizes. Total crash effects, 15-17 component effects, and 18-19-year-old effects were only available in the non-peer-reviewed monograph; the other effects are from the peer reviewed article. Component effects estimated through proportional incidence calculated as Restricted/Total Rate. iIncludes Masten (2011). The overall GDL estimates for the individual age cohorts are from the peer-review article; the component effects are from the non-peer-reviewed dissertation. The overall GDL effects were combined across the separate estimates for programs with 1 or 2 restrictions during unsupervised driving to obtain single weighted effect sizes. Additional data were obtained from the author in order to calculate some of the effect sizes. Component effects estimated through Modeling/Design. Component effects were only coded from the dissertation if an effect size for the component calibration was available from at least one other study included in the meta-analysis. jIncludes Neyens, Donmez, & Boyle (2008). Additional data were obtained from the authors in order to calculate the effect sizes. kIncludes Kellermann, Rios, Wald, Nelson, Dark, & Price (2007). The component effect is from the non-peer-reviewed monograph; all overall GDL effects are from the peer-reviewed article. Component effect estimated through proportional incidence calculated as Restricted/Total Rate. lThe data were re-analyzed using ARIMA interrupted time series analysis with a single intervention point in 2004 and crash rates of 30-59-year-olds as a covariate; the 2008 year was excluded from the analysis due to aberrant values, likely due to the U.S. economic downturn. The complexity of the intervention and questionable methodological choices (e.g., the figure does not illustrate the actual data points) of the original analysis were not realized until after the quality ratings were completed; in retrospect this study would have been excluded altogether. m Includes Shope, Molnar, Elliott, & Waller (2001) and Elliott & Shope (2003). Additional data were obtained from the author in order to calculate some of the effect sizes. Component effect estimated through proportional incidence calculated as Restricted/Total Rate. nIncludes Williams, Chaudhary, & Tison (2010b). Additional data were obtained from the author in order to calculate some of the effect sizes. Component effects estimated through proportional incidence calculated as Restricted/Non-Restricted Rate.

DOT HS 812 211 November 2015
11871-111015-v2