mesoporous polyoxometalate cluster crosslinked ... · pdf fileorganosilica frameworks...
TRANSCRIPT

S1
Electronic Supplementary Information
Mesoporous Polyoxometalate Cluster–Crosslinked
Organosilica Frameworks Delivering Exceptionally High
Photocatalytic Activity
Eirini D. Koutsouroubi, Alexandra K. Xylouri and Gerasimos S. Armatas*
Materials Science and Technology, University of Crete, Heraklion 71003, Crete, Greece.
E-mail: [email protected]
Electronic Supplementary Material (ESI) for ChemComm.This journal is © The Royal Society of Chemistry 2015

S2
Experimental section
Pluronic P123 surfactant (HO(CH2CH2O)20(CH2CH(CH3)O)70(CH2CH2O)20H, Mn ~ 5800),
1,2-bis(triethoxysilyl)ethane (≥96%), absolute ethanol (99.8%), tetramethylammonium
chloride (N(CH3)4Cl, 98%), dimethyl sulfoxide (≥99.9%) were purchased from Sigma-Aldrich.
Hydrochloric acid solution (1M) was purchased from Merck. Sodium tungstate
(Na2WO4·2H2O, 99%) and sodium metasilicate (Na2SiO3·9H2O, 98%) were purchased from
Alfa-Aesar. The 1-phenylethanols and benzyl alcohols used as substrates were of high purity
and commercially available from Sigma-Aldrich.
Synthesis of polyoxometalate [-SiW11O39]8-
Mono lacunary silicotungstates K8[-SiW11O39] and (NBu4)8[-SiW11O39] were prepared
according to the literature procedure.1
Synthesis of organically-modified silicotungstate
The hybrid [SiW11O39{O(Si(OH)2C2H4Si(OH)3)2}]4- polyoxometalate (POM) (denoted as
SiW11(SiOH)24-) was prepared by following a similar procedure reported previously.2 Briefly, 2
g of K8SiW11O39 was dissolved in 50 mL of deionized water under stirring. Then, 0.437 mL of
1,2-bis(triethoxysilyl)ethane (BTSE) was added dropwise and the pH of solution was adjusted
to 1 with 1 M HCl. The resulting mixture was stirred for about 20 h at room temperature to
obtain a clear solution. Consequently, the solution was concentrated under reduced pressure in
a rotary evaporator to get a white precipitate. This solid was dissolved in 25 mL of water, and
then filtered on a glass frit (no. 4). Tetramethylammonium salt of the target compound,
(NMe4)4SiW11(SiOH)2, was obtained by adding excess of N(CH3)4Cl (0.276 g) and the white
microcrystals (1.7 g, 71%) was collected by filtration, washed with 2-propanol and dried under
vacuum at 40 οC. This compound was characterized by IR spectroscopy (IR (KBr) v 2961,
2936, 2874, 1485, 1042, 948, 907, 798, 533 cm-1, Fig. S4).
Synthesis of mesoporous SiW11/MES hybrid materials
In a typical experiment, 1 g of Pluronic P123 triblock copolymer was dissolved in 12 mL of
deionized water. In a separate vial, 5.16 mmol of BTSE was slowly added to a mixture
containing 12 mL deionized water and 2.5 mL 1 M HCl. The two solutions were then mixed
together under continuous stirring at 40 οC. After 5 min, a clear solution of
(NMe4)4SiW11(SiOH)2 POM in 5 mL dimethyl sulfoxide (DMSO) was added to the reaction
solution and the resulting mixture was stirred vigorously at 40 οC for about 24 h. The mixture
was then placed in a Teflon-lined autoclave and heated in an oven at 100 οC for 5 days. The
white precipitate was collected by filtration, subsequently washed with water and ethanol and
dried at 60 οC. Template removal was achieved by ethanol extraction of the as-made
(containing surfactant) materials at 70 οC for 6 h.3
Mesoporous materials with different loading amount of [SiW11O39]n- (SiW11) clusters were
prepared following the above method, varying the amount of the functionalized
(NMe4)4SiW11(SiOH)2 POMs. The amount of POM used in reactions was varied between 33,
52 and 125 μmol to give a series of mesoporous SiW11/MES hybrid materials with ~ 9, ~15
and ~25% (w/w) [SiW11O39]n- loading, as determined by elemental EDS analysis. The EDS
POM contents are slightly lower than those expected from the stoichiometry of reactions, i.e.
10, 15 and 30% (w/w). Mesoporous ethane-silica (denoted as MES) was prepared in a similar
procedure to SiW11/MES, but without addition of POM.

S3
Characterization
The small angle XRD patterns were collected using a PANanalytical X´pert Pro MPD X-ray
diffractometer equipped with a Cu (λ=1.5418 Å) rotating anode operated at 40 mA and 45 kV,
in the Bragg-Brentano geometry.
Nitrogen adsorption-desorption isotherms were measured at 77 K using liquid N2 on a
Quantachrome Model NOVA 3200e sorption analyzer. Before analysis, samples were degassed
overnight at 373 K under vacuum (<10-4 mbar). The specific surface areas were calculated
using the Brunauer-Emmett-Teller (BET) method on the adsorption data in the 0.05–0.24
relative pressure (P/Po) region. The total pore volumes were estimated from the adsorbed
amount at the P/Po = 0.98 and the pore side distributions were obtained from the adsorption
data using the nonlocal density functional theory (NLDFT) method.
Transmission electron microscopy (TEM) images were taken with a JEOL Model JEM-2100
electron microscope operating at 200 kV accelerated voltage. The samples were first gently
ground, ultrasonically dispersed in ethanol, and then picked up on a holey carbon-coated Cu
grid.
Elemental microprobe analyses were performed using a JEOL Model JSM-6390LV scanning
electron microscope (SEM) equipped with an Oxford INCA PentaFETx3 energy dispersive X-
ray spectroscopy (EDS) detector. Samples were gently placed on carbon tape, forming flat
surfaces, and taken into the instrument chamber for analysis. Data acquisition was performed
several times in different areas of samples using an accelerating voltage of 20 kV and 100-s
accumulation time.
Thermogravimetric analyses (TGA) were performed on a Perkin-Elmer Diamond system.
Thermal analysis was conducted from 40 to 600 oC in air atmosphere (100 mL min-1 flow rate)
with a heating rate of 5 oC min-1.
Infrared (IR) spectra were recorded on a Perkin Elmer Model Frontier FT-IR spectrometer with
2 cm-1 resolution. Samples were prepared as KBr pellets.
Raman spectra were recorded at room temperature on a Nicolet Almega XR micro-Raman
spectrometer equipped with a 473 nm blue laser (15 mW) as an excitation source.
Diffuse reflectance UV/vis spectra were obtained on a Perkin-Elmer Lambda 950 optical
spectrophotometer, using an integrating sphere. BaSO4 powder was used as a 100% reflectance
standard. The reflectance data were converted to absorption using the Kubelka–Munk equation:
a/S =(1-R)2/(2R), where R is the reflectance and a and S are the absorption and scattering
factors, respectively.
Catalytic reactions
The photocatalytic reactions were carried out in a 4-mL vial equipped with a PTFE cap. In the
vial, 0.1 mmol of substrate and appropriate amount of catalyst (3 mol catalyst, based on
SiW11 loading) were added in 2 mL of α,α,α-trifluorotoluene. The reaction mixture was first
stirred in the dark for 30 min to homogeneously disperse the catalyst in the solution. The
reaction was initiated by irradiation with a Variac Cermax 300 W Xe Lamp (λ>360 nm).
During irradiation, the reaction mixture was bubbled with oxygen (~15 mL min-1) and cooled
with a water bath (20±2 oC). Product analysis was performed on a Shimadzu GC-MS QP2010
Ultra system equipped with a 60 m Mega-5 MS capillary column, using He as carrier gas.
Blank experiments in the absence of catalyst or UV irradiation did not show any catalytic
activity.
For recycling experiments, the photocatalyst was recovered by centrifugation, washed with
a,a,a-trifluorotoluene, dried under vacuum at 80 oC, and used for the next catalytic run.

S4
Table S1 Morphological properties of mesoporous ethane-silica (MES) and x% SiW11/MES
materials.
Sample d-spacing
(nm)
BET Surface area
(m2g-1)
Pore volume
(cm3g-1)
Pore size
(nm)
MES 10.4 978 1.24 8.3
9% SiW11/MES 12.1 962 1.28 7.8
15% SiW11/MES 12.3 867 1.19 7.8
25% SiW11/MES 12.6 725 1.04 7.7

S5
Table S2. Catalytic activities of various SiW11-containing catalysts for the photooxidation of
1-phenylethanol to acetophenone with molecular O2.a
Catalyst Yield (%)b Kinetic constantc, k
(min-1)
9% SiW11/MES 24 0.004
15% SiW11/MES 73 0.020
25% SiW11/MES 57 0.012
(NBu4)8[SiW11O39] 5d - aReaction conditions: 0.1 mmol 1-phenylethanol, 3 mol catalyst (based on SiW11 loading), 2
mL α,α,α-trifluorotoluene, O2 bubbling (~15 mL min-1), 20 oC, UV light irradiation (λ>360
nm). bYield at 1 h, determined by GC-MS analysis, with error ±1%. cReaction rate constant (k)
assuming pseudo-first-order kinetics. dAt 4 h irradiation time.

S6
Fig. S1 TGA profiles (solid lines) performed in air and the corresponding differential
thermogravimetric (DTG) curves (dashed lines) of (a) as-prepared containing surfactant and (b)
ethanol-extracted mesoporous 15% SiW11/MES sample.
The TGA profile of as-prepared (containing surfactant) sample shows a weight loss in the
temperature range 50–150 oC due to the liberation of physisorbed solvent. The weight loss
(~29%) observed between 150 and 350 oC, which is accompanied by at least two-step process
as indicated by the DTG curve, is attributed to the decomposition of surfactant. The TGA
profile of ethanol-extracted sample show a ~5.1% weight loss between 150 and 360 oC, which
corresponds mainly to the decomposition of surfactant residue in the pores. This process is
followed by a gradual weight loss at temperatures between 400 and 600 oC, which correspond
to the loss of ethane fragment in silsesquioxane component.
S7
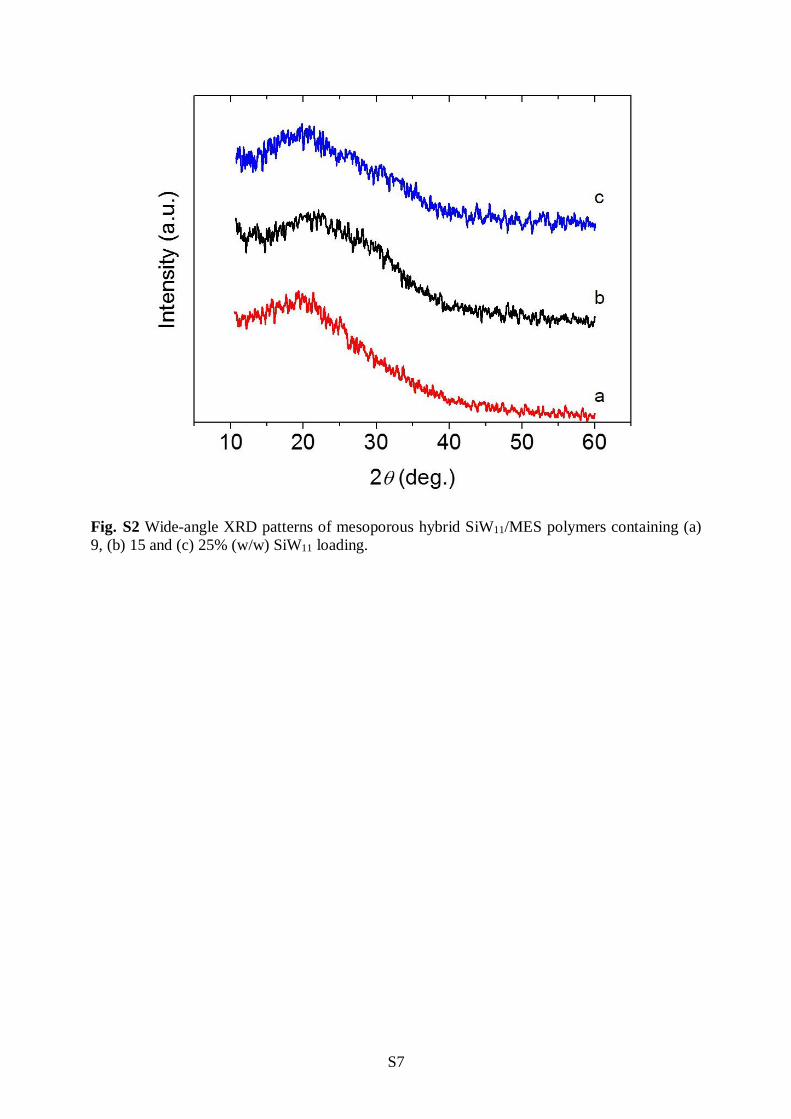
Fig. S2 Wide-angle XRD patterns of mesoporous hybrid SiW11/MES polymers containing (a)
9, (b) 15 and (c) 25% (w/w) SiW11 loading.
S8
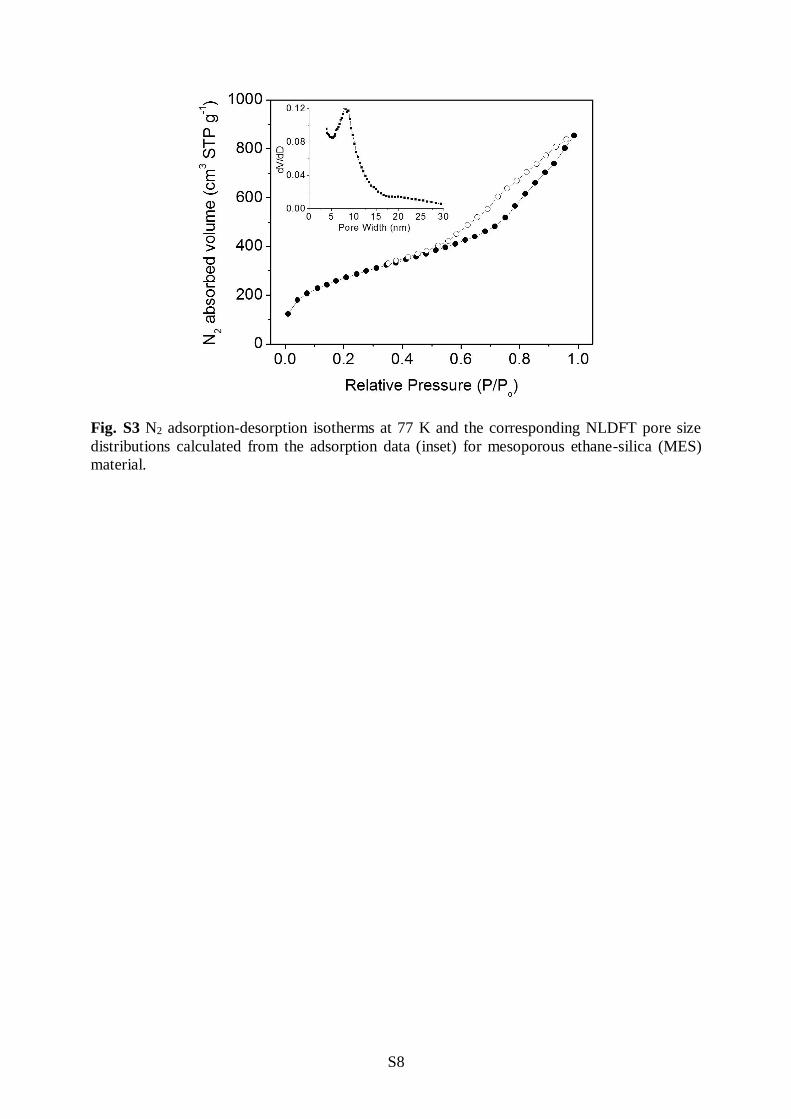
Fig. S3 N2 adsorption-desorption isotherms at 77 K and the corresponding NLDFT pore size
distributions calculated from the adsorption data (inset) for mesoporous ethane-silica (MES)
material.

S9
Fig. S4 Infrared spectra of mesoporous (a) ethane-silica (MES) and (b) 9%, (c) 15% and (d)
25% (w/w) SiW11-loaded ethane-silica (SiW11/MES) polymeric materials and (e) hybrid
(NMe4)4SiW11(SiOH)2 compound.
The IR spectrum of mesoporous ethane-silica (MES) material shows intense absorption peaks
at 1385 and 1270 cm-1, 1030–1033 cm-1 and 1100–1108 cm-1, which are attributed to the
vibration bands of –CΗ2 groups, the stretching vibration of Si–O–Si bond and the stretching
vibration of Si–O–C bond, respectively, of the silsesquioxane framework. The peaks at 1163
and 1103 cm-1 are attributed to the stretching vibrations of O–C and Si–O–C bonds,
respectively. The absorption peak at 912 cm-1 can be assigned to the bending vibration band of
Si–O–Si bond.[15] The IR spectra of x% SiW11/MES polymers show also the characteristic
stretching vibration bands of the Keggin [SiW11O39]n- clusters: (1) the W=Od asymmetrical
stretching vibration at 914–922 cm-1, (2) the W–O–W asymmetrical stretching band at 780 cm-
1, and (3) the W–O–W symmetrical stretching band in the 530–536 cm-1 region.[14] The
organically-modified (NMe4)4SiW11(SiOH)2 complex exhibits the W=Od stretching band in the
907–948 cm-1 region and the W–O–W asymmetrical and symmetrical stretching vibration
bands at ~798 and ~533 cm-1, respectively. On the hybrid POM the absorption peak at 1042
cm-1 is attributed to the stretching vibration of Si–O bonds and the intense peak at 1485 cm-1 is
assigned to the methyl (–CH3) asymmetric bending mode of N(CH3)4+ cations.

S10
Fig. S5 Diffuse reflectance UV–vis spectra of mesoporous ethane-silica (MES) and x%
SiW11/MES materials and (NMe4)4SiW11(SiOH)2 complex.

S11
Fig. S6 X-ray diffraction patterns of (a) NBu4+ precipitate obtained after dissolution of the 15%
SiW11/MES sample with HF (5% by weight in water) and (b) as-prepared (NBu4)8[SiW11O39]
compound.

S12
Fig. S7 Raman spectra of (a) NBu4+ precipitate obtained after dissolution of the 15%
SiW11/MES sample with HF and (b) as-prepared (NBu4)8[SiW11O39] compound.
The Raman spectra of NBu4+ precipitate obtained after dissolution of the 15% SiW11/MES
polymer in hydrofluoric acid and (NBu4)8[SiW11O39] compound show intense peaks in 900–
1000 cm−1 region that correspond to the W=Od stretching mode and two weak features between
790 and 890 cm−1 due to the asymmetric stretching modes of W–O–W bonds in the lacunary α-
[SiW11O39]8- cluster, respectively.4 The Raman shifts at ~527 and ~376 cm-1 are associated
with the bending modes of W–O–W and O–Si–O bonds.

S13
Fig. S8 The pseudo first-order rate plots (Co, Ct are the initial and final (at time t)
concentrations of 1-phenylethanol, respectively) for the photooxidation of 1-phenylethanol
catalyzed by various mesoporous ethane-silica materials (x% SW11/MES) loaded with different
amounts of SiW11. The corresponding red lines are fit to the data.

S14
Fig. S9 Recycling study of the mesoporous 15% SW11/MES catalyst. Reaction conditions: 0.1
mmol 1-phenylethanol, 3 mol catalyst (based on SiW11 loading), 2 mL α,α,α-trifluorotoluene,
O2 bubbling (~15 mL min-1), 20 oC, UV light irradiation (λ>360 nm), 2 h.

S15
Fig. S10 Nitrogen adsorption–desorption isotherms at 77 K of three-times reused 15%
SW11/MES catalyst. BET analysis on adsorption data indicates a surface area of 814 m2g-1 and
total pore volume of 1.09 cm3g-1. Inset: the corresponding NLDFT pore size distribution
indicating a pore diameter of ~ 7.5 nm.

S16
Fig. S11 Time evolution plots of the photooxidation of various para-substituted aryl alcohols
catalyzed by mesoporous 15% SW11/MES.
S17
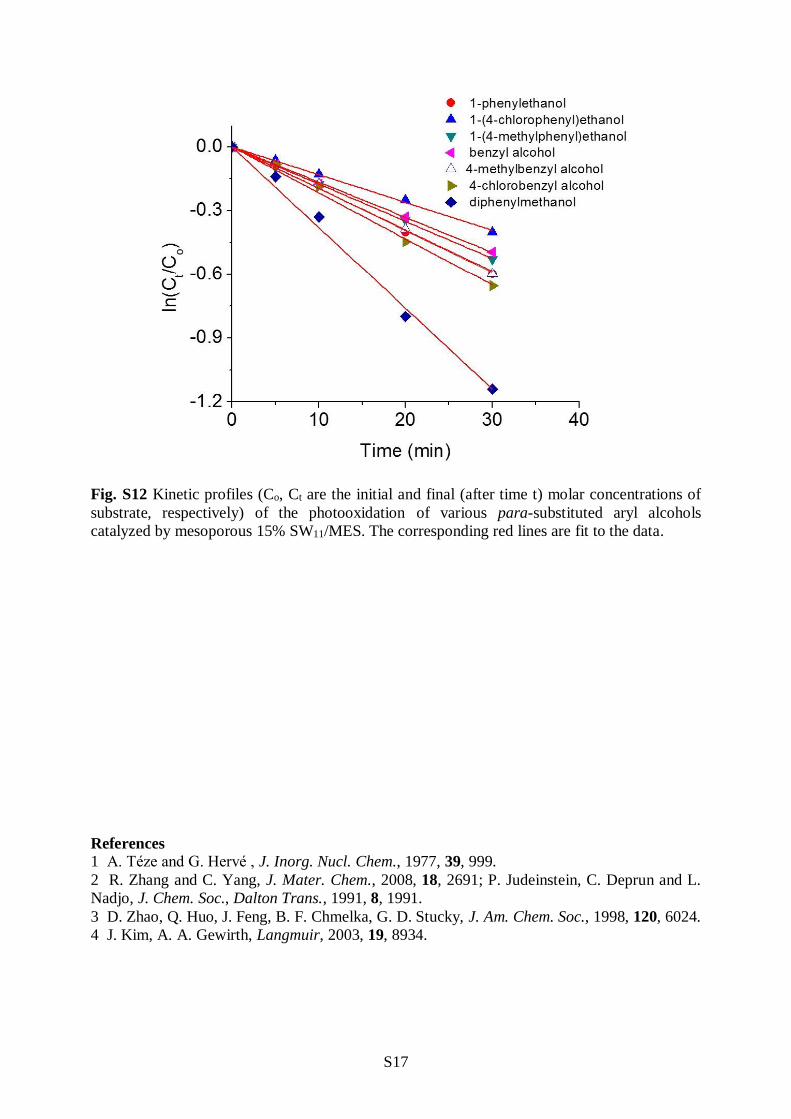
Fig. S12 Kinetic profiles (Co, Ct are the initial and final (after time t) molar concentrations of
substrate, respectively) of the photooxidation of various para-substituted aryl alcohols
catalyzed by mesoporous 15% SW11/MES. The corresponding red lines are fit to the data.
References
1 A. Téze and G. Hervé , J. Inorg. Nucl. Chem., 1977, 39, 999.
2 R. Zhang and C. Yang, J. Mater. Chem., 2008, 18, 2691; P. Judeinstein, C. Deprun and L.
Nadjo, J. Chem. Soc., Dalton Trans., 1991, 8, 1991.
3 D. Zhao, Q. Huo, J. Feng, B. F. Chmelka, G. D. Stucky, J. Am. Chem. Soc., 1998, 120, 6024.
4 J. Kim, A. A. Gewirth, Langmuir, 2003, 19, 8934.