mesoporous molecular sieve derived tio2 nanofibers doped with sno2
TRANSCRIPT
Mesoporous Molecular Sieve Derived TiO2 Nanofibers Doped with SnO2
Chunrong Xiong and Kenneth J. Balkus, Jr.*Department of Chemistry and the UTD Nanotech Institute, The UniVersity of Texas at Dallas,Richardson, Texas 75083-0688
ReceiVed: March 15, 2007; In Final Form: May 10, 2007
Mesoporous silica spheres were used as templates to prepare 5 to∼10 nm Sn doped TiO2 (TDT) nanofibersusing SnCl4 and TiCl4 as precursors. The as-made nanofibers were crystalline anatase but transformed intothe rutile phase after annealing above 700°C. The Sn dopant amount in the TDT nanofibers can be controlledby changing the molar ratio of SnCl4 to TiCl4. The dopant Sn atoms were incorporated into the anatase latticeat a level of∼15%. The photodegradation of various dyes was catalyzed by the TDT nanofibers and wasshown to be more effective than P25 and the undoped TiO2 nanofibers.
Introduction
Both efficient light-to-energy conversion and photooxidationof organics require avoiding the accumulation of electrons onmetal oxide semiconductors that would increase the recombina-tion rate of electron hole pairs. The anatase phase of TiO2 isoften considered to be the most suitable material for widespreadenvironmental applications due to its high photoelectrochemicalactivity and its stability with respect to photo and chemicalcorrosion.1 However, due to inefficient use of photogeneratedelectron hole pairs, further studies are needed to improve theactivity of this semiconductor. Suppression of the recombinationof photogenerated electrons and holes in a semiconductorparticulate system is essential for improving the efficiency ofthe net charge transfer in photocatalysis and solar cells.2 Avariety of methods has been employed for this purpose,including modification of the TiO2 surface with noble metals(Pd, Au, Ag, etc.)3 and coupling of two semiconductor particleswith different Fermi levels.4 Among these coupled semiconduc-tors, the TiO2-SnO2 system has been the focus of a number ofstudies because of the structural analogy between both oxides.5
They have the same crystal system with two molecular unitsper unit cell. The bandgaps of SnO2 and TiO2 are 3.8 and 3.2eV, respectively. When the two semiconductor particles arecoupled, the conduction band of SnO2 acts as a sink forphotogenerated electrons.5a,6 Since the photogenerated holesmove in the opposite direction, they accumulate in the valenceband of the TiO2 particle, therefore leading to efficient spatialseparation of photogenerated charges, suppressing recombina-tion. In addition, the Sn dopant also enhances the photoinducedcharge rate of TiO2.7
Several methods have been developed to produce TiO2-SnO2
materials. TiO2 capped SnO2 particles were prepared by theaddition of titanium isopropoxide to a colloidal suspension ofSnO2.8 A patterned TiO2-SnO2 bilayer catalyst has beenprepared by creating strips of anatase TiO2 on SnO2 film coatedsoda-lime glass using the photolysis of an organically modifiedsol-gel film.9 Ultrafine SnO2-TiO2 coupled particles have beenprepared by homogeneous solution precipitation.10 TiO2-SnO2
particulate films were deposited on glass slides using the plasma
enhanced chemical vapor deposition of SnCl4 and TiCl4.11 RutileTixSnxO2 solid solutions were prepared using a citric acidcomplexing method.12 In these studies, the morphologies of themixed oxides were particles or particulate films. However, manyapplications would benefit from both high surface to volumeand efficient transport of electrons and excitons in nanofibersor nanotubes. Recently, side-by-side bicomponent TiO2/SnO2
was fabricated by electrospinning;13 the average diameter of thefibers was 100 nm. Furthermore, Sn substitution for Ti in aTiO2 lattice matrix can more effectively slow down therecombination rate. For example, it was found that the photo-catalytic activity of Sn doped TiO2 was increased up to 15 timesin the oxidation of acetone.12 Such results encourage thefabrication of anatase TiO2 nanofibers doped with Sn (TDT).
To substitute Sn for Ti in TiO2 nanofibers, the atomic leveldispersion of the Sn precursor in the Ti species is important toavoid phase separation, which often occurs in sol-gel systems.Although a number of efforts has been made to prepare TiO2
nanofibers or nanorods,14 TDT nanofibers have not beenreported. Traditionally, porous materials have been used to makeone-dimensional nanosized metals and metal oxides insideconfined channels.15 However, the host matrix must be dissolvedto recover the encapsulated nanoparticles, which can lead tochemical corrosion of the oxide nanofibers. We recently reporteda novel method to produce crystalline TiO2 nanofibers bytemplating with mesoporous silica.16 In the present work, wehave extended this effort to produce TDT nanofibers frommesoporous silica spheres, Furthermore, Sn atoms were incor-porated into the TiO2 lattice, which is much different from theprevious TiO2-SnO2 materials.5-11
Experimental Procedures
Preparation of Mesoporous Silica Spheres.Dallas amor-phous material-1 (DAM-1) spheres were synthesized accordingto a literature procedure.17 In a typical preparation, 1.8 g ofvitamin E R-tocopheryl polyethylene glycol 1000 succinate(TPGS) was dissolved in a solution containing 36 mL of water,27 mL of concentrated HCl, 25 mL of formamide, and 15 mLof ethanol. The solution was stirred for 4 h atroom temperature.Then, 1.07 g of tetraethylorthosilicate (TEOS) was added tothe homogeneous mixture with stirring at room temperature for30 min and aged at room temperature for 4 days. The final molar
* Corresponding author. Tel: (972) 883-2659; fax: (972) 883-2925;e-mail: [email protected].
10359J. Phys. Chem. C2007,111,10359-10367
10.1021/jp072091t CCC: $37.00 © 2007 American Chemical SocietyPublished on Web 06/20/2007

composition of the gel was 617 H2O/54.4 HCl/107.8 HCONH2/24 vitamin E TPGS/52.9 ethanol/1.0 TEOS. The productDAM-1 spheres were isolated by vacuum filtration, washed withdeionized water, then dried at 90°C for 12 h, and calcined at550 °C for 15 h. The BET surface area was found to be 808m2/g with a pore size of 2.2 nm.
Preparation of TDT Nanofibers. Mesoporous silica sphereswere placed in a 120 mesh stainless steel screen basket thatwas positioned in a 23 mL Teflon-lined autoclave 4 cm above4 mL of SnCl4 and TiCl4. The filling of SnCl4 and TiCl4 intothe DAM-1 mesopores was conducted by heating the autoclaveat 135°C for 24 h under autogenous pressure. After cooling toroom temperature, the silica spheres were transferred to a 20mL beaker with the opening sealed by Parafilm, under acontrolled air flow of 70 mL/min, for∼3 h. After hydrolysis,the TDT nanofibers were dried at 90°C followed by calcinationat 500°C. To remove the mesoporous silica spheres, 3% HFwas used to treat the samples for 5 min, followed by suctionfiltration, washing with deionized water, and drying at∼90 °Cfor ∼12 h.
Characterization. The crystallinity of the TDT nanofiberswas determined by powder X-ray diffraction (XRD) (ScintagXDS 2000 X-ray diffractometer with Cu KR radiation). Thefiber morphology was evaluated by scanning electron micro-scopy (LEO 1530 VP field emission SEM) from Au/Pd coatedsamples. The BET surface area of the template DAM-1 sphereswas measured on a Quantachrome Autosorb I using N2
adsorption-desorption, and the pore sizes were calculated usingthe branch of adsorption curves based on the Barrett-Joyner-Halenda (BJH) model. The microstructure was observed bytransmission electron microscopy (TEM) using an FEI CM200FEG transmission electron microscope at 200 kV.
Photodegradation Evaluation.The photocatalytic degrada-tion of methylene green (MG, Aldrich, the dye content is ca.65%) was used to evaluate the photocatalytic activity of theproducts. The initial MG concentration was 3.0× 10⁻⁵ M withpH ) 5.6. The TDT nanofibers were annealed at 500°C for 10h, and DAM-1 spheres were removed by 3% HF. For allexperiments, 0.025 g of catalyst was added to 45 mL of MGaqueous solution. The mixture was sonicated for 10 min andthen magnetically stirred in a dark environment at roomtemperature for 30 min to establish an adsorption-desorptionequilibrium. The catalytic reactions were carried out in a 100mL quartz flask at room temperature. The light source was awater-cooled 450 W Hanovia quartz mercury arc lamp with∼65% of the radiation energy falling in visible spectrum and∼35% in the UV spectrum. The concentrations of MG atdifferent intervals were calculated from UV-vis absorptionspectra at 657.5 nm, the band corresponding to MG.
Photodegradation of methylene blue (MB), indigo carmine,rhodamine B, and rose bengal were also investigated at roomtemperature using the same reactor and light source as statedpreviously. The initial concentrations were 4.28× 10⁻⁵, 1.715× 10⁻⁴, 5 × 10⁻⁵, and 9.83× 10⁻⁵ M, respectively, with initialpH values of 6.1, 5.7, 4.5, and 6.5, respectively. The catalystwas hollow TDT nanofiber shells with a Sn/Ti atomic ratio of0.1 annealed at 500°C. When MB, indigo carmine, and rosebengal were used as substrates, the reaction solution contained25 mg of catalyst and 45 mL of dye solution and 20 mg ofcatalyst and 100 mL of dye solution for rhodamine B. Theconcentrations of MB, indigo carmine, rhodamine B, and rosebengal were calculated from the absorption peak at 661, 610.5,554, and 549 nm, respectively.
Results and Discussion
Preparation of TDT Nanofiber. An SEM image of themesoporous silica spheres is shown in Figure 1a. Mesoporoussilica spheres were demonstrated to have a wormhole structureas shown in the TEM image in Figure 1b. The pore size andpore volume were determined by N2 absorption. The pore sizeof the silica spheres was 2.2 nm with a wall thickness of 4.2nm. The pore volume was∼0.36 cm3/g, and the surface areawas 808 m2/g. The volatile precursors, SnCl4 and TiCl4, wereplaced at the bottom of a Teflon-lined autoclave along with theDAM-1 spheres. At 135°C, the vapor pressures of SnCl4 andTiCl4 were 980 and 760 mmHg, respectively. SnCl4 and TiCl4penetrated into the mesoporous templates and remained insidethe pores under the autogenous pressure. The impregnatedDAM-1 particles were taken out of the autoclave after 1 day ofvapor phase filling. SnCl4 and TiCl4 then diffused out of thepores owing to the high volatility of the precursors at roomtemperature and standard pressure as described previously.16
Upon contact with moisture, hydrolysis occurred, and TDTnanofibers were generated on the outside surface of themesoporous silica as illustrated in Scheme 1.
When the molar ratio of SnCl4 to TiCl4 was 1 in the Tefloncontainer, and mesoporous DAM-1 spheres were used astemplates, TDT nanofibers were grown from the mesoporoussilica spheres as shown in Figure 2. Thus, it was not requiredthat the mesoporous silica spheres be dissolved for access tothe TDT nanofibers. In contrast to other methods wheresemiconductive fibers were grown inside confined pores,15 one-
Figure 1. Mesoporous DAM-1 spheres characterized by (a) SEM and(b) TEM images.
10360 J. Phys. Chem. C, Vol. 111, No. 28, 2007 Xiong and Balkus

dimensional nanosized metal oxide fibers can be grown outsidethe molecular sieve channels. It can be seen in Figure 2b thatthe TDT nanofibers have a uniform diameter of∼30 nm owingto the uniform DAM-1 pore size. However, the fibers werecoated with∼10 nm of Au/Pd to prevent charging; therefore,TEM was used to determine the diameter as shown in Figure2c. The mesopores play an important role in directing theformation of a fibrous morphology for the complex oxides.Dispersion of gaseous SnCl4 and TiCl4 after diffusing out ofthe pores as well as the fusion of growing fibers from adjacentpores resulted in fiber diameters larger than the DAM-1 poresize (2.2 nm). The atomic ratio of Sn to Ti was determined byEDS to be 0.15. The fiber Sn/Ti ratio was much lower than themolar ratio of 1 in the precursor mixture. A possible explanationfor this is that moisture sensitivity of SnCl4 is much less thanTiCl4. Thus, some of the SnCl4 precursor is lost during thehydrolysis step. Additionally, SnCl4 has a higher vapor pressure(20 mmHg) than TiCl4 (10 mmHg) at room temperature.
The TEM images in Figure 2c clearly show highly crystallineanatase. The (101) lattice planes show ad-spacing of 3.57 Å,compared with 3.52 Å for pure TiO2. The lattice fringes of (101)planes on the nanofibers grow along the fiber growth direction,but some also grow perpendicular to the fiber growth axis. Theaverage diameter of the TDT nanofibers is about 5∼ 10 nm.Although TiO2 fibers have been generated by electrospinning,
the fiber diameter is usually over 50 nm.18-21 To further studyif Sn atoms were incorporated into TiO2 lattice, an EDSmeasurement was made through focusing an electron beam intoa ∼ 3 nm diameter spot on the lattice matrix. EDS spectrumindicated a Sn/Ti ratio of 0.10. This further suggests that thehydrolysis of the vapor phase precursors results in atom levelmixing during fiber formation.
The mesoporous silica spheres may be removed by etchingwith 3% HF for 5 min. After removal of most of the silica core,a hollow TDT nanofiber shell structure was generated as shownin Figure 2d. There is a thin shell of silica (confirmed by EDAX)under the TDT nanofibers that holds the hollow sphere together.It can also be observed that TDT nanofibers were shortened by50% owing to etching by HF. Interestingly, the fiber diameterdid not significantly change after HF etching (see Figure S1a).Heating the nanofibers in 1 M HCl at 100°C for 10 h did notaffect the Sn/Ti ratio. However, the Sn/Ti ratio was decreasedfrom 0.15 to∼0.10 after HF treatment. The SEM image as wellas the maps for Ti and Sn for the core shell TDT nanofiberswith a Sn/Ti ratio of 0.1 are shown in Figure 3, which showsthe uniform dispersion of Sn atoms after HF etching. The effectof HF etching on the Sn/Ti ratio also depends on the annealingtemperatures of the TDT nanofibers. When the annealingtemperatures before HF etching were 300, 500, 700, and 800°C, the Sn/Ti ratios after HF etching were 0.06, 0.10, 0.11, and0.11, respectively. In addition, there was still trace Si remainingin the samples, and the Si/Ti atomic ratio was∼5% determinedby EDS. Without annealing, the as-made TDT nanofibers werecompletely dissolved by HF.
The X-ray diffraction (XRD) patterns in Figure 4 reveal achange in the crystalline phase of the TDT nanofibers (Sn/Ti) 0.15) with annealing temperature. The as-made nanofibersare composed of the anatase phase (40°C), which was furtherconfirmed by its TEM image (shown in Figure S2). Increasing
SCHEME 1: Formation Process of Sn Doped TiO2Nanofibers from Mesoporous Silica
Figure 2. TDT nanofibers prepared with a molar ratio of SnCl4 to TiCl4 equal to 1 and annealed at 500°C. (a) SEM, (b) high magnification SEM,(c) HRTEM images before HF etching, and (d) core-shell structure after removal of silica spheres by HF etching.
TiO2 Nanofibers Doped with SnO2 J. Phys. Chem. C, Vol. 111, No. 28, 200710361

the annealing temperature resulted in an increase in all the peaksattributed to the anatase phase and eventually formation of therutile phase. For the TDT nanofibers (Sn/Ti) 0.15), the phasetransformation from anatase to rutile occurred at about 700°C,about 100° higher than that for pure TiO2 (Figure S3) becauseof the introduction of Sn, which hinders the phase transformationfrom anatase to rutile.14a When annealed at 700°C, the TDTnanofibers consisted of 80% anatase and 20% rutile and 40%anatase and 60% rutile for 800°C. The XRD peak ascribed tothe 101 reflection of anatase shifted from ad-spacing of 3.52to 3.57 Å. Similarly, it can be seen that the 110 reflection ofrutile shifted from 3.25 to 3.32 Å. All of these shifts are relatedto the larger radius of Sn4+ as compared with Ti4+, indicatingthat Sn atoms were incorporated into the TiO2 lattice. The unitcell parameters for the Sn/Ti) 0.15 sample were enlarged witha ) 3.820 Å andc ) 10.198 Å as shown in Table 1.
The percent of SnO2 in the TDT nanofibers was varied bysimply changing the molar ratio of the precursors (summarizedin Table 1). The atomic ratio of Sn to Ti in the nanofibers wasdecreased to 0.08 when the molar ratio of SnCl4 to TiCl4 in theautoclave was 0.5, and the unit cell parameters werea ) 3.826Å andc ) 10.04 Å. Increasing the molar ratio of SnCl4 to TiCl4
to 2 resulted in an increase in the Sn/Ti atomic ratio in thenanofibers to 0.19, but the unit cell parameters did not furtherincrease as compared to the sample with a molar ratio of SnCl4
to TiCl4 of 1, which implies that there is a limit for theincorporation of Sn atoms into the TiO2 lattice. Substitution ofTi by Sn in an anatase lattice has been reported up to a limit of10 atom %,22 Beyond this value, SnO2 appeared as a separatedphase. No SnO2 phase was observed in the XRD patterns (FigureS4) of TDT nanofibers prepared with different molar ratios ofSnCl4 to TiCl4.
SEM images of the TDT nanofibers prepared with differentmolar ratios of SnCl4 to TiCl4 are shown in Figure 5. The fiberlength changed with the Sn/Ti molar ratio of the precursors.When the SnCl4/TiCl4 molar ratio was decreased to 0.3, thefiber length was∼3 µm as shown in Figure 5a. Figure 5bdisplays the hollow shell structure obtained after HF etching,and the fiber length was reduced to 2µm. With an increase inthe molar ratio of SnCl4 to TiCl4, the TDT nanofiber lengthdecreased as shown in Table 1. When the SnCl4/TiCl4 ratio was0.5, the fiber length was∼2 µm as seen in Figure 5c,d and∼1µm for a SnCl4/TiCl4 ratio of 2. The corresponding hollow TDTnanofiber shells after HF etching are also shown in Figure 5e,h,where the fiber length was 1µm. Meanwhile, the Sn/Ti atomicratios of the TDT nanofibers after HF treatment were decreasedto 0.03, 0.05, and 0.13, respectively, as shown in Table 1. Whenthe SnCl4/TiCl4 molar ratio in the precursor mixture was 3, onlytrace amounts of fibers formed (Figure S5). A higher molar ratioof SnCl4 toTiCl4 (g3) may result in a greater loss of precursorsduring hydrolysis owing to the lower moisture sensitivity andhigher vapor pressure of SnCl4 versus TiCl4. This may alsoexplain why the fiber length decreased with increasing the Sn/Ti molar ratio of the precursors, and pure SnO2 nanofibers werenot obtained by this approach. Highly crystalline anatasenanorods were revealed in the previous samples by the HRTEMimages shown in Figure 6. Two kinds of growth directions ofthe 101 lattice planes can be observed along and perpendicularto the fiber growth axis. The fiber diameters did not changesignificantly with the SnCl4/TiCl4 molar ratio as expectedbecause of the fixed DAM-1 pore size (2.2 nm) and the constant
Figure 3. SEM image of (a) the hollow shell TDT nanofibers (Sn/Ti) 0.1) and corresponding elemental map for (b) Ti and (c) Sn.
Figure 4. XRD patterns of Sn doped TiO2 nanofibers (Sn/Ti) 0.15)prepared with a molar ratio of SnCl4 to TiCl4 of 1 and annealed atdifferent temperatures.
TABLE 1: Effect of Molar Ratio of SnCl 4 to TiCl 4 on TDT Nanofibersa
atomic ratio of Sn to Tib unit cell (Å)cmolar ratio ofSnCl4 to TiCl4 before HF etch after HF etch
fiber diameterdetermined by TEM (nm)d
fiber lengthdetermined by SEM (µm)d a c
0.3 0.05 0.03 5 to∼10 ∼3 3.812 10.0210.5 0.08 0.05 5 to∼10 ∼2 3.816 10.0391 0.15 0.10 5 to∼10 ∼2 3.820 10.1982 0.19 0.13 5 to∼10 ∼1 3.820 10.198
a TDT nanofibers were annealed at 500°C for 10 h.b Sn/Ti molar ratio in the fibers was determined by EDS measurements using a LEO fieldemission SEM.c Pt was used a reference to calibrate the peak positions.d Without HF etching.
10362 J. Phys. Chem. C, Vol. 111, No. 28, 2007 Xiong and Balkus

hydrolysis conditions. Meanwhile, HF etching did not greatlychange the fiber diameter according to the TEM images (FigureS1b,d).
Photodegradation of Dyes.Although mesoporous TiO2fibers have been produced by electrospinning,23 the photocata-lytic properties fell far below P25 owing to the larger diametersize (∼600 nm) and the collapse of mesopores upon calcination.Side-by-side bicomponent TiO2/SnO2 fibers were fabricated byelectrospinning with an average fiber diameter of 100 nm.13 Thephotodegradation rate of rhodemine B dye on the bicomponentfibers was twice that for the pure TiO2 fibers with a diameterof 50 nm. Cao et al. prepared Sn doped TiO2 nanoparticulatefilms by plasma-enhanced CVD.11 The catalytic activity wasnearly twice as effective as the analogue TiO2 film in thephotodegradation of phenol.24 Similarly, Sn doped TiO2 particleswere reported to be over twice as active as P25 in thephotodegradation of toluene,25 which was further demonstratedin the photodecomposition of methylcyclohexane.26 Sn dopedTiO2 thin films on glass also exhibited better catalytic activityin the photogradation of methylene green than undoped TiO2
films.27 There is precedence for enhanced photocatalytic activityin Sn doped TiO2 systems.
To investigate the effect of Sn substitution in the DAM-1templated TiO2 nanofibers on the photocatalytic properties, theroom temperature photodegradation of MG, MB, indigo car-mine, rhodamine B, and rose bengal was conducted. Themolecular structures of these dyes are shown in Figure 7. Theresults for the photodegradation of MG catalyzed by all samplesare shown in Figure 8. It can be seen that the TDT nanofibersdisplayed faster photocatalysis reaction rates as compared topure TiO2 nanofibers and Degussa P25, which indicated thatthe Sn substitution for Ti can effectively suppress the recom-bination of electron hole pairs and increase photodegradationefficiency. In the absence of a catalyst, the MG dye slowlyphotobleached, but there was only a few percent conversionafter 3.5 h as shown in Figure 8. Out of the four different Sndoped TiO2 nanofibers, the TDT nanofibers with a Sn/Ti atomicratio of 0.10 exhibited the most efficient catalytic activity withcomplete conversion after 60 min. This can be compared to thecommercial P25 catalyst (30 nm TiO2 nanoparticles having a
Figure 5. SEM of TDT nanofibers annealed at 500°C. (a) Prepared with a molar ratio of SnCl4 to TiCl4 of 0.3 before and (b) after HF etching,respectively. (c) Prepared with a ratio of 0.5, (d) with different magnification before etching, (e) after etching. (f) Prepared with a ratio of 0.2, (g)with different magnification before etching, and (h) after etching.
Figure 6. HRTEM images of TDT nanofibers annealed at 500°C before etching and prepared with a molar ratio of SnCl4 to TiCl4 of (a) 0.3, (b)0.5, and (c) 2.
TiO2 Nanofibers Doped with SnO2 J. Phys. Chem. C, Vol. 111, No. 28, 200710363

surface area of∼50 m2/g and an anatase/rutile ratio of 3) andTiO2 nanofibers where complete conversion required more than210 min. Meanwhile, TDT nanofibers exhibited a faster reactionrate than Sn doped TiO2 nanoparticles,27 on which the time tophotodegrade MG was over 100 min under UV light irradiationand over 300 min under visible light irradiation.
Since P25 is a mixture of anatase and rutile, the effect of theannealing temperature of the TDT nanofibers on photodegra-dation activities of MG was investigated. As the annealingtemperature was increased, more of the rutile phase formed.Figure 9 shows the conversion of MG versus time for the TDTnanofibers prepared with a molar ratio of SnCl4 to TiCl4 of 1.Without annealing, the TDT nanofibers were completely dis-solved by HF, so the lowest annealing temperature was 300°C. The TDT nanofibers annealed at 500°C exhibited the bestphotodegradation activity. When the annealing temperatureswere 700 and 800°C, it was found that the degradation rate ofMG decreased due to the formation of the rutile phase, whichis generally less catalytically active than the anatase phase.28-31
The TDT nanofibers annealed at 800°C contain∼60% rutileas compared to P25 (∼25% rutile); however, the activity of theSn doped catalyst is still better. Additionally, for TDT nanofibers
annealed at 300°C, the photodegradation activity was alsodecreased because TDT nanofibers after HF etching have alower Sn/Ti atomic ratio of 0.06, as compared to 0.10 for theTDT nanofibers annealed at 500°C.
In addition to MG, the dyes MB, indigo carmine, rose bengal,and rhodamine B were also investigated as substrates forphotodegradation by TDT nanofibers. As compared to P25 andundoped TiO2 nanofiber shells, the TDT nanofibers exhibiteda better activity in the photodegradation of MB as shown inFigure 10. The time to completely bleach MB was 75 min onthe TDT nanofibers,∼3 times faster than the pure TiO2
nanofibers and P25 catalyst. Figure 10 also shows that the MBdye itself photobleaches to only a minor extent over the courseof the experiment. In comparison, Ag doped TiO2 nanoparticlestook over 180 min to completely photobleach MB.32
Another cationic dye, rhodamine B, was examined. Thecomplete conversion time of the dye was 75 min for TDTnanofibers (Sn/Ti) 0.1) and 170 and 200 min for pure TiO2
nanofibers and P25, respectively, as shown in Figure 11. Thephotocatalytic activity of TDT nanofibers was apparently fasterthan P25 and undoped TiO2 nanofibers. Meanwhile, TiO2nanofibers exhibited a better catalytic activity than P25 after45 min, so it took a shorter amount of time (170 min) to
Figure 7. Molecular structures of methylene green (MG), methylene blue (MB), rose bengal, indigo carmine, and rhodamine B.
Figure 8. Plot of conversion vs time for the photodegradation of MGcatalyzed by P25 and hollow TDT nanofiber shells and hollow TiO2
nanofiber shells annealed at 500°C. (Blue diamonds) P25, (pinksquares) TiO2 nanofiber, (tan stars) TDT nanofiber with Sn/Ti) 0.03,(blue circles) TDT nanofiber with Sn/Ti) 0.05, (red triangles) TDTnanofiber with Sn/Ti) 0.10, and (×) TDT nanofiber with Sn/Ti)0.13.
Figure 9. Plot of conversion vs time for the photodegradation of MGon hollow TDT nanofiber shells (Sn/Ti) 0.1) annealed at differenttemperatures. (2) P25, (pink squares) TDT nanofibers annealed at 300°C, (blue diamonds) TDT nanofibers annealed at 500°C, (tan×) TDTnanofibers annealed at 700°C, and (brown stars) TDT nanofibersannealed at 800°C.
10364 J. Phys. Chem. C, Vol. 111, No. 28, 2007 Xiong and Balkus

completely photodegrade the dye. The photocatalytic activityof the TDT nanofibers was also better than a Sn doped TiO2
thin film,33 which was reported to take over 160 min to finishthe photodegradation of rhodamine B. For side-by-side TiO2/SnO2 fibers, the complete conversion time was reported to be45 min with a UV lamp (254 nm) as the light source.13 However,the light source we used was a water-cooled Hanovia quartzmercury arc lamp with∼65% of the radiation energy falling inthe visible spectrum and∼35% in the UV spectrum.
For the anionic dye indigo carmine, a higher concentration(1.72× 10⁻⁴ M) was used in the photodegradation experimentsas compared to MB (4.62× 10⁻⁵ M) and MG (3.0× 10⁻⁵ M).However, the complete photobleaching time was 40 min forthe TDT nanofibers (Sn/Ti) 0.1) as shown in Figure 12 and75 min for P25 and pure TiO2 nanofibers, which was fasterthan a SBA-15 supported TiO2 catalyst (>140 min).34 Indigocarmine was bleached faster than MB and MG because it isconsidered to be a light sensitive dye,30 where electrons fromthe dye can be excited by visible light and injected into theconduction band of the TiO2, accelerating light harvesting andimproving the photodegradation efficiency. Additionally, thegeneral bleaching rate of anionic dyes is faster than cationic
dyes.30 This was further demonstrated by the photodegradationof another anionic dye, rose bengal, as shown in Figure 13. Ittook only 30 min to completely photodegrade rose bengal forTDT nanofibers (Sn/Ti) 0.1) and 60 min for P25 and TiO2nanofibers.
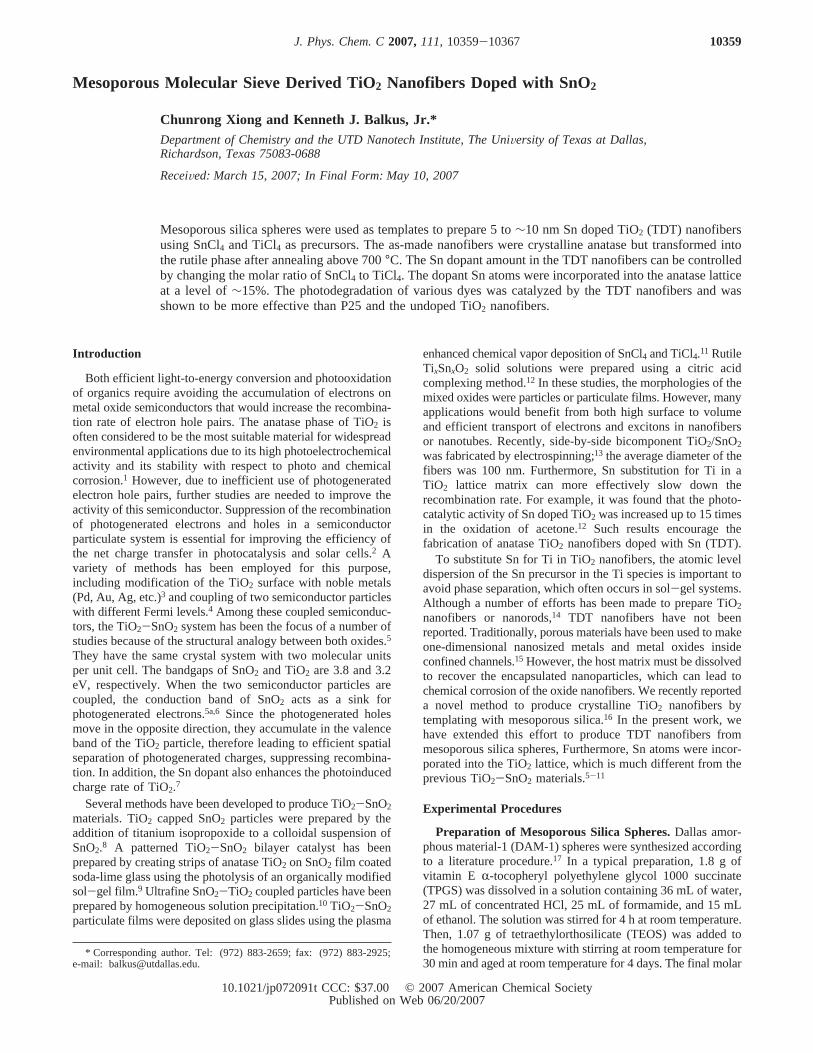
In the previous dye photodegradation experiments, the TDTnanofiber catalysts have a hollow shell structure obtained byHF etching. The catalyst activity for the TDT nanofibers witha Sn/Ti ratio of 0.15 before HF etching (i.e., with DAM-1spheres) in the photodegradation of indigo carmine is shown inFigure 14. To study the differences in photodegradation ef-ficiency, TDT nanofibers before etching were compared withP25 and the hollow shell TDT nanofibers. When the sameweight of catalysts was used, it was found that TDT nanofibersbefore HF etching exhibited poor photoactivity. The activitywas not comparable to 25 mg of hollow shell TDT nanofibersuntil 100 mg of TDT nanofibers with the DAM-1 core intactwas used, which implies that the weight ratio of the TDTnanofibers to the mesoporous template (DAM-1 spheres) issmall. To improve the weight ratio in an as-synthesized catalyst,a mesoporous template with a larger pore volume might storemore of the oxide precursors to produce more TDT nanofibersper unit weight of mesoporous template. It should also be noted
Figure 10. Plot of conversion vs time for the photodegradation ofMB on (blue diamonds) P25, (pink squares) hollow TiO2 nanofibershells, and (red triangles) hollow TDT nanofiber shells (Sn/Ti) 0.1)annealed at 500°C.
Figure 11. Plot of conversion vs time for the photodegradation ofrhodamine B on (blue diamonds) P25, (red triangles) hollow TiO2
nanofiber shells, and (pink squares) hollow TDT nanofiber shells (Sn/Ti ) 0.1) annealed at 500°C.
Figure 12. Plot of conversion vs time for the photodegradation ofindigo carmine on (blue diamonds) P25, (brown triangles) hollow TiO2
nanofiber shells, and (pink squares) hollow TDT nanofiber shells (Sn/Ti ) 0.1) annealed at 500°C.
Figure 13. Plot of conversion vs time for the photodegradation ofrose bengal on (blue diamonds) P25, (brown triangles) hollow TiO2
nanofiber shells, and (pink squares) hollow TDT nanofiber shells (Sn/Ti ) 0.1) annealed at 500°C.
TiO2 Nanofibers Doped with SnO2 J. Phys. Chem. C, Vol. 111, No. 28, 200710365
that the hollow shell of TDT nanofibers can be broken up bymechanical grinding. This may also occur in a stirred reactorwith time. There is no change in activity observed when theTDT nanofiber catalysts are cycled multiple times, which impliesthat there is no little or no change in accessible surface areabetween the fresh hollow sphere catalyst configuration and theused catalyst that likely contains dispersed individual TDTnanofibers after prolonged stirring.
Conclusion
In summary, TDT nanofibers have been successfully madeby impregnation of SnCl4 and TiCl4 in mesoporous DAM-1followed by controlled hydrolysis. TDT nanofibers with adiameter of 5 to∼10 nm have been generated from mesoporoussilica spheres, and a hierarchal structure of a TDT nanofibershell and a mesoporous template core formed. The as-made TDTnanofibers were in the anatase phase but transformed into rutilewhen the annealing temperature was 700°C. The Sn atomsincorporated into the TiO2 lattice matrix effectively suppressedthe recombination rate of the electron hole pairs in thephotodegradation reaction of dyes. The Sn content in the TDTnanofibers was adjustable by changing the molar ratio of SnCl4
to TiCl4, but with an upper limit of∼15%. In the photodegra-dation of dyes, TDT nanofibers exhibited better catalytic activitythan P25 and pure TiO2 nanofibers with an optimum Sn/Tiatomic ratio of 0.1. The TDT nanofibers should have a furtherapplication in the deep mineralization of recalcitrant organics.Additionally, the TDT nanofibers should have the sameadvantages in solar cells, where electron hole recombination isan issue.
Acknowledgment. We thank the Robert A. Welch Founda-tion and SPRING for financial support.
Supporting Information Available: HRTEM and TEMimages and XRD patterns. This material is available free ofcharge via the Internet at http://pubs.acs.org.
References and Notes
(1) (a) Lin, J.; Yu, J. C.; Lo, D.; Lam, S. K.J. Catal.1999, 183, 368-372. (b) Hoffmann, M. R.; Martin, S. T.; Choi, W.; Bahnemann. D. W.Chem. ReV. 1995, 95, 69-96.
(2) (a) Hiroshi, Y.; Shigeo, H.J. Phys. Chem.1989, 93, 4833-4837. (b) Gerischer, H.; Heller, A.J. Phys. Chem.1991, 95, 5261-5267.(c) Gopidas, K. R.; Bohorquez, M.; Kamat, P. V.J. Phys. Chem.1994, 98,3822-3831.
(3) (a) Borgarello, E.; Kiwi, J.; Gra¨tzel, M.; Pelizzetti, E.; Visca, M.J. Am. Chem. Soc.1982, 104, 2996-3002. (b) Martin, S. T.; Morrison, C.L.; Hoffman, M. R.J. Phys. Chem.1994, 98, 13695-13704. (c) Klosek,S.; Raftery, D.J. Phys. Chem. B2001, 105, 2815-2819. (d) Asahi, R.;Morikawa, T.; Ohwaki, T.; Aoki, K.; Taga, Y.Science2001, 293, 269-271. (e) Tahir, M. N.; Eberhardt, M.; Therese, H. A.; Kolb, U.; Theato, P.;Muller, W. E. G.; Schro¨der, H. C.; Tremel, W.Angew. Chem., Int. Ed.2006, 45, 4803-4809.
(4) (a) Stafford, U.; Gray, K. A.; Kamat, P. V.Heterog. Chem. ReV.1996, 3, 77-104. (b) Kamat, P. V.; Vinodgopal, K.Organic and InorganicPhotochemistry; Marcel Dekker: New York, 1998.
(5) (a) Pilkenton, S.; Raftery, D.Solid State Nucl. Magn. Reson. 2003,24,236-253. (b) Chappel, S.; Chen, S. G.; Zaban, A.Langmuir2002, 18,3336-3342. (c) Turrion, M.; Bisquert, J.; Salvador, P.J. Phys. Chem. B2003, 107, 9397-9403. (d) Levy, B.; Liu, W.; Gilbert, S. E.J. Phys. Chem.B 1997, 101, 1810-1816. (e) Vassiliev, Y. S.; Yusipovich, A. I.;Rogynskaya, Y. E.; Chibirova, F. K.; Skundin, A. M.; Kulova, T. L.J.Solid State Electrochem.2005, 9, 698-705.
(6) Stafford, U.; Gray, K. A.; Kamat, P. V.Heterog. Chem. ReV. 1996,3, 77-104.
(7) Jing, L.; Fu, H.; Wang, B.; Wang, D.; Xin, B.; Li, S.; Sun, J.Appl.Catal., B2006, 62, 282-291.
(8) Bedja, I.; Kamat, P. V.J. Phys. Chem.1995, 99, 9182-9188.(9) (a) Hattori, A.; Tokihisa, Y.; Tada, H.; Tohge, N.; Ito, S.; Hongo,
K.; Shiratsuchi, R.; Nogami, G.J. Sol-Gel Sci. Technol.2001, 22, 53-61. (b) Tada, H.; Hattori, A.; Tokihisa, Y.; Imai, K.; Tohge, N.; Ito, S.J.Phys. Chem. B2000, 104, 4585-4587.
(10) Shi, L.; Li, C.; Gu, H.; Fang, D.Mater. Chem. Phys.2000, 62,62-67.
(11) Cao, Y.; Zhang, X.; Yang, W.; Du, H.; Bai, Y.; Li, T.; Yao, J.Chem. Mater.2000, 12, 3445-3448.
(12) Lin, J.; Yu, J. C.; Lo, D.; Lam, S. K.J. Catal.1999, 183, 368-372.
(13) Liu, Z. Y.; Sun, D. D.; Guo, P.; Leckie, J. O.Nano Lett.2007, inpress.
(14) (a) Sui, R. H.; Rizkalla, A. S.; Charpentier, P. A.Langmuir2005,21, 6150-6153. (b) Chae, W. S.; Lee, S. W.; Kim, Y. R.Chem. Mater.2005, 17, 3072-3074. (c) Li, D.; Xia, Y. N.Nano Lett.2004, 4, 933-938.(d) Ding, B.; Kim, C. K.; Kim, H. Y.; Seo, M. K.; Soo, J. P.Fibers Polym.2004, 5, 105-109.
(15) (a) Omer, D.; Ivana, S.; Neil, C.; Geoffrey, A. O.AdV. Funct. Mater.2003, 13, 30-36. (b) Atsushi, F.; Hidenobu, A. Y.; Yusuke, A.; Masaru, I.Nano Lett.2002, 2, 793-795. (c) Shin, H. J.; Ryoo, R.; Liu, Z.; Terasaki,O. J. Am. Chem. Soc.2001, 123, 1246-1247. (d) Coleman, N. R. B.; Morris,M. A.; Spalding, T. R.; Holmes, J. D.J. Am. Chem. Soc.2001, 123, 187-188. (e) Gao, F.; Lu, Q.; Zhao, D. Y.AdV. Mater. 2003, 15, 739-742. (f)Han, Y. J.; Kim, J. M.; Stucky, G. D.Chem. Mater.2000, 12, 2068-2069.(g) Sander, M. S.; Cote, M. J.; Gu, W.; Kile, B. M.; Tripp, C. P.AdV.Mater. 2004, 16, 2052-2057.
(16) (a) Xiong, C. R.; Balkus, K. J., Jr.Chem. Mater.2005, 17, 5136-5140. (b) Xiong, C. R.; Kim, M. J.; Balkus, K. J., Jr.Small2006, 2, 52-55.
(17) Coutinho, D.; Orozio-Tevan, R. A.; Reidy, R. F.; Balkus, K. J., Jr.Microporous Mesoporous Mater.2002, 54, 229-248.
(18) Kim, D., II; Rothschild, A.; Lee, B. H.; Kim, D. Y.; Jo, S. M.;Tuller, H. L. Nano Lett.2006, 6, 2009-2013.
(19) Li, D.; Xia, Y. Nano Lett.2003, 3, 555-560.(20) Onozuka, K.; Ding, B.; Tsuge, Y.; Naka, T.; Yamazaki, M.; Sugi,
S.; Ohno, S.; Yoshikawa, M.; Shiratori, S.Nanotechnology2006, 17, 1026-1031.
(21) Son, W. K.; Cho, D.; Park, W. H.Nanotechnology2006, 17, 439-443.
(22) Aldon, L.; Kubiak, P.; Picard, A.; Jumas, J. C.; Olivier-Fourcade,J. Chem. Mater.2006, 18, 1401-1406.
(23) Madhugiri, S.; Sun, B.; Smirniotis, P. G.; Ferraris, J. P.; Balkus,K. J., Jr.Microporous Mesoporous Mater.2004, 69, 77-83.
(24) Cao, Y.; Yang, W. S.; Zhang, W. F.; Liu, G. Z.; Yue, P.New. J.Chem.2004, 28, 218-222.
(25) Fresno, F.; Tudela, D.; Maira, A. J.; Rivera, F.; Coronado, J. M.Soria, J.Appl. Organomet. Chem.2006, 20, 220-225.
(26) Fresno, F.; Coronado, J. M.; Tudela, D.; Soria, J.Appl. Catal., B2005, 55, 159-167.
Figure 14. Plot of conversion vs time for the photodegradation ofindigo carmine on P25 and TDT nanofibers annealed at 500°C beforeand after removal of DAM-1 spheres. (Blue diamonds) 25 mg of P25,(pink squares) 25 mg of TDT nanofibers after removal of DAM-1spheres, Sn/Ti) 0.1, (tan stars) 25 mg of TDT nanofibers beforeremoval of DAM-1 spheres, Sn/Ti) 0.15, (orange×) 75 mg of TDTnanofibers before removal of DAM-1 spheres, Sn/Ti) 0.15, and (browntriangles) 100 mg of TDT nanofibers before removal of DAM-1 spheres,Sn/Ti ) 0.15.
10366 J. Phys. Chem. C, Vol. 111, No. 28, 2007 Xiong and Balkus

(27) Arpac, E.; Sayılkan, F.; Asiltu¨rk, M.; Tatar, P.; Kiraz, N.; Sayılkan,H. J. Hazard. Mater.2007, 140, 69-74.
(28) Watanabe, T.; Nakajima, A.; Wang, R.; Minabe, M.; Koizumi, S.;Fujishima, A.; Hashimoto, K.Thin Solid Films 1999, 351, 260-263.
(29) Kominami, H.; Murakami, S.; Kato, J. I.; Kera, Y.; Ohtani, B.J.Phys. Chem. B2002, 106, 10501-10507.
(30) Epling, G. A.; Lin, C.Chemosphere2002, 46, 561-570.
(31) Sumita, T.; Yamaki, T.; Yamamoto, S.; Miyashita, A.Appl. Surf.Sci.2002, 200, 21-26.
(32) Senthilkumaar, S.; Porkodi, K.; Gomathi, R.; Maheswari, G. A.;Manonmani, N.Dyes Pigm.2006, 69, 22-30.
(33) Zheng, S. K.; Wang, T. M.; Hao, W. C.; Shen, R.Vacuum2002,65, 155-159.
(34) Ding, H. M; Sun, H.; Shan, Y. K.J. Photochem. Photobiol., A2005, 169, 101-107.
TiO2 Nanofibers Doped with SnO2 J. Phys. Chem. C, Vol. 111, No. 28, 200710367