mergers, acquisitions and capital raising in mining and … · americas mining & metals...
TRANSCRIPT

Mergers, acquisitions and capital raising in mining and metals2013 trends2014 outlookChanging gear

About this study• The data is primarily sourced from ThomsonONE.com.• Unless otherwise stated, all values are in US dollars.
Mergers and acquisitions (M&A)• Only completed deals are included. Deals identifi ed as
incomplete, pending, partly incomplete, conditional or intended as of 31 December 2013 were excluded.
• The acquirer country is based on the ultimate owner’s geographic headquarters. The target country is determined by where the primary targeted asset or company is located.
• Country-based refers to domestic and inbound deals.
• A country’s acquisition refers to domestic and outbound deals.
• Commodity analysis is based on the company’s primary commodity focus.
• The value of M&A activity by commodity includes deals where the given commodity is the acquirer and/or target’s primary commodity. Commodity charts illustrate the value of deals where the given commodity is the target.
• The data does not capture the value of transactions where this information is not publicly available.
• “Megadeals” refer to all deals with a value equal to, or greater than, $1b.
Capital raisingThe primary source for this data is ThomsonONE. Certain details have been supplemented with information from company and stock exchange websites and major business press. Only completed transactions are included.
• Only original Initial Public Offerings (IPOs) — the fi rst time that a company issues equity to the public — are included in the IPO analysis. Proceeds are allocated to the primary exchange of listing.
• Equity issues are geographically categorized by the primary exchange where the issuer’s stock trades, except where stated. Where a company offers Global Depositary Receipts or American Depositary Receipts, the issue is allocated to the destination market of those shares.
• Loan data and proceeds include refi nancing and amendments to existing debt, and are as per ThomsonONE intelligence. Proceeds are allocated to the geography of the borrower.
• All credit rating references are to Standard & Poor’s long-term issuer ratings, unless otherwise stated.
Notes on the data:
Note: The data is primarily sourced from ThomsonONE, $ refers to US dollars.

This EY study examines transactions and fi nancing in the mining and metals sector in 2013, and discusses the outlook for 2014.
It provides an in-depth analysis of the major global mining and metals transactions, capital markets and resulting capital fl ows, by considering mergers and acquisitions (M&A), initial public offerings (IPOs), secondary equity offerings, bonds and loans. It also provides an analytical breakdown by commodity.
Mergers, acquisitions and capital raising in mining and metals — 2013 trends, 2014 outlook

This report was authored by:
And thank you to the EY Global Mining & Metals team for their support.
Lee DownhamGlobal Mining & MetalsTransactions LeaderTel: +44 20 7951 [email protected]
Robert StallAmericas Mining & Metals Transactions LeaderTel: +1 404 817 [email protected]
Jodie EldridgeM&A Analyst, Mining & Metals Tel +61 2 9248 4423 [email protected]
Mike ElliottGlobal Mining & Metals LeaderTel: +61 2 9248 [email protected]
Kunihiko TaniyamaJapan Mining & Metals Transactions LeaderTel: +81 3 4582 [email protected]
Nicky CrabtreeAssistant Director, Mining & MetalsTransactions Advisory ServicesTel: +44 20 7951 [email protected]
Emily ColborneStrategic Analyst, Mining & MetalsTel: +44 121 [email protected]
Celeste van der WaltSenior Researcher, Mining & MetalsTel +27 11 772 3219 [email protected]
Paul MurphyAsia-Pacifi c Mining & MetalsTransactions LeaderTel: +61 3 9288 [email protected]
Contents ThemesExecutive summary 6Spotlight: Alternative fi nancing 10Q&A with Silver Wheaton Corp. 14Spotlight: The window of opportunity 18Mergers & acquisitions 22Capital raising 32Outlook 40
Commodity analysisAluminium 44Coal 46Copper 48Gold 50Iron ore 52Nickel 54Potash/phosphate 56Silver/lead/zinc 58Steel 60Uranium 62

6 | Mergers, acquisitions and capital raising in mining and metals
2013: A year of calibration and repositioningWe look back at 2013 as an infl ection point, a year when management and investors fi nally came to terms with a new investing paradigm.
The extreme price volatility and rapid changes to the global economy that defi ned 2012 persisted through 2013.Year-end reporting announcements were littered with headlines of impairments and recriminations that forced changes in strategy and senior management across many of the industry’s participants during 2013.
As a result, we saw investing activity contract during 2013, where the risks were just too great given the moving base on which decisions needed to be made. Acquisition plans were not supportable and as a result, few deals were pursued. As the year progressed, even divestment plans were scaled back as it became clear that price expectations could not be met, and as balance sheets became less stressed due to refi nancing and stronger cash generation in the second half of the year.
2013 marks the tipping point for the sector, with many investors calling it the bottom of the market. This investment “inertia” is clear in the underlying deal volumes and values for the year,
which, excluding the all-share merger of Xstrata and Glencore International, were down 25% and 16% year-on-year (y-o-y) to 702 and $87.3b, respectively.
Capital raising followed a similar trend, with only a 9% increase in total proceeds to $272b, largely due to some exceptional loan refi nancings, and a 9% decrease in the total volume of issues to the lowest level seen since 2008. There were few new investments in the sector and the bulk of capital raised during 2013 is being used to refi nance existing facilities.
This pull-back in risk capital hit the junior sector hardest, with equity markets providing little support. Proceeds from secondary issues by juniors fell 43% y-o-y (from an already low base) with an inevitable tightening of global exploration spend. Investors are looking for low risk, near-term, high-yield opportunities, which the early-stage junior mining sector cannot offer at present. To bridge this gap, alternative capital raising options provided some reprieve but did not satisfy the level of capital being demanded across the sector.
However, the continued rise of private capital in the sector, including the increased share of total M&A undertaken by fi nancial investors (by value) from 5% in 2012 to 19% in 2013, supports the view that 2013 marks the tipping point for the sector, with many of the providers of such capital calling the bottom of the market.
Executive summary
2003 2004 2005 2006 2007 2008 2009 2010 2011 2012 2013*Volume 475 596 564 701 903 919 1,047 1,123 1,008 941 702Value ($m) 46,182 26,350 65,430 175,713 210,848 126,884 60,035 113,706 162,439 104,014 87,309 Average value ($m) 97 44 116 251 233 138 57 101 161 111 124Median value ($m) 4.4 3.1 4.8 6.2 7.2 6.0 3.2 5.2 5.6 5.0 3.8
Volume and value of deals (2003-2013)
*Excluding the merger between Glencore International and Xstrata (the “Glencore Xstrata merger”)

Mergers, acquisitions and capital raising in mining and metals |
Deal inertia drives M&A activity down2013 marked the third consecutive year of declining M&A activity in the mining and metals sector: deal volume dropped 25% y-o-y. While the value of deals increased by 20% to $124.7b, this increase was primarily due to the completion of the Glencore Xstrata merger. Excluding this deal, value decreased 16% to $87.3b, highlighting the contraction in investment spend across the sector during 2013.
Although there were notable exceptions, such as First Quantum Minerals’ acquisition of Inmet Mining, the majority of deals that completed in 2013 were largely smaller, low-risk acquisitions fueled by a desire to increase an existing stake, achieve domestic or inter-regional consolidation, or a strategic attempt to secure future supply.
As diversifi ed mining companies seek to optimize portfolios, many of the industry’s large producers announced signifi cant divestment progams. During 2013, the industry’s top fi ve diversifi ed mining majors completed $6.3b1 of divestments, while $5.5b of deals have been agreed and are expected to complete during 2014, with the Las Bambas divestment by Glencore Xstrata being the last major
1. This includes the $1.8b sale of Vale’s Norsk Hydro shares, which falls outside of the M&A data within this report.
7
divestment still in the process of fi nding a buyer. This activity, together with other rationalization measures and an upturn in iron ore prices toward the end of 2013, has taken the pressure off earnings and balance sheets, easing the pressure to divest.
Although the successful exit of many divested assets suggests deals are there to be done, there is strong evidence that a gap remained between the valuation expectations of buyers and sellers during 2013. Intensifi ed volatility in metals prices continues to drive a disparity in asset valuation expectations and, as a consequence, buyer and seller differing views on price remain a drag on M&A activity.
The opportunity for fi nancial investors continuesThe year in review proved to be of great opportunity for fi nancial investors who increased their share of total M&A value from 5% in 2012 to 19% in 2013. These investors can act counter-cyclically, attracted by the prospect of potentially strong returns driven by low asset valuations.
“2013 was a year of calibration and repositioning. Those mining companies who
had a change of leadership refreshed their strategies and focused on productivity and
capital optimization rather than pursuing M&A. Across the sector we saw the capital
raising environment tighten for those without an investment grade credit but,
looking forward, we expect to see a steady improvement in market conditions.”
Lee DownhamMining & Metals Global Transaction Advisory Services Partner
UKI
Capital raising by asset class - proceeds $b (2007-2013)
2007 2008 2009 2010 2011 2012 2013 ChangeIPOs 21,400 12,406 2,987 17,948 17,449 1,388 815 -41%Follow ons 66,802 48,751 73,806 49,705 49,745 25,950 26,233 1%Convertibles 12,865 12,238 14,431 5,477 2,365 3,537 7,738 119%Bonds 36,358 38,146 61,016 72,502 83,804 112,539 87,890 -22%Loans 110,787 171,691 62,420 183,875 187,059 105,981 148,881 40%Total 248,212 283,232 214,660 329,507 340,422 249,394 271,557 9%

8 | Mergers, acquisitions and capital raising in mining and metals
Financial investors (including sovereign wealth funds) undertook fi ve of the 19 megadeals (>$1b) in 2013: Lizarazu’s and Receza’s joint $3.6b investment in Polyus Gold International; investments in Uralkali by Onexim Group ($3.5b) and Chengdong Investment Corp ($2b); Samruk-Kazyna’s $1.7b investment in Kazzinc; and Crispian Investments’ $1.5b investment in Norilsk Nickel.
Other smaller deals of this nature included B&A Mineração, a venture headed by the former CEO of Vale Roger Agnelli, and Grupo BTG Pactual’s joint purchase of Rio Verde Minerals Development Corp for $36m. In addition, Mick Davis (Former Xstrata CEO) announced his intention to establish X2 Resources, while Aaron Regent (former CEO of Barrick Gold Corp) formed investment company Magris Resources, demonstrating the growing relevance of mining-focused private capital.
So, while 2013 will be known as the year in which this capital was raised, the infl ection we now see in the market is likely to mean that 2014 is the year when we start to see this capital being deployed.
Debt refi nancing driving an improvement in balance sheet strengthAlthough bank lending increased 40% y-o-y to $149b, this headline includes a large refi nancing of $17.3b by Glencore Xstrata — reportedly the largest corporate loan refi nancing in any sector in Europe for over fi ve years.
About half of the total loan proceeds were amendments, increases and extensions to existing credit agreements, with only $33b of lending coming in the form of new agreements for project fi nancing, acquisitions and capital expenditure.
A total of $74b of the refi nancing completed in the year was largely refi nancing on improved terms, which pushed out maturities and lowered yields to strengthen balance sheets. Average spreads on non-leveraged loans narrowed to 147bps in 2013 from 174bps in 2012. Intense competition among banks to secure relationships with industry heavy-weights meant that investment grade borrowers attracted greater fl exibility and, in some cases, better pricing, than corporate bonds could offer.
Syndicated project fi nance that closed in 2013 reached $13.4b, up from $5b in 2012. The largest fi nancings went to steel and aluminium projects in India and the Middle East, respectively. A small number of iron ore, gold and base metals mines in Africa, South America and Australia also attracted project fi nance on a smaller scale. Although this increase is well below 2011 levels, it is a move in the right direction. This positive indicator, coupled with greater competition from banks to fund the industry’s advanced and de-risked projects, supports a stronger appetite for lending going into 2014.
Convertible loans providing a rare source of capital for exploration and development companiesConvertible bond raisings experienced a 32% increase in volume and a massive 119% increase in proceeds, albeit from a low base in 2012.
Share of deal value by acquirer type (2011-2013)
Industry acquirersState-backed acquirersOther sectors
Financial investorsCommodity tradersUndisclosed
0% 20% 40% 60% 80% 100%
2011
2012
2013*
*Excluding the Glencore Xstrata merger
-2468
10121416
-20406080100120140160
Proceeds Number
Proc
eeds
($b)
Num
ber
2000
2001
2002
2003
2004
2005
2006
2007
2008
2009
2010
2011
2012
2013
Convertibles became increasingly popular in 2013 as investors could secure coupon rates comparable with those of vanilla high-yield bonds, thereby effectively receiving free options as an inducement. This bucked the historical trend of issuers paying lower coupons to compensate for the potential equity dilution. The average coupon paid in 2013 was 9%, with one issue offering 22.5%. This partly refl ects the high proportion of early-stage,

9Mergers, acquisitions and capital raising in mining and metals |
unrated and therefore higher risk companies that are issuing convertibles, and in some cases are prepared to accept the highly dilutive equity valuations in the absence of many alternatives. As a result, any lack of confi dence in the upside potential of the share price is compensated for by the high yield that investors receive for the debt component.
Outlook - long term health in the balanceThe mining and metals sector is entering 2014 with a more positive outlook: confi dence in the global economy is improving, companies have taken action to deleverage balance sheets and the industry-wide focus on productivity and effi ciency should begin to yield results. As a result, we expect the gradual strengthening of mining and metals equity valuations to continue and the increased availability of capital.
However, continued economic volatility is also expected in 2014 due to Eurozone economics, Chinese economic rebalancing and US Federal Reserve policies regarding the tapering of quantitative easing. As supply and demand struggle to return to post-supercycle equilibrium, we expect further price volatility to occur for at least the next two years. This will see caution prevail: any uplift in M&A activity and improvement of capital raising conditions will be gradual and will require innovation in pricing to tame volatility.
Conditions in the bond markets are likely to tighten if global interest rates begin to rise should quantitative easing begin to taper. “We expect to see a greater proportion of the sector’s funding to come from equity through follow-on raisings, although a widespread return to equity will require a return of confi dence at the top of the industry along with some high profi le success stories among junior developers. If this occurs, it should translate into optimism and risk-taking at the bottom,” said Lee Downham, Mining and Metals Global Transaction Advisory Services Partner, UKI.
Similarly, we are seeing strong appetite from debt providers, with increased competition among banks likely to improve access to leveraged loans for quality mid-tier mining companies and developers. However, given the strict criteria applied by these investors, it is questionable if the availability of these funds will support industry needs in their entirety.
We expect growth in M&A activity during the fi rst half of the year to be driven by fi nancial investors and equity-backed alternative capital providers as outlined in our Spotlight section: Alternative fi nancing. This growth will not only be driven by anticipated longer term commodity price recovery but also by the application of in-house technical experience to drive operational, technical and
The Capital AgendaBased around four dimensions, the capital agenda helps mining and metals companies consider their issues and challenges and understand their options to make more informed capital decisions.
1. Preserving capital: reshaping the operational and capital base
2. Optimizing capital: driving cash and working capital and managing the portfolio of assets
3. Raising capital: assessing future capital requirements and assessing funding sources
4. Investing capital: strengthening investment appraisal and transaction execution
How organizations manage their capital agenda today will defi ne their competitive position tomorrow.
EY works with clients to help them make better and more informed decisions about managing capital and transactions strategically in a changing world. Whether you are preserving, optimizing, raising or investing capital, EY’s Transaction Advisory Services brings together a unique combination of skills, insight and experience to deliver tailored advice attuned to your needs — helping you drive competitive advantage and increased shareholder returns.
fi nancial infl uence. This has the potential to be the most exciting story of 2014. Will we see the deployment of capital so feverishly raised during 2013? And, if so, will it begin to drive new investment activity across producers?
With low levels of new capital and new investment, the mining sector may well be sowing the seeds for the next boom as supply falls short of demand. Will fi nancial investors, private capital and other counter-cyclical investors be able to fi ll this capital shortfall in 2014? It is EY’s view that a more patient form of capital creation is essential for the sector’s long-term health. This capital will be required to both replace the “hot money” that has been leaving the sector, as short-term returns fall from their record level, and provide capital for the next projects required to restore extinguishing supply or meet future demand growth.

10 | Mergers, acquisitions and capital raising in mining and metals
Alternative fi nancingThe majors found little diffi culty in securing funding through traditional means (primarily the debt markets) in 2013. But with equity markets increasingly taking a short-term view, juniors are necessarily looking for alternatives.
Spotlight
Lack of confi dence in the industry’s ability to yield satisfactory near-term returns has resulted in a dramatic pull back in public equity funding to the sector. Further, efforts by the majors to restore that confi dence, including through a focus on optimizing existing assets, have resulted in a slowdown of buying or investing on their part, particularly in long-lead exploration.
With much of the industry focused on optimization, it should be of little surprise that funding sources designed to achieve just that have seen an increase in demand. Streaming and royalty agreements aim to unlock incremental value through the monetization of non-core metals production; hence we are seeing the streaming model evolve and grow in tune with the current needs of the industry.
Further, a lack of clear consensus over the near-term direction of commodity prices – and more importantly, whether the bottom of the latest cycle has been reached – continues to inhibit the wholesale return of both public equity and industry-led M&A. But equally, this impasse has created exceptional opportunities for
capital providers with confi dence, patience and fi nancial capacity to take a long-term view on the sector, whether from an investment returns or supply security perspective.
Known brands, new vehiclesIn the private sphere, where arguably greater freedom exists to take such a view, veteran industry expertise is combining with private equity to inject capital into the sector through strategic acquisitions. Some examples include:
• X2 Resources, led by ex-Xstrata CEO Mick Davis and backed by TPG and Noble Group
• B&A Mineração, the venture of Roger Agnelli (ex CEO of Vale) and BTG Pactual
• QKR Corporation, the fund headed by ex-JP Morgan Chase banker Lloyd Pengilly, with Andre Liebenberg (former BHP Billiton), and backed by a consortium of investors including Qatar Holdings
• Magris Resouces, the fund set up by Aaron Regent (ex CEO of Barrick Gold Corp)

11Mergers, acquisitions and capital raising in mining and metals |
In addition, Resource Capital Funds, a mining-focused private equity (PE) fi rm, has $2.04b of committed capital in its latest fund to invest in the mining sector. This represents an estimated $4.6b of capital deployed – or waiting to be deployed - by this group alone.
The traditional private equity model has historically played a relatively small role in the upstream mining sector, but depressed valuations have increased speculation that this trend may change. However, while there may be discrete deals of this nature, with traditional PE looking at specifi c deals, our view is that “private capital” funds, of the type described above, are the ones that will be most active in the sector. These investors are deploying patient capital, adopting a longer-term investment horizon and seeking to establish a robust operational structure that supports margin-led growth, rather than pursuing the strategy of “growth for growth’s sake” which characterized industry growth over the previous decade. For mainstream PE, it is about backing the right management and funding an asset with short-term exit potential; those types of opportunities are few and far between. Strategic offtakers, such as state-backed entities and commodity traders, typically have greater private visibility over their particular near- and long-term demand picture through their customer base. This gives them the confi dence to invest now to secure future supply.
Exploration in crisisEarly-stage exploration companies have historically relied on public equity markets for funding. However, challenging market conditions mean that few institutional investors are prepared to take a risk on early stage investment and few companies are keen to issue further shares at such low valuations. As a result, explorers are left with few options: cancel exploration programs to preserve precious cash resources; or seek “last resort” fi nancing options that typically delay the dilution impact but of course come at a cost. Consequently, there has been both a dramatic decline in exploration expenditure over 2013,2 and an increase in the pursuit of equity-linked fi nancing options, such as standby-equity agreements and convertible instruments. Risk capital is unlikely to be available on a large scale in 2014, but there is an increasingly large pool of family offi ces, private equity providers and venture capitalists that provide early-stage seed funding, often linked to certain conditions and achievement of project milestones. However, access to this group of investors can be challenging, given the private and highly selective nature of their investments.
2. “SNL Metals Economics Group’s 24th Corporate Exploration Strategies estimates worldwide exploration budgets to fall 29% to $15.2b in 2013,” SNL Metals Economics Group press release, 24 October 2013.
“Alternative fi nance, while not a new phenomenon, has increasingly become mainstream in 2013. Unsupportive, “short-termist” equity markets have spawned a greater variety of funding structures and capital providers at a time of critical need among the industry’s advancing juniors.”
Michael ElliottGlobal Mining & Metals Leader
Australia

12 | Mergers, acquisitions and capital raising in mining and metals
Evolving landscapeDifferent fi nancing options are suited to particular stages of the development cycle and critically to the individual needs of the asset, each with their own risks and costs attached. Companies today typically require non-dilutive, committed, fl exible, value-accretive funding options where investor objectives are aligned with the long-term goals of management. Portfolio funding approaches are often adopted by advancing companies as a means of managing risks and costs.
Importantly, funding options are becoming increasingly fl exible and innovative in their structure, evolving to meet the changing demands of the industry. Streaming agreements form such an example: Vale’s landmark $1.9b agreement with Silver Wheaton Corp marked a step change in the scale and scope of streaming deals.3 For insights into Silver Wheaton Corp’s investment strategy, refer to the Q&A with Randy Smallwood, President & Chief Executive Offi cer, and Gary Brown, Senior Vice President & Chief Financial Offi cer, Silver Wheaton Corp.
Streaming represents a non-dilutive, non-controlling means of securing upfront capital and unlocking value, typically from non-core production. However, no form of fi nancing is without its costs and limitations. Streaming agreements limit the project owner’s future exposure to the streamed metal, and potentially impact a project’s margins once in production, through the loss of by-product credits. Further, Standard & Poor’s (S&P) has recently announced its decision to treat streaming agreements as debt (under prescribed circumstances), which may deter leveraged producers from undertaking streams. Other rating agencies, including Moody’s, have not followed suit, so the extent to which this move by S&P will inhibit the growth of streaming in 2014 remains to be seen.
The focus of stream providers remains typically on producing and near-producing assets that present low political risk, and suffi cient operating margins and earnings stability to deliver throughout cycles. However, earlier stage options, such as the “early deposit” structure agreed upon by Silver Wheaton and Sandspring Resources in November 2013,4 are also emerging.
3. “Silver Wheaton acquires gold streams from Vale’s Salobo and Sudbury Mines,” Silver Wheaton Corp press release, 2 May 2013.4. “Silver Wheaton completes early deposit gold stream agreement with Sandspring Resources,” Silver Wheaton press release, 11 November 2013.
Streams have arguably been the story of 2013, although their contribution to the overall sector funding remains small: we estimate that about $2.4b of upfront capital was injected into the sector via streams in 2013. However, this is not to downplay its importance. While relatively small compared with traditional bank lending, project fi nance and equity, streaming as a form of alternative fi nance has become signifi cant, dwarfi ng the level of investment into the sector from standby equity distribution agreements (SEDAs) or royalties, for example.
Future of alternative fi nancingJust as many of the structures described above have been around for a long time, so they are likely to remain an important component of mining industry funding, going forward. The return of equity markets for early exploration should limit the need for higher cost alternatives, but we believe this may be some way off. If we are adapting to a “new normal” of steadier demand growth and increasing supply complexities, there will be an ongoing need for countercyclical, long-term investment approaches that sustain industry growth through inevitable periods of volatility.
Demand is only one side of the equation; supportive conditions would need to persist for fi nance providers to be able to secure and provide capital on attractive terms. Circumstances in 2013 have given rise to an environment of low confi dence among the many and high confi dence among the few – translating into the potential for opportunistic buying at depressed valuations.
We expect these circumstances to persist through 2014: the window of opportunity for private capital investment is clearly now and capital is ready and waiting to be deployed, albeit only to the best projects and teams. There are signals that juniors are adapting and responding to the changing funding environment - from better management of expectations, scaling back of project plans, and careful cost management, to better “storytelling.” As a result, in 2014, we expect to see continued strong growth in alternative fi nancing to the industry.

13Mergers, acquisitions and capital raising in mining and metals |
Note: Stages refer to exploration, development, construction, production.
Alternative fi nancing options utilized in 2013
Type Typical structure Benefits/drawbacks to company Example providersStage
E D C P
Standby equity agreements
Deferred equity and equity-backed loans. Option to issue shares to the provider over a multi-year period, at the issuer’s discretion.
Issuer is in control of timingDelayed dilution can adversely impact liquidity and share price
• YA Global• Darwin Strategic• Dutchess Opportunity Cayman Fund
Earn-in agreements
Partner (often a major) funds exploration activities over a specified time period, thereby earning the right to a pre-determined share of project ownership.
Ability to progress exploration projectsPotential exit optionExit risk – earn-in partner can elect notto continuePotential dilution
Development finance
Loans, strategic equity and convertibles. Banks may offer ancillary services (e.g., community engagement strategies, environment and social risk management).
Strong vote of confidence in the project and managementStringent environmental and social requirements; extensive diligence required
• International Finance Corporation• China Development Bank• European Bank for Reconstruction
and Development• International Development Corp of
South Africa
Offtake Terms vary but typically include exclusive right to percentage of future production. Can, but may not, include advance payment. Can be structured as take-or-pay.
Guaranteed source of demandOften a requirement for project financeCan include minimum stipulations – e.g., minimum price and volume, hedging
• Strategic state buyers• Private capital – e.g., Red Kite, Blackrock• Banks• Customers• Traders
Equipment/EPCM Equipment leasing agreements and project investment by equipment/service providers. Typically include operating leases, sale and lease-back, hire purchase, secured term loans, RCFs, asset-based inventory financing and equity investments.
Can reduce capital outlays at construction phaseSupply chain default risk - financial and legal due diligence required
• Equipment suppliers or EPCM• contractors – e.g.,• GE Capital• Macquarie Bank• Caterpillar Financial Services• Standard Bank
Royalties Upfront payment in return for a percentage of either future revenues or profits, or the value of the product produced
Long-term, passive investments – no dilutionNo interest costsPayments must be made – regardless of future profitabilityReduces future cash flows
• Royal Gold• Franco-Nevada• Premier Royalty• Anglo Pacific Group• Callinan Royalties• American Bullion Royalties• Royalco Resources• Gold Royalties Corp
Streams Upfront payment plus ongoing payments in return for a right to a percentage of production from an identified asset (usually life-of-mine). Typically precious metals by-product.
No equity dilution or interest costsRetain operational controlMonetization of non-core productionOngoing payments designed to cover cost of productionS&P treats as debt (fromNovember 2013)Terms need to be carefully negotiatedLoss of by-product credits
• Silver Wheaton• Franco-Nevada• Royal Gold• Sandstorm Gold• Sandstorm Metals + Energy
Alternative fi nancing options The table below outlines some of the options that are being adopted by mining and metals companies in the current environment. These options are explored in more detail in EY’s contributions to Mining Journal’s “Global Mining Finance Guide 2014.”

14 | Mergers, acquisitions and capital raising in mining and metals
Q&A
President & Chief Executive Offi cerRandy Smallwood
Senior Vice President & Chief Financial Offi cerGary Brown
Interview
With major producers under pressure from shareholders to pull back capital investment, combined with slow equity markets for developers, timing seems perfect for patient, counter cyclical investors such as Silver Wheaton. Do you agree, and how long do you see this “window of opportunity” being open for investors like Silver Wheaton?
“I think we’ve proven that this model works across the cycle. The current state of the industry in terms of reduced capital spending, lack of equity support and a challenging debt environment has made this market about as good as it can be for us and created all sorts of investment opportunities for us.
We always compete as a source of capital against debt and equity and in most markets we provide an attractive form of capital with one of the key characteristics being the unlocking of hidden value.
The feeling we get is that we are close to the bottom. We see fourth quartile producers hurting, and marginal projects cancelled or put on hold. In the precious metals space, we really feel that commodity prices cannot go down much further because it’s driving supply side pressure, so it’s only a matter of time before it starts moving up again.
On the demand side of the equation, there is a continued appetite for metals out there, which will apply upward pressure on commodity prices, so I am hopeful that by the end of this year we will start seeing a move back up off the low price environment that we are in right now.
I have been in the industry for close to 30 years now and it’s amazing how many times the experts can be wrong with respect to predicting commodity prices. You have to rely on your intuition to a certain extent, but more importantly, you need to focus on making good long term investments that are able to withstand the short term fl uctuations in commodity prices.” Randy Smallwood
Given the desire among many investors in major producers to reduce invested capital, do you see a greater opportunity for Silver Wheaton to come into some of these large assets through a streaming arrangement?
“I think that we have already touched upon the point that equity investors have defi nitely pulled back from this space, so the availability of capital from equity investors has defi nitely been reduced over the last 12 months. That in itself creates an opportunity for competing forms of capital like metal streaming. On the debt side, the companies that can attract debt are generally trying to reduce the fi nancial risk in their capital structures and that combination does create a more favorable environmental for metal streaming.

15Mergers, acquisitions and capital raising in mining and metals |
with Silver Wheaton Corp.the operating margins of the asset. We want mines that will deliver product to us through both the highs and the lows of the commodity price cycles. We have been in the industry long enough to know that commodity prices are cyclical and so the fi rst criteria that we look at is where the mining operation is expected to fall relative to the respective cost curve for the primary metal being mined. We are very focused on making investments in operations that lie in the bottom half of their respective cost curves.
To expand on that a little bit, if it is a copper mine that has silver or gold by-product production, we look at the copper cost curve and determine where this asset fi ts relative to all the other copper mines in the world, and we’ll be interested in the assets at the bottom half of the cost curve because those are the ones that will continue to operate and deliver through highs and more importantly through the lows of the commodity price cycle. It’s the fourth quartile and some third quartile producers that suffer and sometimes have to shut down during the lows of the commodity prices.
When we look at our existing portfolio, about 90% of our production comes from assets in the bottom half in the respective cost curves. With a portfolio that is comprised of 24 different assets, 19 in operation and 5 at various stages of development, to have that high a concentration in the bottom half of the cost curve, we would argue, it is one of the highest quality portfolios in the mining industry.” Randy Smallwood
And what about management, how important are good management teams to your investment decision?
“We are very focused on making sure that we invest into good partners, but one of the things we always have be sensitive to, is the fact that we do not select the management. So although these mines may have expert management right now, we do not know who is going to be operating these mines fi ve years from now. We do not have that control. Management is very important to us, and we work with strong partners but we also want assets that are able to withstand weak management and changes in management.
And so, again, that’s one of the objectives of being down on the bottom half of the cost curve, it gives it some capacity to withstand whatever gets thrown at these assets including political risks, tax changes, low commodity prices and poor management - we want to make sure that they are strong enough to withstand the impact of all of those.” Randy Smallwood
While there have been capital spending cuts, a lower commodity price environment results in less operating cash fl ow being generated by mining companies to fund capital projects that have not been cancelled. As a result, there is still signifi cant demand for capital in this space.” Gary Brown
And how about assets which are already in production, where a release of capital via a streaming agreement is being considered. Do you see an increase in those types of transactions?
“I think there is a bit of a paradigm shift happening in the mining industry in general. Historically mining companies have focused on growth without necessarily focusing on return on invested capital. And now I see there being a higher focus on generating returns on invested capital. With streaming’s ability to unlock value and reduce the mining company’s equity exposure to a particular project, I think that does open up additional opportunities to us.” Gary Brown
You have often been quoted as saying that a streaming arrangement creates shareholder value for both the streamer and the seller. Why do you think this is?
“There are two principal areas that highlight that value for shareholders:
Firstly, precious metal companies typically have a lower weighted average cost of capital than base metal companies and hence precious metals that are hidden within a base metal asset typically wind up getting valued with a higher weighted average cost of capital. So when you bring them into a precious metal company like Silver Wheaton, they have a lower weighted average cost of capital resulting in a higher net asset value.
In addition, precious metal companies tend to trade at higher market multiples than base metal companies, so when you take silver from a base metal company and bring it into a precious metals company, there is a creation of value there. This arbitrage was really the founding principle when we created Silver Wheaton back in 2004.
So those two characteristics haven’t changed through the commodity price cycles - precious metal companies continue to trade at better multiples and they have better access to capital than base metals companies.” Randy Smallwood
What are the key characteristics of an investment for Silver Wheaton, and is there anything that is absolutely critical for you to consider investing?
“In terms of us selecting a mine and making that investment into a mine, the key is the quality of the asset itself, specifi cally

16 | Mergers, acquisitions and capital raising in mining and metals
Risk aversion is driving many investors into safer, more developed mining districts. Do you see Silver Wheaton following this trend, or are emerging markets a key focus for you?
“Yes, we have always been and continue to be focused on assessing all the risks inherent in a potential investment opportunity, including assessing political risk.
When you look at our current portfolio, the majority of the assets are located in the Americas and Western Europe, which represent very safe jurisdictions from a political risk perspective, and we don’t see that changing. We don’t see ourselves expanding to areas that have a high level of political risk associated with them.
We are a precious metals streaming company, but we are focused on the silver side of things and when you look at where silver naturally occurs in the earth’s crust, that’s primarily North and South America. There is signifi cant amount of silver produced in China and Russia. However, those would be places that we would have a tough time consummating a silver stream transaction, unless we had a partner that could indemnify us against any of the political risks that we would be exposed to.
And then you look at Africa which has pockets of high political risks and there is really very little silver produced out of Africa, so there is very little chance that we’ll consummate a silver stream transaction relative to one of those areas. The bottom line is that we continue to see a lot of opportunity in politically stable jurisdictions and those are the opportunities that are at the top of our list.” Gary Brown
Silver Wheaton has 19 streams with operating assets and 5 with development assets. How does Silver Wheaton manage the increased risk associated with those in the development stage, where the ability to exercise operational control is limited?
“We consider all of our agreements as partnerships and we do our best to work with our partners in terms of supporting these projects going forward and when it comes to development assets, our primary security comes from the completion tests and corporate guarantees that are put in place when we close a transaction. These not only ensure that we are protected in terms of these assets getting to market, but also have penalty clauses to compensate us and encourage the asset to be built on time and on budget. Typically we fi nd this structure is adequate to protect us and the investor and to ensure everyone’s interests are aligned.” Randy Smallwood
“And I would just add to that for the development stage assets, we generally don’t advance a signifi cant amount of the upfront funds until permitting is in place, the mining company has secured all the fi nancing required to build the particular project, and construction has commenced.” Gary Brown
With whom do you see Silver Wheaton competing for investment opportunities over the next few years, and do you expect to see much consolidation across the industry in the near term?
“There are a couple of other companies that have adopted our metal streaming model, but they have generally applied it to the gold space. We are a precious metal company focused on the silver space, and so we don’t anticipate as much competition on the silver streaming transactions.
There have been murmurs that other purely fi nancial investors, private equity funds and pension funds have considered entering the metal streaming space, but as Randy alluded to earlier, the key component in making a good investment in metal streaming transactions is assessing the technical aspects associated with the mining operation and the resource itself. We have a world class team of geologists, mining engineers and metallurgists that we deploy in assessing those risks. It is very diffi cult for purely a fi nancial investor to assemble such a qualifi ed team that can focus on that space.
And with respect to the other players that are currently in the space, our key advantage is our size. We are the largest of the metal streaming companies out there. That provides us with the substantial cash fl ow which allows us to grow, it gives us excellent access to the capital markets both debt and equity, and with our highly diversifi ed portfolio, it gives us a little more latitude with respect to risk tolerance. I don’t see the landscape changing signifi cantly from a competitive perspective in the future and I see us as having a number of advantages over the current players.” Gary Brown
Finally, can you tell us a little more about Silver Wheaton as an investment itself? How do you feel the investment opportunity compares to investment into a pure-play silver producer or an ETF?
“Silver Wheaton provides shareholders with a much lower risk profi le than a traditional mining investment and yet still delivers most of the rewards that are traditionally related to a mining investment.

17Mergers, acquisitions and capital raising in mining and metals |
When I compare us to an ETF, the fi rst differentiating factor is that we provide a level of leverage to the precious metal exposure inherent in our portfolio. This leverage arises because we don’t pay fully for every ounce of silver or gold that we gain exposure to upfront. We defer a portion of the payment until the precious metal is actually delivered to us. This characteristic should result in us outperforming a straight investment in bullion which is supported by the fact that the returns we have generated for shareholders since the inception of the Company in 2004 are about three times that generated from an investment in bullion.
We also provide shareholders with exposure to the exploration and expansion upside that our portfolio has shown a propensity to deliver. As we have previously stated, our portfolio is comprised of very good mines and some of them are very young in their development and have all sorts of opportunity for continued growth through expansion and exploration success and we deliver that to our shareholders.
We also have the opportunity to make accretive acquisitions. We continue to grow and add value on a per share basis. One of the key stats that I have always admired is that the shareholders who acquired shares when this company was founded back in 2004 had about 1.5 silver equivalent ounces backing every share. We currently have about 6 silver equivalent ounces underlying each share in this company, highlighting just how accretive our acquisitions have been.
We also pay a dividend which is based on a percentage of operating cashfl ow. With the cost of every ounce of silver or gold being delivered to us being virtually fi xed contractually, basing the dividend on operating cashfl ows provides shareholders with direct participation in both our enviable organic growth profi le and increases in underlying commodity prices. ETFs and bullion investments obviously don’t pay dividends.
As a result of these characteristics, we believe that Silver Wheaton represents the best investment vehicle out there to gain precious metal exposure.” Randy Smallwood
“And I would just add that shareholders are gaining access to the expertise of the company that has not only demonstrated the ability to consummate highly accretive transactions but, has also shown that it has the discipline to avoid investing in assets that don’t deliver shareholder returns.” Gary Brown

18 | Mergers, acquisitions and capital raising in mining and metals
The window of opportunityOnly time will tell if we are witnessing a correction, a restructuring of the sector or just the start of the new normal. The capital decisions that companies make will be the key to their success.
What is certain is that this is a cyclical industry and one where the very factors contributing to the challenges will also force the solution: a lull in investment will eventually lead to a contraction in supply which will, once again, support higher commodity prices and investment.
Meanwhile, there is a window of opportunity for those with confi dence in the sector and access to longer-term, more patient capital. These investors are looking to capitalize on reduced competition for assets, lower valuations and a continued fl ow of divestments from the large cap producers.
This window of opportunity will remain open until equity markets for the sector recover fully and while large cap producers remain cautious about investing. Until then, those with access to patient private capital, including fi nancial investors, will have a free run to take advantage of the current market conditions.
Spotlight
Source: S&P Capital IQ, EY analysis.
0.00.2
0.60.4
1.0
1.41.6
1.2
0.8
1.8Consensusforecast
-1,000
0
1,000500
-500
1,500
2,5002,000
3,0003,500
Net
Deb
t/EB
ITDA
Net Debt/EBITDA
2005
2006
2007
2008
2009
2010
2011
2012
2013
E
2014
E
2015
E
2016
E
Availability of capital to undertake M&ATop 14 globally diversifi ed mining companies leverage and cash fl ow summary

19Mergers, acquisitions and capital raising in mining and metals |
Free cash fl ows have been squeezed over the last 18 months due to low earnings and a record level of investment, which reached its peak during 2012. Across our sample of the top 14 globally diversifi ed mining and metals companies, each company allocated on average $6.3b5 to capital expenditure, primarily on large-scale, tier-one organic growth projects in an environment where costs escalated and initial budgets were exceeded. Leverage consequently soared as companies took advantage of the favorable lending conditions to fund growth.
The industry has quickly reacted to this scenario: major producers are focused on achieving cost-saving targets, productivity improvements, divestments and scaling back capital expenditure, while pursuing only the top-tier projects and doing so incrementally. As a result of these actions, consensus forecasts show improved cash fl ows, after capital investment, albeit modestly during 2013 and then dramatically after 2014 to levels more conduciveto investment, particularly as leverage begins to fall over the same period.
However, while conditions lend themselves to a return to investment, a complex capital allocation challenge exists where investment decisions are tougher than ever. Companies are challenged to identify a unique strategy that sets them apart from their peers in an uncertain economic and commodity price environment, where returns can be marginal.
5. Source: S&P Capital IQ, EY analysis.
In the immediate aftermath of recent market conditions and changes to management, we are witnessing a greater focus on yield. Dividends and share buybacks are being used to appease shareholders and compensate for a perceived under-delivery on capital returns. As the graph below shows, beyond 2014, the forecast ramp-up in dividends is highly affordable against the expected improved cash fl ows; a much lower percentage of cash is being paid out as dividends despite the relative level increasing signifi cantly.
So the question is: how does management achieve the right balance between short-term yield and long-term capital appreciation? The danger in seeking the former is that growth projects are snubbed at the detriment of long-term value. Encouragingly, analysis suggests the large cap producers, at least, should be able to satisfy both criteria, given expected improvements to cash fl ows.
“It’s an opportunistic time for those with access to longer-term capital and with confi dence in the sector to capitalize on attractive investment opportunities in the current market.”
Nicky CrabtreeMining & Metals Global Transaction
Advisory Services, Assistant Director EY UKI
Source: S&P Capital IQ, EY analysis.
Dividend
2005
2006
2007
2008
2009
2010
2011
2012
2013
f
2014
f
2015
f
2016
f
0%
20%
40%
60%
80%
100%
120%
0200400600800
1,0001,2001,4001,600
Divi
dend
/FCF
Divi
dend
($m
)
Top 14 globally diversifi ed mining companies dividend summary

20 | Mergers, acquisitions and capital raising in mining and metals
Investors are presently being offered a better yield with higher dividends set against depressed share prices. While this is yet to fl ow through to improved investor sentiment, we do expect this to happen over time. Once confi dence returns to the sector, companies will have more capacity to again focus on investing capital for growth.
This change in sentiment is not limited to the producers; development companies are preserving capital, optimizing project timetables and looking for a broader range of partners to de-risk the build-out. The manner in which these companies are approaching capital markets is also changing, where wider pools of capital providers are being considered and capital is being stretched further. As this group of companies is increasingly looking to attract private equity-type investment, they are beginning to approach investment in a more disciplined manner, setting out milestones, increasing accountability and adjusting rewards.
Return on investment time horizonMining companies invest for the future – that is, investments made are not expected to generate income immediately but at some point in the future. The graph opposite shows expected return on capital employed (ROCE), revealing that historical investments are unlikely to yield signifi cant uptick in ROCE until after 2016. This analysis is based on consensus forecasts, which some argue to be conservative and others realistic.
Based on these forecast returns, it will be diffi cult to justify a signifi cant increase in M&A activity outside of investments that present a unique or highly synergistic value proposition. This suggests that for those investors who are able to realize this upside, the window of opportunity will remain open for some time.
When is the timing right?While the best time to undertake M&A is at the bottom of the market, this has not historically proven to be the case. The graph below demonstrates little correlation between commodity price peaks (and possibly the timing of decisions) and when deals are completed.
Historical M&A value vs commodity price
Value of M&A LMEX base metals Iron oreGold Coal
0
50
100
150
200
250
0
10,000
20,000
30,000
40,000
50,000
5,000
15,000
25,000
35,000
45,000
Jan
08
May
08
Sep
08Ja
n 09
May
09
Sep
09Ja
n 10
May
10
Sep
10Ja
n 11
May
11
Sep
11Ja
n 12
May
12
Sep
12Ja
n 13
May
13
Sep
13
Com
mod
ity p
rices
(mon
thav
erag
es, r
ebas
ed)
Deal
val
ue, $
m
Source: EY analysis, ThomsonONE, Thomson Datastream
Source: S&P Capital IQ, EY analysis.
ROCE
2005
2006
2007
2008
2009
2010
2011
2012
2013
E
2014
E
2015
E
2016
E
02468
1012141618
ROCE
%
Consensusforecast
Top 14 globally diversifi ed mining companies - ROCE summary

21Mergers, acquisitions and capital raising in mining and metals |
As long as management’s primary focus is on cost optimization and driving up ROCE, in the absence of a signifi cant metals price jump, we are unlikely to see a return to large-scale M&A in the near-term. However, shareholder pressure may alleviate over time, resulting in a situation where expectations realign to more modest levels of ROCE, incentivized by the prospect of higher yields.
In the interim, the time for those with a longer-term investment horizon to undertake M&A is now, where favorable valuations and reduced competition support an attractive acquisition environment. However, the nature of this M&A is likely to differ from that historically, where capital is likely to be preserved for opportunities that support a robust operational structure and margin-led growth, rather than pure scale-led growth.
From a wider economic and commodity price environment, the sector requires some fi rm consensus on valuation before investment decisions free up more widely. Interestingly, it is those with a clear “in house view” of commodity prices and other key valuation input assumptions, including economic and commodity prices, such as commodity traders, which are most active in the M&A market right now.
The window will gradually close, not slamThere is no disputing that the mining and metals sector invests and reaps its return in cycles. The cyclical nature of the industry is one of the key determinants of how long the window of opportunity will remain open for patient capital. While forecasts are never conclusive, historical trends suggest larger producers will return to investments before long, although an imminent fi ght for assets with private capital looks unlikely.

Mergers & acquisitions
1.
Preference for smaller bolt-on deals
Valuation gap
Regional M&A trends
Financial investors
Cross border activity
Commodity overview
22 | Mergers, acquisitions and capital raising in mining and metals

23Mergers, acquisitions and capital raising in mining and metals |
Introspection and inertia characterized a year of subdued M&A activity in the mining and metals sector. During the last 12 months, there was a distinct shift away from external investing for growth toward internal capital optimization. Traditional buyers concentrated on capital discipline, improving balance sheet strength and maximizing return on capital. The majors continued to pursue divestment of non-core assets, while cash-strapped juniors struggled to raise fi nance. Such a climate presents deal opportunities. However, the sense of urgency to make them happen was missing.
The year 2013 marked the third consecutive year of declining M&A deal values and volume in the mining and metals sector. Deal volume dropped 25% y-o-y, while total deal value increased by 20% to $124.7b. However, this increase was misleading as it was primarily due to the completion of the merger between Glencore International and Xstrata. Excluding this, overall deal value decreased 16% to $87.3b, prolonging the downward trend of recent years.
The mining and metals industry continued to be plagued by volatility in commodity markets and the macroeconomic uncertainty that characterized the last fi ve years. With margins squeezed and returns from previous investments under scrutiny, companies are hesitant to part with capital. Faith has been shaken and investment sentiment in the industry is at an all-time low.
But, for the large cap producers at least, there is very little distress and balance sheets are looking increasingly healthy. As diversifi ed mining and metals companies seek to optimize portfolios with a focus on increasing overall margins, many of the industry’s majors have announced high-value divestment programs. During 2013, the industry’s top fi ve diversifi ed mining majors completed $6.3b6
of divestitures, while $5.5b of deals have been agreed and are expected to complete during 2014. As it stands, the Las Bambas divestment by Glencore Xstrata appears to be the last major divestment across the top fi ve major producers that is still in the process of fi nding a buyer. Other examples of divestments made in 2013 include the following:
• BHP Billiton divested its Pinto Valley mining operation and associated San Manuel Arizona Railroad Company ($650m)7,interests in the EKATI Diamond Mine and Diamonds Marketing operations ($553m),8 and the East and West Browse joint venture ($1.63b).9
• Vale sold its shares in Norsk Hydro for $1.82b,10 and announced the sale of its Araucaria fertilizer plant for $234m11 and its stake in the Brazilian BM-ES-22A oil and gas concession for $40m.12
• Rio Tinto sold its 80% interest in Northparkes ($820m);13
agreed the sale of its Eagle project to Lundin (c.$325m);14 and completed the sale of its 57.7% effective interest in Palabora Mining Company ($373m);15 the North American portion of its Alcan Cable business ($151m) in 2012;16 and 50% stake in the Clermont mine ($1b).17
6. Including Vale’s $1.8b sale of its Norsk Hydro shares, which falls outside of the M&A data within this report.7. “BHP Billiton completes sale of Pinto Valley to Capstone Mining Corp,” BHP Billiton press release, 11 October 2013.8. “BHP Billiton completes diamond business to Dominion Diamond Corporation,” BHP Billiton press release, 10 April 2013.9. “BHP Billiton completes the sale of interest in East and West Browse joint venture,” BHP Billiton press release, 7 June 2013.10. “Vale sells all of its shares in Norsk Hydro with the exercise of the over-allotment option,” Vale press release, 14 November 2013.11. “Vale to sell fertilizers asset,” Vale press release, 18 December 2012.12. “Vale to sell stake in oil and gas concession,” Vale press release, 26 December 2012.13. “Rio Tinto agrees to sell of interests in Northparkes,” Rio Tinto press release, 28 July 2013.14. “Rio Tinto agrees sale of Eagle project,” Rio Tinto press release, 12 June 2013.15. “Rio Tinto agrees sale of shareholding in Palabora,” Rio Tinto press release, 11 December 2012.16. “Rio Tinto completes sale of Alcan Cable’s North American business,” Rio Tinto press release, 5 September 2012.17. “Rio Tinto agrees sale of interest in Clermont mine,” Rio Tinto press release, 25 October 2013.
“2013 was a tough year for M&A across the sector. There was a lack of desire to pursue acquisitive growth and for those with multiple assets there was insuffi cient distress to force divestment. The most signifi cant deal of the year, the merger of Glencore International and Xstrata, was unique in nature, was all equity and represented 30% of deal value for the year.”
Lee DownhamGlobal Mining & Metals Transactions
Leader, EY
2003 2004 2005 2006 2007 2008 2009 2010 2011 2012 2013*Volume 475 596 564 701 903 919 1,047 1,123 1,008 941 702Value ($m) 46,182 26,350 65,430 175,713 210,848 126,884 60,035 113,706 162,439 104,014 87,309 Average value ($m) 97 44 116 251 233 138 57 101 161 111 124Median value ($m) 4.4 3.1 4.8 6.2 7.2 6.0 3.2 5.2 5.6 5.0 3.8
Volume and value of deals (2003-2013)
*Excluding Glencore Xstrata merger

24 | Mergers, acquisitions and capital raising in mining and metals
Additionally, most of the majors focused their strength on achieving cost saving targets and scaling back capital expenditure while pursuing only the top tier projects and doing so incrementally. For instance:
• Rio Tinto reduced operating costs by $2b by the end of 2013 and is scaling back capital expenditure 20% y-o-y for the next two years.18
• Anglo American will deliver about $1.3b annually by cutting overhead costs, reducing its project pipeline and generating more value from product sales.19
• AngloGold Ashanti plans cuts of $460m from corporate and exploration costs and $500m from operating cost savings.20
This activity, together with other rationalization measures and an uptick in iron ore prices during the back end of 2013, has strengthened cash fl ows and balance sheets and eased the pressure to divest non-core or underperforming assets.
As such, investing activities remained subdued in 2013 and any expectation of rock-bottom asset sales seems off the mark. These conditions collectively point toward deal inertia. With buyers looking for bargains and sellers in no mood to let assets go cheaply, it’s a stalemate.
Valuation gap – increasingly diffi cult to bridgeHowever, the gap between buyers’ and sellers’ valuation expectations is not only the preserve of the large cap producers. A total of 74% of the respondents to EY’s Capital Confi dence Barometer Survey for Mining and Metals, released in October 2013, believe that a valuation gap of 10% -30% currently exists. Further, the expectation of the majority of respondents is that the gap is going to remain or even increase.
A disparity in analysts’ forecast for metal prices, fueled by differing expectations for world economic growth, is producing a broad range of asset valuations. This is only serving to widen the gap between buyer and seller expectations on price and hinder deal completion. While some believe that current equity valuations are wildly undervalued, others consider this to be a much-needed market correction. From any vantage point, it is a challenging
18. “Rio Tinto is delivering on its commitment to create greater value for shareholders,” Rio Tinto Investor Presentation, 3 December 2013.19. “Anglo American chief plans $1.3bn cash uplift in shake-up,” The Telegraph, 26 July 2013.“Half year fi nancial report for the six months ended 30 June 2013,” Anglo American report, 26 July 2013.20. “AngloGold Q3 earnings jump on 12% output gain, 10% cost decline,” AngloGold Ashanti press release, 6 November 2013.
backdrop against which to make investment decisions. With price volatility expected to continue for a few more years as the supply and demand balance struggles to achieve equilibrium, both buyers and sellers will need to be innovative in their approach to valuations.
2004
2003
2005
2006
2007
2008
2009
2010
2011
2012
2013
<$200m
>$1b
Between $200m and $1b
Volume
Deal
val
ue ($
b)
Deal
vol
ume
-50
100150200250
02004006008001,0001,200
Volume and value of deals by size (2003-2013)
Financial investors embrace opportunitiesDespite challenging market conditions, the sector’s new entrants appear to be fi nding a way to successfully navigate the M&A landscape. During the last 12 months, fi nancial investors increased their share of total M&A undertaken by value from 5% in 2012 to 19% in 2013. This stands to reason given that many fi nancial investors are countercyclical, attracted by the prospect of potentially strong returns driven by low asset valuations.
In 2013, 5 of the 19 megadeals (>$1b) were undertaken by fi nancial investors:
1. The $3.6b joint investment by Lizarazu and Receza in Polyus Gold International
2. Onexim Group’s $3.5b investment in Uralkali
3. Chengdong Investment Corp’s $2b (12.5%) stake in Uralkali
4. Samruk-Kazyna’s $1.7b investment in Kazzinc
5. Crispian Investments’ $1.5b investment in Norilsk Nickel
These deals highlight the disparity between market valuations and the underlying value that a strategic and more patient investor can attribute. In most part, these megadeals demonstrated a belief by the fi nancial investor that the market was being too risk averse.
25Mergers, acquisitions and capital raising in mining and metals |
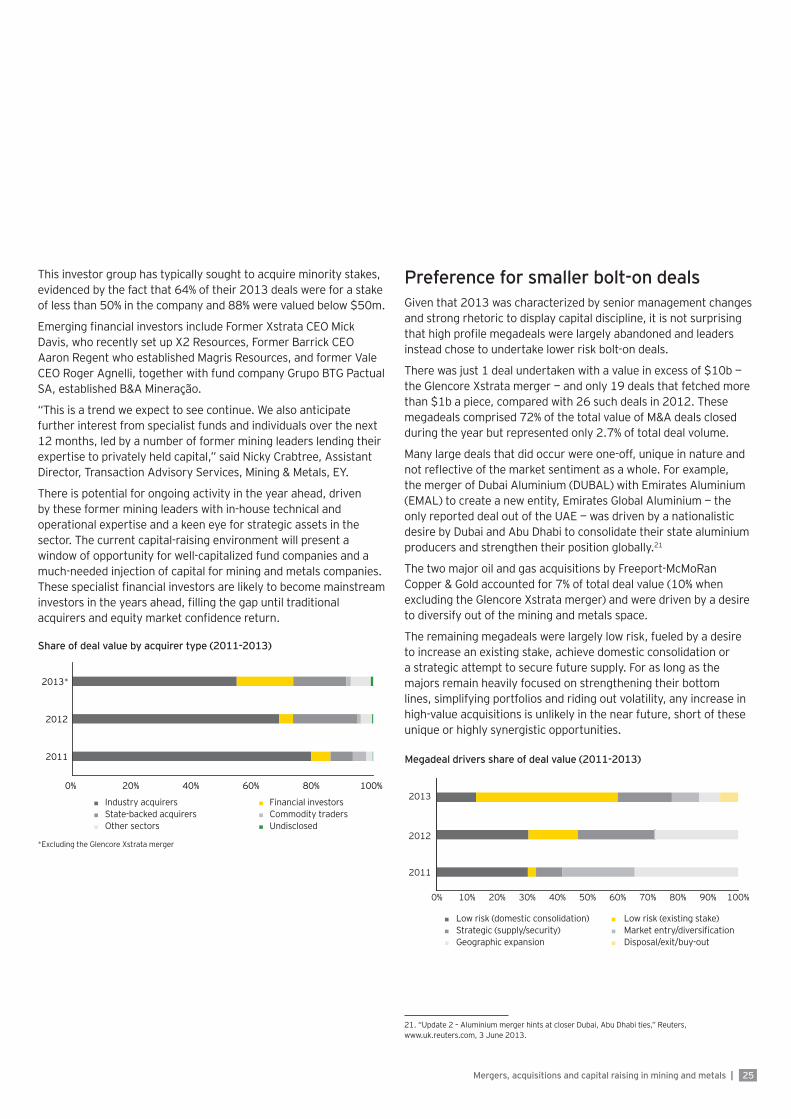
This investor group has typically sought to acquire minority stakes, evidenced by the fact that 64% of their 2013 deals were for a stake of less than 50% in the company and 88% were valued below $50m.
Emerging fi nancial investors include Former Xstrata CEO Mick Davis, who recently set up X2 Resources, Former Barrick CEO Aaron Regent who established Magris Resources, and former Vale CEO Roger Agnelli, together with fund company Grupo BTG Pactual SA, established B&A Mineração.
“This is a trend we expect to see continue. We also anticipate further interest from specialist funds and individuals over the next 12 months, led by a number of former mining leaders lending their expertise to privately held capital,” said Nicky Crabtree, Assistant Director, Transaction Advisory Services, Mining & Metals, EY.
There is potential for ongoing activity in the year ahead, driven by these former mining leaders with in-house technical and operational expertise and a keen eye for strategic assets in the sector. The current capital-raising environment will present a window of opportunity for well-capitalized fund companies and a much-needed injection of capital for mining and metals companies. These specialist fi nancial investors are likely to become mainstream investors in the years ahead, fi lling the gap until traditional acquirers and equity market confi dence return.
0% 10% 20% 30% 40% 50% 60% 70% 80% 90% 100%
2013
2012
2011
Low risk (domestic consolidation)Strategic (supply/security)Geographic expansion
Low risk (existing stake)
Disposal/exit/buy-out
Megadeal drivers share of deal value (2011-2013)
Preference for smaller bolt-on dealsGiven that 2013 was characterized by senior management changes and strong rhetoric to display capital discipline, it is not surprising that high profi le megadeals were largely abandoned and leaders instead chose to undertake lower risk bolt-on deals.
There was just 1 deal undertaken with a value in excess of $10b — the Glencore Xstrata merger — and only 19 deals that fetched more than $1b a piece, compared with 26 such deals in 2012. These megadeals comprised 72% of the total value of M&A deals closed during the year but represented only 2.7% of total deal volume.
Many large deals that did occur were one-off, unique in nature and not refl ective of the market sentiment as a whole. For example, the merger of Dubai Aluminium (DUBAL) with Emirates Aluminium (EMAL) to create a new entity, Emirates Global Aluminium — the only reported deal out of the UAE — was driven by a nationalistic desire by Dubai and Abu Dhabi to consolidate their state aluminium producers and strengthen their position globally.21
The two major oil and gas acquisitions by Freeport-McMoRan Copper & Gold accounted for 7% of total deal value (10% when excluding the Glencore Xstrata merger) and were driven by a desire to diversify out of the mining and metals space.
The remaining megadeals were largely low risk, fueled by a desire to increase an existing stake, achieve domestic consolidation or a strategic attempt to secure future supply. For as long as the majors remain heavily focused on strengthening their bottom lines, simplifying portfolios and riding out volatility, any increase in high-value acquisitions is unlikely in the near future, short of these unique or highly synergistic opportunities.
21. “Update 2 – Aluminium merger hints at closer Dubai, Abu Dhabi ties,” Reuters, www.uk.reuters.com, 3 June 2013.
Share of deal value by acquirer type (2011-2013)
Industry acquirersState-backed acquirersOther sectors
Financial investorsCommodity tradersUndisclosed
0% 20% 40% 60% 80% 100%
2011
2012
2013*
*Excluding the Glencore Xstrata merger

26 | Mergers, acquisitions and capital raising in mining and metals
Rank Value ($m)
Type Target name Target country
Target commodity
Acquirer Acquirer country
Acquirer commodity
Share (%)
1 37,439 Domestic Xstrata Switzerland Diversifi ed Glencore International Switzerland Trading company 65.9
2 7,500 Domestic DUBAL (Dubai Aluminium Company Limited)
United Arab Emirates
Aluminium Emirates Aluminium Co United Arab Emirates
Aluminium 100.0
3 6,450 Domestic Plains Exploration & Production Co
US Oil & gas Freeport-McMoRan Copper & Gold US Copper 100.0
4 5,058 Domestic Inmet Mining Corp Canada Copper First Quantum Minerals Canada Copper 94.0
5 3,911 Domestic Sterlite Industries (India) India Diversifi ed Sesa Goa India Iron Ore 100.0
6 3,620 Domestic Polyus Gold International Russia Gold Lizarazu and Receza Russia Financial investor 37.8
7 3,543 Domestic Uralkali Russia Potash/phosphate
Onexim Group Russia Financial investor 21.8
8 3,462 Domestic Consolidation Coal US Coal Murray Energy Corp US Coal 100.0
9 2,616 Domestic Hyundai Hysco - Steel milling business
South Korea
Steel Hyundai Steel South Korea Steel 100.0
10 2,611 Domestic Titanium Metals Corp US Titanium Precision Castparts Corp US Aircraft components
90.4
11 2,218 Cross border
Eurasian Natural Resources UK Diversifi ed Eurasian Resources Group Luxembourg Consortium 55.4
12 2,100 Domestic McMoRan Exploration Co US Oil & gas Freeport-McMoRan Copper & Gold US Copper 64.0
13 2,000 Cross border
Uralkali Russia Potash/phosphate
Chengdong Investment Corp China Sovereign wealth fund
12.5
14 1,650 Domestic Kazzinc Kazakhstan Silver/lead/zinc Samruk-Kazyna Kazakhstan Sovereign wealth fund
29.8
15 1,487 Domestic GMK Noril'skiy Nikel' (Norilsk Nickel)
Russia Nickel Crispian Investments Russia Financial investor 5.9
16 1,347 Cross border
Uranium One Kazakhstan Uranium ARMZ Russia Uranium 48.4
17 1,109 Cross border
ArcelorMittal Mines Canada Canada Iron ore POSCO; China Steel; EQ-Partners South Korea Steel 15.0
18 1,105 Cross border
CGA Mining Philippines Gold B2Gold Corp Canada Gold 100.0
19 1,077 Domestic Henan Dayou Energy Co China Coal Investor Group China Coal 26.3
Megadeals (2013)
The table above includes deals that are reported as mergers of equals. However, targets and acquirers are assigned for the purposes of analysis per ThomsonONE classifi cations.

27Mergers, acquisitions and capital raising in mining and metals |
2004
2005
2006
2007
2008
2009
2010
2011
2012
2013
Cross-borderDomestic
65% 65%60% 59%
43%
67%
55%52%
48%
58%
35% 35%40% 41%
57%
33% 45%48%
52%
42%
Share of cross-border and domestic deals, by volume (2004-2013)
Cross-border activity – declining popularityThe year 2013 saw the fi rst fall in the proportion of cross-border deal activity since the global fi nancial crisis (GFC) in 2008. Outbound activity, as a proportion of the total M&A volume, fell from 52% to 42% y-o-y, with only 18% of the total deal value for the year targeting cross-border assets.
The fl ow-on effect was a signifi cant increase in the value of domestic deal activity, which rose from $43.3b in 2012 to $65.1b in 2013 (excluding the Glencore Xstrata merger), accounting for 75% of the entire deal value for the year. All of the top 10 deals were domestic targets, while two of the largest deals — the merger of DUBAL with EMAL and the merger of Sterlite Industries into Sesa Goa — were driven by nationalistic consolidation. The remaining megadeals were largely low risk, fueled by a desire to increase an existing stake, achieve domestic consolidation or a strategic attempt to secure supply.
Target region 2008 2009 2010 2011 2012 2013* Y-o-Y change*North America 48,520 15,420 22,200 54,187 13,306 26,923 102%Asia Pacifi c 29,611 20,505 38,955 38,297 41,055 25,365 -38%CIS 3,553 3,836 3,718 23,894 5,418 17,939 231%Middle East - - 1,605 131 - 7,500 -Europe 26,432 4,608 6,613 3,564 10,424 3,863 -63%Latin America 16,924 12,139 23,957 22,084 13,872 2,792 -80%Africa 1,844 3,285 16,657 20,282 19,940 2,927 -85%Total 126,884 60,035 113,706 162,439 104,014 87,309 -16%
Value of deals by target region ($m)
*Excluding the Glencore Xstrata merger
“Cross-border statistics point to a very cautious sector, one that is holding back from high-risk cross-border investments that are diffi cult to value and justify. It is not surprising that 2013 M&A activity was largely focused on creating value in familiar territories.”
Jodie EldridgeM&A Analyst, Mining & Metals, EY
Australia
Regional M&A trendsIn 2013, Europe was both the most targeted and the most acquisitive region by deal value due to the Glencore Xstrata deal. Excluding this deal, North America was the most targeted region with 31% of deal value, narrowly leading Asia Pacifi c (29%). North America and the Asia-Pacifi c region tied as the most acquisitive regions by deal value, each with 33%.
At a country level, excluding Switzerland’s Glencore Xstrata merger, the US was the most targeted by value ($18b or 21%) and Canada was the most targeted by volume (153 or 22%). Similarly, the US was the most acquisitive country by value (21%) and Canada by volume (30%). The value of US domestic deals rose from $2b in 2012 to $16.6b in 2013, and Canada from $2.2b to $6.8b. Within these countries, buyers mostly targeted assets within their existing commodity focus and looked to strategically create growth and effi ciencies locally.
The unusually high deal value targeting the Middle East is attributable exclusively to the DUBAL-EMAL merger completed in 2013, rather than an overall surge in activity from this region. Similarly, the CIS more than trebled its value of deal investment on a fl urry of large domestic private investor activity in the gold and coal sectors plus the $5.5b worth of investment into potash producer, Uralkali, by Onexim Group and Chengdong Investment Group.

28 | Mergers, acquisitions and capital raising in mining and metals
Activity in emerging and frontier regions slowed during 2013, with the value of deals targeting Latin America and Africa dropping 80% and 85% y-o-y, respectively. The drop-off is not surprising during a period of cautious capital deployment; there is a tendency instead to invest in mature, developed and stable jurisdictions. It is likely that investment capital is being prioritized to projects that do not have the added burden of signifi cant infrastructure capital that often accompanies large-scale emerging market projects. Encouragingly, this is likely to be a short-term phenomenon.
The drop in China’s outbound and domestic deal value (a fall of 42% and 22%, respectively, in 2013) can be attributed to new leadership and major structural reforms as it switches from a growth-based economy to a consumption-based one.22 In particular, stricter rules around environmental protection and public backlash against health and safety standards have impacted the Chinese mining and metals industry. Overcapacity of supply in coal, steel and iron ore has impacted short-term pricing, making investments into anything other than high margin projects diffi cult to justify at this point in time.
Although China is still dependent on commodity imports to supply its large-scale capital expansion, the post-GFC strategy to secure supply through large-scale acquisitions slowed during 2013. Many of the recent deals have been subject to greater scrutiny, in particular over prices paid, which is driving a more cautious approach to M&A.
22. “Changing China set to shake the world economy, again,” Reuters, 16 September 2013.
Consequently, buyers have increasingly been exploring alternative routes, such as off-take agreements and providing pre-export fi nance as an alternative method of securing supply over outright acquisition. For example, Yunnan TCT Yong-Zhe Company signed an agreement with Sirius Minerals for off-take (initially fi xed price) and an ongoing collaboration arrangement instead of taking an equity stake in the polyhalite developer.23
23. “Major polyhalite off take contract,” Sirius Minerals press release, 27 June 2013.
Acquiring region 2008 2009 2010 2011 2012 2013* Y-o-Y change*North America 35,057 13,661 35,481 48,964 16,961 28,487 68%Asia Pacifi c 46,148 20,197 49,688 58,924 47,903 28,535 -40%CIS 13,015 5,248 4,196 19,457 4,131 14,090 241%Middle East - 72 533 231 53 7,923 14758%Europe 24,074 11,182 7,528 28,438 23,035 6,480 -72%Africa 511 1,419 1,480 2,437 2,633 1,333 -49%Latin America 8,079 8,181 14,799 3,987 9,287 436 -95%Undisclosed - 75 - - 9 26 185%Total 126,884 60,035 113,706 162,439 104,014 87,309 -16%
Value of deals by acquiring region ($m)
*Excluding the Glencore Xstrata merger
“The waning appetite for Chinese outbound M&A deals, including state-backed investors, is partly driven by greater accountability requirements. The Chinese Government has been concerned about capital-intensive foreign acquisitions in recent years, many of which are not yet profi table or even operating due to a lack of infrastructure.”
Eleanor WuChina Outbound Transactions Leader,
EY China
“The increase in North American activity was motivated by greater clarity around macro-economic conditions and a desire to strengthen balance sheets in order to better ride out the volatility in commodity markets. The majority of deals were domestic in nature.”
Robert StallAmericas Mining and Metals Transactions Leader, EY

29Mergers, acquisitions and capital raising in mining and metals |
Outbound (bubble size = deal value)Domestic (bubble size = deal value)
Canada
China
Russia
Australia
Brazil
Mexico
5.3
9.8
10.8
0.5
0.1
1.3
2.2Finland
2.2
0.4
0.3
South Africa
0.1
6.8
3.1
Germany
US0.7
16.6
2.0
0.4
0.30.3
0.3
Kazakhstan
1.00.3
1.4
Philippines1.1
0.8
M&A outfl ows for key nations

30 | Mergers, acquisitions and capital raising in mining and metals
Commodity overview Gold surpassed steel this year as the most sought-after commodity: it was the target of 34% (237) of deals and $12b of investment.
A total of 47% of gold buyers came from outside the gold sector, of which fi nancial investors represented 22%. This is a trend likely to continue as gold prices remain under pressure, costs look set to increase and the dwindling share prices of junior players make them
0.9
0.9
1.4
1.8
1.9
3.2
4.5
6.3
7.5
8.6
9.2
9.5
15.3
16.4
Rare earths/lithium
Steel
Value of deals by acquirer commodity ($b)
*Excludes the Glencore Xstrata merger“Financial investors” include sovereign wealth funds, investment funds, investment companies, and individual investors.“Other” includes mining services, minor metals, and acquirers from other sectors such as automotive, aggregates, technology, and fertilizers.
attractive targets for those willing to see out volatile short-term prices. Additionally, fi nancial investors will be an increasing source of fi nance as the fl ow of debt and equity into gold juniors/explorers remains elusive. As margins increasingly look to be under pressure and the specter of devastating impairments in recent years remains, gold players that are able to rationalize operations, share risk through joint ventures, achieve cost savings and improved cash fl ows by pursuing divestitures will enjoy the greatest returns.
*Excludes the Glencore Xstrata merger“Other” includes minor metals/minerals and backward integration assets (such as power, marine port facilities, fertilizer manufacture).
Value of deals by target commodity ($b)
1.3
1.5
1.9
2.8
3.3
3.6
5.9
6.0
6.2
6.9
7.9
8.9
9.1
10.1
12.0
Rare earths/lithium
Nickel
Uranium
Silver/lead/zinc
Iron ore
Other non-ferrous metals
Potash/phosphate
Steel
Other
Coal
Copper
Oil & gas
Aluminium
Gold
31Mergers, acquisitions and capital raising in mining and metals |
In 2013, aluminium deal value was uncharacteristically high due to the $7.5b merger between Dubai Aluminium (DUBAL) and Emirates Aluminium (EMAL). This deal was driven by integration, merging the smelting capabilities of Dubai and Abu Dhabi to form the world’s fi fth largest aluminium company and to further develop the UAE’s non-oil based economy.
Oil and gas fi gures were also high on the back of Freeport-McMoRan Copper & Gold’s $8.6b acquisitions of Plains Exploration and Production and McMoRan Exploration, which comprised 94% of the entire value of oil and gas interests by the mining sector. Freeport-McMoRan Copper & Gold, which has previously held assets in this space, was attracted by strong fundamentals in the oil and gas sector and the opportunity to reduce its exposure to fl uctuating metal prices.
While 2013 deal activity was down on 2012, copper was still one of the most-sought after commodities, evidenced by a couple of big value deals during the year. Stand-out copper transactions included Capstone Mining’s $650m acquisition of BHP Billiton’s Pinto Valley copper mine, First Quantum Minerals’ $5.1b takeover of Inmet Mining and China Molybdenum’s purchase of Northparkes mines from Rio Tinto for $820m. As with gold, strong, long-term demand prospects and depressed valuations provide a good opportunity for fi nancial investors to invest in copper.
The value and volume of deals involving energy commodities were among the worst hit in 2013 due to continuing market weakness and the threat of alternate energy sources. Deal value for the
acquisition of coal assets dropped 56% y-o-y, while the value of deals targeting uranium fell 51%. In addition, we witnessed a 55% fall in y-o-y deal value targeting iron ore assets, where an uncertain price environment challenged deal execution.
We do expect this to change, however, as coal and iron ore assets are increasingly being targeted by commodity traders, with several large deals on the horizon.
For example, Rio Tinto looks likely to sells its stake in the Clermont coal mine in Australia to Glencore Xstrata and Sumitomo, while BHP Billiton has also announced the sale of stakes in its Jimblebar iron ore assets to Itochu Corp and Mitsui & Co. In addition, in 2013, Noble Group concluded minority stake acquisitions in coal miners, Resource Generation and Pan Asia Corp, and recently announced a 21% stake purchase in Cockatoo Coal. Commodity traders are also looking to secure long-term future supply of these commodities through off-take agreements, loan facilities and investment in low-cost assets on expected future delivery to high-demand growth markets, such as China and India. Stable supply available out of Australia makes this region particularly attractive for this kind of arrangement.

Capital raising
2.
Convertible bonds
The equity markets
IPOs
Bonds
The credit environment
Syndicated loans
Follow-on equity
32 | Mergers, acquisitions and capital raising in mining and metals

33Mergers, acquisitions and capital raising in mining and metals |
2007
2008
2009
2010
2011
2012
2013
-
50
100
150
200
250
300
350
400
Loans Bonds Convertibles Follow ons IPOs
Proc
eeds
($b)
Capital raised by the mining and metals sector (2007-2013)
This was a year that saw the twin challenges of “capital allocation” and “access to capital” top EY’s business risks in mining and metals radar,24 against a backdrop of weak prices, depressed earnings, squeezed margins and broken confi dence. Mining and metals equities signifi cantly underperformed other sectors and commodity prices over the fi rst half of the year, as investors lost conviction in management’s ability to deliver satisfactory returns at the top of the industry and in the rationality of risk-taking at the bottom.
Global economic uncertainty persisted, with a weaker growth rate in China, continued fi nancial diffi culties in European economies and the protracted negotiations over the US debt ceiling. This made for a challenging fi nancing environment and a subdued near-term outlook for metals prices. Bond markets were volatile, while leverage risk intensifi ed for sub-sectors of the industry.
As a result, most management teams turned their focus inward to “steady the ship,” resulting in capital restructurings, reduced capital expenditure and subdued acquisitive growth.
However, improving sentiment over the closing months of the year, supported by a tentative recovery in metals prices, suggests the tide may be slowly turning. The majors reported strong third quarter production; industry-wide cost savings and cash release programs have begun to yield results; and shareholders are welcoming the greater commitment to near-term capital returns. The industry is steadily restoring confi dence, and some much-needed optimism is gradually returning in 2014.
24. EY, “Business risks facing mining and metals, 2013-2014,” www.ey.com/miningandmetals.
The credit environment: changes on the horizonBond markets were beset by volatility in 2013. Fears in July that the US Federal Reserve would begin to taper quantitative easing (QE) inhibited bond issuance over the third quarter, but as those fears temporarily subsided, investment grade issuers in the sector took advantage of revived demand for yield.
However, there were early signs of some inherent risks, with 2014 set to bring a shift in the interest rate cycle and, with it, the risk of selective demand and higher funding costs for issuers. Critical to the year ahead is how the markets deal with the timetable for QE tapering. This impact will potentially be felt beyond the US markets, with emerging markets having already seen signifi cant outfl ows in 2013 and Asian investors fearing tighter borrowing conditions.25
Loan markets have seen strong liquidity, particularly in Europe, with competition among banks driving down pricing for high grade deals. However, syndicated lending remains the preserve of strong names with strong banking relationships to match.
Credit rating migration was overwhelmingly negative in 2013 as volatile commodity prices squeezed the margins of producers and exposed them to greater leverage risk. The severity of this risk naturally varied across different commodity groups, with gold, steel and coal producers accounting for the majority of 2013 rating downgrades. Persistent overcapacity continues to hamper the steel sector, while thermal coal prices remain under pressure due to signifi cant oversupply. The gold price, down 27% over 2013, remains vulnerable to anticipated events impacting the US dollar, interest rates and infl ation in 2014.
25. “Fitch street view: Asian investors fear corp liquidity drain on Fed tapering,” Fitch Ratings, 17 November 2013.
“An overall annual increase in capital raised by the mining and metals industry in 2013, to $272b, masks what was, in reality, a highly challenging and volatile year — one that may prove to be a turning point in the capital and investment cycle.”
Strategic Analyst, Global Mining & MetalsEmily Colborne
Net debt/EBITDA by peer group (2006-2015f)
2006 2007 2008 2009 2010 2011 2012 2013f 2014f 2015f
Consensus forecast
Net
deb
t/EB
ITDA
Coal producers Gold producers
Steel producers High yield mid-tiers
0.00.51.01.52.02.53.03.54.0
Source: S&P Capital IQ, EY analysis

34 | Mergers, acquisitions and capital raising in mining and metals
High-yield mid-tier producers with single commodity exposure were particularly vulnerable in 2013; two S&P-rated defaults in the sector, although rare, illustrated the severity and changeability of the market conditions. However, actions taken by companies to respond to this risk — deleveraging through non-core divestments, cost cutting, capacity cutbacks and productivity improvements — paint a more optimistic picture as we head into 2014.
The equity markets: improved hope for a recoveryEchoing 2009 but on a much smaller scale, equity markets supported balance sheet rehabilitation among a number of debt-burdened producers in 2013. But equity funding to the junior sector was exceptionally constrained. Proceeds raised from secondary issues by juniors fell 43% y-o-y, from an already low base, with inevitable implications for global exploration spend.
Investors are looking for low risk, near-term, high-yield opportunities, which the early-stage junior mining sector cannot offer at the present time. Juniors are also unable to match the apparent “wait and see” approach being adopted by investors, in the face of escalating operational costs and challenges combining to push out the period from discovery to cash-fl ow. Without the surety of near-term returns, equity markets are unwilling to take on the additional risk in the current environment and it may be some time before confi dence returns for explorers.
While the timing of a shift back to equities is impossible to predict, we do anticipate a gradual improvement over 2014. This has already begun with sectors that offer predictable dividend income, but we ultimately see this moving to higher-risk cyclical sectors as investors regain confi dence and equities begin to offer better returns again. At the moment, the mantra is selectivity; for while the vast swathe of early stage explorers are struggling in the current environment, equity (and indeed debt) is fi nding its way to advancing projects where management have been able to demonstrate tangible returns and realistic growth potential.
The challenging conditions in public equity markets continue to prop open a window of opportunity for private capital investors and alternative funding structures and providers. We discuss this further in our two Spotlight articles.
BondsMining and metals companies issued $88b of bonds in 2013. This represented a 22% decrease on 2012 against the backdrop of another record-breaking year globally (across all sectors). The decline in issuance by the sector partly refl ects the impact of macro-economic uncertainty, particularly in the US markets, but also reduced appetite, with the majors having largely restructured balance sheets suffi ciently already.
Relative performance of equities and commodities (2013)
405060708090
100110120130
Jan
2013
Feb
2013
Mar
201
3
Apr
201
3
May
201
3
Jun
2013
Jul 2
013
Aug
201
3
Sep
2013
Oct
201
3
Nov
201
3
LMEX index Gold Iron oreEuromoney Global Mining & Steel S&P 500 Composite
Source: Thomson Datastream. Rebased to 2 January 2013.
Q1-13 Q2-13 Q3-13 Q4-13
Upgrades Downgrades
2
94
19
2
10
4
24
S&P ratings migration — mining and metals (2013)
Source: S&P Ratings Direct. Represents foreign long-term issuer credit rating.
Rated universe: 183 entities

35Mergers, acquisitions and capital raising in mining and metals |
2014
2015
2016
2017
2018
2019
2020
2021
2022
2023
2024
2026
2027
2028
2029
2031
2032
2033
2034
2035
2036
2037
2039
2041
2042
2043
2052
-
2
4
6
8
10
12
14
16
Am
ount
out
stan
ding
($b)
Maturity year
Fixed income: total amount outstanding, top fi ve diversifi ed miners
Source: S&P Capital IQ. As at 10 January 2014.
Market conditions remained in favor of investment grade issuers for most of the year, except in periods of extreme volatility. The average coupon on high grade US dollar bonds of <10 year maturities fell to 2.4%, from 3% in 2012, while the average spread above the benchmark narrowed to 168bps from 199bps. The average tenor of US dollar bonds decreased slightly to 10 years, from 12 years in 2012.
2000
2001
2002
2003
2004
2005
2006
2007
2008
2009
2010
2011
2012
2013
Proceeds Number
-
20
40
60
80
100
120
-
50
100
150
200
250
Proc
eeds
($b)
Num
ber
Bond volume and proceeds (2000-2013) The major producers continued to take advantage of these conditions, and with signifi cant maturities on the horizon, are likely to continue to do so for as long as market conditions permit. Companies are still pursuing refi nancing options to manage their repayment risk through diversifi cation and extension of maturities.
Issuance in 2013 saw the inclusion of fl oating rate tranches — a response to investor fears of being locked into low rates in a rising interest rate environment. Foreign currency tranches were also a feature — for example, Anglo American’s Kangaroo bond26 and BHP Billiton’s Maple bond27 — as companies sought to diversify funding sources and tap localized demand for high grade issues offering higher yields than government debt.
While investment grade issuance remained healthy, emerging market and high yield issues bore the brunt of market volatility and risk aversion. Emerging markets endured turmoil in 2013 as investors withdrew en masse at the prospect of an end to fi scal stimulus in the US and lower economic growth in those economies.
26. Bonds issued in Australian dollars by foreign/international issuers.27. Bonds issued in Canadian dollars by foreign/international issuers.

36 | Mergers, acquisitions and capital raising in mining and metals
From a mining and metals perspective, investors became more selective, seeking comfort in “safe” names. Codelco reportedly attracted more than $2b demand for a $950m issue, with S&P upgrading the company’s foreign currency issuer credit rating to AA- from A on the strength of closer ties with the Chilean Government. Samarco Mineração, a Brazilian iron ore joint venture between Vale and BHP Billiton, reportedly attracted $1.25b of offers for a $699m US dollar 10-year issue yielding 5.8%.28
High yield bond issues by mining and metals companies also declined signifi cantly y-o-y, contrary to the trend seen across sectors. This may, in part, be due to investor concerns about liquidity and re-fi nancing risk among highly leveraged mid-tier companies in light of a subdued outlook for metals prices in 2014.
A positive development, however, was support for debut bonds and for unrated issues such as that of Eramet in November. Hecla Mining and St Barbara made two such debuts, securing $500m of 6.875% notes maturing in 2021, and $250m of 8.875% notes maturing in 2018, respectively.
28. “Brazil’s Samarco raised $700m from overseas bond issue,” Wall Street Journal, 22 October 2013.
-2468
10121416
-20406080100120140160
Proceeds Number
Proc
eeds
($b)
Num
ber
2000
2001
2002
2003
2004
2005
2006
2007
2008
2009
2010
2011
2012
2013
Convertible bond volume and proceeds (2000-2013)
Convertible bondsThe biggest growth story of the year was that of convertible bonds, which saw a 32% increase in volume and a 119% increase in proceeds raised, albeit from a low base.
Convertible bonds enjoyed record popularity as an asset class in 2013. Their attractiveness to investors is not surprising: they offer the fi xed income properties of corporate bonds (a fi xed payment, fi xed maturity and set redemption value) and the potential for future upside from conversion to equity in the expectation of share price growth over the bond’s tenor.
Furthermore, investors in 2013 mining and metals convertible bonds were securing coupon rates comparable with those they might receive on vanilla high-yield bonds. This is contrary to historical precedence that would see issuers pay lower coupons to compensate for the potential equity dilution. The average coupon paid in 2013 was 9%, with one issue offering 22.5%. This partly refl ects the high proportion of early-stage, unrated and therefore higher risk companies issuing convertibles in the absence of many alternatives. Any lack of confi dence in the upside potential of the share price is compensated by the high yield that investors are receiving for the debt component.
The high cost of borrowing presents increased risk for pre-production companies, which account for more than 70% of 2013 convertible bond issues. In addition, in an environment of falling share prices, there is the possibility that bondholders will opt not to convert — some gold companies with convertibles maturing in 2013 have faced this challenge. The risk of default, should companies not be in a position to meet the principal repayments on maturity, is thus high, and a number of companies have returned to market for funding to redeem maturing convertible bonds.

37Mergers, acquisitions and capital raising in mining and metals |
2000
2001
2002
2003
2004
2005
2006
2007
2008
2009
2010
2011
2012
2013
Proceeds Number
Proc
eeds
($b)
020406080
100120140160180200
0
50
100
150
200
250
300
350
Num
ber
Syndicated loan volume and proceeds (2000-2013)
3%
9%
10%
11%
17%
50%
Capex
General corporate purposes
Other
Acquisitions
Primary use of proceeds, by share of total proceeds (2013)
Syndicated loansBank lending to the sector increased 40% y-o-y to $149b, but the scale of the increase is somewhat misleading. A $17.3b refi nancing by Glencore Xstrata, for example — reportedly the largest corporate loan refi nancing in any sector in Europe for over fi ve years — accounted for a signifi cant proportion (12%) of that total.
Around half of the total loan proceeds were amendments, increases and extensions to existing credit agreements, with a relatively small proportion of lending coming in the form of new agreements for project fi nancing. Syndicated deals remain rare for smaller companies.
Nevertheless, the $74b of refi nancing completed in the year is vital for the industry. Borrowers consistently point to the strength of their banking relationships as critical to their ability to roll-over credit, and to do so on improved terms. While the ongoing implementation of Basel III has irrevocably changed the global fi nancing landscape, improving economic confi dence, strong liquidity and intense competition among banks seeking growth and ancillary business opportunities, has resulted in a strong year for credit markets and improved borrowing conditions for corporates in 2013. Rio Tinto is said to have refi nanced early to take advantage of improved pricing, while others amended existing debt facilities through the easing of covenants and extension of maturities. Average spreads on non-leveraged loans narrowed to 147bps in 2013 from 174bps in 2012.
The threat of rising interest rates, along with strong demand among lenders, led to an increase in European and US leveraged loans (all sectors), a refl ection of improved confi dence in those economies and the attraction of fl oating interest rates. This translated into improved access to debt for mid-tier miners with strong banking relationships — access that proved constrained in the volatile high yield bond markets. Indeed, banks have offered greater fl exibility, and, in some cases, better pricing, than the fi xed income markets could offer, particularly for unrated issuers. Syndicated project fi nance closed in 2013 reached only $13.4b, albeit an increase from the $5b closed in 2012. This is perhaps a refl ection of slowed investment by the industry this year as much as an indication of constrained funding. Tata Steel’s Odisha project in India and the EMAL 2 joint venture between Mubadala and Dubai Aluminium in Abu Dhabi secured over 60% of this total, but a number of gold, base metals and iron ore projects in Africa, South America and Australia secured smaller amounts. Mining project fi nance accounted for just 2.7% of global project fi nance closed over 2013, according to Thomson Reuters.29
Sitting outside of our syndicated loans data is the signifi cant number of non-syndicated debt fi nancings that are funding project development at the junior and mid-tier level. We explore these further in our spotlight section, “Alternative sources of fi nance.”
29. ”Global project fi nance review, full year 2013”. Thomson Reuters, January 2014.

38 | Mergers, acquisitions and capital raising in mining and metals
IPOsIPO volume reached a low of 26 across global exchanges — the lowest in at least a decade. A meager $0.8b of proceeds was raised across the entire global IPO market, of which the largest issue — that of Chinalco Mining Corp at $410m — accounted for 51%. Traditional sector hotspots — Canada (the Toronto and TSX Venture exchanges) and Australia — were the hardest hit in volume terms. Each hosted 7 IPOs, compared with a respective 42 and 28 in 2012.
Evidence of improved confi dence in the US and UK markets has helped to drive something of an IPO recovery in others sectors, with some large names coming to market, but the mining and metals sector is likely to lag this recovery. In the absence of any signals of stronger macroeconomic growth to support the sector’s fundamentals, risk aversion will prevail. Equally, in a time of uncertainty and volatility, large-scale issuers have been reluctant to time IPOs for fear of mispricing and poor after-market stock performance. A number of IPOs were cancelled or postponed as issuers pointed to weak demand and poor pricing conditions.
Of the 26 IPOs that were completed, just over one-third were cross-border, with Toronto, London and Australia hosting junior companies with operations in Switzerland, Sierra Leone and Indonesia, respectively. Hong Kong hosted three of the largest IPOs (Chinalco Mining Corp, Hengshi Mining Investments and CAA Resources) that will see Chinese funds supporting the development of base metals and iron ore projects in Peru, China and Malaysia respectively. Cornerstone investors in 2013 IPOs included commodity traders Trafi gura Beheer and Mercuria Energy Trading.
Proceeds Number
Proc
eeds
($b)
Num
ber o
f iss
ues
-1020304050607080
-5001,0001,5002,0002,5003,0003,500
2007
2008
2009
2010
2011
2012
2013
Follow-on equity volume and proceeds (2007-2013)
Follow-on equityDepressed share prices, particularly during the fi rst half of 2013, made the issue of equity an untenable fundraising option for most. A dramatic decline in the availability of risk capital for junior companies offset a handful of large equity issues by producers, resulting in a marginal 1% y-o-y increase in total proceeds to $26b.
Early stage juniors unable to access the debt markets or secure strategic investment resorted to small-scale offerings as a means of staying afl oat. Average proceeds raised by junior companies fell to a monthly low of $1.5m in May, and an annual low of $5.9b from 1,832 issues. This represents an almost 50% fall on 2012’s 2,073 issues and proceeds of $10.3b. Fifty-seven percent of all 2013 issues raised less than $1m.
2007
2008
2009
2010
2011
2012
2013
-
5
10
15
20
25280
117
70
177141
86
26
Proceeds Number
Proc
eeds
($b)
IPO volume and proceeds (2007-2013)

39Mergers, acquisitions and capital raising in mining and metals |
Proceeds Average proceeds
Proc
eeds
($m
)
Ave
rage
pro
ceed
s ($
m)
-200400600800
1,0001,2001,400
-
1.0
2.0
3.0
4.0
5.0
6.0
Jan-
12
Apr
- 12
Jul-
12
Oct
- 12
Oct
- 13
Jan-
13
Apr
- 13
Jul-
13
Proceeds raised by junior companies (2012-2013)
However, overall equity proceeds were boosted by some signifi cant equity raises at the top of the market. These included issues by ArcelorMittal and Barrick Gold, which sought to deleverage balance sheets in the face of challenging market conditions in the steel and gold industries. Barrick Gold’s $3b bought-deal fi nancing in November reportedly met with weak demand, illustrating that while such a name could garner support, confi dence in the gold industry is far from restored.
Follow-on activity also included state privatizations, such as the partial stake sale of Steel Authority of India and of Russian diamond producer, Alrosa. Both India and Russia have signaled their intent to pursue further state divestments, targeting local exchanges to lure local investors.

We enter 2014 with a more positive outlook: global economic confi dence is improving, companies have taken action to deleverage balance sheets, and the industry-wide focus on productivity and effi ciency is beginning to yield discernible results.
Nonetheless, there is no escaping the prospect of further capital markets volatility in 2014. US Federal Reserve policies regarding the tapering of quantitative easing will cause short-term uncertainty and instability, with a likely unsettling impact on global capital and commodities markets. Similarly, the outlook for commodity prices is mixed, with many metals remaining in near-term oversupply, which will continue to weigh on prices in 2014. As supply and demand struggle to return to a post-supercycle equilibrium, further price volatility will occur for at least the next two years. This will see caution prevail and any uplift in M&A activity and improvement of capital raising conditions will be gradual and require innovation in pricing to tame volatility.
Conditions in the bond markets — that have sided in favor of issuers for the past three years — are likely to tighten if global interest rates begin to rise.
Investing – strengthening investment appraisal and transaction execution
In 2013, most of the industry focused on reshaping its operational and capital base and much has already been achieved. However, tighter margins and the prospect of tightening credit options in 2014 will require a continued focus on the need and opportunities for capital restructuring and operational improvements. While S&P has a stable outlook for the majority of its 182-strong universe of rated companies, a number of groups (primarily thermal coal, gold and steel) remain at risk of rating downgrades should market conditions deteriorate, or even fail to improve. As such, we anticipate the possibility of further “rescue” rights issues as companies seek to reduce gearing. With smaller companies having to rely on shorter-term revolving credit facilities, this risk increases if loan markets are not supportive of refi nancing in 2014.
Preserving – reshaping the operational and capital base
While projects with near-term cash fl ows will continue to be developed, companies will look for ways to reduce or phase capital expenditure in an attempt to minimize risk and maximize returns potential. Companies across the industry are likely to employ strategies that reduce upfront capital outlays and introduce optionality through staged project development, such as incremental capacity build.
M&A is likely to remain subdued in 2014, as the industry looks to maximize returns by putting existing capital to better work. Portfolio optimization, and therefore full or partial divestments, will continue to be a focus but the valuation gap must fi rst be bridged. Deals that do complete are likely to refl ect the following:
• Deployment of expert-backed private capital allocated toward strategic assets in the sector
• Non-core divestments from gold companies, as well as from other distressed segments of the industry, as the need to optimize capital structures and portfolio increases
• Acquisitions to diversify portfolios, minimizing commodity exposure risk – for example, thermal coal producers moving into metallurgical
coal and possibly even shale gas
• Synergistic deals with a focus on simplifi ed portfolios that should encourage shareholder support for acquisitions that consolidate competitive positioning
• Continued vertical integration to manage price volatility and supply security — for example, steel producers, Japanese and Chinese copper smelters
• Strategic joint ventures and junior consolidation, particularly in gold and silver, as juniors seek means of minimizing upfront capital costs, sharing risk and enhancing access to capital
• Minority stake acquisitions by strategic buyers (family offi ces, private equity providers and venture capitalists) in promising, cash-strapped juniors while valuations remain depressed
Conversely, growing confi dence in global equity markets, as witnessed in the second half of 2013, should ultimately extend to the mining and metals sector, which has lagged the broader recovery to date.
As a result, we expect to see an increased proportion of funding obtained through equity as opposed to public debt markets. This will require confi dence to return at the top of the industry, and some high profi le success stories among junior developers. Even then, the fl ow of equity to the exploration sector may still be some way off.
With the next round of new supply projects being more technically complex (for example, due to greater depths, lower grades, diffi cult metallurgy or signifi cant infrastructure investment requirements), it is unlikely that even the largest mining and metals companies will “go it alone.” Joint venturing will return to its classic role or risk sharing. We would expect to see more sell-downs of stakes in those mega projects to enable their funding and development. It also indicates that the sector “food chain” will become more active as smaller companies will need to sell to larger companies to raise the necessary capital to move projects forward.
Outlook
40 | Mergers, acquisitions and capital raising in mining and metals

The events of recent years, which culminated in the call for leadership changes at the top of the industry, have driven home
the importance of cost discipline, productivity improvement and a holistic approach to capital allocation. With
improved free cash fl ows, the burning platform of non-core divestments to release cash has
largely been extinguished for the majors. Instead, their focus will be on extracting
maximum value from their existing portfolio of assets, through a relentless
focus on productivity and effi ciency improvements.
However, across the industry, we expect streamlining of portfolios has further to go; it is likely to manifest itself in additional divestments to release cash,
Raising – assessing future capital requirements and funding sources
Optimizing – managing the portfolio of assets
Anticipation of key economic triggers in 2014, particularly around government stimulus
programs and interest rate rises, is likely to create an unpredictable
and challenging capital raising environment. Peaks of improved
confi dence, and, in turn, risk-seeking, will be balanced by episodes of insecurity
and risk-aversion. This collectively presents the risk of reduced demand and therefore
less-favorable terms for borrowers in 2014. We are likely to see companies opportunistically access
the bond and loans markets early in the year to refi nance ahead of any anticipated tightening.
For the mining and metals sector, we anticipate stronger equity valuations at the top of the industry, as the focus on capital discipline in 2013 begins to yield results. This should ultimately improve
sentiment, and in turn, funding conditions for the rest of the industry in the equity markets. However, it may be too soon to see the return of risk capital for early stage exploration.
Recovery is unlikely to be rapid and much of the junior sector will continue to rely on alternative sources of fi nance, in an attempt to avoid dilution for existing shareholders. Momentum will come from options that have the effect of deferring the impact of upfront development costs — from equity-linked instruments such as convertibles, to royalty and streaming deals. An increasing use of small-scale M&A to fi nance projects is likely — through strategic partnering or mergers of equals at the junior level. Farm-ins may also increase in popularity as a means of increasing options for juniors without placing further strain on cash resources.
restore balance sheets and free-up management time to focus on strategic priorities. Optimization efforts will also see a reallocation of capital within portfolios, and even within single assets. Examples include re-design of project plans and associated expenditures to reduce or delay upfront capital outlay and partnerships to either share costs and risks or bring in technical expertise, unlocking value sooner rather than later.
As investors continue to challenge mining and metals companies to improve returns and unlock balance-sheets for more productive purposes (including share buybacks), we expect the increasing occurrence of divestment of infrastructure assets to specialist investors. We expect greater innovation in how infrastructure assets are funded.
In a softer commodity price environment — which 2014 may prove to be — cost discipline will be critical as margins remain under pressure. Given the additional need to achieve operational agility, we may see a greater role for innovation and technology.
Growth of a different sortThere is little doubt that growth is back on the mining and metals agenda. A total of 55% of the respondents to EY’s Mining and Metals Capital Confi dence Barometer released in November 2013 slated growth as their top priority. However, what will be interesting to observe is how that growth is achieved. The major producers are committed to a focus on improving free cash fl ow and returns — to be delivered through productivity improvements, recycling of capital, major cost saving initiatives, new production coming online and (now to a lesser degree) non-core divestments.
As our “Window of opportunity” analysis suggests, there are a number of factors that will determine the timing of an industry-wide return to M&A. As long as management remains primarily focused on improving ROCE, it is unlikely that the majors will pursue large-scale acquisitions. Activity will instead be driven by fi nancial investors looking to realize potential upside — not only from a longer-term recovery in commodity prices, but also by utilizing their own in-house technical experience. Financial investors that
41Mergers, acquisitions and capital raising in mining and metals |
possess such expertise are able to exert operational, technical and fi nancial infl uence. With capital waiting to be deployed, investment activity by this group is likely to be the most exciting story of 2014.
In addition, there is evidence of strong appetite from debt providers, with increased competition among banks likely to improve access to leveraged loans for quality mid-tier mining companies and developers. Without new capital and new investment, the mining sector may well be sowing the seeds for the next boom as supply falls short of demand. It is EY’s view that a more patient form of capital creation is essential for the long-term health of the sector. This capital will be required to replace the “hot money” leaving the sector, as short term returns fall from their record level, and to provide capital for the next projects required to replace extinguishing supply or meet future demand growth.

42 | Mergers, acquisitions and capital raising in mining and metals

43Mergers, acquisitions and capital raising in mining and metals |
Commodity analysisAluminiumCoalCopperGoldIron ore
NickelPotash/phosphateSilver/lead/zincSteelUranium
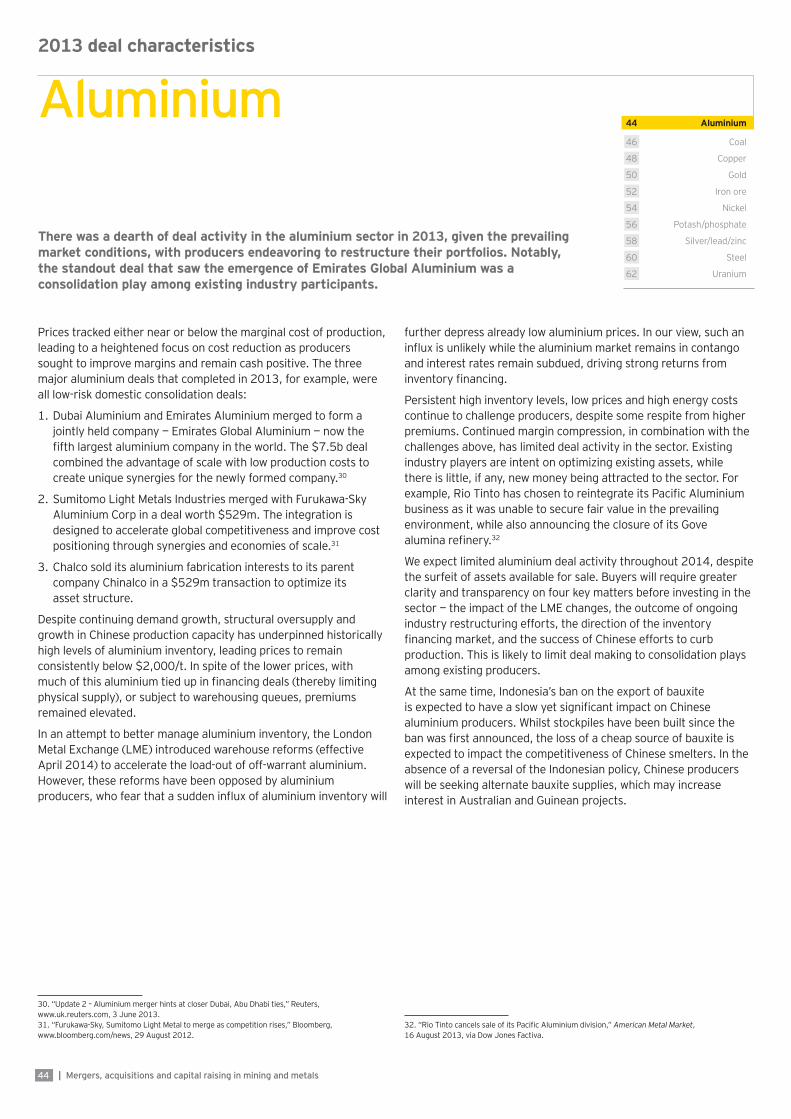
44 | Mergers, acquisitions and capital raising in mining and metals
Prices tracked either near or below the marginal cost of production, leading to a heightened focus on cost reduction as producers sought to improve margins and remain cash positive. The three major aluminium deals that completed in 2013, for example, were all low-risk domestic consolidation deals:
1. Dubai Aluminium and Emirates Aluminium merged to form a jointly held company — Emirates Global Aluminium — now the fi fth largest aluminium company in the world. The $7.5b deal combined the advantage of scale with low production costs to create unique synergies for the newly formed company.30
2. Sumitomo Light Metals Industries merged with Furukawa-Sky Aluminium Corp in a deal worth $529m. The integration is designed to accelerate global competitiveness and improve cost positioning through synergies and economies of scale.31
3. Chalco sold its aluminium fabrication interests to its parent company Chinalco in a $529m transaction to optimize its asset structure.
Despite continuing demand growth, structural oversupply and growth in Chinese production capacity has underpinned historically high levels of aluminium inventory, leading prices to remain consistently below $2,000/t. In spite of the lower prices, with much of this aluminium tied up in fi nancing deals (thereby limiting physical supply), or subject to warehousing queues, premiums remained elevated.
In an attempt to better manage aluminium inventory, the London Metal Exchange (LME) introduced warehouse reforms (effective April 2014) to accelerate the load-out of off-warrant aluminium. However, these reforms have been opposed by aluminium producers, who fear that a sudden infl ux of aluminium inventory will
30. “Update 2 – Aluminium merger hints at closer Dubai, Abu Dhabi ties,” Reuters, www.uk.reuters.com, 3 June 2013.31. “Furukawa-Sky, Sumitomo Light Metal to merge as competition rises,” Bloomberg, www.bloomberg.com/news, 29 August 2012.
further depress already low aluminium prices. In our view, such an infl ux is unlikely while the aluminium market remains in contango and interest rates remain subdued, driving strong returns from inventory fi nancing.
Persistent high inventory levels, low prices and high energy costs continue to challenge producers, despite some respite from higher premiums. Continued margin compression, in combination with the challenges above, has limited deal activity in the sector. Existing industry players are intent on optimizing existing assets, while there is little, if any, new money being attracted to the sector. For example, Rio Tinto has chosen to reintegrate its Pacifi c Aluminium business as it was unable to secure fair value in the prevailing environment, while also announcing the closure of its Gove alumina refi nery.32
We expect limited aluminium deal activity throughout 2014, despite the surfeit of assets available for sale. Buyers will require greater clarity and transparency on four key matters before investing in the sector — the impact of the LME changes, the outcome of ongoing industry restructuring efforts, the direction of the inventory fi nancing market, and the success of Chinese efforts to curb production. This is likely to limit deal making to consolidation plays among existing producers.
At the same time, Indonesia’s ban on the export of bauxite is expected to have a slow yet signifi cant impact on Chinese aluminium producers. Whilst stockpiles have been built since the ban was fi rst announced, the loss of a cheap source of bauxite is expected to impact the competitiveness of Chinese smelters. In the absence of a reversal of the Indonesian policy, Chinese producers will be seeking alternate bauxite supplies, which may increase interest in Australian and Guinean projects.
32. “Rio Tinto cancels sale of its Pacifi c Aluminium division,” American Metal Market,16 August 2013, via Dow Jones Factiva.
Aluminium48 Copper
44 Aluminium
46 Coal
50 Gold
52 Iron ore
54 Nickel
56 Potash/phosphate
58 Silver/lead/zinc
62 Uranium
60 Steel
2013 deal characteristics
There was a dearth of deal activity in the aluminium sector in 2013, given the prevailing market conditions, with producers endeavoring to restructure their portfolios. Notably, the standout deal that saw the emergence of Emirates Global Aluminium was a consolidation play among existing industry participants.

45Mergers, acquisitions and capital raising in mining and metals |
Value of deals targeting aluminium by acquirer ($m)
7,538United Arab Emirates
Japan
China
Australia
US
India
Other
1,019
529
485
282
178
97
Value of deals targeting aluminium by destination ($m)
7,500United Arab Emirates
Japan
China
Australia
US
India
Other
1,019
529
485
282
178
135
2012 2013Value ($m) 383 10,712
Volume 6 21Cross border (% share of volume) 17 10
Value and volume of aluminium deals
Includes deals where aluminium is the target and/or acquirer commodity
The table above may include deals that are reported as mergers of equals. However, targets and acquirers are assigned for the purposes of analysis per ThomsonONE classifi cations.
Top 5 aluminium deals (2013)
Value ($m) Type Target name Target country Acquirer name Acquirer country Stake (%)
7,500 Domestic DUBAL (Dubai Aluminium Company) United Arab Emirates Emirates Aluminium Co (EMAL) United Arab Emirates 100
529 Domestic Sumitomo Light Metal Industries Japan Furukawa-Sky Aluminum Corp Japan 100
529 Domestic Chinalco Henan Aluminium China Aluminum Corp of China (Chinalco) China 87
490 Domestic Yunnan Metallurgical Group Co China China Life Insurance (Group) Co China 19
468 Domestic Alumina Australia CITIC Resources Australia Australia 14

46 | Mergers, acquisitions and capital raising in mining and metals
Russia’s Evraz secured a controlling stake in Raspadskaya via its purchase of a further 50% stake in Raspadskaya’s majority owner, Corber Enterprises, to boost its self-suffi ciency in coking coal. South Korea’s POSCO bought out its partner, Cockatoo Coal, in the Australian Hume coal project — a high quality metallurgical coal project. We also expect increased activity in India given the country is short of both metallurgical and thermal coal, and needs to shore up future supply to support its growing steel industry.
The thermal coal market has experienced lower prices due to increased competition from emerging energy sources (e.g., shale gas). As a result, some companies are reassessing their portfolios and looking to diversify into metallurgical coal or other commodities. This shift in focus is more pronounced in the US, where shale gas has had a signifi cant impact on thermal coal deal activity. For example, Arch Coal sold its Utah thermal coal operations to Bowie Resource Partners for $435m and is considering divesting further assets to focus on its higher margin metallurgical coal business. Other companies are expanding their energy portfolios, such as Consol Energy, which plans to increase its exposure in the Utica shale play in southeastern Ohio.34
The large deals announced in the latter half of 2013 point to improved M&A activity in the coming year. The ongoing focus on productivity should drive deals which support this, as will the industry’s focus on achieving synergies via consolidation. Steelmakers are expected to continue investing in coal as a means of preserving already-squeezed margins and securing supply. However, the thermal coal industry is expected to be the most active in the coming year as companies either seek to rebalance their portfolios or exit the industry, or as opportunistic players, such as trading houses or private equity, make their entry. The most recent example is Sherritt International announcing the sale of its Prairie and Mountain coal mining operations for $435m to Westmoreland Coal Company.
34. Consol Energy plans expansion in Utica shale region in US state of Ohio,” IHS Global Insight Daily Analysis, 17 October 2013, via Factiva. Copyright 2013, IHS Global Insight Limited.
Despite tough market conditions, the 2013 transaction market for coal was not entirely unhealthy and showed some signs of emerging from the slump. Positive indicators included the $1b sale of Rio Tinto’s 50.1% interest in the Clermont joint venture to a company jointly owned by Glencore Xstrata and Sumitomo Corporation, announced in October. This deal confi rms Glencore Xstrata’s confi dence in the thermal coal market, with the company allocating more than $4b to increase its coal output by over 20% by 2016.33
In the US, the recent acquisition of Consolidation Coal by Murray Energy from Consol Energy for $3.5b was another positive sign. The acquisition allowed Murray Energy to secure low cost reliable coal supply for its utility customers. The deal was reportedly subject to a competitive bidding process, indicating renewed interest and confi dence in US thermal coal.
The ongoing weakness in coal prices means companies are more focused on productivity, streamlining portfolios and reducing costs. Domestic consolidation remains a key trend in Australia, China and Indonesia. In Australia, Whitehaven Coal’s purchase of the fi nal 29% in the Vickery South Coal Project for $30m, taking it to full ownership, will allow it to strategically combine the project with an adjacent project it already owns, reducing the development costs for both. China Coal Energy’s $176m purchase of Shanxi Zhongxin Tangshan Gou will increase its coal reserves.
Transaction activity slowed as the year progressed, with improved free cash fl ow removing the urgency to dispose of assets. This saw some assets being taken off the market, such as the Gregory Crinum coal mine owned by BHP Billiton, which had not secured an offer to match its targets.
As traditional acquirers in the sector, steelmakers remained active, transacting to access metallurgical coal supplies to maintain or boost self-suffi ciency levels. The current low valuations and depressed margins made the timing opportune. For example,
33. “Glencore Xstrata CEO bets big on coal as peers hold back,” SNL Coal Report, 9 December 2013.
It was a challenging year for coal producers faced with continued weak coal prices and ongoing cost pressures, resulting in consistent quarterly falls in deal volume. The deals that did take place in 2013 suggest that the nature of divestment is changing from rapid debt reduction to streamlining and refocusing the asset portfolio.
Coal48 Copper
44 Aluminium
46 Coal
50 Gold
52 Iron ore
54 Nickel
56 Potash/phosphate
58 Silver/lead/zinc
62 Uranium
60 Steel
2013 deal characteristics

47Mergers, acquisitions and capital raising in mining and metals |
Value of deals targeting coal by destination ($m)
4,153
China
US
Australia
Russia
South Africa
Other
1,714
778
765
210
239
Value of deals targeting coal by acquirer ($m)
4,356US
China
Australia
UK
New Zealand
Other
1,903
757
591
104
149
Value and volume of coal deals
2012 2013Value ($m) 18,562 8,991
Volume 107 85 Cross border (% share of volume) 46 39
Includes deals where coal is the target and/or acquirer commodity
Top 5 coal deals (2013)
The table above may include deals that are reported as mergers of equals. However, targets and acquirers are assigned for the purposes of analysis per ThomsonONE classifi cations.
Value ($m) Type Target name Target country Acquirer name Acquirer country Stake (%)
3,462 Domestic Consolidation Coal Co US Murray Energy Corp US 100
1,077 Domestic Henan Dayou Energy Co China Investor Group China 26
733 Cross border Corber Enterprises Russia EVRAZ UK 50
435 Domestic Canyon Fuel Co US Bowie Resource Partners US 100
343 Domestic OCI Wyoming Co US Natural Resource Partners US 20

48 | Mergers, acquisitions and capital raising in mining and metals
Copper deal volume and value witnessed a 13% and 30% drop, respectively, y-o-y in 2013, when excluding the $8.55b foray by Freeport-McMoRan Copper & Gold into the oil and gas space. While 2013 deal activity was down on 2012, copper was still one of the most sought-after commodities, evidenced by a couple of big value deals during the year. Stand-out copper transactions included:
1. First Quantum Minerals’ $5.1b takeover of Inmet Mining
2. Capstone Mining’s $650m acquisition of BHP Billiton’s Pinto Valley copper mine
3. China Molybdenum’s purchase of Rio Tinto’s Northparkes mine for $820m
Deal activity was impacted by uncertainty in the copper market. According to the International Copper Study Group,35 the global copper market registered defi cits between May (11,000 mt) and July (151,000 mt). Nonetheless, the overall copper market remains oversupplied with an expected surplus of around 180,000mt -200,000mt in 2013 and 250,000mt-300,000mt in 2014.
This uncertainty, together with overall weakness in the mining and metals industry, has impacted players across the industry. Industry majors such as Rio Tinto and BHP Billiton are looking to sell their non-core assets to optimize their portfolios and strengthen their balance sheets. Mid-tier companies, such as Capstone Mining, are taking advantage of the opportunity to acquire quality assets. For example, BHP Billiton’s sale of its Pinto Valley copper mine in Arizona for $650m to Capstone Mining was part of its non-core asset divestment program, while Rio Tinto’s sale of its stake in Northparkes copper mine in Australia reduced its debt burden.36
However, continued weakness in the copper price brings increased risks to these mid-tier companies in an environment of high cost pressures. Baja Mining was forced to cede a majority stake in the Boleo copper project in Mexico to a Korean consortium for bailout funding, following large capital cost overruns. Mid-tier companies are increasingly vulnerable to takeover bids at lower-than-expected premiums.
35. “Diversifi ed Mining Weekly: Are Copper Oversupply Concerns Overblown?,” BB&T Capital Markets,28 October 2013. 36. “Rio Tinto sells mine stake,” The Wall Street Journal, online.wsj.com/news, 29 July 2013. Accessed 18 December 2013.
Going forward, smaller companies are likely to pursue consolidation as a means of managing escalating costs, lower realizations and capital constraints. However, considering the strong, long-term demand prospects, depressed valuations provide a good opportunity for fi nancial investors to invest in copper.
We expect a number of trends to emerge in the year ahead. Delays to major new supply coming on-stream, such as BHP Billiton’s $20b Olympic Dam expansion, could stimulate market interest in juniors who have near-term production potential. For mid-sized miners and traders, there will be opportunities to achieve scalable growth and diversifi cation if they are either in a position to take advantage of divestments by senior producers or can form partnerships with them. Finally, one of the major deals expected to complete in 2014 is the sale of the Las Bambas copper mine in Peru by Glencore Xstrata.
Copper producers are expected to press ahead with brownfi eld expansions despite escalating capital costs, given this can be managed by releasing capital with the sale of stakes to strategic investors such as Asian SOEs and trading houses. Also in Asia, it is likely that Japanese and Chinese smelters will consider moving toward backward integration in an attempt to achieve self-suffi ciency in copper concentrate. There will also be the emergence of frontier markets, such as Botswana and Mongolia, in addition to traditional supply regions, such as Chile, as targets for access to untapped copper-rich reserves.
Encouragingly for fi nancial investors, there is the promise of investment upsides on the back of strong demand prospects in the long-term, and the high incidence of copper supply disruptions.
Copper48 Copper
44 Aluminium
46 Coal
50 Gold
52 Iron ore
54 Nickel
56 Potash/phosphate
58 Silver/lead/zinc
62 Uranium
60 Steel
2013 deal characteristics
While copper remains high on the list of many acquirers’ priorities, 2013 saw buyers in the copper market opting to wait and see. Uncertainty, fueled by muted demand, fl uctuating mine supply and softer prices, negatively impacted deal activity.

49Mergers, acquisitions and capital raising in mining and metals |
Value and volume of copper deals
2012 2013Value ($m) 13,535 18,051
Volume 92 82Cross border (% share of volume) 67 52
5,754
South Africa
Switzerland
Canada
China
South Korea
US
Other
1,145
936
430
170
319
111
Value of deals targeting copper by acquirer ($m)Value of deals targeting copper by destination ($m)
5,073
Australia
Canada
US
Democratic Republic of Congo
South Africa
Mexico
Other
1,089
936
430
653
357
327
Includes deals where copper is the target and/or acquirer commodity
Top 5 copper deals (2013)
The table above may include deals that are reported as mergers of equals. However, targets and acquirers are assigned for the purposes of analysis per ThomsonONE classifi cations.
Value ($m) Type Target name Target country Acquirer name Acquirer country Stake (%)
6,450 Domestic Plains Exploration & Production Co US Freeport-McMoRan Copper & Gold US 100
5,058 Domestic Inmet Mining Corp Canada First Quantum Minerals Canada 94
2,100 Domestic McMoRan Exploration Co US Freeport-McMoRan Copper & Gold US 64
820 Cross border Rio Tinto - Northeparkes Mine Australia China Molybdenum Co China 80
650 Cross border BHP Billiton - Pinto Valley US Capstone Mining Corp Canada 100
50 | Mergers, acquisitions and capital raising in mining and metals
It was a subdued year for gold deals as major miners grappled with sharp falls in the underlying gold price and looked within to improve cash fl ow from existing operations — 2013 was about protecting margins and reducing costs.
Appetite for M&A softened and price volatility reached new highs, which fueled valuation uncertainty. As a result, majors found it diffi cult to dispose of smaller high cost operations. Producers focused on improving productivity and negotiating cost reductions as a means of improving profi tability.
Cost overruns, production shortfalls and project delays, combined with the signifi cant decline in gold prices, resulted in widespread reporting of impairments by gold producers in 2013. Miners sought to critically review their asset portfolios in an effort to improve both their risk profi le and appetite, as well as protect margins. Notwithstanding, it is important to recognize there can be a lag in implementing measures designed to counter lower prices and margins.
Larger miners also focused on releasing capital through divestments, where they could. For example, Barrick Gold disposed of three of its Australian mines to Gold Fields.37 The market expects further non-core divestments from the majors in coming months, such as the potential disposal of the Marigold gold mine by owners Goldcorp and Barrick Gold.38
The actions of a number of governments, as well as other stakeholders, impacted investment decisions. Kinross Gold announced the cessation of development of Fruta del Norte in Ecuador following its failure to reach an agreement with the Government of Ecuador over the economic and legal terms of the project’s development.39 Such examples, in a risk-averse environment, will inhibit inbound investment in resource-rich, overly resource-nationalistic nations and impact future supply.
As with other commodities, fi nancial and private investors have been showing an interest in the gold sector. The contraction of capital from traditional fi nancing sources and the retreat of major producers from signifi cant M&A activity are creating opportunities for these investors to benefi t from the expected upturn in the sector.
37. “Gold Fields completes acquisition of Barrick’s Granny Smith, Lawlers and Darlot gold mines in Western Australia,” Gold Fields news release, 1 October 2013.38. “Goldcorp and Barrick reportedly selling Nevada mine,” The Globe and Mail, 15 November 2013.39. “Kinross announces it will cease development of Fruta-del-norte,” Kinross Gold news release, 10 June 2013.
This is a trend we expect to continue, at least in the near-term. In 2013, 22% of acquirers of gold assets were fi nancial investors. In particular, the junior players are looking for alternative sources of fi nance from a broader base of capital providers, pointing to an increase in the prominence of private capital.
Given the challenges of the past year, mining companies will need to regain investor trust and reposition themselves before they begin seeking out M&A opportunities. This provides the market with some expectation of growth-driven M&A activity in 2014. Those players who are looking to take advantage of today’s low company valuations to generate longer-term fi nancial returns will dominate the market. The market reacted well to Goldcorp’s $2.6b hostile bid for rival Osisko Mining, announced in January 2014.40 This could signal that industry valuations have fallen to a level where it makes sense for some mining companies to make acquisitions, and disciplined transaction pricing will set the sector for a healthy level of confi dence. However, given the uncertainty of the near-term pricing environment, valuations and transaction negotiations are likely to remain a challenge.
“Despite the uncertain outlook for the year ahead, more strategic JVs and consolidation activity are likely as smaller companies look for ways to minimize project risk and improve access to capital,” said Jay Patel, Canadian Mining and Metals Transactions Leader, EY.
With Chinese demand for gold rising — even surpassing India recently41 — we expect Chinese mining companies and SOEs to pursue domestic and overseas acquisitions, with many deals in the pipeline. Such activity is key to growing reserves, securing supply and increasing international footprints,42 and apt for Chinese private capital investors to acquire strategic stakes for investment purposes.
40. “Goldcorp announces offer to acquire Osisko for C$5.95 per share in cash and shares,” Goldcorp news release, 13 January 2014.41. “Gold demand trends: Q3 2013,” World Gold Council, November 2013.42. “China gold mine deals at record after price plunge: commodities,” Bloomberg, 21 August 2013.
Gold48 Copper
44 Aluminium
46 Coal
50 Gold
52 Iron ore
54 Nickel
56 Potash/phosphate
58 Silver/lead/zinc
62 Uranium
60 Steel
2013 deal characteristics

51Mergers, acquisitions and capital raising in mining and metals |
Value of deals targeting gold by destination ($m)
4,276Russia
China
Canada
Australia
Philippines
Kazakhstan
South Africa
Other
1,608
1,454
1,368
1,105
178
444
1,517
Value of deals targeting gold by acquirer ($m)
4,053Russia
China
Canada
Australia
US
UK
South Africa
Other
2,367
1,706
892
852
302
568
1,211
Value and volume of gold deals
2012 2013Value ($m) 14,638 12,363
Volume 384 292 Cross border (% ) 55 47
Includes deals where gold is the target and/or acquirer commodity
Top 5 gold deals (2013)
The table above may include deals that are reported as mergers of equals. However, targets and acquirers are assigned for the purposes of analysis per ThomsonONE classifi cations.
Value ($m) Type Target name Target country Acquirer name Acquirer country Stake (%)
3,620 Domestic Polyus Gold International Russia Lizarazu and Receza Russia 38
1,105 Cross border CGA Mining Philippines B2Gold Corp Canada 100
823 Domestic Shandong Jinshi Mining Co China Shandong Gold Mining Co China 75
764 Cross border Aurizon Mines Canada Hecla Mining Co US 100
553 Domestic Gansu Daye Geological Mining China Zhejiang Gangtai Holding (Group) Co China 100
52 | Mergers, acquisitions and capital raising in mining and metals
While volatile iron ore prices meant iron ore deal values in 2013 were well down on 2012, there was a gradual improvement in prices as the year went on. The uncertain environment made deal execution particularly diffi cult, especially for larger deals, as evidenced by Hanlong Mining’s aborted $1.2b bid for Sundance Resources.43 The combination of an ambiguous environment and a high degree of market caution meant deal values were historically low, averaging a mere $225m, with only three deals exceeding $500m.
The largest deal was Sesa Goa’s $3.9b purchase of Sterlite Industries, which was motivated by a desire for greater synergies through the achievement of lower operating costs and a healthier balance sheet for the combined group.44 This deal in particular highlights the current focus of iron ore miners on optimizing the supply chain in volume and cost terms to better manage volatility.
Iron ore producers are also increasingly focused on productivity and improving existing operations, adding incremental tonnes from effi ciency as opposed to expansion. This is driving a focus on streamlining portfolios to optimize existing assets. While this remains the mantra of the larger miners, there will only be carefully considered M&A activity outside of divestments of non-core scalable assets. A constraint on dealmaking by the larger players is both shareholder and market pressure on management, many of whom are new in the role. This fresh intake is acutely aware of the pressure to generate short-term shareholder returns, against investing in medium to long term growth, and understand that any deployment of capital will be heavily scrutinized by all involved.
With these factors in play, coupled with lower valuations and more stable iron ore prices, the market looks attractive. Trading houses
43. “Hanlong Mining Investment Pty Ltd bid for Sundance Resources Limited (81.4% Stake) Deal:315633,” Mergermarket, updated 8 April 2013.44. “Sesa Goa Limited bid for Sterlite Industries (India) Limited Deal: 354387,” Mergermarket, updated 17 August 2013.
are increasing their exposure to iron ore, with Chinese trading companies being particularly active, the largest deal being General Nice Development’s $204m purchase of Russia’s IRC. Ongoing deal activity from these players is likely as they continue to seek supply to meet growing Asian demand.
The need to secure future raw material supply also saw steelmakers remaining active buyers of iron ore in 2013, including Evraz’s $158m purchase of a 51% stake in GMK Timir, a joint venture created for the development of iron ore deposits. This activity will continue as China and India, which are structurally short of quality iron ore, need to secure substantial future supply.
The way the deals are done, however, may start to change subtly. Market observers see Chinese companies particularly keen to be involved in collaboration deals as opposed to outright purchases. It is our view that stake purchases and investment in infrastructure to gain off-take will become more common.
Iron ore M&A will increase in 2014, albeit at a subdued pace. Lower valuations of mine assets will bring new entrants seeking to diversify investments. As with other commodities, miners will be reviewing their portfolios and assessing risks and effi ciencies. A key area of potential assessment could be infrastructure assets. While miners will wish to retain control of their routes to market, sales of stakes in infrastructure will allow sharing of expenses and risks, as well as enabling them to focus on their mining assets. For example, Vale’s recent sale of stakes in its logistics unit will see it retain control but reduce exposure and therefore allow a greater focus on its iron ore division.
Iron ore2013 deal characteristics
48 Copper
44 Aluminium
46 Coal
50 Gold
52 Iron ore
54 Nickel
56 Potash/phosphate
58 Silver/lead/zinc
62 Uranium
60 SteelWith the majors increasingly looking to share risks and manage costs through co-investing and developing partnerships, we expect this to shape M&A activity inthe year ahead.

53Mergers, acquisitions and capital raising in mining and metals |
Value of deals targeting iron ore by destination ($m)
1,118
Brazil
Canada
Russia
Cameroon
China
Other
736
699
412
117
242
Value of deals targeting iron ore by acquirer ($m)
1,327
South Korea
China
Russia
UK
United Arab Emirates
Switzerland
Other
1,109
266
178
226
80
138
Value and volume of iron ore deals
2012 2013Value ($m) 7,354 7,420
Volume 65 33 Cross border (% share of volume) 55 42
Includes deals where iron ore is the target and/or acquirer commodity
Top 5 iron ore deals (2013)
The table above may include deals that are reported as mergers of equals. However, targets and acquirers are assigned for the purposes of analysis per ThomsonONE classifi cations.
Value ($m) Type Target name Target country Acquirer name Acquirer country Stake (%)
3,911 Domestic Sterlite Industries (India) India Sesa Goa India 100
1,109 Cross border ArcelorMittal Mines Canada Canada POSCO; China Steel; EQ-Partners South Korea 15
593 Domestic Baotou Iron & Steel Group China Inner Mongolia Baotou Steel China 100
390 Cross border Sul Americana de Metais Brazil Honbridge Holdings China 100
266 Cross border Anglo American - Amapa Project Brazil Zamin Ferrous United Arab Emirates 100

54 | Mergers, acquisitions and capital raising in mining and metals
consumption. Chinese construction sector growth is slowing down and is expected to moderate over the coming quarters, which, given the steel sensitive nature of the industry, will lead to a notable impact on refi ned nickel consumption.47 Chinese stainless steel demand is also slowing.
As a result, demand supply projections indicate that the nickel market will remain in surplus, placing continued pressure on prices. However, some investors believe that the export ban implemented by the Indonesian Government in January 2014, with temporary exemption to two companies — Freeport-McMoRan Copper & Gold and Newmont Mining — could reduce nickel supply and support prices.
The subdued price outlook, combined with escalating costs and capital constraints, are likely to lead to consolidation in the nickel industry. If major producers decide to divest their assets then there will be an acquisition opportunity for those stainless steel producers planning to establish integrated businesses as a means of managing price risk. It is also likely that Chinese players could emerge as strategic buyers to support the nation’s large and growing requirement of nickel, in line with its steel sector.
47. “Industry Forecast - Nickel: Growth To Slow As Economy Rebalances,” Business Monitor Online,accessed 9 September 2012. Copyright 2014 Business Monitor International Ltd.
Nickel48 Copper
44 Aluminium
46 Coal
50 Gold
52 Iron ore
54 Nickel
56 Potash/phosphate
58 Silver/lead/zinc
62 Uranium
60 Steel
2013 deal characteristics
Crispian Investments’ $1.5b minority stake acquisition in Norilsk Nickel was the only major nickel deal in 2013. This deal was part of an agreement between Interros, Millhouse and UC Rusal to settle their shareholding dispute.
Poor trading conditions in the stainless steel sector in Europe and China had a negative impact on the nickel sector. Furthermore, the continuous increase in nickel supply through large nickel pig iron (NPI) capacity additions and new project ramp-ups, such as the Wedgetail and Honeymoon projects of Norilsk Nickel, placed additional pressure on nickel prices.
Nickel producers are formulating various strategies to address falling returns and cost acceleration due to project delays, ranging from production cuts and divestment of assets to permanent closure of operations. Norilsk Nickel, the largest global nickel producer, has unveiled a new strategy to focus on capital discipline and returns on investments: all production assets in the company’s portfolio must meet defi ned “Tier 1” asset criteria by 2015.46
Growth in the Chinese economy will remain the major determining factor for the nickel market in the medium- to long-term. This means that over the next few years, there will be downward pressure on the refi ned nickel industry as the Chinese economy rebalances away from infrastructure investment toward private
46. “Norilsk Nickel unveils new strategy focused on Tier 1 assets and higher returns,” Norilsk Nickel, http://www.nornik.ru/_upload/editor_fi les/fi le2227.pdf, accessed 15 November 2013.
With current prices pushing 40% of nickel producers below profi tability,45 lackluster trading conditions in stainless steel and an oversupply of nickel, it is of little surprise that M&A was not popular in 2013.
45. “Australian nickel miners - emerging from the darkness,” Macquarie equities research, 8 October 2013.

55Mergers, acquisitions and capital raising in mining and metals |
Value of deals targeting nickel by acquirer ($m)
1,487Russia
Philippines
Canada
China
Australia
19
7
7
5
Value of deals targeting nickel by destination ($m)
1,487Russia
Philippines
Australia
Canada
Other
19
7
7
5
Value and volume of nickel deals
2012 2013Value ($m) 433 1,541
Volume 29 13 Cross border (% share of volume) 45 15
Includes deals where nickel is the target and/or acquirer commodity
Top 5 nickel deals (2013)
The table above may include deals that are reported as mergers of equals. However, targets and acquirers are assigned for the purposes of analysis per ThomsonONE classifi cations.
Value ($m) Type Target name Target country Acquirer name Acquirer country Stake (%)
1,487 Domestic GMK Noril'skiy Nikel' (Norilsk Nickel) Russia Crispian Investments Russia 6
15 Domestic Superkolong South Africa IT243 Pty (EMU Nickel and El Nino Mining)
South Africa 100
11 Domestic Toledo Mining Corp Philippines DMCI Mining Corp Philippines 27
8 Domestic Toledo Mining Corp Philippines DMCI Mining Corp Philippines 21
7 Domestic Dinty Lake Nickel Project Canada Unity Energy Corp Canada 100

56 | Mergers, acquisitions and capital raising in mining and metals
However, compared with other commodities, deal activity in the potash/phosphate sector improved in 2013 on a y-o-y basis. Deal value increased as fi nancial investors continued to invest in potash. For example, stake acquisitions in Uralkali by Onexim Group and Chengdong Investment Corp for $3.5b and $2b, respectively, were the largest deals of the year.
Also among the largest deals was Phosagro’s $190m increase in its existing stake in Apatit to support its growth strategy and consolidate through its subsidiaries. Other transactions in the sector were also largely motivated by consolidation, although the purchase of 20% of Karnalyte Resources by state-owned enterprise Gujurat State Fertilisers was a move to shore up future supply.
Interestingly, both Eurochem and Belaruskali made partial stake acquisitions of marine port facilities in 2013, refl ecting their long-term strategic growth interests to expand their exporting capability.
The dissolution of the joint venture formed by Uralkali and Belaruskali is likely to have a large impact on the potash/phosphate market and future deal activity. Along with Canada’s Canpotex, the organization controlled about 70% of global traded potash volume.48 With increased competition, we expect the industry to move toward a deregulated potash pricing format.
48. “Potash cartel break-up: implications for the farmer,” Macquarie Research, 31 July 2013, via ThomsonONE.
This could pose serious threats for the survival of marginal producers, as major players with lower production costs scale up their existing capacities. On the other hand, it could also create an opportunity for increased M&A activity as larger existing players seek greater control, increase their stakes in marginal resources and exploit effi ciencies to consolidate their position.
The medium-term forecast for the potash/phosphate market is one of surplus, despite a demand recovery from China. In addition, nations such as India and Brazil will be the main acquirers of potash/phosphate resources in coming years as they are the main consumers of fertilizer ingredients. However, looking beyond this, the dynamics of the industry could undergo a serious change as efforts to maintain higher prices - by matching supply with demand - are overtaken by boosting capacity utilization to supply more at lower prices.
We expect this to result in a number of outcomes: it will not only provide an edge to the larger, low cost marginal producers, but also pave the way for competitive pricing dynamics, while encouraging cost effi ciencies through strategic acquisition.
Potash/phosphate48 Copper
44 Aluminium
46 Coal
50 Gold
52 Iron ore
54 Nickel
56 Potash/phosphate
58 Silver/lead/zinc
62 Uranaium
60 Steel
2013 deal characteristics
Oversupply and competition issues, in the face of waning demand from major importers, resulted in consistently declining prices during the year. Further, with an outlook of continued greenfi eld project expansion by Eurochem, BHP Billiton and Sirius Minerals, there could be even greater pressure on short-term fundamentals going forward.

57Mergers, acquisitions and capital raising in mining and metals |
Value of deals targeting potash/phosphate by destination ($m)
5,796Russia
Canada
Brazil
Namibia
Australia
Other
76
36
27
24
8
Value of deals targeting potash/phosphate by acquirer ($m)
3,796
China
Russia
India
Brazil
Oman
Australia
Other
2,031
46
36
27
24
8
Value and volume of potash/phosphate deals
2012 2013Value ($m) 3,124 6,096
Volume 23 18 Cross border (% share of volume) 65 44
Includes deals where potash/phosphate is the target and/or acquirer commodity
Top 5 potash/phosphate deals (2013)
The table above may include deals that are reported as mergers of equals. However, targets and acquirers are assigned for the purposes of analysis per ThomsonONE classifi cations.
Value ($m) Type Target name Target country Acquirer name Acquirer country Stake (%)
3,543 Domestic Uralkali Russia Onexim Group Russia 22
2,000 Cross border Uralkali Russia Chengdong Investment Corp China 13
190 Domestic Apatit Russia PhosAgro Russia 13
98 Domestic MMTP Russia MKHK YevroKhim Russia 48
63 Domestic Apatit Russia PhosAgro Russia 1

58 | Mergers, acquisitions and capital raising in mining and metals
In 2013, the value of deals dropped fractionally by 1% to $4b, with a single zinc megadeal accounting for 41% of overall deal value. Volume dropped by 42%. With the imminent closure of a number of large zinc and lead mines, the market is expected to soon experience a supply defi cit. This, together with junior silver miners seeking investment partners in the capital-constrained environment, suggests a positive outlook for M&A activity in silver/lead/zinc assets in 2014.
The largest deal of 2013 was the acquisition of a 30% stake in Kazzinc by Samruk-Kazyna, Kazakhstan’s wealth fund, in a deal worth $1.65b. The stake acquired, although non-controlling, is a strategic one for the Kazakhstan Government, giving it security and control over domestic resources. Deals completed in the silver sector in 2013 were about expansion, with acquirers looking to form a stronger, low-cost precious metals asset base and tap into potential exploration and pre-development projects. Such deals included silver miner Hecla Mining’s $764m acquisition of gold company Aurizon Mines, and gold miner Coeur d’Alene Mines’ $269m acquisition of Orko Silver.
The outlook for zinc and lead mine supply remains weak, with a number of large zinc mines expected to either close or curtail production by 2016. This includes Glencore Xstrata’s Brunswick Mine in Canada, Minmetal’s Century Mine in Australia and Vedanta Resources’ Lisheen Mine in Ireland. This will remove approximately 15% of global zinc supply, which currently stands at 2.1m tonnes. Further, given the recent environment of capex reductions and depressed prices of zinc, new mine development has been on the backburner. We also expect there to be a decreasing interest in silver as a hedge against infl ation as governments move away from monetary easing and stimulus measures.
The return of strong fundamentals is expected to drive the price of zinc and lead up, which will act as a catalyst for M&A activity. Additionally, junior silver miners will be on the lookout for strategic deals to minimize project risk and improve access to capital.
Silver/lead/zinc48 Copper
44 Aluminium
46 Coal
50 Gold
52 Iron ore
54 Nickel
56 Potash/phosphate
58 Silver/lead/zinc
62 Uranium
60 Steel
2013 deal characteristics
Improving zinc market fundamentals, coupled with silver junior miners’ need for investment partners, is expected to lead to increased M&A activity in 2014.

59Mergers, acquisitions and capital raising in mining and metals |
Value of deals targeting silver/lead/zinc by destination ($m)
1,650Kazakhstan
China
Mexico
Other
813
354
21
Value of deals targeting silver/lead/zinc by acquirer ($m)
1,650Kazakhstan
China
US
Other
810
269
Canada 85
24
Value and volume of silver/lead/zinc deals
2012 2013Value ($m) 4,057 4,007
Volume 62 36 Cross border (% share of volume) 60 50
Includes deals where silver, lead or zinc is the target and/or acquirer commodity
Top 5 silver/lead/zinc deals (2013)
The table above may include deals that are reported as mergers of equals. However, targets and acquirers are assigned for the purposes of analysis per ThomsonONE classifi cations.
Value ($m) Type Target name Target country Acquirer name Acquirer country Stake (%)
1,650 Domestic Kazzinc Kazakhstan Samruk-Kazyna Kazakhstan 30
764 Cross border Aurizon Mines Canada Hecla Mining Co US 100
371 Domestic Inner Mongolia Yulong Mining China Science City Development Public Co China 69
269 Cross border Orko Silver Corp Mexico Coeur d'Alene Mines Corp US 100
199 Domestic Orion Minerals Kazakhstan Kazzinc; Verny Capital Kazakhstan 100
60 | Mergers, acquisitions and capital raising in mining and metals
Steelmakers continued to experience signifi cant pressure on profi ts during 2013 due to a combination of excess capacity and slowing demand as a result of continued weak economic fundamentals. It is, therefore, no surprise that M&A activity declined substantially in 2013, both in value and volume. In 2012, the $9.4b merger of Nippon Steel and Sumitomo Metals substantially infl ated the value of steel deals to $27.5b, with deal value in 2013 declining by 62% to $10.5b by comparison. In 2012, there were six deals worth over $1b in the steel sector compared with just two in 2013: Hyundai Steel’s acquisition of the cold-rolled steel business of Hyundai Hysco and ArcelorMittal’s sale of 15% of its Canadian iron ore mine.
Global economic recovery is needed to stimulate demand but before there can be any long-term structural growth in the steel industry, overcapacity has to be addressed. In a move to do just that, the Chinese Government issued new guidelines in 2013 to reduce excess capacity in certain basic industries. While there has been some removal of older capacity in China’s Hebei Province, it remains to be seen whether these guidelines will result in a policy for sustainable restructuring of the Chinese steel sector.
There was signifi cant transaction activity in China in 2013, representing 28% or $1.7b of the $5.9b total value of worldwide transactions targeting steel. The top four deals in China were largely aimed at restructuring existing steel companies:
1. Baoshan Iron & Steel acquired Baosteel Zhanjiang Iron & Steel for $797m to transfer production out of Shanghai to coastal regions. This was in honor of an agreement it signed with the Shanghai Municipal Government to reduce steel production by 6.6m tonnes by 2017.
2. Wuhan Iron and Steel Group Corporation integrated its Hong Kong-based holding company (comprising its seven mining subsidiaries) into its listed entity, Wuhan Iron and Steel Company Ltd, to reduce its operating costs and enhance its market competitiveness.
3. Jiuquan Iron and Steel Group (JISCO) incorporated JISCO Tianfeng Stainless Steel, its unlisted subsidiary, into another of its subsidiaries, JISCO Hongxing Iron and Steel, in a deal worth $729m. This restructure will see all of JISCO’s steel businesses with a listed status.
4. In a move to restructure assets, the Shanghai-listed arm, Inner Mongolia Baotou Steel Union acquired iron ore assets from parent company Baotou Iron & Steel Group for $593m.
As volatile raw material prices for iron ore, metallurgical coal and scrap steel continue to exert signifi cant pressure on steel margins, vertical integration remains a trend in the sector. This was evidenced by a couple of large deals in upstream mining assets. The largest was the $1b purchase of a 15% stake in ArcelorMittal’s Canadian iron ore mines by POSCO and China Steel, which also delivered them secure long-term off-take agreements proportionate to their shares. ArcelorMittal sold its stake mainly to pay off debt and also to extend its Liberian iron ore assets. In another big raw materials deal, Evraz increase its stake in Russian coking coal producer Raspadskaya to 82%, via its $733m acquisition of a further 50% stake in Raspadskaya’s majority owner, Corber Enterprises.
We are, however, increasingly seeing a balancing act between steelmakers either vertically investing capital upstream — into mines — or investing it into downstream operations so as to optimize products, increase margins, and gain greater traction with their customers. In light of lower profi tability across the sector, steelmakers also have to ensure they can service their debt on lower EBITDA margins, with the European steel sector being particularly hard hit.
For this reason, ThyssenKrupp wants to limit its exposure to the steel sector — its net debt at the end of September stood at $6.8b (twice its equity)49 — and has been moving into higher margin goods and services. In December 2013, it fi nally agreed a deal with ArcelorMittal and Nippon Steel & Sumitomo Metal Corporation (NSSMC) to sell its Steel America assets in Alabama for $1.6b. This gives ArcelorMittal and NSSMC greater market share in the US auto sector. Similarly, in the largest deal this year, Hyundai Steel acquired the cold-rolling steel business of Hyundai Hysco in December for $2.6b. This new integrated structure will help the companies to sell auto sheet to their affi liate company Hyundai Motor Group, which enjoys an 80% share of the Korean domestic auto market.
An emerging trend is steelmakers seeking out joint ventures or off-take agreements with miners. For example, Tata Steel Canada paid $30m to acquire a 51% participating interest in Labrador Iron
49. “ThyssenKrupp chief tests shareholder patience on steelmaker overhaul,” Reuters,12 January 2014.
Steel48 Copper
44 Aluminium
46 Coal
50 Gold
52 Iron ore
54 Nickel
56 Potash/phosphate
58 Silver/lead/zinc
62 Uranaium
60 Steel
2013 deal characteristics
Pressure on the steel sector did not ease in 2013. The main drivers of transactions were consolidation in China and vertical integration, with few deals done and a commensurate sharp drop in value.

61Mergers, acquisitions and capital raising in mining and metals |
Value of deals targeting steel by destination ($m)
2,842
US
South Korea
1,657China
Japan
India
Other
524
346
233
309
Value of deals targeting steel by acquirer ( $m)
2,842
Japan
South Korea
1,657China
India
Other
871
233
309
Mines’ Howse deposit. There has also been some downstream joint venture activity to enable steelmakers to access new markets. Nippon Steel and Sumitomo Metal Corp (NSSMC) paid $540m to secure a 50/50 joint venture with Australian steelmaker BlueScope. The joint venture company hopes to expand its product offering, as well as its footprint across Asia.
The outlook for the steel sector in 2014 remains cautiously optimistic as economic fundamentals steadily improve. Chinese steelmakers will become more responsive to the market in light of new economic reforms to reduce excess steel capacity. This is likely to prompt increased consolidation in the sector. Excess capacity is
an issue for the global sector and until it is addressed, profi tability will remain an issue.
Vertical integration into iron ore may not be as attractive in light of the increased supply on the market and forecast reduction or stabilization in iron ore prices. With limited availability of capital, steelmakers will be focusing on debt reduction and optimization of their existing operations. Larger steelmakers will also be seeking out acquisitions that will move them closer to high growth sectors - for example, ArcelorMittal’s and NSSMC’s acquisition of ThyssenKrupp’s North American operations to gain traction in the automotive sector.
Value and volume of steel deals
2012 2013Value ($m) 27,480 10,546
Volume 47 39 Cross border (% share of volume) 36 18
Includes deals where steel is the target and/or acquirer commodity
Top 5 steel deals (2013)
The table above may include deals that are reported as mergers of equals. However, targets and acquirers are assigned for the purposes of analysis per ThomsonONE classifi cations.
Value ($m) Type Target name Target country Acquirer name Acquirer country Stake (%)
2,616 Domestic Hyundai Hysco - Steel milling business South Korea Hyundai Steel Co South Korea 100
1,109 Cross border ArcelorMittal Mines Canada Canada POSCO; China Steel; EQ-Partners South Korea 15
797 Domestic Baosteel Zhanjiang Iron & Steel China Baoshan Iron & Steel Co China 72
737 Domestic WISCO International Resources Development & Investment
China Wuhan Iron and Steel Company China 100
733 Cross border Corber Enterprises Russia EVRAZ UK 50

62 | Mergers, acquisitions and capital raising in mining and metals
The uranium industry has been reeling under acutely weak prices due to oversupply, uncertain demand and slower-than-expected reactor restarts in Japan. This instability understandably resulted in an unfavorable environment for M&A in 2013. Excluding the year’s largest deal — the acquisition of Kazakhstan’s Uranium One by Russia’s ARMZ — Canada enjoyed the most activity, with juniors driving domestic activity via consolidation aimed at taking advantage of low valuations, while fi nancial fi rms acquired equity stakes.
The subdued deal activity in uranium can be attributed to the uncertainty surrounding its short- to medium-term outlook. Japan has about 40kt of uranium inventory, representing around 56% of the country’s annual demand, but it currently does not have an operational reactor: the fi rst reactor is slated to come back online in mid-2014. As a result, there is very little demand from uranium buyers to support prices. The situation in Japan is compounded by abundant near-term global uranium supply — about 19k tonnes excess supply during 201350 — along with continued demand uncertainty.
Reassuringly, there is a brighter outlook for the fi rst half of 2014. Power companies are expected to recommence buying activity and this might support uranium spot prices, although prices are expected to remain below $40 per pound in 1Q 2014.51 Long-term demand for uranium is still expected to be strong, with proposed nuclear power reactors to be established in China (171), India (56), Russia (41) and the US (26), while Japan is expected to restart its reactors. China is set to become the world’s largest nuclear generator in the next decade, with plans to increase nuclear capacity to 70GWe–80GWe by 2020, compared with the current
50. “Uranium Update,” Byron Capital Markets, 17 September 2013.51. “Uranium Update,” Byron Capital Markets, 17 September 2013.
12GWe.52 These emerging countries, together with Japan, will increasingly be looking to secure uranium supplies through vertical integration. A case in point is the 2012 acquisition of Australian mining company Extract Resources by China Guangdong Nuclear Power Group and the China-Africa Development Fund for $2.3b, giving them access to the world’s fourth-largest deposit of uranium, in Namibia.53
Looking ahead, uranium demand is expected to improve slightly but remain weak overall. This will see producers continue to cut both production and costs. In this environment, companies are unlikely to plan new investments or substantially increase their exposure to uranium.
Certain companies are investing in non-uranium assets to diversify their commodity portfolio. This could result in investment fl ows out of the uranium industry into related or unrelated assets. On the other hand, existing stakeholders may see the market weakness as an opportunity to increase their stakes due to lower valuations, which would be welcomed by cash-constrained junior mining ventures.
Once the market has greater clarity around Chinese demand and the timing of Japanese reactor restarts, this should trigger a fl ow of investments into the industry and renew interest in large projects, such as Cameco’s Kintyre.
Finally, one of the biggest uranium transactions expected to complete in 2014 is the divestment of the UK Government’s stake in Urenco, which has an estimated value of $13b. These factors point toward a more buoyant outlook for M&A activity in the year ahead, albeit tempered by the ongoing pressure on prices and demand.
52. “Uranium Sector Review,” Resource Capital Research, 10 September 2012, via ThomsonONE.53. “China digs deep for uranium to meet its rising energy demands,” Business Standard, 17 July 2013.
Uranium48 Copper
44 Aluminium
46 Coal
50 Gold
52 Iron ore
54 Nickel
56 Potash/phosphate
58 Silver/lead/zinc
62 Uranium
60 Steel
2013 deal characteristics
In an exceptionally challenging year, both the value and volume of deals registered a steep year-on-year fall, with deal value dropping to just $2b and only 33 deals completed.

63Mergers, acquisitions and capital raising in mining and metals |
1,347Russia
Canada
Other
473
52
Value of deals targeting uranium by acquirer ($m)Value of deals targeting uranium by destination ($m)
1,347Kazakhstan
Canada
Australia
Sweden
Other
334
115
58
18
Value and volume of uranium deals
2012 2013Value ($m) 3,917 2,028
Volume 43 33 Cross border (% share of volume) 60 45
Includes deals where uranium is the target and/or acquirer commodity
Top 5 uranium deals (2013)
The table above may include deals that are reported as mergers of equals. However, targets and acquirers are assigned for the purposes of analysis per ThomsonONE classifi cations.
Value ($m) Type Target name Target country Acquirer name Acquirer country Stake (%)
1,347 Cross border Uranium One Kazakhstan ARMZ Russia 48
215 Domestic Alpha Minerals Canada Fission Uranium Corp Canada 100
140 Cross border NUKEM Germany Cameco Corp Canada 100
78 Cross border Avocet Resources Australia Lion One Metals Canada 100
66 Domestic Fission Energy Corp Canada Denison Mines Corp Canada 100

About EYEY is a global leader in assurance, tax, transaction and advisory services. The insights and quality services we deliver help build trust and confidence in the capital markets and in economies the world over. We develop outstanding leaders who team to deliver on our promises to all of our stakeholders. In so doing, we play a critical role in building a better working world for our people, for our clients and for our communities.
EY refers to the global organization, and may refer to one or more, of the member firms of Ernst & Young Global Limited, each of which is a separate legal entity. Ernst & Young Global Limited, a UK company limited by guarantee, does not provide services to clients. For more information about our organization, please visit ey.com.
© 2014 EYGM Limited.All Rights Reserved.
EYG no. ER0138CSG/GSC2013/1220852ED None
In line with EY’s commitment to minimize its impact on the environment, this document has been printed on paper with a high recycled content.
This material has been prepared for general informational purposes only and is not intended to be relied upon as accounting, tax, or other professional advice. Please refer to your advisors for specific advice.
ey.com/mining
EY | Assurance | Tax | Transactions | Advisory
Global Mining & Metals LeaderMike ElliottTel: +61 2 9248 [email protected]
OceaniaScott GrimleyTel: +61 3 9655 [email protected]
China and MongoliaPeter MarkeyTel: +86 21 2228 2616 [email protected]
JapanAndrew CowellTel: +81 3 3503 [email protected]
AfricaWickus BothaTel: +27 11 772 [email protected]
Commonwealth of Independent StatesEvgeni KhrustalevTel: +7 495 648 [email protected]
France and LuxemburgChristian MionTel: +33 1 46 93 65 [email protected]
IndiaAnjani AgrawalTel: +91 982 061 [email protected]
United Kingdom & IrelandLee DownhamTel: +44 20 7951 [email protected]
Area contactsUnited States LeaderAndy MillerTel: +1 314 290 [email protected]
CanadaBruce SpragueTel: +1 604 891 [email protected]
South America and Brazil LeaderCarlos AssisTel: +55 21 3263 [email protected]
Transaction advisory services contactsGlobal and EMEIA Mining & Metals Transactions LeaderLee DownhamTel: +44 20 7951 [email protected]
Asia-Pacific Mining & Metals LeaderPaul MurphyTel: +61 3 9288 [email protected]
Americas Mining & Metals Transactions LeaderBob StallTel: +1 404 817 5474 [email protected]
Japan Mining & Metals Transactions LeaderKunihiko TaniyamaTel: +81 3 4582 6400 [email protected]
EY’s Global Mining & Metals CenterWith a volatile outlook for mining and metals, the global sector is focused on cost optimization and productivity improvement, while poised for value-based growth opportunities as they arise. The sector also faces the increased challenges of changing expectations in the maintenance of its social license to operate, skills shortages, effectively executing capital projects and meeting government revenue expectations.
EY’s Global Mining & Metals Center brings together a worldwide team of professionals to help you succeed — a team with deep technical experience in providing assurance, tax, transactions and advisory services to the mining and metals sector. The Center is where people and ideas come together to help mining and metals companies meet the issues of today and anticipate those of tomorrow. Ultimately it enables us to help you meet your goals and compete more effectively.