merger case analysis
TRANSCRIPT

Date: To:
From:
Subject:
As requested by the senior partners of Copeland Cluster and Associates on April 11, 2011, our team has performed an analysis of Activision Blizzard, Inc. and prepared a report. Our report contains details of the effectiveness of Activision Blizzard, Inc.’s current strategy. Through our analysis of the effectiveness of its current strategy, we were able to identify the key strategic issues Activision Blizzard, Inc. is facing and pose specific recommendations to add economic value in the future. This report was created with consideration of the following criteria:
• The current strategy of the company• The competitive dimensions• Key strategic issues • Recommendations
Our research showed Activision Blizzard, Inc.’s current strategy, has in many ways, been immensely successful. Research further indicates that although successful, Activision’s current strategy might be setting the company up for a potentially dangerous future. Our team would especially like to thank Catherine Penrod for all of her assistance in the making and editing of this report. We would be pleased to discuss our report and recommendations with you upon request. Please feel free to call or email our team member Student 4 at XXX-XXX-XXXX or [email protected]. She is available at any day after 12 p.m. Our team would like to thank you for your faith in selecting us to prepare this company analysis.
May 3, 2011
Professor KeiferDr. KigerProfessor MartelDr. Tucker
Team #Student 1Student 2Student 3Student 4Student 5
Analysis of Activision Blizzard, Inc.


THE ACTIVE VISION: THE DEMAND TO
EXPAND
Prepared for:Professor Keifer
Dr. KigerProfessor Martel
Dr. Tucker
Prepared by:Team #
Student 1Student 2Student 3Student 4Student 5
May 3, 2011

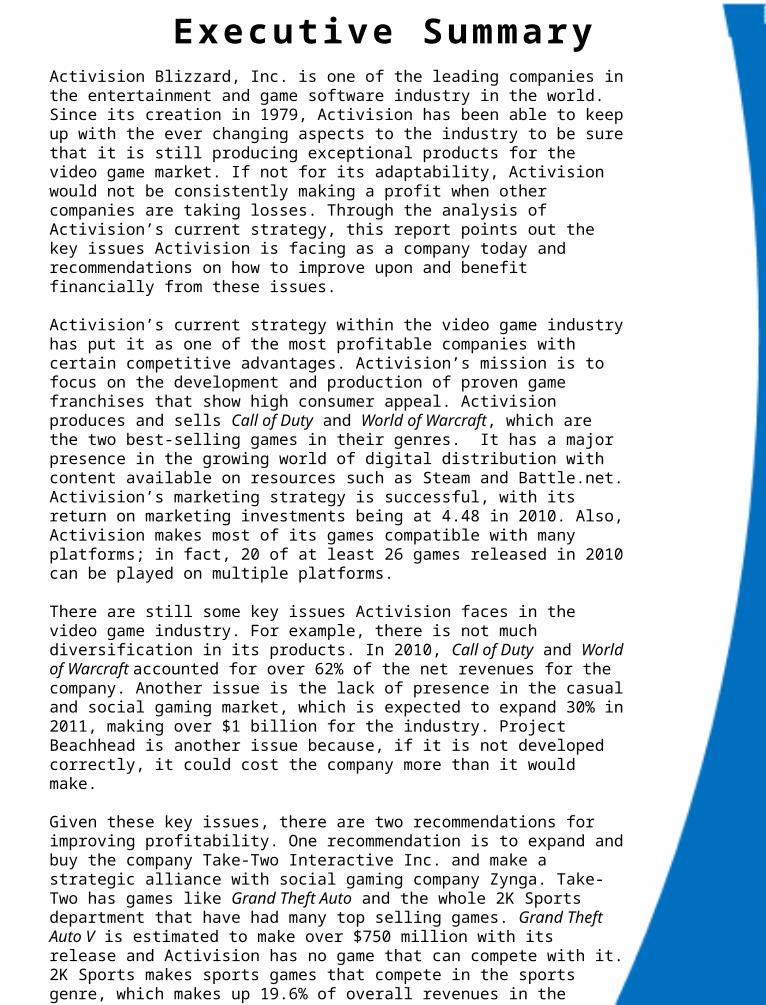
E xe c u t ive S u m m a r yActivision Blizzard, Inc. is one of the leading companies in the entertainment and game software industry in the world. Since its creation in 1979, Activision has been able to keep up with the ever changing aspects to the industry to be sure that it is still producing exceptional products for the video game market. If not for its adaptability, Activision would not be consistently making a profit when other companies are taking losses. Through the analysis of Activision’s current strategy, this report points out the key issues Activision is facing as a company today and recommendations on how to improve upon and benefit financially from these issues. Activision’s current strategy within the video game industry has put it as one of the most profitable companies with certain competitive advantages. Activision’s mission is to focus on the development and production of proven game franchises that show high consumer appeal. Activision produces and sells Call of Duty and World of Warcraft, which are the two best-selling games in their genres. It has a major presence in the growing world of digital distribution with content available on resources such as Steam and Battle.net. Activision’s marketing strategy is successful, with its return on marketing investments being at 4.48 in 2010. Also, Activision makes most of its games compatible with many platforms; in fact, 20 of at least 26 games released in 2010 can be played on multiple platforms. There are still some key issues Activision faces in the video game industry. For example, there is not much diversification in its products. In 2010, Call of Duty and World of Warcraft accounted for over 62% of the net revenues for the company. Another issue is the lack of presence in the casual and social gaming market, which is expected to expand 30% in 2011, making over $1 billion for the industry. Project Beachhead is another issue because, if it is not developed correctly, it could cost the company more than it would make. Given these key issues, there are two recommendations for improving profitability. One recommendation is to expand and buy the company Take-Two Interactive Inc. and make a strategic alliance with social gaming company Zynga. Take-Two has games like Grand Theft Auto and the whole 2K Sports department that have had many top selling games. Grand Theft Auto V is estimated to make over $750 million with its release and Activision has no game that can compete with it. 2K Sports makes sports games that compete in the sports genre, which makes up 19.6% of overall revenues in the industry. Activision does not make any competitive sports games. Making a strategic alliance with Zynga will give Activision a presence in the social gaming field. The second recommendation is to make Beachhead profitable and capable of being the best digital distribution website in the industry. With these recommendations, it is estimated Activision would start to make a 20% increase in net revenues for the next five years. Given the research, these recommendations will position Activision as the number one video game company in the world.

Ta b l e o f C o n te n t s
Introduction .................................................................................................................................................. 1
Current Strategy ........................................................................................................................................... 2
Overview ................................................................................................................................................... 2
Game Genres ............................................................................................................................................. 3
Overview ............................................................................................................................................... 3
Activision Blizzard, Inc. .......................................................................................................................... 4
THQ ....................................................................................................................................................... 5
Electronic Arts ....................................................................................................................................... 5
Take-Two Interactive ............................................................................................................................ 5
Seasonality ................................................................................................................................................ 6
Activision Blizzard, Inc. .......................................................................................................................... 6
Electronic Arts ....................................................................................................................................... 7
Take-Two Interactive ............................................................................................................................ 7
THQ ....................................................................................................................................................... 7
Digital Distribution .................................................................................................................................... 8
Activision Blizzard, Inc. .......................................................................................................................... 8
Call of Duty ............................................................................................................................................ 9
Electronic Arts ..................................................................................................................................... 10
Take-Two Interactive .......................................................................................................................... 11
THQ ..................................................................................................................................................... 11
Marketing Strategies ............................................................................................................................... 12
Activision Blizzard, Inc. ........................................................................................................................ 12
Electronic Arts ..................................................................................................................................... 13
Take-Two Interactive .......................................................................................................................... 13
THQ ..................................................................................................................................................... 13
Brand Name Recognition .................................................................................................................... 14
Platform Compatibility ............................................................................................................................ 16

Key Issues .................................................................................................................................................... 20
Overview ................................................................................................................................................. 20
Franchise Diversification ......................................................................................................................... 21
Casual and Social Gaming ....................................................................................................................... 24
Cost of Project Beachhead ...................................................................................................................... 25
Recommendations ..................................................................................................................................... 26
Overview ................................................................................................................................................. 26
Expansion: Take-Two.............................................................................................................................. 27
Impact of Take-Two Merger .................................................................................................................... 30
Expansion: Zynga Alliance ....................................................................................................................... 32
Impact of Zynga Alliance ......................................................................................................................... 33
Subscription Fees for Beachhead ............................................................................................................ 34
Impact of Fees for Beachhead ................................................................................................................ 35
Conclusion .................................................................................................................................................. 37
Appendix A: Net Revenues by Quarter ...................................................................................................... 39
Appendix B: Primary Research Survey....................................................................................................... 41
Appendix C: GAAP Net Revenue Growth by Platforms ............................................................................. 44
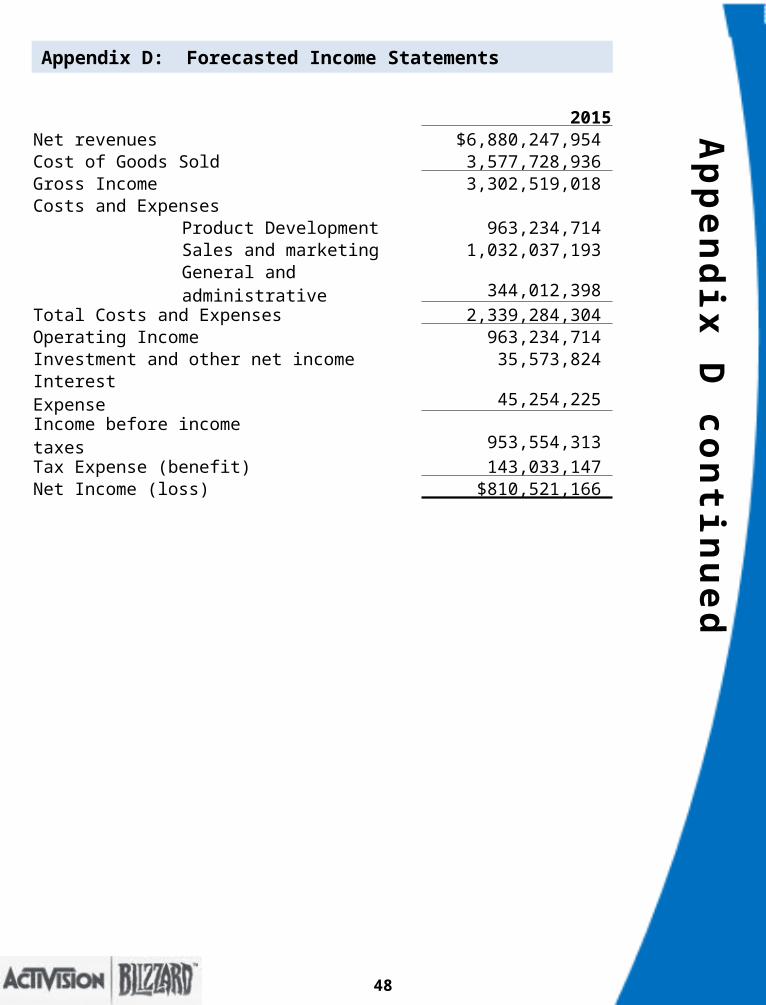
Appendix D: Forecasted Income Statements ............................................................................................ 46
Appendix E: Forecasted Balance Sheet ...................................................................................................... 50
Appendix F: Ratios ...................................................................................................................................... 56
References .................................................................................................................................................. 58


Introduction Current Strategy Key Issues Recommendations Conclusion
The objective of this report is to develop strategic recommendations Activision Blizzard, Inc. can use to improve its market value and distinguish its competitive advantage in the interactive entertainment software industry. Since its inception on July 9, 2008, the Activision Blizzard Incorporation merger, known as the Business Combination, has made the company an industry leader in the development and publishing of interactive entertainment software (Activision Blizzard, Inc., 2011). This $18 billion deal, although shown to be a profitable investment, has created a potentially dangerous environment for Activision Blizzard, Inc. in the future. As of May 2, 2011, ATVI stock was closed at $11.43, up 240 basis points from 2010. This indicates that in the past year, the investors future perception of the company is positive. An analysis of Activision’s current strategy, financial position, and competitive dimensions was conducted in order to develop possible recommendations for Activision Blizzard, Inc. to remain competitive.
Ob
jec
tive
“To continue to be one of the largest, most profitable, and well respected interactive entertainment software companies of the world” (Activision , 2011).
--Activision Blizzard, Inc.
ATVI
TTWO
ERTS
THQI
1

Ov
er
vie
wIntroduction
Current Strategy
Key Issues Recommendations Conclusion
Derived from its annual report, Activision’s strategy is to focus on the development and publishing activities of proven franchises, or content that has the potential to become franchised with sustainable mass consumer appeal and recognition (Activision Blizzard, Inc., 2011). Its main focus areas include the Call of Duty franchise, Project Beachhead, downloadable content, new entertainment franchises, licensed properties, and development of Bungie’s next big hit (Activision Blizzard, Inc., 2011). Research indicates its game genres, marketing strategies, platform compatibility, seasonality of releases, and digital distribution to be the competitive dimensions facing Activision Blizzard, Inc.
Game GenresFranchise
Diversification
ExpansionSeasonality
Franchise Diversification
Digital Distribution
Lacking Presence in Casual and Social Games
Expansion
Development Cost of Project
Beachhead
Profitability of Beachhead
Marketing Strategy
Platform Compatibility
Competitive Dimensions Recommendations
Key Issues
2

Ga
me
Ge
nre
s
There are different types of video games produced today with the goal that everyone can find a game to suit their entertainment needs. Since the start of the industry, the number of genres have grown to accommodate the market. The genres currently offered are: action, adventure, educational, racing / driving, role-playing (RPG), simulation, sports, and strategy. Underneath these basic genres, there are many sub-genres offered to meet specific needs (Arsenault, 2009).
Of the genres and sub-genres, the best-selling ones are action, family entertainment, shooting, and sports games. Since 2007, these four groups have consistently sold more units than any of the other types of games made. In 2009, action games made up 19.5%, sports games made up 19.6%, family entertainment games made up 15.3%, and shooter games made up 12.2% of the video game market. All together that makes ups 66.6% of the units sold during 2009, leaving just 33.4% of the rest of the market for the other game genres. (Entertainment Software Association, 2010)
From 2007 -2009, the action, shooter, sports, and family entertainment genres have consistently had the top selling titles. The action genre has decreased 280 basis points in sales since 2007, which means the action based games have started to decline in consumer appeal. The shooter genre has increased 10 basis points and has always been right around the same percentage, meaning it is a very consistent genre in the industry. Sports games have increased 550 basis points since 2007, making sports games a very profitable solution when making a game. The family entertainment games have decreased 230 basis points since 2007, which possibly means a drop in appeal towards the gaming market. (Entertainment Software Association, 2010)
Sports Games
20%
Action Games
20%
Family En-tertain-
ment15%
Shooter Games
12%
Other Genres
33%
Best Selling Video Game Genres by Units Sold, 2009
Action Games
22%
Family En-tertain-
ment18%
Sports Games
14%
Shooter Games
12%
Other Genres
34%
Best Selling Video Game Genres by Units Sold, 2007
IntroductionCurrent Strategy
Key Issues Recommendations Conclusion
(Entertainment Software Association, 2010)
(Entertainment Software Association, 2010)
3

Ga
me
Ge
nre
s
Activision develops products in the genres of first person action, action/adventure, role-playing, simulation and strategy (Activision Blizzard Inc., 2011). Of these, the best seller has to be in the first person action area with the Call of Duty franchise. Call of Duty has consistently been a top performer for Activision since its release in 2003. Life-to-date, Call of Duty has earned over $4.2 billion worth of revenue, with the newest installment, Call of Duty: Black Ops, making over $650 million in the first five days of sales (Activision Blizzard Inc., 2011).
Blizzard Entertainment’s focus is on the MMORPG genre of video games. It is the leader in this field making three of the most popular games to date, World of Warcraft Diablo, and Starcraft. World of Warcraft is one of the most widely played games in the world, with over 12 million online players having a subscription to the software (Activision Blizzard Inc., 2011). The most recent expansion, World of Warcraft: Cataclysm, by January 10, 2011, sold over 4.7 million copies worldwide setting the record for computer game sales. The first day sales of Cataclysm also set a record in making over $3.3 million in revenue. This shows Blizzard’s stronghold on the MMORPG genre in the gaming industry.
(Lafferty, 2010)
(Wallpaperez, n.d.)
IntroductionCurrent Strategy
Key Issues Recommendations Conclusion
4

Ga
me
Ge
nre
s
THQ Inc. has a main focus on the fighting, racing, action, shooting and strategy genres of video gaming. The most popular games THQ has published in the past have been in the fighting genre. The two biggest fighting games developed are based off of Ultimate Fighting Championship (UFC) and World Wrestling Entertainment (WWE) (THQ Inc., 2009). Currently, these are two of the most popular fighting games on the market, giving THQ a firm grasp on that genre of gaming.
Electronic Arts Inc. has a wide variety of genres it produces such as action/adventure, casual, sports, family, fantasy, racing, music, massively-multiplayer online role-playing, simulation and strategy. The biggest money maker for EA is in the EASports division, where it makes games like Madden and FIFA and other sports games. “Net revenue for fiscal year 2010 was driven by FIFA 10, Madden NFL 10 and The Sims 3” (Electronic Arts Inc., 2010). If not for these titles, EA’s net revenues would have been greatly lower than they already have been. EA has seen a decrease in net revenues over the past years due to competition with other competitors in the same fields EA used to dominate.
Take-Two Interactive is another game publisher that specializes in genres including action, adventure, racing, role-playing, sports and strategy. It publishes games under Rockstar Games and 2K, which focus on action and sports games. Rockstar Games makes the Grand Theft Auto franchise, which is one of the most popular games ever made. 2K makes sports games like NBA 2K11, which are very popular and played among many age groups in the world (Take-Two Interactive Software, Inc., 2010).
(Shane, 2011) (THQ UFC Undisputed 2010 for Xbox 360, 2011)
(Madden 2011 to Hit iPads, 2010) (Rodda, 2010)
(Noe, 2009) (Srisavasdi, 2010)
Electronic Arts
Take-Two Interactive
THQ
IntroductionCurrent Strategy
Key Issues Recommendations Conclusion
5

Se
as
on
ali
tyIntroduction
Current Strategy
Key Issues Recommendations Conclusion
Research shows Activision Blizzard, Inc.’s strategic releasing of top titles during this time frame to have had extreme market success. Last year it released six titles of its most popular franchises on five different platforms; DJ Hero 2, Tony Hawk: SHRED, James Bond 007: Blood Stone, Call of Duty: Black Ops, Bakugan: Defenders of the Core, and World of Warcraft: Cataclysm (Activision Blizzard, Inc., 2011). According to its internal estimates, Call of Duty: Black Ops set a new record in interactive entertainment retail sales of over $650 million during its first five days and has grossed over $1 billion year to date (Activision Blizzard, Inc., 2011). The company also set records on December 7, 2010, with its release of World of Warcraft: Cataclysm selling “3.3 million copies worldwide…during its first 24 hours, making it the fastest-selling PC game of all time” (Activision Blizzard, Inc., 2011, p. 41).
Seasonal releases have increased Activision’s net sales growth rate 219%, 200%, and 167% basis points from third quarter to fourth quarter sales of 2008, 2009, and 2010 respectively (refer to appendix A for revenues in dollars). (Activision Blizzard, Inc. , 2010) (Activision Blizzard, Inc. , 2009).
2008
2009
2010
0 50 100 150 200 250
219%
200%
167%
Net Sales Growth Rate Comparing third & fourth quarter sales
Percentage of Growth Rate
Research indicates strong comparisons between revenue and the seasonality of video game releases. Company reports suggest the highest sale periods occur during the fourth quarter of the year. This is primarily driven by consumer heterogeneity of holiday season purchases.
6
IntroductionCurrent Strategy
Key Issues Recommendations Conclusion
Se
as
on
ality
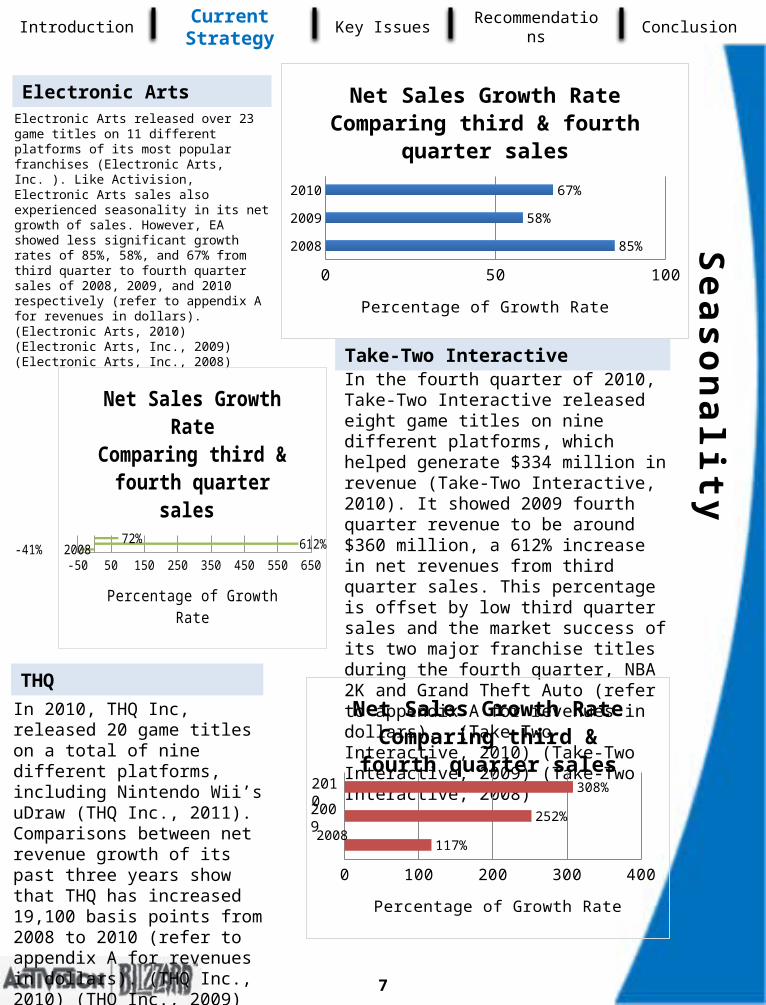
Electronic Arts released over 23 game titles on 11 different platforms of its most popular franchises (Electronic Arts, Inc. ). Like Activision, Electronic Arts sales also experienced seasonality in its net growth of sales. However, EA showed less significant growth rates of 85%, 58%, and 67% from third quarter to fourth quarter sales of 2008, 2009, and 2010 respectively (refer to appendix A for revenues in dollars). (Electronic Arts, 2010) (Electronic Arts, Inc., 2009) (Electronic Arts, Inc., 2008) In the fourth quarter of 2010, Take-Two
Interactive released eight game titles on nine different platforms, which helped generate $334 million in revenue (Take-Two Interactive, 2010). It showed 2009 fourth quarter revenue to be around $360 million, a 612% increase in net revenues from third quarter sales. This percentage is offset by low third quarter sales and the market success of its two major franchise titles during the fourth quarter, NBA 2K and Grand Theft Auto (refer to appendix A for revenues in dollars). (Take-Two Interactive, 2010) (Take-Two Interactive, 2009) (Take-Two Interactive, 2008)
In 2010, THQ Inc, released 20 game titles on a total of nine different platforms, including Nintendo Wii’s uDraw (THQ Inc., 2011). Comparisons between net revenue growth of its past three years show that THQ has increased 19,100 basis points from 2008 to 2010 (refer to appendix A for revenues in dollars). (THQ Inc., 2010) (THQ Inc., 2009) (THQ Inc., 2008)
2008
2009
2010
0 50 100
85%
58%
67%
Net Sales Growth RateComparing third & fourth quarter
sales
Percentage of Growth Rate
2008
2009
2010
-50 50 150 250 350 450 550 650
-41%
612%
72%
Net Sales Growth RateComparing third & fourth
quarter sales
Percentage of Growth Rate
0 100 200 300 400
117%
252%
308%
Net Sales Growth RateComparing third & fourth
quarter sales
Percentage of Growth Rate
2008
Electronic Arts
Take-Two Interactive
THQ
2010
2009
7
Dig
ita
l D
istr
ibu
tio
nIntroduction
Current Strategy
Key Issues Recommendations Conclusion
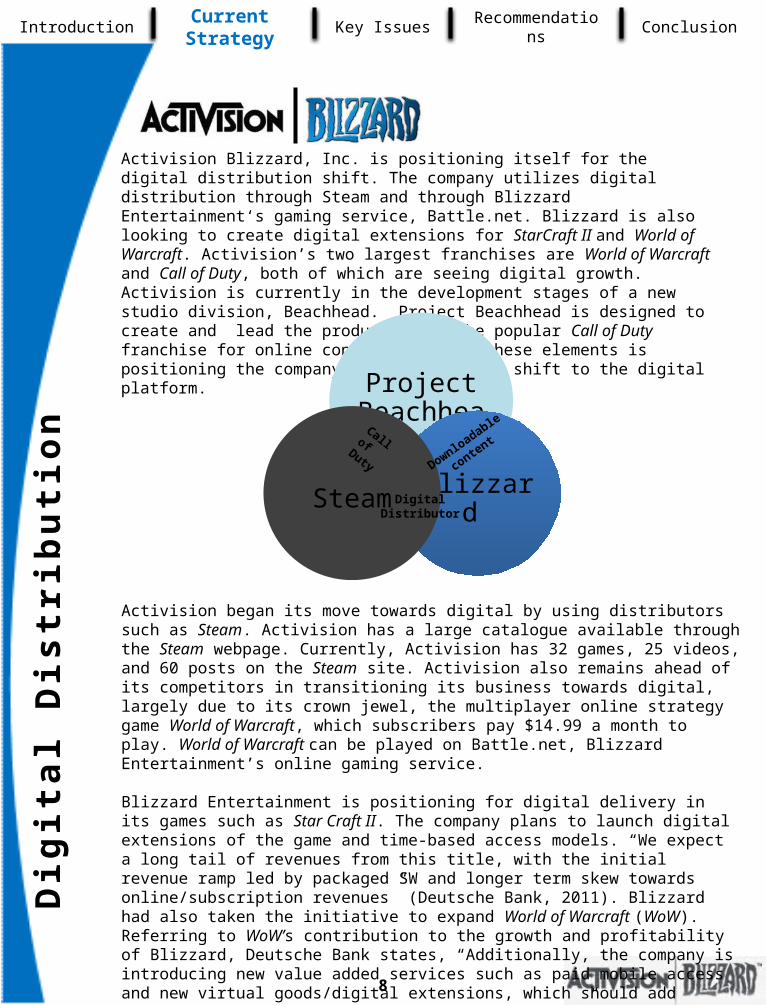
Activision Blizzard, Inc. is positioning itself for the digital distribution shift. The company utilizes digital distribution through Steam and through Blizzard Entertainment‘s gaming service, Battle.net. Blizzard is also looking to create digital extensions for StarCraft II and World of Warcraft. Activision’s two largest franchises are World of Warcraft and Call of Duty, both of which are seeing digital growth. Activision is currently in the development stages of a new studio division, Beachhead. Project Beachhead is designed to create and lead the production of the popular Call of Duty franchise for online content. Each of these elements is positioning the company for a successful shift to the digital platform.
Activision began its move towards digital by using distributors such as Steam. Activision has a large catalogue available through the Steam webpage. Currently, Activision has 32 games, 25 videos, and 60 posts on the Steam site. Activision also remains ahead of its competitors in transitioning its business towards digital, largely due to its crown jewel, the multiplayer online strategy game World of Warcraft, which subscribers pay $14.99 a month to play. World of Warcraft can be played on Battle.net, Blizzard Entertainment’s online gaming service.
Blizzard Entertainment is positioning for digital delivery in its games such as Star Craft II. The company plans to launch digital extensions of the game and time-based access models. “We expect a long tail of revenues from this title, with the initial revenue ramp led by packaged SW and longer term skew towards online/subscription revenues” (Deutsche Bank, 2011). Blizzard had also taken the initiative to expand World of Warcraft (WoW). Referring to WoW’s contribution to the growth and profitability of Blizzard, Deutsche Bank states, “Additionally, the company is introducing new value added services such as paid mobile access and new virtual goods/digital extensions, which should add incremental revenues and drive engagement levels” (Deutsche Bank, 2011).
8
Project Beachhead
Blizzard Steam
Call of Duty
Downloadable
content
DigitalDistributor

Dig
ital D
istr
ibu
tion
IntroductionCurrent Strategy
Key Issues Recommendations Conclusion
In February 2011, Activision announced its newest division, Beachhead. Beachhead is Activision’ s new digital platform for the Call of Duty community. The studio will focus on the digital delivery of new and innovative Call of Duty content. As quoted from Activision Publishing CEO Eric Hirshberg, the plan of Beachhead is to “bring the online experience and console play together for the first time through a platform [that has been] in development for over a year" (Alexander, 2011, p. 1). Activision is currently planning downloadable content for Call of Duty that has more commercial potential than most console games.
Another feature of Beachhead will be the ability to track individuals scores and statistics regardless of the platform Call of Duty was played on. “We enter 2011 a leaner, more focused organization”, Hirshberg said, asserting that the company would only invest in those areas where it believed it had a “true competitive advantage” (Alexander, 2011, p. 1). This digital division of Activision positions the company for a high-profit opportunity and access to the growth of digital distribution.
Activision Blizzard Inc. Q4 Earnings Preview 2010Three days prior to the earnings report and initial announcement of Project
Beachhead (Stock Wizard, 2011)
9
(Activision, 2011)

Dig
ita
l D
istr
ibu
tio
n
Electronic Arts
IntroductionCurrent Strategy
Key Issues Recommendations Conclusion
The digital strategy of Electronic Arts is to reign supreme in the casual and social networking games platform. In November 2009, Electronic Arts bought out Playfish, an independent studio and leading creator of social network games. Then in October of 2010 EA acquired Chillingo, a leading independent game publisher recognized for innovative games and software for various platforms. Chillingo is the leading publisher for Apple applications.
Electronic Arts is working on transforming Mass Effect 2 (first person shooter game) as a potential digital game. Without divulging a specific figure, EA CEO John Riccitiello stated, “The digital version would up accounting for a “double-digit percentage of total sales.” The EA executive also said that a broader digital distribution program on the PlayStation Network as well as Microsoft’s Xbox Live might be vulnerable by what he termed a “channel conflict” between the companies’ digital networks and physical goods business units (MESA, 2011).
Electronic Arts, Inc. Sports President Peter Moore stated in his 2011 M16 keynote address, “Companies that refuse to keep up with changes in consumer behavior are bound to fail. Our competitors scoffed when we invested in social gaming, by buying Playfish, they scoffed at our direct-to-consumer models. But we are number one in mobile games, number one in casual games and number two in social games” (Brightman, 2011). Currently Zynga, known for hits such as FarmVille, CityVille, and FrontierVille, holds the number one position in social gaming.
One, one, and two Mass Effect 2
10
• Increased EA’s intangibles by $6 million (16 percent)
• Decreased acquisition-related contingent consideration by $25 million
• Decreased cash used in investing activities by $464 million primarily due to a $262 million decrease in the acquisitions of subsidiaries Playfish
• Contributed to decrease in net deferred income tax asset position
• Increased market leadership on the Apple® platform and strengthened position as the world's leading wireless entertainment publisher for EA Mobile (TM)
Chillingo

•
Dig
ital D
istr
ibu
tion
Take-Two Interactive is no stranger to digital distribution. They are the leading publisher and developer of interactive entertainment software and have published hits such as Grand Theft Auto, Liberty City Stories and the Red Dead Redemption expansion. “At the moment, digital distribution represents less than 15% of Take-Two revenues. These numbers come from Strauss Zelnick, CEO of Take-Two, in an interview with Bloomberg. Even though digital distribution of profits are rising, Zelnick believes that there are technological barriers that prevent the acquisition of digital products” (Gadget Ground, 2011).
Take-Two is cautious that if games become strictly digital, then it will alienate too many customers. Take-Two distributes its online games through Steam. Take-Two has also touched on cloud-gaming services, such as OnLive. Take-Two has distributed games such as BioShock and Borderlands through OnLive’s streaming service. Overall, the company focuses primarily on the PS3, Xbox 360 and Wii consoles since they allow Take-Two to push the game to their technical limitations. Take-Two predicts “the tablet PCs will account for 50% of all consumers of entertainment and information devices in the years to come” (Hill, 2010).
THQ is beginning to focus on the digital delivery of games and content as a main revenue driver for the company moving forward. “In an interview with Forbes, Farrell talked up the reduced-price model the company is debuting with the upcoming MX vs. ATV Alive, which will release at a lowered price of $40 in the hopes of attracting a larger user base to purchase over 100 pieces of downloadable content” (Orland, 2011).
Digital game distribution has been an advantage for THQ because of lower overall distribution fees and because it eliminates the need to maintain costly inventory. THQ CEO Brain Farrell explains, “If we deliver an experience that the gamer values and wants more of, we build on that with digitally delivered downloadable content, which has the effect of increasing the average revenue per user,"(Orland, 2011). THQ streams games through the cloud-computing service, OnLive, as well as 28 games through the online distributor, Steam.
Take-Two Interactive
THQ
IntroductionCurrent Strategy
Key Issues Recommendations Conclusion
Grand Theft Auto
Sid Meier’s Civiliztion Homefront
Warhammer
BioShock Borderlands Metro 2033 Homefront
11
*The third tier games are based on Top Sellers from the Stream and Onlive game sites. THQ and Take Two Interactive distribution is not limited to these games
Ma
rke
tin
g S
tra
teg
ies
IntroductionCurrent Strategy
Key Issues Recommendations Conclusion
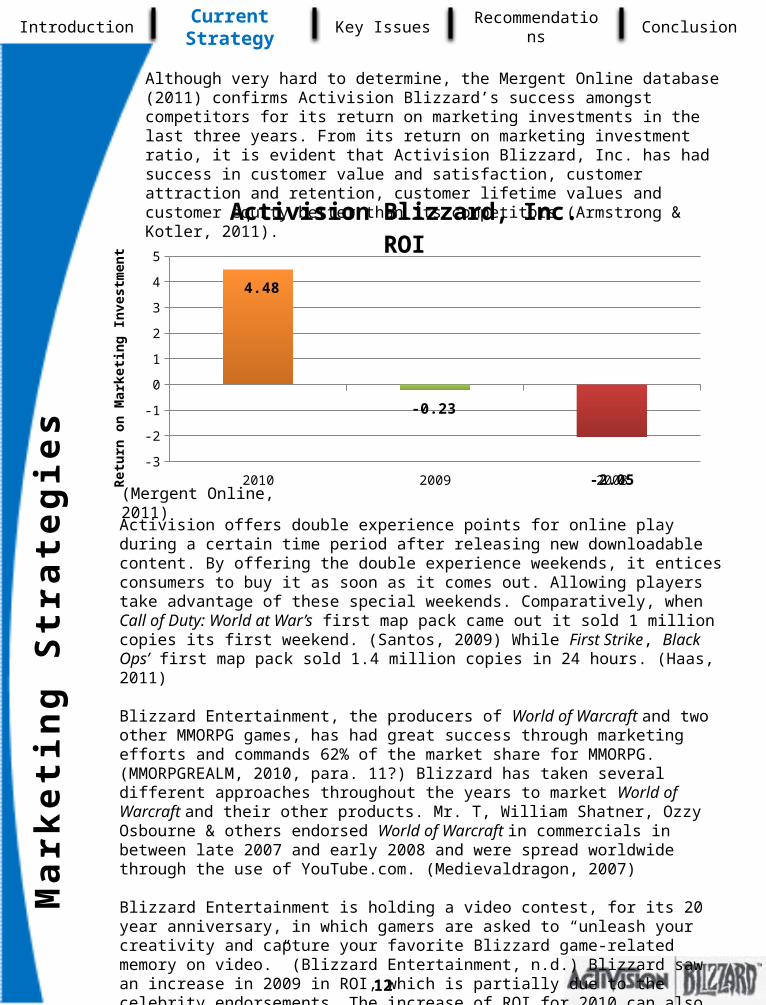
Activision offers double experience points for online play during a certain time period after releasing new downloadable content. By offering the double experience weekends, it entices consumers to buy it as soon as it comes out. Allowing players take advantage of these special weekends. Comparatively, when Call of Duty: World at War’s first map pack came out it sold 1 million copies its first weekend. (Santos, 2009) While First Strike, Black Ops’ first map pack sold 1.4 million copies in 24 hours. (Haas, 2011)
Blizzard Entertainment, the producers of World of Warcraft and two other MMORPG games, has had great success through marketing efforts and commands 62% of the market share for MMORPG. (MMORPGREALM, 2010, para. 11?) Blizzard has taken several different approaches throughout the years to market World of Warcraft and their other products. Mr. T, William Shatner, Ozzy Osbourne & others endorsed World of Warcraft in commercials in between late 2007 and early 2008 and were spread worldwide through the use of YouTube.com. (Medievaldragon, 2007)
Blizzard Entertainment is holding a video contest, for its 20 year anniversary, in which gamers are asked to “unleash your creativity and capture your favorite Blizzard game-related memory on video.” (Blizzard Entertainment, n.d.) Blizzard saw an increase in 2009 in ROI, which is partially due to the celebrity endorsements. The increase of ROI for 2010 can also be partially explained by the sales of downloadable content (DLC) with the double experience points incentives. The outcome for 2011 is looking to grow as well with 1.4 million sales of First Strike (DLC) and the video contest that Blizzard has created for it’s 20 year anniversary.
2010 2009 2008-3
-2
-1
0
1
2
3
4
5
4.48
-0.23
-2.05
Activision Blizzard, Inc.ROI
Retu
rn o
n M
arke
ting
Inve
stm
ent
(Mergent Online, 2011)
Although very hard to determine, the Mergent Online database (2011) confirms Activision Blizzard’s success amongst competitors for its return on marketing investments in the last three years. From its return on marketing investment ratio, it is evident that Activision Blizzard, Inc. has had success in customer value and satisfaction, customer attraction and retention, customer lifetime values and customer equity better than its competitors (Armstrong & Kotler, 2011).
12


Ma
rke
ting
Stra
teg
ies
This survey gave insight to a game publishers’ ability to generate brand awareness for its products. An overwhelming number of people choose Electronic Arts as the producer of both Madden NFL and 2K NBA. Unfortunately, Electronic Arts only publishes Madden NFL. Our survey showed that only three of our ten games had a margin of greater than 10% over the 2nd most votes, and one of those was for 2K NBA. Activision performed well in the survey, its two biggest games each received at least 37%.
Activision Blizzard, Inc. has a good brand awareness for World of Warcraft and Call of Duty. However, World of Warcraft had the second highest margin, 44%, over the next closest producer. Since Call of Duty is based on the titles correctly correlated to its game publisher, the survey indicated a margin of 9% over the next closest publisher. It showed that many people associate sports games with Electronic Arts and first-person shooters with Activision Blizzard, Inc. It was also evident, by the portion of the graph below, that there are some game titles that people associate with a certain game publisher, which is an issue that those publishers would need to overcome. In the case of Activision Blizzard, Inc., which was not correctly associated as the producer of Guitar Hero by a narrow margin of 2%, it has taken the necessary steps and has closed the doors on its music-based games division.
Refer to Appendix B for the Statistical Data of this survey. Such as the sample size (n=100), range (6-74), etc.
IntroductionCurrent Strategy
Key Issues Recommendations Conclusion
WWEBattlefieldGrand Theft Auto
Home FrontGuitar Hero0%
20%
40%
60%
80%
38%36% 34%
31%31%
Brand Name Recognition in Video Game Industry
Game Titles
Perc
enta
ge o
f Vot
es
Activision Blizzard
Electronic Arts
THQ
Take-Two Interactive
* Game titles with percentages in orange were correctly associated with its producer.
15

Pla
tfo
rm
Co
mp
ati
bil
ity
IntroductionCurrent Strategy
Key Issues Recommendations Conclusion
An analysis of the industry shows the most popular platforms being utilized by today’s gamers are consoles, computers, hand-held devices and mobile gaming. “Activision Publishing, Inc. is a leading international publisher of interactive software products and downloadable content. Activision develops and publishes games on the various platforms through internally developed franchises and license agreements” (Activision Blizzard, Inc, 2011 p. 3).
Activision Blizzard is always concerned about producing products that are compatible with popular platforms. At the same time, it wants to ensure that its product is compatible on various platforms as well. According to Activision’s website, it produced at least 26 different games during 2010, 20 of which have the ability to be played on multiple platforms (Activision Blizzard Inc., 2011). Activision currently makes 20 games compatible with multiple platforms in order to increase sales by extending its business to different market segments. Call of Duty: Black Ops is its most platform varied product that it published in 2010 (Call of Duty: Black Ops, 2010).
Multiple Platforms77%
Single Platforms23%
Activision 2010 Game Releases by Platforms (single or multiple)
Call of Duty: Black Ops
PC
PS3
Xbox 360Wii
Nintendo DS
(Activision Blizzard Inc., 2011)
(Call of Duty: Black Ops, 2010)
16

Pla
tfo
rm
Co
mp
ati
bil
ity
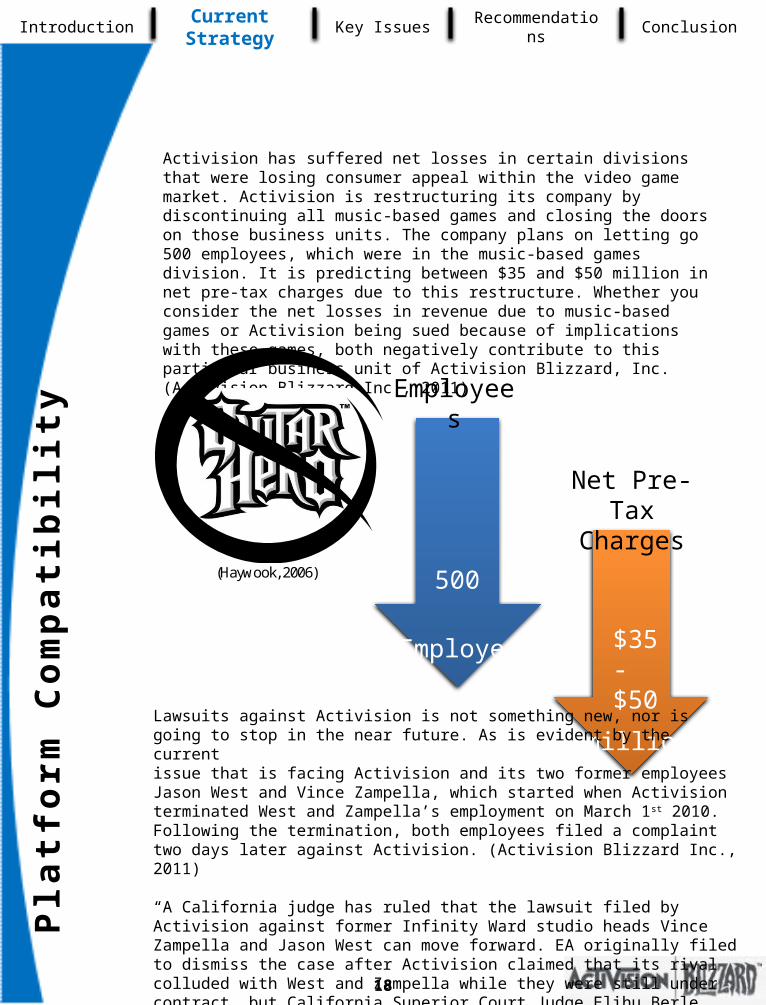
Activision has suffered net losses in certain divisions that were losing consumer appeal within the video game market. Activision is restructuring its company by discontinuing all music-based games and closing the doors on those business units. The company plans on letting go 500 employees, which were in the music-based games division. It is predicting between $35 and $50 million in net pre-tax charges due to this restructure. Whether you consider the net losses in revenue due to music-based games or Activision being sued because of implications with these games, both negatively contribute to this particular business unit of Activision Blizzard, Inc. (Activision Blizzard Inc., 2011)
(Haywook, 2006)
IntroductionCurrent Strategy
Key Issues Recommendations Conclusion
18
Employees
500
Employees
Net Pre-Tax Charges
$35-$50
millionLawsuits against Activision is not something new, nor is going to stop in the near future. As is evident by the current issue that is facing Activision and its two former employees Jason West and Vince Zampella, which started when Activision terminated West and Zampella’s employment on March 1st 2010. Following the termination, both employees filed a complaint two days later against Activision. (Activision Blizzard Inc., 2011)
“A California judge has ruled that the lawsuit filed by Activision against former Infinity Ward studio heads Vince Zampella and Jason West can move forward. EA originally filed to dismiss the case after Activision claimed that its rival colluded with West and Zampella while they were still under contract, but California Superior Court Judge Elihu Berle decided today that there was enough evidence for the case to go on towards trial.” (Schramm, 2011)

Pla
tfor
m C
om
pa
tibility
IntroductionCurrent Strategy
Key Issues Recommendations Conclusion
Also, Activision currently makes games for console systems that are quickly becoming obsolete. Looking through Activision’s reports, it is clear that Sony’s Playstation 2 console is no longer wielding the revenue that it once did. Revenues for this console platform saw a net loss of $139 million from 2009 to 2010, or an 80% decrease.
Activision has started to take action in response to the obsolete technology of the Playstation 2, which can be used to explain part of that decrease in revenue. It has started to weed out games for this system by only releasing 3 games for it in 2010, which also had an impact on the decline from the previous year. In 2009, Activision released 13 games for the Playstation 2 console. Although creating games for obsolete platforms has been an issue Activision is already overcoming, there are still more issues that face the company.
2010 Releases
2010 Releases
GAAP Net Revenues:
$174
GAAP Net Revenues:
$35
80%Decrease
(VGChartz, n.d, pgs. 2-5)
(VGChartz, n.d, p. 1) (GameSpot, n.d.)
19

Introduction Current Strategy Key Issues Recommendations Conclusion
Game GenresFranchise
Diversification
ExpansionSeasonality
Franchise Diversification
Digital Distribution
Lacking Presence in Casual and Social Games
Expansion
Development Cost of Project
Beachhead
Subscription Fees of Beachhead
Marketing Strategy
Platform Compatibility
Competitive Dimensions Recommendations
Key Issues
Ov
er
vie
w
There are many issues that face Activision Blizzard, Inc. in today’s interactive entertainment software market. The key strategic issues that will be discussed are what research deems the most important. Due to the fact its main focus areas include the Call of Duty franchise, Project Beachhead, and downloadable content, Activision Blizzard, Inc. shows an immense lack of portfolio diversification in its products and software (Activision Blizzard, Inc., 2011). Research connects Activision’s problem of franchise diversification with its lack of presence in casual and social games, which in turn denotes the company’s other issue in charging for online game play (Brightman, 2010). Activision has consistently insisted on never charging its customers for online game play; however, with the development costs of Project Beachhead, research indicates Activision may no longer have free game play.
20

Fra
nc
his
e D
ive
rs
ifica
tion
Activision has a history of generating its primary revenue off of a small number of franchises with proven popularity. One outrageous example is how Call of Duty (CoD) and World of Warcraft (WoW) accounted for approximately 62% of the consolidated revenues in 2010, with both contributing even more to the operating income (Activision Blizzard Inc., 2011). If in 2010 one of these games had failed to make as much money as it did, Activision would not have had as high of a net income for the year. Of the at least 26 games Activision made, only 2 made over half of the sales revenue.
CoD and WoW62%
Other38%
% of Activision Revenue 2010
2009 201018%
20%
22%
24%
Top 10 Titles % of Industry Sales
This problem is not only affecting Activision, but it is also affecting the whole industry. “According to The NPD Group, the top 10 titles accounted for 23% of the sales in the U.S. video game industry in 2010, as compared to 21% in 2009” (Activision Blizzard Inc., 2011). The amount of revenue created from the top ten titles is continuously increasing, showing that the same genres and games are making the most profit year in and year out. The only games Activision has in the top games are Call of Duty and World of Warcraft.
Introduction Current Strategy Key Issues Recommendations Conclusion
(Activision Blizzard Inc., 2011)
(Activision Blizzard Inc., 2011).
21
Fra
nc
his
e D
ive
rs
ific
ati
on
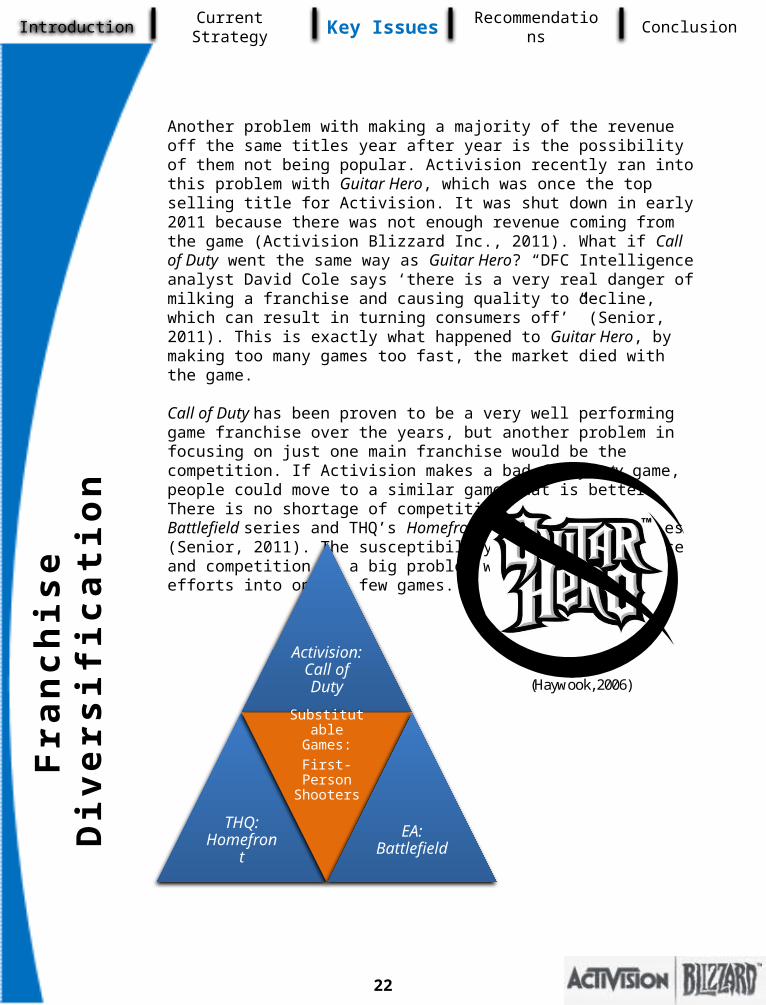
Another problem with making a majority of the revenue off the same titles year after year is the possibility of them not being popular. Activision recently ran into this problem with Guitar Hero, which was once the top selling title for Activision. It was shut down in early 2011 because there was not enough revenue coming from the game (Activision Blizzard Inc., 2011). What if Call of Duty went the same way as Guitar Hero? “DFC Intelligence analyst David Cole says ‘there is a very real danger of milking a franchise and causing quality to decline, which can result in turning consumers off’” (Senior, 2011). This is exactly what happened to Guitar Hero, by making too many games too fast, the market died with the game. Call of Duty has been proven to be a very well performing game franchise over the years, but another problem in focusing on just one main franchise would be the competition. If Activision makes a bad Call of Duty game, people could move to a similar game that is better. There is no shortage of competition either- EA’s Battlefield series and THQ’s Homefront are easy substitutes (Senior, 2011). The susceptibility to poor performance and competition is a big problem with focusing most efforts into only a few games.
(Haywook, 2006)
Activision: Call of Duty
THQ: Homefront
Substitutable Games:
First-Person Shooters
EA: Battlefield
Introduction Current Strategy Key Issues Recommendations Conclusion
22
Fra
nc
his
e D
ive
rs
ifica
tion
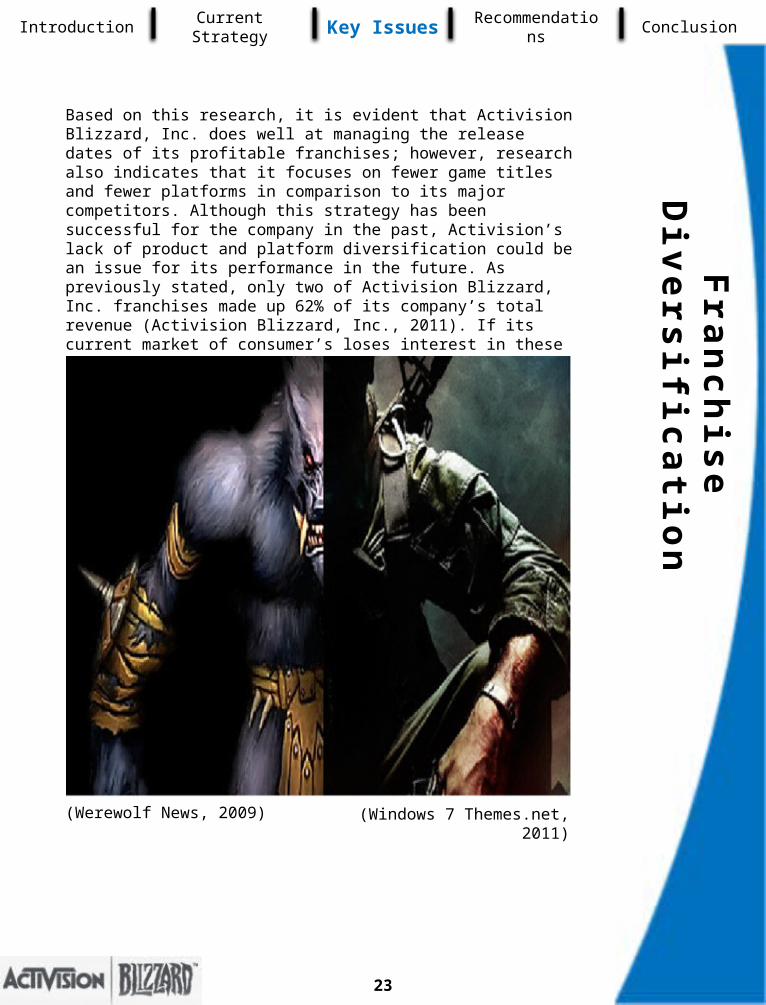
Based on this research, it is evident that Activision Blizzard, Inc. does well at managing the release dates of its profitable franchises; however, research also indicates that it focuses on fewer game titles and fewer platforms in comparison to its major competitors. Although this strategy has been successful for the company in the past, Activision’s lack of product and platform diversification could be an issue for its performance in the future. As previously stated, only two of Activision Blizzard, Inc. franchises made up 62% of its company’s total revenue (Activision Blizzard, Inc., 2011). If its current market of consumer’s loses interest in these popular franchised games, Activision will have trouble diluting profit losses.
(Werewolf News, 2009) (Windows 7 Themes.net, 2011)
Introduction Current Strategy Key Issues Recommendations Conclusion
23

Ca
su
al
an
d S
oc
ial
Ga
min
gIntroduction Current Strategy Key Issues Recommendations Conclusion
“The biggest area of growth in the coming years is likely to be games for tablets and smartphones. In that market, EA has a huge position, while Activision Blizzard, Inc. isn’t a player” (Takahashi, 2011). It is evident that Activision is lacking presence in the causal and social gaming category. Although Activision is looking to derive a majority of its revenue from digital sales, the company does not feel the pressure to invest in social gaming like its competitors have done. Activision CEO Robert Kotick dismissed social gaming during an earnings call with analysts in 2010, calling the category "characterized by unproven business models and a lot of clutter” (Oran, 2010). According to gaming experts at the Tuck School of Business’s third annual Media, Sports and Entertainment Symposium, “Approximately 50 million monthly gamers generate annual revenues of over a billion dollars for the industry…The social gaming industry is projected to expand 30 percent this year and social gaming companies will need to find ways to convert such growth into increasing profits” (The Dartmouth Staff, 2011).
“Games on social networks became a billion dollar business is 2010, enabling the market’s big developers to secure significant investments and pursue sizable exits. Now that Zynga has clearly established itself as the 800 pound gorilla, EA/Playfish are bringing more IP to the market” (Smith, 2011).
According to the research firm Parks Associates, social gaming is on track to become a $5 billion industry in the next five years.
Activision’s leading competitor Electronic Arts is currently dominating the casual gaming and mobile gaming platform. They hold the number one position in casual and mobile gaming and second in social gaming, right behind Zynga. “The global social gaming market is expected to grow from $1 billion in 2009 ($600 million from the US) to just over $3 billion in 2012, representing a compounded annual growth rate (CAGR) of 45%” (Zacks Investment Research, 2011).
24
(Parks Associates, 2011)

Co
st o
f Pro
jec
t Be
ac
hh
ea
dIntroduction Current Strategy Key Issues Recommendations Conclusion
Activision Blizzard, Inc. is introducing a new segment to the company dedicated to expanding the Call of Duty franchise by creating online content. "We have long believed that Activision would begin to offer a premium multiplayer experience for its Call of Duty brand, beginning early in 2011. With the company's recent announcement of Project Beachhead, it acknowledged that such a premium service is in the works, but details about pricing were not provided” (Pachter, 2011).
Currently, Activision insiders are the only individuals with any detailed information on this wholly owned studio. Activision Blizzard, Inc. Chief Financial Officer Thomas Tippl stated during the 2010 results conference call, “We're not yet ready to talk about the details of Beachhead, but when we are, we are going to present in detail what the content is, what the services are, et cetera. So you just have to stay tuned on that"(GoNintendo, 2011). Activision is taking a risk with investing a majority of its time and efforts into a single franchise.
According to Activision Blizzard, Inc.’s Fourth Quarter Corporate Citizenship presentation the top four out of seven main focuses for the company in the year 2011 are all Call of Duty related (Activision , 2011). If for any reason the franchise should collapse or a new hit-driven game hits the market, the company would face major tribulations. It appears Activision may be setting up Beachhead to be a loss leader. “Providing the service for free [will] create a more formidable barrier to entry by its competitors; we [Wedbush Morgan Securities] think it is possible that Project Beachhead will incorporate ‘must have’ features that will serve to drive ever increasing sales of each Call of Duty installment” (Pachter, 2011).
Historically, the company has promised never to charge users to play multiplayer. Activision believes it can sustain sales of Call of Duty at the 20 million-unit level annually. As of right now, there is also no information about which platforms it is going to support. With the uncertainty of Project Beachhead, the key issue is how Activision is going to make the new development studio profitable and how this is going to affect the company and industry as a whole.
25
(Activision , 2011)

Ov
er
vie
w
Game GenresFranchise
Diversification
ExpansionSeasonality
Franchise Diversification
Digital Distribution
Lacking Presence in Casual and Social Games
Expansion
Development Cost of Project
Beachhead
Subscription Fees for Beachhead
Marketing Strategy
Platform Compatibility
Competitive Dimensions Recommendations
Key Issues
Based on Activision Blizzard, Inc.’s franchise diversification, lack of presence in casual and social games, and increasing development costs of Project Beachhead, the two recommendations we posed are for the company to expand and charge customers for Beachhead. We believe that there are two companies that will act as positive reinforcements to Activision’s lack of franchise diversification and presence in casual and social games. Recommendations for Activision Blizzard, Inc. in 2011 to purchase Take-Two Interactive Games, and in 2012 develop a strategic alliance with social gaming company, Zynga. As for recommendations for improving the profitability of Project Beachhead, through much research, we recommend for Activision Blizzard, Inc. to start charging its customers a subscription fee.
Introduction Current Strategy Key Issues Recommendations Conclusion
26
Ex
pa
ns
ion
: Ta
ke
-Tw
o
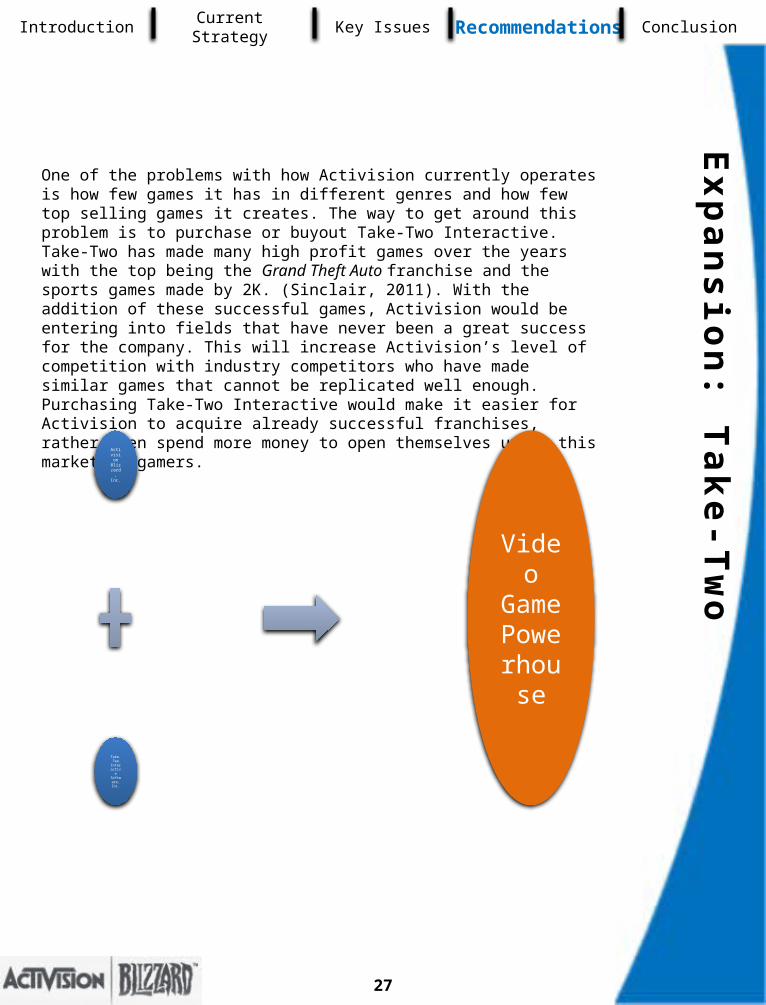
One of the problems with how Activision currently operates is how few games it has in different genres and how few top selling games it creates. The way to get around this problem is to purchase or buyout Take-Two Interactive. Take-Two has made many high profit games over the years with the top being the Grand Theft Auto franchise and the sports games made by 2K. (Sinclair, 2011). With the addition of these successful games, Activision would be entering into fields that have never been a great success for the company. This will increase Activision’s level of competition with industry competitors who have made similar games that cannot be replicated well enough. Purchasing Take-Two Interactive would make it easier for Activision to acquire already successful franchises, rather then spend more money to open themselves up to this market of gamers.
Introduction Current Strategy Key Issues Recommendations Conclusion
Activisio
n Blizzard, Inc.
Take-Two
Interactive Software, Inc.
Video Game Powerhouse
27

Ex
pa
ns
ion
: T
ak
e-T
wo
Grand Theft Auto is in a class of its own when it comes to game genres. Since its creation in 1997, Grand Theft Auto has been one of the best-selling titles ever created. When Grand Theft Auto VI came out in 2008, the first day sales totaled over 3.6 million copies, making over $310 million globally for Take-Two, breaking the record for first day selling numbers at that time. The game had sold more than Halo 3 and even movies such as Pirates of the Caribbean and Spiderman (Vella, 2008). The game that took over Grand Theft Auto VI’s record for first day sales was Call of Duty: Modern Warfare 2, showing what a profitable combination Activision would have if it was able to purchase Take-Two (Activision Blizzard Inc., 2011). The next installment to the franchise, Grand Theft Auto V, is expected to make over $750 million when it releases in 2012 (Pakinkis, 2010).
Activision has had troubles in the past few years trying to make a game that is comparable to Grand Theft Auto. Activision’s recent attempt was with its True Crime series, which was announced to be discontinued earlier in 2011. CEO of Activision Publishing, Eric Hirshberg said, “True Crime’s development was not going to lead to a title at or near the top of the competitive open-world genre. To be blunt, it just was not good enough” (Gilbert, 2011). It was a fact; True Crime was never going to be able to compete against the major titles in the industry already. If Activision purchases Take-Two and starts publishing Grand Theft Auto, there would be no need to make anything new because they would have the best title in the genre to date.
Call of Duty
Grand Theft
Auto
Two huge successful
franchises
Grand Theft Auto’s profitability
True Crime’s profitability
Introduction Current Strategy Key Issues Recommendations Conclusion
28

Introduction Current Strategy Key Issues Recommendations Conclusion
Ex
pa
ns
ion
: Ta
ke
-Tw
o
Another facet to Take-Two that would help Activision make more money would be 2K Sports. 2K Sports is a brand within Take-Two that makes games such as NBA 2K11, MLB 2K11, NHL 2K11, and Top Spin Golf. As of 2008, the NBA 2K franchise had sold over 6 million units, the MLB 2K franchise had sold over 5.5 million units, and the NHL 2K franchise had sold over 2.5 million units (Androvich, 2008). Since then, 2K has come out with a title each year, but none have been more successful than NBA 2K11. NBA 2K11 had sold over 4 million units by February of 2011 when it was released in October of 2010. This performance has been the fastest selling title for both the franchise and the publisher (Magrino, 2011). With the continuing growth and popularity of the 2K Sports titles, it is possible that it could eventually over take EA Sports for the best sports games.
The growing success of 2K Sports is another reason for Activision to buy Take-Two. Activision has never released any kind of sports genre games since it was created. This is bad seeing as sports games make up such a large portion of the profitable market today. Since sports games made up 19.6% of the revenues in 2009, not being involved in this section is out of the question (Entertainment Software Association, 2010). With opportunities in 2K Sports to make games in basketball, baseball, and hockey, it would be easy to make these games compete with EA and its sports division.
2K Sports Games
NBA 2K
NHL 2KTop Spin Golf
MLB 2K
29

Imp
ac
t o
f T
ak
e-T
wo
Me
rge
rIntroduction Current Strategy Key Issues Recommendations Conclusion
Activision should purchase Take-Two Interactive for $1.8 billion in an all cash deal. The acquisition will take place in 2011, starting by consolidating the two companies’ income statements and balance sheets. The problem using cash to purchase Take-Two is that Activision will have to acquire debt in order to balance the balance sheet. The debt will be around $1.2 billion, which the company will pay back through a loan, amortized for ten years with annual principal payments plus interest of 6.5%. On the balance sheet, goodwill increases to approximately $9 billion due to the 24% premium paid to Take-Two’s stockholders. Incurring this debt is a hard move to make, but seeing as this is the only long-term liability Activision will have, the purchase will pay off when Activision benefits from the higher profits in the future.
At the end of the first year, revenues will be around $4.5 billion and net income will be around negative $53 million. The reason Activision will have negative net income in 2011 is not only due to the purchase of Take-Two with cash, but also because costs of goods sold is about 66% of net revenues. Since the merger will most likely take place later in this year, Activision Blizzard, Inc. will not have enough time to work together to decrease these costs, but will work to decrease that percentage in the next five years by reducing product costs.
Purchase Take-Two for $1.8 Billion
Issue $1.2 Billion Worth of Debt
Add $9 Billion to Goodwill
Net Revenues of $4.5 Billion
Net Income of -$53 million
2011 Major Impacts of Take-Two Merger
(Refer to Appendices C and D for condensed financial statements)
30

Imp
ac
t of T
ak
e-T
wo
Me
rge
rIntroduction Current Strategy Key Issues Recommendations Conclusion
In 2012, the recommendation of buying Take-Two will account for most of the 30% increase of net revenues. The net revenues will increase to around $5.8 billion and net income will increase to around $254 million. This is a major increase from the year before with a net profit margin of 40%. One of the reasons for this increase is all the product costs that the company has will start to decrease as a percentage of sales due to cutting unnecessary costs which are duplicated from the two companies. The biggest impact on the balance sheet during this would be the payment on the long term debt and addition to retained earnings.
From 2013-2015, buying Take-Two will prove to be a really profitable decision. Net revenues will increase by 1,000 basis points in 2013 and 400 basis points each year after, making net income increase to around $811 million by 2015. This is an increase in net income of over $850 million dollars throughout the 5 years. Reducing costs of goods sold is one of the main reasons for why they were able to make so much money. Costs of goods sold decreased by 1,400 basis points as a percentage of sales over the five years because Activision was able to get rid of costs, as well as use its experience to help make new games cheaper. (Refer to Appendices C and D for condensed financial statements)
2011:
$4.5 Billio
n Net
Revenues
30% Sale
s Increase
2012:
$5.8 Billio
n Net
Revenues
$254
Million Net Income
$5.8 Billion Net Revenues
40% Net Prof
it Margin
Costs of Goods Sold
Decreases 1400 Basis
Points
Increase in Net
Income of Over
$800 Billion
31
Ex
pa
ns
ion
: Z
yn
ga
All
ian
ce
Introduction Current Strategy Key Issues Recommendations Conclusion
Activision Blizzard Incorporated needs a strong entrance into the social gaming platform. According to The Wall Street Journal, “[The] social gaming company Zynga could be worth as much as $7 to 9 billion” (Wingfield, Ante, & Das, 2011). Rather than buying out the company, Activision Blizzard should create a ten year strategic alliance or partnership with Zynga. Second Shares stated, “This year Zynga should generate about $525mm in revenue. In 2012, we expect Zynga will generate more than $1B in revenue” (Loukerner, 2010).
Social gaming is not only growing rapidly but highly profitable. Companies can earn revenues from membership fees, advertising, and the sale of virtual goods. Virtual goods are by far the largest source of revenue, with Piper Jaffray predicting “$6 billion in virtual good sales by 2013” (Loukerner, 2010). The industry has seen success in large infrastructure companies acquiring independent developers.(See Exhibit to the Right)
Creating a strategic alliance with Zynga will enable Activision to keep development costs low, while increasing presence in social gaming. A partnership between these top two companies could potentially result in the development of social networking games based on Activision’s major franchises. “Social gaming companies like Zynga benefit from brands paying to be in the games” (Loukerner, 2010). Zynga generated about “$400 million in profit last year on approximately $850 million in revenue” (Wingfield, Ante, & Das, 2011).
32
(Loukerner, 2010)

Imp
ac
t of Z
yn
ga
Allia
nc
eIntroduction Current Strategy Key Issues Recommendations Conclusion
33
A strategic alliance created between Activision and Zynga appears to be the key in shifting towards casual and social gaming. Referring to appendix C, acquiring the strategic partnership with Zynga contributed to the growth of generated revenue for the years 2012- 2015. Activision sustained revenue growth throughout the following four years due to the acquisition of Take Two Interactive, subscription fee from Project Beachhead, and its partnership with Zynga. Research indicates the alliance with Zynga would increase brand name recognition and continue to generate revenue. According to The Wall Street Journal, Zynga generated about “$400 million in profit last year on approximately $850 million in revenue and the company is worth approximately 7-9 billion dollars” (Wingfield, Ante, & Das, 2011).
Zynga is the dominant social gaming company worldwide. “Zynga has 237mm active users per month and 67mm active users per day” (Loukerner, 2010). The strong presence that Zynga has through social media drives consumers to the games. Social games based on Activision titles can only have the same effect, therefore reaching a larger consumer base.
Partnering with Zynga and developing social games is going to call for advertising expenses. Referring to appendix C, sales and marketing expenses will increase 15% each year related to the advertising of social games. This impact directly correlates with Activision’s competitive strategy of continuing to improve profitability.
As seen in the chart, Zynga clearly dominates over every other social game developer. It is evident that the alliance will not only gain recognition for Activision in the social gaming category, but it is also likely for the company to surpass its main competitor, Electronic Arts. (Loukerner, 2010)
“We continually strive to manage risk and increase our operating leverage and efficiency with the goal of increased profitability. We believe the key factors affecting our future profitability will be the success of our core properties, proven franchises and genres, cost discipline, and our ability to leverage the continued growth of online and digital revenue opportunities” (Activision, 2011).
Su
bs
cr
ipti
on
Fe
es
fo
r
Be
ac
hh
ea
d
Introduction Current Strategy Key Issues Recommendations Conclusion
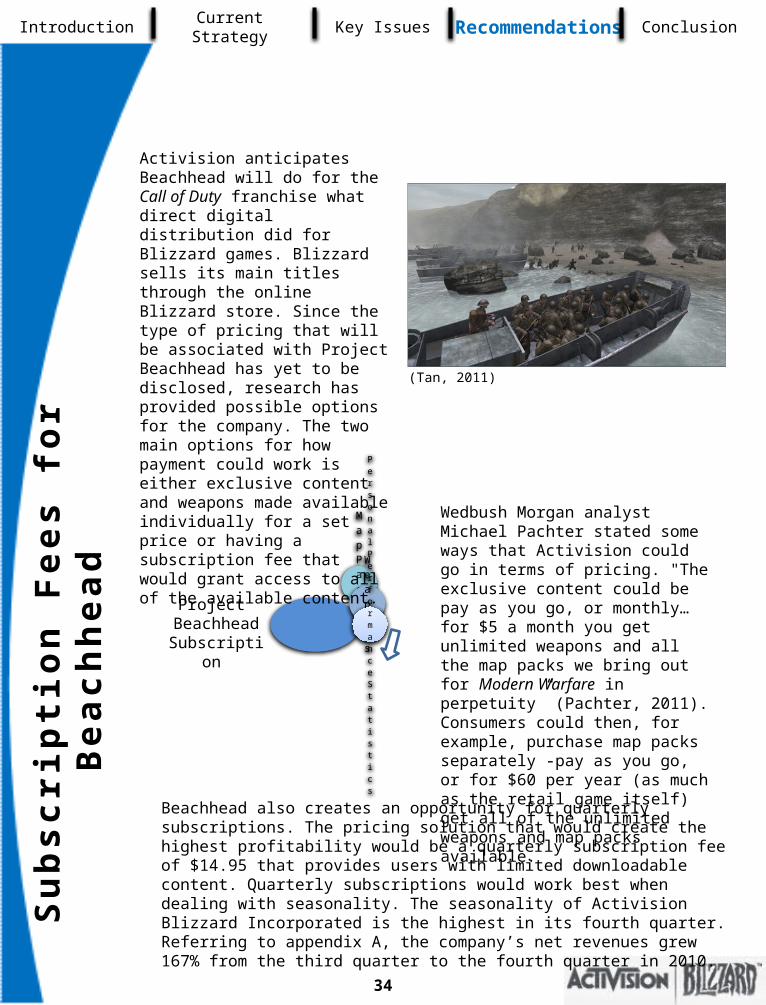
Beachhead also creates an opportunity for quarterly subscriptions. The pricing solution that would create the highest profitability would be a quarterly subscription fee of $14.95 that provides users with limited downloadable content. Quarterly subscriptions would work best when dealing with seasonality. The seasonality of Activision Blizzard Incorporated is the highest in its fourth quarter. Referring to appendix A, the company’s net revenues grew 167% from the third quarter to the fourth quarter in 2010.
Map Packs
Weapons
Personal Performance Statistics
Project Beachhead
Subscription
(Tan, 2011)
Wedbush Morgan analyst Michael Pachter stated some ways that Activision could go in terms of pricing. "The exclusive content could be pay as you go, or monthly…for $5 a month you get unlimited weapons and all the map packs we bring out for Modern Warfare in perpetuity” (Pachter, 2011). Consumers could then, for example, purchase map packs separately -pay as you go, or for $60 per year (as much as the retail game itself) get all of the unlimited weapons and map packs available.
Activision anticipates Beachhead will do for the Call of Duty franchise what direct digital distribution did for Blizzard games. Blizzard sells its main titles through the online Blizzard store. Since the type of pricing that will be associated with Project Beachhead has yet to be disclosed, research has provided possible options for the company. The two main options for how payment could work is either exclusive content and weapons made available individually for a set price or having a subscription fee that would grant access to all of the available content.
34
Imp
ac
t of F
ee
s fo
r B
ea
ch
he
ad
Introduction Current Strategy Key Issues Recommendations Conclusion
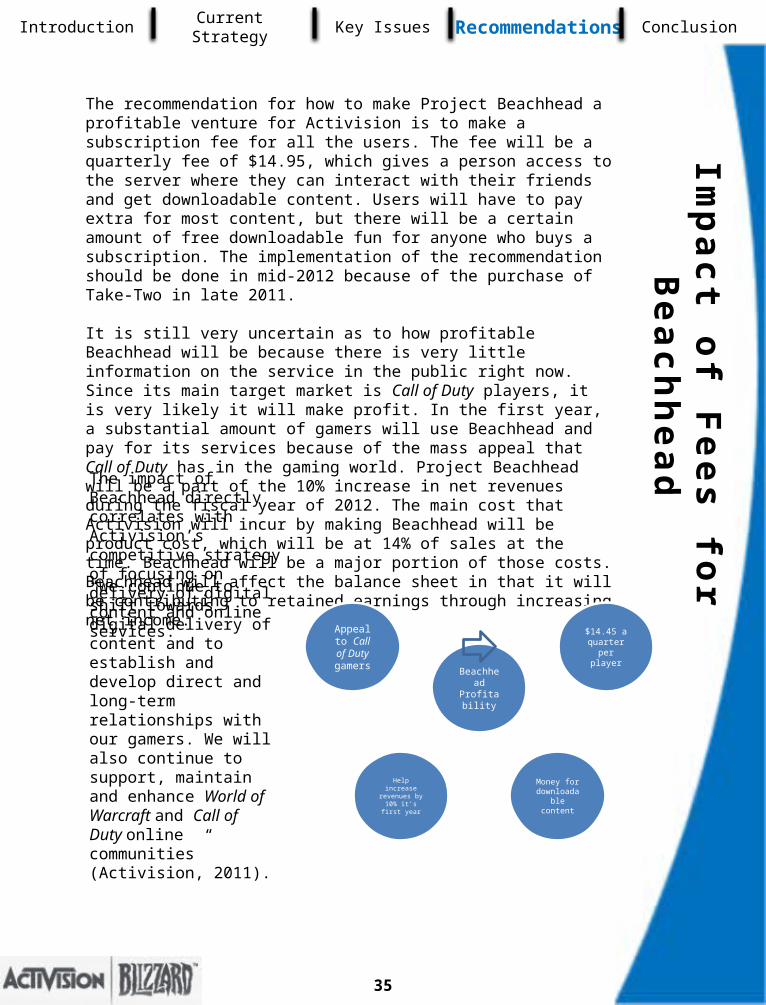
The recommendation for how to make Project Beachhead a profitable venture for Activision is to make a subscription fee for all the users. The fee will be a quarterly fee of $14.95, which gives a person access to the server where they can interact with their friends and get downloadable content. Users will have to pay extra for most content, but there will be a certain amount of free downloadable fun for anyone who buys a subscription. The implementation of the recommendation should be done in mid-2012 because of the purchase of Take-Two in late 2011. It is still very uncertain as to how profitable Beachhead will be because there is very little information on the service in the public right now. Since its main target market is Call of Duty players, it is very likely it will make profit. In the first year, a substantial amount of gamers will use Beachhead and pay for its services because of the mass appeal that Call of Duty has in the gaming world. Project Beachhead will be a part of the 10% increase in net revenues during the fiscal year of 2012. The main cost that Activision will incur by making Beachhead will be product cost, which will be at 14% of sales at the time. Beachhead will be a major portion of those costs. Beachhead will affect the balance sheet in that it will be contributing to retained earnings through increasing net income.
Beachhead
Profitability
$14.45 a quarter
per player
Money for download
able content
Help increase
revenues by 10% it’s first
year
Appeal to Call of Duty
gamers
35
“We continue to shift towards digital delivery of content and to establish and develop direct and long-term relationships with our gamers. We will also continue to support, maintain and enhance World of Warcraft and Call of Duty online communities” (Activision, 2011).
The impact of Beachhead directly correlates with Activision’s competitive strategy of focusing on delivery of digital content and online services.

36

Introduction Current Strategy Key Issues Recommendations Conclusion
Co
nc
lus
ion
37
Activision Blizzard, Inc. has seen revenue growth since the merger with Blizzard Entertainment in 2008. Activision’s current strategy confirms its focus on franchises, technologies, and digital content that have proven to be successful in the past. Research indicates that in order to continue economic growth, Activision should be aware of the industry’s competitive dimensions, and the potential issues it may face. Its franchise diversification, presence in the social and casual gaming market, and its concentrated time, effort, and funds into Project Beachhead to be its three major issues. Through our analysis of Activision Blizzard, Inc. the recommendations in this report will not only provide the company with revenue growth for the next five years, they also act as stabilizers to ensure future market success for the company.
Game Genres
Franchise Diversification
Expansion
Seasonality
Franchise Diversification
Digital Distribution
Lacking Presence in Casual and Social Games
Expansion
Development Cost of Project Beachhead
Subscription Fees of Beachhead
Marketing Strategy
Platform Compatibility
Competitive Dimensions Recommendations
Key Issues

38

*(amounts expressed in thousands)
Ap
pe
nd
ix A
Appendix A: Net Revenues by Quarter
Activision Blizzard, Inc.* 2010 2009 2008Quarter 3 397,000 411,000 413,000Quarter 4 1,061,000 1,232,000 1,318,000
Electronic Arts, Inc.* 2010 2009 2008Quarter 3 613,000 788,000 894,000Quarter 4 1,053,000 1,243,000 1,654,000
Take-Two Interactive Software, Inc.* 2010 2009 2008Quarter 3 194,381 50,621 433,836Quarter 4 334,259 360,364 256,810
THQ Inc.* 2010 2009 2008Quarter 3 77,053 101,290 164,816Quarter 4 314,589 356,678 357,310
(Activision Blizzard, Inc., 2010)
(Activision Blizzard, Inc., 2009)
(Activision Blizzard, Inc., 2008)
(Electronic Arts, Inc., 2010)
(Electronic Arts, Inc., 2009)
(Electronic Arts, Inc., 2008)
(Take-Two Interactive Software, Inc., 2010)
(Take-Two Interactive Software, Inc., 2009)
(Take-Two Interactive Software, Inc., 2008)
(THQ Inc., 2010)
(THQ Inc., 2009) (THQ Inc., 2008)
39

40

Appendix B: Primary Research Survey
41
Below are the questions our group asked in the survey that we posted to SurveyMonkey.com.
Q1: Who makes Bioshock the video game?A) THQ Inc.B) Activision Blizzard Inc.C) Electronic ArtsD) Take-Two Interactive
Q2: Who publishes the video game franchise Call of Duty?E) Activision Blizzard Inc.F) Electronic ArtsG) Take-Two InteractiveH) THQ Inc.
Q3: Who publishes the video game franchise Madden NFL?I) Activision Blizzard Inc.J) THQ Inc.K) Take-Two InteractiveL) Electronic Arts
Q4: Who publishes the video game franchise World of Warcraft?M) Electronic ArtsN) Activision Blizzard Inc.O) THQ Inc.P) Take-Two Interactive
Q5: Who publishes the 2K NBA basketball video games?Q) Take-Two InteractiveR) THQ Inc.S) Electronic ArtsT) Activision Blizzard Inc.
Q6: Who makes the WWE video game?A) Take-Two InteractiveB) Electronic ArtsC) THQ Inc.D) Take-Two Interactive
Q7: Who makes the Battlefield franchise video games?E) THQ Inc.F) Activision Blizzard Inc.G) Take-Two InteractiveH) Electronic Arts
Q8: Who makes the Grand Theft Auto video game franchise?I) THQ Inc.J) Activision Blizzard Inc.K) Electronic ArtsL) Take-Two Interactive
Q9: Who the Homefront video game?M) Electronic ArtsN) Activision Blizzard Inc.O) THQ Inc.P) Take-Two Interactive
Q10: Who makes the Guitar Hero franchise video games?Q) THQ Inc.R) Activision Blizzard Inc.S) Take-Two InteractiveT) Electronic Arts
Ap
pe
nd
ix B

Appendix B: Primary Research Survey
42
Mean=27.03 Median=23 Mode=31
Standard Deviation=13.68 Standard Error=1.37
Sample Variance=187.03
Range= 69 Min=5 Max=74
Statistical Data
27.03
Z=2.12 56
Ex: Normal Distribution for World of Warcraft
P= .9830
Ap
pe
nd
ix B
co
nti
nu
ed

43
Ap
pe
nd
ix C
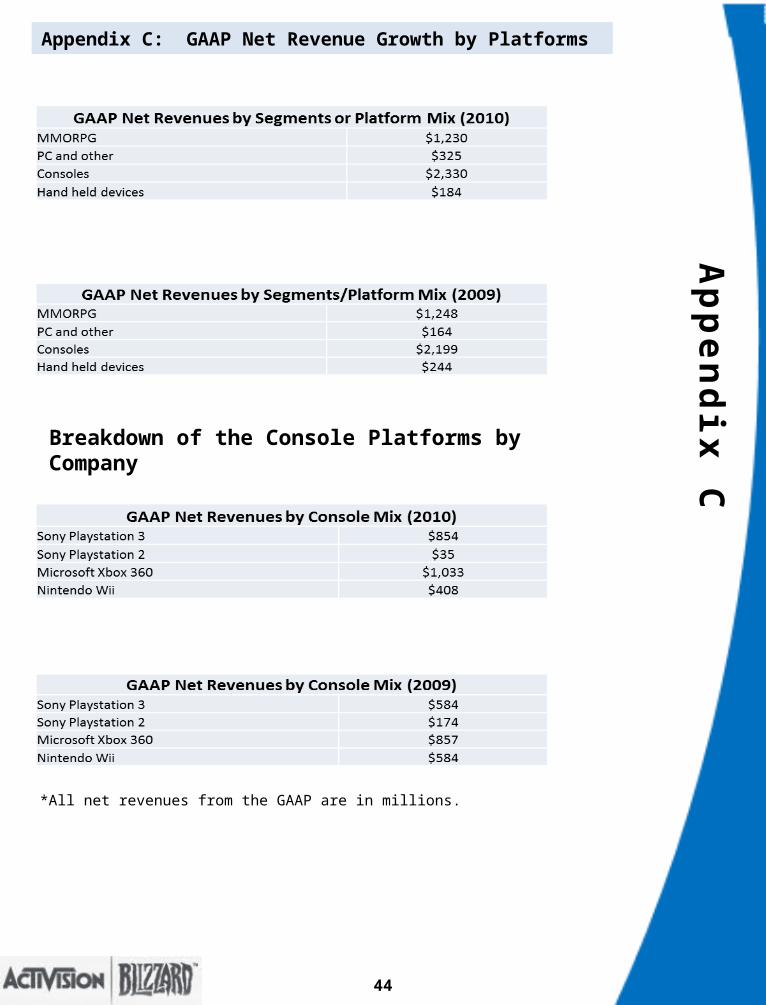
Appendix C: GAAP Net Revenue Growth by Platforms
44
Breakdown of the Console Platforms by Company
*All net revenues from the GAAP are in millions.

45

Ap
pe
nd
ix D
46
Appendix D: Forecasted Income Statements
2011 Net revenues $4,448,374,820 Cost of Goods Sold 2,943,539,000 Gross Income 1,504,835,820 Costs and Expenses
Product Development 711,523,488 Sales and marketing 714,848,459 General and administrative 234,214,894
Total Costs and Expenses 1,660,586,841 Operating Income (155,751,021)Investment and other net income 23,000,000 Interest Expense 70,839,117 Income before income taxes (61,911,904)Tax Expense (benefit) (9,286,786)Net Income (loss) $(52,625,118)
2012 Net revenues $5,782,887,266 Cost of Goods Sold 3,469,732,360 Gross Income 2,313,154,906 Costs and Expenses
Product Development 809,604,217 Sales and marketing 867,433,090 General and administrative 289,144,363
Total Costs and Expenses 1,966,181,670 Operating Income 346,973,236 Investment and other net income 29,900,000 Interest Expense 77,664,866 Income before income taxes 299,208,370 Tax Expense (benefit) 44,881,255 Net Income (loss) $254,327,114

Ap
pe
nd
ix D
co
nti
nu
ed
47
Appendix D: Forecasted Income Statements
2013Net revenues $6,361,175,993 Cost of Goods Sold 3,562,258,556 Gross Income 2,798,917,437 Costs and Expenses
Product Development 890,564,639 Sales and marketing 954,176,399 General and administrative 318,058,800
Total Costs and Expenses 2,162,799,837 Operating Income 636,117,599 Investment and other net income 32,890,000 Interest Expense 66,861,319 Income before income taxes 602,146,280 Tax Expense (benefit) 90,321,942 Net Income (loss) $511,824,338
2014Net revenues $6,615,623,032 Cost of Goods Sold 3,440,123,977 Gross Income 3,175,499,056 Costs and Expenses
Product Development 926,187,225 Sales and marketing 992,343,455 General and administrative 330,781,152
Total Costs and Expenses 2,249,311,831 Operating Income 926,187,225 Investment and other net income 34,205,600 Interest Expense 56,057,772 Income before income taxes 904,335,053 Tax Expense (benefit) 135,650,258 Net Income (loss) $768,684,795
Ap
pe
nd
ix D
co
ntin
ue
dAppendix D: Forecasted Income Statements
2015Net revenues $6,880,247,954 Cost of Goods Sold 3,577,728,936 Gross Income 3,302,519,018 Costs and Expenses
Product Development 963,234,714 Sales and marketing 1,032,037,193 General and administrative 344,012,398
Total Costs and Expenses 2,339,284,304 Operating Income 963,234,714 Investment and other net income 35,573,824 Interest Expense 45,254,225 Income before income taxes 953,554,313 Tax Expense (benefit) 143,033,147 Net Income (loss) $810,521,166
48

49

Ap
pe
nd
ix E
Appendix E: Forecasted Balance SheetAssets 2011
Cash and cash equivalents $1,309,118,000 Short-term investments 696,000,000 Accounts receivable 723,845,000 Inventory 140,592,000 Software development 301,763,000 Intellectual property licenses 45,000,000 Deferred income taxes, net 640,000,000 Other current assets 346,976,000
Total Current Assets: 4,203,294,000 Fixed Assets:
Long-term investments 23,000,000 Software development 148,898,000 Intellectual property licenses 28,000,000 Property and equipment 190,326,000 Other assets 25,680,000
Intangible assets 179,142,000 Trademark and trade names 433,000,000 Goodwill 9,012,469,000
Total Fixed Assets: 10,040,515,000 Total Assets: $14,243,809,000
Liabilities and Shareholders EquityCurrent Liabilities:
Accounts payable $411,852,000 Deferred revenues 1,736,412,000
Accrued expenses and other liabilities 985,498,000 Take-Two liabilities of discontinued operations 3,799,000 Long-term principal payment -
Total Current Liabilities: 3,137,561,000 Other Liabilities:
Deferred income taxes, net 121,059,000 Other liabilities 184,000,000 Long-term liabilities 1,194,844,097 Income taxes payable 29,381,515 Take-Two liabilities of discontinued operations, net of current portion 3,118,000
Total Liabilities 4,669,963,612 Shareholders Equity:
Common Stock and Additional paid-in capital 12,353,000,000 Retained earnings (572,154,612)
11,780,845,388 Less: Treasury Stock (2,194,000,000)Accumulated other comprehensive income (loss) (13,000,000)
Total Shareholders Equity: 9,573,845,388 Total Liabilities and Shareholders Equity: $14,243,809,000 External funding needed (long-term) -
50
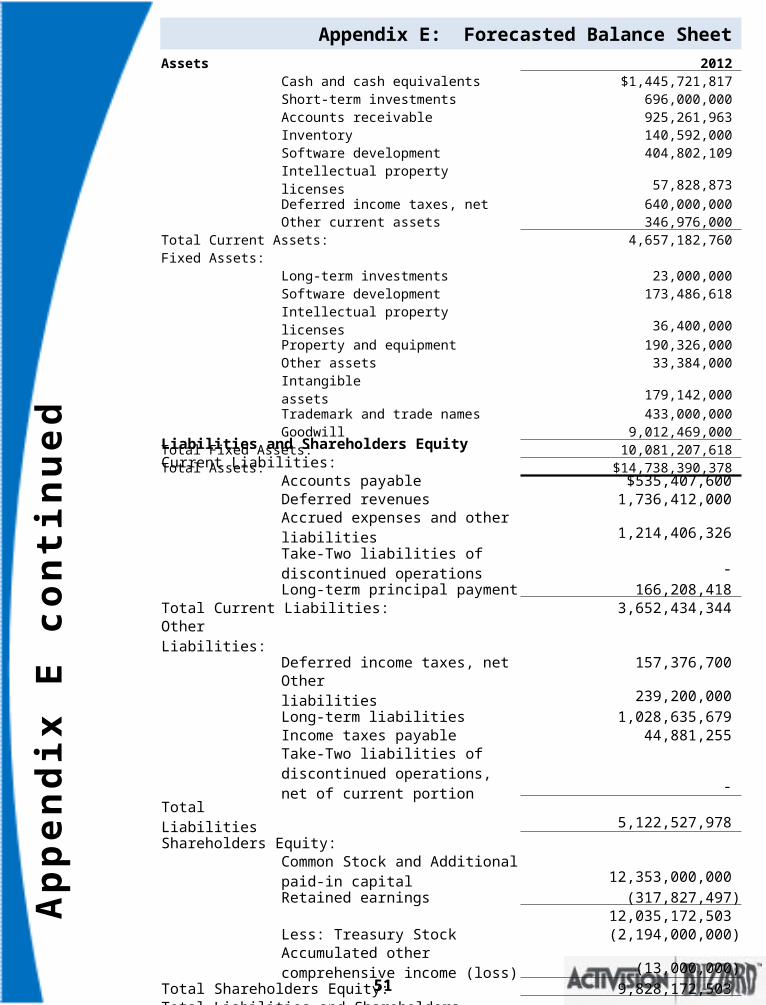
Ap
pe
nd
ix E
co
nti
nu
ed
Appendix E: Forecasted Balance SheetAssets 2012
Cash and cash equivalents $1,445,721,817 Short-term investments 696,000,000 Accounts receivable 925,261,963 Inventory 140,592,000 Software development 404,802,109 Intellectual property licenses 57,828,873 Deferred income taxes, net 640,000,000 Other current assets 346,976,000
Total Current Assets: 4,657,182,760 Fixed Assets:
Long-term investments 23,000,000 Software development 173,486,618 Intellectual property licenses 36,400,000 Property and equipment 190,326,000 Other assets 33,384,000 Intangible assets 179,142,000 Trademark and trade names 433,000,000 Goodwill 9,012,469,000
Total Fixed Assets: 10,081,207,618 Total Assets: $14,738,390,378
Liabilities and Shareholders EquityCurrent Liabilities:
Accounts payable $535,407,600 Deferred revenues 1,736,412,000
Accrued expenses and other liabilities 1,214,406,326 Take-Two liabilities of discontinued operations - Long-term principal payment 166,208,418
Total Current Liabilities: 3,652,434,344 Other Liabilities:
Deferred income taxes, net 157,376,700 Other liabilities 239,200,000 Long-term liabilities 1,028,635,679 Income taxes payable 44,881,255 Take-Two liabilities of discontinued operations, net of current portion -
Total Liabilities 5,122,527,978 Shareholders Equity:
Common Stock and Additional paid-in capital 12,353,000,000 Retained earnings (317,827,497)
12,035,172,503 Less: Treasury Stock (2,194,000,000)Accumulated other comprehensive income (loss) (13,000,000)
Total Shareholders Equity: 9,828,172,503 Total Liabilities and Shareholders Equity: $14,950,700,481 External funding needed (long-term) (212,310,103)
51

Ap
pe
nd
ix E
co
ntin
ue
dAppendix E: Forecasted Balance Sheet
AssetsCurrent Assets: 2013
Cash and cash equivalents $1,590,293,998 Short-term investments 696,000,000 Accounts receivable 1,017,788,159 Inventory 140,592,000 Software development 445,282,319 Intellectual property licenses 64,350,000 Deferred income taxes, net 640,000,000 Other current assets 346,976,000
Total Current Assets: 4,941,282,476 Fixed Assets:
Long-term investments 23,000,000 Software development 212,924,140 Intellectual property licenses 40,040,000 Property and equipment 190,326,000 Other assets 36,722,400 Intangible assets 179,142,000 Trademark and trade names 433,000,000 Goodwill 9,012,469,000
Total Fixed Assets: 10,127,623,540 Total Assets: $15,068,906,016 Liabilities and Shareholders EquityCurrent Liabilities:
Accounts payable $588,948,360 Deferred revenues 1,736,412,000
Accrued expenses and other liabilities 1,335,846,958 Take-Two liabilities of discontinued operations - Long-term principal payment 166,208,418
Total Current Liabilities: 3,827,415,736 Other Liabilities:
Deferred income taxes, net 173,114,370 Other liabilities 263,120,000 Long-term liabilities 862,427,261 Income taxes payable 90,321,942 Take-Two liabilities of discontinued operations, net of current portion -
Total Liabilities 5,216,399,309 Shareholders Equity:
Common Stock and Additional paid-in capital 12,353,000,000 Retained earnings 193,996,841
12,546,996,841 Less: Treasury Stock (2,194,000,000)Accumulated other comprehensive income (loss) (13,000,000)
Total Shareholders Equity: 10,339,996,841 Total Liabilities and Shareholders Equity: $15,556,396,150 External funding needed (long-term) (487,490,134)
52

Ap
pe
nd
ix E
co
nti
nu
ed
Appendix E: Forecasted Balance SheetAssets
Current Assets: 2014Cash and cash equivalents $1,653,905,758 Short-term investments 696,000,000 Accounts receivable 1,058,499,685 Inventory 140,592,000 Software development 448,781,934 Intellectual property licenses 66,924,000 Deferred income taxes, net 640,000,000 Other current assets 346,976,000
Total Current Assets: 5,051,679,377 Fixed Assets:
Long-term investments 23,000,000 Software development 221,441,106 Intellectual property licenses 41,641,600 Property and equipment 190,326,000 Other assets 38,191,296 Intangible assets 179,142,000 Trademark and trade names 433,000,000 Goodwill 9,012,469,000
Total Fixed Assets: 10,139,211,002 Total Assets: $15,190,890,378 Liabilities and Shareholders EquityCurrent Liabilities:
Accounts payable $612,506,294 Deferred revenues 1,736,412,000
Accrued expenses and other liabilities 1,389,280,837 Take-Two liabilities of discontinued operations - Long-term principal payment 166,208,418
Total Current Liabilities: 3,904,407,549 Other Liabilities:
Deferred income taxes, net 180,038,945 Other liabilities 273,644,800 Long-term liabilities 696,218,843 Income taxes payable 135,650,258
Take-Two liabilities of discontinued operations, net of current portion -
Total Liabilities 5,189,960,395 Shareholders Equity:
Common Stock and Additional paid-in capital 12,353,000,000 Retained earnings 962,681,635
13,315,681,635 Less: Treasury Stock (2,194,000,000)Accumulated other comprehensive income (loss) (13,000,000)
Total Shareholders Equity: 11,108,681,635 Total Liabilities and Shareholders Equity: $16,298,642,030 External funding needed (long-term) (1,107,751,652)
53

Ap
pe
nd
ix E
co
ntin
ue
dAppendix E: Forecasted Balance Sheet
AssetsCurrent Assets: 2015
Cash and cash equivalents $1,720,061,988 Short-term investments 696,000,000 Accounts receivable 1,100,839,673 Inventory 140,592,000 Software development 466,733,211 Intellectual property licenses 69,600,960 Deferred income taxes, net 640,000,000 Other current assets 346,976,000
Total Current Assets: 5,180,803,832 Fixed Assets:
Long-term investments 23,000,000 Software development 230,298,750 Intellectual property licenses 43,307,264 Property and equipment 190,326,000 Other assets 39,718,948 Intangible assets 179,142,000 Trademark and trade names 433,000,000 Goodwill 9,012,469,000
Total Fixed Assets: 10,151,261,962 Total Assets: $15,332,065,794 Liabilities and Shareholders EquityCurrent Liabilities:
Accounts payable $637,006,546 Deferred revenues 1,736,412,000
Accrued expenses and other liabilities 1,444,852,070 Take-Two liabilities of discontinued operations - Long-term principal payment 166,208,418
Total Current Liabilities: 3,984,479,034 Other Liabilities:
Deferred income taxes, net 187,240,503 Other liabilities 284,590,592 Long-term liabilities 530,010,425 Income taxes payable 143,033,147
Take-Two liabilities of discontinued operations, net of current portion -
Total Liabilities 5,129,353,701 Shareholders Equity:
Common Stock and Additional paid-in capital 12,353,000,000 Retained earnings 1,773,202,801
14,126,202,801 Less: Treasury Stock (2,194,000,000)Accumulated other comprehensive income (loss) (13,000,000)
Total Shareholders Equity: 11,919,202,801 Total Liabilities and Shareholders Equity: $17,048,556,502 External funding needed (long-term) (1,716,490,709)
54

55

Ap
pe
nd
ix F
Appendix F: Ratios
2011 2012 2013 2014 2015Net sales growth rate 0.00 0.30 0.10 0.04 0.04 Margins
Gross Profit Margin 33.83%40.00% 44.00%
48.00%
48.00%
Operating profit(loss)margin
-3.50% 6.00% 10.00%14.00
%14.00
%Net profit (loss) margin
-1.18% 4.40% 8.05%11.62
%11.78
%
Returns Return on assets -0.37% 1.73% 3.40% 5.06% 5.29%Return on equity -0.55% 2.59% 4.95% 6.92% 6.80%
Asset Management Indicators
Inventory turnover 20.94 24.68 25.34 24.47 25.45 Days' sales in inventory
N/A N/A N/A N/A N/A
Accounts receivable turnover
6.15 6.25 6.25 6.25 6.25
Days'sales outstanding
59.39 58.40 58.40 58.40 58.40
Fixed assets turnover 23.37 30.38 33.42 34.76 36.15 Total assets turnover 0.31 0.39 0.42 0.44 0.45
Financial Management Indicators
Liquidity indicators ( short-term)
Current ratio 1.34 1.28 1.29 1.29 1.30 Quick ratio 1.29 1.24 1.25 1.26 1.26 Solvency indicators ( Long-term)
Debt ratio 0.33 0.35 0.35 0.34 0.33 Debt/equity 0.49 0.52 0.50 0.47 0.43 Leverage 1.49 1.50 1.46 1.37 1.29
56

57

Activision . (2011). Corporate Citizenship. Retrieved April 18, 2011 from Activision: http://www.actisision.com/index.html#about|en_US|
type:corporate
Activision Blizzard Inc. (2011). Games. Retrieved April 17, 2011, from Activision : http://www.activision.com/index.html#games|en_US
Activision Blizzard, Inc. . (2010). Quarterly Report Pursuant to Sention 13 or 15(d) of the Securities Exchange Act of 1934. Activision Blizzard, Inc. .
Activision Blizzard, Inc. . (2009). Quarterly Report Rursuant to Section 13 or 15(d) of the Securities Exchange Act of 1934. Activision Blizzard, Inc. .
Activision Blizzard, Inc. (2011). Annual Report Persuant to Section 13 or 15(d) of theSecurities Exchange Act of 1933. Santa Monica: Activision Blizzard, Inc.
Activision Blizzard, Inc. (2011). Annual Report Pursuant to Section 13 or 15(d) of theSecurities and Exchange Act of 1934. Delaware: Activision Blizzard, Inc.
Activision Blizzard, Inc. (2011, February 9). Fourth Quarter and CY 2010 Results. 14.Activision Blizzard, Inc.
Activision Blizzard, Inc. (2011, February 9). Game Release Calendar. Retrieved April 20, 2011 from Activision Blizzard:
http://investor.activision.com/games.cfm
Androvich, M. (2008, October 6). 2K Sports Unheralded Against EA Sports, says Zelnick. Retrieved April 26, 2011, from GameIndustry.biz:http://www.gamesindustry.biz/articles/2k-sports-
unheralded-against-ea- sports-says-zelnick
Armstrong, G., & Kotler, P. (2011). Marketing: An Introduction (10 ed.). Upper SaddleRiver, New Jersey: Prentice Hall.
Arsenault, D. (2009, March 2). Video Game Genre, Evolution and Innovation. Retrieved April 21, 2011, from Eludamos. Journal for Computer Game Culture: http://www.eludamos.org/index.php/eludamos/article/viewArticle/65/12 5
BDO. (2007, May 9). Spore Delayed by EA. Retrieved April 28, 2011, from Wyrd: http://wyrdstuff.com/?p=503
Blizzard Entertainment. (n.d.). 20 Year Anniversary: Memories of Blizzard Video Contest. Retrieved April 30, 2011, from Blizzard
Entertainment: http://us.blizzard.com/en-us/company/about/b20/contest.html
Brightman, J. (2010, November 23). Activision: 'We Will Never, Ever Charge for Call ofDuty Multiplayer'. Retrieved May 2, 2011 from Industry Gamers:
http://www.industrygamers.com/news/activision-we-will-never-ever- charge-for-call-of-duty-multiplayer/
58
References
Brightman, J. (2011, April 8). Facebook Dominance is EA's Next Goal . From IndustryGamers: http://www.industrygamers.com/news/facebook-dominance-is-eas-nextgoal/
Call of Duty: Black Ops. (2010). Black Ops:Game. Retrieved May 2, 2011, from Call ofDuty: Black Ops: http://www.callofduty.com/game
Cluster 5a 101. (2011, April 19). please take this survey for our cliuster project! United States of America: www.surveymonkey.com.
Dietz, J. (February, 9 2011). Metacritic’s 1st Annual Game Publisher Rankings. Retrieved April 23, 2011, from Metacritic: http://features.metacritic.com/features/2011/game-publisher-rankings-for-2010-releases/
Electronic Arts. (2011). Form 10-Q Quarterly Report. Electronic Arts.
Electronic Arts Inc. (2010). Annual Report Persuant to section 13 or 15(d) of the Securities Exchange Act of 1934. Redwood City: Electronic Arts Inc.
Electronic Arts, Inc. . Recently Released Products. Electronic Arts, Inc. .
Electronic Arts, Inc. (2008). Ouarterly Report Pursuant to Section 13 or 15(d) of the Securities Exchange Commission Act of 1934. Redwood City: Electronic Arts, Inc.
Electronic Arts, Inc. (2009). Ouarterly Report Pursuant to Section 13 or 15(d) of the Securities Exchange Commission Act of 1934. Redwood City: Electronic Arts, Inc.
Electronic Arts, Inc. (2010). Ouarterly Report Pursuant to Section 13 or 15(d) of the Securities Exchange Commission Act of 1934. Redwood City: Electronic Arts, Inc.
Entertainment Software Association. (2010). 2010 Sales, Demographic and Usage Data: Essential Facts about the Computer and Video Game Industry. Entertainment Software Association.
Gadget Ground. (2011, January 21). Take-Two said the chairman of digital distribution and film. From Gadget Ground:
http://gadgetground.com/take-two-said-the-chairman-of-digital-distribution-and-film/
GameSpot. (n.d.). Monster Jam: Urban Assault (PSP). Retrieved May 1, 2011, from GameSpot: 2011
Gilbert, B. (2011, February 9). Activision Axing Guitar Hero and True Crime; Freestyle Games Reportedly Hit with Layoffs. Retrieved April 26, 2011, from Joystiq:
http://www.joystiq.com/2011/02/09/report-activision-axing-guitar-hero-and-true-crime-freestyle-g/
GoNintendo. (2011, February 10). Activision elaborates on project Beachhead...a little. From GoNintendo: http://gonintendo.com/viewstory.php?id=149909
59

Haas, P. (2011, February 9). Call Of Duty: Black Ops First Strike Sales, PS3 Release Date Announced. Retrieved April 26, 2011, from Cinema Blend:
http://www.cinemablend.com/games/Call-Duty-Black-Ops-First-Strike-Sales-PS3-Release-Date-Announced-29936.html
Haywook, N. (2006, March 3). Guitar Hero - PS2. Retrieved May 1, 2011, from Hexus Gaming: http://gaming.hexus.net/content/item.php?item=4804
Kane, Y. (2009, September 10). EA CEO Says Madden Sales Are Down. Retrieved April 27, 2011, from The Wall Street Journal:
http://blogs.wsj.com/digits/2009/09/10/ea-ceos-videogame-outlook/
Lafferty, M. (2010, November 12). "Call of Duty: Black Ops" is Worth the Hype. Retrieved April 28, 2011, from Boise Weekly:
http://www.boiseweekly.com/Cobweb/archives/2010/11/12/review-call- of-duty-black-ops-is-worth-the-hype
Loukerner. (2010, April 6). Zynga $5 Billion Valuation: BUY – Early Leader in Social Gaming is Printing Money . From Second Shares: Secondary Private Company Stocks: http://www.secondshares.com/2010/04/06/zynga-5-billion-valuation- buy-–-early-leader-in-social-gaming-is-printing-money/
Madden 2011 to Hit iPads. (2010, August 9). Retrieved April 28, 2011, from Gadgetlite:http://www.gadgetlite.com/2010/08/09/madden-2011-hit-ipads/
Magrino, T. (2011, February 1). NBA 2K11 sales near 4 million. Retrieved April 26, 2011, from Game Spot: http://www.gamespot.com/news/6297199.html
Makuch, E. (2011, April 7). EA: Battlefield 3 designed to "take Call of Duty down". Retrieved April 24, 2011, from Gamespot:
http://www.gamespot.com/pc/action/battlefield3/news.html?sid=6307366
McWhertor, M. (2009, March 10). Grand Theft Auto IV Moves 13 Million Copies, Take-Two Sees Loss. Retrieved April 26, 2011, from Kotoku:
http://kotaku.com/#!5167709/grand-theft-auto-iv-moves-13-million-copies-take+two-sees-loss
Medievaldragon. (2007, November 20). World of Warcraft Mr. T Commercial TV ad. Retrieved April 20, 2011, from YouTube:
http://www.youtube.com/watch?v=bqJE5TH5jhc&feature=related
Mergent Online. (2011). Activision Blizzard, Inc. (NMS: ATVI). Retrieved April 24, 2011 from Mergent Online:
http://www.mergentonline.com.proxy.library.ohio.edu/companyfinancials.php?pagetype=ratios&compnumber=126122
Mergent Online. (2011). Electronic Arts, Inc. (NMS: ERTS). Retrieved April 24, 2011 from Mergent Online: http://www.mergentonline.com.proxy.library.ohio.edu/companyfinancials.php?pagetype=ratios&compnumber=627773
60
Mergent Online. (2011). Take-Two Interactive Software, Inc. (NMS: TTWO). Retrieved April 24, 2011 from Mergent Online:
http://www.mergentonline.com.proxy.library.ohiou.edu/companyfinancials.php?pagetype=ratios&compnumber=91266
Mergent Online. (2011). THQ, Inc. (NMS: THQI). Retrieved April 24, 2011 from MergentOnline:
http://www.mergentonline.com.proxy.library.ohiou.edu/companyfinancials.php?pagetype=ratios&compnumber=67936
MESA. (2011, March 8). EA: Digital Distribution Has ‘Mass Effect’ on PlayStation Game. From MESA (Media & Entertainment Services Alliance):
http://mesalliance.org/blog/2011/03/08/ea-digital-distribution-has-‘mass-effect’-on-playstation-game/
NASDAQ. (2011, May 2). FlashQuotes: ATVI. Retrieved May 2, 2011 from NASDAQ: http://www.nasdaq.com/aspx/flashquotes.aspx?symbol=ATVI&selected=ATVI
Noe, G. (2009, June 1). Grand Theft Auto IV . Retrieved April 28, 2011, from First Hour: http://firsthour.net/series/grand-theft-auto
Orland, K. (2011, April 18). THQ's Farrell Talks Up Digital Distribution, New Business Models. From Gamasutra: http://www.gamasutra.com/view/news/34160/THQs_Farrell_Talks_Up_Digital_Distribution_New_Business_Models.php
Pakinkis, T. (2010, November 25). Grand Theft Auto 5 release in 2012. Retrieved April 26, 2011, from Computer and Video Games:
http://www.computerandvideogames.com/277677/news/grand-theft-auto-5-release-in-2012-analyst/
Rodda, D. (2010, August 11). FIFA 2011 Cover Unveiled, Slightly Random. Retrieved April 28, 2011, from Futbol for Yanks:
http://futbolforyanks.com/2010/08/11/fifa-2011-cover-unveiled-slightly-random/
Santos, A. (2009, n.d.). World at War Map Pack 1 reaches over $10 million in sales in its first weekend. Retrieved April 25, 2011, from VG Tribune:
http://vgtribune.com/world-at-war-map-pack-1-reaches-over-10-million-in-sales-in-its-first-weekend/
Schramm, M. (2011, March 16). Judge: Activision’s suit against EA and former IW heads can proceed. Retrieved May 2, 2011, from Joystiq:
http;//www.joystiq.com/2011/03/16/judge-activisions-suit-against-ea-and-former-iw-heads-can-proc/
Senior, T. (2011, February 16). Could Call of Duty go the same way as Guitar Hero? Retrieved April 24, 2011, from PCGAMER:
http://www.pcgamer.com/2011/02/16/could-call-of-duty-go-the-same-way-as-guitar-hero/
Shane, C. (2011, January 25). WWE All Stars Boxart Revealed. Retrieved April 28, 2011, from CAWS: http://caws.ws/wweallstars/?p=69
61
Sinclair, B. (2011, February 11). Activision to Acquire Take-Two? Retrieved April 24, 2011, from GameSpot: http://www.gamespot.com/news/6298567.html
Sliwinski, A. (2008, February 12). Spore finally evolves to retail Sept 7, 2008. Retrieved April 28, 2011, from Joystiq:
http://www.joystiq.com/2008/02/12/spore-finally-evolves-to-retail-sept-7-2008/
Smith, J. (2011, March 29). Inside Virtual Goods: Profiling the Social Gaming Middle Market 2011, Is Here. From Inside Social Games:
http://www.insidesocialgames.com/2011/03/29/inside-virtual-goods-profiling-the-social-gaming-middle-market-2011-is-here/
Srisavasdi, G. (2010, October 7). Ballin' with NBA 2K11 and Michael Jordan. Retrieved April 28, 2011, from Hollywood Outbreak:
http://www.hollywoodoutbreak.com/2010/10/07/ballin-with-nba-2k11-and-michael-jordan/
Stock Wizard. (2011, February 6). Activision Blizzard Inc. (NASDAQ: ATVI): Q4 Earnings Preview 2010. Retrieved May 2, 2011 from Stock Wizard: http://isstockwizard.blogspot.com/2011/02/activision-blizzard-inc-nasdaq-atvi-q4.html
Takahashi, D. (2011, February 17). How long before Zynga becomes the most valuable video game company? From GamesBeat Interpreting Innovation:
http://venturebeat.com/2011/02/17/wtf-how-long-before-zynga-becomes-the-most-valuable-video-game-company/
Take-Two Interactive Software, Inc. (2010). Annual Report Pursuant to Section 13 or 15(d) of the Securities Exchange Act of 1934. New York: Take-Two Interactive Software, Inc.
Take-Two Interactive Software, Inc. (2008). Quarterly Report Pursuant to Section 13 or 15(d) of the Securities Exchange Act of 1934. New York: Take-Two Interactive Software, Inc.
Take-Two Interactive Software, Inc. (2009). Quarterly Report Pursuant to Section 13 or 15(d) of the Securities Exchange Act of 1934. New York: Take-Two Interactive Software, Inc.
Take-Two Interactive Software, Inc. (2010). Quarterly Report Pursuant to Section 13 or 15(d) of the Securities Exchange Act of 1934. New York: Take-Two Interactive Software, Inc.
Tan, M. (2011, February 9). Project Beachhead to manage Call of Duty online content. Retrieved May 3, 2011 from Destructoid: http://www.destructoid.com/project-beachhead-to-manage-call-of-duty-online-content-193649.phtml
THQ Inc. (2009). Annual Report Persuant to Section 13 or 15(d) of the Securities Exchange Act of 1934. Agoura Hills: THQ Inc.
THQ Inc. (2011). Pursuant to Section 13 OR 15(D) of The Securities Exchange Act of 1934. Agoura Hills: THQ Inc.
62

THQ Inc. (2009). Quartely Report Pursuant to Section 13 or 15(d) of the Securities Exchange Act of 1934. Agoura Hills: THQ Inc.
THQ Inc. (2008). Quarterly Report Pursuant to Section 13 or 15(d) of the Securities Exchange Act of 1934. Agoura Hills: THQ Inc.
THQ Inc. (2010). Quarterly Report Pursuant to Section 13 or15(d) of the Securities Exchange Act of 1934. Agoura Hills: THQ Inc.
THQ Inc. (2011, April). Recently Released. (T. Inc., Producer) Retrieved April 22, 2011 from THQ: http://www.thq.com/us/search/index/
THQ UFC Undisputed 2010 for Xbox 360. (2011). Retrieved April 28, 2011, from Shopping: http://www.shopping.com/THQ-UFC-Undisputed-2010-for-Xbox-360/prices
Vella, M. (2008, May). Grand Theft Auto Rakes in Record Sales. Retrieved April 26, 2011, from Business Week: http://www.businessweek.com/innovate/gamesinc/archives/2008/05/grand_theft_aut.html
Wallpaperez. (n.d.). Retrieved April 28, 2011, from Wallpaperez: http://www.wallpaperez.info/games/World-of-Warcraft-Cataclysm-wallpaper-2121.html
Wingfield, N., Ante, S. E., & Das, A. (2011, February 14). Zynga's Talks With Investors Value Gaming Concern at Over $7 Billion. From The Wall Street Journal: http://online.wsj.com/article/ SB10001424052748703515504576142693408473796.html
Zacks Investment Research. (2011, April 1). EA Launches On Facebook. From Zacks Investment Research : http://www.dailymarkets.com/stock/2011/04/01/ea- launches-on-facebook/
63