merge page of thesis - core
TRANSCRIPT

Saurashtra University Re – Accredited Grade ‘B’ by NAAC (CGPA 2.93)
Sharma Deepak M., 2005, Critical evaluation of Indian Banking Sector with reference to Private Sector Banks and Public Sector Banks, thesis PhD, Saurashtra University
http://etheses.saurashtrauniversity.edu/id/eprint/64 Copyright and moral rights for this thesis are retained by the author A copy can be downloaded for personal non-commercial research or study, without prior permission or charge. This thesis cannot be reproduced or quoted extensively from without first obtaining permission in writing from the Author. The content must not be changed in any way or sold commercially in any format or medium without the formal permission of the Author When referring to this work, full bibliographic details including the author, title, awarding institution and date of the thesis must be given.
Saurashtra University Theses Service http://etheses.saurashtrauniversity.edu
© The Author
brought to you by COREView metadata, citation and similar papers at core.ac.uk
provided by Etheses - A Saurashtra University Library Service
1
� ������
������� ��
��� ��� ���� � ����� ���� �� ������ ������������ �� ���������� �� �� ���� ������������
���� ��� ������� �� ��� ��
������� �������� ����� ��������������
����� � ���� ���
����� ��� � ����
������
���� ��� �������� �������� �������� ����� ��� �� �� �� ��
��������� � ������ �
���� ���� �� ��� �� � �������
������� �����
��� ���� � ����� �����
������
���� � � � �!"�
#$%% & ''(')(#))# � *�+,�-� #)).

2
��/!-"+�0" 1 � ++�-2� � 3450�44 ��+5054"-!"5 0
�!3-!46"-! �05*�-45"7
�����
������������
This is to certify that Mr. Deepak M. Sharma has carried out
the Research work in this thesis �� ���������
������ �� � ��� �� �� � ����� �����
��� � �� ����� ����� �� �� � �
������ ����� �� ���� �������� � !""!�"#$
Under my guidance and supervision.
I also certify that this is his original work.
����� ���� ��� �� � ���� ��� ������ �� �����
������ ������ �������� ������������������ � ������ !"#������ �$������������%�#���&��� '��������(��������

3
DECLARATION
I, the undersigned hereby declare that the
research work presented in this thesis on
��������� ������ �� � ��� �� �� �
����� ����� ��� � �� ����� �����
�� �� � � ������ ����� �� ���� ��������
� !""!�"#$ is my original work and being
prepared as per the guidance given by my guide.
I also declare that the research work has not
been previously submitted to this or any other
University for any degree or award.
Date: 25th November – 2005 Mr. Deepak M. Sharma Research Scholar Place: Rajkot

4
��������
������� �
�� � �������� � �
�� � ������ ���
�� � ������ � ������ �
�������� ���� ���
� ���������� �� � ����� ������� �
� ���� �� ����������� ��
� � ����� �� ������ ������ �� ���������� ��
� � ����� �� ��� �� � �������� ���
� � ����� �� ����� ���� ��� �� � �� ������� ���
� ��� �� �������� �� ���������� ��!
���������� ���
����� ���

5
PREFACE
The study of Indian Banking sector occupies an important place in
development of economy in India, and is related to close and critical study of
various measures observed in the operation of business and management
organization.
Present study described four types of analytical aspects of
performance of India banking sector i.e. Productivity, Profitability, various
Financial Efficiency (Ratio) and comparative study with Common Size
Statements. Although as a conceptual point of view performance appraisal is
purely developmental tool for a study unit.
Banking sector reforms in India, strive to increase profitability,
productivity and efficiency of the banking institutions. The existing banking
institutions has to face the global competition. As a consequence, there has
not only been rapid expansion in the number of banking institutions in the
country, but the banking horizon of the country has also changed significantly
with the entry of new private sector and foreign banks. Nowadays, the country
has (i) Public Sector Banks (ii) Old Private Sector Banks (iii) New Private
Sector Banks and (iv) Foreign Banks operating side – by – side and giving cut
– throat competitions to each other. This study emphases on the critical
evolution of Indian banking sector specially with reference to public sector
banks and new private sector banks.
Present study contained 10 banks units out of them 5 banks selected
from public sector banks and rest of 5 banks from new private sector banks
randomly.
From Public Sector Bank. Form New Private Sector Bank
(1) State Bank of India (1) ICICI Bank Ltd.
(2) Bank of Baroda (2) HDFC Bank Ltd.
(3) Punjab National Bank (3) UTI Bank Ltd.
(4) Union Bank of India (4) Bank of Punjab Ltd.
(5) Punjab & Sind Bank (5) Global Trust Bank Ltd.

6
Data collected for the period of five years from 1998-99 to 2002-03 of the
accounting years. During the course of study two hypotheses have been
tested. These hypotheses are based on two different statistical tests viz.
Kruskal Wallis One Way Analysis of Variance Test and F – test [ANOVA].
This study is devided into six chapters. The first chapter describes the
history of India banking sector and various banking institutions in India. The
second chapter focuses on the research methodology of the study. The third
chapter describes performance of productivity and profitability of the selected
bank units under study. The fourth chapter emphasis as on ratios with
analytical financial efficiency. The fifth chapter describes comparative study
with common – size profit and loss statement and balance sheet of selected
bank units under study. While sixth chapter shows summary findings and
suggestions for present research study.
After completing my B.Com with 74% in 1986-87, I immediately got the
service in Punjab & Sind Bank in 1988. Fortunately, I finished my M.Com (first
class) in 1991 after my service in bank. During the period of 1991 to 2001
(Ten years) I got Jyoti as a better half in 1992, Pooja (daughter) in 1993 and
Kevin (son) in 1999 during my satisfactory marriage life. One day I thought to
do something for academic era. I express my deep sense of thanks for the full
moral support of my wife and friend, Smt. Jyoti Sharma.
When I thought about to register my self as a Ph. D. student, I met Shri
Ramesh Kavar my special friend to give me all types of help. We have visited
so many places and persons to know procedure and end of this process of
primary stage I approached Dr. Shailesh J. Parmar, Associate Professor,
Department of Commerce and Business Administration, Saurashtra University
and with a smiling face he allowed me for registration as a Ph. D. research
scholar under his guidance.
I am very extremely fortunate to have Dr. Shailesh J. Parmar,
Associate Professor, Department of Commerce and Business Administration,
Saurashtra University – Rajkot as my research supervisor this thesis which
could not have been completed without magnificent supervision extended by
him.

7
I firmly believe that my journey for Ph. D. Degree began with the
blessings of my parents and family members and ended up with the grace of
God. I extend my heartfelt thanks to my parents and family members.
I would like to acknowledge my better half my loving Jyoti (wife). She
has taken care of my requirements and has inspired me constantly to precede
my research work. I indeed appreciate her contribution and co-operation for
my success. Pooja my daughter and Kevin my son also helped me by
providing love and alfaction during the course of my research work. I feel that
the research work could not have been completed in time if I don’t get the
support of my beloved children.
I express my thanks to Late Shri M. S. Joshan, Chief Manager, Punjab
& Sind Bank – Rajkot Branch for his giving me support for study in bank
service life. I also thankful to Shri Ashok Bhatt, Shri Rajan Anand, Shri
Suresh Adeshra, Shri G. Krishna, Shri Dinesh Dhinora, Shri Manoj Valani,
Shri Bakul Chavda, Shri Ramesh Patel, Shri Shantibhai Gohel, Shri Surjit
Singh, Shri Prakash Pandya, Shri Jagdish Bhill, Shri Harshad Zala, Shri
Arvindbhai and Shri Shantibhai Goswami, my loving and coperative staff
member of Punjab & Sind Bank, Rajkot, for providing me moral support. I
express my deep sense of thanks to Mr. Rajul Desai, Manager, Punjab & Sind
Bank – Rajkot for his favour about my research work during his Rajkot Stay.
It is very difficult to find suitable words for thanks to Mr. Nilesh Soni
Head Librarian, Saurashtra University – Rajkot and all staff members of main
liabrary for providing me all facility for reference books, reading atmosphere
during the course of my research work. I am thankful to the office staff of the
Department of Commerce.
I am also acknowledging to Dr. Pratrapsinh Chauhan Head of M.B.A.
Bhavan, Saurashtra University – Rajkot and Dr. Daxaben Gohil Head of
Commerce Bhavan, Saurashtra University – Rajkot, for motivating me for this
research work.
I am considering the willing services of Shivam Computer – Rajkot for
computer setting of the manuscript. I am acknowledging the co-operation
extended to me by Shree Krishna Graphics for type setting, neat typing and
printing of the written data, who have not only processed the words well in
time but have also set the tables in the desirable manner.

8
I am considering the willing services of proof reading work of this
research work from Mr. Ravi Somaiya who is my best friend. I am thankful to
all those who have helped me directly and indirectly for the completion of my
search work.
�� ������ �� ��
Rajkot Dipak M. Shrama November-2005 (Research Scholar)

9
���� �� ���� ������
ALM : Asset Liability Management
BIS : Bank for International Settlement
BOB : Bank of Baroda
BRA : Banking Regulation Act
CAR : Capital Adequacy Ratio
CDR : Credit Deposit Ratio
CRB : Customer Relationship Banking
CRR : Cash Reserve Ratio
DICGC : Deposit Insurance and Credit Guarantee
Corporation
DTL : Demand and Time Liabilities
ECGC : Export Credit Guarantee Corporation
HDFC : Housing Development Finance Corporation
HRD : Human Resource Development
HRM : Human Resource Management
IBA : Indian Bank’s Association
NABARD : National Bank for Agricultural and Rural
Development
NBFC : Non Banking Financial Companies
NDTL : Net Demand and Time Liabilities
NPA : Non Performing Asset
10
P&SB : Punjab and Sind Bank
PNB : Punjab National Bank
PSA : Priority Sector Advances
PSB : Public Sector Bank
RBI : Reserve Bank of India
RRBs : Regional Rural Banks
SBI : State Bank of India
SCB : Scheduled Commercial Bank
SLR : Statutory Liquidity Ratio
UBI : Union Bank of India

11
���� �� ���� �� � ���
��� ������ ���� ��� ��
��� ���� �� ������ ��� ����� ��������� ����� ��
��� ������� ����� ��� ������ ��������� ����� ��
��� ������ ������� ��!��!�� �"
��# ��!��!�� �� ������ $�%%������ ���� &� ��
��'�'��( �)
��) *�������� +� !�� �� $�%%������ ���� &� ��
��'�'��( �,
��" -�. ��������� �� ���� ���� �� ����� ��
��, -�. ��������� �� ���� �� ������ ��
��/ -�. ��������� �� 0!�1�2 �������� ���� �#
���� -�. ��������� �� 0!�1�2 3 ��� ���� �"
���� -�. ��������� �� 4���� ���� �� ����� #�
���� -�. ��������� �� �$�$� ���� 5��� #�
���� -�. ��������� �� 6�*$ ���� 5��� ##
���� -�. ��������� �� 47� ���� 5��� #,
���# -�. ��������� �� 8��2�� 7�! � ���� )�
���) -�. ��������� �� ���� �� 0!�1�2 5�%���� )�
��� 7���� �� 0���!������. 0�� ������ �� ����
!���� �!�. /�
��� 7���� �� 0���!������. 0�� %���.�� �� ����
!���� �!�. /)
��� 7���� �� 0���!������. 2. 9������ *!��
��� $��������� 5��2����. ���
��� 7���� �� 0���!������. 2. ��� 7���� ����%� ��,
��# 7���� �� 0���!������. 2. ��� 0����� ���
��) ����%� ��� �������!�� *��: ��/
��" 5������ 2��:��� *����� ���������
���� 0������2����. ���
��, -�. ��������� ��� 0!�1�2 ��� ��� ���� ���

12
��/ -�. ��������� ��� 0!�1�2 �������� ���� ��#
���� -�. ��������� ��� ���� �� ������ ��)
���� -�. ��������� ��� 4���� ���� �� ����� ��"
���� -�. ��������� ��� ���� ���� �� ����� ��,
���� -�. ��������� ��� �$�$� ���� 5��� ��/
���� -�. ��������� ��� 6�*$ ���� 5��� ���
���# -�. ��������� ��� 47� ���� 5��� ���
���) -�. ��������� ��� 8��2�� 7�! � ���� 5��� ���
���" -�. ��������� ��� ���� �� 0!�1�2 5��� ���
���, !%%��. �� 0������2����. +���� ��� ����;
4���� �!�. ��#
���,� $�%�������� 0������2����. �� ���� :���
-�! ��� 9���� <�� 9�. ����. � ��
=������� �� � ��/
��� 7�+>� ��� ���� 4��� 4���� �!�. ��"
��� 7�+>�� ��� ���� 4��� 4���� �!�. �#�
��� $�+ ��� ������� ���� �#�
��� ��� 0�����%��� � �� �#/
��# $����� ���� �� +���� �)�
��) $� � +� ���� +���� �"�
��" $++ �!���� ��� �!�. ������ �"�
��, ���!���. 5�?!����. +���� �"�
#�� $����� �� 0����� ��� 5� ����%���
0!�1�2 3 ��� ���� �,�
#�� $����� �� ������� ���� 0!�1�2 3 ��� ���� �,#
#�� $����� �� 0����� ��� 5� ����%���
���� ���� �� ����� �,"
#�� $����� �� ������� ���� ���� ���� �� ����� �/�
#�# $����� �� 0����� ��� 5� ����%���
0!�1�2 �������� ���� �/�
#�) $����� �� ������� ���� 0!�1�2 ��������
���� �/#
13
#�" $����� �� 0����� ��� 5� ����%���
���� �� ������ �/"
#�, $����� �� ������� ���� ���� �� ������ �//
#�/ $����� �� 0����� ��� 5� ����%���
4���� ���� �� ����� ���
#��� $����� �� ������� ���� 4���� ���� �� ����� ��#
#��� $����� �� 0����� ��� 5� ����%��� �$�$�
���� 5��� ��,
#��� $����� �� ������� ���� �$�$� ���� 5��� ���
#��� $����� �� 0����� ��� 5� ����%���
6�*$ ���� 5��� ���
#��� $����� �� ������� ���� 6�*$ ���� 5��� ��#
#��# $����� �� 0����� ��� 5� ����%���
8��2�� 7�! � ���� 5��� ��,
#��) $����� �� ������� ���� 8��2�� 7�! �
���� 5��� ���
#��" $����� �� 0����� ��� 5� ����%���
���� �� 0!�1�2 5�� ���
#��, $����� �� ������� ���� ���� �� 0!�1�2 5��� ��#
#��/ $����� �� 0����� ��� 5� ����%��� 47�
���� 5��� ��,
#��� $����� �� ������� ���� 47� ���� 5��� ���
#��� $����� �� 0����� ��� 5� ����%��� ��
0!2���'0������ ����� ���� !���� �!�. ���
#��� $����� �� ������� ���� �� 0!2��� ' 0������
����� ���� !���� �!�. ��#
)�� ������� 0���!������. +���� �!���� ���
�!�. ������ ��#
14
���� �� ������ �� � ���
��� 8���� �� ������ ���� ��� ��
��� 8���� �� ���� �� 2����� ��� �����
��������� ����� ��
��� 8���� �� ���� ��>������� �� �� ��
��� 8���� �� ���� ��>������� �� �<� ��
��# 8���� �� ���� ��>������� �� 0�� �#
��) 8���� �� ���� ��>������� �� 03 � �,
��" 8���� �� ���� ��>������� �� 4�� #�
��, 8���� �� ���� ��>������� �� �$�$� ���� 5��� #�
��/ 8���� �� ���� ��>������� �� 6�*$ ���� 5��� #)
���� 8���� �� ���� ��>������� �� 47� ���� 5��� #,
���� 8���� �� ���� ��>������� �� 87� 5��� )�
���� 8���� �� ���� ��>������� �� �<0 5��� )�
��� ������� 0���!������. �. �! ��� =��!%�
0�� ������ /�
��� ������� 0���!������. �. �! ��� =��!%�
0�� %���.�� /"
��� ������� 0���!������. �. 9������ *!��
0�� %���.�� ���
��� ������� 0���!������. �. ��� 7���� ����%�
0�� %���.�� ��/
��# ������� 0���!������. �. ��� 0�����
0�� %���.�� ��#
��) ������� 0������2����. �� ������� ���� ��)
��� 8���� �� $������ ���?!��. +���� �#�
��� 8���� �� ��� @ 0�����%��� � �� �)�
��� 8���� �� $����� ���� �� +���� �)#
15
CHAPTER NO. 1
INTRODUCTION OF BANKING INDUSTRY
(1) Developments in Indian Banking [i] First Phase: [1948 – 1968]
1] After Independence
2] Plan Era
3] On the eve of Nationalisation
[ii] Second Phase: [1969 – 1991]
1] Nationalisation and after
a) Criteria and Bank list for Nationalisation
b) Branch Expansion
2] Resource Mobilization
a) Deposits: after & before Nationalisation
3] Credit Operation
a) Advances: after & before Nationalisation
4] Social Banking
5] Problems and Consolidation
[iii] Third Phase: [1992 – 2002]
1] Regime of Reforms
2] The Reform Process
3] Banking Reforms
4] Major Components of Reforms
a) Modifying the policy frame work
b) Improving the financial
c) Strengthening the institutional framework
d) Strengthening of supervisory mechanism
e) Narsimhan Committee [1998]
f) Reforms and Response
16
[iv] Forth Phase: [Beyond 2002]
1] New Challenges
2] New Dimension
3] HRD: Rigidities
4] Corporate Governance
(2) Banking Institutions:
1] Commercial Banks a) Public Sector Banks
b) Private Sector Banks
c) Foreign Banks
2] Co-operative Banks
3] Regional Rural Banks
4] Other Banking Institutions
(3) Brief History & Development of Selected Banks
under study
1] Public Sector Banks
a) State Bank of India
b) Bank of Baroda
c) Punjab National Bank
d) Punjab and Sind Bank
e) Union Bank of India
2] New Private Sector Bank
a) ICICI Bank Ltd.
b) HDFC Bank Ltd.
c) UTI Bank Ltd.
d) Global Trust Bank Ltd.
e) Bank of Punjab Ltd.

17
CHAPTER – 1
(1) Developments in Indian Banking
The Indian Banking system is unique and perhaps has no parallel in
the banking history of any country in the world. It is interesting to study the
evolution of Indian Banking over the Last five decades, in terms of
organization, functions, resource mobilization, Socio-economic role, problems
and solutions. The period of five decades witnessed many macro-economic
developments, monetary and banking policies and the external situation,
which influenced the evolution of Indian banking in different ways and in
different periods. For this reason, it would be useful to analize in some detail
the evolution of Indian banking with reference to some distinct phases. The
first phase covers the period from 1948 to 1968 and the second phase from
1969 to 1991. These two periods constitute the past.
The period of banking reforms beginning with 1992 and till the year
2002 may be regarded as the present or the current phase for the purpose of
this analysis. It is the current phase, which provides the basis for looking into
the future of Indian banking system.
[i] FIRST PHASE: (1948 -1968) (Banking Before Nationalisation)
It is useful to trace briefly the banking situation in Indian at the time of
independence of the country in 1947. The country inherited a banking system
that was patterned on the British banking system. There were many joint
stock companies doing Banking Business, and they were concentrating
mostly in major cities. Even the financing activity of these banks was confined
to exports of jute, tea etc. and to traditional industries like textiles (jute, cotton)
sugar.
There was no uniform law governing banking activity. An immediate
concern after the partition of the country was about bank branches located in
Pakistan and steps were taken to close some of them as desired by that
country. As a result of mushroom - like growth of banking companies, bank
failures were very common in those days; in 1949 as many as 55 banks either
went into liquidation or went out of banking business. Banking did not receive
18
much attention of the policy makers and disjointed efforts were made towards
the regulation of the banking Industry.
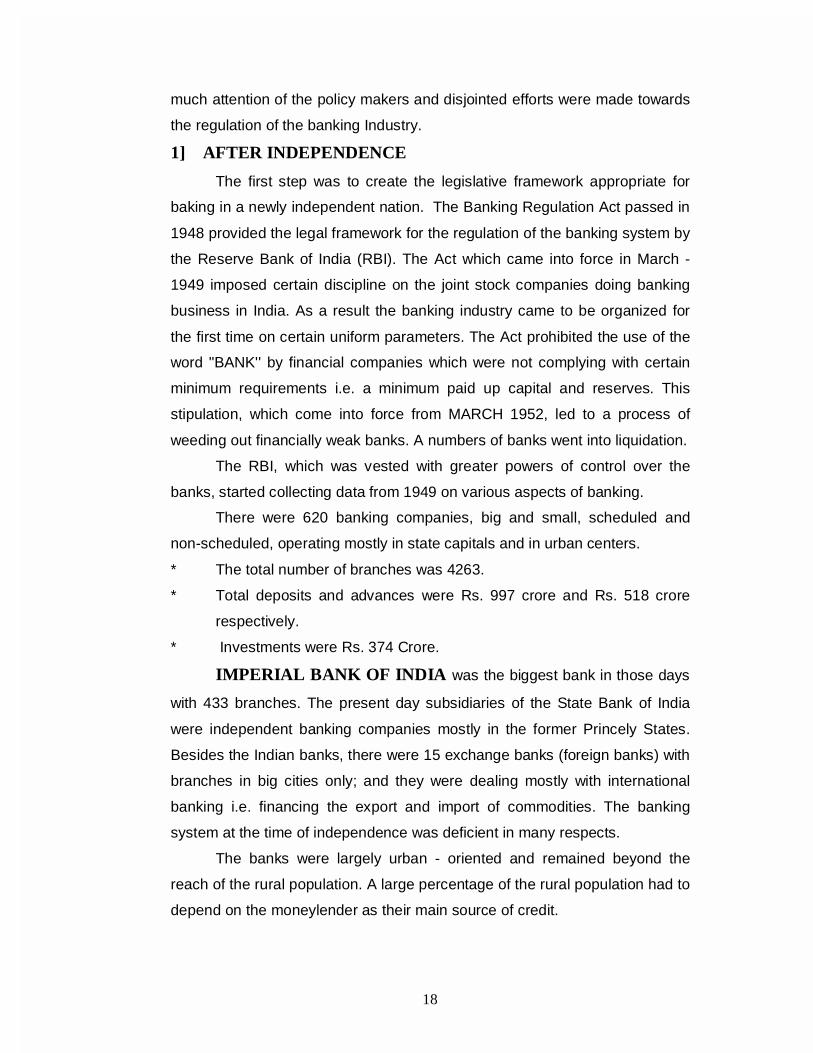
1] AFTER INDEPENDENCE
The first step was to create the legislative framework appropriate for
baking in a newly independent nation. The Banking Regulation Act passed in
1948 provided the legal framework for the regulation of the banking system by
the Reserve Bank of India (RBI). The Act which came into force in March -
1949 imposed certain discipline on the joint stock companies doing banking
business in India. As a result the banking industry came to be organized for
the first time on certain uniform parameters. The Act prohibited the use of the
word "BANK'' by financial companies which were not complying with certain
minimum requirements i.e. a minimum paid up capital and reserves. This
stipulation, which come into force from MARCH 1952, led to a process of
weeding out financially weak banks. A numbers of banks went into liquidation.
The RBI, which was vested with greater powers of control over the
banks, started collecting data from 1949 on various aspects of banking.
There were 620 banking companies, big and small, scheduled and
non-scheduled, operating mostly in state capitals and in urban centers.
* The total number of branches was 4263.
* Total deposits and advances were Rs. 997 crore and Rs. 518 crore
respectively.
* Investments were Rs. 374 Crore.
IMPERIAL BANK OF INDIA was the biggest bank in those days
with 433 branches. The present day subsidiaries of the State Bank of India
were independent banking companies mostly in the former Princely States.
Besides the Indian banks, there were 15 exchange banks (foreign banks) with
branches in big cities only; and they were dealing mostly with international
banking i.e. financing the export and import of commodities. The banking
system at the time of independence was deficient in many respects.
The banks were largely urban - oriented and remained beyond the
reach of the rural population. A large percentage of the rural population had to
depend on the moneylender as their main source of credit.

19
Bank's rural penetration was grossly inadequate, as agriculture was not
considered an economic - proposition by banks in those days. Thus the
agricultural sector, the crucial segment of the Indian economy was not
supported by the banking system in any from, Moreover, security oriented
lending was the order of the day. Only 4 percent of the total advances were
made without any security. Another serious deficiency was that the focus of
banks was entirely on short-term credit. There were no sources of long-term
finance worth the name. There was no well developed capital market; nor was
there any term-lending institution except for the industrial finance corporation
of India set up in 1948.
2] PLAN ERA
With the introduction of economic planning in 1951, the need was felt
for aligning monetary and banking activity with the requirements of planning
the first five year plan observed that RBI as the Central Bank should create
the machinery needed for financing development and ensure that the finance
available flows in the directions interned. The objective was to widen and
deepen the flow of agricultural and industrial credit. The thrust was on the
rejuvenation of the rural economy and the banking system had to be geared
to this. The branch expansion by banks and increase in rural credit including
credit to the small-scale sector became imperative. The All India Rural Credit
Survey Committee appointed by the RBI reviewed the rural credit scheme in
1954 and brought out the maladies of the rural economy arising out of capital
starvation. The committee made a few major recommendations for improving
the flow of rural credit. On the basis of its recommendations, The Imperial
Bank of India was nationalised and renamed as STATE BANK OF INDIA
(SBI) from July 1955. The new bank was charged with the responsibility of
expanding its rural branch network within a time frame. Thus the first step was
taken to induct the commercial banks into rural credit, which was till then
reserved for Co-operative Credit agencies that ware waging a battle against
money lenders. As part of the process of geographical expansion of banking
facilities to meet the credit needs of Co-operatives certain banking companies
functioning in former princely states were converted in 1959 into subsidiaries
of SBI latter come to be known as associate banks of SBI.

20
In 1960, the crash of Palai Central Bank in Kerala shook the
confidence of the public in the banking system and the RBI came out with two
schemes to stabilize the banking system. One was the establishment of the
deposit insurance corporation. To insure the deposits of small depositors, the
second scheme was the compulsory mergers and amalgamations of banks
of weak financial structure, with bigger and viable banks. Simultaneously, in
terms of the Banking Companies (Amendment) Act 1963, RBI acquired
powers to restrain control over the affairs of banks of particular groups of
persons; regulate loans, advances and guarantees given by banks and to
appoint / remove banks executive personnel in 1966, the Co-operative
banking systems was brought within the statutory supervision and control of
RBI. During these years Indian banks established overseas branches to
increase their participation in external trade i.e. foreign exchange
transactions.
There were some qualitative changes in the banking activity during
these years there was a shift in the financing of industries; there was a decline
in the financing of textiles and sugar industries and with the emphasis of the
second year plan on heavy industry development, the financing of cement,
chemicals iron and steel and engineering industries become prominent.
Export financing also attracted attention, leading to the setting up of export
credit Guarantee Corporation in 1964 to compensate exporters for the losses
they might sustain. There was also some shift in the method of lending from
security based to capacity to produce and sell criteria. A review of the
ownership of bank deposits during this period revealed the nexus between
business houses and banking companies, indicating the nature of control of
banks by business houses.
3] ON THE EVE OF NATIONALISATION
Even though Indian banking made considerable progress both
functionally and in terms of geographical coverage during this period, there
were still many rural and semi-urban areas, which were not served by banks.
Moreover, large industries and big and established business houses tended to
enjoy a major portion of the credit facilities, vital sectors like agriculture small
scale industries and exports did not receive the attention they deserved.

21
Therefore the Government imposed in 1968 social control over banks by
amending banking laws.
The objective was to achieve efficient distribution of banking resources
in conformity with the requirements of the economy and to meet the needs of
the priority sectors. In this process RBI acquired wider powers in matters of
appointment of heads of banks directors on the boards of banks and auditors.
The out come of implementation of social control over banks is of
interest. One is that the system of credit planning became an integral part of
formulation of credit policy. Second, the introduction of the lead bank scheme
was to make the banking system function as an instrument of development,
under social control the banking system including smaller banks started
gaining strength as evidence by the absence of voluntary or compulsory
mergers of banks. Thus social control was a milestone in the evolution of
banking policy.
OBJECTS OF NATIONALISATION
1. Service to agriculture sector for promoting agricultural production
and rural development.
2. Curbing credit extension for speculative and unproductive
purposes.
3. Ending of control of big industrial units and big business.
4. Creation of an atmosphere for development of adequate
professional management in the banking industry.
5. Providing credit and other facilities to small entrepreneurs with a
view to have a self-generating economy so as to enable the
improvement of poor and down trodden economically and socially.
With the nationalisation of the 20 banks it is expected that these banks
will help in
a. Better economic development of higher to neglected and less
developed areas of the country
b. Better the economic and social lot of the poor and weaker sections
of the society.
c. Curb unnecessary and unwanted credit expansion.

22
d. Mobilize savings and utilize fruitfully and advantageously the saving
so mobilized.
[ii] SECOND PHASE: 1969 - 1991
This phase began in a sedate manner with the appointment in 1969 of
the banking commission, which was to recommend changes in structure,
procedures and policy for the Indian banking system. However, the
commission did not have much time to complete its tasks as it was over taken
by swift politico - economic developments, which culminated in the
nationalisation,
a) Criteria for Nationalisation:
The private sector having demand and time liabilities of Rs. 50 crores &
more on July 19, 1969, of the 14 Major Indian Scheduled Commercial Banks
were nationalised.
List of Private Sector Banks that became Nationalised Banks (19/07/1969)
1) Central Bank of India
2) Bank of India
3) United Commercial Bank
4) Bank of Baroda
5) Canara Bank
6) United Bank of India
7) Dena Bank
8) Syndicate Bank
9) Union Bank of India
10) Allahabad Bank
11) Punjab National Bank
12) Indian Bank
13) Bank of Maharashtra
14) Indian Overseas Bank
On April 15, 1980 six more private sector banks were nationalised,
Criteria for Nationalisation was the banks having demand and time liabilities
of not less than Rs. 200 crores.

23
List of Private Sector Bank that became Nationalised Banks (15/04/1980)
1) Andhra Bank
2) Corporation Bank
3) New Bank of India
4) Oriental Bank of Commerce
5) Punjab & Sind Bank
6) Vijaya Bank
The prefix ‘THE’ and suffix ‘LTD’ were removed from the names of
these banks after their nationalisation.
Thus extending further the area of public control over the Indian
banking system nationalisation was seen as a major step to ensure adequate
credit flow into genuine productive areas in conformity with plan priorities.
1] NATIONALISATION AND AFTER
The main objectives of nationalisation were growth, reduction in
regional imbalance of economic activity, to make the banking system reach
out to the small man in rural and semi urban areas extending banking facilities
to areas hitherto not served by banks so that they not only mop up potential
savings but also meet the credit gaps in agriculture, small-scale industries and
other neglected sectors of the economy. The aim was to bring large areas of
economic activity within the organised banking system. The two significant
aspects of nationalisation were rapid branch expansion and channeling credit
according to priorities.
In the wake of nationalisation the growth and development of the Indian
banking system was phenomenal. By the end of the second decade of
nationalisation, Indian banking was relatively sophisticated, with a wide
network of branches, huge deposit resources and extensive credit operations.
The outburst of banking activity during this period was such it may be
described as banking explosion.
b) BRANCH EXPANSION
In terms of the branch licensing policy laid dawn by the RBI the accent
on the opening of branches in rural and semi-urban areas backward regions
and under-banked states so that inter-regional disparities could be reduced.

24
The detail of the progress of branch network during the period is summarised
in the table below:
TABLE NO. 1.1
BRANCH EXPANSION (NUMBER)
Year Total No.
of
Branches
Rural
Branches
Semi
Urban
Branches
Urban –
Metro &
Other
1969 8262
100
1833
[22.19%]
3342
[40.45%]
3087
[37.36%]
1980 32419
100
15105
[46.59%]
8122
[25.05%]
9192
[28.36%]
1991 60220
100
35206
[58.46%]
11344
[18.84%]
13670
[22.70%]
Source: Bank Quest Dec. 2002
Graph No. : 1.1
Graph of Branch Expansion
1833
3342
3087
15105
8122
9192
35206
11344
13670
0%
10%
20%
30%
40%
50%
60%
70%
80%
90%
100%
PER
CEN
TA
GE
1969 1980 1991
YEAR
BRANCH EXPANSION
Urban – Metro & Other
Semi Urban Branches
Rural Branches
The total of bank branches increased eight times between 1969 and
1991. The bulk of the increase was on account of rural branches, which
increased from less than two thousand in 1969 to over 35,000 in 1991. The
percentage share in the total number of branches of rural and semi urban

25
offices rose from 22 percent and 40 percent respectively in 1969 to 45 percent
and 25 percent in 1980 and to 58 percent and 18 percent in 1991. A
substantial part of the increase in branch expansion took place in the first
decade after nationalisation. The share of rural and semi urban branches
together in the total number of branches rose from 26 percent in 1969 to 76
percent in 1991. The impact of this phenomenal growth was to bring down the
population per branch from 60,000 in 1969 to about 14,000, thus one of the
objectives of nationalisation. i.e. make banking reach out to the small man in
rural and semi-urban areas, may be said to have been served to a great
extent. Even on the eve of banking reforms, the bank branch network was
widespread.
2] RESOURCE MOBILISATION
One of the objectives of branch expansion was to mop up national
savings both actual and potential and to channel them into investment
according to plan priorities. The magnitude of resources mobilised by the
banks during 1969 to 1991 is indicated below.
a) DEPOSITS - BEFORE & AFTER NATIONALISATION
TABLE NO. : 1.2
DEPOSITS - BEFORE & AFTER NATIONALISATION
[Rs. In Crore]
YEAR TOTAL
DEPOSITS
TERM
DEPOSITS
SAVING
DEPOSITS
OTHER
DEPOSITS
1969 5173
[100]
3280
(100)
1524
(100)
369
(100)
1980 37988
[734.35%]
19253
(586.98%)
10937
(717.65%)
7798
(2113.28%)
1991 230758
(4460.82%)
128768
(3925.85%)
56902
(3373.73%)
45088
[12218.97%]
SOURCE: Bank quest Dec. – 2002

26
Graph No. : 1.2
Graph of Deposits Before and After Nationalisation
3280
1524
369
19253
10937
7798
128768
56902
45088
0%
10%
20%
30%
40%
50%
60%
70%
80%
90%
100%P
ER
CE
NT
AG
E
1969 1980 1991
YEAR
DEPOSITS BEFORE AND AFTER NATIONALISATION
OTHERDEPOSITS
SAVINGDEPOSITS
TERMDEPOSITS
Between 1969 and 1980, total deposits increased six times between
1980 and 1991 the increase was five fold because of attractive interest rate
from RBI and bold decision for customer. The substantial increase in total
deposits was because of the rise in the term deposits and saving deposits,
which represents the savings of the community. These two categories of
deposits recorded a six fold increase in each of the periods 1969-1980 and
1981-1991. The share of time deposits was on an average 56 percent of total
deposits for the period 1969-1991 while the average share of saving deposits
was 27 percent. It is noteworthy that deposits per bank office, which was
Rs.0.6 crore in 1969 rose to Rs. 1.2 crore in 1980 and to Rs. 3.8 crore in
1991. This is the result of both widening and deepening of the branch network
by banks.
3] CREDIT OPERATION
Given the objective of ensuring adequate credit flow to genuine
productive sectors and in accordance with plan priorities, banks resorted to
extensive credit operation after nationalisation. This was made possible by the
enlarged resource base of banks during the period The RBI's credit policy
over the years laid increasing emphasis on channeling of bank credit to
preferred sectors and borrowers of small means. Annual targets were laid

27
down for lending to priority sectors as a whole with sub targets for weaker
sections of the society. It was also stipulated that a major portion of the
deposits mobilised in rural and semi-urban areas should be deployed in
respective areas.
The credit operations of banks during the period are summarised below.
a) ADVANCES: AFTER & BEFORE NATIONALISATION
TABLE NO.1.3
ADVANCES: AFTER & BEFORE NATIONALISATION
(Priority Sector) [Rs in Crore]
1969 1980 1991
BANK CREDIT PRIORITY SECTOR
3729 659
[17.67%]
25371 8501
[33.51%]
125592 45425
[36.17%] OF WHICH AGRICULTRE 258
[39.15%] 3584
[42.16%] 18157
[39.97%] SSI SECTOR 347
[52.66%] 3229
[37.98%] 18150
[39.96%] OTHER PRIORITY SECTOR 54
[8.19%] 1688
[19.86%] 9118
[20.07%] NOTE: Figures in brackets are percentages to vertical totals.
SOURCE: Bank Quest Dec. - 2002
Bank credit increased seven fold between 1969 and 1980 and by five
times between 1980 and 1991. The share of priority sector in total bank credit
increased from 18 percent in 1969 to 33.51 percent in 1980 and 36.17 percent
in 1991. Within the priority group the share of agriculture was 39 percent in
1969, 42 percent in 1980 and it remained at that in 1991 by 40 percent. The
share of SSI sector in total bank credit was 52.66 percent in 1969 showed a
relative decline to 38 percent in 1980 and 40 percent in 1991.
Going by the rural spread of bank branches, deposits mobilised and
credit extended, one could justifiably conclude that there was complete
transformation from class banking to mass banking during the period.
4] SOCIAL BANKING
An important banking development after nationalisation was the
emergence of social banking i.e. the use of banking as an instrument for
promoting socio-economic objectives. In the seventies, banking policy was

28
reoriented for securing a progressive reduction in income inequalities,
concentration of economic power and class disparities. For attaining the
objectives of social banking, special institutions and schemes were sponsored
by the Government of India and the RBI.
The introduction of the scheme for priority sector lending was followed
by the establishment in 1971 of credit Guarantee Corporation to provide
guarantees against the risk of default in payment in respect of loans to various
categories of small borrowers. This was intended to encourage banks to lend
to these innovations were made in the field of social banking and large
volumes of credit were lent under programmes like 20 point Economic
Programme, Integrated Rural Development Programme (IRDP), and
programmes for self employment of educated unemployed youth. Many of the
poverty alleviation programmes in the nature of mass lending schemes were
adopted by the banking systems for financing.
Though banks penetrated into rural areas planners were not satisfied
with the amount of credit extended to weaker sections of the rural society. To
ensure that the benefits of developments percolated sufficiently to the needy
the governments of India come out with special programmes like small
farmers development agency. The marginal farmers development agency and
agricultural labourers development Agency. It was felt that to cater to the
needs of these target groups, a separate credit agency was necessary. The
Narsimham Committee which went into these problems in 1974
recommended the establishment of Regional Rural Banks (RRBs). Under the
RRBs ACT - 1975, banks in collaboration with central and state government
set up RRBs in selected regions where the Co-operative system was weak
and where commercial banks were not very active.
An important aspect of credit policy during the period was the use of
administered interest rates to direct the flow of funds to preferred sectors,
small borrowers and weaker sections of the society. The aim was to make
credit available at low cost to the identified
5] PROBLEMS AND CONSOLIDATION
The phenomena growth of the Indian banking system over the two
decades prior to the reforms gave rise to several problems which become
29
more visible from the mid eighties. The rapid and substantial growth rendered
the banking system unwieldy. Besides, the constraints both internal and
external (To the banking systems) under which banks were functioning,
exposed their several weakness.
PROBLEMS OF BANKING INDUSTRY
There was low operational efficiency, inadequate capital base, and
high level of non performing assets, low profitability, unhealthy balance sheets
and unsatisfactory customer’s service. In short, the very viability of the
banking system came in for scrutiny.
The period 1985-1991 may be regarded as a period of consolidation for
the banking system. The process of consolidation called for action on several
fronts, individual banks were asked to prepare action plan covering
organization and structure, house-keeping training, customer service, credit
management recovery of loans productivity and profitability. The banks were
asked to introduce, in a phased manner, modern technology in banking
operations following the recommendations of the Rangarajan Committee on
computerization in banks. Emphasis was laid on the financial viability of banks
through improvement in profitability, strengthening the capital base of banks
and allowing them flexibility in several areas of their operations.
Although the progress made by the banking system in terms of
geographical and functional coverage, resources mobilized and credit
deployed was laudable. It displayed all the characteristics of a repressed
financial system.
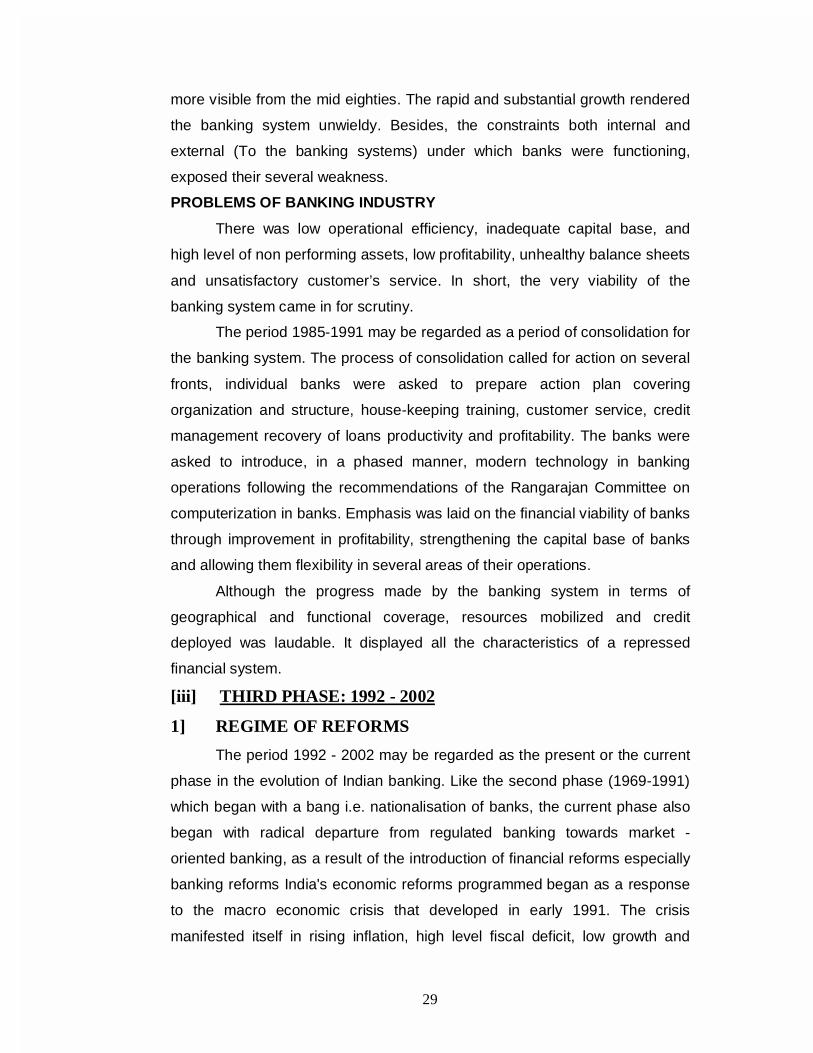
[iii] THIRD PHASE: 1992 - 2002
1] REGIME OF REFORMS
The period 1992 - 2002 may be regarded as the present or the current
phase in the evolution of Indian banking. Like the second phase (1969-1991)
which began with a bang i.e. nationalisation of banks, the current phase also
began with radical departure from regulated banking towards market -
oriented banking, as a result of the introduction of financial reforms especially
banking reforms India's economic reforms programmed began as a response
to the macro economic crisis that developed in early 1991. The crisis
manifested itself in rising inflation, high level fiscal deficit, low growth and

30
unsustainable current account deficit, and the gulf war of 1990 precipitated
the balance of payments crisis. Faced with the most serious balance of
payments problems. Government of India initiated measures for stabilization
and structural adjustment, with far-reaching consequences.
2] THE REFORM PROCESS
The main plan of economic reforms comprised (a) stabilization of the
economy so as to keep under control inflationary and balance of payments
pressures. (b) deregulation of the real and financial sectors and removal of
the license and permits system from all spheres of production and domestic
trade, to promote competition (c) liberalization of international trade in various
sectors to promote competition and efficiency by removing the high degree of
protection enjoyed by the domestic industry and (d) integration with the world
economy to attract capital and modern technology.
However economic reforms in the real sectors of the economy would
not succeed without parallel reforms in the financial sector. It hardly needs
emphasis that a liberalized economy would be ill served if the banking system
remains highly sheltered or regulated. Just as the banking system cannot
become viable or sustainable in the long run unless it adequately responds to
the needs of the market - oriented economy. Thus financial sector reforms
were a necessary concomitant of liberalization of industrial and trade policies.
3] BANKING REFORMS
The board directions, of the financial reforms were improvement in the
overall monetary policy framework, strengthening financial institutions and
gradual integration of the domestic financial system into the global economy.
Within there broad goals of policy banking reforms have the specific task of
achieving.
(A) A suitable modification in the policy framework within which banks
operate.
(B) Improvement in the financial health and competitive capabilities of
banks.
(C) Building financial infrastructure relating to supervise audit and
technology.

31
(D) Up gradation of the level of managerial competence and the quality of
human resources.
The banking reforms based on these specific tasks have two aspects;
macro level policy changes and micro-level policy reforms. The former aims at
removing external constraints on the banking system as a whole and thus
creating a climate in which banks could function in tune with liberalization.
Micro-level reforms, on the other hand, are concerned with specifics of
individual banks and banks as a whole to enable them to overcome internal
constraints on their functioning.
4] MAJOR COMPONENTS OF REFORMS
The basis for banking reforms was provided by the committee on
financial system (Narasimham Committee) which made recommendations in
November- 1991, and these recommendations are LAND MARK in the
evolution of banking policy in the country as these transformed the Indian
banking system from a highly regulated to a more market - oriented system.
The major components of banking reforms are outlined in the following
paragraphs.
a) Modification of policy frame work was the starting point. The pre-
emption of bank's resources by way of Cash Reserve Ratio (CRR) and
Statutory Liquidity Ratio (SLR) was acting as an external constraint on their
profitability. This constraint was relaxed in two ways. These two ratios
together pre-empted as much as 63.5 percent of banks resources in 1991.
The average CRR was reduced to 7.5 percent by may - 2001. The SLR was
also rationalised into a uniform ratio of 25 percent of Net Demand and Time
Liabilities (NDTL) of banks. The interest paid on eligible cash balances under
CRR was raised to 6 percent.
Alongside, the bank rate was activated in April 1997 as an effective
signal and as a reference rate. There was also the deregulation of the
administered structure of interest rates. The plethoras of lending rates were
rationalized and interest rates were made market - oriented for most of the
transactions, the expectations being the lending rate for small borrowers and
interest rate on savings bank deposits.

32
A continuous and careful step-by-step approach has become the main
features of deregulation of interest rates. To facilitate the use of open market
operations as a monetary instrument, many policy changes were made in
government securities market with reference to yields, sales procedures,
network of dealers and maturity patterns. These were supplemented by
measures to discontinue automatic monetisation of fiscal deficit by phasing
out the issue of adhoc treasure bills.
The modifications in the policy frame work carried out as part of the
reforms have paved the way for greater reliance on indirect instruments of
monetary control.
b) Improvement in financial soundness of banks is the second major
component. In an attempt to maintain profitability, banks developed a
tendency to over-extend their lending by accepting debtors of low credit
worthiness, which has come to be known as "adverse selection'' in 1992,
prudential norms and regulations were introduced, to ensure safety and
soundness of banks and impart greater transparency and accountability in
operations.
Prudential norms introduced relate to income recognition, provisioning
for bad and doubtful debts and capital adequacy. Prudential norms have
helped to serve two purposes. One they have brought out the true position of
the banking systems, loan portfolio and two, the norms have helped to arrest
its deterioration. The norms have been progressively tightened since their
introduction.
The other measures related to the improving of financial soundness of
banks are recapitalisation of public sector banks on a selective basic by the
government, improved governance in banks and a certain amount of
functional autonomy to the management of public sector banks.
c) Strengthening the institutional framework is another key element of
banking reforms. A more competitive environment has also been created for
banks so as to raise their efficiency and performance. Efficiency is not just
operational or allocational efficiency but functional efficiency as well.
Banks are already facing competition from non-banking finance
companies (NBFCs), mutual funds and from within the industry itself. While
existing banks have been allowed greater flexibility. New banks are now being

33
setup in the private sector to provide increased competition. In January 1993,
RBI announced guidelines for the entry of new private sector banks.
Approvals have been given for the establishment of new foreign banks to set
up their operations in India and existing foreign banks have been allowed to
expand their branch network.
d) Strengthening of supervisory mechanism is essential for the sound
banking system. There has to be an alert mechanism for monitoring
compliance with prudential norms and directives of RBI and other regulatory
agencies.
The system of external supervision has been revamped by the
establishment of the board for financial supervision with the operational
support of the Department of Banking Supervision of RBI. In tune with
international practices of supervision, a Three Tier supervisory off-site
monitoring and a periodical external auditing based on CAMELS (Capital
Adequacy, Asset Quality, Management Earnings, Liquidity and Systems
Controls) has been put in place.
Development Financial Institutions and Non-Development Finance
Institutions were also brought into the regulatory ambit of RBI.
In terms of the KHANNA COMMITTEE (1995) recommendations and
the Amendments in 1997 of the RBI ACT, a Three-Tier supervisory frame
work was introduced in respect of non banking financial companies (NBFCs).
The CAMELS approach has been made applicable to NBFCs also. A
department of non-banking supervision has been created to exclusively
supervise NBFCs only.
e) NARASIMHAM COMMITTEE – 1998: The government appointed
second high level "Committee on Banking Sector Reforms’’ headed by Shri M.
Narasimham to review the implementation of the reforms recommended by
the earlier committee and to look ahead and chart the reforms necessary in
the years ahead to make Indian Banking strong and better equipped to
compete effectively in a fast changing environment.
The committee submitted its reports in April - 1998, meeting wide-
ranging recommendations covering various aspects of banking policy,
institutional, supervisory and legislative dimensions. The committee came out
with recommendations with regard to Capital Adequacy, Asset Quality Non-
34
Performing Assets (NPAs) Directed Credit, Prudential Norms, Disclosure
Requirements, Asset Liability Management for earning and profitability,
Systems and Methods in Banks, Restructuring Including Mergers and
Amalgamations Reduction of Government and RBI share holding to 33
percent in public sector banks, Devising Effective Regulatory Norms and the
Review of Banking Sector Laws.
These recommendations are being progressively implemented. In
follow up of Narasimham Committee (1998) reference to weak banks in the
context of restructuring of banks, Verma Committee was appointed in 1999
with the specific task of identifying weak public sector banks, examining their
problems and suggesting strategies for restructuring them. The
recommendations of the committee were approved in principle.
f) REFORMS AND RESPONSE: The progress of banking reforms in
the last ten years has been impressive. The RBI made substantial progress in
modifying the policy framework for reforms. The proportion of banks resource
pre-empted has been brought down for instance the SLR which was 37.4
percent in March - 1992 came dawn to 25 percent in 2001.
Similarly The CRR which was 15 percent in January 1992 was brought
dawn to 5.5 percent in December - 2001
The bank rate reduced from 12 percent in October - 1991 to 6.5
percent in October - 2001.
The interest rate regime has been nationalised and in the context of
deregulation, banks have been given considerable operational flexibility and
autonomy in April-2001, in determining the rates with the approval of their
boards. To restore the soundness of public sector banks, Capital Adequacy
Ratio was introduced in 1992 and this was accompanied by recapitalisation of
banks by the government.
Between 1992-93 and 1998-99 the government contributed over Rs.
20,000 crore to the capital of public sector banks. New initiatives were taken
to strengthen the supervisory system for banks by moving towards
consolidated supervision and also towards risk based supervision.
The response of the banks to the reforms has been impressive. The banks
have been adjusting very well to the new environment, though gradually. As at

35
the end of March - 01, 23 out of 27 public sector banks have capital adequacy
in excess of 10 percent more than the prescribed ratio of 9 percent.
• 15 Nationalised banks fell into this category i.e. exceeding 10 percent.
• There has been considerable reduction in Non-Performing Assets
(NPAs). The ratio of gross NPAs to gross advances which was 23
percent in 1992-93 declined to 12.4 percent by March-2001.
• Net NPAS to net advances was 6.7 percent in 2001.
• Net profit of public sector banks amounted to Rs. 2095 crore in 2001 as
against net loss of Rs. 4705 crore in 1993-94.
Deposits mobilised increased four-fold between 1992 and 2000. The
Share of Time Deposits being 80 percent in 2000. Credit deployed in 2000
showed four-fold increase over 1991. The share of credit to priority sector in
total bank credit was a little over 30 percent.
In 1992-93 the first post reform year 12 out of 27 public sector banks
reported net losses, by March-2001 only 2 banks recorded net losses. The
striking feature of the banking system during 1991-2001 is its continuing
branch expansion.
By March-2001 there were 65901 branches and the share of rural and
semi-urban branches together was 70 percent indicating the wide reach of the
banking system, there is little doubt that the benefits of the banking reforms
have been considerable.
[iv] FOURTH PHASE: BEYOND 2002
1] NEW CHALLENGES
The first phase of financial reforms laid the basis for a sound banking
system. Considerable progress has been made in implementing the reforms
and the banking system is now moving towards the second phase.
Nevertheless the Indian banking system faces several difficult challenges;
therefore the banks have to reorient their strategies in the light of their own
strengths and the kind of market in which they are likely to operate. Some of
the challenges are home grown e.g. high cost of doing business; level of non
performing assets; and low levels of customer satisfaction. Some of the
challenges are external, e.g. phenomenal growth in the volume of capital
inflows; integration of financial markets across the globe. In view of these

36
domestic and international developments, it is necessary to chart out a path
for the development of efficient banking in the new century; there are several
areas of concern which need to be addressed.
2] NEW DIMENSION
Indian banks will have to operate in a deregulated competitive financial
sector. Competitive pressure is building up for Indian banks both from within
and from outside. Competition is likely to intensify in the coming years within
the industry, from NBFCs and from foreign entities. Competition is not just in
terms of number of competitors specialised markets, cross-border trade in
financial services and capital flows. Our reforms have made progress but we
have not become competitive internationally. We cannot lag behind other
countries and we have to transform the Indian banking system from being a
largely domestic one to a truly international one, and this should enable India
to emerge as an international banking center.
a) Information Communication Technology:
The worldwide revolution in Information and Communication
Technology (ICT) has become the biggest force of change in banking. It is a
source of productivity growth and facilitates effective competition. ICT reduces
costs, increase volumes and facilitates customised products. It plays an
important role in the payments and settlement system. Technology has
opened up new avenues in banking for discharging the same functions in a
cost effective manner e.g. 24 hour banking, telebanking, internet banking,
E-banking. The process of technological change is just beginning in Indian
banking sector. Even the use of existing technology is at low levels. Though
RBI and the banks have been taking step in the last few years,
computerisation has been mostly directed towards accounting and related
activities to management and customer service and customised products.
The Indian banking systems will have to redouble its efforts to build the
technological infrastructure not only to provide cost effective and competitive
customer service but also to achieve international recognition and status.
b) Management of NPAs:
The level of Non-Performing Assets (NPAs); though declining in recent
years, continues to be high by international standards. NPA have become a

37
first charge on banks’ funds for provisioning. These affect banks’ performance
by eating into their profitability. The most important condition for improvement
in the profitability of banks is a reduction in the level of NPAs is required. In
fact it is a pre condition for the stability of banking system. The response to
the efforts at debt recovery and restructuring of assets and other method has
been slow. The strategies for containing, the problem of NPAS should
emphasise the strict enforcement of prudential norms and requirements.
c) Enforcement of Law:
Transparency and disclosure and the need for legislation which will make the
recovery process smoother. Reforms have to be supported by legal changes
for enforceability of contracts. In any effort to build a banking system of
international stature, reduction in NPAs, should be the priority Target. d) Assets Liability Management:
Assets liability mismatches expose the banks to various types of risk
i.e. risks of liquidity and insolvency. Risk management is a continuous
process of controlling assets and liabilities in terms of size, maturities and
yields. As operations in the financial market become varied and complex,
banks have to equip themselves with a variety of skills and appropriate
technology. The RBI has issued guidelines to banks in April - 1999 for Asset
Liability Management which would help the bank management to meet the
challenges. Banks are encouraged to prescribe risk parameters and establish
effective control system. Now the action lies with banks. The general
complaint that customer satisfaction is at low levels needs to be addressed in
all seriousness.
e) Expansion of Business:
The effort should be not only to preserve the existing circle of clients,
both corporate and individuals, but also to enlarge the client base. Banks
need to develop customer relationship which has come to be known as
''Relationship Banking.'' It is concerned essentially with maintaining relations
with customers on a continuing basis. This is Customers Relationship
Management (CRM) and it is not just the relationship built around raising
deposits and making loans, though that is important, CRM goes well beyond
that. Two important aspects of CRM are: one that it does not view customers

38
in totality or in the aggregate and two the devising of banking products.
Regarding the first, customers’ needs and demands and business styles vary;
and it is necessary to consider segments of customers and build customer
profiles to evolve strategies.
As banking products are intangible, CRM involves personal selling. As
for the second, once the need for segment approach is recognised product
differentiation becomes important. The present methods of evolving products
and then looking around for customers for those products would not yield the
declared result. In short banking products should be customer-based. The
method of pricing products should also change from cost plus to product
quality. To raise the level of customer satisfaction, banks will have to setup
CRM groups or CRM departments.
3] HRD: RIGIDITIES:-
Human resource development (HRD) is the most important need for a
service industry like banking. The banking industry being largely in the public
sector, certain rigidities developed in HRD within the banking system. A part
from being the preferred employer for the educated manpower, public sector
banks followed a hierarchical, structure, which gives preference to seniority
over performance. Besides, the banks continued until recently their generalist
orientation in the matter of recruitment. In the result, the best talent, especially
specialist, could not be attracted. The approach to human resources
management in banks will have to change in tune with the fast changing
banking environment at home and abroad. While it is difficult to bring about
radical changes in the staff structure in the near future public sector banks
can effect improvement in the existing practices of recruitment, training and
redeployment. The focus must shift from generalist orientation of the staff to
specialist orientation i.e. the ability to imbibe and absorb technology.
Information technology is an area where HRD is now critical. There is also the
urgent need for training. For up gradation of different types of skills for
redeployment for changing the mindset and attitudes. It is time that banks
revamp their HRD departments and evolves appropriate policies to make the
best use of their primary asset i.e. human resources.

39
a) Internal Capital Evaluation:
There are issues in supervision and regulation with which the banks
will have to be very much concerned in the day’s ahead; the banks will have
to prepare for tightening of prudential norms as the new Basel Accord
becomes effective.
The earlier Basel Accord (1988) gave recognition mainly to credit or the
principal risk. Since then a number of events have taken place including the
East Asian Crisis which brought to light the inadequacy of the 1988
arrangement, as it did not recognize market risks. It also did not distinguish
between different types of exposures with different dimensions of risk.
According to the new capital Accord, banks would have to provide capital in
terms of "Economic Capital '' rather than the minimum regulatory capital. The
concept of economic capital covers all risks embedded in the banks balance
sheet. Again in terms of the Accord, Supervision involves moving from the
transaction-based approach to a risk base approach to determine the level of
risk that each bank is exposed to.
Bank managements will therefore have to develop internal capital
evaluation according to their risk profile. Risk weights are being constantly
revised to take into consideration additional sources of risk.
4] CORPORATE GOVERNANCE
Corporate governance is assuming greater importance in the banking
sector in recent times because of certain unhealthy developments in recent
years. The main focus in corporate governance is how to enhance
shareholder value. This needs to be achieved in a legal and ethical manner
leading to contribution to business prosperity. The major ingredients of good
corporate governance would be accountability at all levels, transparency and
enhancing the image of the organization in the eyes of the public. Corporate
governance underlines the belief that the public good should be placed above
the private good and that corporate resources cannot be used for personal
benefit.
Ethics is the part of good governance. Ethic apart, good governance is
concerned with observing rules and regulations, guidelines and cleans
corporate practices. Public sector banks have to pay considerable attention to

40
corporate governance in the context of deregulation prudential norms, risk-
based supervision and globalisation. As part of the ongoing reforms bank
managements and their boards have been given greater autonomy. It is very
important that greater vigilance over adherence to prescribed rules, norms,
and regulations is exercised.
The response groups in the banking system are banks, RBI the
Government and the customers, and the onus is on them to raise Indian
banking to international standards
41
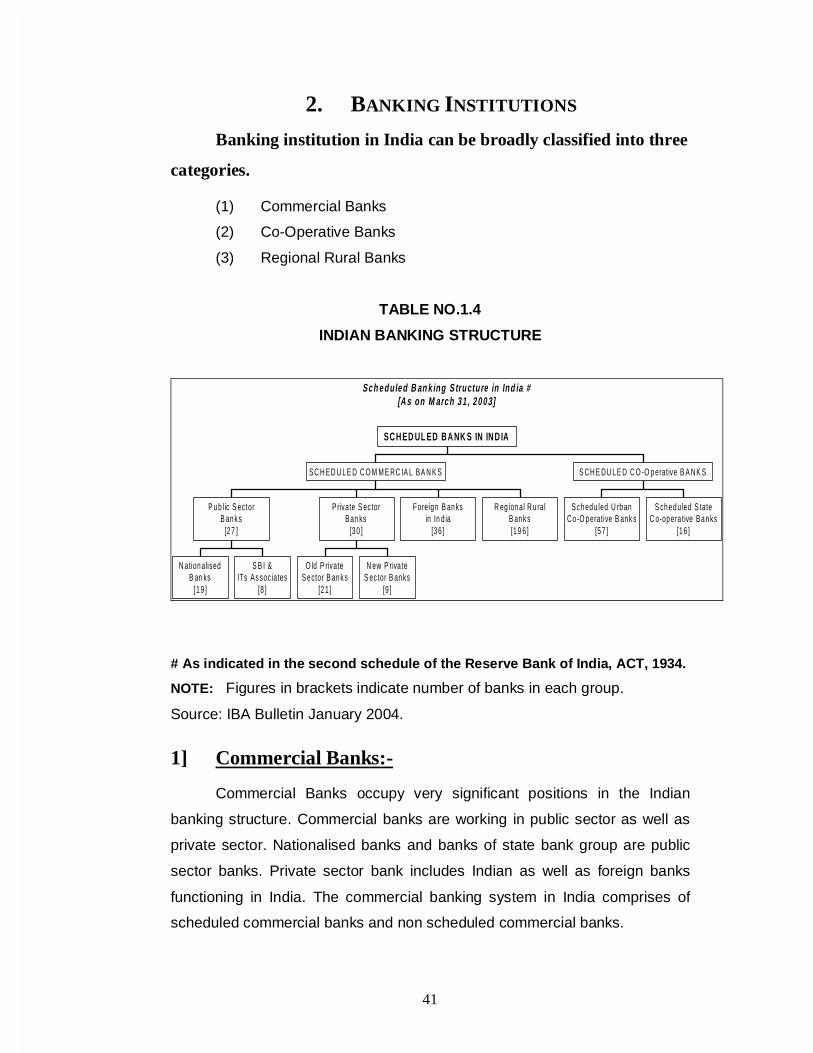
2. BANKING INSTITUTIONS
Banking institution in India can be broadly classified into three
categories.
(1) Commercial Banks
(2) Co-Operative Banks
(3) Regional Rural Banks
TABLE NO.1.4
INDIAN BANKING STRUCTURE
Sc h e dule d B an k ing S tructure in Ind ia #[A s on M arc h 3 1 , 2 0 0 3]
N ation alisedB an ks
[1 9 ]
S B I &ITs As soc iates
[8 ]
P u b lic S ectorB an k s
[2 7 ]
O ld P rivateSe ctor B an k s
[2 1 ]
N ew P riva teS ec tor B an ks
[9 ]
P rivate S ec torBan ks
[3 0 ]
Foreig n B an ksin In d ia
[3 6 ]
R eg ion al R u ralB an k s[1 9 6 ]
SC H ED U L E D C O M M E RC IA L BA N K S
Sc h ed u led U rb anCo -O p erative B an k s
[5 7 ]
S ch e d u led S tateC o-op era tive Ba n ks
[1 6 ]
S CH E DU L E D C O -O p erative B A NK S
SC H ED UL ED B A NK S IN IN D IA
# As indicated in the second schedule of the Reserve Bank of India, ACT, 1934.
NOTE: Figures in brackets indicate number of banks in each group.
Source: IBA Bulletin January 2004.
1] Commercial Banks:-
Commercial Banks occupy very significant positions in the Indian
banking structure. Commercial banks are working in public sector as well as
private sector. Nationalised banks and banks of state bank group are public
sector banks. Private sector bank includes Indian as well as foreign banks
functioning in India. The commercial banking system in India comprises of
scheduled commercial banks and non scheduled commercial banks.
42
Scheduled Commercial Banks:
After the nationalisation of 14 major commercial banks and later six
banks, the tally has come to 20. These banks are wholly owned and managed
by Government of India. But besides these 20 banks other banks were left in
the private sector which are controlled and managed by private hands but
they are regulated by national banking policy and are scheduled with the
Reserve Bank under Section 42 (B) of the RBI Act. They have been kept in
the second schedule of the RBI.
Non-scheduled Commercial Banks:
These are those banks which are not included in the second schedule
of the Reserve Bank of India. Usually those banks, the paid-up capital of
which are less than 5 lacs or the banks which do not conform to the norms of
the Reserve Bank of India within the meaning of the Act or according to
specific functions etc. or according to judgment of the Reserve Bank, are not
capable of serving and protecting the interest of depositors.
Certainly these banks do not enjoy the facilities enjoyed by scheduled
banks; they are under obligation to maintain a minimum deposit of five
percent with the RBI or with themselves under information to the RBI. The
Reserve Bank may help these banks in case of need, if these banks are
keeping their deposits with the RBI.
Non-scheduled banks may be listed in the Approved List maintained by
the Reserve Bank. If a bank is included in the list it starts enjoying the facilities
of postal concession for their remittances etc. For inclusion in such an
approved list the non-scheduled banks must:-
(i) be registered under Indian Companies Act ;
(ii) engage itself in banking business ;
(iii) have a minimum paid-up capital of Rs. 50,000.
Such banks are fast declining. In 1960-61 they were 256. In June 1969 they
were only 16 and in December 1978 their number came down to meager 9.
• Scheduled commercial banks are in public sector and private sector also.

43
• State Bank group consist of State Bank of India and its seven associate
banks.
• State Bank of India (SBI) is the biggest commercial bank of the country in
terms of man power and resources. State Bank of India was established
in1955 by conversion of the Imperial Bank of India. It ranks top in the world
in terms of number of employees.
• Nationalised bank group consists of 19 banks.
a) PUBLIC SECTOR BANKS
Here is list of public sector bank in India.
(A) Nationalised Banks. No. of Bank 19*
(B) State Bank of India and its Associates. No. of Bank 8
Total Public Sector Banks As on 31/03/2003 27
* (Note: Out of 20 nationalised bank, one bank ‘’New Bank of India’’ merged
with Punjab National Bank in 1992-93 resulting number of nationalised banks
as 19)
[A] NATIONALISED BANKS:-
(1) Allahabad Bank (2) Andhra Bank
(3) Bank of Baroda (4) Bank of India
(5) Bank of Maharashtra (6) Canara Bank
(7) Central Bank of India (8) Corporation Bank
(8) Dena Bank (10) Indian Bank
(11) Indian Overseas Bank (12) Oriental Bank of Commerce
(13) Punjab & Sind Bank (14) Punjab National Bank
(15) Syndicate Bank (16) UCO Bank
(17) Union Bank of India (18) United Bank of India
(19) Vijaya Bank
[B] STATE BANK OF INDIA and its Associates:-
1) State Bank of Bikaner & Jaipur 2) State Bank of Hyderabad
3) State Bank of Indore 4) State Bank of Mysore
5) State Bank of Patiala 6) State Bank of Saurashtra
7) State Bank of Travancore

44
b) PRIVATE SECTOR BANKS:-
There are 30 private sector banks in India As on 31/03/2003, out of 30
private sector banks 21 banks are old private sector banks and 9 banks are
new private sector banks.
Entry of new private sector banks:-
The guidelines for licensing of new banks in the private sector were issued
by the RBI on January 22, 1993,after a review of the functioning of the new
banks in private sector in consultation with the government.
• GUIDE LINES:-
1. Minimum paid up capital for a new bank shall be Rs. 200 crores. The
initial capital will be raised to Rs. 300 crores within three years of
commencement of business.
2. The promoter’s contribution shall be a minimum of 40percent of the
paid up capital of the bank at any point of time. The initial capital, other
than the promoter’s contribution, could be raised through public issue
or private placement. In case the promoter’s contribution to the initial
capital is in excess of the minimum proportion of 40 percent, they shall
dilute their excess stake after one year of the bank operations.
Promoter’s contribution of 40 percent of the initial capital shall be
locked in for a period of 5 years from the date of licensing of the bank.
3. While augmenting capital to Rs. 300 crores within three years of
commencement of business, the promoters will have to bring in
additional capital. This would be at least 40 percent of the fresh capital
raised.
4. NRI participation in the primary equity of a new bank shall be the
maximum extent of 40 percent.
5. The new bank should not be promoted by a large industrial house.
However individual companies, directly or indirectly connected with
large industrial houses may be permitted to participate in the equity of
a new private sector bank up to a maximum of 10 percent but will not
have controlling interest in the bank.

45
6. The proposed banks shall maintain an arms length relationship with
business entities in the promoter group and the individual companies
investing up to 10 percent of the equity as stipulated above.
• According to the guidelines, the private sector bank proposed to be
floated, should be public Ltd. companies with stocks quoted in the stock
exchange and should have a minimum capital base of Rs. 100 crores and a
capital adequacy ratio of 8 percent.
• Private sector banks will have to observe norms related to priority sector
advance. The Reserve Bank of India may change the concept of priority
sector advances for such new banks.
• Such a new bank shall not be allowed to set up a subsidiary or mutual
fund for at least three years after its establishment.
• Private Sector Banks Have Two Groups
i) Old Private Sector Banks No. of Banks 21
ii) New Private Sector Banks No. of Banks 9
Total 30
The Old Private Sector Banks are as under:
1] Bharat Overseas Bank Ltd.
2] City Union Bank Ltd.
3] Development Credit Bank Ltd.
4] ING Vysya Bank Ltd.
5] Karnataka Bank Ltd.
6] Lord Krishna Bank Ltd.
7] The Nainital Bank Ltd.
8] SBI Coml. and Intl. Bank Ltd.
9] Tamilnad Mercantile Bank Ltd.
10] The Bank of Rajasthan Ltd.
11] The Catholic Syrian Bank Ltd.
12] The Dhanalakshmi Bank Ltd.
13] The Federal Bank Ltd.
14] The Ganesh Bank of Kurundwad Ltd.
15] The Jammu & Kashmir Bank Ltd.
16] The Karur Vysya Bank Ltd.

46
17] The Lakshmi Vilas Bank Ltd.
18] The Ratnakar Bank Ltd.
19] The Sangli Bank Ltd.
20] The South Indian Bank Ltd.
21] The United Western Bank Ltd.
The New Private Sector Banks are as under:
i) Bank of Punjab Ltd.
ii) Centurion Bank Ltd.
iii) Global Trust Bank Ltd.
iv) HDFC Bank Ltd.
v) ICICI Bank Ltd.
vi) IDBI Bank Ltd.
vi) Indusind Bank Ltd.
viii) Kotak Mahindra Bank Ltd.
ix) UTI Bank Ltd.
c) FOREIGN BANKS:-
Foreign Banks are those banks which are incorporated out side India.
Foreign Bank’s branches are confined to big cities and port towns. These
banks mainly concentrate on the finance of foreign trade. Recently foreign
banks like City Bank and HSBC have introduced attractive deposit schemes
to increase their deposits. Foreign Banks are providing their efficient services
in the area of credit cards, personal loans, home loans, and car finance to
their client and becoming popular day by day with their prompt courteous and
highly mechanised services.
Grindlays Bank which had maximum numbers of branches in India,
merged with Standard Chartered Bank which is now top foreign bank in India
at the end of March-2002. There were 40 foreign banks but following banks
have closed their Indian operation during 2002-2003
1) COMMERZE BANK
2) DRESDNER BANK AG
3) KBC BANK
4) THE SIAM COMMERCIAL BANK P.C.L.

47
THE LIST OF FOREIGN BANKS WORKING IN INDIA
(36 Foreign Banks)
1) ABN Amro Bank N.V. 2) Abu Dhabi Commercial Bank Ltd.
3) American Express Bank Ltd. 4) Antwerp Diamond Bank N.V.
5) Arab Bangladesh Bank Ltd. 6) Bank International Indonesia
7) Bank Muscat SAOG 8) Bank of America NA
9) Bank of Bahrain and Kuwait BSC 10) Bank of Ceylon
11) Barclays Bank PLC 12) BNP Paribas
13) Chinatrust Commercial Bank 14) Chohung Bank
15) Citibank N.A. 16) Credit Agricole Indosuez
17) Credit Luonnais 18) Deutsche Bank AG
19) ING Bank 20) JP Morgan Chase Bank
21) Krung Thai Bank Public Co. Ltd. 22) Mashreq Bank PSC
23) MIZUHO Corporate Bank Ltd. 24) Oman International Bank
25) Sonali Bank 26) Societe General
27) Standard Chartered Bank 28) State Bank of Mauritius
29) The Bank of Nova Scotia. 30) The Toronto Dominion Bank
31) UFJ Bank Ltd.
32) Oversea-Chinese Banking Corporation Ltd.
33) Sumitomo Mitsui Banking Corporation
34) The Bank of Tokyo Mitsubishi Ltd.
35) The Development Bank of Singapore Ltd.
36) The Hong Kong & Shanghai BKG Corp. Ltd.
Note: 1) Indian branches of Standard Capital Grindlays Bank Ltd. were
merged with the Indian branches of Standard Chartered Bank.
2) The Development Bank of Singapore Ltd. changed its name to DBS Bank
Ltd.
1.2. A.2 Co-Operative Banks:-
• Co-Operative Banks are established under Co-Operative Societies
ACT applicable in various states.
• Co-Operative Banks have three tiers set-up.
• State Co-Operative Banks are the apex institution.

48
• Central / District Co-Operative Banks are functioning at the district level
and primary credit societies are working at base level, i.e. villages and
towns.
• Agricultural Credit Societies are functioning in villages and non-
agriculture societies and Urban Co-Operative banks are functioning in
towns and cities.
• When the Reserve Bank of India Act 1934 was passed. There was
provision for inclusion of the names of commercial banks only, in the
second schedule to the out. But subsequently, in 1965, section 42
extended such provision for Co-Operative Banks also. Therefore Co-
Operative Banks are also scheduled banks.
1.2. A.3 Regional Rural Banks (RRBs):-
• The concept of Regional Rural Bank was introduced to the Indian
Banking Industry on the 2nd Oct., 1975 when 5 Regional Rural Banks
were established under the Regional Rural Banks Ordinance, 1975.
• Later on Regional Rural Bank ACT, 1976. Replace the ordinance.
• Number of Regional Rural Banks has now reached to 196 with more
than 14000 branches.
• Regional Rural Banks are also Scheduled Banks.
• Deposits with Regional Rural Banks are insured by the DICGC.
• RBI has decided that RRBs should be paid minimum interest of 13.5
percent by their sponsor banks on their deposits eligible for SLR.
• NABARD and sponsoring banks extend refinance facility to the
Regional Rural Banks @ 3 percent below the bank rate.
• Regional Rural Banks have been given various concessions in respect
of Cash Reserve Ratio (CRR) Statutory Liquidity Ratio (SLR).
Refinance from NABARAD / sponsoring banks and interest on current
account balances.
4] OTHER BANKING INSTITUTIONS:-
(A) DEVELOPMENT BANKS
i) Industrial Development Banks.
IDBI (Industrial Development Bank of India)
49
IFCI (Industrial Finance Corporation of India)
ICICI (Industrial Credit and Investment Corporation of India)
ii) State Level Development Banks
iii) Land Development Banks
iv) National Housing Bank
(B) OTHER FINANCIAL INSTITUTIONS:
i) Life Insurance Corporation of India (LIC of India)
ii) General Insurance Corporation
iii) Unit Trust of India
(C) CREDIT GUARANTEE CORPORATION:-
i) Deposit Insurance and Credit Guarantee Corporation (DICGC)
ii) Export Credit Guarantee Corporation of India
(D) HOUSING CORPORATIONS:-
i) HUDCO (Housing and Urban Development Corporation)
ii) HDFC (Housing Development and Finance Corporation)
iii) HPFC (Housing Promotion and Finance Corporation)
(E) APEX INSTITUTIONS
i) Reserve Bank of India (RBI)
ii) IDBI
iii) NABARD
iv) EXIM
v) IRBI
vi) National Housing Board
vii) SIDBI
(F) OTHER INSTITUTIONS:-
i) DFHI (Discount and Finance House of India Ltd)
ii) SEBI (Securities and Exchange Board of India)
iii) BIFR (Board of Industrial and Finance Reconstruction)
iv) CRISIL (Credit Rating Information Services of India Ltd.)
v) ICRA (Indian Credit Rating Agency)

50
1.2.B Table No. – 1.5
STRUCTURE OF INDIAN COMMERCIAL BANKS [31-03-2003]
[Rs. in Crore] Sr. No.
BANK GROUP
No. of Bank
Deposits Capital Reserve Total Assets
Borrowings Investment Loan And Advances
1 Public Sector Bank
27.00 1079393.81 14175.39 51407.16 1285235.70 22421.04 545668.10 549331.18
Market Share 9.34 76.87 59.30 65.37 72.92 25.90 77.26 72.07 1.a State Bank
Group 8.00 391032.69 1035.80 22097.02 493954.27 11592.56 223366.50 189203.89
Market Share 2.77 27.85 4.33 28.10 28.03 13.23 31.62 24.82 1.b Nationalised
Banks 19.00 688361.12 13139.59 29310.14 79181.43 10838.48 322301.60 360147.29
Market share 6.57 49.02 54.97 37.27 44.89 12.37 45.63 47.25 2 Indian
Private Sector Bank (a + b)
30.00 207173.57 2921.06 15974.40 297279.31 42139.95 107327.94 138951.10
Market Share 10.38 14.75 12.22 20.31 16.81 48.10 15.20 18.23 2.a Old Private
Sector Banks 21.00 91431.26 648.77 5646.38 105109.50 2385.75 40001.03 49436.34
Market Share 7.27 6.51 2.71 7.18 5.96 2.72 5.66 6.49 2.b New Private
Sector Banks 9.00 115742.31 2272.29 10328.02 192169.81 39754.20 67326.91 89514.76
Market Share 3.11 8.24 9.51 13.13 10.90 45.38 9.53 11.74 3 Foreign
Banks In India
36.00 69312.82 4497.79 8906.28 116401.08 22904.42 40795.49 52170.87
Market Share 12.46 4.94 18.82 11.32 6.60 26.14 5.78 6.84 4 Total Private
Sector Bank 66.00 276486.39 7418.85 24880.68 413680.39 65044.37 148123.53 119121.97
Market Share 22.84 19.69 31.04 31.64 23.47 74.25 20.97 25.07 5 Total Comm.
Bank 93.00 1355880.20 21594.24 76287.84 1698916.09 87475.41 693791.53 740473.15
Market Share 32.18 96.56 90.34 97.00 96.39 99.85 98.23 97.14 6 Regional
Rural Banks 196.00 48338.00 2308.59 2357.41 63614.00 131.00 12524.00 21773.00
Market Share 67.82 3.44 9.66 3.00 3.61 0.15 1.77 2.86 7 Total of All
Bank 289.00 1404218.20 23902.83 78645.25 1762530.09 87606.41 706315.53 762246.15
Market Share 100.00 100.00 100.00 100.00 100.00 100.00 100.00 100.00 Source: (1) RBI Report on trend and Progress of Banking. (2) IBA Bulletin – Jan 04. Above table no. 1.5 shows there were 289 banks in India. Out of this
there were 196 RRB’s having the highest market share of 67 percent followed
by commercial banks. In public sector there were 27 banks.

51
In relations to deposits, commercial banks were on the top having a
deposit of Rs. 1355880.20 crores followed by public sector banks having
deposit of Ra. 1079393.81 crores.
In relations to capital there was same situation just as deposit. Out of
total assets of a sum of Rs.1762530.09 crores, commercial banks were
having 96.39 percentages of total assets.
In relations to borrowing, investments, loan and advances, commercial
banks were having the highest share of 99.85 percent, 98.23 percent and
97.14 percent respectively.

52
Table No. – 1.6 FINANCIAL RESULTS OF COMMERCIAL BANKS
2002 - 2003 [Rs. in Crore]
Sr.
No.
BANK GROUP Total
Income
Total
Expenditure
Operating
Profits
Provisions and
Contingencies
Net Profit
1 Public Sector Bank 128464.37 116168.91 29715.24 17419.00 12295.46
Market Share 72.05 72.29 71.78 73.21 69.86
1a State Bank Groups 48866.64 44355.12 11229.11 6717.59 4511.52
Market Share 27.41 27.60 27.13 28.23 25.63
1b Nationalised Banks 79597.73 71813.79 18486.13 10702.19 7783.94
Market share 44.64 44.69 44.66 44.98 44.22
2 Indian Private Sector
Bank (a to b)
31865.98 28908.41 7238.69 4281.12 2957.57
Market Share 17.87 17.99 17.49 17.99 16.80
2a Old Private Sector
Banks
11278.83 10047.24 2804.43 1572.84 1231.59
Market Share 6.33 6.25 6.77 6.61 7.00
2b New Private Sector
Banks
20587.15 18861.17 4434.26 2708.28 1725.98
Market Share 11.55 11.74 10.71 11.38 9.81
3 Foreign Banks In
India
12043.59 10219.55 3727.85 1903.81 1824.04
Market Share 6.75 6.36 9.01 8.00 10.36
4 Total Private Sector
Bank [2+3]
43909.57 39127.96 10966.54 6184.93 4781.61
Market Share 24.63 24.35 26.49 25.99 27.17
5 Total Comm. Bank
(1+4)
172373.94 155296.87 40681.78 23604.71 17077.07
Market Share 96.67 96.64 98.28 99.20 97.02
6 Regional Rural
Banks
5931.00 5407.00 714.00 190.00 524.00
Market Share 3.33 3.36 1.72 0.80 2.98
7 Total of All Bank 178304.94 16703.87 41395.78 23794.71 17601.07
Market Share 100.00 100.00 100.00 100.00 100.00
Source : (1) Report on Trend and Progress of Banking in India 2002-2003
(2) IBA Bulletin – Jan 2004.

53
Above table no.1.6 shows the financial results of commercial banks. In
relations to the total income, public sector banks share were on the top having
a total income of Rs. 128464.37 crores with 72.05 percentages.
In relations to total expenditure, public sector banks and private sector
banks share respectively. In relations to operating profits and provisions and
contingencies commercial banks were having the highest share of 98.28
percent and 99.20 percent respectively.
Out of total profit share Rs. 17601.07 crores the highest profit share
earned by public sector banks with Rs. 12295.46 crores at 69.86 percentages.
Over all views from the above table the share of all public sector banks
have more than 68 percent in all titles.
1.3 Brief history & development of selected banks under
study:-
1.3.1 Public Sector Bank:-
a) STATE BANK OF INDIA:-
Introduction:-
An act was accordingly passed in parliament in May – 1955 and The
State Bank of India was constituted on 1st July – 1955 as a successor to The
Imperial Bank of India under State Bank of India Act – 1955. Later the State
Bank of India (Subsidiary Banks) Act was passed in 1959, enabling the State
Bank of India to take over state associated banks as its subsidiaries.
Initially, there were eight such banks including, the State Bank of
Bikaner and the State Bank of Jaipur, which were later merged to from
one bank called The State Bank of Bikaner and Jaipur there by
reducing the number of seven. The other subsidiaries banks of SBI were
[As on 31/3/03]
1) State Bank of Bikaner & Jaipur 2) State Bank of Hyderabad
3) State Bank of Indore 4) State Bank of Mysore
5) State Bank of Patiala 6) State Bank of Saurashtra
7) State Bank of Travancore

54
SBI has sponsored 30 RRBs spread over 102 districts in 16 states with
a net work of 2339 branches. The Chairman and Managing Director of
State Bank of India is also the ex officio chairman of the Board of
Directors of the associate banks. Key indicators of State Bank of India for
1998-99 to 2002-03 have been shown in the following table no.1.7
Table No. – 1.7 KEY INDICATORS OF STATE BANK OF INDIA
Particular 1998-99 1999-00 2000-01 2001-02 2002-03 Average
Deposits [ Rs. in Crores]
169042 196821 242828 270560 296123 235075
Advances [ Rs. in Crores]
82360 98102 113590 120806 137758 110523
NPA [%] 7.18 6.41 6.03 5.63 4.12 5.87
Profit / Loss [ Rs. in Crores]
1028 2052 1604 2432 3105 2044
No. of Employee 237504 233433 214845 209462 208998 220848
No. of Branches 8982 9043 9078 9085 9081 9054
[Source: IBA Bulletin March 2003, January 2004. ]
GRAPH NO.1.3
GRAPH OF DEPOSIT-ADVANCES OF SBI
169042
82360
196821
98102
242828
113590
270560
120806
296123
137758
0
5 00 00
1 00 000
1 50 000
2 00 000
2 50 000
3 00 000
RS
. IN
CR
OR
ES
1 99 8-99 1 99 9-00 2 00 0-01 2 00 1-02 2 00 2-03
YEAR
D E P OS IT - AD V AN C E S - S B I
D e p os its
Ad va n ce s
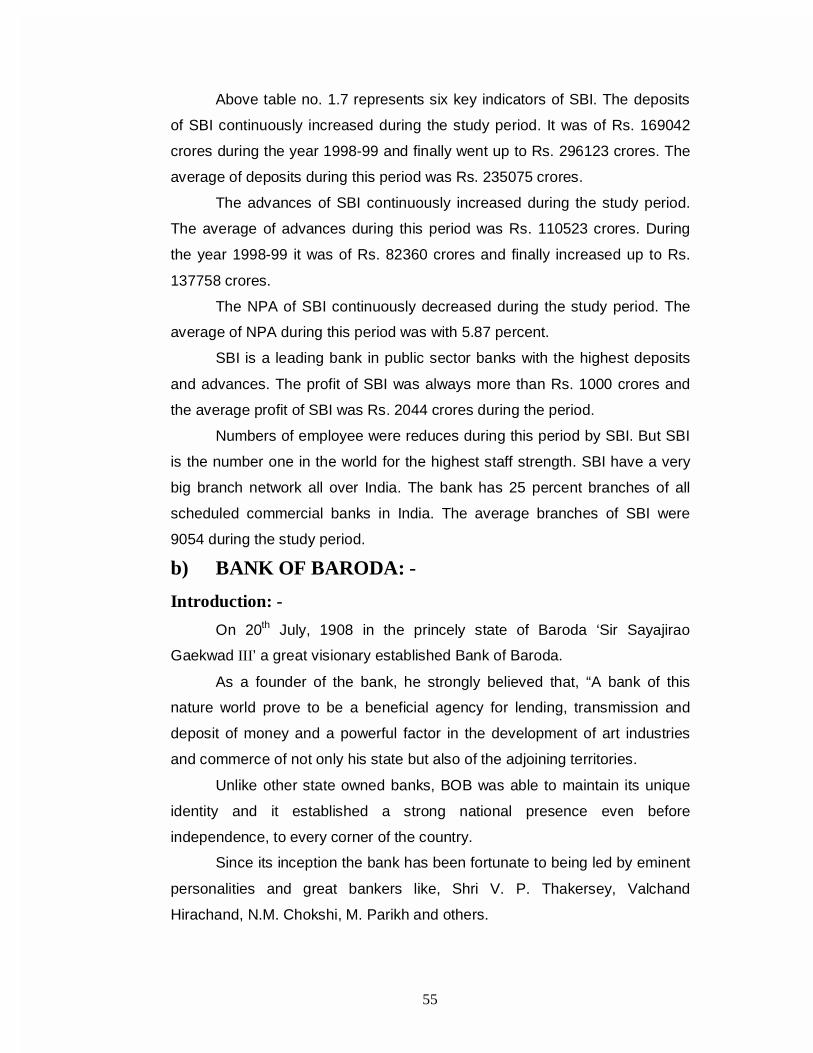
55
Above table no. 1.7 represents six key indicators of SBI. The deposits
of SBI continuously increased during the study period. It was of Rs. 169042
crores during the year 1998-99 and finally went up to Rs. 296123 crores. The
average of deposits during this period was Rs. 235075 crores.
The advances of SBI continuously increased during the study period.
The average of advances during this period was Rs. 110523 crores. During
the year 1998-99 it was of Rs. 82360 crores and finally increased up to Rs.
137758 crores.
The NPA of SBI continuously decreased during the study period. The
average of NPA during this period was with 5.87 percent.
SBI is a leading bank in public sector banks with the highest deposits
and advances. The profit of SBI was always more than Rs. 1000 crores and
the average profit of SBI was Rs. 2044 crores during the period.
Numbers of employee were reduces during this period by SBI. But SBI
is the number one in the world for the highest staff strength. SBI have a very
big branch network all over India. The bank has 25 percent branches of all
scheduled commercial banks in India. The average branches of SBI were
9054 during the study period.
b) BANK OF BARODA: -
Introduction: -
On 20th July, 1908 in the princely state of Baroda ‘Sir Sayajirao
Gaekwad III’ a great visionary established Bank of Baroda.
As a founder of the bank, he strongly believed that, “A bank of this
nature world prove to be a beneficial agency for lending, transmission and
deposit of money and a powerful factor in the development of art industries
and commerce of not only his state but also of the adjoining territories.
Unlike other state owned banks, BOB was able to maintain its unique
identity and it established a strong national presence even before
independence, to every corner of the country.
Since its inception the bank has been fortunate to being led by eminent
personalities and great bankers like, Shri V. P. Thakersey, Valchand
Hirachand, N.M. Chokshi, M. Parikh and others.

56
BOB has been crowned with being amongst the first few banks to have
ventured not only across the country but also overseas by opening a branch
at MOMBASSA in 1953.
Today, the bank enjoys a prominent presence all around and is serving
with 38 branches and 23 offices of its overseas subsidiaries have more than
footage in 16 countries overseas.
Key indicators of Bank of Baroda for 1998-99 to 2002-03 have been
presented in the following table no.1.8
Table No. 1.8 KEY INDICATORS OF BANK OF BARODA
[Source: IBA Bulletin March 2003, January 2004. ]
GRAPH NO.1.4
GRAPH OF DEPOSIT-ADVANCES OF BOB
44614
21092
51276
24393
54070
27421
61804
33663
66366
35348
0
10000
20000
30000
40000
50000
60000
70000
RS
. IN
CR
OR
ES
1998-99 1999-00 2000-01 2001-02 2002-03
YEAR
D E P OS IT - AD V AN C E S - B OB
Depos its
A dvances
Particular 1998-99 1999-00 2000-01 2001-02 2002-03 Average
Deposits [ Rs. in Crores]
44614 51276 54070 61804 66366 55626
Advances [ Rs. in Crores]
21092 24393 27421 33663 35348 28383
NPA [%] 7.70 6.95 6.77 5.06 3.72 6.04
Profit / Loss [ Rs. in Crores]
421 503 275 546 773 504
No. of Employee 46187 47054 46360 38899 40313 43763
No. of Branches 2573 2652 2669 2679 2753 2665

57
Above table no. 1.8 shows six key indictors of BOB. The deposits of
BOB continuously increased during the study period. The average deposits of
BOB were Rs. 55626 crores during this period. It was of Rs. Rs. 44614 crores
during the year 1998-99 and finally rose up to Rs. 66366 crores.
The advances of BOB continuously increased during the study period.
The percentage of increase in advances was more than the increase in
deposits during this period. It was of Rs. 21092 crores during the year 1998-
99 and finally went up to Rs. 35348 crores. The average of BOB was Rs.
28382 crores.
The NPA of BOB continuously decreased during this period. It was at
the highest level with 7.70 percent net NPA to net advances and finally
decreased up to 3.72 percent. The average NPA of BOB during this period
was 6.04 percent.
The profit of BOB shows mixed trend during the study period. The
average profit of BOB was Rs. 504 crores during this period.
The staff strength of BOB shows mixed trend during the study period.
The average of staff strength was 43763 employees.
The branch network of BOB continuously increased during the study
period. The average branch network of BOB was 2665 branches during this
period.
c) PUNJAB NATIONAL BANK:-
Introductions:-
The Punjab National Bank was established in 1895 at Lahor long
before independence i.e. during the era of an undivided India.It is the only
bank that has the distinction of being the first Indian Bank to have started
solely with Indian capital during the British rule.
To its rich heritage are added the far-sighted visionaries and patriots
like Lala Lajpatrai, Sardar Dyal Singh Majithia and Kali Prasanna Roy. They
were among the founder members of the bank.
The bank was nationalised in July 1969, along with 13 other banks.
And from its modest beginning today the bank has grown in size and structure
giving it the recognition of a front line banking institution in India at present.It

58
can boast of being a professionally managed bank with a successful track
record of over 109 years.
Along with 3879 branches and 402 extension counters that are spread
throughout the country, it has the largest branch network in India.
Important strategic business area covers the large Indo-Gangetic belt
and the metropolitan centers.
By bankers almanac (January – 2000) London, it has been ranked as
the 515th biggest bank in the world.
Having a strong correspondent banking relationship with more than
217 international banks of the world it enjoys patronage of more than 50
renowned international banks, who maintain their Rupee Accounts with PNB.
Its presence is noticeable at major centers all over the globe with well
equipped dealing rooms that can maintain and handled 20 different foreign
currency accounts.
Punjab National Bank gets some awards and achievement in last 6 to 7
years like
1) Best Bank award from RBI in – 2002
2) IBA Trophy as best bank for excellence on promotion of Kishan Credit
Card Scheme in – 2001.
3) MAYARAM SURJAN FOUNDATION – RAIPUR 200 “PNB STAFF
JOURNAL” bagged excellence journal of the year award during 3rd All
India Journal Competition 1999.
4) VIth All Indian Journal Competition – 2001.
5) Golden Peacock Award for excellence in corporate governance for the
year 2001 – 2002 ADJUDGED “RUNNERS UP”.
6) Govt. of India’s Indira Gandhi Rajbhasha shields Pratiyogita Award –
2001. Received second highest Rajbhasha Award in this competition.
7) National Awards for excellence in SSI Lending – 2002. Ranked second for
its contribution in leading to SSI sector for the year 2001 – 2002.
Punjab National Bank is working with its subsidiaries like
(1) PNB Capital Service Ltd.
(2) PNB Housing Financial Ltd.
(3) PNB Gilts Ltd.
(4) PNB Asset Management Company Ltd.

59
Key indicators of Punjab and National Bank for 1998-99 to 2002-03
have been mentioned in the following table no. 1.9
Table No.1.9 KEY INDICATORS OF PUNJAB NATIONAL BANK
[Source: IBA Bulletin March 2003, January 2004. ]
GRAPH NO.1.5
GRAPH OF DEPOSIT-ADVANCES OF PNB
40777
19047
47483
22572
56131
28043
64123
34369
75814
40228
0
10000
20000
30000
40000
50000
60000
70000
80000
RS
. IN
CR
OR
ES
1998-99 1999-00 2000-01 2001-02 2002-03
YEAR
D EPOSIT - AD V AN C ES - P N B
Depos its
A dvanc es
Above table no.1.9 represents six key indictors of PNB. The average of
deposits during this period was Rs. 56866 crores. The deposits of PNB
Particular 1998-99 1999-00 2000-01 2001-02 2002-03 Average
Deposits [ Rs. in Crores]
40777 47483 56131 64123 75814 56866
Advances [ Rs. in Crores]
19047 22572 28043 34369 40228 28852
NPA [%] 8.96 8.52 6.75 5.32 3.86 6.68
Profit / Loss [ Rs. in Crores]
372 408 464 562 842 530
No. of Employee 65705 64733 58309 57859 58981 61117
No. of Branches 3822 3853 3879 3857 4037 3890

60
continuously increased during the study period. It was of Rs. 40777 crores
during the year 1998-99 and finally grew up to Rs. 75814 crores.
The advances of PNB continuously increased during the study period.
It was of Rs. 19047 crores during the year 1998-99 and finally went up to Rs.
40228 crores. The average of advances during this period was Rs. 28852
crores.
The NPA of PNB continuously decreased during this period. It was of
8.96 percent net NPA to net advances during the year 1998-99 and finally
decreased up to 3.86 percent. The average of NPA during this period was
6.68 percent.
The profit of PNB continuously increased during the year 1998 to 2003.
The average profit of PNB was Rs. 530 crores during this period. It was of Rs.
372 crores during the year 1998-99 and finally grew up to Rs. 842 crores.
The staff strength of PNB continuously decreased except the year
2002-03. During the year 2002-03 PNB has opened 180 branches all over
country. During this year PNB recruited more than 1000 highly qualified
employees. The average branch network of PNB during the study period was
3890 branches.
d) PUNJAB & SIND BANK:-
Introduction:-
It was in the year 1908, when a humble idea to up lift the poorest of
poor of the land calumniated in the birth of Punjab & Sind Bank with the for-
sighted vision of luminaries like Sir Sunder Singh Majithia and Sardar
Tarlochan Singh. Together they enjoyed the highest respect with the people
of Punjab.
The bank was founded on the principle of social commitment to serve
and help the weaker sections of the society in their economic endeavors to
raise their standard of living.
Today, even after decades here gone by ‘Punjab & Sind Bank’ stands
committed to honour the social commitments of its founding fathers.
In the year 1908, in a small way, having an initial paid up capital of Rs.
1.66 lacs the bank made its beginning without any patronage from any
government agency / organistion.

61
The bank can boast of having survived the tremors of partition,
maintaining a good record of constant all round growth.
It has lived up to its cherished tradition of serving humanity and has to
its credit a vast network of branches / offices spread all over the corners of
this great country. The bank not only enjoys country wide presence but is also
immensely popular amongst people of all walks of life.
• The first branch of Punjab & Sind Bank opened in Hall Bazaar, Amritsar
near “GOLDEN TEMPLE”.
• Head office of Punjab & Sind Bank is working at 21- Rajendra Place,
“Bank House”, New Delhi.
• Punjab & Sind Bank has its own hockey academy at Jalandhar to groom
the youngster.
• “Where service is a way of life” is MISSION OF THE BANK.
Key indicators of Punjab and Sind Bank for 1998-99 to 2002-03 have
been shown in the following table no. 1.10
Table No.1.10
KEY INDICATORS OF PUNJAB & SIND BANK
[Source: IBA Bulletin March 2003, January 2004.]
Particular 1998-99 1999-00 2000-01 2001-02 2002-03 Average
Deposits [ Rs. in Crores]
9497 10556 11905 12483 13224 11533
Advances [ Rs. in Crores]
4100 4765 5181 5577 5892 5103
NPA [%] 10.48 9.39 12.27 11.70 10.89 10.95
Profit / Loss [ Rs. in Crores]
56 61 13 23 4 31.40
No. of Employee 12192 12128 10084 9916 9813 10827
No. of Branches 711 736 746 752 754 740
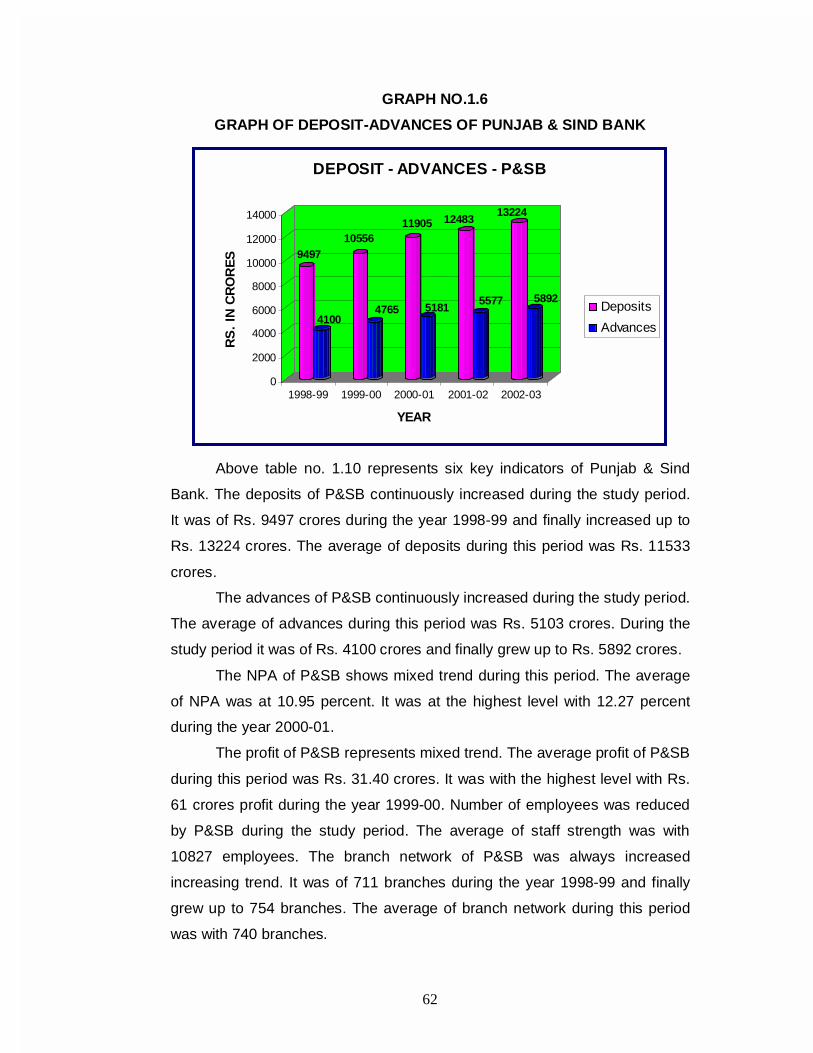
62
GRAPH NO.1.6
GRAPH OF DEPOSIT-ADVANCES OF PUNJAB & SIND BANK
9497
4100
10556
4765
11905
5181
12483
5577
13224
5892
0
2000
4000
6000
8000
10000
12000
14000R
S.
IN C
RO
RE
S
1998-99 1999-00 2000-01 2001-02 2002-03
YEAR
DEPOSIT - ADVANCES - P&SB
Deposits
Advances
Above table no. 1.10 represents six key indicators of Punjab & Sind
Bank. The deposits of P&SB continuously increased during the study period.
It was of Rs. 9497 crores during the year 1998-99 and finally increased up to
Rs. 13224 crores. The average of deposits during this period was Rs. 11533
crores.
The advances of P&SB continuously increased during the study period.
The average of advances during this period was Rs. 5103 crores. During the
study period it was of Rs. 4100 crores and finally grew up to Rs. 5892 crores.
The NPA of P&SB shows mixed trend during this period. The average
of NPA was at 10.95 percent. It was at the highest level with 12.27 percent
during the year 2000-01.
The profit of P&SB represents mixed trend. The average profit of P&SB
during this period was Rs. 31.40 crores. It was with the highest level with Rs.
61 crores profit during the year 1999-00. Number of employees was reduced
by P&SB during the study period. The average of staff strength was with
10827 employees. The branch network of P&SB was always increased
increasing trend. It was of 711 branches during the year 1998-99 and finally
grew up to 754 branches. The average of branch network during this period
was with 740 branches.

63
e) UNION BANK OF INDIA:-
Introduction:-
As a Ltd. company the Union Bank of India was incorporated on 11th
November – 1919 having its registered office at 7, Marzbon Road, Bombay. It
shifted to its own premises at Appollo Street, fort, Mumbai – 400 001 in the
year 1921.
Inaugurated by Mahatma Gandhi, today the bank occupies an enviable
position amongst rest of the Nationalised Bank. It was nationalised by the
government in the first group of 14 banks, in June, 1969 which portrays the
strength and importance enjoyed by the bank since then.
The vision statement of its management aim: “To become the Bank of
First choice in chosen areas and building beneficial and lasting relationships
with customers through a process of continuous improvement. The bank took
a step ahead to meet particular and special requirements of certain section of
economy / client banks and has been credited to having opened specialised
branches in an earnest endeavor to cater to each segment. Besides providing
the traditional products, the branched network has been thoroughly exploited
to improve its fee based earnings.
To improve future growth the bank has made planned efforts and is
making foray into insurance business, DMAT facilities and cash management
product.
As on 31/03/2002 Bank has.
26 Small Scale Industrial Branches
9 Industrial Finance Branches
8 Overseas Branches
6 Personal Banking Branches
4 NRI Branches
4 Specialised Savings Branches
5 Specialised Trading Branches
Key indicators of Union Bank of India for 1998-99 to 2002-03 have
been shown in the following table no. 1.11.

64
Table No. 1.11 KEY INDICATORS OF UNION BANK OF INDIA
[Source: IBA Bulletin March 2003, January 2004. ]
GRAPH NO.1.7
GRAPH OF DEPOSIT-ADVANCES OF UNION BANK OF INDIA
28136
10918
31105
15007
34888
17505
39794
21383
44749
25515
0
500 0
100 00
150 00
200 00
250 00
300 00
350 00
400 00
450 00
RS
. IN
CR
OR
ES
199 8-99 199 9-00 200 0-01 200 1-02 200 2-03
YEAR
D E P OS IT - AD V AN C E S - U B I
Depos its
A dvanc es
Above table no.1.11 represents six key indicators of UBI. The average
of deposits during this period was Rs. 35734 crores. The deposits of UBI
continuously increased during this period. It was of Rs. 28136 crores during
the year 1998-99 and finally went up to Rs. 44749 crores.
Particular 1998-99 1999-00 2000-01 2001-02 2002-03 Average
Deposits [ Rs. in Crores]
28136 31105 34888 39794 44749 35734
Advances [ Rs. in Crores]
10918 15007 17505 21383 25515 18066
NPA [%] 8.70 7.97 6.87 6.26 4.91 6.94
Profit / Loss [ Rs. in Crores]
160 101 155 314 553 257
No. of Employee 30834 30376 28044 25822 25706 28156
No. of Branches 2119 2136 2053 2023 2020 2070

65
The advances of UBI continuously increased during this period. The
percentage of increase in advances was more than the increase in deposits
during this period. The average of advances during this period was Rs. 18066
crores. It was of Rs. 10918 crores during the year 1998-99 and finally grew up
to Rs. 25515 crores.
The NPA of UBI continuously decreased during this period. It was with
the highest level at 8.70 percent net NPA to net advances during the year
1998-99 and finally decreased up to 4.91 percent. The average of NPA was
6.94 percent.
The average profit of UBI was Rs. 257 crores during this period. The
profit of UBI shows mixed trend. It was at the lowest level with Rs. 101 crores
during the year 1999-00 and finally rose up to Rs. 553 crores. The number of
employees of UBI continuously decreased during the study period. The
average staff strength of UBI was 28156 employees during this period. It was
of 30834 employees during the year 1998-99 and finally decreased up to
25706 employees. The average branch network of UBI was 2070 branches.
1.3.2 New Private Sector Bank:-
a) ICICI BANK LTD.:-
Introduction:-
ICICI Bank is India’s second largest bank with total assets of about
Rs.1,00,000 crores and a network of about 540 branches and offices with
over 1000 ATMs. The bank was originally promoted in 1994 by ICICI Ltd., an
Indian financial institution and it was its wholly-owned subsidiary. It offers a
wide range of banking products and financial services to the corporate
channel through its specialised subsidiaries and affiliates. Areas of services
covered under its umbrella are investment banking, life and non-life
insurance, venture capital, assets management and information technology.
Equity of the bank are listed in India on major stock exchanges of India
at Chennai, Delhi, Kolkata, Vadodara, along with National Stock Exchange of
India the Mumbai Stock Exchange. Further, its American Depositary Receipts
[ADRs] are listed on the New York Stock Exchange [NYSE]. As a part of its

66
restructuring, ICICI’s share holding in ICICI Bank was reduced to 46 percent
through a public offering of shares in India during the fiscal year 1998. An
equity offering was made in the form of ADRs listed on the NYSE in fiscal
2000. It further made an acquisition of Bank of Madhura Ltd. in all stock
amalgamation in fiscal 2001 and then it went into secondary market sales to
institutional investors during the fiscal year 2001 and 2002.
The ICICI was originally formed in 1955 at the initiative of the World
Bank, the government of India and representatives of the Indian industry.
Its principal objective was to create a developmental financial institution for
providing medium term and long term projects for financing to Indian
businessman.
In 1999, ICICI Bank became the first Indian company and the first
financial institution bank from non-Japan Asia to be listed on NYSE. In
October – 2001, the Board of Directors of ICICI and ICICI Bank approved the
merger of ICICI and two of its wholly-owned retail finance subsidiaries namely
ICICI personal financial services Ltd. and ICICI capital services Ltd. with the
ICICI Bank.
List of ICICI’s subsidiary Company:
(1) ICICI Securities and finance company Ltd..
(2) ICICI Brokerage Services Ltd..
(3) ICICI Venture funds management company Ltd.
(4) ICICI International Ltd. Mauritius
(5) ICICI Home Finance Company Ltd..
(6) ICICI Trustee ship Services Ltd..
(7) ICICI Investment Management Company Ltd..
(8) ICICI Prudential Life Insurance Company Ltd..
(9) ICICI Lombard General Insurance Company Ltd..
(10) ICICI Securities Holding Inc.
(11) ICICI Securities Inc.
Key indicators of ICICI Bank for 1998-99 to 2002-03 have been shown
in the following table no. 1.12
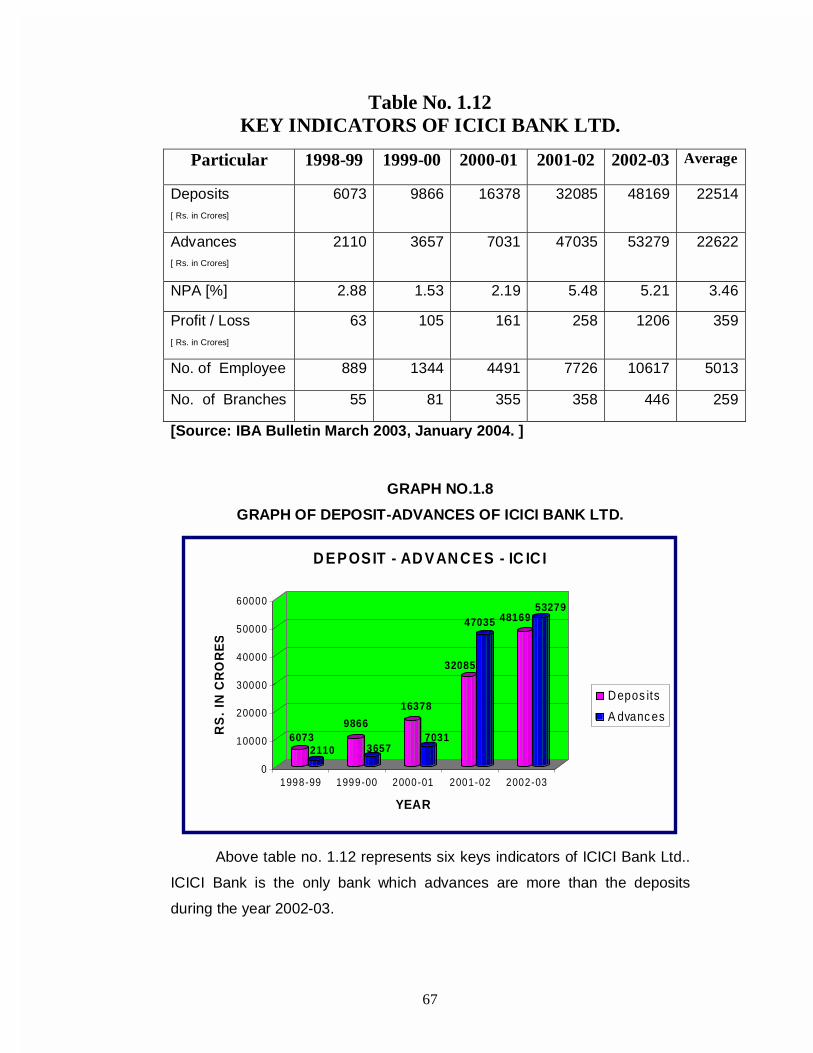
67
Table No. 1.12 KEY INDICATORS OF ICICI BANK LTD.
[Source: IBA Bulletin March 2003, January 2004. ]
GRAPH NO.1.8
GRAPH OF DEPOSIT-ADVANCES OF ICICI BANK LTD.
60732110
9866
3657
16378
7031
32085
47035 4816953279
0
10000
20000
30000
40000
50000
60000
RS
. IN
CR
OR
ES
1998-99 1999-00 2000-01 2001-02 2002-03
YEAR
D EPOSIT - AD VAN C ES - IC IC I
Depos its
A dvanc es
Above table no. 1.12 represents six keys indicators of ICICI Bank Ltd..
ICICI Bank is the only bank which advances are more than the deposits
during the year 2002-03.
Particular 1998-99 1999-00 2000-01 2001-02 2002-03 Average
Deposits [ Rs. in Crores]
6073 9866 16378 32085 48169 22514
Advances [ Rs. in Crores]
2110 3657 7031 47035 53279 22622
NPA [%] 2.88 1.53 2.19 5.48 5.21 3.46
Profit / Loss [ Rs. in Crores]
63 105 161 258 1206 359
No. of Employee 889 1344 4491 7726 10617 5013
No. of Branches 55 81 355 358 446 259

68
The deposits of ICICI Bank continuously increased during the study
period. It was of Rs. 6073 crores during the year 1998-99 and finally went up
to Rs. 48169 crores. The average of deposits during this period was Rs.
22514 crores.
The advances of ICICI Bank continuously increased during this period.
The average advances of ICICI Bank were Rs. 22622 crores during this
period. It was of Rs. 2110 crores during the year 1998-99 and finally grew up
to Rs. 53279 crores.
The NPA of ICICI Bank was with mixed trend during this period. The
average of NPA during the study period was 3.46 percent net NPA to net
advances.
The profit of ICICI Bank continuously increased during this period. The
average of profit was Rs. 359 crores. It was of Rs. 63 crores during the year
1998-99 and finally increased up to Rs. 1206 crores.
The staff strength and branch net work of ICICI Bank continuously
increased during the study period. The average of staff during this period was
5013 employees and the average of branches was 259.
b) HDFC BANK LTD.:-
Introduction:-
The Housing Development finance corporation Ltd. (HDFC) was
amongst the first to receive an in principal approved from the Reserve Bank of
India (RBI)) to set up a bank in the Private Sector as part of the RBI’s
liberalisation of the Indian Banking in Industry.
The bank was incorporated in August 1994 and named as HDFC Bank
Ltd.. It had its registered office in Mumbai. The HDFC Bank commenced
its operations as a scheduled commercial bank in January 1995.HDFC is
India’s premier housing finance company and enjoys an impeccable record
both in India as well as in the international markets.
Since its inception in 1977, the corporation has maintained a consistent
and healthy growth in its financial operations that has helped it to remain a
clear market leader in mortgages in India.
Its outstanding loan portfolio covers over a million dwelling units. At
present HDFC has developed significant expertise in retail mortgage loans to
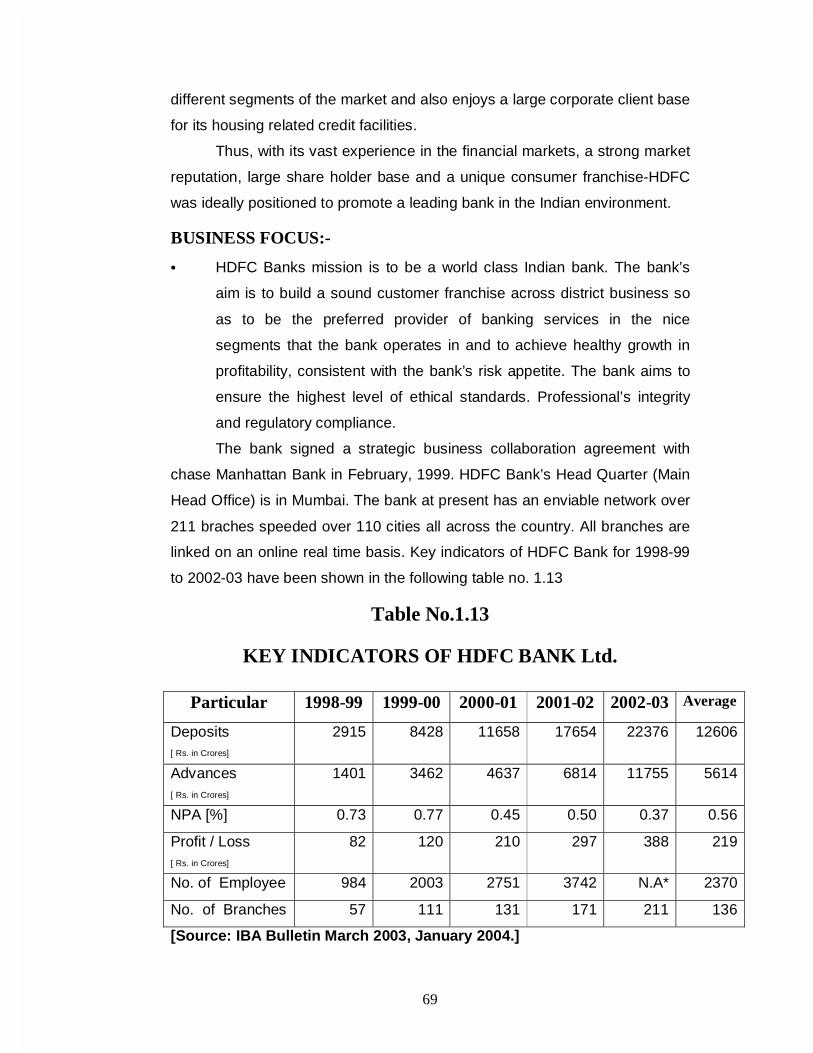
69
different segments of the market and also enjoys a large corporate client base
for its housing related credit facilities.
Thus, with its vast experience in the financial markets, a strong market
reputation, large share holder base and a unique consumer franchise-HDFC
was ideally positioned to promote a leading bank in the Indian environment.
BUSINESS FOCUS:-
• HDFC Banks mission is to be a world class Indian bank. The bank’s
aim is to build a sound customer franchise across district business so
as to be the preferred provider of banking services in the nice
segments that the bank operates in and to achieve healthy growth in
profitability, consistent with the bank’s risk appetite. The bank aims to
ensure the highest level of ethical standards. Professional’s integrity
and regulatory compliance.
The bank signed a strategic business collaboration agreement with
chase Manhattan Bank in February, 1999. HDFC Bank’s Head Quarter (Main
Head Office) is in Mumbai. The bank at present has an enviable network over
211 braches speeded over 110 cities all across the country. All branches are
linked on an online real time basis. Key indicators of HDFC Bank for 1998-99
to 2002-03 have been shown in the following table no. 1.13
Table No.1.13
KEY INDICATORS OF HDFC BANK Ltd.
[Source: IBA Bulletin March 2003, January 2004.]
Particular 1998-99 1999-00 2000-01 2001-02 2002-03 Average
Deposits [ Rs. in Crores]
2915 8428 11658 17654 22376 12606
Advances [ Rs. in Crores]
1401 3462 4637 6814 11755 5614
NPA [%] 0.73 0.77 0.45 0.50 0.37 0.56
Profit / Loss [ Rs. in Crores]
82 120 210 297 388 219
No. of Employee 984 2003 2751 3742 N.A* 2370
No. of Branches 57 111 131 171 211 136
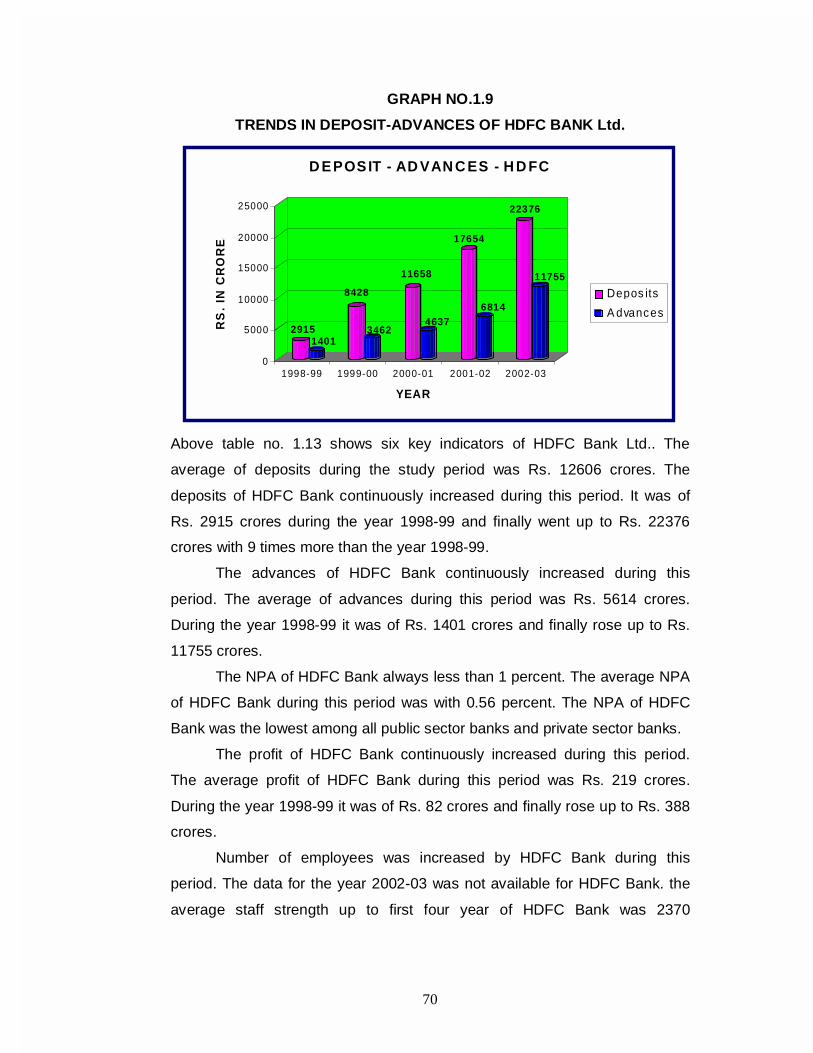
70
GRAPH NO.1.9
TRENDS IN DEPOSIT-ADVANCES OF HDFC BANK Ltd.
29151401
8428
3462
11658
4637
17654
6814
22376
11755
0
5000
10000
15000
20000
25000R
S.
IN C
RO
RE
S
1998-99 1999-00 2000-01 2001-02 2002-03
YEAR
D EPOSIT - AD VAN C ES - H D FC
Depos its
A dvances
Above table no. 1.13 shows six key indicators of HDFC Bank Ltd.. The
average of deposits during the study period was Rs. 12606 crores. The
deposits of HDFC Bank continuously increased during this period. It was of
Rs. 2915 crores during the year 1998-99 and finally went up to Rs. 22376
crores with 9 times more than the year 1998-99.
The advances of HDFC Bank continuously increased during this
period. The average of advances during this period was Rs. 5614 crores.
During the year 1998-99 it was of Rs. 1401 crores and finally rose up to Rs.
11755 crores.
The NPA of HDFC Bank always less than 1 percent. The average NPA
of HDFC Bank during this period was with 0.56 percent. The NPA of HDFC
Bank was the lowest among all public sector banks and private sector banks.
The profit of HDFC Bank continuously increased during this period.
The average profit of HDFC Bank during this period was Rs. 219 crores.
During the year 1998-99 it was of Rs. 82 crores and finally rose up to Rs. 388
crores.
Number of employees was increased by HDFC Bank during this
period. The data for the year 2002-03 was not available for HDFC Bank. the
average staff strength up to first four year of HDFC Bank was 2370
71
employees. The branch network of HDFC Bank continuously increased during
this period.
c) UTI BANK LTD.:-
Introduction:-
UTI Bank was the first of the new private banks to have begun
operation in April 1994 after the government of India allowed new private
banks to be established.
The bank was promoted jointly by the administrator of the specified
undertaking of the Unit Trust of India (UTI-I), Life Insurance Corporation of
India (LIC) and General Insurance Corporation Ltd. and its associates, Viz
Oriental Insurance Corporation and United Insurance Company Ltd.
Registered office of the bank is at Ahmedabad and its central office is located
at Mumbai. It services its customers through a very wide network of more than
200 branch offices and extension counters. Added to its service cadre are
over 1150 ATM’s network that provide 24 hrs a day banking convenience and
pleasure to its customers. The bank has strengths in both retail and corporate
banking and is committed to adopting the best industry practices available
internationally in order to achieve excellence.
In February – 2003 UTI Bank was the first to introduce at par Cheque
facility for all saving bank customers, a stay toward providing facility and
convenience to its customers leading to an ever increase in its customer
base. In September – 1998 UTI Bank went public with and issue of Rs. 71
crores. The issue was over subscribed 1.2 times and participation of over 1
Lakh retail investors. The UTI holding as a result was reduced to 60.85
percent.
Mission of UTI Bank:
The mainstay is customer service and product innovation tuned to
diverse needs of individual and corporate clientele. Adaptation of continuous
technology upgradation with maintaining human values.
The bank’s eyes are sent on progressive globalization and achieving
the same through international standards. It promotes and follows a policy of
efficiency and effectiveness built on ethical practices. UTI Bank went aboard
and introduced VIAS ELECTRON International Debit Card in June – 2002.

72
Dr. P.J. Nayak is the Chairman and Managing Director of the Bank.
Key indicators of UTI Bank for 1998-99 to 2002-03 have been shown in the
following table no. 1.14
Table No.1.14 KEY INDICATORS OF UTI BANK Ltd.
[Source: IBA Bulletin March 2003, January 2004. ]
GRAPH NO.1.10
GRAPH OF DEPOSIT-ADVANCES OF UTI BANK LTD.
30412170
5720
3507
9092
4821
12287
5352
22376
7180
0
2000
4000
6000
8000
10000
12000
14000
16000
18000
RS
. IN
CR
OR
E
1998-99 1999-00 2000-01 2001-02 2002-03
Y EAR
D EPOSIT - AD VAN C ES - U TI
D e p o sits
A d va n ce s
Particular 1998-99 1999-00 2000-01 2001-02 2002-03 Average
Deposits [ Rs. in Crores]
3041 5720 9092 12287 16965 9421
Advances [ Rs. in Crores]
2170 3507 4821 5352 7180 4606
NPA [%] 6.32 4.71 3.43 2.74 2.39 3.92
Profit / Loss [ Rs. in Crores]
31 51 86 134 192 99
No. of Employee 521 729 1185 1721 2338 1299
No. of Branches 35 49 86 111 140 84

73
Above table no.1.14 represents six key indicators of UTI Bank. The
deposits of UTI Bank continuously increased during this period. It was of Rs.
3041 crores during the year 1998-99 and finally went up to Rs. 16965 crores.
The average of deposits during this period was Rs. 9421 crores.
The advances of UTI Bank continuously increased during the study
period. The average of advances during this period was Rs. 4606 crores.
During the year 1998-99 it was of Rs. 2170 crores and finally grew up to Rs.
7180 crores.
The NPA of UTI Bank continuously decreased during the study period.
The average NPA of UTI Bank during this period was at 3.92 percent net NPA
to net advances. It was of 6.32 percent during the year 1998-99 and finally
decreased up to 2.39 percent.
The profit of UTI Bank continuously increased during the study period.
It was of Rs. 31 crores during the year 1998-99 and finally rose up to Rs. 192
crores. The profit of UTI Bank increased with 6 times more during this period.
The staff strength and branch network of UTI Bank continuously
increased during the study period. The average number of employees of UTI
Bank was 1299 and the average branches of UTI Bank were 84.
d) GLOBAL TRUST BANK LTD.:-
Introduction:-
The year 1993 – 94, for the first time in the history of Indian banking
industry, the government with Reserve Bank of India allowed entry of new
players in private sector banking to form and play a vital role in the
development of banking industry. This paved the way for greater competition
and elevation in the levels of banking service and efficiency. The process of
liberalization and deregulation set the tone for the creation of New Private
sector banks in India. Amidst the wave of optimism that swept across the
country, Global Trust Bank was born out of this context and initiative.
The day October 30, 1994 saw the inception of global Trust Bank with
a vision of creating a modern and a model institution since then, Bank has
been creating milestones in the Indian Banking Industry. Promoted by a
generation of very successful professionals and led by padmashree Shree
Ramesh GELLI, Global Trust Bank made impressive international alliances

74
that gave the bank its unique Strengths. It was the first Indian bank to attract
participation from two global multilateral institutions and lending investment
banks. The international finance corporate (IFC), Washington DC. The Private
Sector arm of the world Bank. Contributes to the Strategic direction.
International Vision and expertise in Infrastructure Project evaluation. The
MOU with Daiwa Securities Group is to under take joint research and training
on Indian economy and Industry. It is yet another initiative to be in tune with
the future.
Mr. Sudhakar Gande Said, “The Bank will kick off the move through
housing, car and personal Loans. These Products will be launched very soon.
We are looking for an asset size of about Rs. 200 crore in this segment in the
current year.’’ He said that the product range to retail customers would be
further expanded since it is traditionally a high - yield segment.
Gande Said that it was decided to focus on non fund exposure with a
business target of Rs. 2000 crore of the year, as compared to Rs. 1300 crore
in the previous year. We will restore credibility. We shall fortify investor
confidence.
Key indicators of GTB for 1998-99 to 2002-03 have been shown in the
following table no. 1.15
Table No.1.15 KEY INDICATORS OF GLOBAL TRUST BANK
[Source: IBA Bulletin March 2003, January 2004. ]
Particular 1998-99 1999-00 2000-01 2001-02 2002-03 Average
Deposits [ Rs. in Crores]
4097 6199 7734 6443 6321 6279
Advances [ Rs. in Crores]
2118 3219 4100 3033 3276 3149
NPA [%] 2.15 0.87 3.75 9.23 19.77 7.15
Profit / Loss [ Rs. in Crores]
71 109 80 40 (-) 273 75
No. of Employee 748 939 1173 1147 1314 1064
No. of Branches 63 63 66 84 87 73
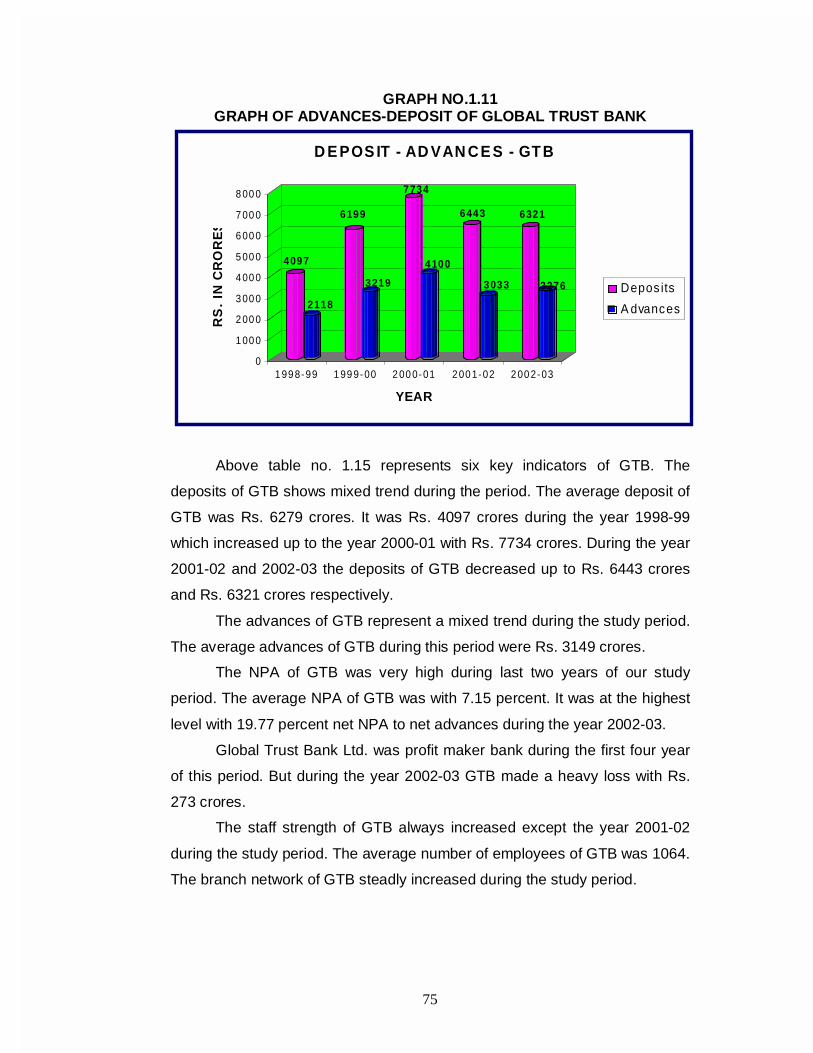
75
GRAPH NO.1.11 GRAPH OF ADVANCES-DEPOSIT OF GLOBAL TRUST BANK
4097
2118
6199
3219
7734
4100
6443
3033
6321
3276
0
1 00 0
2 00 0
3 00 0
4 00 0
5 00 0
6 00 0
7 00 0
8 00 0
RS
. IN
CR
OR
ES
1 99 8-99 1 99 9-00 2 00 0-01 2 00 1-02 2 00 2-03
YEAR
D E POS IT - AD VAN CE S - GTB
Depos its
A dvances
Above table no. 1.15 represents six key indicators of GTB. The
deposits of GTB shows mixed trend during the period. The average deposit of
GTB was Rs. 6279 crores. It was Rs. 4097 crores during the year 1998-99
which increased up to the year 2000-01 with Rs. 7734 crores. During the year
2001-02 and 2002-03 the deposits of GTB decreased up to Rs. 6443 crores
and Rs. 6321 crores respectively.
The advances of GTB represent a mixed trend during the study period.
The average advances of GTB during this period were Rs. 3149 crores.
The NPA of GTB was very high during last two years of our study
period. The average NPA of GTB was with 7.15 percent. It was at the highest
level with 19.77 percent net NPA to net advances during the year 2002-03.
Global Trust Bank Ltd. was profit maker bank during the first four year
of this period. But during the year 2002-03 GTB made a heavy loss with Rs.
273 crores.
The staff strength of GTB always increased except the year 2001-02
during the study period. The average number of employees of GTB was 1064.
The branch network of GTB steadly increased during the study period.

76
e) BANK OF PUNJAB LTD.:-
Introduction:-
Dr. Inderjit Singh was a founder of the Bank of Punjab Ltd.. Late Dr. Inderjit
Singh was born in Musakel [Now in Pakistan] on 22nd November, 1911. He
started his banking carrier in 1932 with Central Bank of India and became
Chief Executive of Punjab & Sind Bank in January – 1960. He remained and
served the bank for 22 years of his career till his retirement in 1982.
After liberalization of the banking sector, Dr. Indrejit Singh was granted
permission to start bank in the private sector by RBI. He later laid the
foundation of and established The Bank of Punjab Limited, which started
functioning and its operations in April – 1995. The bank was nurtured and
developed by him till his death in October – 1998.
The bank has established itself in the Indian banking on strong
foundation in a short span. The Bank of Punjab opened its first branch at
Chandigarh in April – 1995. It has arranged a wide area network of branches
across the country along with a significant ATM Network. The Bank has
e-bank correspondent banking relationship across 60 countries
Key indicators of Bank of Punjab Ltd. for 1998-99 to 2002-03 have
been shown in the following table no. 1.16
Table No.1.16 KEY INDICATORS OF BANK OF PUNJAB Ltd.
[Source: IBA Bulletin March 2003, January 2004. ]
Particular 1998-99 1999-00 2000-01 2001-02 2002-03 Average
Deposits [ Rs. in Crores]
1766 2608 3055 3354 3590 2875
Advances [ Rs. in Crores]
842 1301 1506 1611 1797 1411
NPA [%] 3.66 2.32 2.31 2.93 7.17 3.68
Profit / Loss [ Rs. in Crores]
32 33 35 36 32 34
No. of Employee 528 549 705 955 1158 779
No. of Branches 50 55 64 92 107 74

77
GRAPH NO.1.12
GRAPH OF DEPOSIT-ADVANCES OF BANK OF PUNJAB Ltd.
1766
842
2608
1301
3055
1506
3354
1611
3590
1797
0
5 00
1 000
1 500
2 000
2 500
3 000
3 500
4 000R
S.
IN C
RO
RE
S
1 998-99 1 999-00 2 000-01 2 001-02 2 002-03
YEAR
D E P OS IT - AD V AN C E S - B OP
Depos its
A dvanc es
Above table no. 1.16 shows six key indicators of Bank of Punjab Ltd..
The average of deposits during this period was Rs. 2875 crores. The deposits
of Bank of Punjab Ltd. continuously increased during the study period. It was
of Rs. 1766 crores during the year 1998-99 and finally rose up to Rs. 3590
crores.
The advances of Bank of Punjab Ltd. continuously increased during
this period. The average of advances during this period was Rs. 1411 crores
the credit deposit ratio of Bank of Punjab Ltd. was always more than 45
percent which shows good sign for profitability. During the year 1998-99 the
advances of Bank of Punjab Ltd. was Rs. 842 crores and finally went up to
Rs. 1797 crores. The NPA of Bank of Punjab Ltd. represents mixed trend
during the study period. It was at the highest level with 7.17 percent during the
year 2002-03. The average NPA of Bank of Punjab Ltd. during this period was
3.68 percent.
The profit of Bank of Punjab Ltd. continuously increased up to the year
2001-02 and decreased during the year 2002-03. The average profit of Bank
of Punjab Ltd. was Rs. 34 crores.
The staff strength of Bank of Punjab Ltd. continuously increased during
this period. The average number of employees of Bank of Punjab Ltd. was
779 during this period.

78
The branch network of Bank of Punjab Ltd. continuously increased
during the study period. It was at 50 branches during the year 1998-99 and
finally grew up to 107 branches which were more than double during the study
period.
79
References:
1) IBA Bulletin Special Issue – March 2003.
2) Dr. T. K. Velayudham. “Development in Indian Banking” Article in
Platinum Jubilee Special – Bank Quest Dec. 2002.
3) Gujarat Samachar – Daily New Paper – 25/11/2002.
4) Gujarat Samachar – Daily New Paper – 30/12/2002.
5) “Tanna’s Banking Law and Practice in India” India Law House –
Cannaught Palace – New Delhi.
6) IBA Bulletin – January 2004.

80
CHAPTER NO. 2
RESEARCH METHODOLOGY
2.1 Introduction
2.2 The Title of the Problem
2.3 Period of Study
2.4 Selection of Unit
2.5 Sources of Data
2.6 Objectives of Study
2.7 Tools & Techniques Used
2.7.1 Accounting Techniques
2.7.2 Statistical Tools & Techniques
2.8 Survey of Existing Literature
2.9 Significance of Study
2.10 Out Line of Chapter Plan
2.11 Hypothesis Testing
2.12 Limitations of Study
2.13 References

81
CHAPTER – 2
2.1 INTRODUCTION:-
Economic growth depends on the mobilisation of resources, men and
material and their utilisation in a planned manner.
Financial institutions provide maximum financial convenience to the
public. Financial institutions promote overall saving of the economy by
deepening and widening the financial structure. They also distribute the
available savings in a more efficient manner. They also create credit and
deposit money, production and distribution in furtherance of the economy.
Banks are essential instruments of accelerated growth in a developing
economy. In fact banks are nerve centers of the economy. The primary task of
banking institutions is to mobilize the diffused and thinly scattered savings of a
poor and populous community and to direct them into productive investment.
The existing saving potential of under developed nations has to be
transformed into saving that can be accessible and beneficial to the
community. New saving habits have to be developed, from economic point of
view the major task of banks and other financial institutions is to act, as
intermediaries channeling savings to investments and consumption and
through them the investment requirements of savers are reconciled with the
credit needs of investors by banks.
Financial intermediation by banks plays a catalytic role in promoting
economic development by spreading banking and saving habits and by
helping to fund productive, employment and income. As a general rule, the
banking should respond to the demands of a dynamic economy both through
structural and financial adaptation taking into account the special conditions of
each country.
Bank as a development agency are the source of hope and aspirations
of the masses. Then banks help the agricultural sector in a number of ways.
They provide directly to agriculturists for marketing their produce, for
modernisation and mechanisation of forms, for developing land etc.
Banks also play an important role in development of the industrial
sector by providing short term and long term loans to industries. Banks grant
82
loans to small-scale industrial units for expansion, modernisation and
renovation and also provide them with working capital finance.
The experience of Indian banking system since nationalisation has
brought to the fore front the immense potential of banking as a level of socio-
economic development. Since banking development and economic
development are closely associated with each other, it would be pertinent to
have a comprehensive study of the activities of the public sector banks and
private sector banks in the field of socio-economic development in India. It is
necessary to examine the extent to which the banks have moved towards
their social goal. The present study is an attempts to study the functional and
operational efficiency and profitability and productivity measurement for
selected unit of public sector banks and private sector banks for particular
period. The purpose of this study is, thus to make an in-depth study of what
the public sector banks and private sector banks in India have done during the
period of last five year.
2.2 THE TITLE OF THE PROBLEM: -
The Title of the problem selected for this study is “CRITICAL
EVALUATION OF INDIAN BANKING SECTOR (WITH REFERENCE TO
PUBLIC SECTOR BANKS AND PRIVATE SECTOR BANKS)” {1998-99 TO
2002-03}
2.3 PERIOD OF STUDY:-
Present study has been made covering the period of last 5 years i.e.
1998-99 to 2002-2003.
As the process of nationalisation of commercial banks plus welcome to
new private sector banks was competed in the year 1998, subsequent period
of 5 years from 1998-99 to 2002-2003 has been selected for the study, this
period covers the reform process, banking reforms, major components of
reforms like modifying the policy framework, improving the financial
soundness of banks strengthening the institutional framework, new challenges
and corporate governance.
Thus, the selection period provides a base for study.
83
2.4 SELECTION OF UNIT:-
Banking Industry of India consists of the following segments.
(1) Scheduled Commercial Banks in Public Sector
1. First 14 Nationalised Banks
2. Second 6 Nationalised Banks
3. SBI and its Subsidiaries.
(Total 20 Nationalised Bank but now only 19 Banks are there)
(2) Scheduled Commercial Banks in Private Sector
1. 21 Old Private Banks (before 1994)
2. 9 New Private Banks (1994 and after wards)
(3) Foreign Bank : 36 Foreign Banks are working As on 31/3/2003
During the period from 1980 to 1994 which was the period of pure
nationalisation, there had been great pressure on banks profitability. It was
due to branch expansion and emphasis on mass banking also. Priority sector
lending which in turn was fully controlled by purely political consideration. On
and after 1994 Reserve Bank of India had been given permission for new
private sector bank in Indian banking. There are nine new private sector
banks in India. Bank plays an important role in understanding the
development effort and works as a channel for social economic transformation
as well as catalyst to economic growth. With the help of random sampling
method the selection has been made from public & private sector banks. The
selected units are as under:
[A] Five banks from public sector banks are as under
(i) State Bank of India
(ii) Bank of Baroda
(iii) Punjab National Bank
(iv) Punjab & Sind Bank
(v) Union Bank of India
[B] Five banks from private sector banks are as under
(i) ICICI Bank Ltd.
(ii) Bank of Punjab Ltd.
(iii) Global Trust Bank Ltd.
(iv) HDFC Bank Ltd.
(v) UTI Bank Ltd.

84
2.5 SOURCES OF DATA:-
The study is mainly based on secondary data obtained from the annual
report of various banks. To supplement the data IBA Bulletin, RBI publication,
different publications, Bank Quest, various books, periodicals, journals and
relating banking industry etc have also been used for better reliability.
Moreover to get insight view of banking industry personal unstructured
interviews of employee of selected banks has been taken.
Opinions expressed in Business Standard, News Papers, accounting
literature, Annual review and different publications have also been used in this
study.
2.6 OBJECTIVES OF STUDY:-
Following are the main objectives of the present study:-
(1) To find out the trend of financial performance of public sector banks
and private sector banks under study.
(2) To examine the financial performance of public sector banks and
private sector banks under study.
(3) To examine the overall productivity and profitability of public sector
banks and private sector banks.
(4) To find out employees productivity and branch productivity in selected
units.
(5) To study the accomplishment of social responsibility & obligations by
public sector banks and private sector banks.
2.7 TOOLS AND TECHNIQUES USED:-
The following two types of Tools and Techniques of Analysis have
been used:
(A) Accounting Techniques
(B) Statistical Techniques
2.7.1. Accounting Techniques:-
The researcher pick up the technique to suit their requirement and also
on the basis of data available to them. The accounting techniques which are
used for the analysis of financial statements of various banks data are as
follows.

85
(1) Ratio Analysis
(2) Common Size Statement Analysis
2.7.2 Statistical Techniques:-
Use of statistical techniques has become a normal phenomenon in any
type of analysis. Statistical analysis or tools which are used for financial
analysis, Index Numbers, Regression Analysis, Diagrammatic and graphic
presentation of data has been made wherever necessary of the present study.
The researcher picks up the techniques of Kruskal Wallis One Way Analysis
of Variance Test and F-test (ANOVA) for testing hypothesis relating to various
variables of productivity, profitability and financial efficiency of various banks
under study.
2.8 SURVEY OF EXISTING LITERATURE:-
Some studies relating to financial analysis of Indian banking sector
conducted in the past are being reviewed below.
• L.G. Kulkarni 1 in his paper compared developmental responsibility and
profitability of banks. He reviewed that one of the important reason for
the decline in profitability of banks in the developmental responsibility
undertaken by them. He suggested that carrying of developmental
business could be possible as well as profitable only by reducing costs,
improving systems and improving productivity.
• S.G. SHAH 2 in his paper analysed weakness of the banks and pointed
out the specific areas where action could be taken to improve
profitability. He revealed that rising expense and overheads increase in
wasteful work practices, declines in productivity were major weakness.
He suggested these following areas for improving profitability of bank
(i) To evolve measures that could widen the spread between the cost
of funds, services, and administration and the return on them. (ii) To
developed supplementary sources of income. (iii) To find profit centers
and cost centers in the bank (iv) To assess the extent to which these
elements of the structure could be influence by policy and planning or
by changing the nature of operations. (V) To recognize the element
that controls or settles the income and cost structure at each such
centre and for the bank as a whole.
86
• K Ganesh3 in his paper studied the effectiveness of monitoring
system profit centers, standards for comparison and management
information system. The study suggested that the working fund as the
base for the purpose of comparing profitability at the branch level is
inadequate and he related it to the total business.
• Makrand 4 studied the performance of public sector banks. He selected
six quantitative indicators for performance index. Which were branch
expansion priority sector lending, deposit mobilization export credit net
profit to working funds and wages and cost of business development?
The main recommendations of his study were (i) counseling and expert
opinion to the priority sector lending on diversified activities is needed.
(ii) The lower level staff should also actively be involved in priority
sector lending activities. (iii) Necessary lending power should be
vested with the branch managers.
• H.N. Aggarwal 5 studies the concept of social obligations of banks. The
study recommended that providing more branch offices to the public
particularly in semi – urban and rural areas, providing greater credit
facilities to the public as well as to the priority sector. Helping, (i)
generation and maintenance of employment opportunities in the
country. (ii) Financing the government securities and popularizing the
bill form of credit.
• Nayan Kamal 6 recommended a model for evaluation of performance of
commercial banks. He suggested that the basis of all the important and
quantifiable parameters of performance an integrated performance
index needs to be developed, which will act as a model for evaluating
the performance of commercial banks.
• V.B. Angadi and V.J. Devraraj 7 in their paper studied that difference in
cost of working fund, interest earning social banking, funds
management, other than income expansion of banking business.
Banking services are the main factors contributing to difference in
productivity and profitability ratios of the banks.

87
• J.C. Desai 8 studied staff productivity in banks. Basic objective of the
study was to detect and correct staffing imbalances. He felt that in
service industries like banking with wide variations in work mix, a
universally applicable and fully scientific formula is difficult to evolve in
any area of management.
• A.K. Kanthale 9 observed in his paper that credit policy of the
government has a great impact a factor or determinant of working
result, which is independent of credit and monetary policies.
• P.N. Joshi 10 studied the trend of gross and net profits of scheduled
commercial banks. His conclusion is as follows. (i) Lower capacity for
fund management of the banks was due to statutory liquidity ratio, cash
reserve ratio and priority sector lending. (ii) Lowering yield and rising
cost rate year by year. (iii) Declining demand from the corporate sector
for bank funds had seriously contributed a lot to the decline trend in
profitability.
• M.R. Vyas 11 studied financial performance of regional rural banks in
Rajasthan. He analysed the financial performance with the help of
quick ratio, credit deposit ratio, and profit to proprietor’s capital ration
and working capital analysis. He concluded that regional rural banks
had a bright future as an effective instrument in the economic growth
and up-liftment of down trodden sections of Indian society particularly
in rural area.
• N.A. Shanbhag 12 in his paper evaluated various target based social
obligations assigned to banks from time to time after their
nationalisation. He suggested regrouping of the priority sectors with the
contemporary relevance.
• J.Panda and G.S. Lall 13 in their paper attempted to develop internal
management techniques for improving the profitability of the Indian
banks. They identified most important factors influencing the
profitability i.e. productivity development of funds, quality of advances,
information system organizational setup and branch expansion policy.
88
• M.N. Mishra 14 in his paper evaluated the profitability of scheduled
commercial banks taking into account the interest and non – interest
income and interest expenditure, manpower expenses and other
expenses. The Author has identified that the growing pre emption of
funds in the form of statutory liquidity ratio, cash reserve ratio, faster
increase of expenses as compared to the income, advances, and total
investment than interest income and few more factors have contributed
to the declining profitability of Indian commercial banks.
• A.M. Sadare 15 analyzed public sector banks, private sector banks and
foreign banks for a period of six year from 1985 to 1990. He concluded
that policy supports as well as effectiveness is important factors for
improving the profitability of banks.
• M.Chandra 16 in his article studied the aspects of public sector banks
profitability. He concluded that despite huge working funds. Public
sector banks were not able to show better results due to high cost
operation on account of priority sector advances and more than 56
percent branches being rural.
• A.V. Rajgopalan 17 in his paper has given an over all view on
productivity in banks. He concluded that profitability and productivity
depends on various factors like reduction of costs, recovery work
reorganization, computerization etc. He opined that establishments
expenses play a key role in determine the level of profit. He suggested
that attention should be given on staffing pattern.
• Jagwant Singh 18 has analyzed productivity of Indian banks. He has
used it indicators that can be categorized in to three main indicators i.e.
per employee indicators per branch indicators and financial indicators.
He observed that united commercial bank was the one bank that from
all angles was giving poor performance after nationalisation. SBI was
able to make considerable improvement in its productivity. He
recommended that all the banks should set up productivity cells.
• Amandeep 19 in her work on profitability of commercial banks has
made an attempt examine the trends in profits and profitability of

89
twenty nationalised banks. She used trend analysis ratio analysis and
concentration indices of the selected parameters. She also used multi
variate analysis. She concluded that to have excellent profitability
performance, banks need to have excellent performance in managing
burden.
• H.L. Varma and A.K. Malhotra 20 in their study on fund management in
commercial banks have attempted to examine the fund management in
selected five nationalised banks. They concluded that the selected
nationalised bank has experienced a very low profitability. They
observed inadequacy of capital fund, phenomenal growth in deposits,
less borrowing from Reserve Bank of India, Improvement in liquidity
position and remarkable performance in priority sector lending.
• R.Shrinivasan 21 in his study on priority sector lending has attempted to
study. Priority sector lending impacts on the performances of banks.
He and its studied 14 major Indian banks. He concluded that mass
lending at consetional interest has reduced the earnings of banks.
• S.G. Hundekar 22 studied the productivity aspects of the regional rural
banks. He examines growth and working of regional rural banks. He
studied operational efficiency, profitability and productivity in rural
oriented Bijapur gramin bank. He concluded that Bijapur gramin banks
operating profitability has been very poor over the study period
because of its ineffectiveness in controlling the burden.
• V.K. Bhatasana 23 studied the appraisal of financial performance of
State Bank of India (1980 – 1995) particularly productivity and
profitability of State Bank of India during the study period, he observed
adequacy of capital fund, growth in deposits, branch expansion in rural
area and less borrowing from Reserve Bank of India in this study
period of State Bank of India improved the productivity & profitability of
State Bank of India amongs public sector banks.
• O.B. Sayeed 24 in his Ph.D. research examined correlates of
organizational health productivity and effectiveness in the SBI. The

90
study is related to productivity and effectiveness. It is focus on the
psychological aspect.
There is neither a single comprehensive study on “Critical Evaluation of
Indian Banking Sector (with reference to Private Sector and Public Sector
Banks)” (1998-99 to 2002-03) nor any attempt has been made to analyse
contents of its profitability, productivity and financial efficiency after the new
generated private banks arrived. Hence present study is a humble effort to
bridge the gap in the existing literature.
2.9 SIGNIFICANCE OF STUDY:-
Banking industry of India consists of the following segments.
1. Scheduled Commercial Bank in Public Sector Banks other than the
State Bank of India group.
2. State Bank of India.
3. Associate Banks to State Bank of India.
4. Scheduled Commercial Banks in Private Sector.
5. Foreign Banks.
After 1980 to 1997-98 this period was the period of pure notification
there had been great pressure of profitability. It was due to emphasis on mass
banking and priority sector lending which in term was fully controlled by purely
political considerations. Therefore, the bank management of India faced two
important challenges one of which was to improve their profitability and
productivity by employee and branch level and the other was to achieve the
social objective in an efficient manner.
After the submission of Narshimhan Committee recommendations in
1991, the whole banking scenario changed in India. The committee proposed
reforms in the financial sector. These reforms permit operational flexibility
efficiency, productivity and profitability. It puts great emphasis on the steps
needed to improve the financial health of Indian banks, to make them efficient
market oriented, active dynamic and globally competitive industry a step
closer to the concept of universal banking.
The present study relates to the critical evaluation of Indian banking
sector. It also includes analysis of branch productivity, employee productivity
profit and profitability and priority sector lending. Since 1980 the public sector

91
banks are the leader of the banking industry in India. Their financial
performance appraisal provides a direction to other banking institutions. In
fact, it helps the bank in the setting up of standard.
The present study has been undertaken to depth study of the financial
performance of the public sector banks under study and the private sector
banks under study during 1998-99 to 2002-03.
2.10 OUT LINE OF CHAPTER PLAN:
The entire research report has been presented in the following 6 (six)
chapters which are as under.
• Chapter No. 1 Introduction of banking Industry:
In this chapter the brief history, organization structure of Indian banking
before and after nationalisation, corporate philosophy, strength and
weaknesses, growth and over all business of selected banks have been
discussed.
• Chapter No. 2 Research methodology:-
The second chapter describes problem of the study, objectives and
scope, hypothesis and research methodology, tools and techniques of
analysis and limitation of study have been discussed.
• Chapter No. 3 Analysis of productivity and profitability:-
The third chapter describes meaning of productivity and profitability,
point wise and bank wise ratio and analysis of profitability and productivity,
have been discussed.
• Chapter No. 4 Analysis of financial efficiency:-
This chapter focuses on the determinants of banks financial
performance mainly Capital Adequacy Ratio, Cash Reserve Ratio, Non-
Performing Asset management and Credit Deposit Ratio, and Statutory
Liquidity Ratio.
• Chapter No. 5 Analysis of common size financial statements:-
In this chapter the concepts of Common Size Balance Sheet and Profit
and Loss Statement of selected units have been prepared and analysed.
• Chapter No. 6 Summary, findings and suggestions:-
In this chapter summery of first five chapters, major findings and
suggestions have been shown.

92
2.11 HYPOTHESIS TESTING:-
“A hypothesis is a special proposition formulated to be tested in a
certain given situation as a part of research which stats what the researcher is
looking for.” 25
Hypothesis formulated under the study are as follows:
For the present study the researcher has formulated two hypothesis
viz. Null hypothesis and Alternative hypothesis. Both hypotheses were
tested with the help of statistical tools. The statements of hypothesis were as
under:
NULL HYPOTHESIS:-
[1] There is no significant difference between the productivity ratios of the
units under study.
[2] There is no significant difference between the profitability ratios of the
units under study.
[3] Financial performance of banks under study is not independent of
banking sector reforms.
[4] Productivity and profitability performance of banks under study is not
independent of banking sector reforms.
ALTERNATIVE HYPOTHESIS:
[1] There is significant difference between the productivity ratios of the
units under study.
[2] There is significant difference between the profitability ratios of the
units under study.
[3] Financial performance of banks under study is independent of banking
sector reforms.
[4] Productivity and profitability performance of banks under study is
independent of banking sector reforms.
2.12 LIMITATIONS OF THE STUDY:-
(1) The data, which is used for this study, is based on annual report of the
bank and secondary data collected from RBI & IBA Bulletin published
from time to time. Therefore the quality of this research depends on
quality and reliability of data published in annual reports.

93
(2) The operation at various branch level and micro level has not been
covered in this study.
(3) This study is in the nature of a positive empirical research. It is not
being proposed to enter in the normative aspect and offer suggestion
for improvement in the working.
(4) There are different methods to measure the profitability and
productivity of the banks. In this connection view of expert differed from
one another.
(5) The present study of common size analysis has been made but
common size analysis has its own limitations, which also applies to the
study.
(6) Accounting ratios have its own limitation, which also applied to the
study.
(7) This study is related with five public sector banks and five private
sector banks. Any generalisation for universal application can not be
applied here.

94
2.13 REFERENCES:-
1. L.K. Kulkarni Developmental Responsibility and Profitability of Banks;
Economic & Political weekly, vol. 14 (34) Aug 25, 1979.
2. S.G. Shah, “Bank profitability: The real issues” The Journal of the
Indian institute of Banker’s Vol. 50 No.5 July, Sept. 1979.
3. K.Ganesh, “Monitoring Profitability in Banks.” The Commerce July
1979, p-25-27.
4. Makarand, Social Priority Index of Public Sector Banks Allahabad Bank
Publications, Calcutta – 1979.
5. H.N. Aggarwal, “A portrait of nationalised banks A study with reference
of their social obligations” Inter India Publications, DELHI – 1979.
6. Nayan Kamal, “Performance evaluation of commercial banks:
‘Development of an evaluation model’ Ph.D. Thesis. Himchal Pradesh
University, Shimla, 1982.
7. V.B., Angadi and V.J. Devaray, “Productivity and profitability of banks
in India” Economic and Political weekly, vol. 18 (48) Nov. 26, 1983.
8. C.J. Desai “Analyzing productivity in banking: concept and
methodology.” Prajnan, July-Sept-1983 P.P. 185-193.
9. A.K. Kanthale, The impact of monetary and credit policies on the
working result of commercial banks and suggestion for offsetting the
effects on their profitability. Paper presented at bank economists meet.
Hosted by Indian bank Madras 1984.
10. P.N. Joshi, “Profitability and profit planning in banks”, The Journal of
Indian Institute of Bankers vol. 57 No.2 APRIL – JUNE – 1986.
11. M.R. VYAS, “Financial performance of rural banks, Jaipur” Arihant
publishers 1991.
12. N.A. Shahbhag, Resource allocation and process composition for
batter profitability, paper presented in banks economists conference –
1991 at Bangalore Jan. 1991.

95
13. J.Panda and G.S. Lall, “A critical appraisal on the profitability of
commercial banks”, Indian Journal of banking & finance, vol. 5, 1991-
1992.
14. M.N. Mishra, Analysis of profitability of commercial banks, Indian
journal of banking & finance vol.5, 1992.
15. A.M. Sadare, Profitability in banks, pigmy economic review, vol. 37,
No.9, April, 1992.
16. M.Chandra, “on increasing profitability of public sector banks”, a note
pigmy economic review, vol. 38, Nov. 1992.
17. A.V. Rajagopalang, “Productivity in banks, an overview” Trends and
challenges to Indian banking.” (Ed.), S.S. Huger, Deep & Deep
publication, New Delhi – 1993.
18. Jagwant Singh, “Indian banking industries growth and trends in
productivity” Deep & Deep publication, New Delhi – 1993.
19. Amandeep, “Profit and profitability in commercial banks, Deep & Deep
publication, New Delhi – 1993.
20. H.L. Verma & A.K. Malhotra, “Fund management in commercial
banks”, Deep & Deep publication. New Delhi – 1993.
21. R.Srinivasan, Priority sector lending “Himalaya publishing house, New
Delhi – 1995.
22. S.G. Hundekar, “Productivity in banks, “Printwell Rupa offset printers
Jaipur 1995.
23. V.K. Bhatasana, “Appraisal of financial performance of State Bank of
India” Ph.D. Thesis Saurashtra University Rajkot 1999.
24. O.B. Sayeed, “Correlates of organizational Health, productivity and
effectiveness: A study of some organizational and managerial
personality variables related to productivity and effectiveness of some
branches of State Bank of India” Ph.D. Thesis, University of Udaipur
(1974).
25. Michael V.P. “Research methodology in management” Himalaya
publishing House Bombay 1985 P.No. 107.

96
CHAPTER NO - 3
ANALYSIS OF PRODUCTIVITY AND PROFITABILITY
3.1 Introduction
3.2 Meaning
3.2.1 Productivity
3.2.2 Profitability
3.3 Factors for unproductive atmosphere in Indian banks
3.4 Analysis of Productivity
3.5 Analysis of Profitability – Empirical Analysis
3.6 Analysis and interpretation of Spread Burden and
Profitability of Selected unit under study.
3.7 Conclusion
3.8 References

97
CHAPTER – 3
3.1 INTRODUCTION:-
In India, if the 8.00 percent growth rate of GDP envisaged in the tenth
five year plan is to be achieved, substantial improvement in productivity is
very critical to overall productivity of the country. Financial intermediaries’
especially public sector banks and private sector banks, exert a casual
influence on economic growth by affecting the pace of productivity growth and
technological change.
Banks can enhance resource allocation and accelerate growth by
reducing the cost of acquiring information, conducting transactions and
facilitating saving mobilisation. Many literatures in economics also argue that
economic growth results from capital accumulation and banks influence
growth primarily by raising domestic saving rates and attracting foreign
capital. Studies have shown that countries with more developed and efficient
financial systems will grow faster than countries with less developed and
inefficient financial systems.
Research indicates a clear need for banks to align “STRATEGY” and
“PROCESS” with “CAPITAL” “TECHNOLOGY” AND “HUMAN RESOURCE
MANAGEMENT” in order to achieve gains in profitability, productivity and
efficiency.
In the study, productivity is defined as number of transactions and the
number of loans and deposit accounts per hour per employee. The
productivity of US Banks was taken as the bench mark (100). When
compared to the US Banks. The index for the public sector banks is about 10
for all the private banks is about 32, and for the best Indian private sector
bank, it is about 55. Accounting to the study the three reasons for the wide
gap between Indian and US Banks are: -
• TECHNOLOGY
(Lack of Branch Automation and Centralised Processing)
• SYSTEMIC INEFFICIENCIES
• SCALE

98
The biggest contributor to the productivity gap between US Banks and
Indian PSBs is low investment in technology. Management inefficiency in
terms of over staffing and sub optimal offices contributes only 7 points.
Systemic inefficiency, such as the absence of credit bureau, poor clearing
mechanism in some part of the country and low evolution of remote delivery
channel such as the ATMs and call centers, hinder them from reaching their
full potential.
Productivity of the bank can be improved by reducing the cost of
disintermediation (Reducing operating cost by effectively deploying
technology, Human capital and continually refining its work procedures) and
by raising the spread i.e. deploying capital in the most effective way.
The study has focused on how public sector banks and private sector
banks can improve profitability and productivity by managing some of the
important elements related to capital, technology, process, organizational
issues, labour, in a better way.
However before taking these issues, it is important to understand the
unproductive atmosphere reason’s in which public sector banks and private
sector banks operate.
3.2 MEANING:-
3.2.1 PRODUCTIVITY:-
Productivity is defined as the ratio of output to input for a specific
production system. Rising productivity implies either more output is produced
for the same amount of input or that less input are required to produce the
same amount of output.
The conceptual and empirical problems that plague the measurement
of physical output in most service industries are particularly acute in the
banking sector, where there is no clear consensus on an appropriate
definition of output (Triplett – 1990).
However, most of these measures that are used to study bank’s
performance can be interpreted more correctly as measuring the bank’s
efficiency target rather than directly measuring their productivity.
99
Nonetheless, such measures of efficiency are the most commonly
examined indicators of productivity in banking (Alan Ouster and Lawrence
Antioch – p – 201)
Output Formula :- Productivity = Input
3.2.2 PROFITABILITY: -
“Profits are the record card of the past, the inventive lode star for the
future. If a business unit fails to make profit; capital invested is eroded and if
this situation prolongs the business firm ultimately ceases to exist.” (1)
The word “Profitability” is composed of two words viz. ‘Profit and
Ability’. The terms ‘Ability’ showed the power of the business firm to earn
profits. The term ‘Ability’ is also referred to as “earning power” or “Operating
Performance” of the concerned investment.
Thus the term profitability can be defined as the earning power /
capacity of profit of business firm. The word “Profitability may be defined as
the ability of a given investment to earn a return from it use.” (2) It can be
remarked that ‘Profitability’ is helpful in providing a useful basic for measuring
tool in point of view performance and overall efficiency for Indian banking.
Operating Income Formula :- Profitability = Operating Assets
The overall performance of a bank is evaluated with the help of the
profitability criteria. Profitability indicates net profit as percentage of working
funds (working funds means balance sheet total less contra item). Profitability
shows the efficiency with which a bank deploys its total resources to optimize
its profits and thus used as an index to the degree of asset utilization and
managerial effectiveness.
“The concept of profitability may be defined as the ability of a given
investment to earn a return from its use.” (3) Profitability can be treated as a
relationship of earnings to the total resources of a corporation.
Profitability ratios are the most important and appropriate indicators for
the evaluation of the financial performance of a bank. Profitability ratios serve
as an important measurement of the efficiency with which the operations of
the banks are going on. In case of banking industry income, assets, deposits

100
and working funds can be used as measures for finding out profitability. These
measures of profitability may be important from different points of view for
different people.
For an example,
Profit earned for every Rs.100 of total assets may be of important for a
share holder and profit earned on every Rs.100 deposited may interest the
banking community. 4 Hence in banking industries generally income, assets,
deposits and working funds are taken to find out profitability performance.
Profitability of bank can be measured in the following way.
(1) Profitability – profit per Rs.100 of working funds
(2) Profitability – profit per Rs.100 of deposits
(3) Profitability – profit per Rs.100 of total assets
(4) Profitability – profit per Rs.100 of Income
Poor operational performance may indicate poor profits. A lower profitability
may be due to lack of control over expenses. The analysis of profitability ratio
is very useful to management for the ultimate success of the bank.
3.3 FACTORS FOR UNPRODUCTIVE ATMOSTPHERE IN
INDIAN BANKS:
There are many factors within the banking industry and in the
economic environment in which the bank function, which make it difficult for
the banks to become fully productivity.5
Some of the factors are:
(1) Lock up of funds in NPAs
(2) Policy of appeasement towards the union
(3) Unproductive Competition
(4) Lack of Autonomy
(5) Dual control by RBI as well as the Government.
Let us check this factor in brief:
(1) Lock up of Funds in NPAs: -
Non Performing Assets (NPA) continues to be the primary-source of
misery and the ever present Damocles Sword threatening to question the
fundamental efficiency of bank.

101
It is widely known that the basic causes for accumulation of NPAs of
over Rs. 58000 crore is not because of negative tread cycles or unexpected
business slowdown but is an outcome of serious “system and work practice”
defects in the very operational methodology of the credit delivery system in
the public sector banks. The major shortcoming is the absence of any
systemic effort to identify train and position officials with the required
proficiency to handle the credit functions.
(2) Policy of appeasement towards the union:-
Though over the last couples of years bank union has been lying low,
yet they refuse to subscribe to the principles and practices of participative
management and have victimized the middle and the branch management by
the sheer collective power to stop work and cause all around havoc.
Although the bank unions have the guaranteed right to collective
bargaining on behalf of the employees they have no right to go on strike.
In a landmark judgment, on August 8, 2003, the supreme court of India
held the government employees had no right, fundamental, legal, moral, or
equitable to go on strike. “STRIKE as a weapon is mostly misused which
results in chaos and total mal-administration.” The bench said adding,
“STRIKE affects society as a whole and particularly when two lac employees
go on strike in masses (Referring to Tamilnadu Government case) the entire
administration comes to a grinding halt.” The observation made by the court
has certainly put public sector banks in a better position to deal with bank
union.
(3) Unproductive Competition:-
The State Bank of India its seven associates and the additional twenty
nationalised banks have all been allowed to retain their individual entities.
Different banks even though they themselves belong to the public sector;
spend considerable, time competing among them without increasing the total
benefit to the system. As a result the focus on banks has shifted away from
the areas of real productivity. Solanker, clearly outlines these concerns when
he says; “The present structure is not ideal one but an accident of history. The
two main objectives for retaining the separate identities, mainly to preserve
cultural strength and to preserve competition do not seem to have been
fulfilled.” Solankar further adds, condensing the total number to six, all India in

102
character more or less equal in size with fairly good representation in all parts
in India with RRBs merged.”
It is very difficult to speculate in what manner the twenty-seven banks
should be reformed and in to what precise number. However, the best option
would be to divest government holding, as promised so that the mergers
between banks could be market driven rather than a bail out consideration.
(4) Lack of Autonomy:-
Lack of Autonomy together with government fiats like directed
investment and directed credit programme adds to the systemic inefficiencies
and results in lower productivity, public sector banks face excessive
administrative and political interferences in internal credit decision – making
and internal management. The Narasimham Committee, in its report
recommended that the various guidelines and directives issued by the
government or The Reserve Bank of India in regard to internal administration
of the bank should be reviewed to examine their continuing relevance in
context of the need to ensure the independence and autonomy of the banks.
There is a strong feeling among the bankers. That the recommendations of
the Narasimham Committee for phasing out directed lending to sectors
designated hitherto, redefining the priority segments, and granting more
autonomy are yet to be reviewed in totality.
(5) DUAL CONTROL BY RBI as well as the Governments:-
The banking system suffers from the fact that it is serving two masters.
Both the finance ministry and RBI seem to have equal say in the affairs of the
bank. The government should make its expectations from the banking system
very clear and leave their realisation to the deft handling of RBI. Endeavors, of
productivity increase demand (RAO, 1989).
(a) Origin of all instructions from a single source, namely the central bank
that only is equipped to understand the various issues involved and
can appreciate the mind of bankers.
(b) Clear delineation of policies and keeping them above party
consideration.... and.
(c) Accountability to a single authority.
These are the main constraints under which public sector banks
operate in India.

103
3.4 ANALYSIS OF PRODUCTIVITY: -
(i) Productivity Ratio per branch by Business volume:
This ratio is one of the best indicators for the measurement of
productivity of bank. A high ratio indicates better productivity and low ratio
indicates lower productivity. This ratio has been calculated with the help of
following formula.
Business volume Formula: Productivity per branch = No. of Branches.
Where Business volume = Deposits + Advances of the bank

104
GRAPH NO. 3.1 AVERAGE PRODUCTIVITY BY BUSINESS VOLUME PER BRANCH
(Source: Computed from Data Collected from IBA Bulletin – Mar. –03 & Jan.-04)
Year
Name of Bank Under study unit
1998-99 1999-00 2000-01 2001-02 2002-03 Average
Public Sector Bank
Punjab & Sind Bank 19.12 20.82 22.90 24.02 25.35 22.44
Punjab National Bank 15.65 18.18 21.70 25.53 28.74 21.96
Bank of Baroda 25.54 28.53 30.53 35.64 36.95 31.44
Union Bank of India 18.43 21.59 25.52 30.24 34.78 26.11
State Bank of India 27.99 32.61 39.26 43.08 47.78 38.14
Average 21.35 24.35 27.98 31.70 34.72 28.02
Private Sector Bank
ICICI Bank Ltd. 148.78 166.95 65.94 221.01 227.46 165.99
HDFC Bank Ltd. 75.72 107.12 124.39 143.09 161.75 122.41
UTI Bank Ltd. 148.89 188.31 161.78 158.91 172.46 166.07
Global Trust Bank Ltd. 98.65 149.49 179.30 112.81 117.21 131.49
Bank of Punjab Ltd. 52.16 71.07 71.27 53.97 50.35 59.76
Average 104.84 136.59 120.54 137.96 145.84 129.15

105
GRAPH NO. 3.1 AVERAGE PRODUCTIVITY BY BUSINESS VOLUME PER BRANCH
22.44 21.9631.44 26.11
38.14
165.99
122.41
166.07
131.49
59.76
0
20
40
60
80
100
120
140
160
180
PE
RC
EN
TA
GE
P&SB PNB BOB UBI SBI ICICI HDFC UTI GTB BOP
NAME OF BANK
AVERAGE PRODUC TIVITY PER BRANCH
P ROD UC TIV ITY P E RB RA NC H
106
This is the most productivity key indicator used by the banks. This ratio
does not reflect fully the wide range of service provided by the each branch of
the banks under study.
The average productivity per branch for public sector banks under
study was Rs. 28.02 crores, and the average productivity per branch for
private sector banks under study was Rs.129.15 crores. This was 4.61 times
more than public sector banks under study.
In P&SB business volume per branch was Rs.19.12 crores during the
year 1998-99. This ratio represented an increasing trend during the study
period and reached up to Rs. 25.35 crores. This shows net increase of
Rs.6.23 crores as compared to the year 1998-99. The average of this ratio
during the study period was Rs.22.44 crores.
In PNB business volume per branch was Rs.15.65 crores during the
year 1998-99. This ratio represented an increasing trend during the study
period and reached up to Rs.28.74 crores as compared to the year 1998-99.
The average of this ratio during the study period was Rs.22.44 crores.
In BOB business volume per branch was Rs.25.54 crores during the
year 1998-99. This ratio shows represented an increasing trend during the
study period and reached up to Rs.36.95 crores. This shows net increase of
Rs.11.41 crores as compared to the year 1998-99. The average of this ratio
during the study period was Rs.31.44 crores.
In UBI business volume per branch was Rs.18.43 crores during the
year 1998-99. This ratio represented an increasing trend during the study
period and reached up to Rs.34.78 crores. This shows net increase of
Rs.16.35 crores as compared to the year 1998-99. The average of this ratio
during the study period was Rs.26.11 crore.
In SBI business volume per branch was Rs.27.99 crores during the
year 1998-99. This ratio represented an increasing trend during the study
period and reached up to Rs.47.78 crores. This shows net increase of
Rs.19.79 crores as compared to the year 1998-99. The average of this ratio
during the study period was Rs.38.14 crores.
In ICICI Bank Ltd. business volume per branch was Rs.148.78 crores during
the year 1998-99. This ratio shows mixed trend during the study period and
reached up to Rs.65.94 crores in the year 2000-01. This went up to Rs.221.01

107
crores in the year 2001-02 and Rs.227.46 crores in the year 2002-03 with
increasing trend. This shows net increase of Rs.78.68 crores as compared to
the year 1998-99. The average of this ratio during the study period was
Rs.165.99 crores, which is second highest level between private sector banks
under study.
In HDFC Bank Ltd. business volume per branch was Rs.75.72 crores
during the year 1998-99. This ratio represented an increasing trend during the
study period and reached up to Rs.161.75 crores. This shows net increase of
Rs.86.03 crores as compared to the year 1998-99. The average of this ratio
during the study period was Rs.122.41 crores.
In UTI Bank Ltd. business volume per branch was Rs.148.89 crores
during the year 1998-99. This ratio shows mixed trend during the study period
and reached up to Rs.188.31 crores in the year 1999-00. This shows net
increase of Rs.39.42 crores as compared to the year 1998-99. But in the year
2000-01 business volume per branch came down up to Rs.161.78 crores also
in the year 2001-02 up to Rs.158.91 crores at the lowest level. The average of
this ratio during the study period was Rs.166.07 crores.
In GTB Ltd. business volume per branch was Rs. 98.65 crores during
the year 1998-99. This ratio represented mixed trend during the study period
and reached up to Rs.179.30 crores in the year 2000-01. This shows net
increase of Rs.80.65 crores as compared to the year 1998-99. But in the year
2001-02 business volume per branch came down to Rs.112.81 crores and
Rs.117.21 crores in the year 2001-02 and 2002-03 respectively. The average
of this ratio during the study period was Rs.131.49 crores.
In Bank of Punjab Ltd. business volume per branch was Rs.52.16
crores during the year 1998-99. This ratio represented mixed trend during the
study period and reached up to Rs.71.27 crores at the highest level in the
year 2000-01 but reached up to Rs. 50.35 crores at the lowest level in the
year 2002-03. The average of this ratio during the study period was Rs.59.76
crores, which is the lowest average compared to private sector banks under
study.
Overall performance in productivity as per business volume per branch
in public sector banks under study is not satisfactory as compared with private
sector banks under study. The average of public sector banks under study

108
during the study period was Rs.28.02 crores business volume per branch
while. The average of private sector banks under study during the study
period was Rs.129.15 crores business volume per branch, which is 4.61 times
more than the public sector banks under study.
F-TEST [ANOVA] :-
Productivity Per branch in Banks
Null Hypothesis (H0):
“There is no significance difference in productivity per branch in banks
under study.”
Alternative Hypothesis (H1):
“There is a significance difference in productivity per branch in banks
under study.”
Level of Significance: 5 per cent
Critical Value: 2.5787
Degree of Freedom: 49
Table – 3.1A
ANOVA TABLE
Source of
Variation SS df MS F F crit
Between Groups 4381.015 4 1095.254 0.25929 2.578737
Within Groups 190082.5 45 4224.056
Total 194463.5 49
109
Table 3.1A indicates that there were no any significant differences in
productivity per branch of banks under study because the calculated value of
‘F’ was lower than table value so, null hypothesis is accepted and alternative
hypothesis is rejected. It can be concluded that per branch of productivity of
banks trends are uniform.
(ii) Productivity Ratio per employee by business volume: -
This ratio is one as the best indicator for the measurement of productivity of
bank. A high ratio indicates better productivity and law ratio indicates lower
productivity. This ratio has been calculated with the help of following formula.
Business volume Formula: Productivity Per Employee =
No. of Employees Business Volume = Deposits + Advances of the bank

110
TABLE No. 3.2 Trends in productivity per employee in banks under study.
(Rs. In crore per employee)
Year Name of Bank Under study unit
1998-99 1999-00 2000-01 2001-02 2002-03 Average
Public Sector Bank
Punjab & Sind Bank 1.12 1.26 1.69 1.82 1.95 1.57
Punjab National Bank 0.91 1.08 1.44 1.70 1.97 1.42
Bank of Baroda 1.42 1.61 1.76 2.45 2.52 1.95
Union Bank of India 1.27 1.52 1.87 2.37 2.73 1.95
State Bank of India 1.06 1.26 1.66 1.87 2.08 1.59
Average 1.16 1.35 1.68 2.04 2.25 1.70
Private Sector Bank
ICICI Bank Ltd. 9.20 10.06 5.21 10.24 9.56 8.85
HDFC Bank Ltd. 4.39 5.94 5.92 6.54 NA 5.70
UTI Bank Ltd. 10.00 12.66 11.74 10.25 10.33 11.00
Global Trust Bank Ltd. 8.31 10.03 10.09 8.26 7.76 8.89
Bank of Punjab Ltd. 4.94 7.12 6.47 5.20 4.65 5.68
Average 7.37 9.16 7.89 8.10 8.07 8.02
(Source: Computed from Data Collected from IBA Bulletin – Mar. –03 & Jan.-04)

111
GRAPH NO.3.2 AVERAGE PRODUCTIVITY BY BUSINESS VOLUME PER EMPLOYEE
1.57 1.421.95 1.95
1.59
8.85
5.7
11
8.89
5.68
0
2
4
6
8
10
12
PE
RC
EN
TA
GE
P&SB PNB BOB UBI SBI ICICI HDFC UTI GTB BOP
N AME OF B AN K
AVE R AGE P R OD U C TIV ITY PE R E MPLOYE E
P RO D U C TIV ITY P E RE M P L O YE E
112
This is the most common productivity indicator used by the banks. This
ratio does not reflect fully the wide range of services provided by the banks.
The employee’s productivity and efficiency will reflect by this ratio.
In P&SB business volume per employee was Rs. 1.12 crore during the
year 1998-99. This ratio represented an increasing trend during the study
period and reached up to Rs. 1.95 crores business volume per employee in
the year 2002-03. This shows net increase of Rs. 0.83 crores as compared to
1998-99. The average of this ratio during the study period was Rs. 1.57
crores.
In PNB business volume per employee was Rs. 0.19 crores during the
year 1998-99. This ratio represented an increasing trend during the study
period and reached up to Rs. 1.97 crores business volume per employee in
the year 2002-03. This shows net increase of Rs. 1.06 crores as compared to
the year 1998-99. The average of this ratio during the study period was Rs.
1.42 crores.
In BOB business volume per employee was Rs. 1.42 crores during the
year 1998-99. This ratio represented an increasing trend during the study
period and reached up to Rs. 2.52 crores business volume per employee in
the year 2002-03. This shows net increase of Rs. 1.10 crores as compared to
the year 1998-99. The average of this ratio during the study period was Rs.
1.95 crores.
In UBI business volume per employee was Rs. 1.27 crores during the
year 1998-99. This ratio represented an increasing trend during the study
period and reached up to Rs. 2.73 crores business volume per employee in
the year 2002-03. This shows net increase of Rs. 1.46 crores as compared to
the year 1998-99. The average of this ratio during the study period was Rs.
1.95 crores.
In SBI business volume per employee was Rs. 1.06 crores during the
year 1998-99. This ratio represented an increasing trend during the study
period and reached up to Rs. 2.08 crores business volume per employee in
the year 2002-03. This shows net increase of Rs. 1.02 crores a compared to
the year 1998-99. The average of this ratio during the study period was Rs.
1.59 crores.

113
In ICICI Bank Ltd. business volume per employee was Rs. 9.20 crores
during the year 1998-99. This ratio represented mixed trend during the study
period and reached up to Rs. 10.24 crores in the year 2001-02. But due to
new recruitment of employees more than 3000 every year the ratio of
business volume per employee came dawn up to Rs. 5.21 crores and Rs.
9.56 crores in the year the year 2000-01 and 2002-03 respectively. The
average of this ratio during the study period was Rs. 8.85 crores, which is
5.00 times more than the average of public sector banks under study.
In HDFC Bank Ltd. business volume per employee was Rs. 4.39 crores
during the year 1998-99. This ratio represented an increasing trend during the
study period and reached up to Rs. 6.45 crores business volume per
employee in the year 2001-02. This shows net increase of Rs. 2.15 crores as
compared to the year 1998-99. The average of this ratio during the study
period was Rs. 5.70 crores, which is 3 times more than the average of public
sector banks under study.
In UTI Bank Ltd. business volume per employee was Rs. 10.00 crores
during the year 1998-99. This ratio represented mixed trend during the study
and reached up to Rs. 12.66 crores at the highest level in the year 1999-00.
But due to new recruitment of employees 4 time more in last 5 years. The
ratio of business volume per employee came down to Rs. 11.74 crores Rs.
10.25 crores, and Rs. 10.33 crores in the year 2000-01 to 2002-03
respectively. The average of this ratio during the study period was Rs. 11.00
crores, which is the highest ever for public sector banks and private sector
banks under study.
In GTB Ltd. business volume per employee was Rs. 8.31 crores during
the year 1998-99. This ratio represented mixed trend during the study period
and reached up to the highest level Rs. 10.09 crores in the year 2000-01 and
the lowest level Rs. 7.76 crores in the year 2002-03. The average of this ratio
during the study period was Rs. 8.89 crores.
In Bank of Punjab Ltd. business volume per employee was Rs. 4.94
crores during the year 1998-99. This ratio shows mixed trend during the study
period and reached up to the highest level Rs. 7.12 crores in the year 1999-00
and the lowest level Rs. 4.65 crores in the year 2002-03 because of new
114
recruitment of employee in last three year. The average of this ratio during the
study period was Rs. 5.68 crores.
Overall we can see that business volume per employee is more than
4.72 times higher in new private sector banks under study as compared to
public sector banks under study. The average business per employee for
public sector banks under study is Rs. 1.70 crores and for private sector
banks under study it is Rs. 8.02 crores.
Concept of efficiency relate to how well a bank employs its resources
relative to the existing production possibilities frontier [or in other words
relative to current “best practice”] how an institution simultaneously minimizes
costs and maximizes revenue, based on an existing level of production
technology.
F-TEST [ANOVA]:
Productivity per employees in banks
Null Hypothesis (H0):
“There is no significance difference in productivity per employee of
banks under study.”
Alternative Hypothesis (H1):
“There is a significance difference in productivity per employee of banks
under study.”
Level of Significance: 5 per cent
Critical Value: 2.5836
Degree of Freedom: 48

115
Table -3.2A
ANOVA TABLE
Source of
Variation SS df MS F F crit
Between Groups 5.613857 4 1.403464 0.096477 2.583668
Within Groups 640.0735 44 14.54713
Total 645.6874 48
From the above table, it is clear that difference between groups and within
groups in per employee productivity of banks was not significant because the
calculated value (0.096477) of ‘F’ was lower than critical value (2.5836) of ‘F’.
Analysis indicates that there was similarity of per employee productivity of
banks under study.
iii) Productivity Ratio per employee by working funds:-
This ratio is based on working funds and contingent liability of the bank,
which is best indicator for the measurement of productivity of a bank. A low
ratio indicates lower productivity and high ratio indicates better productivity.
This ratio has been calculated with the help of following formula.
Working Funds + Contingent Liability Formula : Productivity by working funds = No. of Employee
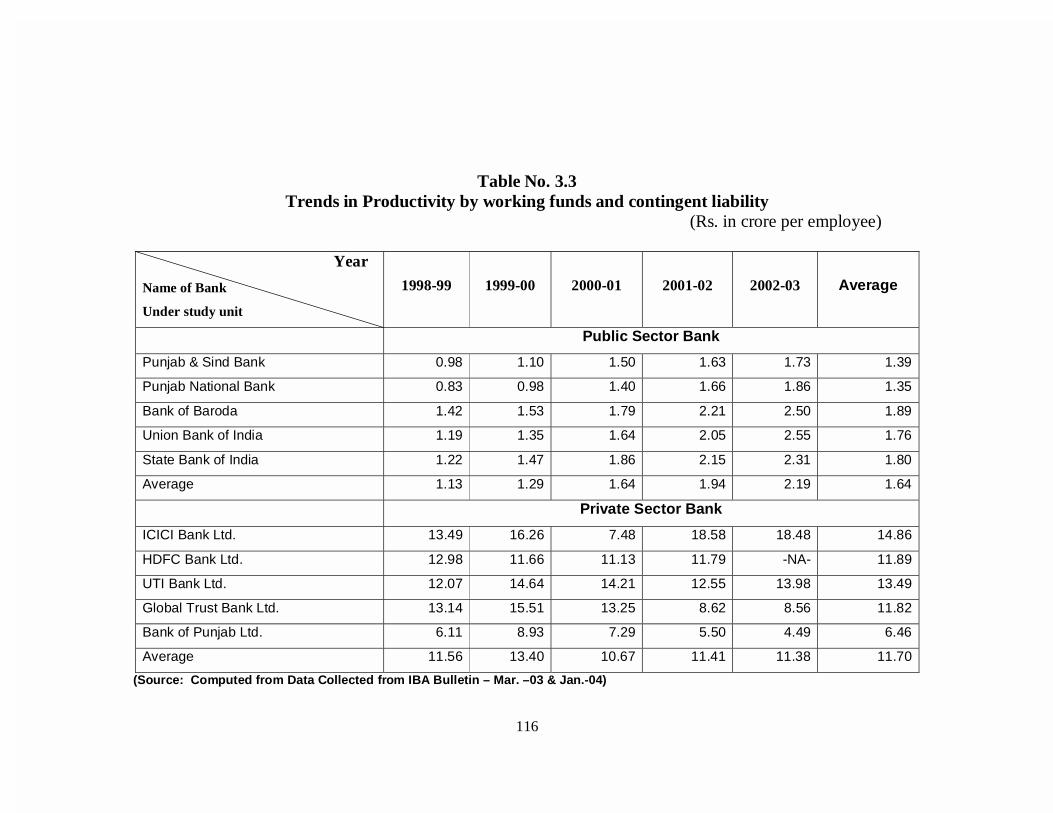
116
Table No. 3.3 Trends in Productivity by working funds and contingent liability
(Rs. in crore per employee)
Year
Name of Bank
Under study unit
1998-99 1999-00 2000-01 2001-02 2002-03 Average
Public Sector Bank
Punjab & Sind Bank 0.98 1.10 1.50 1.63 1.73 1.39
Punjab National Bank 0.83 0.98 1.40 1.66 1.86 1.35
Bank of Baroda 1.42 1.53 1.79 2.21 2.50 1.89
Union Bank of India 1.19 1.35 1.64 2.05 2.55 1.76
State Bank of India 1.22 1.47 1.86 2.15 2.31 1.80
Average 1.13 1.29 1.64 1.94 2.19 1.64
Private Sector Bank
ICICI Bank Ltd. 13.49 16.26 7.48 18.58 18.48 14.86
HDFC Bank Ltd. 12.98 11.66 11.13 11.79 -NA- 11.89
UTI Bank Ltd. 12.07 14.64 14.21 12.55 13.98 13.49
Global Trust Bank Ltd. 13.14 15.51 13.25 8.62 8.56 11.82
Bank of Punjab Ltd. 6.11 8.93 7.29 5.50 4.49 6.46
Average 11.56 13.40 10.67 11.41 11.38 11.70
(Source: Computed from Data Collected from IBA Bulletin – Mar. –03 & Jan.-04)

117
GRAPH NO.3.3 AVERAGE PRODUCTIVITY BY WORKING FUNDS PER EMPLOYEE
1.39 1.35 1.89 1.76 1.8
14.86
11.89
13.49
11.82
6.46
0
2
4
6
8
10
12
14
16
PE
RC
EN
TA
GE
P&SB PNB BOB UBI SBI ICICI HDFC UTI GTB BOP
NAME OF BAN K
AVERAGE PR ODUC TIVITY PER EMPLOYEE
P ROD UC TIV ITY P E RE M P LOYE E

118
This ratio represents the value of business base on both fund and non fund
related activity.
In P&SB productivity by working funds and contingent liability per
employee was Rs. 0.98 crores during the year 1998-99. This ratio
represented an increasing trend during the study period and reached up to
Rs. 1.73 crores. This shows net increase of Rs. 0.75 crores as compared to
the year 1998-99. The average of this ratio during the study period was Rs.
1.39 crores.
In PNB productivity by working fund and contingent liability per
employee was Rs. 0.83 crores during the year 1998-99. This ratio
represented an increasing trend during the study period and reached up to
Rs. 1.86 crores. This represented net increase of Rs. 1.03 crores as
compared to the year 1998-99. The average of this ratio during the study
period was Rs. 1.35 crores.
In BOB productivity by working funds and contingent liability per
employee was Rs. 1.42 crores during the year 1998-99. This ratio registered
an increasing trend during the study and reached up to Rs. 2.50 crores. This
shows net increase of Rs. 1.08 crores as compared to the year 1998-99. The
average of this ratio during the study period was Rs. 1.89 crores.
In UBI productivity by working funds and contingent liability per
employee was Rs. 1.19 crores during the year 1998-99. This ratio
represented an increasing trend during the study period and reached up to
Rs. 2.55 crores. This shows net increase of Rs. 1.36 crores as compared to
the year 1998-99. The average of this ratio during the study period was Rs.
1.76 crores.
In SBI productivity by working funds and contingent liability per
employee was Rs. 1.22 crores during the year 1998-99. This ratio
represented an increasing trend during the study period and reached up to
Rs. 2.31 crores. This shows net increase of Rs. 1.09 crores as compared to
the year 1998-99. The average of this ratio during the study period was Rs.
1.80 crores, which is more than the average of public sector bank’s under
study.

119
In ICICI Bank Ltd. productivity by working funds and contingent liability
per employee was Rs. 13.49 crores during the year 1998-99. This ratio
represented mixed trend during the study period and reached at the highest
level up to Rs. 18.58 crores during the year 2001-02 and at the lowest level
up to. Rs. 7.48 crores during the year 2000-01. The average of this ratio
during the study period was Rs. 14.86 crores which is the highest level ever
all banks under study.
In HDFC Bank Ltd. productivity by working funds and contingent
liability per employee was Rs. 12.98 crores during the year 1998-99. This ratio
shows mixed trend during the study period and reached the lowest level to
Rs. 11.13 crores during the year 2000-01, which is nearer to average for
private sector banks under Study. The average of this ratio during the study
period was Rs. 11.89 crores
In UTI Bank Ltd. productivity by working funds and contingent liability
per employee was Rs. 12.07 crores during the year 1998-99. This ratio
represented mixed trend during the study period and reached at the highest
level up to Rs. 14.64 crores during the year 1999-00. The average of this ratio
during the study period was Rs. 13.49 crores which is more than the average
of public sector banks under study.
In GTB Bank Ltd. productivity by working funds and contingent liability
per employee was Rs. 13.14 crores during the year 1998-99. This ratio shows
mixed trend during the study period and reached up to the highest level at Rs.
15.51 crores during the year 1999-00 and the lowest level at Rs. 8.56 crores
during the year 2002-03. The average of this ratio during the study period was
Rs. 11.82 crores.
In Bank of Punjab Ltd. productivity by working funds and contingent
liability per employee was Rs. 6.11 crores during the year 1998-99. This ratio
represented mixed trend during the study period and reached at the highest
level up to Rs. 8.93 crores in the year 1999-00 and at the lowest level up to
Rs. 4.49 crores during the year 2002-03 which is the lowest level in all private
sector banks under study. The average of this ratio during the study period
was Rs. 6.46 crores.

120
Overall we can see that the average of public sector banks under study
is Rs. 1.64 crores and the average of private sector banks under study is Rs.
11.70 crores which is 7 time higher than the average of public sector banks
under study.
F-TEST [ANOVA]:
Productivity by working funds and contingent liability
Null Hypothesis (H0):
“There is no significance difference in productivity by working funds
and contingent liability of banks under study.”
Alternative Hypothesis (H1):
“There is significance difference in productivity by working funds and
contingent liability of banks under study.”
Level of Significance: 5 per cent
Critical Value: 2.5836
Degree of Freedom: 48
Table -3.3A
ANOVA TABLE
Source of
Variation SS df MS F F crit
Between
Groups 9.111 4 2.27775 0.063409 2.583668
Within Groups 1580.537 44 35.9213
Total 1589.648 48

121
It is evident from table 3.3A that the difference between productivity by
working funds and contingent liability of banks between groups and within
groups was not significant because the calculated value of ‘F’ was 0.06340
which is lower than table value of F. It can be said that the productivity by
working funds and contingent liability indicates uniform trends.
iv) Productivity Ratio per employee by Net Total Income:
From the point of view of productivity of a bank, net total income is a
key indicator for productivity measure. A high ratio indicates better productivity
and low ratio indicates lower productivity. This ratio has been calculated with
the help of following formula.
Net total Income Formula : Productivity by Net Total Income =
No. of employees

122
TABLE NO: - 3.4 Trends in Productivity by net total income
(Rs. in crore per employee)
Year
Name of Bank
under study unit
1998-99 1999-00 2000-01 2001-02 2002-03 Average
Public Sector Bank
Punjab & Sind Bank 0.09 0.11 0.14 0.15 0.16 0.13
Punjab National Bank 0.08 0.09 0.11 0.13 0.15 0.11
Bank of Baroda 0.12 0.12 0.14 0.18 0.18 0.15
Union Bank of India 0.10 0.12 0.14 0.17 0.20 0.15
State Bank of India 0.09 0.11 0.14 0.16 0.18 0.14
Average 0.10 0.11 0.13 0.16 0.17 0.14
Private Sector Bank
ICICI Bank Ltd. 0.71 0.78 0.33 0.35 1.18 0.67
HDFC Bank Ltd. 0.45 0.40 0.53 0.54 -NA- 0.48
UTI Bank Ltd. 0.81 0.79 0.89 0.93 0.80 0.84
Global Trust Bank Ltd. 0.85 0.94 0.91 0.83 0.56 0.82
Bank of Punjab Ltd. 0.43 0.56 0.54 0.50 0.42 0.49
Average 0.65 0.69 0.64 0.63 0.74 0.66
(Source: Computed from Data Collected from IBA Bulletin – Mar. –03 & Jan.-04)

123
GRAPH NO.3.4 AVERAGE PRODUCTIVITY BY NET TOTAL INCOME PER EMPLOYEE
0.13 0.110.15 0.15 0.14
0.67
0.48
0.840.82
0.49
0
0.1
0.2
0.3
0.4
0.5
0.6
0.7
0.8
0.9
PE
RC
EN
TA
GE
P&SB PNB BOB UBI SBI ICICI HDFC UTI GTB BOP
NAME OF BANK
AVER AGE PR OD UC TIV ITY PER EMPLOYEE
P ROD UC TIV ITY P E RE M P LOYE E

124
Net income per employee ratio provides the relationship between the number
of employee and net total income. This calculation also provides the average
net income by year wise per employee bank wise which can easily compare
with other bank under study.
We see that private sector banks under study perform 4.5 times better
than public sector banks under study.
In P&SB productivity by net total income per employee was Rs. 0.09
crores during the year 1998-99. This ratio represented an increasing trend
during the study period and reached up to Rs. 0.16 crores. This shows net
increase of Rs. 0.07 crores as compared to the year 1998-99. The average of
this ratio during the study period was Rs. 0.13 crores.
In PNB productivity by net total income per employee was Rs.0.08
crores during the year 1998-99. This ratio represented an increasing trend
during the study period and reached up to Rs. 0.15 crores. This shows net
increase of Rs. 0.07 crores as compared to the year 1998-99. The average of
this ratio during the study period was Rs. 0.11 crores.
In BOB productivity by net total income per employee was Rs. 0.12
crores during the year 1998-99. This ratio represented an increasing trend
during the study period and reached up to Rs. 0.18 crores. This represented
net increases of Rs. 0.06 crores as compared to the year 1998-99. The
average of this ratio during the study period was Rs. 0.15 crores.
In UBI productivity by net total income per employee was Rs. 0.10
crores during the year 1998-99. This ratio represented an increasing trend
during the study period and reached up to Rs. 0.20 crores. This shows net
increase of Rs. 0.10 crores as compared to the year 1998-99. The average of
this ratio during the study period was Rs. 0.15 crores.
In SBI productivity by net total income per employee was Rs. 0.09
crores during the year 1998-99. This ratio represented an increasing trend
during the study period and reached up to Rs. 0.18 crores. This shows net
increase of Rs. 0.09 crores as compared to the year 1998-99. The average of
this ratio during the study Period was Rs. 0.14 crores.
In ICICI Bank Ltd. productivity by net total income per employee was
Rs. 0.71 crores during the year 1998-99. This ratio represented mixed trend
during the study period and reached at the highest level up to Rs. 1.18 crores
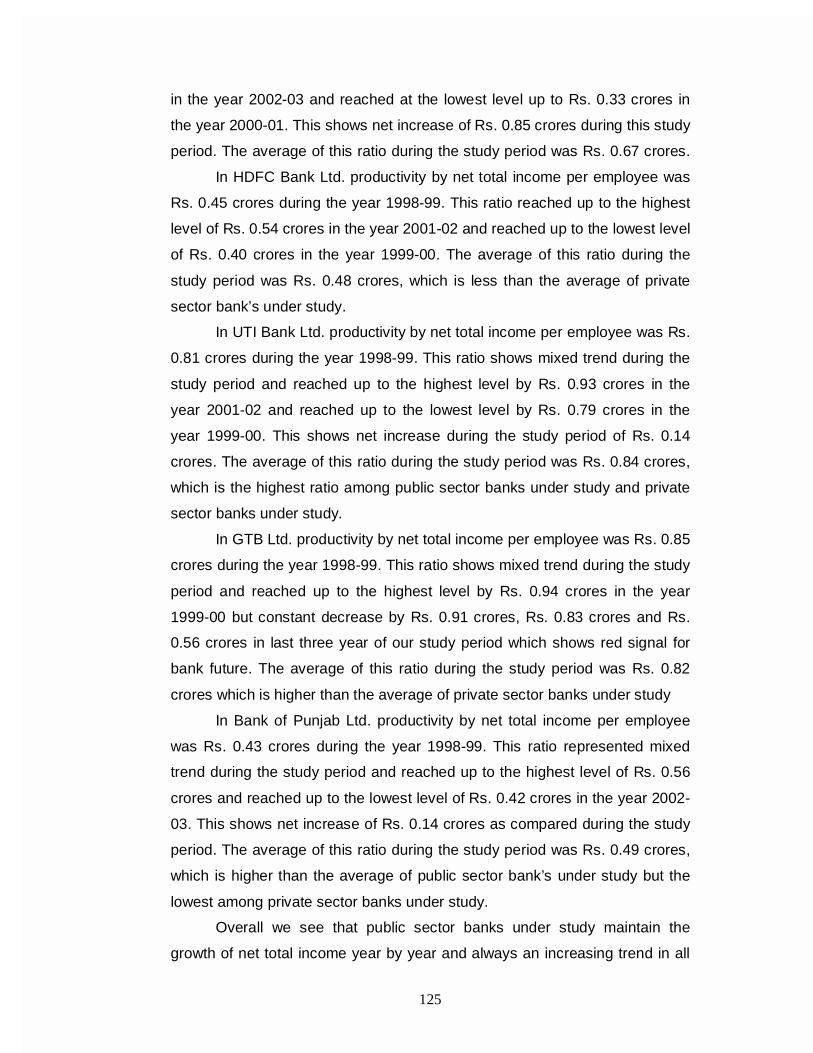
125
in the year 2002-03 and reached at the lowest level up to Rs. 0.33 crores in
the year 2000-01. This shows net increase of Rs. 0.85 crores during this study
period. The average of this ratio during the study period was Rs. 0.67 crores.
In HDFC Bank Ltd. productivity by net total income per employee was
Rs. 0.45 crores during the year 1998-99. This ratio reached up to the highest
level of Rs. 0.54 crores in the year 2001-02 and reached up to the lowest level
of Rs. 0.40 crores in the year 1999-00. The average of this ratio during the
study period was Rs. 0.48 crores, which is less than the average of private
sector bank’s under study.
In UTI Bank Ltd. productivity by net total income per employee was Rs.
0.81 crores during the year 1998-99. This ratio shows mixed trend during the
study period and reached up to the highest level by Rs. 0.93 crores in the
year 2001-02 and reached up to the lowest level by Rs. 0.79 crores in the
year 1999-00. This shows net increase during the study period of Rs. 0.14
crores. The average of this ratio during the study period was Rs. 0.84 crores,
which is the highest ratio among public sector banks under study and private
sector banks under study.
In GTB Ltd. productivity by net total income per employee was Rs. 0.85
crores during the year 1998-99. This ratio shows mixed trend during the study
period and reached up to the highest level by Rs. 0.94 crores in the year
1999-00 but constant decrease by Rs. 0.91 crores, Rs. 0.83 crores and Rs.
0.56 crores in last three year of our study period which shows red signal for
bank future. The average of this ratio during the study period was Rs. 0.82
crores which is higher than the average of private sector banks under study
In Bank of Punjab Ltd. productivity by net total income per employee
was Rs. 0.43 crores during the year 1998-99. This ratio represented mixed
trend during the study period and reached up to the highest level of Rs. 0.56
crores and reached up to the lowest level of Rs. 0.42 crores in the year 2002-
03. This shows net increase of Rs. 0.14 crores as compared during the study
period. The average of this ratio during the study period was Rs. 0.49 crores,
which is higher than the average of public sector bank’s under study but the
lowest among private sector banks under study.
Overall we see that public sector banks under study maintain the
growth of net total income year by year and always an increasing trend in all

126
public sector banks under study. But not possible in private sector bank under
study. The average of net total income per employee for private sector bank
under study shows imbalance between these banks and some bank shows
red signal because of constant decrease in Ratio for net Total Income Per
employee.
F-TEST [ANOVA]:
Trends in Productivity by net total income:
Null Hypothesis (H0):
“There is no significance difference in productivity by net total income
of banks under study.”
Alternative Hypothesis (H1):
“There is a significance difference in productivity by net total income of
banks under study.”
Level of Significance: 5 per cent
Critical Value: 2.5836
Degree of Freedom: 48
Table -3.4A
ANOVA TABLE
Source of
Variation SS df MS F F crit
Between Groups 0.014358 4 0.003589 0.033659 2.583668
Within Groups 4.692242 44 0.106642
Total 4.7066 48

127
It is clear from table No.3.4A that the calculated value of ‘F’ was 0.033659,
which is lower than table value of ‘F’ (2.5836). So, null hypothesis is accepted
and alternative hypothesis is rejected. So, it can be concluded that there is no
any difference in productivity of banks by net total income.
V) Productivity Ratio per employee by Net Profit: -
This ratio indicates profit per employee, which is main indicator for
productivity. This ratio shows how efficiently employee working in the market.
The following formula has been adopted for productivity by net profit.
Net Profit Formula : Productivity by Net profit =
No. of employee

128
Table No. 3.5 Trends in productivity by Net Profit
(Rs. in Crore per employee)
Year
Name of Bank
Under study unit
1998-99 1999-00 2000-01 2001-02 2002-03 Average
Public Sector Bank
Punjab & Sind Bank 0.005 0.005 0.001 0.002 0.001 0.003
Punjab National Bank 0.006 0.006 0.008 0.010 0.014 0.009
Bank of Baroda 0.009 0.011 0.006 0.014 0.019 0.012
Union Bank of India 0.005 0.003 0.006 0.012 0.022 0.010
State Bank of India 0.004 0.009 0.007 0.012 0.015 0.009
Average 0.006 0.007 0.006 0.010 0.014 0.009
Private Sector Bank
ICICI Bank Ltd. 0.070 0.080 0.040 0.030 0.110 0.066
HDFC Bank Ltd. 0.080 0.060 0.080 0.080 -NA- 0.075
UTI Bank Ltd. 0.060 0.070 0.070 0.080 0.080 0.072
Global Trust Bank Ltd. 0.090 0.120 0.070 0.030 Loss 0.078
Bank of Punjab Ltd. 0.060 0.060 0.050 0.040 0.030 0.048
Average 0.072 0.078 0.062 0.052 0.073 0.068
(Source: Computed from Data Collected from IBA Bulletin – Mar. –03 & Jan.-04)
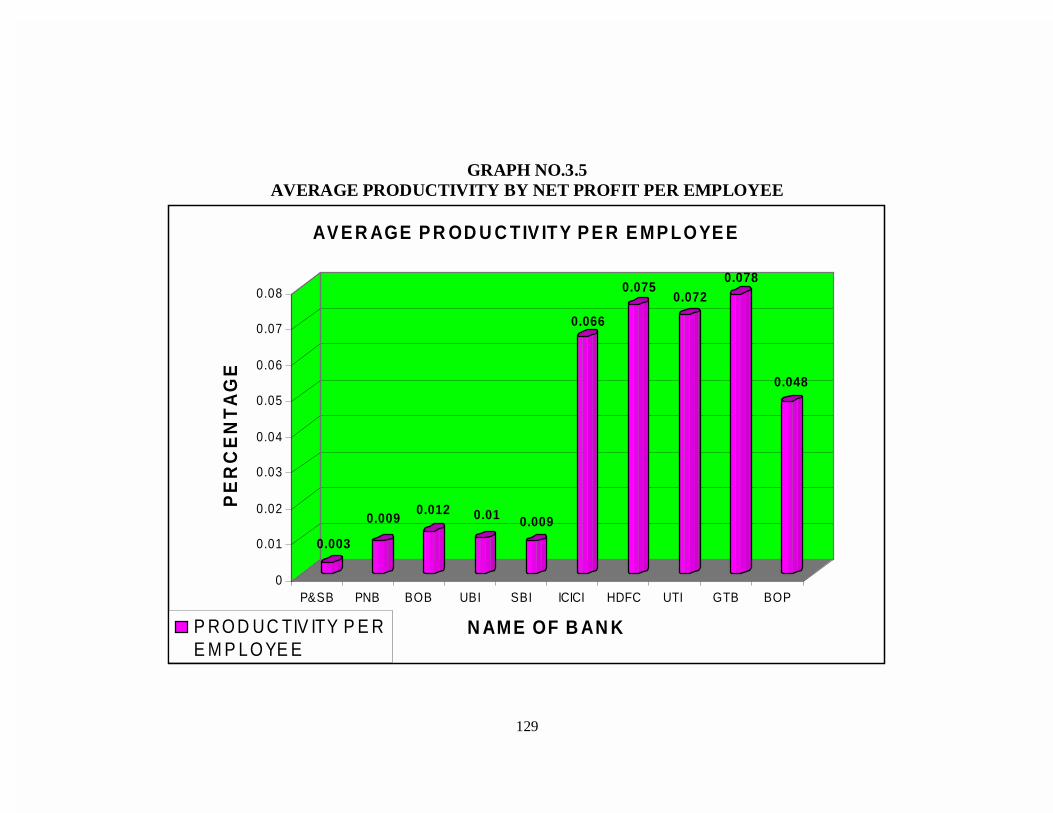
129
GRAPH NO.3.5 AVERAGE PRODUCTIVITY BY NET PROFIT PER EMPLOYEE
0.003
0.0090.012 0.01 0.009
0.066
0.0750.072
0.078
0.048
0
0.01
0.02
0.03
0.04
0.05
0.06
0.07
0.08
PE
RC
EN
TA
GE
P&SB PNB BOB UBI SBI ICICI HDFC UTI GTB BOP
N AME OF B AN K
AV E R AGE P R OD U C TIV ITY P E R E MP LOYE E
P RO D UC TIV ITY P E RE M P LO YE E

130
Net profit per employee’s ratio provides the relationship between the
number of employee and net profit. This calculation also provides the average
net profit by year wise per employee and bank wise also which can easily
compare with other banks under study.
In P&SB productivity by net profit per employee was Rs. 0.005 crores
during the year 1998-99. This ratio represented mixed trend during the study
period and reached up to the lowest level of Rs. 0.001 crores in the year
2002-03. This shows net decrease of Rs. 0.004 as compared to the year
1998-99. This is a red signal because profit per employee goes down
constantly is very serious nowadays. The average of this ratio during the
study period was Rs. 0.003 crores.
In PNB productivity by net profit per employee was Rs. 0.006 crores
during the year 1998-99. This ratio represented an increasing trend during the
study period and reached up to Rs. 0.014 crores. This shows net increase of
Rs. 0.008 crores as compared to the year 1998-99. The average of this ratio
during the study period was Rs. 0.009 crores, which is equal to the average of
public sector banks under study.
In BOB productivity by net profit per employee was Rs. 0.009 crores
during the year 1998-99. This ratio represented an increasing trend except the
year 2000-01 during the study period and reached up to Rs. 0.019 crores.
This shows net increase of Rs. 0.10 crores as compared to the year 2000-01.
The average of this ratio during the study period was Rs. 0.012 crores, which
is more than the average of public sector banks under study.
In UBI productivity by net profit per employee was Rs. 0.005 crores
during the year 1998-99. This ratio registered mixed trend during the study
period and reached up to the highest level of Rs. 0.022 crores in the year
2002-03 which is the highest in all public sector banks under study average
and reached up to the lowest level of Rs. 0.003 crores in the year 1999-00.
This registered net increase of Rs. 0.019 crores during the study period. The
average of this ratio during the study period was Rs. 0.010 crores.
In SBI productivity by net profit per employee was Rs. 0.004 crores
during the year 1998-99. This ratio shows mixed trend during the study period
and reached up to the highest level of Rs. 0.15 crores in the year 2002-03.
This represented net increase of Rs. 0.011 crores as compared to the year

131
1998-99. The average of this ratio during the study period was Rs. 0.009
crores.
In ICICI Bank Ltd. productivity by net profit per employee was Rs.
0.070 crores during the year 1998-99. This ratio represented mixed trend
during the study period and reached up to the lowest level of Rs. 0.030 crores
in the year 2001-02 and reached up to the highest level of Rs.0.011 crores
which is the highest in all public sector banks under study and private sector
banks under study. The average of this ratio during the study period was
Rs.0.066 crores.
In HDFC Bank Ltd. productivity by net profit per employee was
Rs.0.080 crores during the year 1998-99. This ratio shows mixed trend during
the study period and reached up to the lowest level at Rs.0.060 crores in
1999-00 and reached up to the highest level at Rs.0.080 in the year 2000-01
and 2001-02 both year. The average of this ratio during the study period was
Rs.0.075 crores, which is higher than the average of private sector banks
under study and public sector banks under study.
In UTI Bank Ltd. productivity by net profit per employee was Rs.0.060
crores during the year 1998-99. This ratio registered an increasing trend
during the study period and reached up to Rs.0.080 crores in the year 2002-
03. This registered net increase of Rs.0.020 crores as compared to the year
1998-99. The average of this ratio during the study period was Rs.0.072
crores.
In GTB Ltd. productivity by net profit per employee was Rs.0.090
crores during the year 1998-99. This ratio represented mixed trend during the
study period and reached up to the highest level Rs.0.120 crores in the year
1999-00 and reached up to the lowest level at Rs.0.030 crores in the year
2001-02. This bank made heavy loss in the year 2002-03. So that we are not
able to makes this ratio positively in this year. For the last three years this
banks ratio had constantly decreased by Rs.0.120 crores, Rs.0.070 crores
and Rs.0.030 crores in the year 1999-00, 2000-01 and 2001-02 year
respectively. This is red signal for future of the bank. The average of this ratio
during the study period was Rs.0.078 crores, which is the highest over all
banks under study.
132
In Bank of Punjab Ltd. productivity by net profit per employee was
Rs.0.060 crores during the year 1998-99. This ratio shows decreasing trend
during the study period and reached up to Rs.0.030 crores. This shows net
decrease of Rs.0.030 crores as compared to the year 1998-99. The average
of this ratio during the study period was Rs.0.048 crores.
Overall it can be seen that public sector banks under study maintain
the growth of net total except Punjab and Sind Bank year-by-year, but not
possible in private sector banks under study. Some of banks are in
decreasing trend and show high ups and downs in net profit. The Global Trust
Bank Ltd had the highest productivity net profit ratio in the year 1999-00 but
this result turn into heavy loss in the year 2002-03, which does not show a
good picture for the years to come.
3.5 ANALYSIS OF PROFITABILITY:
An appraisal of operating efficiency and effectiveness is a pre requisite
for some bank managements. An operational efficiency is the result of sound
financial management. 6 The efficiency and productivity of a bank is assessed
more in terms of its profits than anything else. The operational profitability of
any bank is fundamentally affected by various key factors Rs. The goal of
financial sector reforms is improving profitability by ameliorating efficiency and
productivity.
Analytical framework:
The framework adopted for the aim of analysis is purely based on the
income and expenditure statement of banks. Profit is a difference between
income and expenditure. There is a clear-cut relationship between income
and expenditure.7 Therefore this definite relationship needs to be carefully
analysed to derive their relative impact on profitability. At this juncture, it is
important to mention the assumptions of the analytical framework.
The interest earned is the return of funds lent and interest paid is the
cost of funds, establishment and all other expenses of a bank are incurred in
order to provide services to customers for services the bank charges for them
separately or it provides free services.8
Let us see Income and Expenditure flows by chart.

133
Table No. 3.6
Income and Expenditure flow
Part Expenditure Income Difference
1. K = Interest Paid R = Interest Earned S = SPREAD
S = R-K
2. M = Establishment C = Non Interest B = BURDEN
Expenses Income B = M+O-C
O = Other Expenses
M+O = Non Interest
Expenses
3. E = Total Expenses I = Total Income P = Profit
P = S-B
P = I-E
The important elements in income and expenditure statement of a bank
and their relationship are presented in above table. Here non-interest
expenses include manpower expenses and other expenses including
provision.
Manpower expenses are affected by salary structure, number of
employees, seniority, composition of employees, wage agreements,
recruitment, promotions and placement policies of bank. Other expenses that
are effected by nature and volume of business, system and procidure of
banks and which themselves are affected by quality of expenditure – decision,
budgeting and cost control technique followed by banks, plus provisions for
NPA and Taxes are included.9
Let us see factors affecting bank profitability
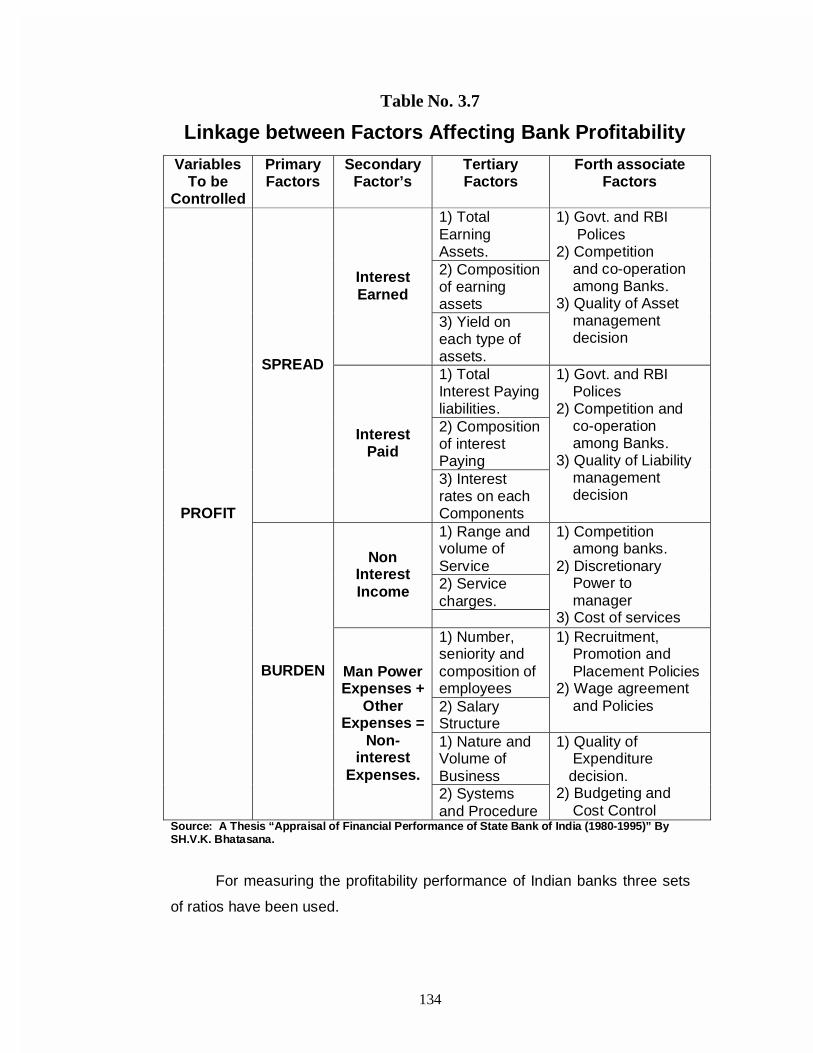
134
Table No. 3.7
Linkage between Factors Affecting Bank Profitability
Variables To be
Controlled
Primary Factors
Secondary Factor’s
Tertiary Factors
Forth associate Factors
1) Total Earning Assets. 2) Composition of earning assets
Interest Earned
3) Yield on each type of assets.
1) Govt. and RBI Polices 2) Competition and co-operation among Banks. 3) Quality of Asset management decision
1) Total Interest Paying liabilities. 2) Composition of interest Paying
SPREAD
Interest Paid
3) Interest rates on each Components
1) Govt. and RBI Polices 2) Competition and co-operation among Banks. 3) Quality of Liability management decision
1) Range and volume of Service 2) Service charges.
Non Interest Income
1) Competition among banks. 2) Discretionary Power to manager 3) Cost of services
1) Number, seniority and composition of employees 2) Salary Structure
1) Recruitment, Promotion and Placement Policies 2) Wage agreement and Policies
1) Nature and Volume of Business
PROFIT
BURDEN Man Power Expenses +
Other Expenses =
Non-interest
Expenses. 2) Systems and Procedure
1) Quality of Expenditure decision. 2) Budgeting and Cost Control
Source: A Thesis “Appraisal of Financial Performance of State Bank of India (1980-1995)” By SH.V.K. Bhatasana.
For measuring the profitability performance of Indian banks three sets
of ratios have been used.

135
(i) Spread Ratio
(ii) Burden Ratio
(iii) Profitability Ratio
(i) SPREAD RATIO:
Spread is the difference between interest earned and interest paid by
the bank. It is difference between the income earned by deployment of funds
and the cost of funds. Spread plays an important role in determining the
profitability of banks. It is the amount available to the banks for meeting their
administrative, operating and miscellaneous expenses. Generally every bank
tries to increase spread volume, so that spread is more enough available to
meet the non-interest expenses and remining part contributes to the profit.
The profitability performance of banks is analysed through analysis of spread.
The three spread ratios are as under.
(a) Interest earned as percentage of working funds.
(b) Interest paid as percentage of working funds.
(c) Spread as percentage of working funds.
(ii) BURDEN RATIO:
Burden means the difference between non-interest expenditure and
non-interest income of a bank. Burden represents the amounts of non-interest
expenditure, which is not covered by non-interest income of a bank. Burden is
the combination of establishment expenditure and other expenses of banks
minus other incomes (Consisting of commission, exchange, brokerage and
other miscellaneous receipts). It means that burden represents non-interest
expenditure not covered by non-interest income. Profit may also be defined as
the difference between spread and burden. Hence higher the burdens of
commercial banks lower the profitability. The burden ratios being employed to
study the profitability of banks under study are:
(a) Non-interest expenditure as percentage of working funds.
(b) Non-interest or other income as percentage of working funds.
(c) Burden as percentage of working funds.
(iii) PROFITABILITY RATIO:
Profitability ratios are the most important and appropriate indicators for
the evaluation of the financial performance of a bank. Profitability ratios serve

136
as an important measure for measurement of the efficiency with which the
operations of the banks are going on. Poor operational performance may
indicate poor profits. A lower profitability may be due to lack of control over
expenses. The analysis of profitability ratio is very useful; to management for
the ultimate success of the bank, to share holders for regular and adequate
returns and the growth of bank and to creditors for repayment of their debt
and solvency of the bank. The main profitability ratios to be employed in the
present study are profit as percentage of working funds.
EMPIRICAL ANALYSIS: -
In this section data collected for the present study in respect of all
selected bank unit is analysed with the help of analytical framework
mentioned earlier.
The following equation is used for present study: -
P = (S – B) or P = [(R – K) – (M + O) - (C)]
Where P = Profit
R = Total Interest earned
K = Total Interest Paid
S = Spread
M = Total Man power or Establishment expenses
O = Total other expenses
C = Total non-interest or other income
B = Burden
If we divide both the sides of the above equation by common
denominator W (here W means working funds) we get the following equation
in a new form:-
[ ] [ ] [ ][ ]WC
WO
WM
WK
WR
WP −+−−=
Using small letters to represent relative quantities.
We get
P = (r – k) – [(m + o) – (c)]
Above equation indicates that:
(1) Interest Earned ratio “r” = Total Interest Earned ÷ Working funds
(2) Interest Paid ratio “K” = Total Interest paid ÷ Working funds

137
(3) Establishment expenses ratio “m” = Total establishment expenses ÷
Working funds
(4) Other expenses ratio “O” = Other expenses ÷ Working funds
(5) Other Income ratio “C” = Non – Interest Income ÷ Working funds
(6) Profitability Ratio “P” = Profit ÷ Working funds
Thus, Bank profitability can be improved either in any one or all of the
following ways.
(A) Increase the magnitude of spread ratio by increasing interest earned
ratio greater than interest paid ratio with the help of efficiency fund
management.
(B) Lowering the burden ratio by decreasing magnitude of manpower or
establishment expenses, other expenses and increasing the magnitude
of other income (with the help of efficiency of man power, efficiency of
customer services and efficient general bank management).
For increasing profitability, a bank has to increase spread ratio and
decrease the burden ratio increasing the magnitude of spread can be
achieved by increasing interest earned ratio greater than interest paid ratio.
Decreasing the burden ration can be achieved by decreasing establishment
expenses ratio, other expenses ratio and increasing other income ratio.
3.6 ANALYSIS AND INTERPRETATION OF SPREAD – BURDEN AND PROFITABILITY OF SELECTED UNIT UNDER STUDY:
(A) PUBLIC SECTOR BANK
(I) PUNJAB AND SIND BANK:
The analysis and interpretations of spread burden and profitability of
Punjab and Sind Bank has been disclosed in the following table no. 3.8.
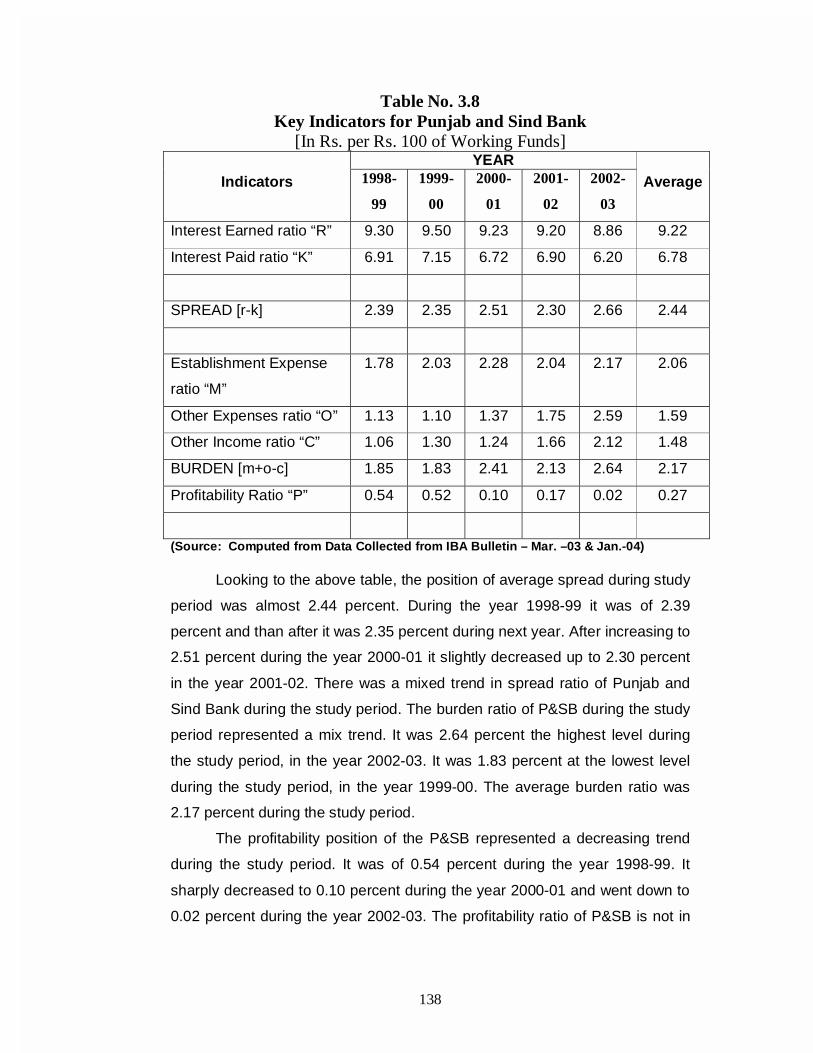
138
Table No. 3.8 Key Indicators for Punjab and Sind Bank
[In Rs. per Rs. 100 of Working Funds] YEAR
Indicators 1998-
99
1999-
00
2000-
01
2001-
02
2002-
03
Average
Interest Earned ratio “R” 9.30 9.50 9.23 9.20 8.86 9.22
Interest Paid ratio “K” 6.91 7.15 6.72 6.90 6.20 6.78
SPREAD [r-k] 2.39 2.35 2.51 2.30 2.66 2.44
Establishment Expense
ratio “M”
1.78 2.03 2.28 2.04 2.17 2.06
Other Expenses ratio “O” 1.13 1.10 1.37 1.75 2.59 1.59
Other Income ratio “C” 1.06 1.30 1.24 1.66 2.12 1.48
BURDEN [m+o-c] 1.85 1.83 2.41 2.13 2.64 2.17
Profitability Ratio “P” 0.54 0.52 0.10 0.17 0.02 0.27
(Source: Computed from Data Collected from IBA Bulletin – Mar. –03 & Jan.-04)
Looking to the above table, the position of average spread during study
period was almost 2.44 percent. During the year 1998-99 it was of 2.39
percent and than after it was 2.35 percent during next year. After increasing to
2.51 percent during the year 2000-01 it slightly decreased up to 2.30 percent
in the year 2001-02. There was a mixed trend in spread ratio of Punjab and
Sind Bank during the study period. The burden ratio of P&SB during the study
period represented a mix trend. It was 2.64 percent the highest level during
the study period, in the year 2002-03. It was 1.83 percent at the lowest level
during the study period, in the year 1999-00. The average burden ratio was
2.17 percent during the study period.
The profitability position of the P&SB represented a decreasing trend
during the study period. It was of 0.54 percent during the year 1998-99. It
sharply decreased to 0.10 percent during the year 2000-01 and went down to
0.02 percent during the year 2002-03. The profitability ratio of P&SB is not in

139
a good position as per this indicator. This is because of continuous increase in
the other expenses and establishment expenses throughout the study period.
The Punjab and Sind Bank had to increase the magnitude of spread
ratio by increasing interest earned ratio greater than interest paid ratio with
the help of fund management.
(II) PUNJAB NATIONAL BANK: The analysis and interpretation of spread, burden and profitability of
Punjab National bank has been disclosed in the following table no. 3.9.
Table No. - 3.9 Key indicators for Punjab National Bank
[In Rs. per Rs. 100 of Working Funds] YEAR
INDICATORS 1998-
99
1999-
00
2000-
01
2001-
02
2002-
03
AVERAGE
Interest Earned Ratio “R” 9.60 9.52 9.23 9.12 8.68 9.23
Interest Paid Ratio “K” 6.03 6.64 6.02 5.97 5.06 5.92
SPREAD [r-k] 3.57 2.98 3.21 3.15 3.62 3.31
Establishment Expense
Ratio “M”
2.31 2.19 2.30 1.80 1.71 2.06
Other Expenses Ratio “O” 1.63 1.39 1.41 1.91 2.39 1.75
Other Income Ratio “C” 1.18 1.35 1.22 1.34 1.45 1.31
BURDEN [m+o-c] 2.76 2.23 2.49 2.37 2.65 2.50
Profitability Ratio “P” 0.81 0.75 0.72 0.78 0.97 0.81
(Source: Computed from Data Collected from IBA Bulletin – Mar. –03 & Jan.-04)
Looking to the above computed data of PNB, the position of spread
was almost around 3.15 percent during the study period except in the year
1999-00. Interest earned ratio of PNB represented decreasing trend during
the study period. But Interest paid ratio of PNB showed mixed trend during the
study period. The spread ratio of PNB was 3.57 percent during the year 1998-
99 and than after it was 2.98 percent in next year. The average of spread
during the study period was 3.31 percent.

140
The burden ratio of PNB during the study period represented mix trend. It was
2.76 percent at the highest level during the study period in the year 1998-99
and at the lowest level during the study period at 2.23 percent in the year
1999-00. The average of this ratio was 2.50 percent during the study period.
The profitability position of the PNB registered an increasing trend during the
last three year of the study period. It was of 0.81 percent during the year
1998-99. It slightly decreased to 0.75 percent during the year 1999-00. But
after the year 2000-01, it showed an increasing trend by 0.72 percent, 0.78
percent and 0.97 percent during the last three year. The average of this ratio
was of 0.81 percent during the study period.
(III) BANK OF BARODA: -
The analysis and interpretation of spread burden and profitability of
Bank of Baroda has been disclosed in to the following table no. 3.10.
Table No. 3.10 Key indicators for Bank of Baroda
[In Rs. per Rs. 100 of Working Funds] YEAR
INDICATORS 1998-99
1999-00
2000-01
2001-02
2002-03
AVERAGE
Interest Earned Ratio “R” 9.23 8.83 9.09 8.40 7.98 8.71 Interest Paid Ratio “K” 6.22 5.98 6.03 5.75 5.23 5.84 SPREAD [r-k] 3.01 2.85 3.06 2.65 2.75 2.87 Establishment Expense Ratio “M”
1.62 1.53 1.81 1.49 1.48 1.59
Other Expenses Ratio “O” 1.70 1.63 1.93 1.79 1.91 1.79 Other Income Ratio “C” 1.11 1.17 1.12 1.40 1.65 1.29 BURDEN [m+o-c] 2.21 1.99 2.62 1.88 1.74 2.09 Profitability Ratio “P” 0.80 0.86 0.44 0.77 1.01 0.78 (Source: Computed from Data Collected from IBA Bulletin – Mar. –03 & Jan.-04)
Looking to the above table the position of spread during the study
period was 2.65 percent and above. During the year 1998-99 it was of 3.01
percent and than after it was 2.85 percent during next year. The average of
spread during the study period was of 2.87 percent. During the year 1998-99
and 2000-01 it crossed the level of 3.00 percent but during the year 1999-00,
2001-02 and 2002-03 was under the average level of spread ratio.

141
The burden ratio of BOB during the study period represented mix trend.
It was 2.66 percent at the highest level during the study period in the year
2000-01. It was 1.74 percent at the lowest level during the study period in the
year 2002-03. The average of burden ratio was 2.09 percent during the study
period.
The profitability position of the BOB showed an increasing trend during
the last three years of the study period. It was 0.44 percent at the lowest level
during the study period in the year 2000-01. It was 1.01 percent at the highest
level during the study period in the year 2002-03. The average of this ratio
was of 0.78 percent during the study period. Increasing trend during the last
three year in profitability ratio is good sign for better future for BOB.
(IV) UNION BANK OF INDIA:
The analysis and interpretation of spread burden and profitability of
Union Bank of India has been disclosed in the following table no. 3.11.
Table No. 3.11 Key indicators for Union Bank of India
[In Rs. per Rs. 100 of Working Funds] YEAR
INDICATORS 1998-99
1999-00
2000-01
2001-02
2002-03
AVERAGE
Interest Earned Ratio “R” 9.19 9.47 9.58 9.05 8.43 9.14 Interest Paid Ratio “K” 6.52 6.73 6.45 6.04 5.50 6.25 SPREAD [r-k] 2.67 2.74 3.13 3.01 2.93 2.89 Establishment Expense Ratio “M”
1.65 1.75 1.94 1.55 1.35 1.65
Other Expenses Ratio “O” 1.35 1.55 1.59 1.88 2.12 1.70 Other Income Ratio “C” 0.84 0.85 0.80 1.12 1.62 1.05 BURDEN [m+o-c] 2.16 2.45 2.73 2.31 1.85 2.30 Profitability Ratio “P” 0.51 0.29 0.40 0.70 1.08 0.59 (Source: Computed from Data Collected from IBA Bulletin – Mar. –03 & Jan.-04) Looking to the above table the position of spread was 2.67 percent during the
year 1998-99. It was of 2.67 percent and than after it was of 2.74 percent and
3.13 percent during the year 1999-00 and 2000-01 respectively. The spread
ratio of UBI represented mixed trend during the study period. The average of
spread during the study period was of 2.89 percent. The burden ratio of UBI
during the study period represented mix trend. It was of 2.16 percent during

142
the year 1998-99 and it increased to 2.45 percent during the year 1999-00
and also it increased to 2.73 percent during the year 2000-01. The ratio
decline for the next two-year and it went dawn to 1.85 percent during the year
2002-03. The average of this ratio was 2.30 percent during the study period.
The profitability position of UBI showed an increasing trend during the
last four years of the study period. It was of 0.51 percent during the year
1998-99. It sharply decreased to 0.29 percent during the year 1999-00. The
ratio after declining to 0.29 percent during the year 1999-00 registered an
increasing trend during next three year and reached at the highest level of
1.08 percent during the year 2002-03. The average of this ratio was of 0.59
percent during the study period. (V) STATE BANK OF INDIA:
The analysis and interpretation of spread, burden and profitability of
State Bank of India has been disclosed in the following table no. 3.12.
Table No. - 3.12 Key indicators for State Bank of India [In Rs. per Rs. 100 of Working Funds]
YEAR INDICATORS 1998-
99 1999-
00 2000-
01 2001-
02 2002-
03 AVERAGE
Interest Earned Ratio “R” 8.59 8.49 8.28 8.56 8.27 8.44 Interest Paid Ratio “K” 5.86 5.84 5.63 5.95 5.62 5.78 SPREAD [r-k] 2.73 2.65 2.65 2.61 2.65 2.66 Establishment Expense Ratio “M”
1.86 1.71 1.90 1.48 1.51 1.69
Other Expenses Ratio “O” 1.88 1.52 1.47 1.63 1.84 1.67 Other Income Ratio “C” 1.48 1.37 1.23 1.20 1.53 1.36 BURDEN [M+O-C] 2.26 1.86 2.14 1.91 1.82 2.00 Profitability Ratio “P” 0.47 0.79 0.51 0.70 0.83 0.66 (Source: Computed from Data Collected from IBA Bulletin – Mar. –03 & Jan.-04)
Looking to the above table the position of spread during the study
period was almost around 2.6 percent. During the year 1998-99 it was of 2.73
percent and than after it was of 2.65 percent during next year. After
decreasing to 2.61 percent during the year 2000-01 it slightly increased to
2.65 percent during the year 2002-03. The average of spread during the study
period was of 2.66 percent.
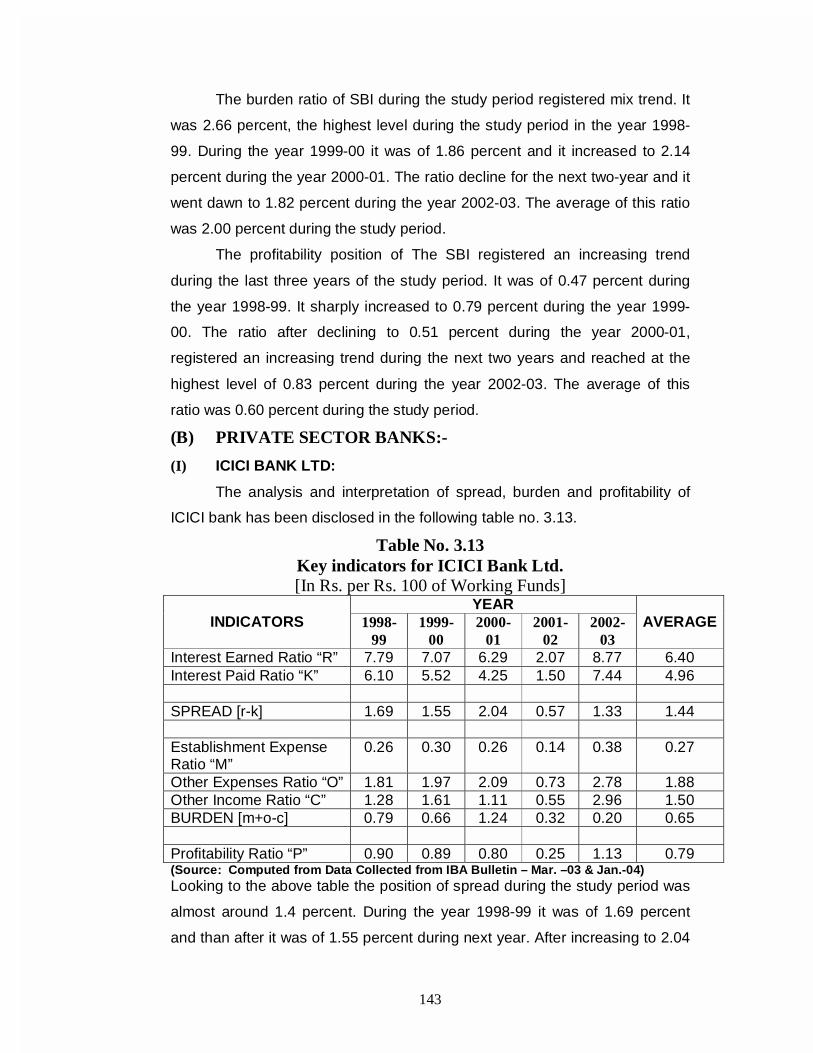
143
The burden ratio of SBI during the study period registered mix trend. It
was 2.66 percent, the highest level during the study period in the year 1998-
99. During the year 1999-00 it was of 1.86 percent and it increased to 2.14
percent during the year 2000-01. The ratio decline for the next two-year and it
went dawn to 1.82 percent during the year 2002-03. The average of this ratio
was 2.00 percent during the study period.
The profitability position of The SBI registered an increasing trend
during the last three years of the study period. It was of 0.47 percent during
the year 1998-99. It sharply increased to 0.79 percent during the year 1999-
00. The ratio after declining to 0.51 percent during the year 2000-01,
registered an increasing trend during the next two years and reached at the
highest level of 0.83 percent during the year 2002-03. The average of this
ratio was 0.60 percent during the study period. (B) PRIVATE SECTOR BANKS:-
(I) ICICI BANK LTD:
The analysis and interpretation of spread, burden and profitability of
ICICI bank has been disclosed in the following table no. 3.13.
Table No. 3.13 Key indicators for ICICI Bank Ltd. [In Rs. per Rs. 100 of Working Funds]
YEAR INDICATORS 1998-
99 1999-
00 2000-
01 2001-
02 2002-
03 AVERAGE
Interest Earned Ratio “R” 7.79 7.07 6.29 2.07 8.77 6.40 Interest Paid Ratio “K” 6.10 5.52 4.25 1.50 7.44 4.96 SPREAD [r-k] 1.69 1.55 2.04 0.57 1.33 1.44 Establishment Expense Ratio “M”
0.26 0.30 0.26 0.14 0.38 0.27
Other Expenses Ratio “O” 1.81 1.97 2.09 0.73 2.78 1.88 Other Income Ratio “C” 1.28 1.61 1.11 0.55 2.96 1.50 BURDEN [m+o-c] 0.79 0.66 1.24 0.32 0.20 0.65 Profitability Ratio “P” 0.90 0.89 0.80 0.25 1.13 0.79 (Source: Computed from Data Collected from IBA Bulletin – Mar. –03 & Jan.-04) Looking to the above table the position of spread during the study period was
almost around 1.4 percent. During the year 1998-99 it was of 1.69 percent
and than after it was of 1.55 percent during next year. After increasing to 2.04

144
percent during the year 2000-01 it sharply decreased to 0.57 percent during
2001-02. The average of spread during the study period was of 1.44 percent.
The burden ratio of ICICI Bank during the study period represented mix
trend. It was of 1.24 percent at the highest level during the study period in the
year 2000-01. It was of 0.20 percent at the lowest level during the study
period in the year 2002-03. The average of the ratio was 0.65 percent during
the study period. The profitability position of the ICICI Bank represented
mixed trend during the study period. It was of 0.25 percent at the lowest level
during the study period in the year 2001-02. It was of 1.13 percent at the
highest level during the study period in the year 2002-03. The average of
profitability ratio with working fund during the study period was of 0.79
percent. During the year 2001-02 it was 8 times increased in working funds
and this is effected in profitability ratio during the year 2001-02. The
profitability ratio of ICICI Bank is in good position among all banks under
study.
(II) HDFC BANK LTD.:
The analysis and interpretation of spread, burden and profitability of
HDFC Bank Ltd. has been disclosed in the following table no. 3.14.
Table No. 3.14 Key Indicators for HDFC Bank Ltd. [In Rs. per Rs. 100 of Working Funds]
YEAR INDICATORS 1998-
99 1999-
00 2000-
01 2001-
02 2002-
03 AVARAGE
Interest Earned Ratio “R” 8.64 5.80 8.06 7.16 6.65 7.26 Interest Paid Ratio “K” 5.26 3.19 4.83 4.52 3.92 4.34 SPREAD [r-k] 3.38 2.61 3.23 2.64 2.73 2.92 Establishment Expense Ratio “M”
0.51 0.42 0.50 0.46 0.50 0.48
Other Expenses Ratio “O” 2.55 2.24 2.59 2.34 2.51 2.45 Other Income Ratio “C” 1.56 1.07 1.19 1.40 1.55 1.35 BURDEN [m+o-c] 1.50 1.59 1.90 1.40 1.46 1.58 Profitability Ratio “P” 1.88 1.02 1.33 1.24 1.27 1.34 (Source: Computed from Data Collected from IBA Bulletin – Mar. –03 & Jan.-04) Looking to the above table the position of spread was almost around
2.80 percent during the study period. During the year 1998-99 it was of 3.38
percent the highest level, within this study period. The spread ratio of HDFC
bank represented mix trend during the study period. The average of this ratio

145
was 2.92 percent during the study period. The burden ratio of HDFC Bank
Ltd. during the study period registered mix trend. It was of 1.50 percent during
the year 1998-99 and it slightly increased to 1.59 percent during next year but
reached at the highest level of 1.90 percent in the year 2000-01. During the
year 2001-02 this ratio sharply declined to 1.40 percent, which was the lowest
during the study period. The average of this ratio was 1.58 percent during the
study period.
The profitability position of HDFC Bank Ltd. represented mixed trend
during the study period. It was of 1.88 percent during 1998-99. It sharply
decreased to 1.02 percent during the year 1999-00, which was the lowest
during the study period. The average of this ratio was of 1.34 percent during
the study period. The HDFC Bank maintained good profitability ratio during
the study period. (III) UTI BANK LTD.:
The analysis and interpretation of spread, burden and profitability of
UTI Bank Ltd. has been disclosed in the following table no. 3.15.
Table No. 3.15 Key indicators for UTI Bank Ltd.
[In Rs. per Rs. 100 of Working Funds] YEAR
INDICATORS 1998-99
1999-00
2000-01
2001-02
2002-03
AVERAGE
Interest Earned Ratio “R” 9.53 7.24 8.27 8.21 7.47 8.15 Interest Paid Ratio “K” 7.69 5.89 7.35 6.82 5.82 6.72 SPREAD [r-k] 1.84 1.35 0.92 1.39 1.65 1.43 Establishment Expense Ratio “M”
0.31 0.23 0.27 0.35 0.43 0.32
Other Expenses Ratio “O” 1.94 1.72 1.36 3.01 2.33 2.07 Other Income Ratio “C” 1.20 1.36 1.51 2.89 2.09 1.81 BURDEN [m+o-c] 1.05 0.59 0.12 0.47 0.67 0.58 Profitability Ratio “P” 0.79 0.76 0.80 0.92 0.98 0.85 (Source: Computed from Data Collected from IBA Bulletin – Mar. –03 & Jan.-04)
Looking to the above table the position of spread of the UTI Bank Ltd.
was almost above 1.00 percent except in the year 2000-01 during the study
period. During the year 1998-99 it was of 1.84 percent, which was at the
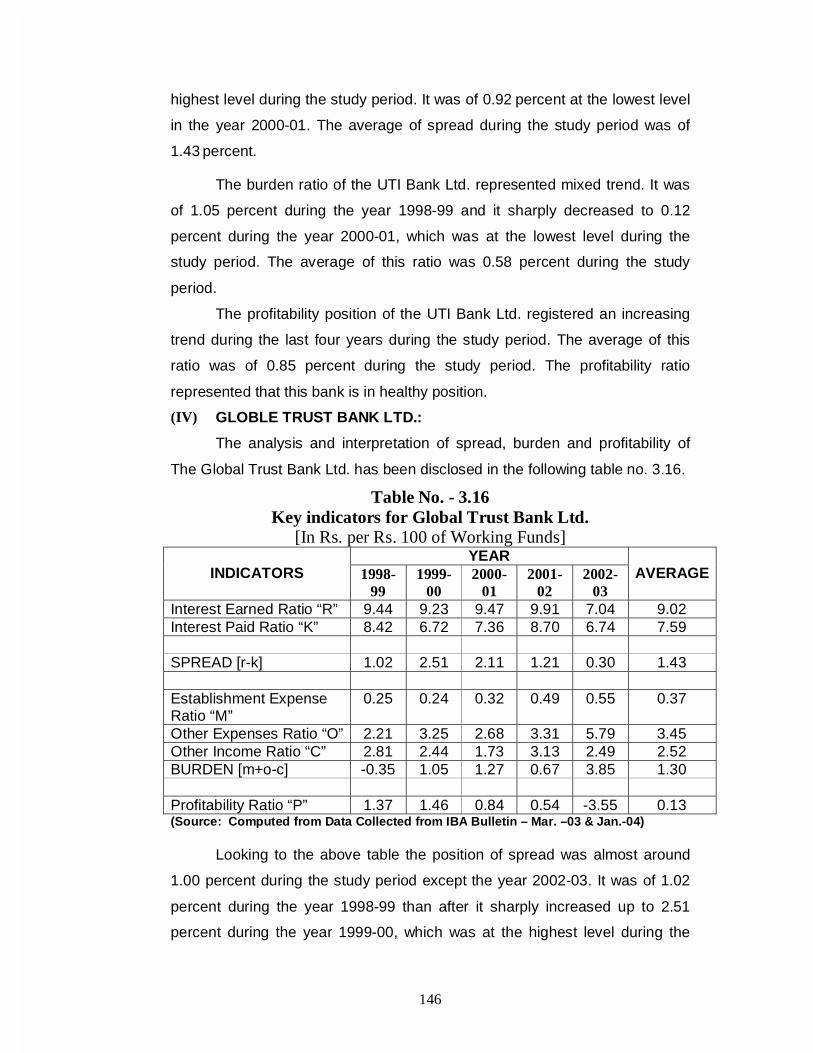
146
highest level during the study period. It was of 0.92 percent at the lowest level
in the year 2000-01. The average of spread during the study period was of
1.43 percent.
The burden ratio of the UTI Bank Ltd. represented mixed trend. It was
of 1.05 percent during the year 1998-99 and it sharply decreased to 0.12
percent during the year 2000-01, which was at the lowest level during the
study period. The average of this ratio was 0.58 percent during the study
period.
The profitability position of the UTI Bank Ltd. registered an increasing
trend during the last four years during the study period. The average of this
ratio was of 0.85 percent during the study period. The profitability ratio
represented that this bank is in healthy position.
(IV) GLOBLE TRUST BANK LTD.: The analysis and interpretation of spread, burden and profitability of
The Global Trust Bank Ltd. has been disclosed in the following table no. 3.16.
Table No. - 3.16 Key indicators for Global Trust Bank Ltd.
[In Rs. per Rs. 100 of Working Funds] YEAR
INDICATORS 1998-99
1999-00
2000-01
2001-02
2002-03
AVERAGE
Interest Earned Ratio “R” 9.44 9.23 9.47 9.91 7.04 9.02 Interest Paid Ratio “K” 8.42 6.72 7.36 8.70 6.74 7.59 SPREAD [r-k] 1.02 2.51 2.11 1.21 0.30 1.43 Establishment Expense Ratio “M”
0.25 0.24 0.32 0.49 0.55 0.37
Other Expenses Ratio “O” 2.21 3.25 2.68 3.31 5.79 3.45 Other Income Ratio “C” 2.81 2.44 1.73 3.13 2.49 2.52 BURDEN [m+o-c] -0.35 1.05 1.27 0.67 3.85 1.30 Profitability Ratio “P” 1.37 1.46 0.84 0.54 -3.55 0.13 (Source: Computed from Data Collected from IBA Bulletin – Mar. –03 & Jan.-04) Looking to the above table the position of spread was almost around
1.00 percent during the study period except the year 2002-03. It was of 1.02
percent during the year 1998-99 than after it sharply increased up to 2.51
percent during the year 1999-00, which was at the highest level during the

147
study period. Then after the ratio continuously declined for next three year
and went down to 30 percent during the year 2002-03 the average of this ratio
during the study period was of 1.43 percent.
The burden ratio of the GTB Ltd. registered mix trend. It was of (-) 0.35
percent during the year 1998-99 and of 3.85 percent during the year 2002-03.
This is not a healthy sign for future of The GTB Ltd. The average of the ratio
was 1.30 percent during the study period.
The profitability position of the GTB Ltd. registered decreasing trend for
the last four year during the study period. It was of 1.46 percent at the highest
level during the year 1999-00. There after a constant decreasing trend was
registered by the Global Trust Bank Ltd. During 2002-03 there was negative
performance in relation to profitability ratio during the study period. The Global
Trust Bank Ltd. suffered heavy loss during the year 2002-03, which shows red
signal for future.
(V) BANK OF PUNJAB LTD.:
The analysis and interpretation of spread, burden and profitability of
Bank of Punjab Ltd. has been disclosed in the following table no. 3.17.
Table No. 3.17 Key indicators for Bank of Punjab Ltd.
[In Rs. per Rs. 100 of Working Funds] YEAR
INDICATORS 1998-99
1999-00
2000-01
2001-02
2002-03
AVERAGE
Interest Earned Ratio “R” 8.78 8.23 9.10 9.35 8.23 8.74 Interest Paid Ratio “K” 6.85 5.92 6.08 7.03 5.95 6.37 SPREAD [r-k] 1.93 2.31 3.02 2.32 2.28 2.37 Establishment Expense Ratio “M”
0.33 0.25 0.24 0.33 0.40 0.31
Other Expenses Ratio “O” 2.08 2.47 3.03 4.09 4.32 3.20 Other Income Ratio “C” 2.03 1.44 1.15 3.01 3.15 2.16 BURDEN [m+o-c] 0.38 1.28 2.12 1.41 1.57 1.35 Profitability Ratio “P” 1.55 1.03 0.90 0.91 0.71 1.02 (Source: Computed from Data Collected from IBA Bulletin – Mar. –03 & Jan.-04)
Looking to the above table the position of spread during the study
period was almost around 2.00 percent. During the year 1998-99 it was of
1.93 percent at the lowest level during the study period. Than after it was of

148
2.31 percent during the year 1999-00. It was of 3.02 percent at the highest
level during the year 2000-01. The average of spread during the study period
was of 2.37 percent.
The burden ratio of the Bank of Punjab Ltd. during the study period
represented mix trend. It was of 0.38 percent, the lowest level in the year
1998-99. It was of 2.12 percent at the highest level during the year 2000-01.
The average of this ratio during the study period was of 1.35 percent.
The profitability position of the Bank of Punjab Ltd. registered constant
decreasing trend during the study period. It was of 1.55 percent at the highest
level in the year 1998-99. It sharply decreased to 0.71 percent during the year
2002-03. The profitability ratio in The Bank of Punjab Ltd. does not represent
the healthy sign for future.

149
Table No. 3.18 Summary of Profitability Ratio for Bank’s under Study
[In Rs. per Rs. 100 of Working Funds]
(Source: Computed from Data Collected from IBA Bulletin – Mar. –03 & Jan.-04)
Name of Bank under study 1998-99 1999-00 2000-01 2001-02 2002-03 Average
Public Sector Bank
Punjab & Sind Bank 0.54 0.52 0.10 0.17 0.02 0.27
Punjab National Bank 0.81 0.75 0.72 0.78 0.97 0.81
Bank of Baroda 0.80 0.86 0.44 0.77 1.01 0.78
Union Bank of India 0.51 0.29 0.40 0.70 1.08 0.59
State Bank of India 0.47 0.79 0.51 0.70 0.83 0.66
Average 0.63 0.64 0.44 0.62 0.78 0.62
Private Sector Bank
ICICI Bank Ltd. 0.90 0.89 0.80 0.25 1.13 0.79
HDFC Bank Ltd. 1.88 1.02 1.33 1.24 1.27 1.34
UTI Bank Ltd. 0.79 0.76 0.80 0.92 0.98 0.85
Global Trust Bank Ltd. 1.37 1.46 0.84 0.54 -3.55 0.13
Bank of Punjab Ltd. 1.55 1.03 0.90 0.91 0.71 1.02
Average 1.30 1.03 0.93 0.77 0.11 0.83

150
GRAPH NO: 3.6 AVERAGE PROFITABILITY OF SELECTED BANKS
0.27
0.810.78
0.590.66
0.79
1.34
0.85
0.13
1.02
0
0.2
0.4
0 .6
0 .8
1
1.2
1 .4
PE
RC
EN
TA
GE
P&SB PNB BOB UBI SBI ICICI HDFC UTI GTB BOP
NAM E OF BANKA V E. P ROF. RA TIO

151
The profitability ratio position of P&SB is very poor as compared to other
public sector banks under study. The profitability ratio of PNB is very good as
compared to other public sector banks under study. The profitability ratio
represented mix trend for public sector banks under study. It was of 0.78
percent during the year 2002-03. It was 0.44 percent during the year 2000-01.
The profitability position of the GTB Ltd. is very poor as compared to
other private sector banks under study as well as other public sector banks
under study. The profitability ratio of HDFC Bank Ltd. is very good as
compared to other private sector banks under study. The profitability ratio
represented decreasing trend for private sector banks under study. It was of
1.30 percent in the year 1998-99 at the highest level during the study period.
It was of 0.11 percent in the year 2002-03 the lowest level during the study
period.
F-TEST [ANOVA]:
Profitability Ratio of Bank’s:
Null Hypothesis (H0):
“There is no significance difference in profitability ratio of banks under
study.”
Alternative Hypothesis (H1):
“There is a significance difference in profitability ratio of banks under
study.”
Level of Significance: 5 per cent
Critical Value: 2.5787
Degree of Freedom: 49
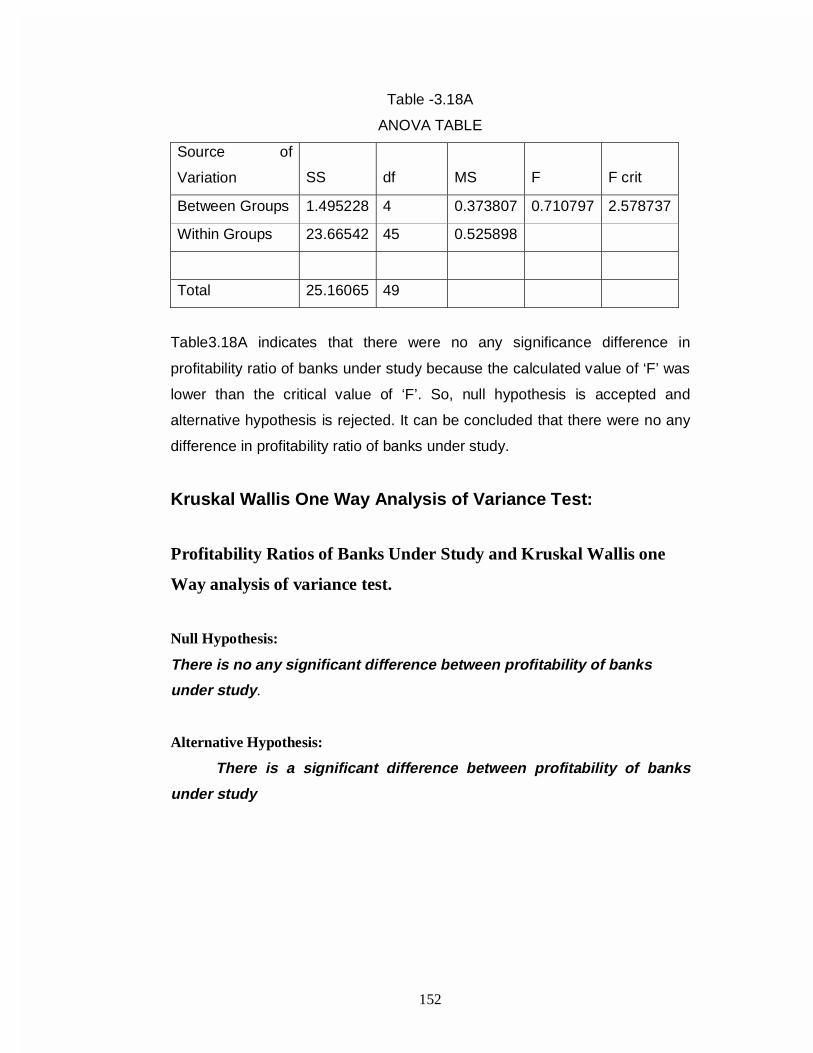
152
Table -3.18A
ANOVA TABLE
Source of
Variation SS df MS F F crit
Between Groups 1.495228 4 0.373807 0.710797 2.578737
Within Groups 23.66542 45 0.525898
Total 25.16065 49
Table3.18A indicates that there were no any significance difference in
profitability ratio of banks under study because the calculated value of ‘F’ was
lower than the critical value of ‘F’. So, null hypothesis is accepted and
alternative hypothesis is rejected. It can be concluded that there were no any
difference in profitability ratio of banks under study.
Kruskal Wallis One Way Analysis of Variance Test:
Profitability Ratios of Banks Under Study and Kruskal Wallis one
Way analysis of variance test.
Null Hypothesis:
There is no any significant difference between profitability of banks
under study.
Alternative Hypothesis:
There is a significant difference between profitability of banks
under study

153
TABLE NO.3.18B
Comparative Profitability of Banks with Kruskal Wallis One Way Analysis of Variance Test
PSB R1 PNB R2 BOB R3 UBI R4 SBI R5 ICICI R6 HDFC R7 UTI R8 GT R9 BOP R10
0.54 13.5 0.81 28 0.8 26 0.51 10.5 0.47 9 0.9 33.5 1.88 50 0.79 23.5 1.37 47 1.55 49
0.52 12 0.75 19 0.86 31 0.29 6 0.79 23.5 0.89 32 1.02 40 0.76 20 1.46 48 1.03 41
0.1 3 0.72 18 0.44 8 0.4 7 0.51 10.5 0.8 26 1.33 46 0.8 26 0.84 30 0.9 33.5
0.17 4 0.78 22 0.77 21 0.7 15.5 0.7 15.5 0.25 5 1.24 44 0.92 36 0.54 13.5 0.91 35
0.02 2 0.97 37 1.01 39 1.08 42 0.83 29 1.13 43 1.27 45 0.98 38 -
3.55 1 0.71 17
Total 34.5 124 125 81 87.5 139.5 225 143.5 139.5 175.5
238.05 0 3075.2 0 3125 0 1312.2 0 1531 0 3892.1 0 10125 0 4118.45 0 3892.05 0 6160.05
Calculated Value 23.106
Table Value 9.488
Calculated value is higher than table value so null hypothesis is rejected and alternative hypothesis is accepted. It means there has
been significant difference in profitability of banks under study.
154
3.7 CONCLUSION
Since the advent of financial sector reforms, banks have undergone a
complete transformation. Banks today have more freedom to decide upon
their strategies, product and services they want to offer, and have a bit more
flexibility in hiring work force.11
Public sector banks need to rework their strategy to take on new
generation private banks in ever product, service and market to compete. This
will require some immediate productivity, improvement measure, which will
return to fund medium and long-term productivity improvement exercise.
Public sector banks should immediately change the way their branches
function by redesigning branch layout and simplifying transaction process to
become more customer friendly. They should work out their business strategy
and clearly identify the product and services they want to provide, based on
their strength.12 There is an immediate need to rationalize their product
portfolio base on some rational profitability analysis. A simple pricing strategy
based on segmentation approach will help in identifying loss making products
and improve capital spread. Banks can immediately out source their It
services to external vendor so that they can focus on their core business. The
external vendor can work as business partner to bring about other
technological transformation over next 2 to 3 years
Banks should work towards transforming branches from transaction
dispenser to relationship management center. This exercise should preferably
be accomplished in next three years. If tangible impact is to be felt such a
transformation will require advanced technology and professionally qualified
employees to provide efficient services. Public sector banks need to set up
modern. It infrastructure in place within three to four years in line with the new
generation private banks.13
There is a need of centralized data base so that core banking solution
can be implemented to meet the over growing demand of providing different
products and value added service through different delivery channels.
Human resource development will act as the catalyst for any
transformation. Human resource department need to work out their strategy in
coordination with business group to provide skilled people to fulfill business

155
requirement. Banks can take the right step in this direction by reworking their
recruitment, compensation, transfer and promotion policy, skill development is
an ongoing process and a separate head under H R function should be
appointed to take care of this need.

156
3.8 REFEREBCES:
(1) Souvenir published at IV conference of Asia and pacific accountants,
New Delhi – 1965-1 p-143.
(2) Joseph F. Bradley “Administrative financial management” New York
Braves & Noble – 1964 p-104.
(3) Howard Bion B and Upton Miller op. cit p.147.
(4) Seshadri J.H. “An Economics Analysis of profitability in commercial
Banks” July-Sept vol. – IX No.3 P 215/216.
(5) Godse V.Y. (2002), “centralized Data Base: Concept and Relevance
IBA Bulletin Dec. – 2002.
(6) Triplett J.E. (1990) “Banking out put” in Eat well etal (ads) New Pal
grave Dictionary of money and finance. Macmillan London p p 143-
146.
(7) Oster A., Antioch L. (1999) “Measuring productivity in the Australian
Banking sector” submission to the National Australia Bank (NAB) P.P.
201-212.
(8) Berger A.N. W.C. Hunter and S.G. Timme (1993) “The Efficiency of
financial Institutions: A Review and preview of Research. Past present
and future.” Journal of Banking and finance, 17 (2/3) P.P. 221-249.
(9) Basin T.M. (2002)” Technology implementation and HRD Initiatives in
public sector banks in India Proceeding of the bank Economists
conference-2002. PP 248-316.
(10) Government of India (1998) “Report of the committee on banking
sector reforms.”
(11) Henry D. (2002), “Productivity is key to outsourcing Alltel information
services.
(12) IBM financial service chap No.5 “Promoting productivity in Banks.”
(13) Samal B. (2002) “EVA-A Key performance measure” proceeding of the
Bank Economists conference 2002 p-82/86.
(14) IBA Bulletin – March – 2003 and January-2004.

157
CHAPTER NO - 4
ANALYSIS OF FINANCIAL EFFICIENCY
4.1 Introduction
4.2 Meaning
4.3 Various Ratios and Analysis
(1) CAR Capital Adequacy Ratio
(2) NPA Non Performing Asset
(3) CDR Credit Deposit Ratio
(4) CRR Cash Reserve Ratio
(5) SLR Statutory Liquidity Ratio
4.4 References

158
CHAPTER - 4
4.1 INTRODUCTION:-
The bank uses various indicators for measuring its financial
performance. These indicators are of great importance and tell us the true
financial position of the bank. This indicators help in identifying the strengths
and weaknesses of the bank and suggesting improvements in its future
working. It is, thus, very important for a banking or business concern to
analyze its financial performance at the end of each financial year.
On the basic of financial indicators like Capital Adequacy Ratio [CAR]
Non Performing Assets [NPA], Credit Deposit Ratio [CDR], Cash reserve
Ratio [CRR] and Statutory Liquidity Ratio [SLR] it is found that some banks
are a progressive, technology driven, professionally managed entity well
geared to meet competition from existing as well as other banks effectively.
4.2 MEANING:-
Financial efficiency analysis covers a vast area and is of great practical
importance. “Financial efficiency on the other hand is measure for
ascertaining the effectiveness of the investment decisions as to how well the
business uses its assets to generate gross revenue” (1)
However, financial analysis is not restricted to the use of resources like
man power. It is a broader concept which measures the extent to which the
business uses or employs its fixed assets, current assets, total capital
employed and owner’s equity in such a manner that it generates optimum
revenues. The higher the measure of financial analysis it is considered to be
positive indicator of the financial performance of the business.
“Of the five categories of financial ratios which pertain to liquidity
solvency, repayment capacity, profitability and financial efficiency, the
financial efficiency ratios play a significant role in highlighting the financial
performance of banking business’’ (2)
Keeping in view the importance of financial analysis and the vast area
that it covers, we have carried out the present research work, which is
concerned with banking organization that offers a personalized service. The
vitality of this service depends on the quality and attitude of its working
personnel. This banks under study uses various indicators for measuring its

159
financial performance.(3) This indicators help in identifying the strengths and
weaknesses of the banks under study and suggest improvements in its future
working.
The study work was conducted with the following specific objectives:
� To analyze the adequacy of the capital based on the level of activity by
the bank unit under study.
� TO measure the liquidity position and factors responsible for causing
liquidity / illiquidity in the banks under study.
4.3 VARIOUS RATIOS: -
The researcher has selected some ratios for analysis of financial
efficiency for selected banks under study.
4.3.1 Capital Adequacy Ratio [CAR]:-
Banks in India with international exposure were required to maintain
minimum capital funds equal to 8 percent of their risk weighted assets and
other exposures on an ongoing basis till 31-03-2000. This percentage has
been increased to 9 percent with effect from 31/03/2000. (4)
The above requirement was introduced from 1992 after acceptance of
Narsimhan Committee report which recommended observance of prudential
norms by commercial banks and financial institution, in respect of income
recognition, assets classification and provisioning and capital adequacy
standards as prescribed by Bank for International Settlement [BIS].
Capital Fund of the Bank Formula :- Capital Adequacy Ratio =
Risk Weighted Assets X 100
� Capital Fund:-
Capital inclusive of Tier-I and Tier-II capital, i.e., core capital and
supplementary capital respectively. Tier I capital comprises of issued,
subscribed and paid up capital, statutory reserves, capital reserves, share
premium. Revenue and other reserves including investment fluctuation
reserve and balance in P&L account. Tier II capital comprises of unsecured,
redeemable and nonconvertible debentures.

160
� Risk Weighted assts and other exposures :-
[(Assets x Risk Weight) + (off balance sheet Items (i.e. contingent credit
exposure) x conversion factors)]
Here is a CAR with Tire I Table for all banks under study for the period of
1998-99 to 2002-03.
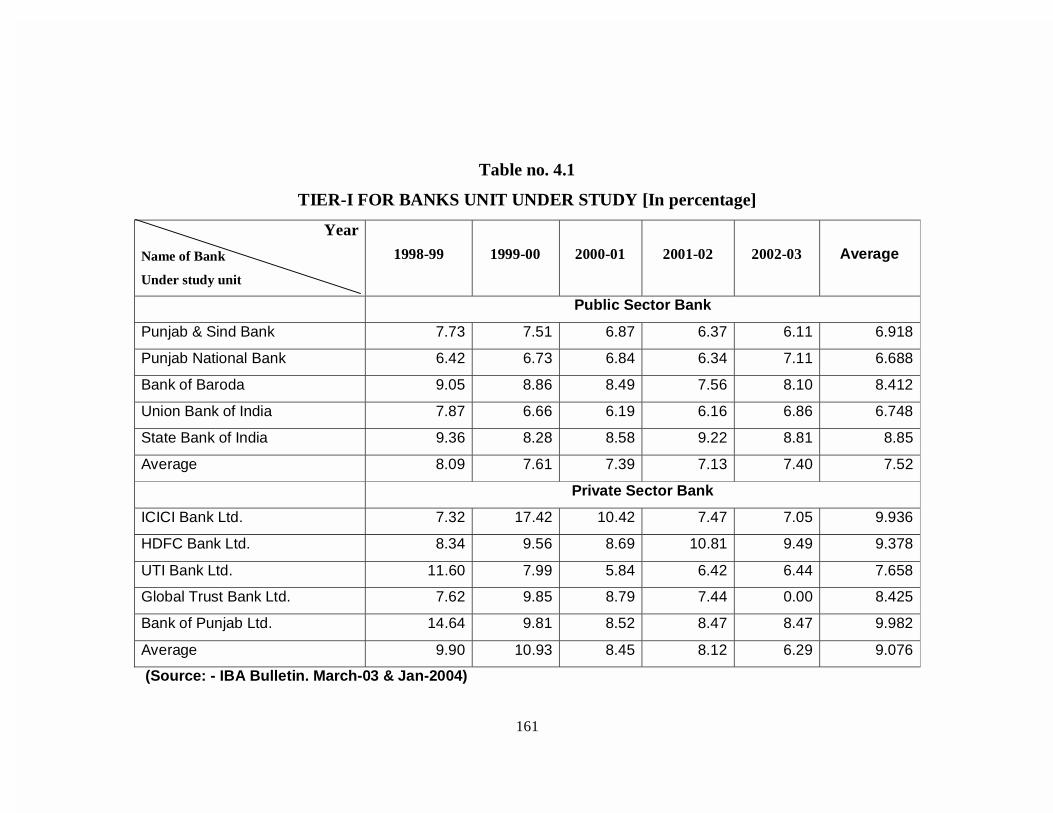
161
Table no. 4.1
TIER-I FOR BANKS UNIT UNDER STUDY [In percentage]
Year
Name of Bank
Under study unit
1998-99 1999-00 2000-01 2001-02 2002-03 Average
Public Sector Bank
Punjab & Sind Bank 7.73 7.51 6.87 6.37 6.11 6.918
Punjab National Bank 6.42 6.73 6.84 6.34 7.11 6.688
Bank of Baroda 9.05 8.86 8.49 7.56 8.10 8.412
Union Bank of India 7.87 6.66 6.19 6.16 6.86 6.748
State Bank of India 9.36 8.28 8.58 9.22 8.81 8.85
Average 8.09 7.61 7.39 7.13 7.40 7.52
Private Sector Bank
ICICI Bank Ltd. 7.32 17.42 10.42 7.47 7.05 9.936
HDFC Bank Ltd. 8.34 9.56 8.69 10.81 9.49 9.378
UTI Bank Ltd. 11.60 7.99 5.84 6.42 6.44 7.658
Global Trust Bank Ltd. 7.62 9.85 8.79 7.44 0.00 8.425
Bank of Punjab Ltd. 14.64 9.81 8.52 8.47 8.47 9.982
Average 9.90 10.93 8.45 8.12 6.29 9.076
(Source: - IBA Bulletin. March-03 & Jan-2004)

162
The table shows that the highest level of Tier-I managed by ICICI Bank
in the year 1999-00 with 17.42 percent. State Bank of India is at the highest
level with 9.36 percent in the year 1998-99 in all public sector banks under
study during the study period. The average of Tier-I for public sector banks
under study is 7.52 percent, where the average of Tier-I for private sector
bank unit under study is 9.08 percent during the study period.
In public sector banks under study SBI and BOB have maintained
above the average of Tier-I CAR and PSB, PNB & UBI have maintained
below average of Tier-I CAR
In private sector banks under study ICICI Bank, HDFC Bank and Bank
of Punjab Ltd. have maintain above the average of Tier-I CAR where UTI
Bank and GTB Ltd. have maintain below the average of Tier-I CAR.
Capital adequacy Ratio = Tier-I + Tier II where Tier-II mainly focus on outside
unsecured liabilities. Here is a data relating to Tier-II for CAR.
F-TEST [ANOVA]:
TIER-I FOR BANKS UNIT UNDER STUDY [In percentage]
(ANOVA Test):
Null Hypothesis (H0):
“There is no significance difference in Tier I capital trends of banks
under study.”
Alternative Hypothesis (H1):
“There is a significance difference in Tier I capital trends of banks under
study.”
Level of Significance: 5 per cent
Critical Value: 2.5787
Degree of Freedom: 49

163
Table -4.1A
ANOVA TABLE
Source of
Variation SS df MS F F crit
Between
Groups 39.9165 4 9.979125 1.863061 2.578737
Within Groups 241.0338 45 5.356306
Total 280.9503 49
From the above table, it is clear that difference between groups and within
groups in Tier I capital of banks were not significant because the calculated
value (1.8630) of ‘F’ was lower than critical value (2.5787) of ‘F’. Analysis
indicates that Tier I capital proportion of banks under study were uniform.
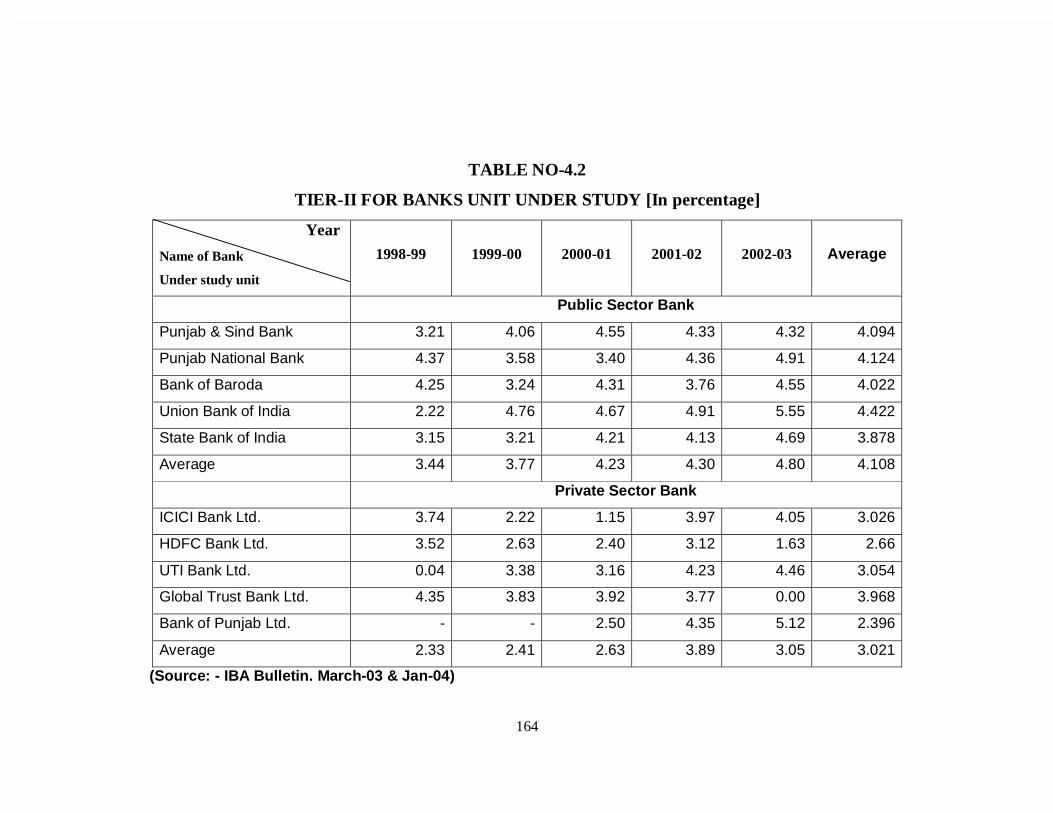
164
TABLE NO-4.2
TIER-II FOR BANKS UNIT UNDER STUDY [In percentage]
Year
Name of Bank
Under study unit
1998-99 1999-00 2000-01 2001-02 2002-03 Average
Public Sector Bank
Punjab & Sind Bank 3.21 4.06 4.55 4.33 4.32 4.094
Punjab National Bank 4.37 3.58 3.40 4.36 4.91 4.124
Bank of Baroda 4.25 3.24 4.31 3.76 4.55 4.022
Union Bank of India 2.22 4.76 4.67 4.91 5.55 4.422
State Bank of India 3.15 3.21 4.21 4.13 4.69 3.878
Average 3.44 3.77 4.23 4.30 4.80 4.108
Private Sector Bank
ICICI Bank Ltd. 3.74 2.22 1.15 3.97 4.05 3.026
HDFC Bank Ltd. 3.52 2.63 2.40 3.12 1.63 2.66
UTI Bank Ltd. 0.04 3.38 3.16 4.23 4.46 3.054
Global Trust Bank Ltd. 4.35 3.83 3.92 3.77 0.00 3.968
Bank of Punjab Ltd. - - 2.50 4.35 5.12 2.396
Average 2.33 2.41 2.63 3.89 3.05 3.021
(Source: - IBA Bulletin. March-03 & Jan-04)

165
The table shows that the highest level of Tier-II is maintained by UBI with 5.55
percent in the year 2002-03 among all banks under study period.
The average of Tier-II for public sector banks under study is 4.11
percent and for private sector banks under study is 3.02 percent during the
study period.
In public sector banks under study only PNB and UBI have above
average of Tier-II CAR during the study period. But PSB, BOB and SBI have
below average of Tier-II CAR during the study period.
In private sector banks under study ICICI Bank UTI Bank and Global
Trust Bank have maintained above average of Tier-II CAR. But HDFC Bank
and Bank of Punjab Ltd. have below average of Tier-II CAR during the study
period. Here is an overall performance about CAR of selected banks under
study.
F-TEST [ANOVA]:
TIER-II FOR BANKS UNIT UNDER STUDY [In percentage]
(ANOVA Test):
Null Hypothesis (H0):
“There is no significance difference in Tier II capital trends of banks
under study.”
Alternative Hypothesis (H1):
“There is a significance difference in Tier II capital trends of banks under
study.”
Level of Significance: 5 per cent
Critical Value: 2.5888
Degree of Freedom: 47
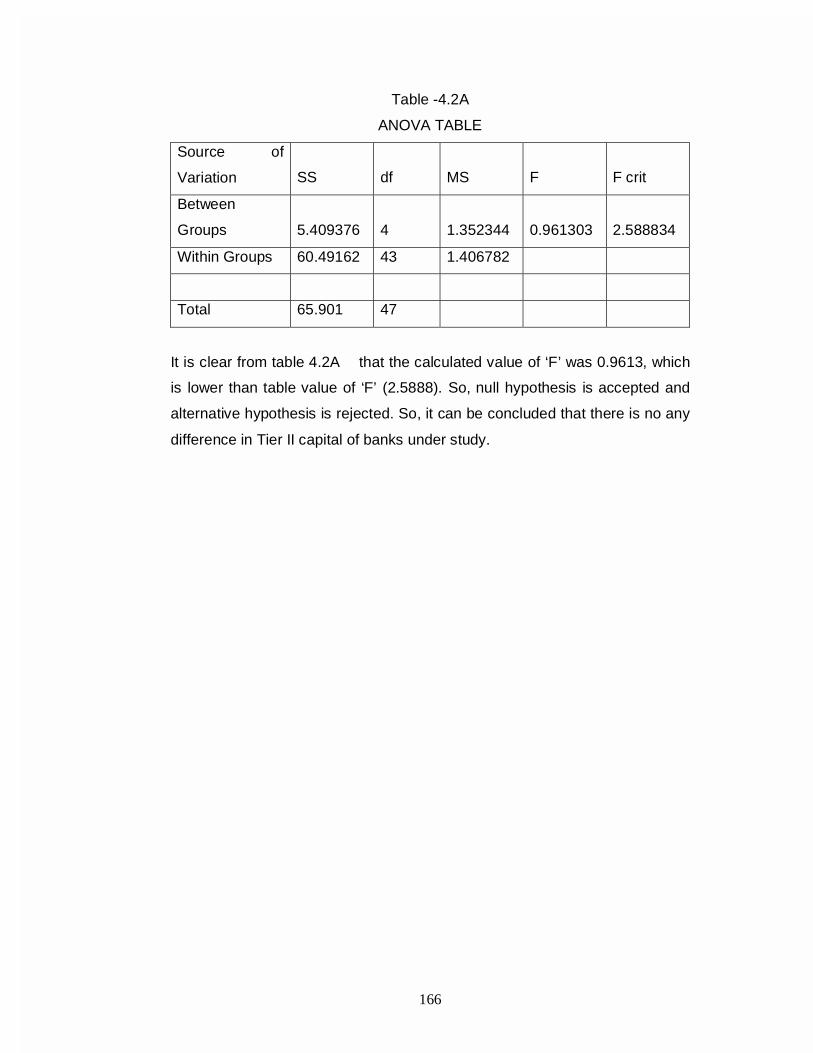
166
Table -4.2A
ANOVA TABLE
Source of
Variation SS df MS F F crit
Between
Groups 5.409376 4 1.352344 0.961303 2.588834
Within Groups 60.49162 43 1.406782
Total 65.901 47
It is clear from table 4.2A that the calculated value of ‘F’ was 0.9613, which
is lower than table value of ‘F’ (2.5888). So, null hypothesis is accepted and
alternative hypothesis is rejected. So, it can be concluded that there is no any
difference in Tier II capital of banks under study.

167
Table No. 4.3 CAR FOR SELECTED BANKS [In percentage]
(Source: - IBA Bulletin. March-03 & Jan-04)
Year
Name of Bank
Under study unit
1998-99 1999-00 2000-01 2001-02 2002-03 Average
Public Sector Bank
Punjab & Sind Bank 10.94 11.57 11.42 10.70 10.43 11.012
Punjab National Bank 10.79 10.31 10.24 10.70 12.02 10.812
Bank of Baroda 13.30 12.10 12.80 11.32 12.65 12.434
Union Bank of India 10.09 11.42 10.86 11.07 12.41 11.17
State Bank of India 12.51 11.49 12.79 13.35 13.50 12.728
Average 11.53 11.38 11.62 11.43 12.20 11.631
Private Sector Bank
ICICI Bank Ltd. 11.06 19.64 11.57 11.44 11.10 12.962
HDFC Bank Ltd. 11.86 12.19 11.09 13.93 11.12 12.038
UTI Bank Ltd. 11.64 11.37 9.00 10.65 10.90 10.712
Global Trust Bank Ltd. 11.97 13.68 12.71 11.21 0.00 12.393
Bank of Punjab Ltd. 14.64 9.81 11.02 12.82 13.59 12.376
Average 12.23 13.32 11.08 12.01 9.34 12.096
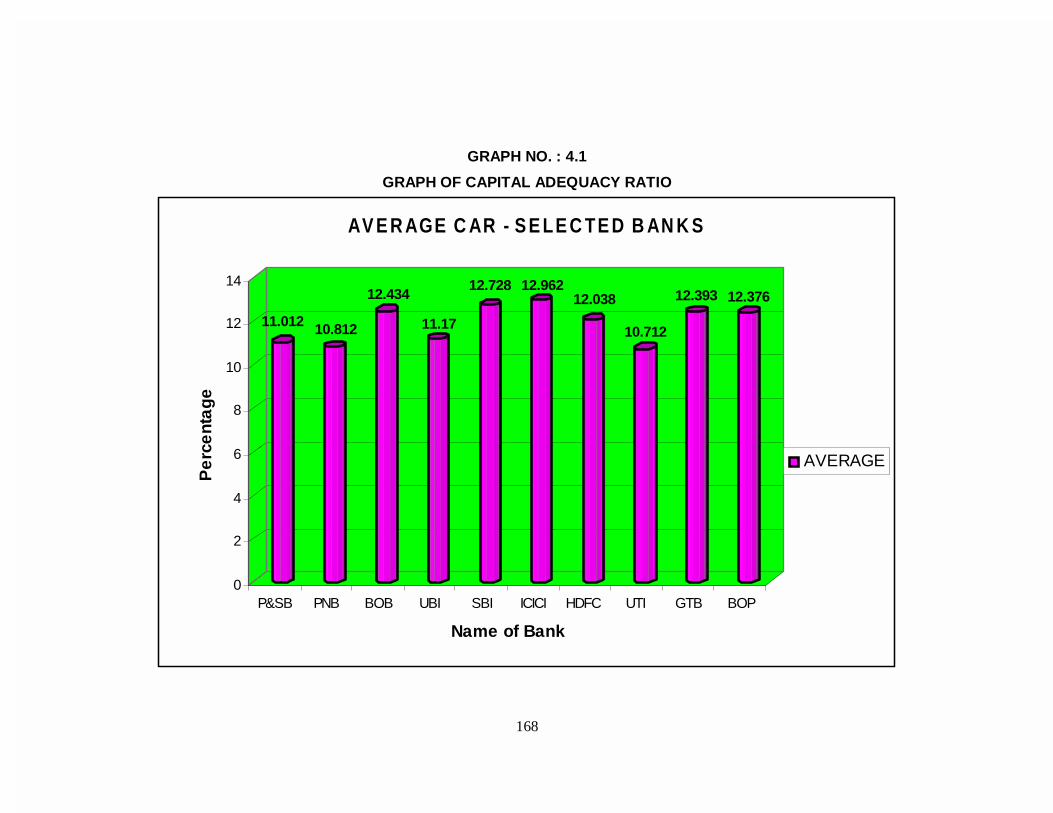
168
GRAPH NO. : 4.1
GRAPH OF CAPITAL ADEQUACY RATIO
11.012 10.812
12.434
11.17
12.728 12.96212.038
10.712
12.393 12.376
0
2
4
6
8
10
12
14
Pe
rce
nta
ge
P&SB PNB BOB UBI SBI ICICI HDFC UTI GTB BOP
Name of Bank
AV E R AGE C AR - S E LE C TE D B AN K S
AVERAGE

169
The above data shows that all banks under study have above 10.00 percent
of CAR except Bank of Punjab Ltd. during the year 1999-00 with 9.81 percent.
Before 31/3/2000 the percentage of CAR required by the banks for this
purpose was not less than 8 percent which has now been increased to 9
percent. All banks under study have good CAR during the study period.
ICICI Bank has the highest level of CAR with 19.64 percent during the
year 1999-00 and Bank of Punjab has the lowest level of CAR with 9.81
percent during the year 1999-00 among all banks under study.
Out of public sector banks SBI has the best performance with 12.73
percent of CAR. Out of private sector banks ICICI Bank Ltd. has the best
performance with 12.96 percent of CAR.
During the year 2002-03 Global Trust Bank Ltd. was in heavy loss
which effected in CAR resulted in to ZERO.
F-TEST [ANOVA]: CAPITAL ADEQUACY RATIO (ANOVA Test):
Null Hypothesis (H0):
“There is no significance difference in Capital Adequacy ratio of banks
under study.”
Alternative Hypothesis (H1):
“There is a significance difference in Capital Adequacy ratio of banks
under study.”
Level of Significance: 5 per cent
Critical Value: 2.5787
Degree of Freedom: 49

170
Table -4.3A
ANOVA TABLE
Source of
Variation SS df MS F F crit
Between
Groups 14.13961 4 3.534902 0.63494 2.578737
Within Groups 250.5286 45 5.567302
Total 264.6682 49
Table4.3A indicates that there were no any significance difference in capital
adequacy ratio of banks under study because the calculated value of ‘F’ was
lower than the critical value of ‘F’. So, null hypothesis is accepted and
alternative hypothesis is rejected. It can be concluded that there were no any
difference in capital adequacy ratio of banks under study.
4.3.2 Non Performing Asset [NPA] :-
After introduction of Narshimhan Committee recommendations, all
advances and loans are classified in to two categories, i.e.,
i) Performing Assets [PA]
ii) Non Performing Assets [NPA]
An asset becomes non performing when it ceases to generate income for the
bank. In this respect, the RBI has prescribed a standard norm of 5 percent
maximum. All the banks in India are required to follow this.
Net NPA’S NPA Ratio =
Total Advances X 100
Where Net NPA’S = Gross NPA’s – Provision for NPA’s
And
Total Advances = Total Advances are taken as per the amount shown in the
assets side of the balance Sheet of the bank.
All banks have to make full provisions for NPA’s as per the prudential norms
of RBI. The prudential norm of RBI is as under.
The non-performing asset (NPA) was defined as the credit facility in
respect of which the interest and/or installment of principal has remained past

171
due for the specified period of time. The specified period was reduced in the
phased manner as under. (5)
Year ending March 31 Specified periods
1993 Four quarters
1994 three quarters
1995 onwards two quarters
With a view to moving toward international practices and to ensure
greater transparency, it has been decided to adopt the 90 days overdue norm
for the identification of NPAs, from the year ending 31st March, 2004, the non-
performing assets (NPA) shall be the loan or the advance where:
(i) Interest and/or installment of the principal remain overdue for the
period of more then 90 days in respect of the term loan.
(ii) The accounts remain out of order for the period of more then 90 days,
in respect of the Overdraft / Cash Credit (OD/CC).
(iii) The bill remains overdue for the period of more then 90 days in the
case of bills purchased and discounted.
(iv) Interest and/or installment of the principal remain overdue for two
harvest season but for the period not exceeding two half year in the
case of the advance granted for the agriculture purposes, and
(v) Any amount to be received remains overdue for the period of more
then 90 days in respect of other account.
� Exempted assets
The certain categories of the advances have been exempted from
being treated as non-performing for the purpose of the income determination
and/or provisioning, even though they meet the aforesaid criteria, e.g.,
Government guaranteed advances.
Classification of Advances
The guidelines require banks to classify their advances into four broad
categories.
i. Standard Assets: Standard assets are one, which dose not discloses
any irregularity and which dose not carry more then normal risk to the
business. Such asset is not an NPA.
ii. Sub-standard Asset: Sub standard asset is one which has been
classified as NPA for a period not exceeding 18 months.

172
iii. Doubtful Assets: A doubtful asset is one which has remained NPA for
a period exceeding 18 months and where some security is available.
There are assets in respect of whom collection or liquidation in full has
become highly questionable and doubtful.
iv. Loss Assets: A loss asset is one where loss has been identified by
the bank. Internal or external auditor or the Reserve Bank of India
inspector, but the amount has been written off wholly or partly.
Provisioning for loans and advances:-
As per direction of RBI which are revised from time to time, the following
provisions should be made in respect of borrowers accounts
i. Standard Assets: Provision @ 0.25 percent of balance outstanding is
required to be made.
ii. Sub-Standard Assets: Provision @ 10 percent of balance
outstanding (without reducing value of securities) is required to be
made.
iii. Doubtful Assets: 100 percent to the extent advances are not covered
by realizable value of security to which the bank has a valid recourse
Over and above item (a), depending upon the period for which the
asset has remained doubtful 20 percent to 50 percent of the secured
portion (i.e. estimated realized value of the security)
The provisions should be made on the following basis.
Period for which the advances have Provision required
been considered as doubtful to be made
i. Up to one year 20% of the secured portion
ii. one to three years 30% of the secured portion
iii. More then three years 50% of the secured portion
(iv) Loss Assets: Provision for 100 percent of the outstanding balance
should be made.
It is important to note that in case advances are covered under DICGC /
ECGC schemes provision is required to made after deducting from the
unsecured part of the advance, the amount of cover, calculated by applying
rates specified by DICGC / ECGC, to the unsecured portion.
Hear is a data relating to Net NPA to Net Advances for selected banks under
study.
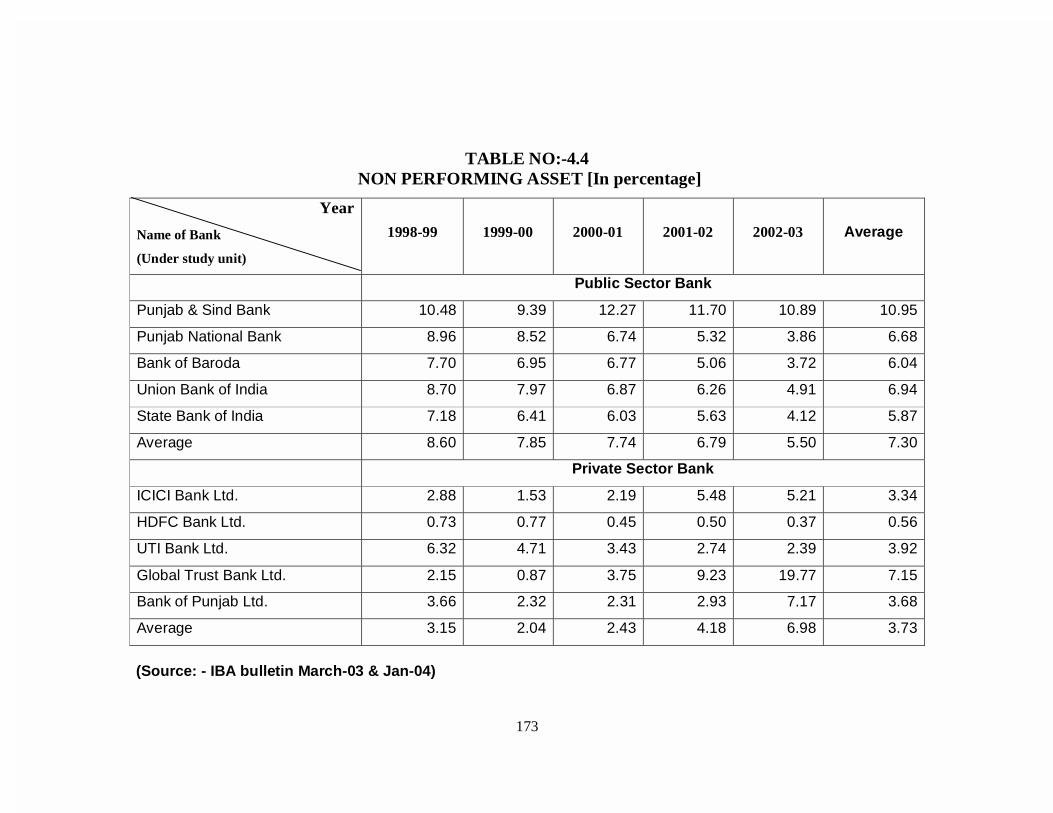
173
TABLE NO:-4.4 NON PERFORMING ASSET [In percentage]
(Source: - IBA bulletin March-03 & Jan-04)
Year
Name of Bank
(Under study unit)
1998-99 1999-00 2000-01 2001-02 2002-03 Average
Public Sector Bank
Punjab & Sind Bank 10.48 9.39 12.27 11.70 10.89 10.95
Punjab National Bank 8.96 8.52 6.74 5.32 3.86 6.68
Bank of Baroda 7.70 6.95 6.77 5.06 3.72 6.04
Union Bank of India 8.70 7.97 6.87 6.26 4.91 6.94
State Bank of India 7.18 6.41 6.03 5.63 4.12 5.87
Average 8.60 7.85 7.74 6.79 5.50 7.30
Private Sector Bank
ICICI Bank Ltd. 2.88 1.53 2.19 5.48 5.21 3.34
HDFC Bank Ltd. 0.73 0.77 0.45 0.50 0.37 0.56
UTI Bank Ltd. 6.32 4.71 3.43 2.74 2.39 3.92
Global Trust Bank Ltd. 2.15 0.87 3.75 9.23 19.77 7.15
Bank of Punjab Ltd. 3.66 2.32 2.31 2.93 7.17 3.68
Average 3.15 2.04 2.43 4.18 6.98 3.73

174
GRAPH NO.: 4.2 GRAPH OF NON – PERFORMING ASSETS
10.95
6.686.04
6.94
5.87
3.34
0.56
3.92
7.15
3.68
0
2
4
6
8
10
12
Per
cen
tag
e
P&SB PNB BO B UBI SBI IC IC I HD F C UT I G T B BO P
N ame of B ank
AVERAGE NPA - SELECT ED BANKS
A verage

175
The above data shows that the average of NPA’s of all five public sector
banks under study is 7.30 which is because of the highest NPA by P&SB. The
average of all private sector banks under study is 3.73 percent and out of
these five private sector banks GTB have the highest NPA average which was
near above 7.15 percent. SBI was the top with the lowest NPA average
among all public sector banks under study.
PNB, BOB, and UBI have achieved decreasing trend to control over
NPA percent with less then 7.00 percent below the average of public sector
banks under study. P&SB is facing mismanagement of NPA and credit policy
from last six year. The NPA of P&SB was at the highest with 12.27 percent in
the year 2000-01 out of all public sector banks under study during the study
period. It was with the lowest NPA the at 3.72 percent by BOB during the year
2002-03 out of all public sector banks under study during the study period.
ICICI bank was with an increasing trend for NPA percent during the
study period except the year 1998-99. The average of ICICI Bank’s NPA was
3.34 percent which was just below of average of all private sector banks
under study.
HDFC Bank is doing excellent work in the area of NPA management
and has achieved with the lowest NPA percent among all banks under study
during all five years of the study. The average of HDFC Bank’s NPA was 0.56
percent NPA to net advance.
UTI Bank is with the average of 3.96 percent of NPA which is above
average of all private sector banks under study. The percentage of NPA of
UTI Bank shows a decreasing trend during the study period. UTI Bank
arranged LOK ADALAT during the year 2001-02 & 2002-03 for NPA account
Holder and settled more then 2200 NPA account with maximum recovery.
Global Trust Bank Ltd. is clubbed with oriental bank of commerce during the
year 2004-05 because of only heavy NPA slippage and heavy loss during the
year 2002-03 with Rs.273 crores. Global Trust Bank has the highest level of
NPA with 19.77 percent net NPA to advance during the year 2002-03. This
was only because of poor credit policy and wrong advances.
Bank of Punjab Ltd. has maintained below NPA percent average within
the first four years of our study period. But during the year 2002-03 it was
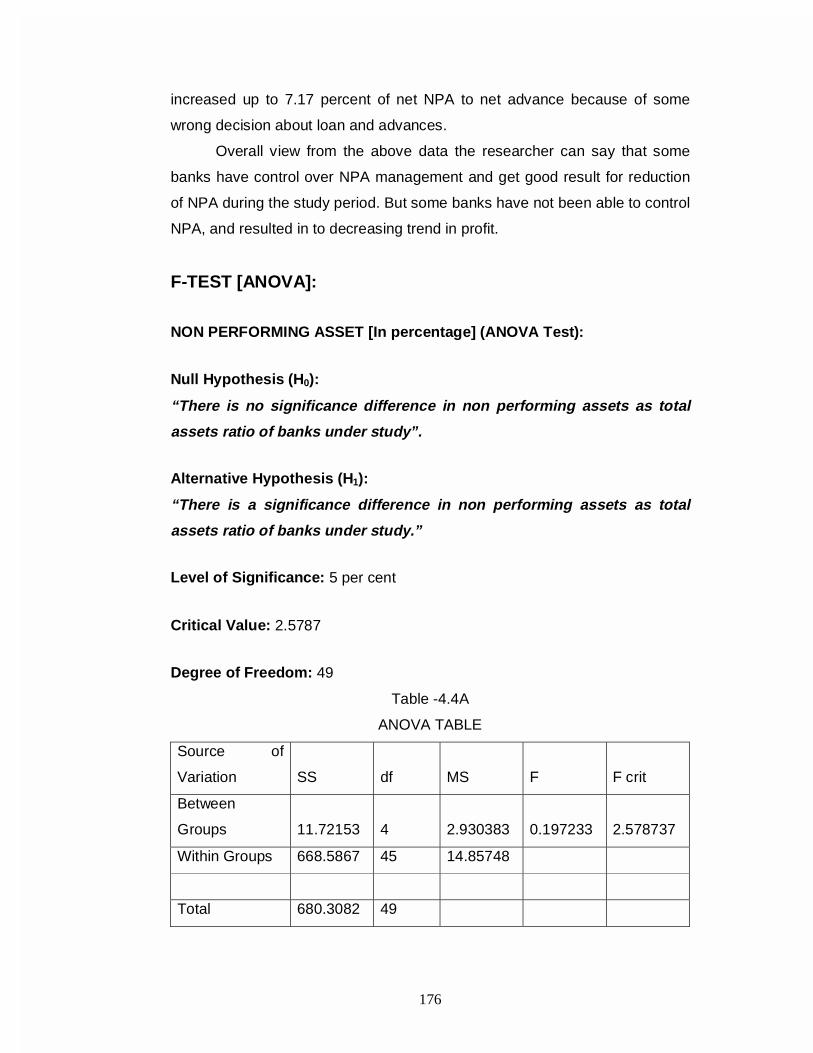
176
increased up to 7.17 percent of net NPA to net advance because of some
wrong decision about loan and advances.
Overall view from the above data the researcher can say that some
banks have control over NPA management and get good result for reduction
of NPA during the study period. But some banks have not been able to control
NPA, and resulted in to decreasing trend in profit.
F-TEST [ANOVA]:
NON PERFORMING ASSET [In percentage] (ANOVA Test):
Null Hypothesis (H0):
“There is no significance difference in non performing assets as total
assets ratio of banks under study”.
Alternative Hypothesis (H1):
“There is a significance difference in non performing assets as total
assets ratio of banks under study.”
Level of Significance: 5 per cent
Critical Value: 2.5787
Degree of Freedom: 49
Table -4.4A
ANOVA TABLE
Source of
Variation SS df MS F F crit
Between
Groups 11.72153 4 2.930383 0.197233 2.578737
Within Groups 668.5867 45 14.85748
Total 680.3082 49
177
It is evident from table 4.4A that the difference between non performing
assets as total assets ratio of banks between groups and within groups was
not significant because the calculated value of ‘F’ was 0.19723, which is lower
than table value of F. It can be said that the non performing assets as total
assets ratio indicates uniform trends.
4.3.3 Credit Deposit Ratio [CDR] :-
The ratio of total advances granted by a bank to its total deposits (i.e.,
Net Demand and Time Deposits) on any particular date is called the Credit
Deposit Ratio of the Bank. A ratio of more than 40 percent in this respect is
considered to be a desirable norm.
Total Advances Formula : Credit Deposit Ratio =
Total Deposits X 100
Here is a data relating to CDR of banks under study.

178
TABLE NO:-4.5 CREDIT DEPOSIT RATIO [In Percentage]
(Source: - IBA bulletin March-03 & Jan-04)
Year
Name of Bank
(Under study unit)
1998-99 1999-00 2000-01 2001-02 2002-03 Average
Public Sector Bank
Punjab & Sind Bank 43.17 45.14 43.52 44.68 44.56 44.214
Punjab National Bank 46.71 47.54 49.96 53.60 53.06 50.174
Bank of Baroda 47.28 47.57 50.71 54.47 53.26 50.658
Union Bank of India 38.80 48.25 50.17 53.73 57.02 49.594
State Bank of India 48.72 49.84 46.78 44.65 46.52 47.302
Average 44.936 47.668 48.228 50.226 50.884 48.388
Private Sector Bank
ICICI Bank Ltd. 34.74 37.07 42.93 146.59 110.61 74.388
HDFC Bank Ltd. 48.06 41.07 39.78 38.60 52.53 44.008
UTI Bank Ltd. 71.36 61.31 53.02 43.56 42.32 54.314
Global Trust Bank Ltd. 51.69 51.92 53.01 47.07 47.33 50.204
Bank of Punjab Ltd. 47.68 49.88 49.30 48.03 50.06 48.990
Average 50.706 48.25 47.608 64.77 60.57 54.381

179
GRAPH NO 4.3
GRAPH OF - CREDIT DEPOSIT RATIO
44.21450.174 50.658
49.59447.302
74.388
44.008
54.31450.204 48.99
0
10
20
30
40
50
60
70
80
Per
cen
tag
e
P&SB PNB BOB UBI SBI ICICI HDFC UTI GTB BOP
Name of Bank
AVERAGE CDR - SELECTED BANKS
Average
180
The above data shows that all banks under study have more than 44
percentage of CDR. The average of CDR for public sector banks under study
was 48.39 percent while an average of CDR for private sector banks under
study was 54.38 percentages.
It was a mixed trend of CDR in P&SB during the study period. The
average of CDR of P&SB was 44.21 percent with the lowest in public sector
banks under study.
It was an increasing trend of CDR in PNB during the study period
except 2002-03. PNB was at the highest level of CDR with 53.60 percent
during the year 2001-02. The average of CDR for PNB was 50.17 percent
during the study period.
The above data shows an increasing trend of CDR for BOB during the
study period except 2002-03. BOB was at the highest level of CDR with 54.47
percent during the year 2001-02. The average of CDR for BOB was 50.66
percent with the highest over all public sector banks under study during the
study period.
It was an increasing trend in CDR for UBI during the study period. UBI
was at the highest level of CDR with 57.02 percent during the study period.
57.02 percent CDR of UBI was the highest in all public sector banks under
study. The average of CDR for UBI was 49.594 percent during the study
period.
SBI is a leading public sector bank in Indian banking sector. SBI have
the highest deposits among all banks in India. It was a mixed trend of CDR in
SBI during the study period. The average of CDR for SBI was 47.30 percent
which was lower than the average of all public sector banks under study.
It can be said from the above analysis that selected public sector banks
was in an increasing trend which started from 44.94 percent during the year
1998-99 and ended with 50.88 percent during the year 2002-03 in the study
period. The average of CDR for public sector banks under study was 48.39
percent. Out of five public sector banks PNB, BOB and UBI were above the
average of CDR while P & S Bank and SBI were under the average of CDR
during the study period.
It was a mixed and highly fluctuated trend of CDR in ICICI Bank during
the study period. During the year 2001-02 the CDR of ICICI Bank was 146.59

181
percent which was the highest among all selected banks study. The average
of CDR for ICICI Bank was 74.39 percent which was also the highest over all
selected banks under study during the study period.
The CDR of HDFC Bank registered a declining trend except 2002-03
during the study period. The CDR average of HDFC Bank was 44.01 percent
during the study period which was below average of five selected private
sector banks. The HDFC Bank made more advances during the year 2002-03
which resulted in to 52.53 percent CDR at the highest level during the study
period.
The CDR of UTI Bank represented a declining trend during the study
period. It was at the highest level with 71.36 percent during the year 1998-99,
which goes down up to the lowest level with 42.32 percent during the study
period. The average CDR of UTI Bank was 54.31 percent which was above
the average of five private sector banks. The CDR of GTB showed a mixed
trend during the study period. During the year 2001-02 and 2002-03, GTB
was in a great trouble about NPA and bed advances which resulted into
decreasing trend in CDR of GTB. The average CDR of GTB was 50.20 which
were below average of five selected private sector banks.
The CDR of Bank of Punjab Ltd. represented a mixed trend during the
study period. The average CDR of BOP was 48.99 percent which was below
average of five selected private sector banks.
It can be said from the above table that the average CDR of private
sector banks showed a mixed 50.71 percent during the year 1998-99 which
went up to the highest level with 64.77 percent during the year 2001-02. The
average CDR of five selected private sector banks was 54.38 percent and for
five selected public sector banks was 48.39 percent during the study period.
The public sector banks were steadily growing for CDR year by year
and four banks out of five were more than the average of CDR while the
private sector banks were growing without rhythm and one only ICICI Bank
out of five selected private sector banks was above the average CDR during
the study period.

182
F-TEST [ANOVA]:
CREDIT DEPOSIT RATIO [In percent] (ANOVA Test):
Null Hypothesis (H0):
“There is no any significance difference in credit deposit ratio of banks
under study.”
Alternative Hypothesis (H1):
“There is a significance difference in credit deposit ratio of banks under
study.”
Level of Significance: 5 per cent
Critical Value: 2.5787
Degree of Freedom: 49
Table -4.5A
ANOVA TABLE
Source of
Variation SS df MS F F crit
Between
Groups 926.8139 4 231.7035 0.745401 2.578737
Within Groups 13987.98 45 310.8439
Total 14914.79 49
From the above table, it is clear that difference between groups and within
groups in credit deposit ratio of banks was not significant because the
calculated value (0.7454) of ‘F’ was lower than critical value (2.5787) of ‘F’.
Analysis indicates that there were similar trends in credit deposit of banks
under study.

183
4.3.4 Cash Reserve Ratio :- (CRR)
Section 42[1] of the Reserve Bank of India act requires every bank
included in the second schedule annexed there to maintain an average daily
balance with the Reserve Bank of India, the amount of which shall not be less
than three percent of the total of the demand and time liabilities in India, as
shown in the return referred to the next sub section of the said section,
provided that the Reserve Bank may be notification in the GAZETTE of India
increase the said percentage to such higher percentage as may be specified
in the notification so however that the percentage shall not be more than
fifteen percentage of the total of the demand and time liabilities.
Under the provision of the above section before it was amended in
1962, the average daily balance to be maintained was five percent of the
demand liabilities and two percent of the time liabilities in India and the said
percentages could be increased by the Reserve Bank by a Gazette
notification to a level which shall not be more than twenty percent in case of
demand liabilities and not more than eight percent in the case of time
liabilities.
The powers relating to additional reserve requirements were first
exercised by the Reserve Bank, when by a notification issued by it on March
11, 1960 by which all scheduled banks were required to maintain with it in the
form of additional deposits, 25 percent of any additions to their demand and
time liabilities after March 11, 1960, over and above the minimum
requirements
Viz. 5 percent on demand and 2 percent on time liabilities. By a
subsequent notification dated May 6, 1960. The quantum of additional
deposits to be maintained with the Reserve Bank was raised to 50 percent of
the rise in deposit liabilities from May 6, 1960. However in order to
compensate the banks for the loss of interest on fresh deposits the Reserve
Bank agreed to pay interest on these additional reserve equal to the average
rate of interest on total deposits of each bank during the corresponding
quarter, subject to ceiling equal to bank rate.
The rate of interest on additional deposits was raised on June 29,
1960. By 1/2 percent per annum subject to ceiling of 41/2 percent in England
when the credit squeeze was abolished in about the middle of 1958. The
184
Bank of England was given the power to reduce the liquid resources of the
commercial banks by calling on them for special deposits. In order to reduce
the inflationary state of British economy The Bank of England with the
approval of the chancellor of exchequer required the London clearing banks to
deposit one percent of their total deposits on or before the 15th June.
Such money could not be utilized until it was released. It may be noted
that in conformity with the Reserve Banks policy of operating credit regulation
measures in a flexible manner, further impounding of increase in deposits was
suspended with effect from November 11,1960 and about half of the reserves
already impounded amounting to Rs.13 crores was released by reaffixing the
additional reserve requirement at 25 percent of the increase between March
11 and November 11, subsequently, the additional reserve requirement was
completely revoked with effect form January 13,1961, thereby releasing an
additional Rs.13 crores of reserves to banks.
The CRR at the time of nationalisation was 3 percent. The percentage
of CRR goes on changing every six months, when the credit policy for six
months is announced by the Reserve Bank.
Sub-section (3) of section 42 provides for payment of penal interest by
a scheduled bank on the amount of any shortfall in the cash balance required
to be maintained by it with the Reserve Bank in terms of sub-section (1) or
sun-section (I-A) of section 42.Such penal interest will initially be at the rate of
3 percent above the Bank rate for the first fortnight of default, and if the
default is not made good, at the rate of 5 percent above the bank rate in
respect of the second and each subsequent fortnight till the stipulated
minimum balance is restored. For further provisions refer to section 42 of the
Reserve Bank of India Act.
Sub-section (1-B) of Section 42 also provides for payment of
interest by the Reserve Bank at its discretion at the rates determined by it
from time to time on the additional reserves.
Section 42(2) of the Reserve Bank of India Act, 1934, as amended
from time to time lays down that---
Every scheduled bank shall send to the Reserve Bank a return signed
by two responsible officers of such bank showing:

185
(a) The amount of its demand and time liabilities and the amount of its
borrowings from banks in India classifying them into demand and time
liabilities;
(b) The total amount of legal tender notes and coins held by it in India;
(c) The balance held by it at the Reserve Bank in India;
(d) The balances held by it at other banks in current account and the
money at call and short notice in India;
(e) The investment (at book value) in Central and State Government
securities including treasury bills and treasury deposit receipts;
(f) The amount of advances in India;
(g) The inland bills purchased and discounted in India and foreign bills
purchased and discounted,
(h) At the close of business on each alternate Friday and every such
return shall be sent not later than seven days after the date to which it
relates.
Section 42 has been amended by the Act 1 of 1984
(w.e.f.29.3.1985). As per the amendment the concept of average daily
balance has been linked to balances held at the close of business on each
day of a fortnight instead of a week and that the scheduled banks will be
required to file fortnightly returns on each alternate Friday in a month instead
of on each Friday of the month. Provision has also been made for filing of a
special return where last Friday of a month not an alternate is Friday for the
purpose of sub-section (2) of section 42.
During the mid term review of monetary and credit policy from April-
1998 to March-2003, the RBI has reduced the CRR from 11.00 percent to
4.75 percent. Thus the present CRR rate as applicable to commercial bank
was 4.75 percent.
Current account balances held with RBI Formula : CRR =
Net Demand & Time Liabilities in India. X 100
CRR and SLR together known as Reserve Requirement are the instruments
used by RBI to directly regulate the liquidity of the banking system.

186
Table No. 4.6
Cash Reserve Ratio (CRR)
CRR
Effective
from
CRR as % of
Domestic
DTL
CRR
Effective
from
CRR as % of
Domestic
DTL
CRR
Effective
from
CRR as % of
Domestic
DTL
CRR
Effective
from
CRR as % of
Domestic
DTL
13/11/1976 6.00 28/02/1987 9.50 06/07/1996 12.00 13/03/1999 10.50
31/07/1981 6.50 24/10/1987 10.00 26/10/1996 11.50 08/05/1999 10.00
21/08/1981 7.00 02/07/1988 10.50 09/11/1996 11.00 12/08/2000 8.50
27/11/1981 7.25 30/07/1988 11.00 04/01/1997 10.50 10/03/2001 8.00
25/12/1981 7.50 01/07/1989 15.00 18/01/1997 10.00 29/12/2001 5.50
29/01/1982 7.75 17/04/1993 14.50 25/10/1997 9.75 01/06/2002 5.00
09/04/1982 7.25 15/05/1993 14.00 22/11/1997 9.50 16/11/2002 4.75
11/06/1982 7.00 11/06/1994 14.50 06/12/1997 10.00 14/06/2003 4.50
27/05/1983 7.50 09/07/1994 14.75 17/01/1998 10.50 02/10/2004 5.00
29/07/1983 8.00 06/08/1994 15.00 28/03/1998 10.25
27/08/1983 8.50 09/12/1995 14.00 11/04/1998 10.00
04/02/1984 9.00 11/05/1996 13.00 29/08/1998 11.00
DATA SOURCES: - 1. TANNAN ‘S BANKING LAW AND PRACTICE IN INDIA
2. EVER MORE BANKING [HASIJA & SOOD]
3. IBA BULLETIN - JAN. 2004. + JAN. 2005
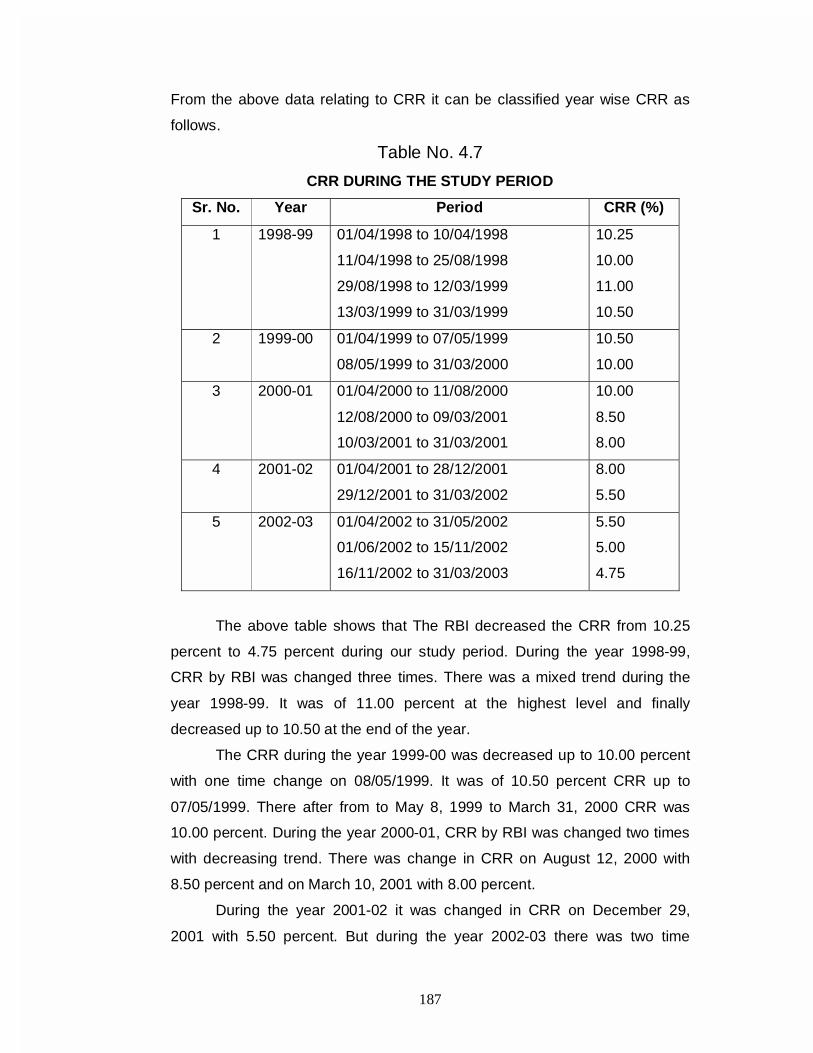
187
From the above data relating to CRR it can be classified year wise CRR as
follows.
Table No. 4.7
CRR DURING THE STUDY PERIOD
Sr. No. Year Period CRR (%)
1 1998-99 01/04/1998 to 10/04/1998
11/04/1998 to 25/08/1998
29/08/1998 to 12/03/1999
13/03/1999 to 31/03/1999
10.25
10.00
11.00
10.50
2 1999-00 01/04/1999 to 07/05/1999
08/05/1999 to 31/03/2000
10.50
10.00
3 2000-01 01/04/2000 to 11/08/2000
12/08/2000 to 09/03/2001
10/03/2001 to 31/03/2001
10.00
8.50
8.00
4 2001-02 01/04/2001 to 28/12/2001
29/12/2001 to 31/03/2002
8.00
5.50
5 2002-03 01/04/2002 to 31/05/2002
01/06/2002 to 15/11/2002
16/11/2002 to 31/03/2003
5.50
5.00
4.75
The above table shows that The RBI decreased the CRR from 10.25
percent to 4.75 percent during our study period. During the year 1998-99,
CRR by RBI was changed three times. There was a mixed trend during the
year 1998-99. It was of 11.00 percent at the highest level and finally
decreased up to 10.50 at the end of the year.
The CRR during the year 1999-00 was decreased up to 10.00 percent
with one time change on 08/05/1999. It was of 10.50 percent CRR up to
07/05/1999. There after from to May 8, 1999 to March 31, 2000 CRR was
10.00 percent. During the year 2000-01, CRR by RBI was changed two times
with decreasing trend. There was change in CRR on August 12, 2000 with
8.50 percent and on March 10, 2001 with 8.00 percent.
During the year 2001-02 it was changed in CRR on December 29,
2001 with 5.50 percent. But during the year 2002-03 there was two time

188
change on June 1, 2002 and November 16, 2002 with 5.00 percent and 4.75
percent respectively.Reserve Bank of India pays an interest on CRR in
excess of 3 percent.
4.3.5 Statutory Liquidity Ratio:-
Under section 24 of the Banking Regulation Act – 1949 commercial
banks in India are required to maintain. [In addition to average daily balance/
cash reserve under section 42 of RBI Act / section 18 of BR Act respectively.]
[a] Cash
[b] Gold
[c] Approved securities amounting to at least 25 percent of their net
demand and time liabilities in India.
This percentage is called the Statutory Liquidity Ratio (SLR). The act
also provides that the SLR can be increased from time to time by RBI up to a
maximum of 40 percent of the net demand and time liabilities.
During the year 2002-03 the applicable SLR was 25 percent.
Liquid Assets of the Bank Comprising Formula : SLR =
Net Demand and Time Liabilities in India X 100
Table No. 4.8
Statutory Liquidity Ratio (SLR)
Effective from
As % of Domestic
Demand and Time
Liabilities
Effective from
As % of Domestic
Demand and Time
Liabilities
September, 1981
October, 1981
July, 1984
September, 1984
June, 1985
July, 1985
April, 1987
January, 1988
September, 1990
January, 1993
34.50
35.00
35.50
36.00
36.50
37.00
37.50
38.00
38.50
38.25
February, 1993
March, 1993
August, 1993
September, 1993
October, 1993
August, 1994
September, 1994
October, 1994
October, 1997
38.00
37.75
37.50
37.25
34.75
34.25
33.75
31.50
25.00
189
The above table no. 4.8 shows that SLR percentage is continuously
decreasing since September - 1997. It is being regulated by RBI. SLR is not
simply a measurement tool for fiscal and monetary regulation but it is being
managed by RBI keeping in view the following three broad objectives.
1) To safeguard the solvency of commercial banks including liquidity
position.
2) To strengthen and develop market for government securities in India.
3) To make proper allocation of financial resources to the government so
that plane economic development of the country can be achieved.
Since September – 1981, the effective SLR was 34.50 percent, which
continuously decreased till October – 1997. When it was 25 percent, the
SLR has been remained unchanged since October – 1997. Hence at
present the effective rate is 25 percent.
190
4.4 REFERENCES:-
1) Shaffer Barry – Financial Ratio Part 5 Vineyard Notes # 8, internet.
2) Nigam Sudha, Financial Efficiency, Print Well Publishers, P-47.
3) Swati Katira – “Comparative Analysis of financial efficiency of Banking
Industry in Gujarat state.” Ph.D. Thesis – Dec. 2002 – Saurashtra
University – Rajkot.
4) S. K. Khatik “Financial Appraisal of IDBI Bank Ltd.” In Indian Journal of
Accounting Vol. XXXIII – Dec. 2002.
5) ‘Bank Audit’ – Advanced Auditing for CA final By Vinodkumar Aggarwal
& P. K. Sharma Published by Tayal Institute of Professional studies.
Page No. 129 to 132.
6) Sh. V. K. Bhatasana Thesis, Sau. Uni. 1999.
7) Indian Banking year Book – 1998.
8) IBA Bulletin Jan – 2004 & Jan – 2005.
191
CHAPTER – 5
ANALYSIS OF COMMON SIZE FINANCIAL
STATEMENTS
5.1 Concept
5.1.1 Introduction
5.1.2 Meaning
5.1.3 Definition
5.2 Merits and Demerits of Common Size Statements
5.3 Analysis and interpretation of Common Size Financial
Statements
5.4 Analysis and Interpretation of Consolidated Financial
Statements
5.5 Summary
5.6 References

192
CHAPTER - 5
5.1 CONCEPT:-
Profitability analysis is very valuable on comparative basis and
therefore it is of paramount importance that a series of statements over a
period of years should be used for detailed and perspective study. Common
size financial statement is a very useful tool for analysing the financial position
particularly growth and profitability.
5.1.1 Meaning:-
Mainly, the common size statements are concerned with the evaluation
of relationship among items as a particular date and period. It simply means
to calculate the percentage of each figure in each year’s financial statements
to a concerned total. It is a static type of analysis or the study of the financial
growth and profitability of a unit under study.
5.1.2 Definition:-
“Common size statements supplemented by additional analytical
financial data are the effective tools of a historical financial study of a
business or industry.” 1
“Common size financial statements are those in which figures reported
are converted into percentage to some common base.”2
It should be noted that relating them to a common base could highlight
the relative importance of various items in financial statement. Thus in the
balance sheet the total of assets or total of liabilities is taken as 100 and all
the figures are expressed as percentage of that base. Since, these bases
represents 100 percent in all the statements in the comparison, there prevails
a common size statements.
Common size statements are also known as “Components are reduced
to the total of 100 and each individual item on the statement is expressed as
percentage of total”. 3
In the balance sheet percent wise comparison is made of each item
shown here with the amount representing net asset or net liabilities. The
analysis of balance sheet of a unit under study under the common size
statements method would represent whether the deposits or advances are
193
increasing or decreasing is comparison to total liabilities or total assets,
whether the changes are made in the various heads, whether deposits and
advances are increasing and also as to what the percentage change in growth
of profitability increasing or decreasing over the period of comparison.
“When common size balance sheet is read horizontally does not give
information about the trend of individual items but the trend of their
relationship of total.”4
As observed by Roy H. Garrison. “A common size statement is one
that shows the separate items appearing on it in the percentage form, rather
than in dollar form. Each item is stated as a percentage of some total of which
that item is a part. Preparation of common size statements is called vertical
analysis” 5
According to Kennedy and McMullen, “Common size statements are
often called component percentage or 100 percentage statement because
each statement is reduced to the total of 100.” 6
They further observe that, “The common size statements are most
valuable to analyst in the study of current financial position and operating
results of a business and especially in making comparisons between
companies in the same industry and with industry standards.
The percentage of each individual item of a statement shows the
relation of the item to the total. Therefore, the common size percentages
analytical method represents type of ratio analysis because each individual
item of a statement is expressed as percentage of total. This common size
statement analysis is also known as vertical analysis or 100 percent
statement analysis. This type of first converts each individual rupee amount in
the statement to a percentage of the total amount of the group of which it is
part. Thus in the words of Korn J. Winston and Boyd Thomas, the relative
importance of each individual amount stands out clearly.”7
The technique of analysis is useful when some one wish to compare
two or more banks having differences in the organization’s size. But to make
such comparison really meaningful, it is necessary that the financial
statements i.e. Balance sheet of all such banks should be prepared on the
same pattern, e.g. all the banks should be more or less of the same age, they
should be following the same accounting practices, the method of

194
depreciation on fixed assets should be the same, the provision for NPA and
others should be also be the same because all units are following RBI’s
guideline. The trend represented by common size is more authentic as it
shows by the “Qualitative” assessment as opposed to the “Quantitative”
assessment shown by absolute figures.
5.2 MERITS OF COMMON SIZE FINANCIAL STATEMENTS:-
The various benefits of preparing common size financial statement can
be narrated as follows:
1. A needful comparison of two or more periods or two or more units
under study is possible, particularly when productive capacity different
from bank to bank.
2. A careful study of common size percentage of a bank will indicate the
structure of Balance Sheet and Profit and loss accounts.
3. The common size balance sheet will show the capital from share
holders, owned funds and borrowing from others as well as fixed and
other assets increasing or decreasing by size of the unit.
4. The common size income statement will show the allocation of profit in
the form of retained earnings, interest, dividends, and taxes also.
5. The relative importance of each individual item of liabilities side and
asset side will stand out clearly.
DEMERIT OF COMMON SIZE FINANCIAL STATEMENTS:-
In spite of having the above benefits, the technique is not free from
some limitation, which is as follows: 1. The comparative common size balance sheet shows the
percentage of each item to the total period but not variation in
respective heads from period to period.
2. It gives information about the trend of individual items relationship
to total but observations of these trends is not very useful because
there are no definite norms for proportion of each items to total.
3. In calculating percentage of common size profit and loss account, if
the figure is negative the percentage cannot be calculated and
likewise, if the change is from or to a zero balance in amount, it is

195
not possible to calculate the percentage. Presenting the difficulties
in common size analysis, John N. Mayer has rightly noted,
“It is doubtful whether the observation of trends of these relationships is
of any value to the analyst because the total is affected by variations in all its
components and, therefore the trends of the relationships are too complex for
interpretation. If it could be established in any particular business that, for an
example, the inventory of merchandise should normally be a certain
percentage of total liabilities and capital, the common size balance sheet
would be useful, but it is usually impossible to establish such a norm.”8
COMMON SIZE STATEMENT ANALYSIS:
Financial statements when read with absolute figures are not easily
understandable. Sometimes they are even misleading. It is therefore,
necessary that figures reported in these statements should be converted
percentage to some common base. 9
To prepare commons size balance sheet the following procedure has
been adopted in the present study.
[1] The figures of various items in the balance sheet have been grouped
under several heads and the total of each group has been rounded off
to crores of rupees.
[2] The total of assets and liabilities side is termed as working funds and
has been treated as hundred and the percentage of each group of item
of assets and liabilities have been calculated in proportion of working
funds.
In the present study the common size balance sheets have been
prepared of each selected units and analyzed the financial structure as well
as financial strength.
For preparation of the common size profit and loss statement of
selected unit under study, the following procedure has been adopted.
1. The figures of various items in the profit and loss statement have been
grouped under several heads i.e. TOTAL INCOME & TOTAL
EXPENDITURE and the total of each group rounded off to crores of
rupees.

196
2. The totals of total income and total expenditure plus profit have been
treated as hundred and the percentage of each group of item of income
and expenditure and profit have been calculated.
3. The common size profit and loss statement and balance sheet for each
individual bank under study has been prepared separately.
5.3 ANALYSIS AND INTERPRETATION OF COMMON SIZE
PROFIT & LOSS STATEMENT AND BALANCE SHEET OF
SELECTED UNIT UNDER STUDY:-
(A) PUNJAB & SIND BANK
The Condensed and Common Size Profit and Loss Statement of
Punjab & Sind bank has been shown in table No. 5.1.
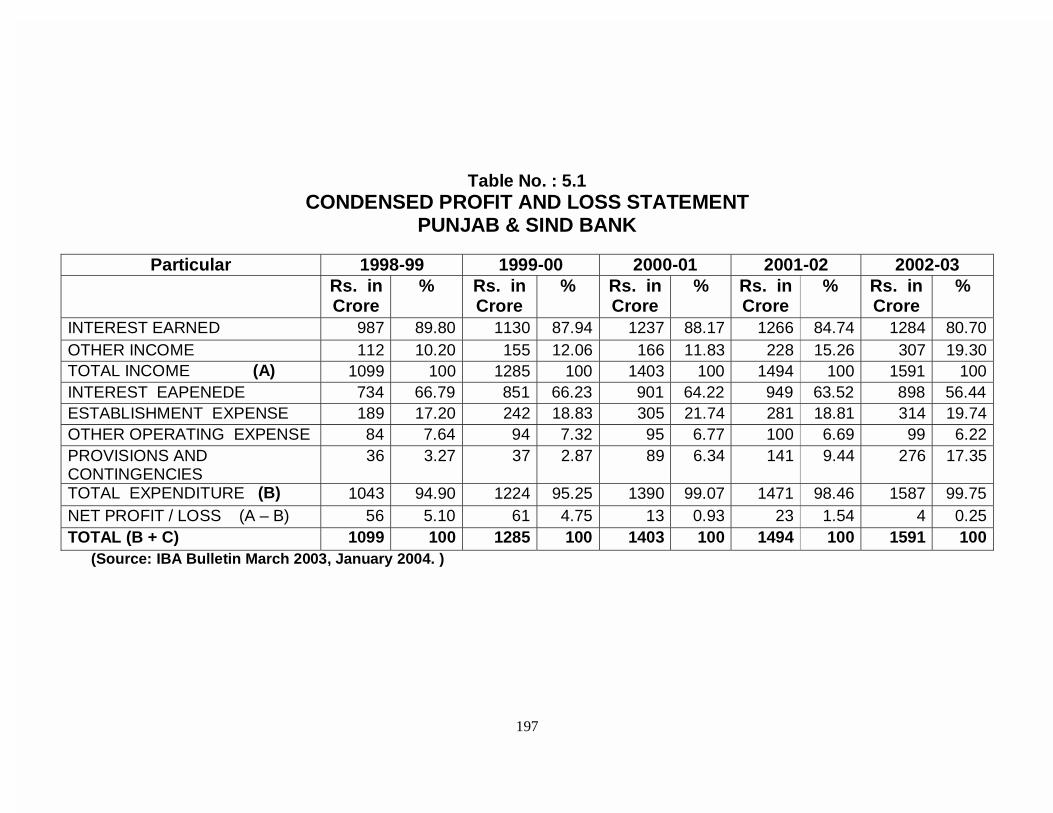
197
Table No. : 5.1 CONDENSED PROFIT AND LOSS STATEMENT
PUNJAB & SIND BANK
Particular 1998-99 1999-00 2000-01 2001-02 2002-03 Rs. in
Crore % Rs. in
Crore % Rs. in
Crore % Rs. in
Crore % Rs. in
Crore %
INTEREST EARNED 987 89.80 1130 87.94 1237 88.17 1266 84.74 1284 80.70 OTHER INCOME 112 10.20 155 12.06 166 11.83 228 15.26 307 19.30 TOTAL INCOME (A) 1099 100 1285 100 1403 100 1494 100 1591 100 INTEREST EAPENEDE 734 66.79 851 66.23 901 64.22 949 63.52 898 56.44 ESTABLISHMENT EXPENSE 189 17.20 242 18.83 305 21.74 281 18.81 314 19.74 OTHER OPERATING EXPENSE 84 7.64 94 7.32 95 6.77 100 6.69 99 6.22 PROVISIONS AND CONTINGENCIES
36 3.27 37 2.87 89 6.34 141 9.44 276 17.35
TOTAL EXPENDITURE (B) 1043 94.90 1224 95.25 1390 99.07 1471 98.46 1587 99.75 NET PROFIT / LOSS (A – B) 56 5.10 61 4.75 13 0.93 23 1.54 4 0.25 TOTAL (B + C) 1099 100 1285 100 1403 100 1494 100 1591 100
(Source: IBA Bulletin March 2003, January 2004. )

198
The condensed and common size profit and loss statement of Punjab and
Sind Bank registered mixed trend during the study period. Table no. 5.1
makes it evident that during the period under study cost of deposit and other
operating expenses shows decreasing trend but in establishment expenses
and provisions and contingencies represents an increasing trend during the
study period. In total income ratio the role of interest earned ratio shows
mixed with decreasing trend but other income shows mixed with increasing
trend.
The percentage of interest earned towards total income was the
highest at 89.80 percent in the year 1998-99 but continuous decreasing trend
during last four year of the study period except the year 2000-01 and become
the lowest at 80.70 percent in the year 2002-03.
The percentage of interest expended towards total income was the
highest at 66.79 percent in the year 1998-99 but continuous decreasing trend
during the study period and was the lowest in the year 2002-03 when it stood
at 56.44 percent of total income. The bank makes profit every year but the
bank represents mixed trend in profit. It was with 5.10 percentage of total
income in the year 1998-99, which was the highest profit with Rs. 56 crores.
But Punjab and Sind Bank registered 0.25 percent profit of total income in the
year 2002-03 with decreasing trend with Rs. 4 crores.
From the statement of profit and loss we can say that bank have to
improve interest earn percentage and control over interest paid and non
performing advances than bank can make profit in future.
The Condensed and Common Size Balance Sheet of Punjab & Sind
Bank has been shown in table No. 5.2

199
Table No. : 5.2 CONDENSED BALANCE SHEET
PUNJAB & SIND BANK
Particular 1998-99 1999-00 2000-01 2001-02 2002-03
Rs. in crore % Rs. in
crore % Rs. in crore % Rs. in
crore % Rs. in crore %
CAPITAL 243 2.29 243 2.04 243 1.81 243 1.77 243 1.68 Reserve and Surplus 131 1.23 178 1.50 186 1.39 202 1.47 214 1.48 Deposits 9497 89.47 10556 88.71 11905 88.83 12483 90.76 13224 91.26 Borrowing and other liabilities/provisions 744 7.01 922 7.75 1068 7.97 826 6.00 810 5.58
Working funds 10615 100 11899 100 13402 100 13754 100 14491 100 ASSET Cash and balances with Reserve Bank of India 1036 9.76 1169 9.82 1001 7.47 862 6.27 904 6.24
Balance with banks and money at call and short notice
524 4.94 480 4.03 752 5.61 678 4.93 624 4.31
Investments 4274 40.26 4809 40.42 5499 41.03 5745 41.77 6237 43.04 Advances 4100 38.62 4765 40.05 5181 38.66 5577 40.55 5892 40.66 Fixed Assets 83 0.78 83 0.70 84 0.63 77 0.56 68 0.47 Other Assets 598 5.64 593 4.98 885 6.60 815 5.92 766 5.28 Working funds 10615 100 11899 100 13402 100 13754 100 14491 100 (Source: IBA Bulletin March 2003, January 2004.)

200
It can be observed from table no. 5.2 that the ratio of deposit towards
working funds was always more than 88.00 percent of the working funds
during the study period. It was the highest in the year 2002-03 when it was
91.26 percent and it was the lowest in the year 1999-00 when it was 88.71
percent of the working funds.
Capital, reserve and surplus, borrowing and other liabilities / provisions
have nominal share in working funds i.e. 10 to 12.5 percentage of the working
funds. The advances registered mixed trend during the study period. It ranged
between 38.62 percent in the year 1998-99 and 40.66 percent in the year
2002-03 of the working funds. The investments registered an increasing trend
during the study period. It was the highest in the year 2002-03 when it was
43.04 percent and was the lowest in the year 1998-99 when it was 40.26
percent of the working funds.
The fixed assets contributed a very little share towards the working
funds during the study period. There were always less than 1 percent of the
total working funds.
The other assets contributed more share as compared to fixed assets
and registered mixed trend. It ranged between 4.98 percent in the year 1999-
00 and 6.60 percent in the year 2000-01 of the working funds.
On the analysis of above balance sheet we can say that the capital
was steady with amount but decreasing trend in percent with the working
funds.
The Punjab and Sind Bank has not maintained the credit deposit ratio
as other bank have maintained. Moreover, the percentage of balance with
banks and money at call and short notice was not more than 5.61 percent
showing a satisfactory level. Overall the balance sheet shows the medium
progress in advances and other aspects towards other banks under study.
(B) STATE BANK OF INDIA
The Condensed and Common Size Profit and Loss Statement of State
Bank of India has been presented in table No. 5.3

201
Table No. : 5.3 CONDENSED PROFIT AND LOSS STATEMENT
STATE BANK OF INDIA
Particular 1998-99 1999-00 2000-01 2001-02 2002-03 Rs. in
crore % Rs. in crore % Rs. in
crore % Rs. in crore % Rs. in
crore %
INTEREST EARNED 19108 85.33 22201 86.15 26139 87.07 29810 87.72 31087 84.41 OTHER INCOME 3284 14.67 3569 13.85 3883 12.93 4175 12.28 5740 15.59 TOTAL INCOME (A) 22392 100 25770 100 30022 100 33985 100 36827 100 INTEREST EXPENDED 13044 58.25 15273 59.27 17756 59.14 20729 60.99 21109 57.32 ESTABLISHMENT EXPENSE
4147 18.52 4478 17.38 6012 20.03 5153 15.16 5689 15.45
OTHER OPERATING EXPENCE
1750 7.81 1816 7.05 2287 7.62 2058 6.06 2254 6.12
PROVISIONS AND CONTINGENCIES
2423 10.82 2151 8.35 2363 7.87 3613 10.63 4670 12.68
TOTAL EXPENDITURE (B) 21364 95.40 23718 92.05 28418 94.66 31553 92.84 33722 91.57 NET PROFIT / LOSS (A – B)
1028 4.60 2052 7.95 1604 5.34 2432 7.16 3105 8.43
TOTAL (B+C) 22392 100 25770 100 30022 100 33985 100 36827 100 (Source: IBA Bulletin March 2003, January 2004.)
202
It can be observed from table no. 5.3 that the interest earned percent was
always more than 84.00 percent of the total income during the study period. It
ranged between 84.41 percent in the year 2002-03 and 87.72 percent in the
year 2001-02 of the total income. However the absolute figures always
increase during the study period, as it was Rs. 19108 crores in 1998-99,
which went up to Rs. 31087 crores in the year 2002-03.
The other income of the bank registered a declining trend during the
first four years and an increasing trend during the last year of the study
period. The absolute figures have registered a continuous increasing trend
during the study period. It was 14.67 percent in the year 1998-99, which
declined to 2002-03 with 12.28 percent towards the total income. But it was
the highest at 15.59 percent during the year 2002-03 towards the total
income.
The interest-expended ratio over total income is very important
measurement for profitability. It showed on increasing trend during the first
four years a decline trend during the last year of the study period. It was the
highest during the year 2001-02 when it was 60.99 percent of the total
income. It was the lowest during the year 2002-03 when it was 57.32 percent
of the total income.
The establishment expenses were always between 15.00 to 20.03
percent of the total income. The other expenses and provisions and
contingencies played an important role in total expenses. This directly
affected to net profit. It ranged between 15.49 percent in the year 2000-01
and 18.80 percent in the year 2002-03 of the total income.
On the analysis of total income and total expenditure it can be said that
State Bank of India shows an increasing trend in profit during the study
period. In 1998-99 the profit was Rs. 1028 with 4.60 percent of the total
income again an increasing trend during the year 1999-00 having absolute
amount of Rs. 2052 crores with 7.95 percent of the total income but a decline
trend during the year 2000-01 having absolute amount of Rs. 1604 crores with
5.34 percent of the total income again an increasing trend in the year 2001-02
having absolute amount of Rs.2432 crores with 7.16 percent of the total

203
income. During the year 2002-03 State Bank of India was on the top among
all public sector and private sector banks having absolute amount of Rs. 3105
crores with 8.43 percent of the working funds.
On the basis of the forgoing analysis it can be said that State Bank of
India is healthy and profit making unit under study.
The Condensed and Common Size Balance Sheet of State Bank of
India has been disclosed in table no. 5.4

204
Table No. : 5.4 CONDENSED BALANCE SHEET
STATE BANK OF INDIA
Particular 1998-99 1999-00 2000-01 2001-02 2002-03
Rs. in crore % Rs. in
crore % Rs. in crore % Rs. in
crore % Rs. in crore %
CAPITAL 526 0.24 526 0.20 526 0.17 526 0.15 526 0.14 Reserve and Surplus 9876 4.44 11621 4.44 12935 4.10 14698 4.22 16677 4.44 Deposits 169042 75.97 196821 75.27 242828 76.93 270560 77.70 296123 78.78 Borrowing 43065 19.35 52537 20.09 59355 18.80 62444 17.93 62551 16.64 Working funds 222509 100 261505 100 315644 100 348228 100 375877 100 ASSET Cash and balances with Reserve Bank of India
17392 7.82 18902 7.23 18496 5.86 21873 6.28 12738 3.39
Balance with banks and money at call and short notice
35820 16.10 28233 10.80 42213 13.37 43058 12.36 32443 8.63
Investments 71287 32.04 91879 35.13 122876 38.93 145142 41.68 172348 45.85 Advances 82360 37.02 98102 37.51 113590 35.99 120806 34.69 137758 36.65 Fixed Assets 2194 0.99 2478 0.95 2593 0.82 2415 0.69 2389 0.64 Other Assets 13456 6.03 21911 8.38 15876 5.03 14934 4.30 18201 4.84 Working funds 222509 100 261505 100 315644 100 348228 100 375877 100
(Source: IBA Bulletin March 2003, January 2004.)
205
It can be observed from table no. 5.4 that the ratio of deposit to working
funds was always more than 75 percent of the working funds during the study
period. It was the lowest in the year 1999-00 when it was 75.27 percent of the
working funds and it was the highest in the year 2002-03 when it was 78.78
percent of the working funds with Rs. 296123 crores which was the highest
deposit all over public sector bank.
The capital of State Bank of India was steady in rupees but the ratio of
capital towards working funds registered decreasing trend in percentage
which was always less than 0.25 percent.
The reserve surplus have nominal share in working funds, which was 4
to 4.5 percent during the study period.
The borrowing of other liability and provisions registered mixed trend
during the study period. In 1998-99 it was by 19.35 percent and in the year
1999-2000 it increased to 20.09 percent, which was the highest ratio during
the study period. In last three years of the study period there was decreasing
trend in the ratio of the borrowing and other liabilities and provision towards
working funds i.e. 18.80 percent, 17.93 percent & 16.64 percent in the year
2000-01, 2001-02 & 2002-03 year respectively.
The ratio of cash and balances with RBI registered decreasing trend
except 2001-02 during the study period. It was the highest in the year 1998-99
with 7.82 percent and the lowest in the year 2002-03 with 3.39 percent during
the study period.
The balance with banks and money at call and short notice shows
constant decreasing trend during the study period. The ratio of balance with
banks and money at call and short notice towards working funds was 16.10
percent in the year 1998-99 and this was the highest during the study period.
But constant decreasing trend resulted with only 8.63 percent at the lowest
level during the year 2002-03.
The investments contributed a very big share with increasing trend
towards the working funds. It started with 32.04 percent in the year 1998-99
and reached up to the highest level of 45.85 percent in the year 2002-03 of
the working funds.
206
The advances registered mixed trend during the study period. It ranged
between 34.69 percent in the year 2001-02 and 37.51 percent in the year
1999-00, which was the highest level during the study period.
The fixed assets contributed very little in share towards the working
funds during the study period. There was always less than 1 percent of the
total working funds with decreasing trends.
The other assets registered a little share with mixed trend towards the
working funds. It was at the highest level of 8.38 percent in the year 1999-00
and the lowest level at 4.30 percent in the year 2001-02 during the study
period.
On the basis of above analysis it can be said that the increase in
deposit in public sector banks is good sign for profit making banks. The State
Bank of India has maintained good credit deposit ratio it was always above 40
percent. And also it can be said that the percent of balance with banks and
money at call and short notice which was always more than 8.50 percent
showing a satisfactory level.
The State Bank of India represented the best progress in deposits and
advances.
(C) PUNJAB NATIONAL BANK
The Condensed and Common Size Profit and Loss Statement of
Punjab National Bank has been shown in table no.5.5

207
Table No. : 5.5 CONDENSED PROFIT AND LOSS STATEMENT
PUNJAB NATIONAL BANK
Particular 1998-99 1999-00 2000-01 2001-02 2002-03 Rs. in
crore % Rs. in
crore % Rs. in
crore % Rs. in
crore % Rs. in
crore %
INTEREST EARNED 4448 89.08 5155 87.63 5863 88.27 6648 87.18 7485 85.69 OTHER INCOME 545 10.92 728 12.37 779 11.73 978 12.82 1250 14.31 TOTAL INCOME (A) 4993 100 5883 100 6642 100 7626 100 8735 100 INTEREST EXPENDED 2795 55.98 3538 60.14 3825 57.59 4353 57.08 4361 49.93 ESTABLISHMENT EXPENSE
1069 21.41 1184 20.13 1459 21.97 1316 17.26 1476 16.90
OTHER OPERATING EXPENCE
307 6.15 340 5.78 413 6.22 483 6.33 581 6.65
PROVISIONS AND CONTINGENCIES
450 9.01 413 7.01 481 7.23 912 11.96 1475 16.88
TOTAL EXPENDITURE (B) 4621 92.55 5475 93.06 6178 93.01 7064 92.63 7893 90.36 NET PROFIT / LOSS [A-B]
372 7.45 408 6.94 464 6.99 562 7.37 842 9.64
TOTAL (B+C) 4993 100 5883 100 6642 100 7626 100 8735 100 (Source: IBA Bulletin March 2003, January 2004.)

208
It can be observed from table no. 5.5 that the ratio of net profit towards total
income shows mixed trends during the study period. It was at the highest level
with 9.64 percent in the year 2002-03 with Rs. 842 crores and at the lowest
level with 6.94 percent in the year 1999-00 with Rs. 408 crores towards total
income. In total income ratio the role of interest earned ratio registered mixed
trends with always more than 85 percent of the total income. The percentage
of interest earned towards total income was the highest at 89.08 percent in
the year 1998-99 but continuous decreasing trend during last four year of the
study period except the year 2000-01 and become the lowest at 85.69 percent
in the year 2002-03 during the study period.
The percentage of interest expended towards total income was the
highest at 60.14 percent in the year 1999-00 and was the lowest with 49.93
percent in the year 2002-03. The other expenditure like establishment
expense, other operating expense and provisions and contingencies
represents mixed trend during the study period towards total income.
The Punjab National Bank earned profit every year but in the year
1999-00 it was down by 7.45 to 6.94 percent of total income only because of
more interest expended and less interest earned towards total income.
From the above analysis it can be said that Punjab National Bank is in
a good position with the profitability position of public sector banks under
study.
The Condensed and Common Size Balance Sheet of Punjab National
Bank has been presented in table no. 5.6

209
Table No. : 5.6 CONDENSED BALANCE SHEET
PUNJAB NATIONAL BANK
Particular 1998-99 1999-00 2000-01 2001-02 2002-03
Rs. in crore
% Rs. in crore
% Rs. in crore
% Rs. in crore
% Rs. in crore
%
CAPITAL 212 0.46 212 0.39 212 0.33 212 0.29 265 0.31
Reserve and Surplus 1718 3.71 1873 3.46 2457 3.87 3004 4.12 3768 4.37 Deposits 40777 88.03 47483 87.72 56131 88.37 64123 87.94 75814 87.93 Borrowing 3616 7.80 4561 8.43 4719 7.43 5576 7.65 6375 7.39 Working funds 46323 100 54129 100 63519 100 72915 100 86222 100 ASSET Cash and balances with Reserve Bank of India 5016 10.83 5477 10.12 5366 8.45 5101 7.00 6569 7.62
Balance with banks and money at call and short notice 824 1.78 753 1.39 704 1.11 1297 1.78 1509 1.75
Investments 18573 40.10 22099 40.83 25128 39.56 28207 38.68 34030 39.47 Advances 19047 41.12 22572 41.70 28043 44.15 34369 47.14 40228 46.66 Fixed Assets 617 1.33 681 1.26 724 1.14 758 1.04 885 1.03 Other Assets 2246 4.84 2547 4.70 3554 5.59 3183 4.36 3001 3.47 Working funds 46323 100 54129 100 63519 100 72915 100 86222 100
(Source: IBA Bulletin March 2003, January 2004.)

210
It can be observed from above table no. 5.6 that the capital of Punjab
National Bank rose from Rs. 212 crores to Rs. 265 crores because of the
public issue during in the year 2002-03 for Rs. 52 crores. But the ratio of
capital towards working funds shows mixed trend during the study period. It
was always less than 0.5 percent of working funds.
The ratio of deposits towards working funds was always more than
87.00 percent during the study period.
The ratio of reserve and surplus shows a little share in working funds
between 3.00 to 5.00 percent during the study period. The ratio of borrowing
and other liabilities and provisions is having good share in working funds with
always more than 7.00 percent of working funds. The ratio of cash and
balance with RBI and balance with banks and money at call and short notice
have nominal share in working funds i.e. 8.50 to 12.61 percent of the working
funds during the study period. The ratio of investments towards working funds
was always more than 39.00 percent during the study period. It was the
highest in the year 1999-00 with 40.83 percent of working funds and the
lowest in the year 2001-02 with 38.68 percent of working funds during the
study period. The advances show tremendous increase during first four year
of the study period with 41.12 to 47.14 percent of working funds in the year
2001-02. But little bit decrease during the year 2002-03 with 46.66 percent of
the working funds. The ratio of fixed assets and other assets contributed small
share with mixed trend towards the working funds. It ranged with 4.50 to 7.00
percent of the working funds.
On overall analysis of above balance sheet it can be said that the
deposit ratio was good with the working funds. The capital was increased
because of public issue. The advances were in the best position in
comparison with other public sector banks. The Punjab National Bank have
maintain good credit deposit ratio and also the percentage of balance with
banks and money at all and short notice plus cash and balance with RBI was
always more than 8.00 percent of the working funds.
(D) BANK OF BARODA
The Condensed and Common Size Profit and Loss Statement of Bank
of Baroda has been shown in the table no. 5.7.

211
Table No. : 5.7 CONDENSED PROFIT AND LOSS STATEMENT
BANK OF BARODA
Particular 1998-99 1999-00 2000-01 2001-02 2002-03 Rs. in
crore % Rs. in
crore % Rs. in
crore % Rs. in
crore % Rs. in
crore %
INTEREST EARNED 4821 89.28 5178 88.35 5757 89.06 5956 85.71 6098 82.85 OTHER INCOME 579 10.72 683 11.65 707 10.94 993 14.29 1262 17.15 TOTAL INCOME (A) 5400 100 5861 100 6464 100 6949 100 7360 100 INTEREST EXPENDED 3248 60.15 3506 59.82 3820 59.10 4076 58.66 3994 54.27 ESTABLISHMENT EXPENSE
845 15.65 896 15.29 1146 17.73 1056 15.20 1129 15.34
OTHER OPERATING EXPENCE
362 6.70 407 6.94 461 7.13 508 7.31 520 7.07
PROVISIONS AND CONTINGENCIES
524 9.70 549 9.37 762 11.79 763 10.97 944 12.82
TOTAL EXPENDITURE (B) 4979 92.20 5358 91.42 6189 95.75 6403 92.14 6587 89.50 NET PROFIT / LOSS [A-B]
421 7.80 503 8.58 275 4.25 546 7.86 773 10.50
TOTAL (B+C) 5400 100 5861 100 6464 100 6949 100 7360 100 (Source: IBA Bulletin March 2003, January 2004.)

212
It can be observed from table no. 5.7 that the ratio of interest was gradually
decreasing but the ratio of other income was gradually increasing except the
year 2000-01 during the study period towards total income. The interest
earned ratio towards total income was always more than 82.00 percent. It
ranged between 82.85 percent at the lowest level in the year 2002-03 and
89.28 percent at the highest level in the year 1998-99 during the study period.
The other income shows an increasing trend during first two year and
the last two year but decreasing trend in the year 2000-01. It was at the
highest level with 17.15 percent of total income in the year 2002-03 and it was
at the lowest level with 10.72 percent of total income in the year 1998-99
during the study period.
Interest expended is a key factor in total expenditure. The ratio of
interest expended towards total income shows constant decreasing trend
during the study period. It was at the highest level with 60.15 percent in the
year 1998-99 with Rs. 3248 crores and at the lowest level with 54.27 percent
with Rs. 3994 crores towards total income of Rs. 7360 crores during the study
period.
The ratio of other expense like establishment expense, other operating
expense, and provision and contingencies toward total income ranged
between 40.00 to 45.00 percent of the total income during the study period.
The establishment expense was at the highest level with 17.73 percent of
total income because of voluntary retirement scheme [VRS] 2000-01.
The ratio of provision and contingencies over total income registered
gradually increasing trend except the year 2001-02 during the study period. It
was at the lowest level of 9.37 percent with Rs. 549 crores in the year 1999-
00 and reached up to the highest level with 12.82 percent of total income
during the study period. The Bank of Baroda registered always more than
7.00 percent profit of total income except the year 2000-01. The ratio of profit
over total income went down in the year 2000-01 because of establishment
expense increased for the VRS scheme.
On the basis of forgoing analysis is can be said that Bank of Baroda is
good and profit making bank and healthy bank among all public sector banks.
The Condensed and Common Size Balance Sheet of Bank of Baroda
has been presented in table no. 5.8

213
Table No. : 5.8 CONDENSED BALANCE SHEET
BANK OF BARODA
Particular 1998-99 1999-00 2000-01 2001-02 2002-03
Rs. in crore
% Rs. in crore
% Rs. in crore
% Rs. in crore
% Rs. in crore
%
CAPITAL 294 0.56 294 0.50 294 0.46 294 0.41 294 0.38 Reserve and Surplus 2604 4.99 2940 5.02 3062 4.84 3533 4.98 4093 5.36 Deposits 44614 85.42 51276 87.47 54070 85.39 61804 87.16 66366 86.85 Borrowing 4720 9.03 4113 7.01 5896 9.31 5279 7.45 5665 7.41 Working funds 52232 100 58623 100 63322 100 70910 100 76418 100 ASSET Cash and balances with Reserve Bank of India 3684 7.05 3506 5.98 4370 6.90 2581 3.64 3466 4.54
Balance with banks and money at call and short notice
8335 15.96 8971 15.30 8067 12.74 6366 8.98 3351 4.39
Investments 15905 30.45 18557 31.65 19857 31.36 23833 33.61 30179 39.49 Advances 21092 40.38 24393 41.61 27421 43.30 33663 47.47 35348 46.26 Fixed Assets 597 1.14 608 1.04 647 1.02 692 0.98 698 0.91 Other Assets 2619 5.02 2588 4.42 2960 4.68 3775 5.32 3376 4.41 Working funds 52232 100 58623 100 63322 100 70910 100 76418 100
(Source: IBA Bulletin March 2003, January 2004.)

214
It can be observed from table no. 5.8 that the ratio of capital towards funds
was always less than 0.56 percent of the working funds. But the amount of
capital of Rs. 294 crores remains steady during the study period. The ratio of
reserve and surplus over working funds shows mixed trend during the study
period. It was at 4.99 percent in the year 1998-99, which improve slightly and
went up to 5.02 percent in the year 1999-00. It fall dawn to 4.84 percent in
the year 2000-01 than improved and reached to 4.98 and 5.36 percent in last
two year towards the working funds.
The ratio of deposits towards working funds was always more than
85.00 percent during the study period. It was at the highest level at 87.47
percent in the year 1999-00 and at the lowest level at 85.39 percent in the
year 2000-01 of the working funds. However the absolute figures always
increase during the study period as deposits was Rs. 44614 crores in the year
1998-99 which reached up to Rs. 66366 crores in the year 2002-03 which
covers more than 86 percent of working funds.
The ratio of borrowing of other liabilities /provisions towards working
funds registered mixed trend during the study period. It was at the highest
level with 9.03 percent of working funds in the year 1998-99. But in next year
it was at the lowest with 7.01 percent of working funds.
The ratio of cash and balances with RBI and Balance with Banks and
Money at Call and Short Notice registered decreasing trend during the study
period. It was at the highest level with 7.05 percent + 15.96 percent = 23.01
percent in the year 1998-99 which fall dawn to the lowest level with 4.54
percent + 4.39 percent = 8.93 percent towards working funds during the year
2002-03. The Bank of Baroda has taken policy decision for this decline ratio
with certain reason.
The ratio of investments over working funds showed gradually
increasing trend except the year 2000-01 during the study period. The ratio of
investments shows always more than 31.00 percent of working funds. It was
at the lowest level with 30.45 percent in the year 1998-99, which went up to
the highest level at 39.49 percent during the year 2002-03 towards working
funds.

215
The important ratio of advances over working funds registered an
increasing trend for the first four year and decreasing trend in the last year
during the study period. The ratio of advances was always more than 40.00
percent of working funds. This is good sign for profit making bank in public
sector banks. It was at the highest level with 47.47 percent during the year
2001-02 and at the lowest level with 40.38 percent during the year 1998-99
towards working funds. Fixed and other assets have nominal share in working
funds. It was never become more than 7.5 percent towards working funds.
On the analysis of above it can be said that the performance of Bank of
Baroda is good in relation to credit deposit ratio and investments.
(E) UNION BANK OF INDIA
The Condensed and Common Size Profit and Loss Statement of Union
Bank of India has been presented in table no. 5.9.

216
Table No. : 5.9 CONDENSED PROFIT AND LOSS STATEMENT
UNION BANK OF INDIA
Particular 1998-99 1999-00 2000-01 2001-02 2002-03 Rs. in
crore % Rs. in
crore % Rs. in
crore % Rs. in
crore % Rs. in
crore %
INTEREST EARNED 2869 91.60 3315 91.73 3733 92.29 4016 88.95 4306 83.92 OTHER INCOME 263 8.40 299 8.27 312 7.71 499 11.05 825 16.08 TOTAL INCOME (A) 3132 100 3614 100 4045 100 4515 100 5131 100 INTEREST EXPENDED 2037 65.04 2358 65.25 2514 62.15 2679 59.34 2809 54.75 ESTABLISHMENT EXPENSE
514 16.41 612 16.93 756 18.69 687 15.22 689 13.43
OTHER OPERATING EXPENCE
270 8.62 253 7.00 263 6.50 280 6.20 329 6.41
PROVISIONS AND CONTINGENCIES
151 4.82 290 8.02 357 8.83 555 12.29 751 14.63
TOTAL EXPENDITURE (B) 2972 94.89 3513 97.20 3890 96.17 4201 93.05 4578 89.22 NET PROFIT / LOSS [A-B]
160 5.11 101 2.80 155 3.83 314 6.95 553 10.78
TOTAL (B+C) 3132 100 3614 100 4045 100 4515 100 5131 100 (Source: IBA Bulletin March 2003, January 2004.)

217
Table No. 5.9 make it evident that during the study period cost of deposit and
other operating expenses shows decreasing trend but in provisions and
contingencies represents continuous increasing trend towards total income.
In total income ratio the role of interest earned ratio shows an
increasing trend up to 2000-01 and then decreasing trend during the last two
years. The ratio of interest earned over total income was at the highest level
with 92.29 percent in the year 2000-01 and at the lowest level with 83.92
percent in the year 2002-03 during the study period.
The percentage of other income towards total income was at the lowest
level with 7.71 percent of total income during the year 2000-01 and at the
highest level with 16.08 percent of total income during the year 2002-03
during the study period.
The ratio of interest expended towards total income was the highest at
65.25% during the year 1999-00 but after 1999-00 there was continuous
decreasing trend and went down to the lowest level during the year 2002-03
with 54.75 percent of total income. The ratio of establishment expenses over
total income was at the highest level when it stood at 18.69 percent of total
income. This was only because of VRS scheme for employees.
The percentage of other operating expenses over total income showed
decreasing trend except the year 2002-03, it was the highest level with 8.62
percent in 1998-99 and was at the lowest level in the year 2001-02 when it
stood at 6.20 percent of total income.
The ratio of provisions and contingencies over total income registered
constant increasing trend during the study period. It was at the lowest level
with Rs. 151 crores at 4.82 percent of total income in the year 1998-99 and
reached up to the highest level with Rs. 751 crores at 14.63 percent of total
income in the year 2002-03 during the study period. The percentage of profit
over total income showed an increasing trend during last four years of the
study period.
In the beginning of the study period the ratio of profit over total income
was with Rs. 160 crores at 5.11 percent of total income, which fall dawn in
next year i.e. in 1999-00 with Rs. 101 crores at 2.80 percent of total income.

218
After 1999-00 there was a constant increasing trend. In the year 2000-01 it
was with Rs. 155 crore at 3.83 percent and in the year 2001-02 it was with Rs.
314 crore at 6.95 percent and in the year 2002-03 it was suddenly hike in
profit due to increase in other income it was Rs. 553 crore at 10.78 percent
profit of total income.
On the basic of the forgoing analysis it can be said that Union Bank of
India was rather healthy and good profit maker bank of the public sector
banks during the last two years of the study period.
The Condensed and Common Size Balance Sheet of Union Bank of
India has been disclosed in table no. 5.10.

219
Table No. : 5.10 CONDENSED BALANCE SHEET
UNION BANK OF INDIA
Particular 1998-99 1999-00 2000-01 2001-02 2002-03
Rs. in crore
% Rs. in crore
% Rs. in crore
% Rs. in crore
% Rs. in crore
%
CAPITAL 338 1.08 338 0.97 338 0.87 338 0.76 460 0.90 Reserve and Surplus 1345 4.31 1409 4.02 1511 3.88 1769 3.99 2107 4.13 Deposits 28136 90.10 31105 88.82 34888 89.51 39794 89.68 44749 87.64 Borrowing 1410 4.51 2169 6.19 2241 5.74 2474 5.57 3744 7.33 Working funds 31229 100 35021 100 38978 100 44375 100 51060 100 ASSET Cash and balances with Reserve Bank of India 3609 11.56 3112 8.89 2744 7.04 2393 5.39 2247 4.40
Balance with banks and money at call and short notice 2276 7.29 3468 9.90 2574 6.60 2513 5.66 1652 3.24
Investments 12140 38.87 11479 32.78 13672 35.08 15410 34.73 19371 37.94 Advances 10918 34.96 15007 42.85 17505 44.91 21383 48.19 25515 49.97 Fixed Assets 750 2.40 771 2.20 763 1.96 755 1.70 733 1.44 Other Assets 1536 4.92 1184 3.38 1720 4.41 1921 4.33 1542 3.01 Working funds 31229 100 35021 100 38978 100 44375 100 51060 100
(Source: IBA Bulletin March 2003, January 2004.)

220
It can be observed from above table no. 5.10 that the capital of Union Bank of
India remains up to the first four year with Rs. 338 crores and the ratio of
capital over working funds shows decreasing trend up to 2001-02. But in the
year 2002-03 Union Bank of India announced a public issue of Rs. 122 crore
and it was fully subscribed so the capital of Union Bank of India was with Rs.
460 crores and the ratio of capital over working funds was 0.90 percent in the
year 2002-03.
The ratio of reserve and surplus towards working funds has a little
share with less than 5.00 percent of working funds.
The percentage of deposits over working funds registered mixed trend
with always more than 85.00 percent of working funds. It was at the highest
level with 90.10 percent of working funds in the year 1998-99 with Rs. 28136
crores. It was at the lowest level with 87.64 percent of working funds in the
year 2002-03 during the study period.
The ratio of borrowing and other liabilities/provisions towards working
funds registered mixed trend with always more than 4.00 percent of working
funds.
The ratio of cash and balance with Reserve Bank of India shows
constant decreasing trend during the study period. It was at the highest level
with 11.56 percent in the year 1998-99 and reached to the lowest level with
4.40 percent of working funds in the year 2002-03 during the study period.
The percentage of balance with banks and money at call and short
notice registered mixed trend during the study period. It was at the highest
level in the year 1999-00 when it was 9.90 percent of the working funds. And
it was at the lowest level in the year 2002-03, when it was 3.24 percent of
working funds during the study period.
The ratio of investment towards working funds shows mixed trend
during the study period. It ranged with 32.78 to 38.87 percent of working
funds.
The ratio of advances towards working funds showed an increasing
trend during the study period. In the beginning of the study period in the year
1998-99 it was only at 34.96 percent of working funds but in the year 1999-00

221
it jumped up to 42.85 percent of working funds and reached up to the highest
level in the year 2002-03 with 49.97 percent of working funds. It was the
highest ever in all public sector banks under study.
The ratio of fixed assets towards working funds registered continuous
decreasing trend, which started with the highest level in the year 1998-99 with
2.40 percent and ended with the lowest level in the year 2002-03 with 1.44
percent during the study period.
The percentage of other assets towards working funds showed mixed
trend during the study period. But it was always less than 5 percent of working
funds.
Over all analysis of above common-size balance sheet it can be said
that Union Bank of India is passing through the best phase of reform process
and also got good result during the five years of the study period. The Union
Bank of India had good credit deposit ratio among all public sector units under
study in last two year. The Union Bank of India is getting 10.83 percent profit
of total income in the year 2002-03, which shows healthy and profit making
bank in public sector banks under study.
[F] ICICI BANK LTD.
The Condensed and Common Size Profit and Loss Statement of ICICI
Bank Ltd. has been shown in table no. 5.11.

222
Table No. : 5.11 CONDENSED PROFIT AND LOSS STATEMENT
ICICI BANK LTD.
Particular 1998-99 1999-00 2000-01 2001-02 2002-03 Rs. in
crore % Rs. in
crore % Rs. in
crore % Rs. in
crore % Rs. in
crore %
INTEREST EARNED 544 85.94 853 81.47 1242 84.95 2152 78.91 9368 74.78 OTHER INCOME 89 14.06 194 18.53 220 15.05 575 21.09 3159 25.22 TOTAL INCOME (A) 633 100 1047 100 1462 100 2727 100 12527 100 INTEREST EXPENDED 426 67.30 667 63.71 838 57.32 1559 57.17 7944 63.42 ESTABLISHMENT EXPENSE 18 2.84 36 3.44 52 3.56 147 5.39 403 3.22 OTHER OPERATING EXPENCE 65 10.27 117 11.17 283 19.36 475 17.42 1609 12.84 PROVISIONS AND CONTINGENCIES
61 9.64 122 11.65 128 8.75 288 10.56 1365 10.89
TOTAL EXPENDITURE (B) 570 90.05 942 89.97 1301 88.99 2469 90.54 11321 90.37 NET PROFIT / LOSS [A-B]
63 9.95 105 10.03 161 11.01 258 9.46 1206 9.63
TOTAL (B+C) 633 100 1047 100 1462 100 2727 100 12527 100 (Source: IBA Bulletin March 2003, January 2004.)
223
Table No. 5.11 makes it evident that during the period under study
interest earned ratio shows mixed trend. It was at the highest level with 85.94
percent of total income in the year 1998-99. But it was at the lowest level with
74.78 percent of income in the year 2002-03 during the study period.
The percentage of other income towards total income shows mixed trend
during the study period. It was at the lowest level with 14.06 percent in 1998-
99 and was at the highest level with 25.22 percent in the year 2002-03 during
the study period. The ratio of interest expended over total income showed
mixed trend during the study period. It was at the highest level with 67.30
percent of total income in the year 1998-99 and was at the lowest level with
57.17 percent of total income in the year 2001-02 during the study period.
The ratio of other expenses [Establishment expenses, other operating
expenses and provision and contingencies] over total income registered
mixed trend during the study period.
The profit of 1998-99 was Rs. 63 crore with 9.95 percent of total
income which went up to 10.03 percent in the year 1999-00 with Rs. 105
crores. It was of 11.01 percent of total income in the year 2000-01 with Rs.
161 crore. But in last two years ICICI bank not able to maintain profit ratio
towards total income by more than 10 percent. The ratio during the year 2001-
02 was 9.46 percent of total income. It was because of increase in
establishment expense. It was by 9.63 percent profit of total income in the
year 2002-03. It can be observed that there was an increase in profit from Rs.
258 crores to Rs. 1206 crores which was history in Indian banking during the
year 2002-03.
From the statement of profit and loss it can be said that ICICI Bank is
healthy and the best profit maker bank among all banks under study.
The Condensed and Common Size Balance Sheet of ICICI Bank Ltd.
has been shown in table no. 5.12

224
Table No. : 5.12 CONDENSED BALANCE SHEET
ICICI BANK LTD.
Particular 1998-99 1999-00 2000-01 2001-02 2002-03
Rs. in crore
% Rs. in crore
% Rs. in crore
% Rs. in crore
% Rs. in crore
%
CAPITAL 165 2.36 197 1.63 220 1.11 963 0.92 963 0.90 Reserve and Surplus 143 2.05 953 7.89 1092 5.53 5636 5.41 6321 5.92 Deposits 6073 86.98 9866 81.72 16378 82.98 32085 30.82 48169 45.10 Borrowing 601 8.61 1057 8.76 2047 10.38 65426 62.85 51359 48.08 Working funds 6982 100 12073 100 19737 100 104110 100 106812 100 ASSET Cash and balances with Reserve Bank of India 466 6.67 722 5.98 1232 6.24 1774 1.70 4886 4.57
Balance with banks and money at call and short notice 1172 16.79 2693 22.30 2362 11.97 11012 10.58 1603 1.50
Investments 2861 40.98 4417 36.59 8187 41.48 35891 34.47 35462 33.20 Advances 2110 30.22 3657 30.29 7031 35.62 47035 45.18 53279 49.88 Fixed Assets 200 2.86 222 1.84 385 1.95 4239 4.07 4061 3.80 Other Assets 173 2.48 362 3.00 540 2.74 4159 4.00 7521 7.05 Working funds 6982 100 12073 100 19737 100 104110 100 106812 100
(Source: IBA Bulletin March 2003, January 2004.)

225
It can be observed from table no. 5.12 that the ratio of capital towards working
funds registered gradually decreasing trend during the study period. It was at
the highest level with 2.36 percent of working funds in the year 1998-00,
which was went dawn to the lowest level in the year 2002-03; when it was
0.90 percent of working funds.
The ratio of reserve and surplus towards working funds registered
mixed trend during the study period. It was with 2.05 percent of working funds
in the year 1998-99, which was the lowest in the study period. It was at the
highest level with 7.89 percent of working funds in the year 1999-00 during
the study period.
The percentage of deposits towards working funds shows mixed trend
during the study period. However the absolute figures continuously increase
during the study period as it was Rs. 6073 crores in the year 1998-99, Rs.
9866 crores in the year 1999-00, Rs. 16378 crores in the year 2000-01, Rs.
32085 crores in the year 2001-02 and Rs. 48169 crores in the year 2002-03.
But it was 86.98 percent of working funds in 1998-99, which was at the
highest level during the study period, and it was 30.82 percent of working
funds in the year 2001-02, which was at the lowest level during the study
period.
The ratio of borrowing and other liabilities / provisions towards working
funds registered increasing trend in the first four year and decreasing in the
last year of the study period. It was at the lowest level with 8.61 percent of
working funds in the year 1998-99. It was at the highest level with 62.85
percent of working funds in the year 2001-02 during the study period.
The ratio of cash and balances with Reserve Bank of India over
working funds shows mixed trend during the study period. However the
absolute figures in Rs. always increased during the study period.
The percentage of balance with banks and money at call and short
notice over working funds registered mixed trend during the study period. It
was at the highest level with 22.30 percent of working funds in the year 1999-
00. It was at the lowest level when it was with 1.50 percent of working funds in
the year 2002-03.

226
The ratio of investment towards working funds show mixed trend during
the study period. It was at the highest level when it was with 41.48 percent of
working funds in the year 2000-01. It was at the lowest level with 33.20
percent in the year 2002-03 during the study period.
The percentage of advances towards working funds contributed an
increasing trend during the study period. It can be remarked from above
common size balance sheet that the amount of advances increased by 25
times more during the five years of the study period. The advances were
highest in 2002-03 when it was 49.88 percent of the working funds and was at
the lowest of 30.22 percent of the working funds in the year 1998-99 during
the study period. It was remarkable that the amount of advances was more
than the deposits during the year 2001-02 and 2002-03.
The percentage of fixed assets and other assets have a little share in
working funds. The ICICI bank has increased Rs. 3854 crores in fixed assets
in the year 2001-02 for expansion of ATM card center and branches all over
India and also makes an investment in other assets during the year 2002-03
with more than Rs. 3000 crores.
On the basic of forgoing analysis it can be said that ICICI Bank is a
healthy unit from the viewpoint of profitability. The ICICI Bank is the highest
profit making bank among new private sector banks in India during the study
period.
[G] HDFC BANK LTD.
The Common Size and Condensed Profit and Loss Statement of
The HDFC Bank Ltd. has been represented in table no. 5.13 from
1998-99 to 2002-03.

227
Table No. : 5.13 CONDENSED PROFIT AND LOSS STATEMENT
HDFC BANK LTD.
Particular 1998-99 1999-00 2000-01 2001-02 2002-03 Rs. in
crore % Rs. in
crore % Rs. in
crore % Rs. in
crore % Rs. in
crore %
INTEREST EARNED 376 84.68 680 84.47 1259 87.13 1703 83.64 2023 81.05 OTHER INCOME 68 15.32 125 15.53 186 12.87 333 16.36 473 18.95 TOTAL INCOME (A) 444 100 805 100 1445 100 2036 100 2496 100 INTEREST EXPENDED 229 51.58 374 46.46 754 52.18 1074 52.75 1192 47.76 ESTABLISHMENT EXPENSE 22 4.95 49 6.09 78 5.40 109 5.35 152 6.09 OTHER OPERATING EXPENCE
67 15.09 122 15.15 231 15.99 308 15.13 439 17.59
PROVISIONS AND CONTINGENCIES
44 9.91 140 17.39 172 11.90 248 12.18 325 13.02
TOTAL EXPENDITURE (B) 362 81.53 685 85.09 1235 85.47 1739 85.41 2108 84.46 NET PROFIT / LOSS [A-B]
82 18.47 120 14.91 210 14.53 297 14.59 388 15.54
TOTAL (B+C) 444 100 805 100 1445 100 2036 100 2496 100 (Source: IBA Bulletin March 2003, January 2004.)

228
The percentage of interest earn towards total income represented mixed trend
during the study period. It ranged between 81.05 percent in the year 2002-03
and 87.13 percent in the year 2000-01 of the total income.
The other income showed an increasing trend during the first two year
as it was 15.32 percent in the year 1998-99 which move towards up to 15.53
percent of total income in the year 1999-00 and diminishing trend during third
year 2000-01 when it stood 12.87% of the total income. The other expenses
of the bank, which included an establishment expenses, other operative
expenses and provisions & contingencies registered mixed trend during the
period under review. However, the absolute figures showed and increasing
trend as it was Rs. 133 crores in the year 1998-99, which finally rose up to
916 crores in 2002-03 with five times more than in the year 1998-99.
The ratio of interest expended over total income showed mixed trend
during the study period. The amount of income expended is very important
from the profitability point of view. It is direct reset of cost of the deposits of
the bank. The ratio of profit over total income was highest in all banks under
study. The profit was the highest level in the year 1998-99 when it was 18.47
percent of total income. It was at the lowest level when it was 14.53 percent of
total income in the year 2000-01.
On the basic of overall analysis of above common size profit and loss
statement of The HDFC Bank Ltd. it can be said that The HDFC Bank Ltd.
had achieved a good position among all new private sector bank. The HDFC
Bank is a healthy unit from the viewpoint of profitability.
The Condensed and Common Size Balance Sheet of HDFC Bank Ltd.
has been represented in table no. 5.14 from 1998-99 to 2002-03.
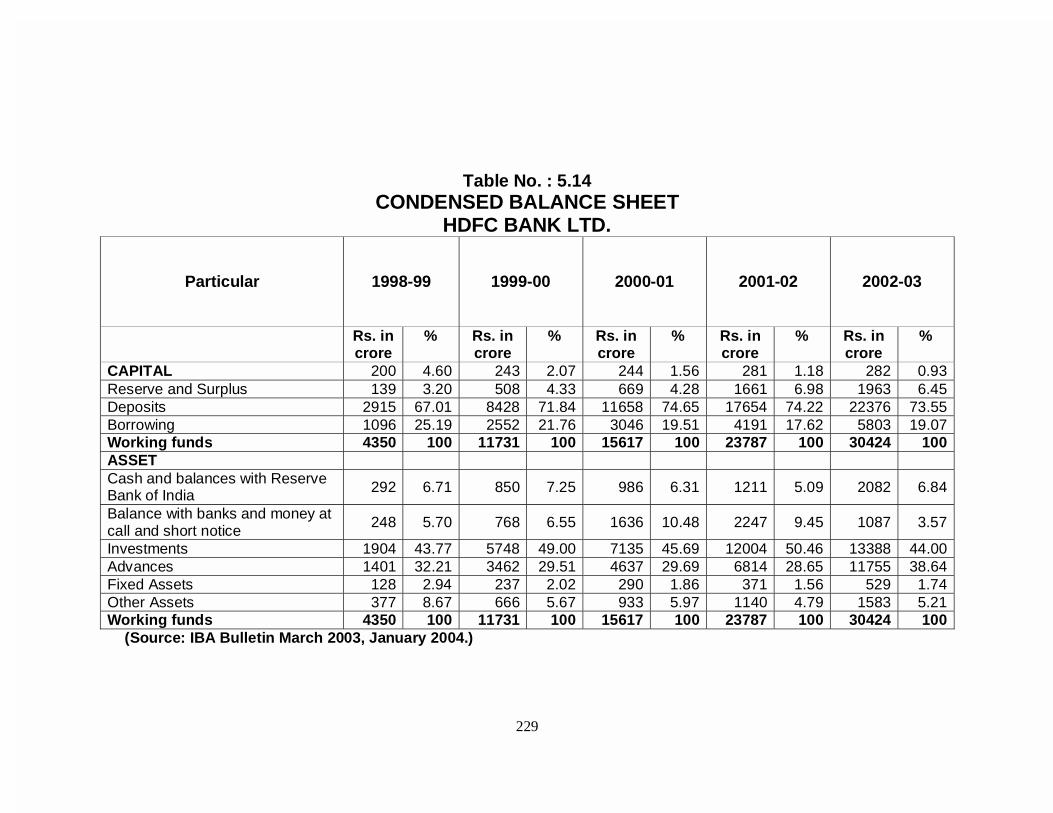
229
Table No. : 5.14 CONDENSED BALANCE SHEET
HDFC BANK LTD.
Particular 1998-99 1999-00 2000-01 2001-02 2002-03
Rs. in crore
% Rs. in crore
% Rs. in crore
% Rs. in crore
% Rs. in crore
%
CAPITAL 200 4.60 243 2.07 244 1.56 281 1.18 282 0.93 Reserve and Surplus 139 3.20 508 4.33 669 4.28 1661 6.98 1963 6.45 Deposits 2915 67.01 8428 71.84 11658 74.65 17654 74.22 22376 73.55 Borrowing 1096 25.19 2552 21.76 3046 19.51 4191 17.62 5803 19.07 Working funds 4350 100 11731 100 15617 100 23787 100 30424 100 ASSET Cash and balances with Reserve Bank of India 292 6.71 850 7.25 986 6.31 1211 5.09 2082 6.84
Balance with banks and money at call and short notice 248 5.70 768 6.55 1636 10.48 2247 9.45 1087 3.57
Investments 1904 43.77 5748 49.00 7135 45.69 12004 50.46 13388 44.00 Advances 1401 32.21 3462 29.51 4637 29.69 6814 28.65 11755 38.64 Fixed Assets 128 2.94 237 2.02 290 1.86 371 1.56 529 1.74 Other Assets 377 8.67 666 5.67 933 5.97 1140 4.79 1583 5.21 Working funds 4350 100 11731 100 15617 100 23787 100 30424 100
(Source: IBA Bulletin March 2003, January 2004.)

230
It can be remarked from the table no. 5.14 that the ratio of capital towards
working funds represented a decreasing trend during the period under study.
It was started with 4.60 percent of working funds in the year 1998-99 and
ended with 0.93 percent of working funds in the year 2002-03. However the
absolute figures in Rs. of deposits showed an increasing trend. It was Rs. 200
crores in the year 1998-99 which finally roses up to Rs. 282 crores in the year
2002-03.
The percentage of reserve and surplus over working funds was 3.20
percent of working funds in the year 1998-99, which was at the lowest level
during the study period. It was 4.33 percent in the year 1999-00, which came
dawn to 4.28 percent of working funds in the year 2000-01. The HDFC Bank
have an increase in reserve and surplus with Rs. 992 crores in the year 2001-
02 and it became Rs. 1661 crores with 6.98 percent of working funds. But
during the last year again there was slight declining trend in percentage with
6.45 percent of working funds.
The ratio of deposits over working funds registered a mixed trend
during the period under study. It was at the lowest level in the year 1998-99
when it was 67.01 percent of working funds. Due to the benefits of several
scheme for customers the HDFC Bank got a good hike in deposits during the
year 1999-00 and 2000-01 and it reached the highest level with 74.65 percent
of working funds. While it was 74.22 percent of working funds in the year
2001-02, it came down to 73.55 percent of working funds in the year 2002-03.
The ratio of borrowing and other liabilities / provision towards working funds
registered a decreasing trend during the first four years. It was 17.62 percent,
the lowest level, in the year 2001-02 and was the highest level in the year
1998-99 when it stood at 25.19 percent of the working funds. There after
during the last year of study period it recorded an increasing trend, and finally
rose up to 19.07 percent of working funds.
The cash and balances with reserve bank of India ranged between
5.09 percent in the year 2001-02 and 7.25 percent in the year 1999-00 of the
working funds.
The ratio of balance with banks and money of call and short notice
towards working funds represented a mixed trend during the study period. It
231
was the highest in the year 2000-01 when it was 10.48 percent of working
funds. It was the lowest in the year 2002-03 when it was 3.57 percent of
working funds. However the absolute figures always increase except 2002-03
during the study period.
The percentage of investment towards working funds makes it evident
that there was a mixed trend during the study period. The ratio of investment
was in the highest level in the year 2001-02 when it was 50.46 percent of
working funds. It was in the lowest level in 43.77 percent of working funds
during the study period.
The ratio of advances over working funds registered a mixed trend
during the study period. It was at 32.21 percent of working funds in the year
1998-99 which came down to 29.51 percent in the year 1999-00. But in the
year 2000-01 the ratio of advances over working funds slightly went up to
29.69 percent of working funds. It was at the highest level with 38.64 percent
in the year 2002-03 during the study period. The ratio of fixed asset ratio to
working funds represented a mixed trend during the study period.
The percentage of other assets towards working funds showed a mixed
trend during the study period. It was at the highest level in the year 1998-99
when it was 8.67 percent of working funds. It was at the lowest level in the
year 2001-02 when it was with 4.79 percent of working funds.
Referring to the above common size balance sheet of the HDFC Bank
it can be said that HDFC Bank is healthy unit and was good in customer
relationship business.
[H] GLOBAL TRUST BANK LTD.
The Common Size Income Statement [Profit and Loss Statement] of
The Global Trust Bank Ltd. is presented in the table no. 5.15

232
Table No. : 5.15 CONDENSED PROFIT AND LOSS STATEMENT
GLOBAL TRUST BANK LTD.
Particular 1998-99 1999-00 2000-01 2001-02 2002-03 Rs. in
crore % Rs. in
crore % Rs. in
crore % Rs. in
crore % Rs. in
crore %
INTEREST EARNED 491 76.96 696 79.09 897 84.46 724 75.97 540 73.87 OTHER INCOME 147 23.04 184 20.91 165 15.54 229 24.03 191 26.13 TOTAL INCOME (A) 638 100 880 100 1062 100 953 100 731 100 INTEREST EXPENDED 438 68.65 507 57.61 697 65.63 636 66.74 517 70.73 ESTABLISHMENT EXPENSE 13 2.04 18 2.05 30 2.82 36 3.78 42 5.74 OTHER OPERATING EXPENCE
81 12.70 106 12.05 134 12.62 134 14.06 135 18.47
PROVISIONS AND CONTINGENCIES
35 5.48 140 15.90 121 11.40 107 11.22 310 42.41
TOTAL EXPENDITURE (B) 567 88.87 771 87.61 982 92.47 913 95.80 1004 137.35 NET PROFIT / LOSS [A-B]
71 11.13 109 12.39 80 7.53 40 4.20 -273 -37.35
TOTAL (B+C) 638 100 880 100 1062 100 953 100 731 100 (Source: IBA Bulletin March 2003, January 2004.)

233
Unfortunately the bank suffered heavy losses during the year 2002-03.
The bank has more provisions and contingencies in the year 2002-03 with Rs.
310 crore due to advances turn to NPA. The ratio of profit towards total
income was 11.13 percent in the year 1998-99, which went up to the highest
level with 12.39 percent in the year 1999-00 and declining trend during the
next two years.
The interest earned ratio towards total income showed a mixed trend
during the study period. It was at the highest level with 84.46 percent of total
income in the year 2000-01 and was the lowest in the year 2002-03 when it
was 73.87 percent of the total income. The other income registered a mixed
trend and ranged between 15.00 to 27.00 percent of total income during the
study period.
There was a key roll of provisions and contingencies over total
expenditure during the study period. The ratio of establishment expenses
towards total income represented an increasing trend during the study period.
This ratio increased because of new recruitment which was badly needed for
new branches opened during last three years of study period.
On the analysis of above profit and loss statement, it may be noticed
that the provision for bad debts increased year after year except the year
2000-01 and 2001-02 during the study period. On the whole, it may be
concluded that from the viewpoint of profitability, the performance of the bank
is not good and this bank suffered from a heavy losses in the year 2002-03.
This bank has no NPA reduction strategy.
The Condensed and Common Size Balance Sheet of the Global Trust
Bank Ltd. has been shown in table no. 5.16

234
Table No. : 5.16 CONDENSED BALANCE SHEET
GLOBAL TRUST BANK LTD.
Particular 1998-99 1999-00 2000-01 2001-02 2002-03
Rs. in crore
% Rs. in crore
% Rs. in crore
% Rs. in crore
% Rs. in crore
%
CAPITAL 104 2.00 121 1.60 121 1.28 121 1.66 121 1.58 Reserve and Surplus 186 3.58 407 5.40 467 4.93 273 3.74 146 1.90 Deposits 4097 78.79 6199 82.19 7734 81.65 6443 88.16 6921 90.28 Borrowing 813 15.63 815 10.81 1150 12.14 471 6.44 478 6.24 Working funds 5200 100 7542 100 9472 100 7308 100 7666 100 ASSET Cash and balances with Reserve Bank of India 474 9.12 514 6.82 666 7.03 484 6.62 727 9.48
Balance with banks and money at call and short notice 107 2.06 224 2.97 54 0.57 128 1.75 78 1.02
Investments 1962 37.73 2929 38.84 3865 40.80 2900 39.68 2499 32.60 Advances 2118 40.73 3219 42.68 4100 43.29 3033 41.50 3276 42.73 Fixed Assets 327 6.29 338 4.48 379 4.00 320 4.38 301 3.93 Other Assets 212 4.07 318 4.21 408 4.31 443 6.07 785 10.24 Working funds 5200 100 7542 100 9472 100 7308 100 7666 100
(Source: IBA Bulletin March 2003, January 2004.)
235
From the above table no. 5.16 it can be observed that the ratio of
capital towards working funds represented constant decreasing trend during
the study period except the year 2001-02.
The ratio of reserves and surplus against working funds showed a
mixed trend during the study period. It was at the highest level when it was
with 5.40 percent of working funds in the year 1999-00. There was declining
trend during last three year and reached to the lowest level with 1.90 percent
of working funds in the year 2002-03. It was with Rs. 467 crores in the year
2000-01, which went down to Rs. 146 crores in the year 2002-03.
The percentage of deposits over working funds showed an increasing
trend during the study period except the year 2000-01. The ratio of deposits
over working funds was always more than 81 percent except the year 1998-
99. It was the highest in the year 2002-03 when it was 90.28 percent of the
working funds. It was the lowest in the year 1998-99 when it was 78.79
percent of working funds. However it was with Rs. 7734 crores at the highest
level in the year 2000-01. But in the year 2001-02, there was great fall in
deposits because of the depositor’s losses their trust over bank, and withdrew
their deposits.
The ratio of borrowing and other liabilities / provisions towards working
funds showed a decreasing trend except the year 2000-01 during the study
period. It was at the highest level of 15.63 percent in the year 1998-99, which
went down to the lowest level of 6.24 percent in the year 2002-03. The bank
has returned the borrowing and other liabilities more than 60 percent during
the year 2001-02 because of public demand.
The ratio of cash and balances with RBI and balance with banks and
money at call and short notice over working funds was always less than 12
percent during the study period. The ratio of investments towards working
funds represented a mixed trend during the study period. It was at the highest
level in the year 2000-01 when it was of 40.80 percent of working funds. It
was at the lowest level in the year 2002-03 when it was of 32.60 percent of
working funds.
The ratio of advances over working funds was always more than 40
percent, which shows mixed trend during the study period. It was tremendous
hike during the year 2000-01 with Rs. 3219 crore to 4100 crore with the
236
highest level with 43.29 percent of working funds. But in the next year it came
down to Rs. 3033 crores having 41.50 percent of working funds. The
fluctuation of advances shows week position of the bank. The ratio of fixed
asset over working funds represented mixed trend during the study period.
But the percentage of other assets over working period registered an
increasing trend during the study period.
On the basis of above analysis it can be said that during the year 2001-
02 the financial position of the bank was very poor. There was decreasing
trend in borrowing & other liabilities / provisions during the last two year of our
study period. From the view point of profitability the bank is passing through
adverse circumstances, which might threaten the existence of the bank during
years to come.
[I] THE BANK OF PUNJAB LTD.
The Common Size Income Statement [Profit and Loss Statement] of
The Bank of Punjab Ltd. is presented in the table no. 5.17 for the
period of 1998-99 to 2002-03.

237
Table No. : 5.17 CONDENSED PROFIT AND LOSS STATEMENT
THE BANK OF PUNJAB LTD
Particular 1998-99 1999-00 2000-01 2001-02 2002-03 Rs. in
crore % Rs. in
crore % Rs. in
crore % Rs. in
crore % Rs. in
crore %
INTEREST EARNED 186 81.22 263 85.11 340 88.77 363 75.63 353 72.34 OTHER INCOME 43 18.78 46 14.89 43 11.23 117 24.37 135 27.66 TOTAL INCOME (A) 229 100 309 100 383 100 480 100 488 100 INTEREST EXPENDED 145 63.32 189 61.17 227 59.27 273 56.88 255 52.25 ESTABLISHMENT EXPENSE 7 3.06 8 2.59 9 2.35 13 2.71 17 3.48 OTHER OPERATING EXPENCE 35 15.28 58 18.77 83 21.67 120 25.00 108 22.13 PROVISIONS AND CONTINGENCIES
10 4.37 21 6.79 29 7.57 38 7.91 76 15.58
TOTAL EXPENDITURE (B) 197 86.03 276 89.32 348 90.86 444 92.50 456 93.44 NET PROFIT / LOSS [A-B]
32 13.97 33 10.68 35 9.14 36 7.50 32 6.56
TOTAL (B+C) 229 100 309 100 383 100 480 100 488 100 (Source: IBA Bulletin March 2003, January 2004.)

238
It can be observed from the above table no. 5.17 that the ratio of interest
earned over total income showed an increasing trend during the first three-
years of the study period and a declining trend during the last two years. It
was with the highest level of 88.77 percent of total income during the year
2000-01. It was of the lowest level with 72.34 percent of the total income
during the year 2002-03. The percent of other income showed a declining
trend during the first three years. It was at the lowest level of 11.23 percent of
total income in the year 2000-01. There was an increasing trend during the
last two years. It reached up to the highest level of 27.66 percent of total
income in the year 2002-03.
The ratio of interest expended over total income represented a
decreasing trend through out the study period. In the beginning of the study
period i.e. 1998-99 it was at the highest level of 63.32 percent of the total
income. And during the last year of study period i.e. 2002-03 it was the lowest
with 52.25 percent of the total income.
The ratio of establishment expenses over total income represented a
mixed trend. It ranged between 2.35 to 3.48 percent of the total income during
the study period. But the percentage of other operating expenses towards
total income registered an increasing trend during the first four years of the
study period and during the last year i.e. 2002-03 there was a declining trend
having 22.13 percent of the total income.
The ratio of profit towards total income showed a decreasing trend
during the study period. It was at the highest level of 13.97 percent of total
income in the year 1998-99, which come down to 10.68 percent in the year
1999-00, again came down to 9.14 percent in the year 2000-01 and at the last
year i.e. 2002-03 it was at the lowest level of 6.56 percent of total income.
On the basis of above analysis it can be said that The Bank of Punjab
Ltd. was not able to fulfill its corporate goal of increasing the profit during the
study period. The Bank of Punjab Ltd. could possibly make more profit by
retail banking and safe advances in the service person area.
The Condensed and Common Size Balance Sheet of The Bank of
Punjab Ltd. has been disclosed in table No. 5.18.

239
Table No. : 5.18 CONDENSED BALANCE SHEET
THE BANK OF PUNJAB LTD
Particular 1998-99 1999-00 2000-01 2001-02 2002-03
Rs. in crore
% Rs. in crore
% Rs. in crore
% Rs. in crore
% Rs. in crore
%
CAPITAL 105 4.96 105 3.29 105 2.81 105 2.70 105 2.45 Reserve and Surplus 46 2.17 62 1.94 74 1.98 86 2.21 110 2.57 Deposits 1766 83.38 2608 81.63 3055 81.79 3354 86.38 3590 83.74 Borrowing 201 9.49 420 13.14 501 13.42 338 8.71 482 11.24 Working funds 2118 100 3195 100 3735 100 3883 100 4287 100 ASSET Cash and balances with Reserve Bank of India 195 9.21 260 8.14 207 5.54 238 6.13 406 9.47
Balance with banks and money at call and short notice 84 3.97 72 2.25 174 4.66 259 6.67 124 2.89
Investments 823 38.86 1297 40.59 1464 39.20 1371 35.31 1485 34.64 Advances 842 39.75 1301 40.72 1506 40.32 1611 41.49 1797 41.92 Fixed Assets 79 3.73 112 3.51 136 3.64 184 4.74 191 4.46 Other Assets 95 4.48 153 4.79 248 6.64 220 5.66 284 6.62 Working funds 2118 100 3195 100 3735 100 3883 100 4287 100
(Source: IBA Bulletin March 2003, January 2004.)

240
It is evident from table no. 5.18 that the amounts of capital remain same with
Rs. 105 crore during the study period but the ratio of capital towards working
funds represented a continuous decreasing trend during the study period.
The ratio of deposit towards working funds was almost more than
81.00 percent during the study period. The ratio of deposit was 83.38 percent
of working funds during the year 1998-99 which came down in the next year
to 81.63 percent. It went up to the highest level of 86.38 percent of working
funds in the year 2001-02. But after that the ratio came down during the last
year i.e. 2002-03, when it was of 83.74 percent of working funds.
The percentage of borrowing and other liabilities / provision towards
working funds represented a mixed trend during the study period. The ratio of
cash and balances with RBI and balance with banks and money at call and
short notice towards working funds showed a mixed trend during the study
period. It was of 10.12 percent in the year 2000-01 and of 13.18 percent in the
year 1998-99.
The ratio of investment over working funds represented a declining
trend during the last four years of study period. It was 38.86 percent of
working funds during the year 1998-99, which went up to the highest level of
40.59 percent in the year 1999-00. The ratio went down to the lowest level
with 34.64 percent of working funds during the year 2002-03.
The ratio of advances towards working funds registered an increasing
trend except the year 2000-01 during the study period. The ratio of advances
was always more then 40 percent except the year 1998-99 during the study
period. It was of the highest level of 41.92 percent of working funds in the year
2002-03. It was at the lowest level of 39.75 percent in the year 1998-99 during
the study period. However the absolute figures always increase during the
study period as it was Rs. 842 crores in the year 1998-99 which went up to
Rs. 1797 crores more than double in the year 2002-03. The ratio of fixed
assets towards working funds registered a decreasing trend during the first
two years and an increasing trend during the next two years and again a
decreasing trend during the last year of the study period. It ranged between
39.75 to 41.92 percent of total working funds during the study period.
241
The ratio of fixed assets was always more than 3.50 percent of working
funds. The percentage of other assets towards working funds ranged between
4.48 percent in the year 1998-99 and 6.64 percent in the year 2000-01 of the
working funds during the study period.
On the basis of the forgoing analysis it can be said that The Bank of
Punjab Ltd. is in the developmental phase from the viewpoint of profitability.
The Bank of Punjab Ltd. is a new private sector bank. This bank has much
more to do for attaining a more profitable position in future. The Bank of
Punjab Ltd. has to improve in retail banking and customer service area.
[J] UTI BANK LTD.
The Common Size Profit and Loss Statement [Income Statement] of
UTI Bank Ltd. has been presented in table no. 5.19.

242
Table No. : 5.19 CONDENSED PROFIT AND LOSS STATEMENT
UTI BANK LTD
Particular 1998-99 1999-00 2000-01 2001-02 2002-03 Rs. in
crore % Rs. in
crore % Rs. in
crore % Rs. in
crore % Rs. in
crore %
INTEREST EARNED 373 88.81 483 84.15 890 84.52 1180 73.93 1465 78.13 OTHER INCOME 47 11.19 91 15.85 163 15.48 416 26.07 410 21.87 TOTAL INCOME (A) 420 100 574 100 1053 100 1596 100 1875 100 INTEREST EXPENDED 301 71.67 393 68.47 791 75.12 980 61.40 1142 60.91 ESTABLISHMENT EXPENSE 12 2.86 15 2.61 29 2.75 50 3.13 85 4.53 OTHER OPERATING EXPENCE 39 9.29 50 8.71 101 9.59 156 9.77 238 12.69 PROVISIONS AND CONTINGENCIES
37 8.80 65 11.32 46 4.37 276 17.30 218 11.63
TOTAL EXPENDITURE (B) 389 92.62 523 91.11 967 91.83 1462 91.60 1683 89.76 NET PROFIT / LOSS [A-B]
31 7.38 51 8.89 86 8.17 134 8.40 192 10.24
TOTAL (B+C) 420 100 574 100 1053 100 1596 100 1875 100 (Source: IBA Bulletin March 2003, January 2004.)

243
It can be observed from table no. 5.19 that the ratio of net profit over total
income showed an increasing trend during the first two-years and the last two
years of the study period. In the year 2000-01 it was of 8.17 percent of total
income. However the absolute figure of profit continuously increases during
the study period. It was Rs. 31 crores in the year 1998-99 which went up to
Rs. 192 crores (more than six times up) in the year 2002-03. The interest
earned ratio represented mixed trend. It was the highest of 88.81 percent of
total income in the year 1998-99 and was the lowest of 73.93 percent in the
year 2001-02.
The role of other income in total income was excellent during the last
two years of the study period.
The interest expended ratio over total income ranged between 60.91
percent in the year 2002-03 with the lowest level and 75.12 percent in the
year 2000-01 with the highest level during the study period.
The ratio of establishment towards total income registered mixed trend
during the study period. It increased in the last two years of study period
because of new recruitment for branch development during the year 2001-02
and 2002-03.
The ratio of other operating expenses towards total income ranged
between 8.71 percent in the year 1999-00 and 12.69 percent in the year
2002-03 during the study period. The ratio of provisions and contingencies
towards total income showed a mixed trend during the study period. It was at
the lowest level of 4.37 percent in the year 2000-01 and was of the highest
level of 17.30 percent of total income in the year 2001-02.
The UTI Bank has made profit every year during the study period.
From the viewpoint of profitability it can be said that the UTI Bank is a healthy
unit.
The Condensed and Common Size Balance Sheet of UTI Bank Ltd.
has been presented in table no. 5.20 from 1998-99 to 2002-03.

244
Table No. : 5.20 CONDENSED BALANCE SHEET
UTI BANK LTD.
Particular 1998-99 1999-00 2000-01 2001-02 2002-03
Rs. in crore
% Rs. in crore
% Rs. in crore
% Rs. in crore
% Rs. in crore
%
CAPITAL 132 3.37 132 1.98 132 1.23 192 1.34 230 1.17 Reserve and Surplus 74 1.89 108 1.62 170 1.58 423 2.94 688 3.51 Deposits 3041 77.68 5720 85.77 9092 84.45 12287 85.47 16965 86.50 Borrowing 668 17.06 709 10.63 1372 12.74 1473 10.25 1730 8.82 Working funds 3915 100 6669 100 10766 100 14375 100 19613 100 ASSET Cash and balances with Reserve Bank of India 338 8.63 401 6.01 881 8.18 1123 7.81 1600 8.16
Balance with banks and money at call and short notice 158 4.04 492 7.38 330 3.07 628 4.37 1970 10.04
Investments 1101 28.12 2065 30.96 4193 38.95 6630 46.12 7841 39.98 Advances 2170 55.43 3507 52.59 4821 44.78 5352 37.23 7180 36.61 Fixed Assets 69 1.76 85 1.27 234 2.17 260 1.81 306 1.56 Other Assets 79 2.02 119 1.79 307 2.85 382 2.66 716 3.65 Working funds 3915 100 6669 100 10766 100 14375 100 19613 100
(Source: IBA Bulletin March 2003, January 2004.)

245
It can be observed from above table that the ratio of capital towards working
funds registered a mixed trend during the study period. However the absolute
figures always increase during the study period, as it was Rs. 132 crores in
the year 1998-99, which went up to Rs. 230 crores in the year 2002-03.
The ratio of reserves and surplus against working funds showed a
mixed trend during the study period. It was at the highest level of 3.51 percent
of working funds in the year 2002-03 and was at the lowest in the year 2000-
01 when it was of 1.58 percent of working funds.
The percentage of deposits over working funds showed an increasing
trend during the study period except the year 2000-01. The ratio of deposits
over working funds was always more than 84 percent except the year 1998-
99. It was the highest in the year 2002-03 when it was 86.50 percent of the
working funds. It was the lowest in the year 1998-99 when it was 77.68
percent of working funds.
The ratio of borrowing and other liabilities / provisions towards working
funds showed a decreasing trend except the year 2000-01 during the study
period. It was of the highest level of 17 percent in the year 1998-99, which
went down to the lowest level of 9 percent in the year 2002-03.
The ratio of cash and balances with Reserve Bank of India over
working funds showed mixed trend during the study period. However the
absolute figures in terms of rupee value continued to increase during the
study period.
The percentage of balance with banks and money at call and short
notice over working funds registered mixed trend during the study period. It
was at the highest level of 10.04 percent of working funds in the year 2002-
03. It was at the lowest level of 3.07 percent of working funds in the year
2000-01.
The ratio of investment towards working funds showed an increasing
trend during the first four years of the study period. It was at the highest level
of 46.12 percent of working funds in the year 2001-02. It was at the lowest
level of 28.12 percent in the year 1998-99 during the study period.
The percentage of advances towards working funds showed a
declining trend during the study period. It can be remarked that the amount of

246
advances increase year by year but the ratio of advances towards working
funds gradually decreased during the study period. The ratio was the highest
in the year 1998-99 when it was 55.43 percent of the working funds and was
at the lowest of 36.61 percent of the working funds in the year 2002-03.
The percentage of fixed assets and other assets have a little share in
working funds. The UTI bank has increased Rs. 150 crores in fixed assets in
the year 2000-01 for expansion of ATM card center and branches all over
India and also made an investment in other assets during the year 2002-03
with more than Rs. 450 crores.
On the basis of forgoing analysis it can be said that UTI Bank is healthy
unit from the viewpoint of profitability. The UTI Bank has been one of the best
profit making banks among new private sector banks in India during the study
period.
5.4 ANALYSIS AND INTERPRETATION OF CONSOLIDATED
FINANCIAL STATEMENTS:-
The Condensed and Common Size Profit and Loss Statement of public
sector & private sector banks under study has been shown in table no. 5.21
from 1998-99 to 2002-03.
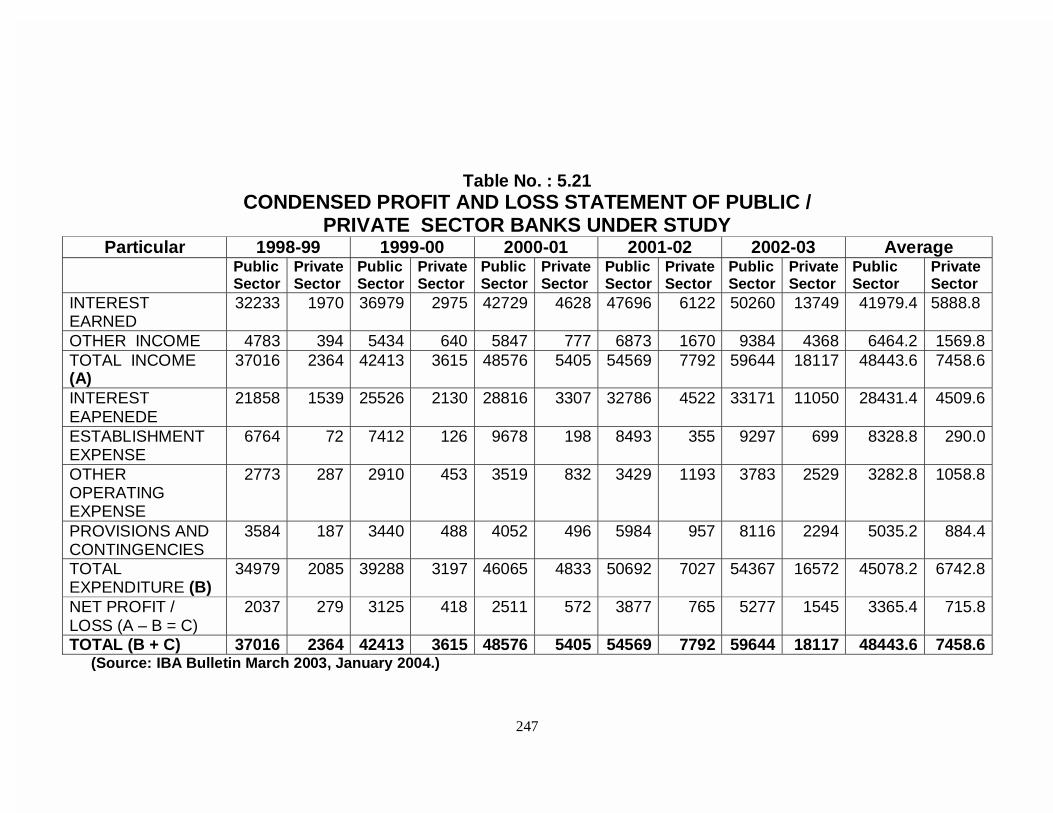
247
Table No. : 5.21 CONDENSED PROFIT AND LOSS STATEMENT OF PUBLIC /
PRIVATE SECTOR BANKS UNDER STUDY Particular 1998-99 1999-00 2000-01 2001-02 2002-03 Average
Public Sector
Private Sector
Public Sector
Private Sector
Public Sector
Private Sector
Public Sector
Private Sector
Public Sector
Private Sector
Public Sector
Private Sector
INTEREST EARNED
32233 1970 36979 2975 42729 4628 47696 6122 50260 13749 41979.4 5888.8
OTHER INCOME 4783 394 5434 640 5847 777 6873 1670 9384 4368 6464.2 1569.8 TOTAL INCOME (A)
37016 2364 42413 3615 48576 5405 54569 7792 59644 18117 48443.6 7458.6
INTEREST EAPENEDE
21858 1539 25526 2130 28816 3307 32786 4522 33171 11050 28431.4 4509.6
ESTABLISHMENT EXPENSE
6764 72 7412 126 9678 198 8493 355 9297 699 8328.8 290.0
OTHER OPERATING EXPENSE
2773 287 2910 453 3519 832 3429 1193 3783 2529 3282.8 1058.8
PROVISIONS AND CONTINGENCIES
3584 187 3440 488 4052 496 5984 957 8116 2294 5035.2 884.4
TOTAL EXPENDITURE (B)
34979 2085 39288 3197 46065 4833 50692 7027 54367 16572 45078.2 6742.8
NET PROFIT / LOSS (A – B = C)
2037 279 3125 418 2511 572 3877 765 5277 1545 3365.4 715.8
TOTAL (B + C) 37016 2364 42413 3615 48576 5405 54569 7792 59644 18117 48443.6 7458.6 (Source: IBA Bulletin March 2003, January 2004.)

248
It can be observed from the table no. 5.21 that the trend of profit of
public sector banks under study showed an increasing trend during the
first four years of study period and a decreasing trend for profit of public
sector banks under study during the last year. But for private sector
banks under study, there was an increasing trend for profit throughout
the study period. The average of profit for public sector banks under
study was Rs. 3365.4 crores and the average of profit for private sector
banks under study was Rs. 715.8 crores during the study period. The
profit of public sector banks is 4.5 times more than the profit of private
sector banks.
There was an increasing trend in income like interest earned and
other income for public sector banks under study during the study
period. But there was a mixed trend in expenditure like Establishment
exp., Other Operating Expenses and Provisions / Contingencies for public
sector banks under study during the study period. There was an
increasing trend in income and expenditure of private sector banks
under study during the study period.
On the basis of overall analysis it can be said that the private
sector banks have achieved good profit ratio which is more than 9
percent of total income during the study period, and it is remarkable that
this ratio is achieved with heavy loss of the GTB Limited in the year
2002-03.
The public sector banks under study have achieved a profit
ratio of 6.95 percent of total income during the study period which is
also good profit ratio but mainly the State Bank of India has played an
important role in this matter during the study period.
The Condensed and Common Size Balance Sheet of public
sector banks and private sector banks under study has been
represented in table no. 5.22 from 1998-99 to 2002-03.

249
Table No. : 5.22
CONDENSED BALANCE SHEET OF PUBLIC / PRIVATE SECTOR BANKS UNDER STUDY
Particular 1998-99 1999-00 2000-01 2001-02 2002-03
Public Sector
Private Sector
Public Sector
Private Sector
Public Sector
Private Sector
Public Sector
Private Sector
Public Sector
Private Sector
CAPITAL 1613 706 1613 798 1613 822 1613 1662 1788 1701 Reserve and Surplus 15674 588 18021 2038 20151 2472 23206 8079 26859 9228 Deposits 292066 17892 337241 32821 399822 47917 448764 71823 496276 98021 Borrowing 53555 3379 64302 5553 73279 8116 76599 71899 79145 59852 Working funds 362908 22565 421177 41210 494865 59327 550182 153463 604068 168802 ASSET Cash and balances with Reserve Bank of India 30737 1765 32166 2747 31977 3972 32810 4830 25924 9701
Balance with banks and money at call and short notice 47779 1769 41905 4249 54310 4556 53912 14274 39579 4862
Investments 122179 8651 148823 16456 187032 24844 218337 58796 262165 60675 Advances 137517 8641 164839 15146 191740 22095 215798 63845 244741 77287 Fixed Assets 4241 803 4621 994 4811 1424 4697 5374 4773 5388 Other Assets 20455 936 28823 1618 24995 2436 24628 6344 26886 10889 Working funds 362908 22565 421177 41210 494865 59327 550182 153463 604068 168802 (Source: IBA Bulletin March 2003, January 2004.)
250
It can be remarked from the table no. 5.22 that the average of
capital remained steady during the first four years of the study period
for public sector banks under study. The average of capital of private
sector banks under study showed a constant increasing trend during the
study period. There was more than 1.5 times increase in deposits of
public sector banks under study during the study period. But, there was
more than 5 time increase in deposits of public sector banks during
the study period. The ratio of deposits towards working fund is more
than 80 percent in public sector banks under study. But, it was less
than 60 percent of deposit towards working funds in private sector
banks during the study period. This shows higher amount of trust of the
public in the public sector banks. The growth of deposit, borrowings and
other liabilities / provisions and investment with advances was
tremendous with private sector banks under study towards public sector
banks under study.
The credit deposit ratio of private sector banks under study was
more than 75 percent in the year 2002-03, which it was only 49 percent in
public sector banks under study. This represents rosy picture for private
sector banks as compared to public sector banks. The growth of fixed
assets and other assets of private sector banks under study is higher
than public sector banks under study during the study period, as there is
considerable growth in total branches. Referring to the above common size
and condensed balance sheet of public sector banks and private sector
banks under study, it can be said that public sector banks under study
taking much more care for social responsibility. It showed steady progress
with latest technology during the study period. But, the growth and progress
of new private sector banks under study was very fast with the help
of technology up gradation and multi channel services offered to
customers during this 1998-99 to 2002-03. This private sector banks under
study have increased in deposit with 548 percent during the study period,
while, public sector banks have increased only with 170 percent during the
study period.

251
Thus, it can be said that public sector bank made poor progress in
increase of deposits as compared to private sector banks under study during
the study period.
5.5 SUMMARY:-
In this chapter the researcher has tried to analyze the common size
financial statements, which have been converted into percentage to some
common base e.g. working funds or total income. Here researcher has taken
common size Profit and Loss Statement and Balance Sheet for
private sector banks and public sector banks under study.
There are some merits and demerits of common size financial
statement which have been discussed in this chapter. In common size
statements percentages analytical method represents one type of ratio
analysis because each individual item of a Profit and Loss Statement
and Balance Sheet is expressed as percentage of total. This common
size statement analysis is also known as vertical analysis or 100
percent statement analysis. Figures of various items in the Profit and
Loss Statement and Balance Sheet have been grouped under total
income and working funds heads and the percentage of each group of
items have been calculated.
From the analysis and interpretation of various bank unit under
study it has been observed that some banks under study are facing
mismanagement of NPAs and low CDR which had effect on their
profitability. But some of the banks under study are presenting very
good progress and also high credit deposit ratio, which effected
positively to their productivity & profitability.
From the analysis of consolidated Profit and Loss Statement and
Balance Sheet of public sector and private sector banks under study it
can be seen that the Global Trust Bank has had negative contribution in
the year 2002-03 for profit. Some banks under study have average
contribution in profit but like ICICI, HDFC, SBI, PNB, BOB banks have
excellent contribution in profit and development of Indian Banking Sector
during the study period.
252
5.6 REFERENCES:-
1. Harry Simons Revised by Jpy M. Smith and K. Fred Skonsen, “Inter
Mediate Accounting” South Western Publishing, 1977, p. 585.
2. S.N. Maheshwari, “Principles of Management Accounting”, Sultan
Chand and Sons, 1981, p. 43.
3. R. D. Kennedy and S. Y. McMullen, Financial Statements from
Analysis and Interpretation, Richer D. Irwin Inc. 162, p. 247.
4. Ibid.2.
5. Ray, HI. Garison. Managerial Accounting. Concept of Planning,
Control & Decision Making, Business publication, Dallas, Texas,
1976, p. 599.
6. Ralph D. Kennedy and S.Y. McMullen. Financial Statements. Form,
Analysis and interpretation Illinois. Richard D. Irwin, Inc., 5th Edition
1968. p. 247.
7. Winston J. Korn and Thomas Boyd. Accounting for Management
Planning and Decision Making (New York, Illinois, Richard D. Irwin
1968 – p. 156.
8. John N. Mayer, “Financial Statement Analysis”, NewJurcy Prentice
Hall Inc. Engle Wood Cliffes 1969, p.86
9. “Financial Efficiency” Dr. S. J. Parmar, 2001. P. No. 171.

253
CHAPTER NO. 6 SUMMARY, FINDINGS AND SUGGESTIONS
6.1 Introduction
6.2 Summary
6.3 Findings
6.4 Suggestions

254
CHAPTER - 6
6.1 INTRODUCTION:-
Banking Industry in India has passed through different phases since
the 19th century when it appeared for the first time as private sector
institutions financing trade and commerce. After independence, the direction
of banking changed and it took upon it self the responsibility of economic
development of the country. Since then, banking activity spread all over the
country along with an increase in the volume of business. But now that the
forces of change have been unleashed in the Indian Economy over the last
decade, they have transformed the operating environment across the entire
spectrum of businesses. This coincided with the rapid development in
technology and created both an opportunity to innovate in product offerings to
customers and to improve overall efficiency, and the challenges of keeping
pace with change and gaining the first mover advantage.
Within the banking sector, increasing competition and growing risks
remain important challenges. The competition for market share is increasing
the pressure on profitability and forcing banks to trim costs, particularly
transaction costs and improve overall efficiency. Profitability, productivity and
financial efficiency have, as a result become critical objective to be aimed at.
In today’s markets, credit risk along with market risk and operational risk are
the real challenges before banks.
As an effect of liberalisation, privatisation and globalisation policy there
have not only been rapid expansion in the number of banking institutions in
the country, but the banking horizon of the country has also changed
significantly. In view of the fact that the public sector banks that have been
operating in an extremely protected economic environment and may lose out
in the wave of competition from old and new private sector banks in India.
Various schemes of financial assistance for capital restructuring of the
economically weak public sector banks were also introduced during last
decade. Besides that, the public sector banks were also given time to meet
the prudential and capital adequacy norms as well as norms to manage NPA.
So, most of the public sector banks are now working on the concept of
universal banking and service oriented banking. The whole process of reforms

255
has intensified competition leading to overall improvement in financial
performance.
Thus, now banks are confronted with the problem of how to survive in
the market. To solve such problem and to cope up with the metamorphosis
which banks are undergoing, it is essential to study their financial efficiency,
productivity and profitability, and to find the reasons of deviation and make the
revisions accordingly.
The present study has been undertaken for critical evaluation of Indian
banking sector [with reference to private sector and public sector banks]. The
study period is of five years from 1998-99 to 2002-03. The research work has
been carried out in order to fulfill the following objectives.
a. To find out the trend of financial performance of public sector banks
and private sector banks under study.
b. To examine the financial performance of public sector banks and
private sector banks under study.
c. To examine the overall productivity and profitability of public sector
banks and private sector banks.
d. To find out employees productivity and branch productivity in selected
units.
e. To study the accomplishment of social responsibility & obligations by
public sector banks and private sector banks.
In this study, the financial performance of selected banks has been
evaluated. The selection of banks has been divided in to two groups,-public
and private banks. The researcher has taken five banks from public sector
banks and five banks from private sector banks randomly. And for each bank
and each group, different types of parameters have been used with the help
of ratios to evaluate the financial performance for the period of study.
The research work has been divided in to six chapters with three major
parameters like productivity, financial efficiency with different ratios and
profitability.

256
6.2 SUMMARY:-
The entire research report has been present in the following chapters
which are as under.
In chapter number one the brief history, organisation and structure of
Indian banking before and after nationalisation, reforms and corporate
philosophy has been discussed. The researcher has focused on strengths
and weaknesses of banks and also discussed growth and overall business of
selected banks under study.
In chapter number two the researcher has described about problem of
study, objectives and scope, hypothesis and research methodology, tools and
techniques of analysis also limitation of study have been discussed.
The third chapter describes meaning of productivity and profitability,
point wise and bank wise ratio and analysis of productivity and profitability
have been discussed. These are the key indicator for evaluation of research
work.
In chapter number four the researcher has discussed about various
ratios for the purpose of financial efficiency. CAR, CRR, SLR, NPA and CDR
are main ratios discussed in this chapter.
In chapter number five the researcher has discussed and analysed a
common size profit and loss statement and common size balance sheet of
selected banks.
In the last chapter of this study the researcher has discussed and
described the summary of his research work, findings of the study and
suggestions for improvement in profitability and productivity of selected units.
6.3 FINDINGS:-
The major findings are as under.
1] In the chapter of “Analysis of productivity and profitability” the
productivity in all selective banks is calculated as under.
A] In productivity per branch by business volume, the researcher
has taken deposit plus advances of the bank as a business volume.
Productivity per branch for public sector banks shows an average of Rs. 28.02
crores productivity per branch. The ratio indicates the weak performance of
P&SB, PNB and UBI with below average. The average of productivity per
257
branch by SBI shows very good with Rs. 38.14 crores productivity per branch
among public sector banks. The performance in private sector banks
regarding productivity per branch shows excellent results during this period.
The average of productivity per branch in all private sector banks was Rs.
129.15 crores which shows more than four times compared with private sector
banks. The average of ICICI bank was with Rs. 165.99 crores per branch. The
performance of Bank of Punjab Limited was very poor in comparison to other
selected private sector banks. Thus, the productivity related to business
volume per branch was not remarkable in public sector banks.
B] In the calculation of productivity per employee the researcher
has taken deposits plus advances of the bank as a business volume. A high
ratio indicates better productivity and low ratio indicates lower productivity.
The average of public sector banks was very poor with Rs. 1.70 crores per
employee while the average of private sector banks was excellent with Rs.
8.02 crores per employee. During the year 1998-99 The UTI Bank was at the
top with Rs. 10.00 crores among all selected banks while PNB was at the
bottom with Rs. 0.91 crores per employee. In public sector banks P&SB, PNB
and SBI were below average and in private sector bank HDFC and Bank of
Punjab Limited were below average. The UTI Bank has maintained always
above Rs. 10.00 crores during study period. To improve productivity per
employee, public sector banks have to either improve deposit or advance rate
of the branches or to decrease the number of employee, by introducing VRS
scheme again.
C] The ratio based on working funds and contingent liability per
employee showed constant increasing trend in selected public sector banks.
The average of productivity by working funds per employee in public sector
banks was Rs. 1.64 crores and P&SB, PNB were below average. The
average of private sector banks under study was Rs. 11.70 crores productivity
by working funds per employee. The ICICI Bank was at the highest with Rs.
14.86 crores among all selected banks under study, they were very good to
this productivity as compared to public sector banks. It showed that through
more working funds and contingent liability and less staff strength the bank to
earned more productivity per employee. Thus, the productivity related to

258
working funds per employee was not remarkable in selected public sector
banks under study during study period.
D] Net total income should be considered as a key indicator for
productivity. The researcher has calculated productivity by net total income
per employee for selected banks under study. Productivity by net total income
per employee represented consistent increase in public sector banks. But the
private sector banks recorded mixed trend in productivity during this period.
Net total income per employee of P&SB was below the average with Rs. 0.13
crores per employees. Same trend has been observed in PNB also. But SBI,
BOB and Bank of Punjab Limited were above the average during study
period. The average of private sector banks was excellent as compared to
public sector banks. Productivity by net total income per employee of UTI
Bank was with Rs. 0.84 crores which was the highest in all selected banks
under study. During the year 1998-99 PNB was at the lowest level with Rs.
0.08 crores and GTB was at the highest with Rs. 0.85 crores per employee.
Same trend has been observed in the next year i.e. 1999-00 and 2000-01.
During the year 2001-02 UTI Bank was at the highest with Rs. 0.93 crores
while PNB was at the lowest with Rs. 0.13 crores. During the year 2002-03
ICICI Bank was at all time high among all selected banks with Rs. 1.18 crores
and PNB once again at the lowest level with Rs. 0.15 crores net total income
per employee. From the view point of productivity by net total income per
employee, the performance was not remarkable in public sector banks under
study.
E] The ratio of productivity by net profit per employee shows how
efficiently employee working in the market. With the analysis of productivity by
net profit, the performance of public sector banks was not remarkable
because the average productivity by net profit per employee of public sector
banks was only Rs. 0.009 crores per employee. While the average of private
sector banks unit was Rs. 0.068 crores per employee which was more than
seven time higher than the public sector banks. In case of public sector
banks, P&SB was very poor in relation to this ratio and PNB, BOB, UBI and
SBI were on and above the average. In case of private sector banks, GTB
suffered heavy losses during the year 2002-03 showing a dangerous situation

259
for the survival in the year to come. The Bank of Punjab Limited was not able
to maintain this ratio above the average of private sector banks.
F] Table No. 6.1 Average Productivity Ratios during the study period
Productivity
Name of Bank
under study
By Business
Volume Per
Branch
By Business
Volume Per
employee
By working
funds per
employee
By net total
income per
employee
By net
profit per
employee
Public Sector Banks Punjab & Sind Bank 22.44 1.57 1.39 0.13 0.003
Punjab National Bank 21.96 1.42 1.35 0.11 0.009
Bank of Baroda 31.44 1.95 1.89 0.15 0.012
Union Bank of India 26.11 1.95 1.76 0.15 0.010
State Bank of India 38.14 1.59 1.80 0.14 0.009
Average 28.02 1.70 1.64 0.14 0.009
Private Sector Banks ICICI Bank 165.99 8.85 14.86 0.67 0.066
HDFC Bank 122.41 5.70 11.89 0.48 0.075
UTI Bank 166.07 11.00 13.49 0.84 0.072
Global Trust Bank Ltd. 131.49 8.89 11.82 0.82 0.078
Bank of Punjab Ltd. 59.76 5.68 6.46 0.49 0.048
Average 129.15 8.02 11.70 0.66 0.068
(Source: Computed from Data Collected from IBA Bulletin March–03 Jan–04)
The above table no. 6.1 shows various average productivity ratios for
selected banks during study period. Overall performance of P&SB is very
poor. P&SB is the second lowest among public sector banks except in net
profit per employee. The average profit per employee of P&SB was at Rs.
0.003 crores which is the lowest among all selected banks. P&SB can make
more business, but it is also important to earn more profit per employee. PNB
was at the lowest during study period among all selected banks. But ratio of
net profit per employee of PNB was second highest. This is because of only
very high staff strength and branch network as compared to other banks. BOB
was in a strong position for various productivities among public sector banks.
BOB has a good staff strength and multi activity branch network with various

260
customer products. UBI was in a good position for productivity of business
volume per branch. SBI was having an excellent position as per analysis of
above productivity. The productivity ratios average of private sector banks
unit was excellent and always more than four times as compared to public
sector banks. The Bank of Punjab Limited was very poor in all productivity
ratio as compared to other private sector banks. While ICICI and UTI Bank
have showed tremendous performance. HDFC Bank and GTB was good in all
productivity ratios as compared to other private sector banks. Overall view of
productivity ratios it can be said that the performance of P&SB in public sector
banks and Bank of Punjab Limited in private sector banks was not remarkable
in selected banks under study.
G] The profitability is an important aspect of performance appraisal
and evaluation, which indicated the ability to perform various tasks in the most
effective way. The overall profitability of Indian banking sector had been
significantly differed in all selected banks during the study period. The
profitability ratio position of P&SB is very poor as compared to other banks
under study. The average of profitability for public sector banks was 0.62
while the average of P&SB was only 0.27. But BOB showed outstanding
performance among selected public sector banks. BOB and SBI also showed
good performance regarding profitability. UBI was at the highest level of 1.08
during the year 2002-03 but its average profitability was below the average of
public sector banks. The average of profitability for private sector banks was
Rs. 0.83 per Rs. 100 of working funds. ICICI Bank, HDFC Bank, UTI Bank
and Bank of Punjab Limited were having above the average of profitability.
While GTB facing heavy loss during the year 2002-03, Because of this
reason, The GTB was having below the average profitability among all private
sector banks under study.
2] In the chapter of “Analysis of Financial Efficiency” the various ratios
have been discuss as under.
A] In this study, the significant difference was found among all
banks under study regarding all the ratios relating to financial efficiency. Tier –
I Capital, which is a core capital of a bank and shows the soundness of a
bank, was tested. In public sector banks, Tier – I Capital ratio had shown

261
decreasing trend in 1998-99 to 2001-02. But after that the trend had gone up
because of best performance by PNB, BOB and UBI during the year 2002-03.
Tier – I capital of BOB and SBI was found tremendous. In private sector
banks Tier – I capital had shown increasing trend in 1999-00 and 2000-01.
But after that the trend had gone down with weak performance of ICICI Bank
and GTB mostly. Tier – I capital of HDFC Bank was found tremendous. The
average of Tier – I capital as compared to public sector banks, was found
good with 9.076 percent, in the private sector banks ICICI Bank, HDFC Bank
and Bank of Punjab Limited were having above the average of Tier – I capital.
B] The another aspect of financial efficiency is Tier – II capital, the
subordinate capital of a bank. The position of public sector banks consistently
improved during the period of study. The data shows that the highest level of
Tier – II capital maintain by UBI with 5.55 percent during the year 2002-03
among all banks under study, while GTB had a very poor performance with
0.00 percent during the year 2002-03. The average of Tier – II capital the
public sector banks found good with 4.108 percent as compared to private
sector banks. P&SB, PNB, BOB and UBI were having above the average of
4.00 percent of Tier – II while SBI, ICICI, HDFC, UTI, GTB and Bank of
Punjab Limited were having below the average of 4.00 percent of Tier – II
capital.
C] Capital Adequacy Ratio was comparatively high than RBI
guideline in all selected banks under study. P&SB showed mixed trend during
the study period. This bank maintained this ratio above the RBI guidelines but
below the average of public sector banks under study. Same trend can be
observed in PNB and UBI. BOB and SBI were found tremendous results
during this period with CAR having ratio over and above RBI guideline and the
average of public sector banks under study. During the year 1998-99 BOB
was at the top in public sector banks with 13.30 percent CAR. During the year
2001-02 and 2002-03, SBI was at the top among all public sector banks with
13.35 and 13.50 percent respectively. In private sector banks CAR had shown
mixed trend during the period. The average of CAR was 12.096 percent which
was higher than the average of public sector banks. ICICI, GTB and Bank of
Punjab Limited were found to show tremendous results with above the

262
average while HDFC and UTI represented poor performance. The average
CAR of ICICI Bank was 12.962 percent at the top and the average CAR of
UTI bank was 10.712 percent at the bottom among all selected banks under
study.
D] The second aspect of financial efficiency taken by the
researcher was net NPA to net advances, which is major issue for the banking
industry. NPA of P&SB was quite higher than others, however, it showed
decreasing trend during the year 2000-01 to 2002-03. The average NPA of
P&SB was 10.95 percent during this period. P&SB is performance was very
poor in recovery of advances. NPA of PNB was below the average with
decreasing trend. Same trend found in BOB, UBI and SBI also. In private
sector banks under study the average of NPA was 3.73 percent which shows
half of the average of public sector banks. NPA of ICICI Bank, HDFC Bank,
GTB and Bank of Punjab Limited had shown mixed trend during the study
period. Only UTI Bank was having a decreasing trend in NPA with always less
than one percent. During the year 2002-03 GTB suffered in heavy losses. The
NPA of GTB was 19.77 percent which was the highest among all selected
banks under study.
E] Credit Deposit Ratio was also another parameter for measuring
efficiency in this study. The ratio of total advances granted by a bank to its net
demand and time deposits on any particular date is called the CDR of the
bank. The CDR improved well in private sector banks as compared to public
sector banks. The average CDR of public sector banks was 48.39 percent
and the average CDR of private sector banks was 54.38 percent during this
period. BOB, PNB and UBI was having above the average of CDR while
P&SB and SBI were having under the average of CDR during the study
period. During the year 2001-02, BOB was at the highest level with 54.47
percent CDR among all public sector banks. During the year 1998-99, UBI
was at the lowest level with 38.80 percent CDR among all selected public
sector banks. The average CDR of private sector banks was 54.38 percent.
The average of CDR of ICICI, UTI and GTB was always above 50.00 percent.
During the year 2001-02 The ICICI Bank was at the highest level in Indian
Banking Industries with 146.59 percent CDR. The average CDR of HDFC
Bank and Bank of Punjab Limited was 44.01 percent and 48.99 percent

263
respectively. More than 50.00 percent CDR shows higher financial efficiency
in banks.
F] In the analysis of Cash Reserve Ratio, it can be said that as per
section 42[1] of the RBI act requires every bank included in the second
schedule annexed there to maintain an average daily balance with the RBI,
the amount of which shall not be less than three percent of the total of the
demand and time liabilities in India. During the year 1998-99 there was three
time change in CRR by RBI from 10.00 percent 11.00 percent and 10.50
percent respectively. But only one time change on 08-05-1999 with 10.00
percent during the year 1999-00. During the year 2000-01 there was two time
change with up to 8.00 percent showing decreasing trend. During the year
2001-02 and 2002-03 there was constant decreasing trend from 8.00 percent
to 4.75 percent of CRR. The 4.75 percent CRR was all time lowest during the
year 2002-03.
G] SLR is not simply a measurement tool for fiscal and monetary
regulation but it is being managed by RBI with control over liquidity position in
Banking Industry. The effective SLR was 34.50 percent since September –
1981 which continuously decreased till October – 1997 when it was 25
percent. The SLR has been remained unchanged since October – 1997.
Hence today the effective SLR is 25 percent.
6.4 SUGGESTIONS:-
For improving the working of the public sector banks and private sector
banks in India following suggestions emerge for consideration.
Productivity per employee: - In regard to this research work with regard to productivity per employee
of public sector banks, almost all of these banks performed poorly. Two banks
viz, Punjab National Bank and P & S Bank have recorded worst performance.
A critical review of the year-to-year performance of these two banks reveals
that they have shown some improvement in successive years under study.
This in itself indicates that the banks have certain untapped potential which if
properly oriented can result in a better performance. On the whole the entire
group of public sector banks under review present a dismal picture in terms of
employee productivity.

264
Similarly when the group of private sector banks is taken for comparison all
the banks have fared well with the sole exception of Bank Of Punjab Ltd.
Hence the following suggestions are made to improve the situation:
1) The major asset of the banks being their human resources, they should
be redeployed matching their skillsets and providing on the job training
wherever necessary in order to derive optimum level of efficiency and
productivity. Apparently there is a mismatch in the deployment of
resources, which resulted in lower productivity.
2) The banks should adopt more aggressive marketing strategies in line
with the new private sector banks to add to the business volumes both
in terms of deposits as well as advances.
3) With numerous technological features coming into day to day banking
resulting in diminishing reliance on men than the machines, the excess
staff should be used for marketing bank’s products thereby increasing
volumes in terms of credit as well as deposits.
4) As regards the poor performance of Bank Of Punjab Ltd., in the private
sector, it is noted that the Bank has finalized its plans to merge with
Centurion Bank and once the merger takes place it is going to improve
on productivity front.
Productivity per branch:-
A comparative study of public sector banks under review reveals that
the performance of P&SB, PNB and UBI is below average whereas SBI and
BOB have registered above average performance. Similarly among the
private sector banks, the performance of HDFC Bank and Bank of Punjab is
below average while other banks have fared better. In respect to the average
business per branch of public sector banks is way below that of the private
sector banks. It is therefore safe to assume that the private sector banks have
been implementing a well-defined strategy to perform exceedingly well.
The following suggestions are made to improve the productivity per
branch in relation to public sector banks.
1] The bank should close down the unviable bank branches by
selling out the existing business to some other bank which has
been able to maintain a sustainable growth rate.

265
2] Increase the business volume at branches by adopting
aggressive marketing strategies and by redeployment of staff
wherever necessary.
Profitability: -
A critical evaluation of profitability of public sector banks reveals that
except P&SB, all the other banks have recorded an improvement in the ratio
post VRS for the year 2002-03. The position of P&SB reveals an alarming
situation where in the bank is on the verge of going into red. However the
position of other public sector banks is not that promising where as it was
expected that with the exit of about one lakh employees from the banking
system under VRS. The banks were unable to make improvement in the
profitability to the desired levels as an indicator of efficient functioning of any
organisation run on commercial considerations. The position of private sector
banks is also not impressive enough and among these banks the position of
GTB Limited is scary to say the least.
The following suggestions are made to retrieve the position for the
banks under study.
1] The banks should shed high cost deposits.
2] The banks should strive for batter deposit mix there by reducing
the cost of deposit and improve profitability.
3] The public sector banks should in consultation with the
government of India formulate another VRS / CRS scheme to
reduce the cost incurred on wages and there by improve
profitability.
4] High yielding advances should be aggressively marketed to
improve earning / income.
5] Cut down on wasteful expenditure.
6] Strive for increasing fee-based income on services like issue of
drafts, opening of letters of credit, issue of guarantees and other
ancillary services.
7] By adopting the above measures the spread will improve
resulting in improved profitability.
266
Non-Performing Assets: -
A comparative study of NPA positions of public sector banks reveals
that P&SB with an average percentage of NPAs at 10.95 has recorded the
worst performance. Similarly among the private sector banks, GTB Limited
with NPA level of 19.77 percent for the year 2002-03 and an average of 7.15
percent for the five years under study discloses an alarming situation. In fact
GTB Limited being of recent origin, the magnitude of NPAs signals that the
bank is sinking.
Overall, the average NPA level of public sector banks stand at 7.30 Vis
a Vis private sector banks at 3.73. The reasons are not too far to seek and
they have been elaborately discussed herein before and for the sake of
brevity the same is not repeated. The following suggestions are made which
can progressively reduce the banks NPA level, which in effect will result in
better profitability.
1] Banks in particular public sector banks are required to identify top 100
NPA accounts in the banks and form a team at head office level comprising of
officials having the requisite expertise and exposure and depute them to the
branches in groups where the incidences of NPAs is large. The overall team
leader will be chairman and managing director of the bank who will directly
monitor the recoveries. This is so because at the branch level it is often seen
either the staff are not well equipped to deal with these matters decisively or
the top management do not have trust in their field functionaries. The teams
so deputed should take advantage of Securitisation Act-2002 and take
measures swiftly auction the assets held by bank for realization of dues. By
delaying action and getting entangled in procedural wrangles will only result in
diminishing value of assets in the charge of the bank causing avoidable loss
to the bank.
2] Loan disbursing mechanism should be strengthened through proper
and scientific evaluation of the quality of assets being financed.
3] Recovery through legal means should be speeded up by effective
follow-up.
4] Increase the volume of credit ensuring the quality of assets.

267
5] Study the market trends and adjust the credit mix to various segments
without following the age-old methods.
6] Control and restrict the advances to those sectors where the banks
experience has not been satisfactory.
Capital Adequacy Ratio:-
The Capital Adequacy Ratio for all the public sector banks is above
benchmark level of a percent and there appears to be no immediate threat in
satisfying the stipulated norms for these banks in the near future. When we
look at the private sector banks, all the banks are satisfying the requirements
of CAR the sole exception is of GTB Limited whose CAR for the year 2002-03
is zero. It means a total erosion of capital and reserves in the books of banks.
Subsequently during the year 2004 the bank’s position worsened beyond
repair in all key parameters. Therefore Government of India has decided to
merge GTB Limited with OBC (nationalised bank). The bank financially sound
and has achieved commendable progress over the years. The government
has therefore thought it fit to merge GTB Limited with OBC to safeguard
depositors interest as well as borrowers interest. Hence it is felt that any
suggestion for improving the situation of GTB Limited becomes irrelevant at
this point of time.
Credit Deposit Ratio:-
P&SB Bank have the lowest CDR at 44.21 percent among the public
sector banks. With regard to private sector banks, UTI Bank with CDR of
42.32 percent is at the lowest level. The suggestions for improvement of CDR
for these banks are as under.
1] By raising the level of advances while ensuring the quality of assets so
that the profitability is not effected.
2] By shedding high cost deposits so as to improve CDR as well as
increase profitability.
Overall Suggestions:-
1] Appropriate use of technology for improvement in the quality of
customer service and ensuring efficiency in operations is crucial for the
effective functioning of banks in emerging competitive environment. Success

268
lies in aligning technology with the business strategy and redefining
processes to get maximum advantage.
2] The attitude of bankers will have to be more customers oriented than
procedure oriented. Banks also should provide customer services during
extended business hours and also provide ATM facilities covering residential
areas to facilitate customers in with drawing cash at any time of the day and
night as per their convenience.
3] Real progress and prosperity depend on harmonious relations among
all staff members, customers and all areas of banking. The appointment of
CEOs or other top executives should be made by a group of eminent persons
functioning efficiently. This would ensure depoliticisation of the process and
improved transparency in the accounts of the banks for its shareholders and
general public. The process of any reforms in banking system can not gather
momentum without evolving reforms in the area of Human Resource
Development. Overstaffing, over unionisation and rigid frame work of
promotions and transfers, also lack of effective leadership are the principal
contributory factors to the disquieting trend in Personal Management. Thus,
the policy should be redefined to making the employees committed to the
organisation and to the changes that are taking place and to face the future
challenges as a cohesive team.
4] There is a need for increasing competition in the Indian banking system
given that the limited entry of small banks allowed so far is unlikely to
introduce such competition on an adequate scale. One option is to allow large
scale entry of private banks. Allowing the large scale entry of private banks to
provide more meaningful competition could help improve the performance of
public sector banks, but it has the risk of forcing closure of weak public sector
banks. The more viable option would there fore be to privatise at least some
of the public sector bank.
5] Innovation with technology can add to bank’s competitive edge
in rendering services to its clients. If it is not possible to be the first in the
market, the next best is to become a fast follower i.e. to quickly adapt to the
new idea and operationalise it at the earliest. It is necessary to stay ahead,
constantly upgrade the products and create new markets. Those who develop
innovative methods to reduce cost and provide cheaper and quality service

269
and products at reasonable prices will win. Overall it can be said that the
banks also need to improve their product portfolio and must strive to be a one-
stop shop for the financial needs of middle and upper class income and high
net worth individuals. This would be a good step to be a market leader in the
highly competitive financial market.
270
BIBLIOGRAPHY
Agarmal B. M. and Advanced Accounting, Shuchita Prakashan (P)
Gupta M. P. Ltd.
Aggarwal H. N. “A portrait of nationalized banks A study with
reference of their social obligations” Inter India
Publications, DELHI – 1979.
Agarwal Pradeep and “Banking, The Challenges of Deregulation” In
Sarkar Jayati, Indian Development Report (Ed. Kirit S. Parekh)
Indira Gandhi Institute of Development Research –
Mumbai P. 216. (1991).
Aggarwal V. and ‘Bank Audit’ – Advanced Auditing for CA final
P. K. Sharma Published by Tayal Institute of Professional
studies. Page No. 129 to 132
Ahuja Kanta Op. Cit. P. 27 – 28 (1996).
Angadi V. B. Measurement of Efficiency in Banking Industry,
BBI.
Angadi V.B. and, “Productivity and profitability of banks in India”
V.J. Devaray Economic and Political weekly, vol. 18 (48) Nov.
26, 1983.
Antioch L. “Measuring productivity in the Australian Banking
Oster A. sector” submission to the National Australia Bank
(NAB) P.P. 201-212. (1999)
Amandeep “Profit and profitability in commercial banks, Deep &
Deep publication, New Delhi – 1993.

271
B. Samal “EVA-A Key performance measure” proceeding of
the Bank Economists conference p-82/8 (2002).
Banerjee Amalesh and Banking and Financial Sector Reforms in India,
Singh S. K. Deep and Deep Publication.
Batra Vinod Development Banking in India, Printwell Publishers,
Jaipur.
Basin T.M. ” Technology implementation and HRD Initiatives
in public sector banks in India Proceeding of the
bank Economists conference-2002. PP 248-316
(2002).
Bedi H. L. and Edited by C. R. Rao Practical Banking Advances,
Dardika V. K. UBS Publishers Distributors Ltd.
Berger A.N., “The Efficiency of financial Institutions: A Review
W.C. Hunter and and preview of Research. Past present and future.”
S.G. Timme Journal of Banking and finance, 17 (2/3) P.P. 221-
249 (1993).
Bhalla V. K. Contemporary Issues in Finance, Anmol
Publications Pvt. Ltd.
Bhall V. K. Financial Management & Policy, Anmol
Publications, 1998
Bhall V. K. Working Capital Management, 4th Rev. Edition,
Anmol Publication, 2001.
Bhatasana V.K. “Appraisal of financial performance of State Bank
of India” Ph.D. Thesis Saurashtra University Rajkot
1999.

272
Bhatia B. S. and Management of Capital Markets, Financial Services
Batra G. S. and Institutions Deep & Deep Publications.
Bhole L. M. Financial Institutions and Market Structure, Growth
and Innovations, 3rd Edition, Tata McGraw Hill
Limited, 1999.
Bradley Joseph F. “Administrative financial management” New York
Braves & Noble – 1964 p-104.
Chakrabarti Problems of Co-operative Development in India,
Pranabkumar S.Chand & Co., 1983.
Chandra Prasanna Financial Management, 5th Edition, Tata McGraw
Hill.
Chandra M. “On increasing profitability of public sector banks”, a
note pigmy economic review, vol. 38, Nov. 1992.
Chidambaram P. “In Bank Economists Meet” March – 1989 P. XXXIII.
Chopra K. Profit, Profitability and Productivity in Public Sector
Banking, ABS Publication, Jalandhar, 1987.
Desai C. J. “Analyzing productivity in banking: concept and
methodology.” Prajnan, July-Sept-1983 P.P. 185-
193.
Desai V. R. M. Banking Development in India, Rawat Publications,
Jaipur, 1978.

273
Dwivedi D. N. Managerial Economics, Vikas Publishing House Pvt.
Ltd., 1996.
Ganesh K. “Monitoring Profitability in Banks.” The Commerce
July 1979, p-25-27.
Gardon and Natarajan Banking Theory and Practice, Himalaya publishing
House.
Garg S. C. Indian Banking-Cost & Profitability, Anmol
Pubications, New Delhi, 1993.
Garison Ray, HI. Managerial Accounting. Concept of Planning,
Control & Decision Making, Business publication,
Dallas, Texas, 1976, p. 599.
Ghosh D. N. Performance of Public Sector Banks in India An
Evaluation, Allied Publication Pvt. Ltd., New Delhi,
1979.
Godse V.Y. “Centralized Data Base: Concept and Relevance
IBA Bulletin Dec. – 2002.
Government of India “Report of the committee on banking sector reforms.”
(1998).
Gujaral N.S. “Retail Banking in the changing scenario”
proceeding of the Bank economists conference –
2002 pp. 94-98.
Gupta M. C. Profitability Analysis : An Empirical Approach,
Pointer Publishers, Jaipur, 1989.
Henry D. “Productivity is key to outsourcing Alltel information
services. (2002).

274
Hingorani N. L. Management Accounting, Sultan Chand & Sons.
Ramnathan A. R. and
Grewal T. S.
Howard Bion B. and Introduction to Business Finance, Tata McGraw Hill.
Upton Miller op. Cit p. 147.
Hundekar S. G. Productivity in Banks, Printwell Offset Printers,
Jaipur, 1995.
IBM financial service chap No.5 “Promoting productivity in Banks.”
Indian Institue of Guidelines for Answering Associate Examination
Bankers Feb. 1999, IIB Mumbai.
Jagwant Singh, “Indian banking industries growth and trends in
productivity” Deep & Deep publication, New Delhi –
1993.
Jilani Rasaid In his statement as Chairman IBA Bulletin
September – 1997 Page – 11.
Joshi P. N. “Profitability and profit planning in banks”, The
Journal of Indian Institute of Bankers vol. 57 No.2
APRIL – JUNE – 1986.
Kanthale A. K. The impact of monetary and credit policies on the
working result of commercial banks and suggestion
for offsetting the effects on their profitability. Paper
presented at bank economists meet. Hosted by
Indian bank Madras 1984.
275
Katira Swati “Comparative Analysis of financial efficiency of
Banking Industry in Gujarat state.” Ph.D. Thesis –
Dec. 2002 – Saurashtra University – Rajkot.
Kennedy Ralph D. and Financial Statements. Form, Analysis and
McMullen S.Y. interpretation Illinois. Richard D. Irwin, Inc., 5th
Edition 1968. p. 247.
Khatik S. K. “ Financial Appraisal of IDBI Bank Ltd.” In Indian
Journal of Accounting Vol. XXXIII – Dec. 2002.
Kothari C. R, Research Methodology, Wishwa Prakashan, 1997.
Kulkarni L. K. Developmental Responsibility and Profitability of
Banks; Economic & Political weekly, vol. 14 (34)
Aug 25, 1979.
Lall G. S. and “A critical appraisal on the profitability of commercial
J. Panda banks”, Indian Journal of banking & finance, vol. 5,
1991-1992.
Lapsley Irvine and Accounting and Performance Measurement Issues
Falconer Mitchell in the Private and Public Sectors, Paul Chapman
Publishing Ltd.
Maheshwari S. N. “Principles of Management Accounting”, Sultan
Chand and Sons, 1981, p. 43.
Makarand, Social Priority Index of Public Sector Banks
Allahabad Bank Publications, Calcutta – 1979.
Mayer John N. “Financial Statement Analysis”, NewJurcy Prentice
Hall Inc. Engle Wood Cliffes 1969, p.86

276
Michael V.P. “Research methodology in management” Himalaya
publishing House Bombay 1985 P.No. 107.
Mishra M. N. Analysis of profitability of commercial banks, Indian
journal of banking & finance vol.5, 1992.
Mithani D. M. Money Banking, International Trade and Public
Finance, Himalaya Publishing House.
Nayan Kamal Commercial Banks in India. Performance Evalution,
Deep and Deep publishing New Delhi, 1985.
Nigam Sudha Financial Efficiency, Print well publishers.
Oxford Dictionary of Finance and Banking, 2nd
Edition, Oxford University Press.
Nathwani Nirmal : “The study of financial performance of banking
sector of India.” Thesis sub. In Saurashtra
University – Rajkot. 2004.
Oza J. Productivity and Profitability of Public Sector Banks
in India. An international comparison, Printwell
Publishing house.
Parmar S. J. Financial Efficiency – Modern Tools and
Techniques, Raj Book Accounting, Reston
Publishing Co., Inc.2001. Page No. 171.
Patel Mohan “Functions and operations of commercial banks in a
developing economic with special reference to
India.” Thesis sub. In Saurashtra University –
Rajkot. 2002.
277
Prabhu Yardi Banker’s guide to Non-Performing Advances,
Identification, Income Recognition, Asset
Classification and Provisionin, Yardi Prabhu
Consultants Pvt. Ltd., March 2002.
Rajagopalang A. V. “Productivity in banks, an overview” Trends and
challenges to Indian banking.” (Ed.), S.S. Huger,
Deep & Deep publication, New Delhi – 1993.
Rangarajan C. “Imparatives of Banking in India” RBI Bulletin, New
Delhi, September, P. 1062. (1994)
Rathi Gokul B. and Non-Performing Assets, A Practical Handbook,
Sandhane, Smita M. Tanvi Publications, Pune, 2002.
Sadare A. M. Profitability in banks, pigmy economic review, vol.
37, No.9, April, 1992.
Sayeed O. B. “Correlates of organizational Health, productivity
and effectiveness: A study of some organizational
and managerial personality variables related to
productivity and effectiveness of some branches of
State Bank of India” Ph.D. Thesis, University of
Udaipur (1974).
Seshadri J.H. “An Economics Analysis of profitability in
commercial Banks” July-Sept vol. – IX No.3 P
215/216.
Shah S.G. “Bank profitability: The real issues” The Journal of
the Indian institute of Banker’s Vol. 50 No.5 July,
Sept. 1979.
278
Shahbhag N. A. Resource allocation and process composition for
batter profitability, paper presented in banks
economists conference – at Bangalore Jan. 1991.
Sharma N. K. Management Accountancy, RBSA Publishers,
Jaipur, 1993.
Simons Harry “Inter Mediate Accounting” Revised by Jpy M. Smith
and K. Fred Skonsen, South Western Publishing,
1977, p. 585.
Srinivasan R. Priority sector lending “Himalaya publishing house,
New Delhi – 1995.
Shaffer Barry Financial Ratio Part 5 Vineyard Notes # 8, internet.
“Tanna’s Banking Law and Practice in India” India Law House
– Cannaught Palace – New Delhi.
Tarapore S. S. In his lecture delivered as chief guest IBA Bulletin
September – P. 20. (1997).
Thingalaya N. K. Op. Cit. P. 12 (1997).
Toor N. S. Analysis of Balance Sheet, Skylark Publications,
March ’02.
Triplett J. E. “Banking out put” in Eat well etal (ads) New Pal
grave Dictionary of money and finance. Macmillan
London p p 143-146. (1990).
Vashisht A. K. Performance Appraisal of commercaial Banks in
India, PH. D. Thesis, Himachal Pradesh University.

279
Velayudham T. K. “Development in Indian Banking” Article in Platinum
Jubilee Special – Bank Quest Dec. 2002.
Verma H. L. & “Fund management in commercial banks”, Deep &
A.K. Malhotra Deep publication. New Delhi – 1993.
VYAS M. R. “Financial performance of rural banks, Jaipur”
Arihant publishers 1991.
Winston J. Korn and Accounting for Management Planning and Decision
Thomas Boyd. Making (New York, Illinois, Richard D. Irwin 1968 –
p. 156.
Watson Denzil and Corporate Finance-Principles and Practice,
Head Anthony Taxmann India, 2002.
ARTICLES
Bhaskar P. R. Banking Cost Structure – Changing with times,
Chartered Financial Analyst, Nov. 1998.
Ghose B. K. Bank Nationalisation-Promises and Performance,
The Journal of IIB, vol 58 / No. 3, Jul.-Sep. 1987.
Sharma R. H. NPA Management and Profitability, The Journal of
IIB, Vol 67 / No. 2, Apr-June 1996.
Sivaprakasam M. R. Norms for Capital Adequacy, The Journal of IIB, Vol
70 / No. 4, Oct-Dec. 1999.
Vashisht Dheeraj Asset Liability Management in Banks, The Journal
of IIB Vol 67 / No. 4.

280
PERIODICALS
Banking Statistics – RBI Bombay
Business India – Dec.2002 (Best Banks)
Business Standard
Economic & Political Weekly – February 2002
Gujarat Samachar dated 25/11/2002 & 30/12/2002.
IBA Bulletin Special Issue – March 2003.
IBA Bulletin – January 2004.
The Economic Times
The Financial Express – survey 2002
JOURNALS
Bank Quest – December 2002.
Souvenir published at IV conference of Asia and pacific accounts, New Delhi
– 1965-1 p-143.
Indian Banking year Book – 1998.
REPORTS
Annual Reports of BOB 2002-03
Annual Reports of PNB 2002-03
Annual Reports of UBI 2002-03
Annual Reports of SBI 2002-03
Annual Reports of ICICI 2002-03
Annual Reports of HDFC 2002-03
Annual Reports of UTI 2002-03
WEB SITES
www.namastheri.com
www.indiainfoline.com
www.rbi.org.com.
www.googal.com.
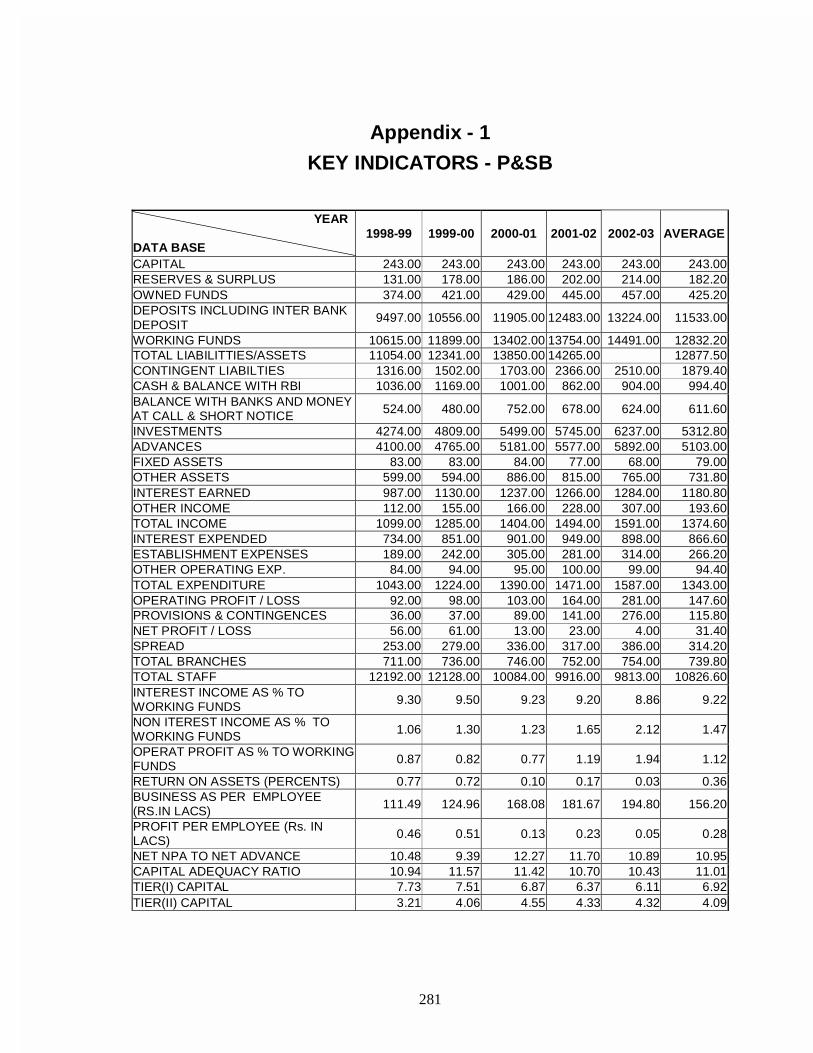
281
Appendix - 1
KEY INDICATORS - P&SB
YEAR DATA BASE
1998-99 1999-00 2000-01 2001-02 2002-03 AVERAGE
CAPITAL 243.00 243.00 243.00 243.00 243.00 243.00 RESERVES & SURPLUS 131.00 178.00 186.00 202.00 214.00 182.20 OWNED FUNDS 374.00 421.00 429.00 445.00 457.00 425.20 DEPOSITS INCLUDING INTER BANK DEPOSIT
9497.00 10556.00 11905.00 12483.00 13224.00 11533.00
WORKING FUNDS 10615.00 11899.00 13402.00 13754.00 14491.00 12832.20 TOTAL LIABILITTIES/ASSETS 11054.00 12341.00 13850.00 14265.00 12877.50 CONTINGENT LIABILTIES 1316.00 1502.00 1703.00 2366.00 2510.00 1879.40 CASH & BALANCE WITH RBI 1036.00 1169.00 1001.00 862.00 904.00 994.40 BALANCE WITH BANKS AND MONEY AT CALL & SHORT NOTICE 524.00 480.00 752.00 678.00 624.00 611.60
INVESTMENTS 4274.00 4809.00 5499.00 5745.00 6237.00 5312.80 ADVANCES 4100.00 4765.00 5181.00 5577.00 5892.00 5103.00 FIXED ASSETS 83.00 83.00 84.00 77.00 68.00 79.00 OTHER ASSETS 599.00 594.00 886.00 815.00 765.00 731.80 INTEREST EARNED 987.00 1130.00 1237.00 1266.00 1284.00 1180.80 OTHER INCOME 112.00 155.00 166.00 228.00 307.00 193.60 TOTAL INCOME 1099.00 1285.00 1404.00 1494.00 1591.00 1374.60 INTEREST EXPENDED 734.00 851.00 901.00 949.00 898.00 866.60 ESTABLISHMENT EXPENSES 189.00 242.00 305.00 281.00 314.00 266.20 OTHER OPERATING EXP. 84.00 94.00 95.00 100.00 99.00 94.40 TOTAL EXPENDITURE 1043.00 1224.00 1390.00 1471.00 1587.00 1343.00 OPERATING PROFIT / LOSS 92.00 98.00 103.00 164.00 281.00 147.60 PROVISIONS & CONTINGENCES 36.00 37.00 89.00 141.00 276.00 115.80 NET PROFIT / LOSS 56.00 61.00 13.00 23.00 4.00 31.40 SPREAD 253.00 279.00 336.00 317.00 386.00 314.20 TOTAL BRANCHES 711.00 736.00 746.00 752.00 754.00 739.80 TOTAL STAFF 12192.00 12128.00 10084.00 9916.00 9813.00 10826.60 INTEREST INCOME AS % TO WORKING FUNDS 9.30 9.50 9.23 9.20 8.86 9.22
NON ITEREST INCOME AS % TO WORKING FUNDS 1.06 1.30 1.23 1.65 2.12 1.47
OPERAT PROFIT AS % TO WORKING FUNDS 0.87 0.82 0.77 1.19 1.94 1.12
RETURN ON ASSETS (PERCENTS) 0.77 0.72 0.10 0.17 0.03 0.36 BUSINESS AS PER EMPLOYEE (RS.IN LACS) 111.49 124.96 168.08 181.67 194.80 156.20
PROFIT PER EMPLOYEE (Rs. IN LACS) 0.46 0.51 0.13 0.23 0.05 0.28
NET NPA TO NET ADVANCE 10.48 9.39 12.27 11.70 10.89 10.95 CAPITAL ADEQUACY RATIO 10.94 11.57 11.42 10.70 10.43 11.01 TIER(I) CAPITAL 7.73 7.51 6.87 6.37 6.11 6.92 TIER(II) CAPITAL 3.21 4.06 4.55 4.33 4.32 4.09
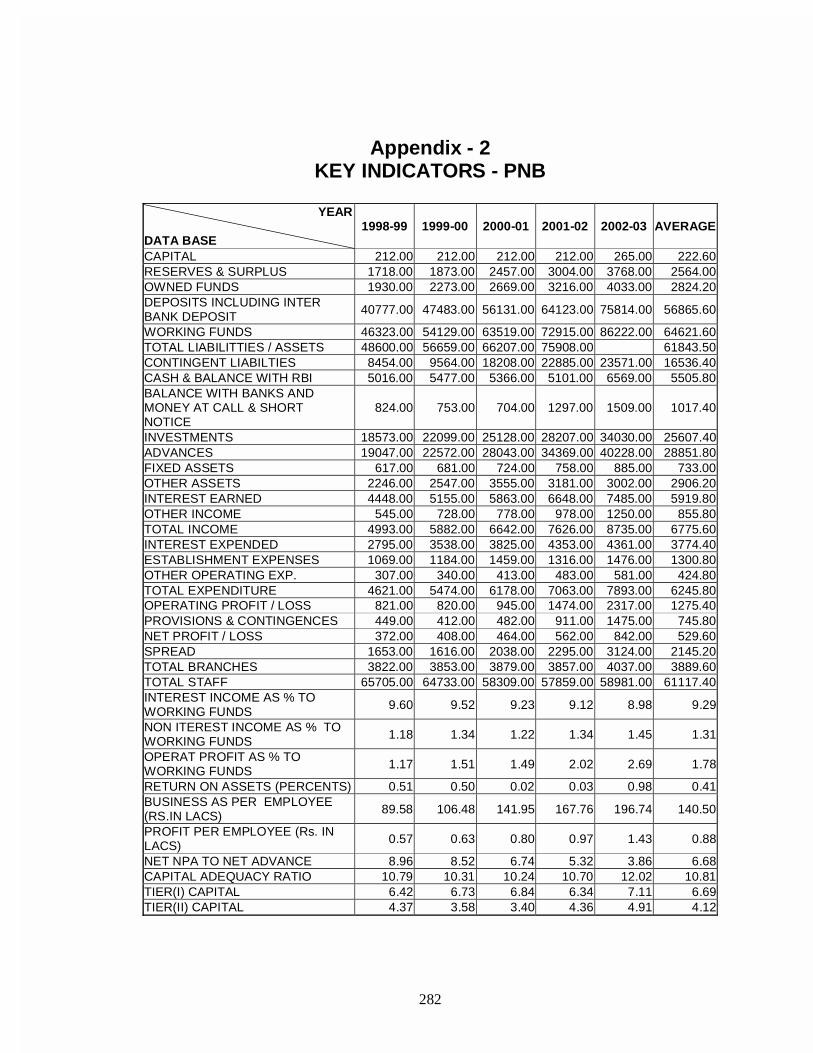
282
Appendix - 2 KEY INDICATORS - PNB
YEAR DATA BASE
1998-99 1999-00 2000-01 2001-02 2002-03 AVERAGE
CAPITAL 212.00 212.00 212.00 212.00 265.00 222.60 RESERVES & SURPLUS 1718.00 1873.00 2457.00 3004.00 3768.00 2564.00 OWNED FUNDS 1930.00 2273.00 2669.00 3216.00 4033.00 2824.20 DEPOSITS INCLUDING INTER BANK DEPOSIT 40777.00 47483.00 56131.00 64123.00 75814.00 56865.60
WORKING FUNDS 46323.00 54129.00 63519.00 72915.00 86222.00 64621.60 TOTAL LIABILITTIES / ASSETS 48600.00 56659.00 66207.00 75908.00 61843.50 CONTINGENT LIABILTIES 8454.00 9564.00 18208.00 22885.00 23571.00 16536.40 CASH & BALANCE WITH RBI 5016.00 5477.00 5366.00 5101.00 6569.00 5505.80 BALANCE WITH BANKS AND MONEY AT CALL & SHORT NOTICE
824.00 753.00 704.00 1297.00 1509.00 1017.40
INVESTMENTS 18573.00 22099.00 25128.00 28207.00 34030.00 25607.40 ADVANCES 19047.00 22572.00 28043.00 34369.00 40228.00 28851.80 FIXED ASSETS 617.00 681.00 724.00 758.00 885.00 733.00 OTHER ASSETS 2246.00 2547.00 3555.00 3181.00 3002.00 2906.20 INTEREST EARNED 4448.00 5155.00 5863.00 6648.00 7485.00 5919.80 OTHER INCOME 545.00 728.00 778.00 978.00 1250.00 855.80 TOTAL INCOME 4993.00 5882.00 6642.00 7626.00 8735.00 6775.60 INTEREST EXPENDED 2795.00 3538.00 3825.00 4353.00 4361.00 3774.40 ESTABLISHMENT EXPENSES 1069.00 1184.00 1459.00 1316.00 1476.00 1300.80 OTHER OPERATING EXP. 307.00 340.00 413.00 483.00 581.00 424.80 TOTAL EXPENDITURE 4621.00 5474.00 6178.00 7063.00 7893.00 6245.80 OPERATING PROFIT / LOSS 821.00 820.00 945.00 1474.00 2317.00 1275.40 PROVISIONS & CONTINGENCES 449.00 412.00 482.00 911.00 1475.00 745.80 NET PROFIT / LOSS 372.00 408.00 464.00 562.00 842.00 529.60 SPREAD 1653.00 1616.00 2038.00 2295.00 3124.00 2145.20 TOTAL BRANCHES 3822.00 3853.00 3879.00 3857.00 4037.00 3889.60 TOTAL STAFF 65705.00 64733.00 58309.00 57859.00 58981.00 61117.40 INTEREST INCOME AS % TO WORKING FUNDS 9.60 9.52 9.23 9.12 8.98 9.29
NON ITEREST INCOME AS % TO WORKING FUNDS 1.18 1.34 1.22 1.34 1.45 1.31
OPERAT PROFIT AS % TO WORKING FUNDS 1.17 1.51 1.49 2.02 2.69 1.78
RETURN ON ASSETS (PERCENTS) 0.51 0.50 0.02 0.03 0.98 0.41 BUSINESS AS PER EMPLOYEE (RS.IN LACS) 89.58 106.48 141.95 167.76 196.74 140.50
PROFIT PER EMPLOYEE (Rs. IN LACS) 0.57 0.63 0.80 0.97 1.43 0.88
NET NPA TO NET ADVANCE 8.96 8.52 6.74 5.32 3.86 6.68 CAPITAL ADEQUACY RATIO 10.79 10.31 10.24 10.70 12.02 10.81 TIER(I) CAPITAL 6.42 6.73 6.84 6.34 7.11 6.69 TIER(II) CAPITAL 4.37 3.58 3.40 4.36 4.91 4.12
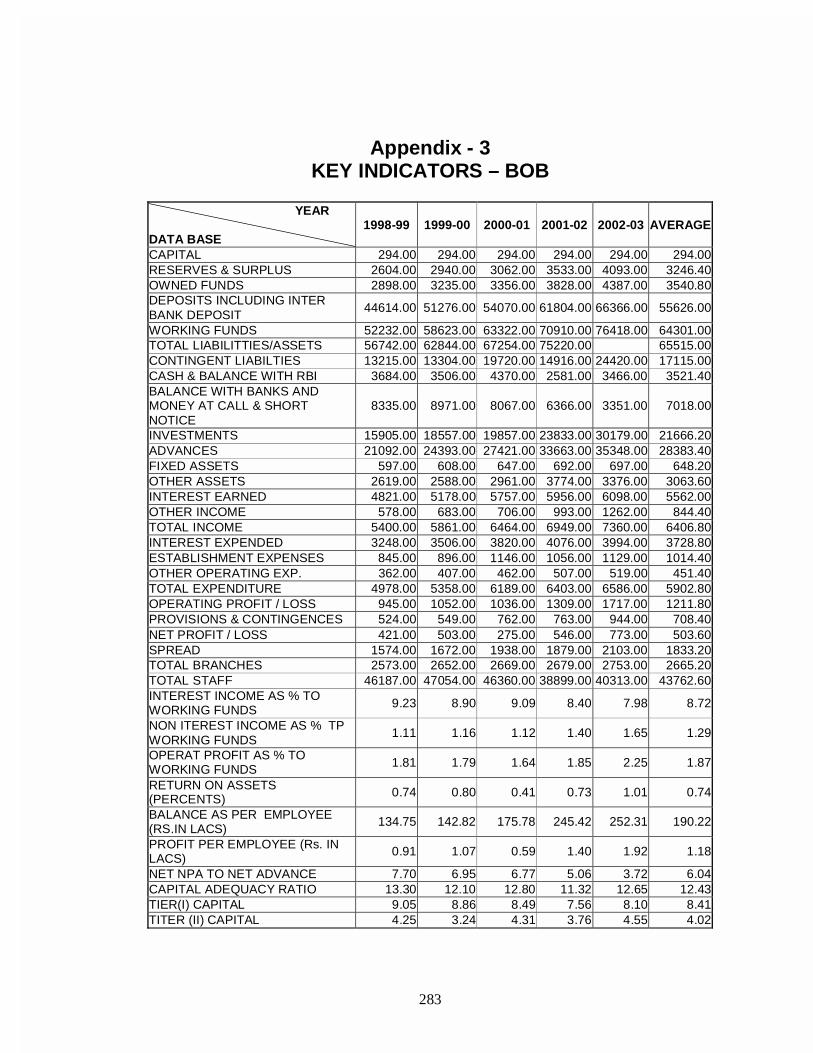
283
Appendix - 3 KEY INDICATORS – BOB
YEAR DATA BASE
1998-99 1999-00 2000-01 2001-02 2002-03 AVERAGE
CAPITAL 294.00 294.00 294.00 294.00 294.00 294.00 RESERVES & SURPLUS 2604.00 2940.00 3062.00 3533.00 4093.00 3246.40 OWNED FUNDS 2898.00 3235.00 3356.00 3828.00 4387.00 3540.80 DEPOSITS INCLUDING INTER BANK DEPOSIT
44614.00 51276.00 54070.00 61804.00 66366.00 55626.00
WORKING FUNDS 52232.00 58623.00 63322.00 70910.00 76418.00 64301.00 TOTAL LIABILITTIES/ASSETS 56742.00 62844.00 67254.00 75220.00 65515.00 CONTINGENT LIABILTIES 13215.00 13304.00 19720.00 14916.00 24420.00 17115.00 CASH & BALANCE WITH RBI 3684.00 3506.00 4370.00 2581.00 3466.00 3521.40 BALANCE WITH BANKS AND MONEY AT CALL & SHORT NOTICE
8335.00 8971.00 8067.00 6366.00 3351.00 7018.00
INVESTMENTS 15905.00 18557.00 19857.00 23833.00 30179.00 21666.20 ADVANCES 21092.00 24393.00 27421.00 33663.00 35348.00 28383.40 FIXED ASSETS 597.00 608.00 647.00 692.00 697.00 648.20 OTHER ASSETS 2619.00 2588.00 2961.00 3774.00 3376.00 3063.60 INTEREST EARNED 4821.00 5178.00 5757.00 5956.00 6098.00 5562.00 OTHER INCOME 578.00 683.00 706.00 993.00 1262.00 844.40 TOTAL INCOME 5400.00 5861.00 6464.00 6949.00 7360.00 6406.80 INTEREST EXPENDED 3248.00 3506.00 3820.00 4076.00 3994.00 3728.80 ESTABLISHMENT EXPENSES 845.00 896.00 1146.00 1056.00 1129.00 1014.40 OTHER OPERATING EXP. 362.00 407.00 462.00 507.00 519.00 451.40 TOTAL EXPENDITURE 4978.00 5358.00 6189.00 6403.00 6586.00 5902.80 OPERATING PROFIT / LOSS 945.00 1052.00 1036.00 1309.00 1717.00 1211.80 PROVISIONS & CONTINGENCES 524.00 549.00 762.00 763.00 944.00 708.40 NET PROFIT / LOSS 421.00 503.00 275.00 546.00 773.00 503.60 SPREAD 1574.00 1672.00 1938.00 1879.00 2103.00 1833.20 TOTAL BRANCHES 2573.00 2652.00 2669.00 2679.00 2753.00 2665.20 TOTAL STAFF 46187.00 47054.00 46360.00 38899.00 40313.00 43762.60 INTEREST INCOME AS % TO WORKING FUNDS 9.23 8.90 9.09 8.40 7.98 8.72
NON ITEREST INCOME AS % TP WORKING FUNDS
1.11 1.16 1.12 1.40 1.65 1.29
OPERAT PROFIT AS % TO WORKING FUNDS 1.81 1.79 1.64 1.85 2.25 1.87
RETURN ON ASSETS (PERCENTS) 0.74 0.80 0.41 0.73 1.01 0.74
BALANCE AS PER EMPLOYEE (RS.IN LACS)
134.75 142.82 175.78 245.42 252.31 190.22
PROFIT PER EMPLOYEE (Rs. IN LACS)
0.91 1.07 0.59 1.40 1.92 1.18
NET NPA TO NET ADVANCE 7.70 6.95 6.77 5.06 3.72 6.04 CAPITAL ADEQUACY RATIO 13.30 12.10 12.80 11.32 12.65 12.43 TIER(I) CAPITAL 9.05 8.86 8.49 7.56 8.10 8.41 TITER (II) CAPITAL 4.25 3.24 4.31 3.76 4.55 4.02

284
Appendix - 4
KEY INDICATORS – UBI
YEAR DATA BASE
1998-99 1999-00 2000-01 2001-02 2002-03 AVERAGE
CAPITAL 338.00 338.00 338.00 338.00 460.00 362.40 RESERVES & SURPLUS 1345.00 1409.00 1511.00 1769.00 2107.00 1628.20 OWNED FUNDS 1683.00 1747.00 1849.00 2107.00 2567.00 1990.60 DEPOSITS INCLUDING INTER BANK DEPOSIT 28136.00 31105.00 34888.00 39794.00 44749.00 35734.40
WORKING FUNDS 31229.00 35021.00 38978.00 44375.00 51060.00 40132.60 TOTAL LIABILITTIES/ASSETS 33310.00 37604.00 40625.00 47048.00 39646.75 CONTINGENT LIABILTIES 5445.00 6087.00 6874.00 8471.00 14617.00 8298.80 CASH & BALANCE WITH RBI 3609.00 3112.00 2744.00 2393.00 2247.00 2821.00 BALANCE WITH BANKS AND MONEY AT CALL & SHORT NOTICE
2276.00 3468.00 2574.00 2513.00 1652.00 2496.60
INVESTMENTS 12140.00 11479.00 13672.00 15410.00 19371.00 14414.40 ADVANCES 10918.00 15007.00 17505.00 21383.00 25515.00 18065.60 FIXED ASSETS 750.00 771.00 763.00 755.00 733.00 754.40 OTHER ASSETS 1536.00 1184.00 1720.00 1921.00 1542.00 1580.60 INTEREST EARNED 2869.00 3315.00 3733.00 4016.00 4306.00 3647.80 OTHER INCOME 263.00 299.00 312.00 499.00 825.00 439.60 TOTAL INCOME 3132.00 3614.00 4045.00 4515.00 5131.00 4087.40 INTEREST EXPENDED 2037.00 2358.00 2514.00 2679.00 2809.00 2479.40 ESTABLISHMENT EXPENSES 514.00 612.00 756.00 687.00 689.00 651.60 OTHER OPERATING EXP. 270.00 253.00 263.00 280.00 329.00 279.00 TOTAL EXPENDITURE 2971.00 3513.00 3889.00 4201.00 4578.00 3830.40 OPERATING PROFIT / LOSS 310.00 392.00 511.00 869.00 1304.00 677.20 PROVISIONS & CONTINGENCES
150.00 290.00 356.00 555.00 751.00 420.40
NET PROFIT / LOSS 160.00 101.00 155.00 314.00 553.00 256.60 SPREAD 832.00 957.00 1219.00 1337.00 1498.00 1168.60 TOTAL BRANCHES 2119.00 2136.00 2053.00 2023.00 2020.00 2070.20 TOTAL STAFF 30834.00 30376.00 28044.00 25822.00 25706.00 28156.40 INTEREST INCOME AS % TO WORKING FUNDS 9.19 9.47 9.58 9.05 8.43 9.14
NON ITEREST INCOME AS % TO WORKING FUNDS 0.84 0.85 0.80 1.12 1.61 1.04
OPERAT PROFIT AS % TO WORKING FUNDS 0.99 1.12 1.31 1.96 2.55 1.59
RETURN ON ASSETS (PERCENTS)
0.48 0.27 0.38 0.67 1.08 0.58
BUSINESS AS PER EMPLOYEE (RS.IN LACS)
112.94 135.44 186.83 236.92 273.33 189.092
PROFIT PER EMPLOYEE (Rs. IN LACS)
0.52 0.33 0.55 1.22 2.15 0.95
NET NPA TO NET ADVANCE 8.70 7.97 6.87 6.26 4.91 6.94 CAPITAL ADEQUACY RATIO 10.09 11.42 10.86 11.07 12.41 11.17 TIER(I) CAPITAL 7.87 6.66 6.19 6.16 6.86 6.75 TIER(II) CAPITAL 2.22 4.76 4.67 4.91 5.55 4.42

285
Appendix - 5
KEY INDICATORS – SBI
YEAR DATA BASE 1998-99 1999-00 2000-01 2001-02 2002-03 AVERAGE
CAPITAL 526.00 526.00 526.00 526.00 526.00 526.00 RESERVES & SURPLUS 9876.00 11621.00 12935.00 14698.00 16677.00 13161.40 OWNED FUNDS 10402.00 12147.00 13462.00 15224.00 17203.00 13687.60 DEPOSITS INCLUDING INTER BANK DEPOSIT 169042.00 196821.00 242828.00 270560.00 296123.00 235074.80
WORKING FUNDS 222509.00 261505.00 315644.00 348228.00 375877.00 304752.60 TOTAL LIABILITTIES /
ASSETS 231774.00 263815.00 323725.00 358405.00 294429.75
CONTINGENT LIABILTIES 66415.00 82383.00 83669.00 102213.00 106106.00 88157.20 CASH & BALANCE WITH RBI 17392.00 18903.00 18496.00 21873.00 12738.00 17880.40 BALANCE WITH BANKS AND MONEY AT CALL & SHORT NOTICE
35820.00 28233.00 42213.00 43058.00 32443.00 36353.40
INVESTMENTS 71287.00 91879.00 122876.00 145142.00 172348.00 120706.40 ADVANCES 82360.00 98102.00 113590.00 120806.00 137758.00 110523.20 FIXED ASSETS 2194.00 2478.00 2593.00 2415.00 2389.00 2413.80 OTHER ASSETS 13456.00 21910.00 15875.00 14934.00 18201.00 16875.20 INTEREST EARNED 19108.00 22201.00 26139.00 29810.00 31087.00 25669.00 OTHER INCOME 3285.00 3569.00 3883.00 4174.00 5740.00 4130.20 TOTAL INCOME 22392.00 25770.00 30022.00 33985.00 36827.00 29799.20 INTEREST EXPENDED 13044.00 15273.00 17756.00 20729.00 21109.00 17582.20 ESTABLISHMENT EXPENSES 4147.00 4478.00 6012.00 5153.00 5689.00 5095.80 OTHER OPERATING EXP. 1749.00 1817.00 2287.00 2058.00 2253.00 2032.80 TOTAL EXPENDITURE 21364.00 23719.00 28417.00 31553.00 33722.00 27755.00 OPERATING PROFIT / LOSS 3451.00 4202.00 3967.00 6045.00 7775.00 5088.00 PROVISIONS & CONTINGENCES 2423.00 2151.00 2363.00 3613.00 4670.00 3044.00
NET PROFIT / LOSS 1028.00 2052.00 1604.00 2432.00 3105.00 2044.20 SPREAD 6063.00 6928.00 8383.00 9081.00 9978.00 8086.60 TOTAL BRANCHES 8982.00 9043.00 9078.00 9085.00 9081.00 9053.80 TOTAL STAFF 237504.00 233433.00 214845.00 209462.00 208998.00 220848.40 INTEREST INCOME AS % TO WORKING FUNDS 8.59 8.49 8.28 8.56 8.27 8.44
NON ITEREST INCOME AS % TO WORKING FUNDS 1.48 1.36 1.23 1.20 1.53 1.36
OPERAT PROFIT AS % TO WORKING FUNDS 1.55 1.61 1.26 1.74 2.07 1.65
RETURN ON ASSETS (PERCENTS) 0.44 0.78 0.50 0.68 0.83 0.65
BUSINESS AS PER EMPLOYEE (RS.IN LACS) 93.64 111.20 165.90 186.84 207.60 153.04
PROFIT PER EMPLOYEE (Rs. IN LACS)
0.43 0.87 0.75 1.16 1.48 0.94
NET NPA TO NET ADVANCE 7.18 6.41 6.03 5.63 4.12 5.87 CAPITAL ADEQUACY RATIO 12.51 11.49 12.79 13.35 13.50 12.73 TIER(I) CAPITAL 9.36 8.28 8.58 9.22 8.81 8.85 TIER(II) CAPITAL 3.15 3.21 4.21 4.13 4.69 3.88

286
Appendix - 6 KEY INDICATORS – ICICI Ltd.
YEAR DATA BASE
1998-99 1999-00 2000-01 2001-02 2002-03 AVERAGE
CAPITAL 165.00 197.00 220.00 963.00 963.00 501.60 RESERVES & SURPLUS 143.00 953.00 1092.00 5636.00 6321.00 2829.00 OWNED FUNDS 308.00 1150.00 1313.00 6599.00 7289.00 3331.80 DEPOSITS INCLUDING INTER BANK DEPOSIT 6073.00 9866.00 16378.00 32085.00 48169.00 22514.20
WORKING FUNDS 6982.00 12073.00 19737.00 104110.00 106812.00 49942.80 TOTAL LIABILITTIES/ASSETS 7420.00 12834.00 20944.00 105433.00 36657.75 CONTINGENT LIABILTIES 5014.00 9780.00 13848.00 39447.00 89439.00 31505.60 CASH & BALANCE WITH RBI 466.00 722.00 1232.00 1774.00 4886.00 1816.00 BALANCE WITH BANKS AND MONEY AT CALL & SHORT NOTICE
1172.00 2693.00 2362.00 11012.00 1603.00 3768.40
INVESTMENTS 2861.00 4417.00 8187.00 35891.00 35462.00 17363.60 ADVANCES 2110.00 3657.00 7031.00 47035.00 53279.00 22622.40 FIXED ASSETS 200.00 222.00 385.00 4239.00 4061.00 1821.40 OTHER ASSETS 172.00 361.00 540.00 4158.00 7521.00 2550.40 INTEREST EARNED 544.00 853.00 1242.00 2152.00 9368.00 2831.80 OTHER INCOME 89.00 194.00 220.00 575.00 3159.00 847.40 TOTAL INCOME 633.00 1047.00 1462.00 2727.00 12527.00 3679.20 INTEREST EXPENDED 426.00 667.00 838.00 1559.00 7944.00 2286.80 ESTABLISHMENT EXPENSES 18.00 36.00 52.00 147.00 403.00 131.20 OTHER OPERATING EXP. 65.00 117.00 283.00 475.00 1609.00 509.80 TOTAL EXPENDITURE 570.00 942.00 1301.00 2468.00 11321.00 3320.40 OPERATING PROFIT / LOSS 125.00 227.00 290.00 545.00 2571.00 751.60 PROVISIONS & CONTINGENCES 61.00 121.00 129.00 287.00 1365.00 392.60 NET PROFIT / LOSS 63.00 105.00 161.00 258.00 1206.00 358.60 SPREAD 119.00 186.00 404.00 593.00 1424.00 545.20 TOTAL BRANCHES 55.00 81.00 355.00 358.00 446.00 259.00 TOTAL STAFF 889.00 1344.00 4491.00 7726.00 10617.00 5013.40 INTEREST INCOME AS % TO WORKING FUNDS
7.79 7.06 6.29 2.07 8.77 6.40
NON ITEREST INCOME AS % TO WORKING FUNDS
1.28 1.61 1.12 0.55 1.84 1.28
OPERAT PROFIT AS % TO WORKING FUNDS
1.78 1.88 1.47 0.52 2.41 1.61
RETURN ON ASSETS (PERCENTS)
0.85 0.82 0.77 0.24 1.13 0.76
BUSINESS AS PER EMPLOYEE (RS.IN LACS)
513.91 1006.20 521.26 1024.07 955.53 804.19
PROFIT PER EMPLOYEE (Rs. IN LACS)
7.11 10.92 3.59 3.34 11.00 7.19
NET NPA TO NET ADVANCE 2.88 1.53 2.19 5.48 5.21 3.46 CAPITAL ADEQUACY RATIO 11.06 19.64 11.57 11.44 11.10 12.96 TIER(I) CAPITAL 7.32 17.42 10.42 7.47 7.05 9.94 TIER(II) CAPITAL 3.74 2.22 1.15 3.97 4.05 3.03

287
Appendix - 7
KEY INDICATORS – HDFC Ltd.
YEAR DATA BASE
1998-99 1999-00 2000-01 2001-02 2002-03 AVERAGE
CAPITAL 200.00 243.00 244.00 281.00 282.00 250.00 RESERVES & SURPLUS 139.00 508.00 669.00 1661.00 1963.00 988.00 OWNED FUNDS 339.00 752.00 913.00 1942.00 2245.00 1238.2 DEPOSITS INCLUDING INTER BANK DEPOSIT
2915.00 8428.00 11658.00 17654.00 22376.00 12606.2
WORKING FUNDS 4350.00 11731.00 15617.00 23787.00 30424.00 17181.8 TOTAL LIABILITTIES / ASSETS 4838.00 12796.00 16783.00 24824.00 14810.25 CONTINGENT LIABILTIES 8423.00 11633.00 15011.00 20328.00 41560.00 19391.00 CASH & BALANCE WITH RBI 292.00 850.00 986.00 1211.00 2082.00 1084.2 BALANCE WITH BANKS AND MONEY AT CALL & SHORT NOTICE
248.00 768.00 1636.00 2247.00 1087.00 1197.2
INVESTMENTS 1904.00 5748.00 7135.00 12004.00 13388.00 8035.8 ADVANCES 1401.00 3462.00 4637.00 6814.00 11755.00 5613.8 FIXED ASSETS 128.00 237.00 290.00 371.00 529.00 311.00 OTHER ASSETS 378.00 666.00 923.00 1140.00 1583.00 938.00 INTEREST EARNED 376.00 680.00 1259.00 1703.00 2023.00 1208.2 OTHER INCOME 68.00 125.00 186.00 333.00 473.00 237.00 TOTAL INCOME 444.00 805.00 1445.00 2036.00 2496.00 1445.2 INTEREST EXPENDED 229.00 374.00 754.00 1074.00 1192.00 724.6 ESTABLISHMENT EXPENSES 22.00 49.00 78.00 109.00 152.00 82.00 OTHER OPERATING EXP. 67.00 123.00 232.00 309.00 440.00 234.2 TOTAL EXPENDITURE 362.00 685.00 1235.00 1739.00 2108.00 1225.8 OPERATING PROFIT / LOSS 126.00 260.00 382.00 545.00 712.00 405.00 PROVISIONS & CONTINGENCES 44.00 140.00 172.00 248.00 325.00 185.8 NET PROFIT / LOSS 82.00 120.00 210.00 297.00 388.00 219.4 SPREAD 147.00 306.00 506.00 629.00 831.00 483.8 TOTAL BRANCHES 57.00 111.00 131.00 171.00 211.00 136.2 TOTAL STAFF 984.00 2003.00 2751.00 3742.00 N.A. 2370.00 INTEREST INCOME AS % TO WORKING FUNDS
8.65 5.80 8.06 7.16 6.65 7.26
NON ITEREST INCOME AS % TO WORKING FUNDS
1.56 1.07 1.19 1.40 1.56 1.36
OPERAT PROFIT AS % TO WORKING FUNDS
2.90 2.21 2.44 2.29 2.34 2.44
RETURN ON ASSETS (PERCENTS) 1.70 0.94 1.25 1.20 1.27 1.27
BUSINESS AS PER EMPLOYEE (RS.IN LACS) 522.00 593.60 592.32 653.86 865.00 645.36
PROFIT PER EMPLOYEE (Rs. IN LACS) 9.96 9.60 7.64 7.94 10.09 9.05
NET NPA TO NET ADVANCE 0.73 0.77 0.45 0.50 0.37 0.56 CAPITAL ADEQUACY RATIO 11.86 12.19 11.09 13.93 11.12 12.04 TIER(I) CAPITAL 8.34 9.56 8.69 10.81 9.49 9.38 TIER(II) CAPITAL 3.52 2.63 2.40 3.12 1.63 2.66

288
Appendix - 8 KEY INDICATORS – UTI Ltd.
YEAR DATA BASE
1998-99 1999-00 2000-01 2001-02 2002-03 AVERAGE
CAPITAL 132.00 132.00 132.00 192.00 230.00 163.60 RESERVES & SURPLUS 74.00 108.00 170.00 423.00 688.00 292.60 OWNED FUNDS 206.00 240.00 301.00 615.00 918.00 456.00 DEPOSITS INCLUDING INTER BANK DEPOSIT 3041.00 5720.00 9092.00 12287.00 16965.00 9421.00
WORKING FUNDS 3915.00 6669.00 10766.00 14375.00 19613.00 11067.60 TOTAL LIABILITTIES/ASSETS 4021.00 6826.00 11394.00 15056.00 9324.25 CONTINGENT LIABILTIES 2375.00 4005.00 6073.00 7219.00 13068.00 6548.00 CASH & BALANCE WITH RBI 338.00 401.00 881.00 1123.00 1600.00 868.60 BALANCE WITH BANKS AND MONEY AT CALL & SHORT NOTICE
158.00 492.00 330.00 628.00 1970.00 715.60
INVESTMENTS 1101.00 2065.00 4193.00 6630.00 7841.00 4366.00 ADVANCES 2170.00 3507.00 4821.00 5352.00 7180.00 4606.00 FIXED ASSETS 69.00 85.00 234.00 260.00 306.00 190.80 OTHER ASSETS 79.00 119.00 306.00 380.00 717.00 320.20 INTEREST EARNED 373.00 483.00 890.00 1180.00 1465.00 878.20 OTHER INCOME 47.00 91.00 163.00 416.00 410.00 225.40 TOTAL INCOME 420.00 574.00 1053.00 1595.00 1875.00 1103.40 INTEREST EXPENDED 301.00 393.00 791.00 980.00 1142.00 721.40 ESTABLISHMENT EXPENSES 12.00 15.00 29.00 50.00 85.00 38.20 OTHER OPERATING EXP. 39.00 50.00 100.00 156.00 238.00 116.60 TOTAL EXPENDITURE 389.00 524.00 967.00 1461.00 1683.00 1004.80 OPERATING PROFIT / LOSS 68.00 116.00 133.00 410.00 410.00 227.40 PROVISIONS & CONTINGENCES 37.00 65.00 46.00 276.00 218.00 128.40 NET PROFIT / LOSS 31.00 51.00 86.00 134.00 192.00 98.80 SPREAD 73.00 90.00 98.00 200.00 322.00 156.60 TOTAL BRANCHES 35.00 49.00 86.00 111.00 140.00 84.20 TOTAL STAFF 521.00 729.00 1185.00 1721.00 2338.00 1298.80 INTEREST INCOME AS % TO WORKING FUNDS 9.53 7.25 8.26 8.21 7.47 8.14
NON ITEREST INCOME AS % TO WORKING FUNDS 1.19 1.37 1.51 2.89 2.09 1.81
OPERAT PROFIT AS % TO WORKING FUNDS
1.74 1.74 1.23 2.85 2.09 1.93
RETURN ON ASSETS (PERCENTS)
0.77 0.75 0.76 0.89 0.98 0.83
BUSINESS AS PER EMPLOYEE (RS.IN LACS)
1000.00 1248.53 1174.12 1024.96 1032.70 1096.06
PROFIT PER EMPLOYEE (Rs. IN LACS)
6.00 6.91 7.27 7.79 8.22 7.24
NET NPA TO NET ADVANCE 6.32 4.71 3.43 2.74 2.39 3.92 CAPITAL ADEQUACY RATIO 11.64 11.37 9.00 10.65 10.90 10.71 TIER(I) CAPITAL 11.60 7.99 5.84 6.42 6.44 7.66 TIER(II) CAPITAL 0.04 3.38 3.16 4.23 4.46 3.05

289
Appendix - 9
KEY INDICATORS – GTB Ltd.
YEAR DATA BASE
1998-99 1999-00 2000-01 2001-02 2002-03 AVERAGE
CAPITAL 104.00 121.00 121.00 121.00 121.00 117.60 RESERVES & SURPLUS 186.00 407.00 467.00 273.00 146.00 295.80 OWNED FUNDS 290.00 528.00 588.00 394.00 268.00 413.60 DEPOSITS INCLUDING INTER BANK DEPOSIT 4097.00 6199.00 7734.00 6443.00 6921.00 6278.80 WORKING FUNDS 5200.00 7542.00 9472.00 7308.00 7666.00 7437.60 TOTAL LIABILITTIES/ASSETS 5519.00 8315.00 10278.00 8429.00 8135.25 CONTINGENT LIABILTIES 4632.00 7018.00 6068.00 2579.00 3578.00 4775.00 CASH & BALANCE WITH RBI 474.00 514.00 666.00 484.00 727.00 573.00 BALANCE WITH BANKS AND MONEY AT CALL & SHORT NOTICE 107.00 224.00 54.00 128.00 78.00
118.20
INVESTMENTS 1962.00 2929.00 3865.00 2900.00 2499.00 2831.00 ADVANCES 2118.00 3219.00 4100.00 3033.00 3276.00 3149.20 FIXED ASSETS 327.00 338.00 379.00 320.00 301.00 333.00 OTHER ASSETS 213.00 318.00 408.00 443.00 786.00 433.60 INTEREST EARNED 491.00 696.00 897.00 724.00 540.00 669.60 OTHER INCOME 146.00 184.00 164.00 229.00 191.00 182.80 TOTAL INCOME 638.00 880.00 1062.00 953.00 731.00 852.80 INTEREST EXPENDED 438.00 507.00 697.00 636.00 517.00 559.00 ESTABLISHMENT EXPENSES 13.00 18.00 30.00 36.00 42.00 27.80 OTHER OPERATING EXP. 81.00 106.00 134.00 134.00 135.00 118.00 TOTAL EXPENDITURE 567.00 770.00 982.00 913.00 1004.00 847.20 OPERATING PROFIT / LOSS 105.00 248.00 201.00 148.00 36.00 147.60 PROVISIONS & CONTINGENCES 34.00 139.00 120.00 108.00 309.00 142.00 NET PROFIT / LOSS 71.00 109.00 80.00 40.00 (-)273 75.00 SPREAD 53.00 189.00 200.00 88.00 22.00 110.40 TOTAL BRANCHES 63.00 63.00 66.00 84.00 87.00 72.60 TOTAL STAFF 748.00 939.00 1173.00 1147.00 1314.00 1064.20 INTEREST INCOME AS % TO WORKING FUNDS 9.45 9.23 9.48 9.91 7.04 9.02 NON ITEREST INCOME AS % TO WORKING FUNDS 2.81 2.44 1.74 3.14 2.50 2.53 OPERAT PROFIT AS % TO WORKING FUNDS 2.01 3.29 2.12 2.03 0.48 1.99 RETURN ON ASSETS (PERCENTS) 1.28 1.31 0.78 0.48 (-)3.56
0.96
BUSINESS AS PER EMPLOYEE (RS.IN LACS) 690.00 1002.97 1008.86 826.13 776.03 860.80 PROFIT PER EMPLOYEE (Rs. IN LACS) 9.00 12.00 6.85 3.51 (-)19.93
7.84
NET NPA TO NET ADVANCE 2.15 0.87 3.75 9.23 19.77 7.15 CAPITAL ADEQUACY RATIO 11.97 13.68 12.71 11.21 0.00 9.91 TIER(I) CAPITAL 7.62 9.85 8.79 7.44 0.00 6.74 TIER(II) CAPITAL 4.35 3.83 3.92 3.77 0.00 3.17
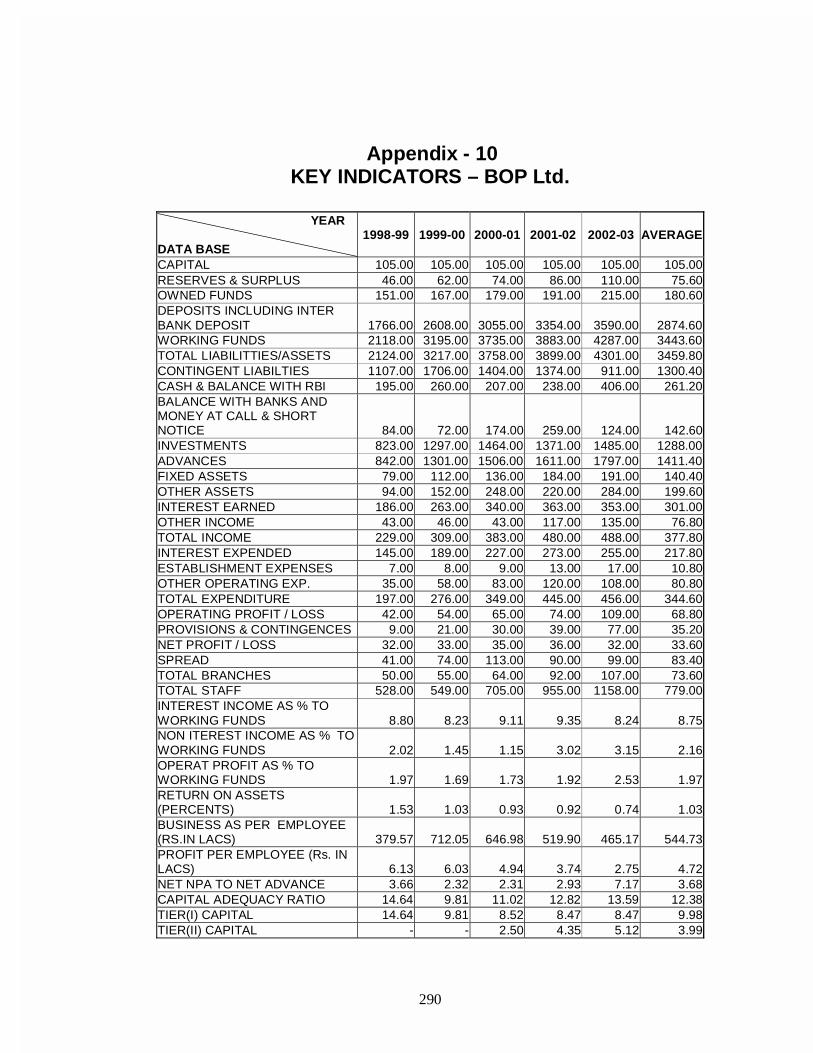
290
Appendix - 10
KEY INDICATORS – BOP Ltd.
YEAR DATA BASE
1998-99 1999-00 2000-01 2001-02 2002-03 AVERAGE
CAPITAL 105.00 105.00 105.00 105.00 105.00 105.00 RESERVES & SURPLUS 46.00 62.00 74.00 86.00 110.00 75.60 OWNED FUNDS 151.00 167.00 179.00 191.00 215.00 180.60 DEPOSITS INCLUDING INTER BANK DEPOSIT 1766.00 2608.00 3055.00 3354.00 3590.00 2874.60 WORKING FUNDS 2118.00 3195.00 3735.00 3883.00 4287.00 3443.60 TOTAL LIABILITTIES/ASSETS 2124.00 3217.00 3758.00 3899.00 4301.00 3459.80 CONTINGENT LIABILTIES 1107.00 1706.00 1404.00 1374.00 911.00 1300.40 CASH & BALANCE WITH RBI 195.00 260.00 207.00 238.00 406.00 261.20 BALANCE WITH BANKS AND MONEY AT CALL & SHORT NOTICE 84.00 72.00 174.00 259.00 124.00 142.60 INVESTMENTS 823.00 1297.00 1464.00 1371.00 1485.00 1288.00 ADVANCES 842.00 1301.00 1506.00 1611.00 1797.00 1411.40 FIXED ASSETS 79.00 112.00 136.00 184.00 191.00 140.40 OTHER ASSETS 94.00 152.00 248.00 220.00 284.00 199.60 INTEREST EARNED 186.00 263.00 340.00 363.00 353.00 301.00 OTHER INCOME 43.00 46.00 43.00 117.00 135.00 76.80 TOTAL INCOME 229.00 309.00 383.00 480.00 488.00 377.80 INTEREST EXPENDED 145.00 189.00 227.00 273.00 255.00 217.80 ESTABLISHMENT EXPENSES 7.00 8.00 9.00 13.00 17.00 10.80 OTHER OPERATING EXP. 35.00 58.00 83.00 120.00 108.00 80.80 TOTAL EXPENDITURE 197.00 276.00 349.00 445.00 456.00 344.60 OPERATING PROFIT / LOSS 42.00 54.00 65.00 74.00 109.00 68.80 PROVISIONS & CONTINGENCES 9.00 21.00 30.00 39.00 77.00 35.20 NET PROFIT / LOSS 32.00 33.00 35.00 36.00 32.00 33.60 SPREAD 41.00 74.00 113.00 90.00 99.00 83.40 TOTAL BRANCHES 50.00 55.00 64.00 92.00 107.00 73.60 TOTAL STAFF 528.00 549.00 705.00 955.00 1158.00 779.00 INTEREST INCOME AS % TO WORKING FUNDS 8.80 8.23 9.11 9.35 8.24 8.75 NON ITEREST INCOME AS % TO WORKING FUNDS 2.02 1.45 1.15 3.02 3.15 2.16 OPERAT PROFIT AS % TO WORKING FUNDS 1.97 1.69 1.73 1.92 2.53 1.97 RETURN ON ASSETS (PERCENTS) 1.53 1.03 0.93 0.92 0.74 1.03 BUSINESS AS PER EMPLOYEE (RS.IN LACS) 379.57 712.05 646.98 519.90 465.17 544.73 PROFIT PER EMPLOYEE (Rs. IN LACS) 6.13 6.03 4.94 3.74 2.75 4.72 NET NPA TO NET ADVANCE 3.66 2.32 2.31 2.93 7.17 3.68 CAPITAL ADEQUACY RATIO 14.64 9.81 11.02 12.82 13.59 12.38 TIER(I) CAPITAL 14.64 9.81 8.52 8.47 8.47 9.98 TIER(II) CAPITAL - - 2.50 4.35 5.12 3.99