mercury performance monitoring 2015 …/media/files/d/de...de beers canada inc., victor mine mercury...
TRANSCRIPT

DE BEERS CANADA INC. VICTOR MINE
MERCURY PERFORMANCE MONITORING 2015 ANNUAL REPORT PER CERTIFICATE OF APPROVAL #3960-7Q4K2G, CONDITIONS 7(5) AND 7(6)
Prepared for:
Ministry of the Environment and Climate Change Prepared by:
Amec Foster Wheeler & Infrastructure 160 Traders Blvd., Suite 110 Mississauga, Ontario L4Z 3K7 July 2016 TC150504
AMEC Foster Wheeler Environment & Infrastructure 160 Traders Blvd. E., Suite 110 Mississauga, Ontario, L4Z 3K7 Tel: (905) 568-2929 Fax: (905) 568-1686 amecfw.com
July 27, 2016 TC140504 Ms. Carroll Leith, District Manager Chief Bruce Shisheesh Ministry of the Environment and Climate Change Attawapiskat First Nation Ontario Government Complex First Nation Office Highway 101E Box 248 South Porcupine, Ontario, P0N 1H0 Attawapiskat, Ontario, P0L 1A0 Dear Ms. Leith / Chief Shisheesh:
Re: Mercury Performance Monitoring 2014 Annual Report, Certificate of Approval #3960-7Q4K2G, Conditions 7(5) and 7(6)
Please find enclosed the Annual Mercury Performance Monitoring Report which is being submitted on
behalf of the De Beers Canada Inc. Victor Mine, for the 2015 reporting period. The report addresses
Conditions 7(5) and 7(6) of Certificate of Approval #3960-7Q4K2G, and summarizes monitoring data
relating to peat pore water, surface water systems, groundwater (well field) discharge and fish.
All monitoring results to date are consistent with permit application expectations relating to mine
dewatering activities, showing no adverse effects of mine dewatering on area mercury levels in
peatlands, surface waters, or fish flesh for the 2015 monitoring period. It has been observed, however,
as per previous reports, that localized sulphate release, unrelated to mine dewatering, has contributed
to mercury methylation effects within the lower reaches of Granny Creek. This effect does not extend
to either of the Nayshkootayaow or Attawapiskat Rivers, and is still under study with further progress
on sulphate source strengths having been defined in 2015.
We would be pleased to discuss any aspect of the above. Should you have any questions please do
not hesitate to contact the undersigned at (905) 568-2929.
Regards,
Amec Foster Wheeler Environment & Infrastructure a Division of Amec Foster Wheeler Americas Limited
On behalf of De Beers Canada Inc.
Prepared by:
Lauren Sicoly, M.Sc. Jason Dietrich, M.Sc. Lesley Lorrimer, B.Sc. Aquatic Biologist Senior Aquatic Ecologist Environmental Scientist Reviewed by:
David Simms, Ph.D. Principal, Environmental Assessment and Resource Development
cc: John. B. Nakogee – Attawapiskat FN Miriam Fleming – MERC Satyendar Bhavsar – MOECC Terry Ternes – De Beers Canada

De Beers Canada Inc., Victor Mine Mercury Performance Monitoring, 2015 Annual Report per Certificate of Approval #3960-7Q4K2G, Conditions 7(5) and 7(6) July 2016
TC140504 Page i
TABLE OF CONTENTS PAGE
1.0 INTRODUCTION ............................................................................................................... 1 2.0 REQUIREMENTS ............................................................................................................. 5 3.0 REPORTING – CONDITION 6(8) DATA .......................................................................... 7
3.1 Condition 6(8) (a) – One Time Assessment of Peat Solids ................................... 7
3.2 Condition 6(8) (b) – Annual Analysis of Peat, Mineral Soil and Bedrock Pore
Water ..................................................................................................................... 7
3.3 Condition 6(8) (c) – Analysis of Surface Water Systems ....................................... 8
3.3.1 Passive Fen Treatment Systems ............................................................... 8
3.3.2 Ribbed Fen Systems ............................................................................... 12
3.3.3 Granny Creek System ............................................................................. 13
3.3.4 Nayshkootayaow and Attawapiskat Rivers .............................................. 17
3.4 Condition 6(8) (d) – Annual Analysis of Well Field Discharge ............................. 18
3.5 Condition 6(8) (e) – Sport and Small Fish Mercury Body Burdens ...................... 19
3.5.1 Methods ................................................................................................... 19
3.5.2 Results – Granny Creek System ............................................................. 23
3.5.3 Results – Attawapiskat River ................................................................... 25
3.5.4 Nayshkootayaow River ............................................................................ 27
4.0 REPORTING – CONDITION 6(9) DATA ........................................................................ 29
4.1 Annual Analysis of Peat Pore Water ................................................................... 29
4.2 Annual Analysis of Mineral Soil Pore Water ........................................................ 30
4.3 Annual Analysis of Surface Waters ..................................................................... 30
4.4 Trend Analysis of Well Field Water Discharge .................................................... 31
4.5 Annual Analysis of Fish Mercury Body Burdens .................................................. 31
5.0 SULPHATE SOURCE INVESTIGATIONS AND CONTROL .......................................... 35 6.0 CONCLUSIONS .............................................................................................................. 37
6.1 Peat Pore Waters ................................................................................................ 37
6.2 Surface Waters .................................................................................................... 37
6.3 Small Fish Mercury Body Burdens ...................................................................... 39
6.4 Consistency with the 2008 Trigger Values Document ......................................... 39
7.0 RECOMMENDATIONS ................................................................................................... 41 8.0 REFERENCES ................................................................................................................ 42

De Beers Canada Inc., Victor Mine Mercury Performance Monitoring, 2015 Annual Report per Certificate of Approval #3960-7Q4K2G, Conditions 7(5) and 7(6) July 2016
TC140504 Page ii
LIST OF TABLES PAGE
Table 1a: Muskeg Monitoring Program - Annual Mercury Results for Clay and Bedrock;
Total Mercury Filtered (2007 - 2016) (concentrations in ng/L) ............................... 46
Table 1b: Muskeg Monitoring Program - Annual Mercury Results for Clay and Bedrock;
Methyl Mercury Filtered (2007 - 2015) (concentrations in ng/L) ............................. 47
Table 2a: Muskeg Monitoring Program - Annual Mercury Results for Peat; Total
Mercury Filtered (2007 - 2015) (concentrations in ng/L) ........................................ 48
Table 2b: Muskeg Monitoring Program - Annual Mercury Results for Peat; Methyl
Mercury Filtered (2007 - 2015) (concentrations in ng/L) ........................................ 49
Table 2c: Muskeg Pore Water - Domed Bog 2007 - 2015 (Filtered) (concentrations
in ng/L) ................................................................................................................... 50
Table 2d: Muskeg Pore Water - Flat Bog 2007 - 2015 (Filtered) (concentrations
in ng/L) ................................................................................................................... 51
Table 2e: Muskeg Pore Water - Horizontal Fen 2007 - 2015 (Filtered) (concentrations
in ng/L) ................................................................................................................... 52
Table 2f: Muskeg Pore Water - Ribbed Fen 2007 - 2015 (Filtered) (concentrations in
ng/L) ....................................................................................................................... 53
Table 2g: Mineral Horizon Pore Water - Shallow Bedrock 2007 - 2015 (Filtered)
(concentrations in ng/L) .......................................................................................... 54
Table 2h: Mineral Horizon Pore Water - Deep Clay 2007 - 2015 (Filtered)
(concentrations in ng/L) .......................................................................................... 55
Table 2i: Mineral Horizon Pore Water - Shallow Clay 2007 - 2015 (Filtered)
(concentrations in ng/L) .......................................................................................... 56
Table 3: Total Mercury - Fens (Unfiltered) (concentrations in ng/L) ..................................... 57
Table 4: Total Mercury - Fens (Filtered) (concentrations in ng/L) ........................................ 58
Table 5: Methyl Mercury - Fens (Unfiltered) (concentrations in ng/L) .................................. 59
Table 6: Methyl Mercury - Fens (Filtered) (concentrations in ng/L) ...................................... 60
Table 7: Fen Systems – Statistical Analysis – Total Mercury (concentrations in ng/L) ........ 61
Table 8a: Total Mercury - Ribbed Fen Surface Waters (Unfiltered) (concentrations in
ng/L) ....................................................................................................................... 62
Table 8b: Total Mercury - Ribbed Fen Surface Waters (Filtered) (concentrations in
ng/L) ....................................................................................................................... 63
Table 8c: Methyl Mercury - Ribbed Fen Surface Waters (Unfiltered) (concentrations in
ng/L) ....................................................................................................................... 64
Table 8d: Methyl Mercury - Ribbed Fen Surface Waters (Filtered) (concentrations in
ng/L) ....................................................................................................................... 65
Table 9: Muskeg System Ribbed Fen General Chemistry Results - All Years ..................... 66
Table 10a: Total Mercury – North Granny Creek (Unfiltered) (concentrations in ng/L) ............ 67
Table 10b: Total Mercury - South Granny Creek (Unfiltered) (concentrations in ng/L) ............ 68
Table 10c: Total Mercury – Granny Creek Confluence (Unfiltered) (concentrations in
ng/L) ....................................................................................................................... 69
Table 11a: Total Mercury – North Granny Creek (Filtered) (concentrations in ng/L) ............... 70
De Beers Canada Inc., Victor Mine Mercury Performance Monitoring, 2015 Annual Report per Certificate of Approval #3960-7Q4K2G, Conditions 7(5) and 7(6) July 2016
TC140504 Page iii
Table 11b: Total Mercury – South Granny Creek (Filtered) (concentrations in ng/L) ............... 71
Table 11c: Total Mercury - Granny Creek Confluence (Filtered) (concentrations
in ng/L) ................................................................................................................... 72
Table 12a: Methyl Mercury – North Granny Creek (Unfiltered) (concentrations in ng/L) ......... 73
Table 12b: Methyl Mercury – South Granny Creek (Unfiltered) (concentrations in ng/L) ......... 74
Table 12c: Methyl Mercury - Granny Creek Confluence (Unfiltered) (concentrations in
ng/L) ....................................................................................................................... 75
Table 13a: Methyl Mercury – North Granny Creek (Filtered) (concentrations in ng/L) ............. 76
Table 13b: Methyl Mercury – South Granny Creek (Filtered) (concentrations in ng/L) ............ 77
Table 13c: Methyl Mercury – Granny Creek Confluence (Filtered) (concentrations in
ng/L) ....................................................................................................................... 78
Table 14: North Granny Creek Summer Condition Methyl Mercury Concentrations
(concentrations in ng/L) .......................................................................................... 79
Table 15a: July / October Methyl Mercury Concentrations for Downstream Granny Creek
Stations G4, G7 and G8 (Filtered) (concentrations in ng/L) ................................... 80
Table 15b: July / October Methyl Mercury Concentrations for Downstream Granny Creek
Stations G4, G7 and G8 (Unfiltered) (concentrations in ng/L) ................................ 81
Table 16a: Total Mercury – Nayshkootayaow and Attawapiskat Rivers (Unfiltered)
(concentrations in ng/L) .......................................................................................... 82
Table 16b: Total Mercury – Nayshkootayaow and Attawapiskat Rivers (Filtered)
(concentrations in ng/L) .......................................................................................... 83
Table 17a: Methyl Mercury – Nayshkootayaow and Attawapiskat Rivers (Unfiltered)
(concentrations in ng/L) .......................................................................................... 84
Table 17b: Methyl Mercury – Nayshkootayaow and Attawapiskat Rivers (Filtered)
(concentrations in ng/L) .......................................................................................... 85
Table 18: Mercury Content in Well Field Discharge (concentrations in ng/L) ........................ 86
Table 19a: Total Mercury – Individual Mine Dewatering Wells (Unfiltered)
(concentrations in ng/L) .......................................................................................... 87
Table 19b: Total Mercury – Individual Mine Dewatering Wells (Filtered) (concentrations
in ng/L) ................................................................................................................... 88
Table 20a: Methyl Mercury – Individual Mine Dewatering Wells (Unfiltered)
(concentrations in ng/L) .......................................................................................... 89
Table 20b: Methyl Mercury – Individual Mine Dewatering Wells (Filtered) (concentrations
in ng/L) ................................................................................................................... 90
Table 21: Boat Electrofishing Species-specific Catch per Unit Effort Summary .................... 91
Table 22: Minnow Trap Species-specific Catch per Unit Effort Summary .............................. 92
Table 23: Dip Net Species-specific Catch per Unit Effort Summary....................................... 93
Table 24: Standard Gill Net Species-specific Catch per Hour per 15.24 m Set
Summary ................................................................................................................ 94
Table 25: Summary of Pearl Dace Univariate Statistics by Age Class for 2015 Granny
Creek System ......................................................................................................... 95
Table 26: Total Length, Weight and Age Comparison by Location for 2015 Pearl Dace
in the Granny Creek System using ANOVA ........................................................... 96
De Beers Canada Inc., Victor Mine Mercury Performance Monitoring, 2015 Annual Report per Certificate of Approval #3960-7Q4K2G, Conditions 7(5) and 7(6) July 2016
TC140504 Page iv
Table 27: 2015 Results of Two Way ANOVA and One Way ANOVA for Pearl Dace from
the Granny Creek System Comparing Mercury Concentration by Area ................. 97
Table 28: Results of ANCOVA Displaying LS Means of 2015 Pearl Dace Total Hg
Adjusted for Total Length and Post HOC Comparison Granny Creek
System ................................................................................................................... 98
Table 29: Results of ANCOVA Displaying LS Means of 2015 Pearl Dace Total Hg
Adjusted for Age and Post HOC Comparison Granny Creek System .................... 98
Table 30: BACI Design ANCOVA Results 2009 versus 2015 Control versus Impact
Sites Granny Creek System ................................................................................... 99
Table 31: Summary of Trout Perch Univariate Statistics by Age Class for 2015
Attawapiskat and Nayshkootayaow Rivers .......................................................... 100
Table 32: Total Length, Weight and Age Comparison by Location for 2015 Trout Perch
in the Attawapiskat River using ANOVA ............................................................... 101
Table 33: 2015 Results of Two Way ANOVA and One Way ANOVA for Trout Perch
from the Attawapiskat River ................................................................................. 102
Table 34: Results of ANCOVA Displaying LS Means of 2015 Total Hg Adjusted for
Total Length and age with Post HOC Comparison Attawapiskat River ................ 103
Table 35: BACI Design ANCOVA Results 2009 versus 2015 Control versus Impact
Sites Attawapiskat River ....................................................................................... 104
Table 36: Summary of Mottled Sculpin Univariate Statistics by Age Class for 2015
Attawapiskat River ................................................................................................ 105
Table 37: Total Length, Weight and Age Comparison by Location for 2015 Mottled
Sculpin in the Attawapiskat River using ANOVA .................................................. 106
Table 38: Results of ANCOVA Displaying Mottled Sculpin LS Means of 2015 Total Hg
Adjusted for Total Length and Post HOC Comparison Attawapiskat River .......... 107
Table 39: Results of ANCOVA Displaying Mottled Sculpin LS Means of 2015 Total Hg
Adjusted for Age and Post HOC Comparison Attawapiskat River........................ 107
Table 40: Summary of 2015 Pearl Dace Univariate Statistics by Age Class for 2015
Nayshkootayaow River ......................................................................................... 108
Table 41: Total Length, Weight and Age Comparison by Location for 2015 Pearl Dace
in the Nayshkootayaow River using ANOVA ........................................................ 109
Table 42: 2015 Results of Two Way ANOVA and One Way ANOVA for Pearl Dace from
the Nayshkootayaow River ................................................................................... 110
Table 43: Results of ANCOVA Displaying LS Means of 2015 Pearl Dace Total Hg
Adjusted for Total Length and Post HOC Comparison Nayshkootayaow
River ..................................................................................................................... 111
Table 44: Results of ANCOVA Displaying LS Means of 2015 Pearl Dace Total Hg
Adjusted for Age and Post Hoc Comparison Nayshkootayaow River .................. 111
Table 45: Sentinel Species from the Nayshkootayaow River used in Statistical
Analyses 2008 - Present ...................................................................................... 112
Table 46a: Muskeg Monitoring Program – Statistical Analysis of Cluster Peat Horizon
Mercury Pore Waters – Annual Sampling Program 2015 Results –
Cluster S-1 ........................................................................................................... 113

De Beers Canada Inc., Victor Mine Mercury Performance Monitoring, 2015 Annual Report per Certificate of Approval #3960-7Q4K2G, Conditions 7(5) and 7(6) July 2016
TC140504 Page v
Table 46b: Muskeg Monitoring Program – Statistical Analysis of Cluster Peat Horizon
Mercury Pore Waters – Annual Sampling Program 2015 Results –
Cluster S-2 ........................................................................................................... 114
Table 46c: Muskeg Monitoring Program – Statistical Analysis of Cluster Peat Horizon
Mercury Pore Waters – Annual Sampling Program 2015 Results –
Cluster S-7 ........................................................................................................... 115
Table 46d: Muskeg Monitoring Program – Statistical Analysis of Cluster Peat Horizon
Mercury Pore Waters – Annual Sampling Program 2015 Results –
Cluster S-8 ........................................................................................................... 116
Table 46e: Muskeg Monitoring Program – Statistical Analysis of Cluster Peat Horizon
Mercury Pore Waters – Annual Sampling Program 2015 Results –
Cluster S-9(1) ....................................................................................................... 117
Table 46f: Muskeg Monitoring Program – Statistical Analysis of Cluster Peat Horizon
Mercury Pore Waters – Annual Sampling Program 2015 Results –
Cluster S-9(2) ....................................................................................................... 118
Table 46g: Muskeg Monitoring Program – Statistical Analysis of Cluster Peat Horizon
Mercury Pore Waters – Annual Sampling Program 2015 Results –
Cluster S-V Series ................................................................................................ 119
Table 47a: North Granny Creek – Statistical Analysis – Mercury – 2015 (Unfiltered)
(concentrations in ng/L) ........................................................................................ 120
Table 47b: North Granny Creek – Statistical Analysis – Mercury – 2015 (Filtered)
(concentrations in ng/L) ........................................................................................ 121
Table 47c: South Granny Creek – Statistical Analysis – Mercury – 2015 (Unfiltered)
(concentrations in ng/L) ........................................................................................ 122
Table 47d: South Granny Creek – Statistical Analysis – Mercury – 2015 (Filtered)
(concentrations in ng/L) ........................................................................................ 123
Table 47e: Nayshkootayaow River – Statistical Analysis – Mercury – 2015 (Unfiltered)
(concentrations in ng/L) ........................................................................................ 124
Table 47f: Nayshkootayaow River – Statistical Analysis – Mercury – 2015 (Filtered)
(concentrations in ng/L) ........................................................................................ 125
Table 47g: Attawapiskat River – Statistical Analysis – Mercury – 2015 (Unfiltered)
(concentrations in ng/L) ........................................................................................ 126
Table 47h: Attawapiskat River – Statistical Analysis – Mercury – 2015 (Filtered)
(concentrations in ng/L) ........................................................................................ 127
Table 48a: 2015 Sulphate Investigation Results (mg/L) ......................................................... 128
Table 48b: 2014 Sulphate Investigation Results (mg/L) ......................................................... 129
Table 48c: 2013 Sulphate Investigation Results (mg/L) ......................................................... 130
Table 48d: 2012 Sulphate Investigation Results (mg/L) ......................................................... 131
Table 48e: 2011 Sulphate Investigation Results (mg/L) ......................................................... 132
Table 48f: 2010 Sulphate Investigation Results (mg/L) ......................................................... 133

De Beers Canada Inc., Victor Mine Mercury Performance Monitoring, 2015 Annual Report per Certificate of Approval #3960-7Q4K2G, Conditions 7(5) and 7(6) July 2016
TC140504 Page vi
LIST OF FIGURES
PAGE
Figure 1: Muskeg Monitoring Locations ............................................................................... 134
Figure 2: Interpreted Drawdown Contours in Upper Bedrock Aquifer (2015 Data) ............. 135
Figure 3a: Ribbed Fen Average Methyl Mercury Concentration (Filtered) as a Function
of DOC ................................................................................................................. 136
Figure 3b: Ribbed Fen Average Methyl Mercury Concentration (Filtered) as a Function
of pH ..................................................................................................................... 136
Figure 4: Surface Water Monitoring Stations ....................................................................... 137
Figure 5a: Nayshkootayaow River Total and Methyl Mercury Trends (Filtered and
Unfiltered) ............................................................................................................. 138
Figure 5b: Attawapiskat River Total and Methyl Mercury Trends (Filtered and Unfiltered)
............................................................................................................................. 139
Figure 6: Mercury Content in Wellfield Discharge Graphical Presentation
(concentrations in ng/L) ........................................................................................ 140
Figure 7: Fish Sampling Areas 2007 – 2015 ....................................................................... 141
Figure 8: Total Mercury by Age Class for 2015 Pearl Dace – Granny Creek System ......... 142
Figure 9: Linear Regression of Total Length at Age for Age 1+ Pearl Dace from the
Granny Creek System for 2015 ............................................................................ 143
Figure 10: Statistical Histograms of 2015 Pearl Dace Total Mercury Adjusted for Total
Length Granny Creek System .............................................................................. 144
Figure 11: Least Square Plots of 2015 Pearl Dace Total Mercury Granny Creek System
............................................................................................................................. 145
Figure 12: Comparison of Total Mercury in Pearl Dace from 2008 to 2015 Granny Creek
System ................................................................................................................. 146
Figure 13: Comparison of Total Mercury by Age Class in Pearl Dace from 2013 to 2015
Granny Creek System .......................................................................................... 147
Figure 14: Total Mercury Additive Model for Pearl Dace of Standard Size (60 mm) from
2008 to 2015 Granny Creek System .................................................................... 148
Figure 15: Total Mercury for 2015 Trout Perch by Age Class – Attawapiskat River.............. 149
Figure 16: Linear Regression of Total Length at Age for Age 1+ Trout Perch in 2015
Attawapiskat River ................................................................................................ 150
Figure 17: Statistical Histograms of 2015 Trout Perch Total Mercury Adjusted for Total
Length Attawapiskat River .................................................................................... 151
Figure 18: Least Square Plot of 2009 and 2015 Trout Perch Total Mercury Attawapiskat
River ..................................................................................................................... 152
Figure 19: Comparison of Total Mercury from 2008 to 2015 by Age Class in Trout Perch
Attawapiskat River ................................................................................................ 153
Figure 20: Total Mercury Additive Model for Trout Perch of Standard Size (50 mm) from
2008 to 2015 Attawapiskat River .......................................................................... 154
Figure 21: Total Mercury for 2015 Mottled Sculpin Attawapiskat River ................................. 155
Figure 22: Statistical Histograms of 2015 Mottled Sculpin Total Mercury by Age Class
Attawapiskat River ................................................................................................ 156

De Beers Canada Inc., Victor Mine Mercury Performance Monitoring, 2015 Annual Report per Certificate of Approval #3960-7Q4K2G, Conditions 7(5) and 7(6) July 2016
TC140504 Page vii
Figure 23: 2015 Total Mercury by Age Class for Pearl Dace Nayshkootayaow River........... 157
Figure 24: Statistical Histograms of 2015 Pearl Dace Total Mercury by Age Class
Nayshkootayaow River ......................................................................................... 158
Figure 25: MS-8 Piezometer Trends in Total Mercury Concentrations (2007 to 2015) ......... 159
Figure 26: MS-8 Piezometer Locations ................................................................................. 160
Figure 27: Groundwater Elevations at Muskeg Monitoring Site MS-8 ................................... 161
Figure 28: Average Annual Sulphate Concentration at Selected Monitoring Locations
(2015 Date ............................................................................................................ 162

De Beers Canada Inc., Victor Mine Mercury Performance Monitoring, 2015 Annual Report per Certificate of Approval #3960-7Q4K2G, Conditions 7(5) and 7(6) July 2016
TC140504 Page viii
LIST OF ABBREVIATIONS
ANCOVA Analysis of Covariance
ANOVA Analysis of Variance
ATT Attawapiskat River
BACI Before-After-Control-Impact
CEQG Canadian Environmental Quality Guidelines
COM Community
CONF Confluence
CPUE Catch Per Unit Effort
DS Downstream
DSNAY Downstream Nayshkootayaow
EEM Environmental Effects Monitoring
F-Value Analysis of Variance from Sample Statistics
FF Far Field
GAM Generalized Additive Model
Hg Mercury
HgCON Mercury Control Station / Northwest Control
MC Monument Channel
MDL Method Detection Limit
MeHg Methyl mercury
NAY or NAYSH Nayshkootayaow River
NAY-MOUTH Mouth of Nayshkootayaow
NEF/F Northeast Fen Final
NGC North Granny Creek
ng/L Nanograms per Litre
NF Near Field
PPM Parts Per Million
P-Value Tabled Probability Threshold
SEF/F Southeast Fen Final
RPD Relative Percent Difference
SGC South Granny Creek
SRB Sulphate Reducing Bacteria
ST Station
SWF/F Southwest Fen Final
T Tributary
µg/g Micrograms Per Gram
THg Total mercury
US Upstream
YOY Young of Year

De Beers Canada Inc., Victor Mine Mercury Performance Monitoring, 2015 Annual Report per Certificate of Approval #3960-7Q4K2G, Conditions 7(5) and 7(6) July 2016
TC140504 Page 1
1.0 INTRODUCTION
This report was prepared by Amec Foster Wheeler Environment & Infrastructure, a Division of
Amec Foster Wheeler Americas Limited (Amec Foster Wheeler) on behalf of De Beers Canada
Inc. (De Beers), pursuant to the requirements of Conditions 7(5) and 7(6) of Certificate of Approval
(C. of A.) #3960-7Q4K2G. This report is the eighth in a series of annual mercury monitoring
reports that have been prepared for the Victor Mine to date. This eighth annual report summarizes
all Victor Mine site mercury monitoring data collected for the 2015 calendar year related to this
permit, and provides summaries of earlier data and trends where appropriate. For consistency
and readability from year to year, this report keeps the same general format and much of the
same wording as previous annual reports, with updates in data interpretation where warranted.
A broad-based, rigorous mercury monitoring program was established for the De Beers Victor
Mine because of concerns raised during the Ministry of the Environment (and Climate Change)
provincial permitting process regarding the possible influences of mine dewatering activities on
muskeg system hydrodynamics and associated mercury chemodynamics. In particular, concerns
were expressed that should mine dewatering lead to extensive drying out of the local muskeg
ecosystem, resultant decomposition of the desiccated peat could lead to increased mercury
release to area receiving waters above levels that occur naturally. Mercury is present in area
peatlands in the baseline condition as a result of the long-range aerial transport of emissions from
natural and anthropogenic sources unrelated to activities of the Victor Mine. Volcanic activity is
the primary natural source for the long-range transport of mercury. Coal-fired power plants in the
United States and elsewhere are one of the primary anthropogenic sources for long-range
mercury transport.
Amec Foster Wheeler and De Beers previously provided evidence supporting the position that
mine dewatering activities were not likely to result in a condition that would substantively increase
mercury release rates to area receiving waters; and that if evidence of such substantive release
rates was to occur, mitigation measures would be implemented to prevent or arrest the
aggravating condition. The Victor Mine mercury monitoring program is designed to test De Beers’
position that mine dewatering is not likely to substantively increase mercury release rates to area
receiving waters.
Data collected up to the end of 2015 continue to support De Beers’ opinion that mine dewatering
is unlikely to result in substantive increases in mercury release to area surface waters. A minor
localized increase in methyl mercury concentrations has, however, been noted over the past few
years in downstream Granny Creek waters. This increase has been attributed to sulphate
releases to the local muskeg environment, from mine rock and ore material drainage, and is
unrelated to mine dewatering effects on the muskeg environment per se. Sulphate acts as an
electron acceptor for sulphate reducing bacteria (SRB). SRB are believed to be the primary
promotors of mercury methylation in wetland environments, and the stimulation of SRB growth
leads to increased rates of methyl mercury production. This effect was first observed during the
Victor Mine construction phase in 2006 and 2007, in connection with Central Quarry discharges
to the Southwest Fen (AMEC 2009). It continues to be observed in association with other localized
De Beers Canada Inc., Victor Mine Mercury Performance Monitoring, 2015 Annual Report per Certificate of Approval #3960-7Q4K2G, Conditions 7(5) and 7(6) July 2016
TC140504 Page 2
muskeg drainages around the Victor Mine site, where sulphate concentrations are elevated above
the background condition.
Laboratory services for the water sampling program were provided by:
Flett Research Ltd. in Winnipeg (to approximately the end of April 2009);
Dr. Brian Branfireun’s laboratory at the University of Toronto (from approximately
May 2009 to September 2010); and
Subsequently by the Biotron Analytical Services laboratory at the University of Western
Ontario. Dr. Branfireun helped establish and supervises the Biotron Analytical Services
laboratory which is a CALA-accredited facility, using ISO 17025.
Fish flesh analyses were similarly conducted at Dr. Branfireun’s laboratory at the University of
Toronto, and subsequently at the Biotron Analytical Services laboratory since 2008. All of the
above laboratories are recognized for their specialty of ultra-trace analyses for mercury.
Method detection limits (MDLs) for water quality sampling have changed over time and according
to the laboratory used. In some instances, these changes have created false impressions of
mercury concentration changes over time. In particular, some of the earlier data were reported at
values that are below current Biotron Analytical Services laboratory MDLs. To address this
concern, all historic water quality data presented in this eighth annual mercury report have been
adjusted for uniformity to reference detection limits of 0.02 ng/L for methyl mercury and 0.1 ng/L
for total mercury currently used by Biotron. Overall, results at the detection limits, as presented in
this report, are more conservative (higher) than those previously reported.
For readers unfamiliar with these units of measurement:
ng/L represents nanograms per litre of water, which can also be expressed as parts per
trillion (ppt) or 1 part of material in 1,000,000,000,000 parts of water.
ug/g represents micrograms per gram of solids (e.g., fish flesh), which can also be
expressed as parts per million (ppm) or 1 part of material in 1,000,000 parts of solids.
Results provided in this report are compared with the more stringent Canadian Environmental
Quality Guidelines (CEQG) for the protection of aquatic life: set at 26 ng/L for total mercury and
4 ng/L for methyl mercury, both as unfiltered samples. The Provincial Water Quality Objective for
the protection of aquatic life is 200 ng/L for total mercury. There is no Provincial Water Quality
Objective for methyl mercury. In the case of filtered methyl mercury concentrations in receiving
waters, comparisons are also made with the bioaccumulation threshold of 0.05 ng/L cited by the
United States Environmental Protection Agency (US EPA 1997) for the protection of fish-eating
wildlife species such as Bald Eagle and River Otter. Fish tissue mercury concentrations for small

De Beers Canada Inc., Victor Mine Mercury Performance Monitoring, 2015 Annual Report per Certificate of Approval #3960-7Q4K2G, Conditions 7(5) and 7(6) July 2016
TC140504 Page 3
bodied fish are also compared with the CEQG tissue residual guideline for methyl mercury of
0.033 mg/kg.
For completeness and in response to comments received from various stakeholders on the 2013
and 2014 annual reports (including from the Ministry of the Environment and Climate Change,
Environment and Climate Change Canada, Neegan Naynowan Stantec LP on behalf of the
Attawapiskat First Nation, and the Wildlands League) this report provides additional data and
analysis not included in previous reports. Most of the additional data and analysis relate to:
Providing more inclusive data sets on both unfiltered and filtered mercury samples for all
sample locations, and particularly those of the Granny Creek system;
Providing long-term summary statistics for peat pore water samples, as well as for
samples collected from the Nayshkootayaow and Attawapiskat Rivers;
Providing a correlation analysis of other factors such as pH, dissolved organic carbon, and
iron that can also potentially affect mercury methylation (in ribbed fen systems);
Determining the effects of flow supplementation from the Attawapiskat River on Granny
Creek methyl mercury concentrations; and
Providing updated information on the analysis of sulphate effects on localized mercury
methylation, and measures being considered / developed to better control sulphate
releases to the local muskeg environment.
A number of peer-reviewed scientific papers have been published in the Hydrological Processes journal and the Science of the Total Environment journal in 2012 through 2014, in relation to the
operation and dewatering effects at the Victor Mine site. Papers relevant to this report are listed
below. The data presented in these research papers, where applicable, support the data and
conclusions presented in this report.
Ulanowski, T.A. and B.A. Branfireun. 2013. Small-scale Variability in Peatland Pore-Water
Biogeochemistry, Hudson Bay Lowland, Canada. Science of the Total Environment.
454-455: 211-218.
Whittington, P. and J. Price. 2012. Effect of Mine Dewatering on Peatlands of the James
Bay Lowland: the Role of Bioherms. Hydrological Processes. 26: 1818-1826.
Whittington, P. and J. Price. 2013. Effect of Mine Dewatering on the Peatlands of the
James Bay Lowland: the Role of Marine Sediments on Mitigating Peatland Drainage.
Hydrological Processes. Published online in Wiley Online Library.

De Beers Canada Inc., Victor Mine Mercury Performance Monitoring, 2015 Annual Report per Certificate of Approval #3960-7Q4K2G, Conditions 7(5) and 7(6) July 2016
TC140504 Page 4
Kompanizare, M. and J.S. Price. 2014. Analytical Solution for Enhanced Recharge around
a Bedrock Exposure Caused by Deep-aquifer Dewatering through a Variable Thickness
Aquitard. Advanced in Water Resources. Volume 74, December 2014, Pages 102-115.
Orlova, Y. and B.A. Branfireun. 2014. Surface Water and Groundwater Contributions to
Streamflow in the James Bay Lowland, Canada. Arctic, Antarctic and Alpine Research.
Finally, it is important to point out that the Victor Mine is now nearing the end of its projected mine
life, and that barring any unforeseen developments, the mine is expected to terminate operations
sometime in late 2018 or early 2019, and from there enter into the process of mine site
reclamation. Mine site reclamation is expected to occur over an approximate three year period,
subject to site access, logistics and weather, in accordance with the current Victor Mine Closure
Plan, Amendment #3 (AMEC 2014a).

De Beers Canada Inc., Victor Mine Mercury Performance Monitoring, 2015 Annual Report per Certificate of Approval #3960-7Q4K2G, Conditions 7(5) and 7(6) July 2016
TC140504 Page 5
2.0 REQUIREMENTS
Condition 7(5) of C. of A. #3960-7Q4K2G states the following:
The Owner shall report the results from the previous calendar year for the mercury monitoring program described [in] Condition 6(8), to the District Manager and the Chief of the Attawapiskat First Nation by June 30 of each year.
In the case of the 2015 annual mercury monitoring report, a request was made by De Beers to
the Timmins District Office of the Ministry of the Environment and Climate Change (MOECC) to
extend the reporting deadline to July 29, 2016. This request was granted in a letter from the
Timmins office District Manager and the Section 53 Ontario Water Resources Act Director on
June 16, 2016.
The referenced Condition 6(8) states:
The Owner shall carryout a mercury monitoring program that includes, but [is] not necessarily limited to the following:
(a) A onetime assessment of peat solids to determine mercury content (completed in 2007);
(b) An analysis of peat, mineral soil, and bedrock pore water on an ongoing annual basis at the locations identified in Table 2;
(c) Monitoring of surface water systems on a monthly or quarterly basis depending on station at the locations identified in Table 3;
(d) Monitoring of the well field discharge on a monthly basis and quarterly basis and quarterly sampling of individual wells;
(e) Sampling of sportfish at 3 year intervals and small fish sampling on an annual basis at locations identified in Table 4.
Condition 7(6) states the following:
The Owner shall report the results from the previous calendar year for the mercury assessments described [in] Condition 6(9), to the District Manager and the Chief of the Attawapiskat First Nation by June 30 of each year.
The referenced Condition 6(9) states:
In conjunction with the mercury management and monitoring program required in Section 6(8), the Owner shall also carryout data analyses, enhanced sampling programs, modelling, risk assessments, and implement effective mitigation measures, as and when

De Beers Canada Inc., Victor Mine Mercury Performance Monitoring, 2015 Annual Report per Certificate of Approval #3960-7Q4K2G, Conditions 7(5) and 7(6) July 2016
TC140504 Page 6
required, all in accordance with the March 31, 2008 Report prepared by AMEC and submitted to the District Manager, entitled Trigger Values for Mercury Concentrations and/or Body Burdens in Fish, Condition 6(10) of Certificate of Approval #8700-783LPK, De Beers Canada Inc., Victor Mine. This program may be amended from time to time when approved in writing by the District Manager. As well, water quality data collected as part of the groundwater well field recovery system shall be analyzed statistically to determine the variability and trending over time. Should significant variation occur over time within individual wells or group of wells then a potential concern will be deemed to exist, requiring further investigation.

De Beers Canada Inc., Victor Mine Mercury Performance Monitoring, 2015 Annual Report per Certificate of Approval #3960-7Q4K2G, Conditions 7(5) and 7(6) July 2016
TC140504 Page 7
3.0 REPORTING – CONDITION 6(8) DATA
3.1 Condition 6(8) (a) – One Time Assessment of Peat Solids
Requirements of this condition were fulfilled in Section 3.1 of the first annual mercury report (2008
Annual Report) and are not repeated here.
3.2 Condition 6(8) (b) – Annual Analysis of Peat, Mineral Soil and Bedrock Pore Water
The reader is referred to earlier annual reports, and most recently Amec Foster Wheeler (2015)
for a discussion early phase sampling program nuances related to Condition 6(8)(b) of C. of A.
#3960-7Q4K2G, and its predecessors. The C. of A. provides for the annual collection of peat pore
water samples from muskeg monitoring program stations identified in the C. of A. (Table 2
therein), as well as from associated mineral soil and bedrock monitoring wells / piezometers.
Samples are to be analysed for total and methyl mercury on filtered samples, as per standard
groundwater sampling protocols.
All of the observed values for total mercury and methyl mercury have thus far been well below
their respective Canadian Environmental Quality Guideline (CEQG) values of 26 ng/L for total
mercury and 4 ng/L for methyl mercury. In making this comparison it is important to stress that
the CEQG values of 26 ng/L for total mercury and 4 ng/L for methyl mercury apply to unfiltered
samples for surface water and not to filtered samples from peat, mineral soil and bedrock pore
water, which are collectively regarded as groundwater samples. It is standard practice to filter
groundwater samples to exclude influences of sediment loading on analytical results, on the
premise that sediment particles are not mobile during in-situ groundwater movement.
Comparisons to the CEQG, in this case, are therefore for illustrative purposes only.
Muskeg monitoring program pore water sample results for total and methyl mercury (filtered
samples) are provided in Tables 1a and 1b for bedrock and clay substrates, respectively, and in
Tables 2a and 2b for peat substrates. Data are provided for the entire period of record from 2007
to 2015. Sampling station locations are shown in Figure 1.
Tables 2c to 2i provide graphical presentations of data from Tables 1 and 2. It should be noted
that the vertical scales on these graphs vary depending on the range of results observed.
Statistical analyses using all data sets are presented in Section 4. With the exception of minor
and possibly anomalous results for a few samples, total and methyl mercury values observed in
2015 were within the range of values observed in previous years for all stations. Occasional spikes
in data were observed for some of the stations for both total and methyl mercury in 2015, but
there is no temporal or spatial pattern to the data. Such spikes were equally likely to be observed
in stations remote from the area under-drained by Victor Mine dewatering (e.g., Station Clusters
S-9(1), S-9(2), S-13 and S-15) as at areas closer to the mine (Station Clusters S-1, S-2, S-7 and
S-8, as well as the S-V1, S-V2 and S-V3 Clusters). Year to year variations therefore appear to be
a regional phenomenon that is not linked to mine dewatering effects on muskeg mercury
chemodynamics.

De Beers Canada Inc., Victor Mine Mercury Performance Monitoring, 2015 Annual Report per Certificate of Approval #3960-7Q4K2G, Conditions 7(5) and 7(6) July 2016
TC140504 Page 8
For 2014, an increase in total mercury concentrations had been noted for three of the four muskeg
monitoring stations for the MS-8 station cluster (Table 2a). The MS-8 station cluster was of interest
because of its proximity to the Victor Mine. There was, however, no long-term trend to the data
and total mercury concentrations observed in 2015 for the MS-8 cluster of stations were
considerably reduced for three of the four stations, compared with the 2014 data. The only MS-8
cluster station that showed a total mercury concentration similar to the 2014 values was the
MS-8-F station for the flat bog muskeg type. The year 2015 data therefore support conclusions
presented in the 2014 annual report, wherein it was hypothesized that the 2014 results for the
MS-8 station cluster may simply have represented random year to year variations. Methyl mercury
concentrations for the MS-8 station cluster have remained variably stable over the period of
observation. Further discussions on this aspect are presented in Section 4.1.
3.3 Condition 6(8) (c) – Analysis of Surface Water Systems
Surface water systems considered in this section include the following:
Passive fen treatment systems;
Ribbed fen systems;
Granny Creek; and the
Nayshkootayaow and Attawapiskat Rivers.
3.3.1 Passive Fen Treatment Systems
The Southwest Fen (SWF) was used as a passive wetland treatment system for the removal of
residual total suspended solids and nutrients from the Central Quarry waste water discharge
during the early phase of mine development in 2006.
The Northeast Fen (NEF) currently provides, or previously provided, a similar function for effluents
derived from the following sources:
Plant site excavation area (completed 2006);
Crusher excavation area (completed 2006 and 2007);
Attawapiskat River intake excavation and construction (completed 2007).
Open pit mine Phase 1 Mine Water Settling Pond (started 2007 and ongoing but limited
discharge);
Dry waste landfill runoff and leachate (started autumn of 2008 and ongoing);
Fully treated sewage treatment plant effluent (started 2006 and completed August 2011);
and

De Beers Canada Inc., Victor Mine Mercury Performance Monitoring, 2015 Annual Report per Certificate of Approval #3960-7Q4K2G, Conditions 7(5) and 7(6) July 2016
TC140504 Page 9
Mine rock stockpile runoff (started in 2010 and continuing).
The Southeast Fen (SEF) and the Northwest Control Fen (HgCON) were set up as control fens
or reference points for the SWF and the NEF. The SEF previously received minor discharges
from the shallow South Quarry during extremely brief periods in 2004 and 2005, but was not
materially affected by these discharges. It is therefore regarded as being not impacted by mine
site discharges or runoff. The HgCON has never received effluent discharge from any source.
Sampling from the SWF was discontinued in June 2009 as the C. of A. for this fen treatment
system (C. of A. # 3374-6G7J2Y) was revoked on March 3, 2009. Much of the SWF has since
been overlaid by stockpiles of mine waste (low grade kimberlite and processed kimberlite). There
are consequently no data for the SWF beyond May 2009.
The Phase 1 Mine Water Settling Pond has discharged surface runoff collected from the pit
perimeter area since 2008. The Phase 1 Mine Water Settling Pond also intermittently received
well development water. The practice of discharging well development water to the Phase 1 Mine
Water Settling Pond was discontinued in 2014 as it contained sulphates that occur naturally in
the groundwater.
Total mercury data (unfiltered and filtered) for the passive treatment and control fen systems are
presented in Tables 3 and 4. Methyl mercury data (unfiltered and filtered) for these same systems
are presented in Tables 5 and 6. All results are within applicable federal (and provincial)
guidelines (objectives) for the protection of aquatic life with the exception of unfiltered methyl
mercury samples taken from the NEF in April/May 2009, January 2012 and April / May 2013; and
from the SWF in January and April of 2008. All filtered methyl mercury values have been below
the federal guideline (Canadian Environmental Quality Guideline; CEQG) value of 4 ng/L except
for the January 2012 value. Winter samples collected from under the ice can show concentrated
ion strength due to ice crystallization effects. In very shallow stagnant water as the water freezes,
ions tend to be extruded from the ice crystal matrix and concentrated in the remaining water below
the ice. In extreme cases where the water freezes to near bottom, severe parameter concentration
distortions can occur. All of the January, April and May anomalies referenced above are winter
samples.
Total mercury concentrations in the three fen systems (NEF, SEF and the HgCON) have been
highly variable over the period of record, but beginning in 2013 a trend has emerged to lower total
mercury concentrations (unfiltered and filtered) in the NEF. If only the dates of common sampling
are considered (i.e., May, July and October for 2013, 2014 and 2015), differences are statistically
significant, with the NEF showing markedly lower total mercury values for both unfiltered and
filtered samples (Table 7). This trend is also reflected in the longer-term averages between these
three fen systems.
Results for methyl mercury in 2015 were similar to those of previous years (Tables 5 and 6). While
continuing to meet the federal and provincial guidelines and objectives for the protection of aquatic
life (with the exception of under-ice methyl mercury samples collected in April/May 2009, January

De Beers Canada Inc., Victor Mine Mercury Performance Monitoring, 2015 Annual Report per Certificate of Approval #3960-7Q4K2G, Conditions 7(5) and 7(6) July 2016
TC140504 Page 10
2012 and April / May 2013 in the NEF), concentrations of methyl mercury, for both unfiltered and
filtered samples, continued to be decidedly higher in the NEF compared with the two control fens.
The data are sufficiently different that statistical analysis was not required to show that the
differences are meaningful.
Methyl mercury concentrations in the NEF are believed to be elevated as a result of increased
sulphate levels, as described in previous annual reports. Sulphate reducing bacteria utilize
sulphate as an electron acceptor, and hence higher sulphate levels tend to promote increased
rates of conversion from total mercury to methyl mercury (Ullrich et al. 2001; Jeremiason et al.
2006). Sulphate concentrations in the NEF during 2015 averaged 72.6 mg/L. This value compares
with average sulphate concentrations of 47.9, 32.2, 30.5, 60.0, 84.5, 74.5 and 60.2 mg/L for the
years of 2008 through 2014, respectively. The optimal sulphate range for mercury methylation is
20 to 50 mg/L (Ullrich et al. 2001).
Ongoing elevated sulphate values observed for the NEF indicate that sulphate containing waters
are still draining to the NEF, primarily from the Mine Rock Stockpile.
Samples from control fen sites typically contain <0.1 mg/L of sulphate. The increased mercury
methylation rate observed for the NEF is therefore a localized phenomenon, and is not believed
to be related to localized muskeg dewatering effects. As per Sections 5 and 7 of this report,
De Beers is currently investigating methods to better control the release of sulphates to localized
muskeg environments including to the NEF.
It is of interest that annual average, filtered methyl mercury concentrations in the NEF have
continued to decline from the peak average value of 1.41 ng/L in 2012 to a value of 0.38 ng/L in
2015. In the 2014 annual report it was speculated that this decline could be a function of one or
both of:
The small stores of inorganic mercury originally present in the upper fen sediments
becoming depleted; or
The continuous activity of sulphate reducing bacteria has progressed to a point where the
associated build-up of sulphide (as opposed to sulphate) has reached a level that is
beginning to inhibit mercury methylation.
Both processes can occur simultaneously.
Relative to the first possibility (depletion of inorganic mercury stores in upper fen sediments)
Table 7 shows a significant trend to reduced total mercury concentrations in the NEF compared
with the two control fens in the period 2013 through 2015. It is therefore reasonably possible that
the small stores of inorganic mercury originally present in the upper fen sediments are becoming
depleted as a consequence of conversion to methyl mercury over the past few years, and

De Beers Canada Inc., Victor Mine Mercury Performance Monitoring, 2015 Annual Report per Certificate of Approval #3960-7Q4K2G, Conditions 7(5) and 7(6) July 2016
TC140504 Page 11
associated flushing from the system, with a consequent reduction in the production of methyl
mercury.
With respect to possible NEF substrate sulphide effects, the reason why there is an optimal
sulphate concentration range for mercury methylation, is that if sulphide concentrations (a
by-product of sulphate reduction by sulphate reducing bacteria) become too high in sediments,
insoluble mercury sulphide is formed, which renders mercury unavailable for methylation. Benoit
et al. (1999) provided data showing that methyl mercury concentrations in wetland sediment pore
water were reduced to near zero, when sediment sulphide concentrations reached approximately
10 mg/L. Whether or not sulphide concentrations in NEF sediments have reached a concentration
where they are both stable and sufficiently elevated to inhibit mercury methylation remains
speculative. Data available from Webb et al. (1998) suggest that sulphate concentrations
exceeding a range of approximately 50 to 100 mg/L have potential to cause this effect, provided
that the resulting sulphides produced are retained in an anoxic environment. The NEF
experiences some fluctuations in water levels, such that this condition may not be fully met.
To assist with interpretations of mercury chemodynamics within the NEF, the MOECC (in its
review of the 2013 annual report), requested that De Beers provide an estimate of flushing rates
for this fen. The NEF has a surface area of approximately 15 ha, and a catchment area of
approximately 150 ha. If it is assumed that the primary active water zone within the fen has an
average depth of 0.5 m, then the volume of active water associated with the NEF can be estimated
at 75,000 m3. Annual runoff for the Granny Creek watershed has been measured at approximately
250 mm based on creek flow measurements. A 150 ha watershed would therefore generate an
estimated average annual runoff of 375,000 m3/yr. A substantial portion of this runoff will report
to the creek as subsurface seepage, as well as over the ice and frozen muskeg during the spring
freshet. It would nevertheless appear, from the above values, that there is sufficient runoff
available to substantively flush the NEF within one calendar year.
Another approach to calculating the flushing rate for the NEF is to consider chloride data from the
SWF. The SWF has a catchment area which is similar in size to that of the NEF. During 2006 the
SWF received effluent from Central Quarry dewatering, which at the end of operations in late
2006 resulted in a SWF terminal pond chloride concentration of about 230 mg/L. This compared
with a background fen chloride concentration of approximately 1 mg/L. By late 2008, two years
later, the SWF terminal pond chloride concentration had been reduced to about 25 mg/L. Chloride
is a conservative ion that is not subject to reactions or degradation, and is therefore affected only
by dilution. This data, which are probably more applicable than the watershed / runoff calculations
presented above, suggest that it would take about two to three years to flush the NEF.
Flushing of methyl mercury from the fen is further complicated by the adsorptive properties of the
peat.

De Beers Canada Inc., Victor Mine Mercury Performance Monitoring, 2015 Annual Report per Certificate of Approval #3960-7Q4K2G, Conditions 7(5) and 7(6) July 2016
TC140504 Page 12
3.3.2 Ribbed Fen Systems
The water quality of general site area drainage is monitored on a quarterly basis at three ribbed
fen stations located on or near to the Victor Mine site (Stations MS-V1-R, MS-V2-R and MS-V3-R),
as well as at several more remote sites beyond the zone of potential mine dewatering effects
(Figures 1 and 2). Ribbed fen sites were selected for surface water quarterly monitoring because
ribbed fens, more than other muskeg types, tend to collect water from surrounding drainages and
therefore provide the most representative data on overall site drainage.
Total and methyl mercury sample results for the ribbed fen stations, for the period of 2007 through
2015, are shown in Tables 8a through 8d. The data show concentrations of total and methyl
mercury that were all well within applicable federal (and provincial) guidelines (objectives) for the
protection of aquatic life, with no obvious increasing or decreasing trends; and no appreciable
differences between stations that are located within the mine dewatering 2 m drawdown contour
(under drained sites) and those stations that are located outside of this contour (remote sites).
For example, total mercury values for 2015, for unfiltered and filtered samples, averaged 3.23
and 2.66 ng/L, respectively, for under drained stations, and 2.99 and 2.26 ng/L for remote stations.
Corresponding 2015 average values for methyl mercury were 0.08 and 0.06 ng/L for under
drained stations, and 0.06 and 0.05 ng/L for remote stations. Some samples collected from under
the ice showed relatively higher concentrations, such as for methyl mercury in January 2012 at
the MS-8-R and MS-13-R stations. These results should be viewed with caution, as per
discussions above regarding ice crystallization concentration effects (Section 3.3.1).
To assist with mercury data interpretation De Beers also collects samples from these same ribbed
fen stations for the analysis of chloride, conductivity, nitrate, dissolved organic carbon (DOC), pH,
sulphate, total phosphorus, calcium, iron, magnesium and sodium (Table 9). The most striking
aspect of Table 9 is the variable results which are observed for chloride, sodium and sulphate for
MS-8R. The data for these three parameters for 2007 and 2008 suggested that there were likely
natural groundwater upwellings in this area in the predevelopment condition, but that groundwater
upwelling gradients were reversed in 2009 as a result of mine dewatering. Since 2011, there have
been variable increases in these three parameters, with inconsistent year to year results.
Hydrogeological data confirm that the Upper Attawapiskat Formation underlying Station MS-8R
has remained under-drained (Figure 2); but the fen track which drains to MS-8R originates well
to the west of MS-8R in an area which is outside of the well field drawdown cone (Figure 2). It is
therefore possible that year to year variations in hydrological conditions, outside of the well field
zone of influence, could be contributing to periodic groundwater upwellings in the upstream
portion of the MS-8R fen track. If this were the case, the occasionally elevated chloride, sodium
and sulphate levels observed for this station would be naturally occurring. Other ribbed fen
stations showed fairly consistent general chemistry values from year to year, with a few minor
exceptions.
The MOECC recently requested that De Beers should consider the potential relationships
between key general chemistry parameters and methyl mercury concentrations for the ribbed fen
systems, to determine if some of these general chemistry parameters were affecting methyl

De Beers Canada Inc., Victor Mine Mercury Performance Monitoring, 2015 Annual Report per Certificate of Approval #3960-7Q4K2G, Conditions 7(5) and 7(6) July 2016
TC140504 Page 13
mercury concentrations. The key parameters of interest are pH, DOC, sulphate and iron.
Regression analyses were performed on the data presented in Table 9, comparing these key
parameters with average filtered methyl mercury concentrations. In performing this analysis, two
abnormally elevated methyl mercury concentrations were excluded as outliers, namely the
0.28 ng/L MS-8R value for 2012, and the 0.25 ng/L MS-13R value for 2012.
The strongest data set relationship shown was for methyl mercury as a function of DOC, where a
positive r2 value of 0.31 was calculated, indicating that 31% of the variability in filtered methyl
mercury concentrations could be explained by DOC concentrations (Figure 3a). There is support
for this relationship in the literature, but the relationships are complicated and at times
contradictory (Ullrich 2001). A weaker negative relationship was observed between filtered methyl
mercury concentrations and pH (r2 value of 0.16), where methyl mercury concentrations tended
to increase with decreasing pH (Figure 3b). Negative correlations between methyl mercury and
pH have been reported in the literature, where methyl mercury solubility has generally been
observed to increase with decreasing pH (Ullrich et al. 2001). Decreasing pH would also increase
the solubility of inorganic mercury, thereby increasing the supply of mercury available to
microorganisms for methylation.
Analysis of potential relationships between filtered methyl mercury concentrations and iron and
sulphate showed effectively no relationship, with r2 values of 0.002 and 0.005, respectively,
indicating that less than 1% of methyl mercury concentrations could be explained by iron and
sulphate concentrations (figures not shown). The lack of a relationship between sulphate and
methyl mercury may appear somewhat surprizing given the known effects of sulphate on methyl
mercury concentrations. The reason for this condition is likely a function of the generally very low
sulphate values observed for the monitoring ribbed fen systems, wherein all but four of the
sulphate values were <5 mg/L, with most values being <1 mg/L, and only one value was
>10 mg/L. These sulphate concentrations are generally below levels where enhanced mercury
methylation would be expected to occur.
3.3.3 Granny Creek System
Total and methyl mercury data for upstream and downstream stations on the Granny Creek
system are provided in Tables 10 through 13. Sampling locations are shown in Figure 4.
Data are provided for the four stations on North Granny Creek, three stations on South Granny
Creek, the Granny Creek Confluence station, and for the Tributary 5A control station, as per the
following:
N. Granny Creek Upstream (NGC/UP/NWF – G-1);
N. Granny Creek Downstream NWF (NGC/DN/NWF – G-2);
N. Granny Creek Downstream NEF (NGC/DN/NEF – G-3);
N. Granny Creek Downstream (NGC/DN G-4);
S. Granny Creek Upstream (SGC/UP/SWF – G-5);

De Beers Canada Inc., Victor Mine Mercury Performance Monitoring, 2015 Annual Report per Certificate of Approval #3960-7Q4K2G, Conditions 7(5) and 7(6) July 2016
TC140504 Page 14
S. Granny Creek Downstream SWF (SGC/DS/SWF – G-6);
S. Granny Creek Downstream (SGC/DS G-7);
Granny Creek Confluence (G-8); and
Tributary 5A.
North Granny Creek stations G-1, G-2, G-3 and G-4 have been positioned progressively from
upstream (G-1) to furthest downstream (G-4). The G-1 station is positioned upstream of any site
drainage influences, but is necessarily still within the mine dewatering drawdown cone shown in
Figure 2. Station G-2 is within the zone of drainage influence from the mine rock stockpile, but is
upstream of drainage influences from the NEF. Station G-3 is positioned just downstream of the
NEF inflow point, and Station G-4 is positioned downstream of all mine related surface drainage
influences.
South Granny Creek stations G-5, G-6 and G-7 have been similarly positioned progressively from
upstream (G-5) to furthest downstream (G-7). The G-5 station is positioned upstream of any site
drainage influences, but is necessarily still within the mine dewatering drawdown cone shown in
Figure 2. Station G-6 is within the zone of drainage influence from the coarse processed kimberlite
and low grade kimberlite stockpiles; and within the zone of influence of drainage from the former
SWF, which has been overprinted by Fine PK Cell 2 and by the coarse processed kimberlite and
low grade kimberlite stockpiles. Station G-7 is positioned downstream of all mine related surface
drainage influences.
The Granny Creek Confluence station (G-8) is positioned immediately downstream of the North
and South Granny Creek confluence, and in terms of water quality is expected to represent an
average of station G-4 and G-7 effects. The Tributary 5A station is a control station located outside
of mine dewatering drawdown cone. Tributary 5A was selected as the closest station to the
Granny Creek system, which has characteristics which are the most similar to Granny Creek in
terms of terrain and watershed area. North and South Granny Creeks each have watershed areas
of approximately 45 km2. Tributary 5A has a watershed area of approximately 30 km2.
Average total mercury concentrations for the seven Granny Creek stations for 2015 varied from
2.30 to 3.44 ng/L for unfiltered samples, and from 1.48 to 2.69 ng/L for filtered samples (Tables
10 and 11). These values are well below the 26 ng/L federal guideline (CEQG) for the protection
of aquatic life. Filtered sample results for total mercury averaged over 2015 are similar for
upstream and downstream stations from both creek branches (Table 11). The graphs attached to
Tables 10 and 11 show that total mercury concentrations can vary substantively throughout the
year due to seasonal and hydrological effects. There are, however, no long-term trends evident
in the data for either North or South Granny Creeks, for stations upstream or downstream of the
developed areas of the Victor Mine. The Tributary 5A station has shown consistently lower total
mercury concentrations for both unfiltered and filtered samples throughout the period of record
dating back to 2009, with the exception of 2014 for stations G7 and G8. Generally lower total
mercury concentrations for the Tributary 5A system compared with the Granny Creek system are
therefore believed to be a background condition.
De Beers Canada Inc., Victor Mine Mercury Performance Monitoring, 2015 Annual Report per Certificate of Approval #3960-7Q4K2G, Conditions 7(5) and 7(6) July 2016
TC140504 Page 15
Methyl mercury concentrations for unfiltered and filtered samples, from upstream and
downstream South and North Granny Creek stations, are shown in Tables 12 and 13. The values
are again variable, depending on seasonal and hydrologic influences. However, unlike total
mercury, where there is no evident trend between upstream and downstream stations, the trend
to elevated downstream methyl mercury concentrations in North and South Granny Creeks
continued into 2015. (Tables 12 and 13).
Particularly elevated methyl mercury values (filtered) were noted for North Granny Creek at the
NGC/DN/NEF (G-3) station during July through September of 2015, with values ranging from
0.67 to 1.14 ng/L. These are the highest filtered mercury values so far observed for this station
(Table 13a). Values for June and October were comparatively low and in keeping with results
observed for previous years. At the same time, filtered methyl mercury values for the NEF station
continued their steady decline in 2015, suggesting that elevated NGC station G-3 values for the
summer of 2015 are related to other factors beyond NEF loadings. Methyl mercury values typically
tend to be elevated during the summer months because of increased methylating bacterial activity
during these months (Ullrich et al. 2001).
One possible explanation for the elevated summer of 2015, station G-3 methyl mercury
concentrations relates to creek flows and to the effects of flow supplementation from the
Attawapiskat River and discharges from the fine PKC facility. Table 14 shows details of summer
results for filtered methyl mercury concentrations for the past three summers. The factor that
stands out for 2015 is the exceptionally high creek flows for that year. In 2013 and 2014 a
substantial portion of NGC summer flows derived from Attawapiskat River flow supplementation.
Flow supplementation to the Granny Creek system is required in accordance with MOECC Permit
to Take Water #1201-9HHJ5G (and its predecessors) in order to maintain fish habitat within the
creek. The addition of Attawapiskat River water in previous years has therefore served to partially
dilute NGC methyl mercury concentrations. At the same time, because of the higher precipitation
experienced in 2015, discharge from the fine PKC facility to NGC also occurred in 2015, unlike
during 2013 and 2014. If the effect of flows and loadings from the Attawapiskat River and the fine
PKC facility are factored out, expected concentrations of filtered methyl mercury in the summer
months without these contributions can be calculated. The calculated values for this condition are
shown in the far right column of Table 14a. In viewing these adjusted values, filtered methyl
mercury are broadly comparable over the three years for July and August, but were still notably
higher for September.
Branfireun et al. (1996) provided data to show that higher concentrations of methyl mercury
release from natural peatlands are typically associated with high runoff conditions, which flush
stored methyl mercury from the system. The very high runoff conditions associated with 2015 may
therefore have contributed to increased methyl mercury concentrations in NGC during 2015.
Table 14b and associated Chart 14a show a positive, moderately strong correlation (r2 – 0.408)
between natural creek flow (flow excluding Attawapiskat River and fine PKC flow contributions)
and observed methyl mercury concentrations for all data combined. However, if the months of
July through September are analyzed separately even stronger r2 values are observed, ranging
from 0.959 to 0.984 (Table 14, Charts 14c through 14e). The exceptionally high methyl mercury

De Beers Canada Inc., Victor Mine Mercury Performance Monitoring, 2015 Annual Report per Certificate of Approval #3960-7Q4K2G, Conditions 7(5) and 7(6) July 2016
TC140504 Page 16
concentrations observed for the NGC G-3 station in 2015 therefore likely appear to be a function
of exceptionally high natural creek flows observed during the summer of that year.
Filtered methyl mercury values were not available for SGC or for Tributary 5A for August and
September, 2015. Unfiltered values for the comparable SGC G-6 station were, however, available
for August which were also elevated (Table 12b).
Of further interest are summer/fall (July/October) downstream methyl mercury concentrations for
the furthest downstream stations on North and South Granny Creeks (stations G-4 and G-7), and
the for the Granny Creek confluence station (G-8). Methyl mercury for these stations is measured
quarterly. July / October results for these stations for all years (2008 through 2015) are shown in
Table 15. The aspect of note from Table 15 (and its associated charts) is that while methyl
mercury concentrations for the downstream Granny Creek stations (G-4 and G-7) have shown a
gradual increase since 2011, concentrations at the further downstream Granny Creek confluence
station (G-8) have remained stable at substantively lower concentrations. The 2010 results are
highly varied between filtered and unfiltered values and are not in keeping with the rest of the data
set. The distance between the G-8 and G-4/G-7 stations is only about 0.8 km, and there are no
substantive increases in watershed contribution between the G-4/G-7 stations and the G-8 station
(Figure 4). The data for filtered and unfiltered methyl mercury therefore suggest that mercury
demethylation may be occurring between the G-4/G-7 stations and the G-8 station.
The demethylation of methyl mercury, by demethylating bacteria, can occur by the
mer-detoxification pathway, and by oxidative and reductive pathways, where the reductive
pathway can occur under both anaerobic and aerobic conditions (Krabbenhoft et al. 2005, Segade
et al. 2010). In cases where methyl mercury concentrations are comparatively low, as in the
Granny Creek system, the oxidative and reductive demethylation pathways would be expected to
predominate, and the rate of demethylation can be comparatively rapid (Krabbenhoft et al. 2005).
That portion of the Granny Creek system between stations G-4/G-7 and station G-8 exhibits a
steeper gradient and is well oxygenated, compared with creek reaches upstream from stations
G-4/G-7, which exhibit a very low gradient condition. Under these conditions, comparatively rapid
methyl mercury demethylation could occur during the warmer open water months. In any case,
the data from the most downstream, Granny Creek confluence station (G-8) show that
concentrations of methyl mercury leaving the Granny Creek system and reporting to the
Nayshkootayaow River have not changed appreciably from the background condition, if at all,
over the period of mine operations.
While elevated methyl mercury concentrations are noted in downstream Granny Creek waters,
averaging 3.0 times background over all years sampled for North Granny Creek and 2.6 times
background over all years for South Granny Creek (worse case condition), these values are still
very low and well below the federal guideline (CEQG) of 4 ng/L (Tables 13a and 13b).
Methyl mercury concentrations for the Granny Creek system are, however, consistently above
the bioaccumulation threshold criterion of 0.05 ng/L for filtered methyl mercury samples put
forward by the US EPA (1997) for the protection of fish-eating wildlife species such as Bald Eagle
De Beers Canada Inc., Victor Mine Mercury Performance Monitoring, 2015 Annual Report per Certificate of Approval #3960-7Q4K2G, Conditions 7(5) and 7(6) July 2016
TC140504 Page 17
and River Otter. Most avian and mammalian predators in the region that feed on fish are larger
species, such as Bald Eagles, Osprey and River Otters, that would tend to seek larger fish types
than those that are available in the Granny Creek system. These larger predators are more apt
to feed on fish from the Nayshkootayaow and Attawapiskat Rivers. Smaller sized predators such
as Belted Kingfisher and Mink could reasonably be expected to feed on fish present in the Granny
Creek system.
Downstream increases in Granny Creek methyl mercury appear to be related to sulphate
drainages associated with the mine site area, and are not believed to be linked to muskeg
dewatering effects, as all available evidence shows that the peat horizons in the general mine site
area continue to be saturated (Amec Foster Wheeler 2016). Sulphate drainage effects continue
to be localized.
3.3.4 Nayshkootayaow and Attawapiskat Rivers
Total and methyl mercury results for the Nayshkootayaow and Attawapiskat Rivers are shown in
Tables 16a and 16b for total mercury (unfiltered and filtered, respectively), and in Tables 17a and
17b for methyl mercury (unfiltered and filtered, respectively). Sample locations are shown in
Figure 4. Graphical data are presented in Figure 5. All values are consistent across the stations,
and well below federal guidelines (CEQG). Filtered results for all stations on the Nayshkootayaow
and Attawapiskat Rivers were generally comparable and well within the range of historical data
for the respective stations. A fifth station (A-5) was added to the Attawapiskat River sampling
network in 2013 at a location 500 m downstream of the well field discharge. This addition was a
response to commitments made to the MOECC following review of the 2012 annual mercury
performance report. Data collected for the 500 m downstream station showed total and methyl
mercury values that were comparable to other Attawapiskat River stations for 2015 (Tables 16
and 17).
In addition to being well below the CEQG of 4 ng/L for the protection of aquatic life, methyl mercury
concentrations in the Attawapiskat and Nayshkootayaow Rivers were also generally at or below
the bioaccumulation threshold of 0.05 ng/L for filtered methyl mercury samples cited by the US
EPA (1997) for the protection of fish-eating wildlife species such as Bald Eagle and River Otter.
The only exceptions in 2015 were very minor excursions for the September sample collected from
the Monument Channel control station (0.07 ng/L), and for two upstream stations on the
Attawapiskat River where values of 0.06 ng/L were recorded for Station A-1 in July and for
Station A2 in October (Table 17b).
For the Nayshkootayaow River it is important to consider observed monitoring data in relation to
predictions made during the permitting stage. In 2007, AMEC predicted a worst-case increase in
methyl mercury concentrations during operations from a base case of 0.062 ng/L to a new value
of 0.162 ng/L; and at closure after 25 yrs of possible peatland desiccation to as much as 0.65
ng/L. The calculated increase from 0.062 ng/L to 0.65 ng/L represented a worst case possible
increase of up to 1,050 percent (i.e, a potential 10.5 fold increase), though even then remaining
well below the CEQG of 4 ng/L. These calculations were based on very conservative

De Beers Canada Inc., Victor Mine Mercury Performance Monitoring, 2015 Annual Report per Certificate of Approval #3960-7Q4K2G, Conditions 7(5) and 7(6) July 2016
TC140504 Page 18
assumptions, wherein it was assumed that up to 10% of the muskeg from a 75.6 km2 under
drained area (as a result of mine dewatering) could potentially decompose over a 25 yr period,
and release stored mercury; and that 17% of the total mercury released would occur as methyl
mercury. The 17% value was based on observations from the SWF that were later determined to
have been artificially elevated because of the sulphate release to the SWF associated with
dewatering of the Central Quarry in 2006.
The 2007 calculations were updated in the 2008 amended permit application, following a further
iteration of the hydrogeological model, during which the area of potential muskeg desiccation was
substantively reduced, and the percent of total mercury occurring as methyl mercury was reduced
to 2.2%. The resulting predicted changes to the methyl mercury concentration in the
Nayshkootayaow River went from 0.062 ng/L to from 0.064 to 0.096 ng/L (i.e., a predicted
increase by a factor of from 1.03 to 1.55), depending on the extent of muskeg desiccation. It was
considered that a change of this magnitude would be difficult to distinguish from the background
condition. No predictions were made relative to the mine closure phase.
Monitoring data has thus far shown that no meaningful desiccation of muskeg has occurred (or is
expected to occur) within the area of the mine dewatering drawdown cone, and that methyl
mercury concentrations in the Nayshkootayaow River have not changed from the background
condition (Tables 16 and 17).
3.4 Condition 6(8) (d) – Annual Analysis of Well Field Discharge
Sampling of the Victor Mine well field discharge has been ongoing since November 2007. All
values for the period of November 2007 to December 2015 have remained low (below CEQG
values) for both total and methyl mercury, as shown in Table 18. Filtered total and methyl mercury
concentrations in the well field discharge have thus far, on average, been at or below background
concentrations measured in the Attawapiskat River shown in Tables 16 and 17. In 2015, average
unfiltered and filtered total mercury concentrations were 2.78 ng/L and 1.04 ng/L for the well field,
and 1.97 ng/L and 1.40 ng/L for the two upstream Attawapiskat River stations. Corresponding
total and filtered methyl mercury values were <0.03 ng/L and <0.03 ng/L for the well field
discharge, and 0.055 ng/L and <0.04 ng/L for the two upstream Attawapiskat River stations.
A slight overall upward temporal gradient is evident in the well field discharge for unfiltered total
mercury concentrations (r2 value of 0.21), but not for filtered total mercury (r2 value of 0.03), or for
unfiltered or filtered methyl mercury (r2 values of 0.0002 and 0.0028, respectively), (Figure 6).
Moreover, it is important to stress that the average annualized well field discharge of
approximately 80,000 m3/d represents only 0.22% of the 36,000,000 m3/d mean annual flow for
the Attawapiskat River.
Quarterly total and methyl mercury sampling results for operating individual wells are shown in
Tables 19 and 20, respectively. For the longer term operating wells, Wells VDW-12, 21 and 22
continue to show the highest total mercury concentrations, and especially well VDW-22. Newly
developed wells VDW-8 and VDW-10 also showed higher total mercury concentrations, and

De Beers Canada Inc., Victor Mine Mercury Performance Monitoring, 2015 Annual Report per Certificate of Approval #3960-7Q4K2G, Conditions 7(5) and 7(6) July 2016
TC140504 Page 19
especially VDW-8 for unfiltered total mercury. There is a general trend to increasing
concentrations of total mercury in some of these wells over time, possibly due to less dilution from
upper aquifer waters as production from individual wells declines. Well VDW-11 on the other hand
has shown a trend to reduced mercury concentrations in 2014 and 2015, compared with 2013.
Methyl mercury concentrations for 2015 were all low in the individual wells, averaging <0.03 ng/L
for unfiltered and filtered samples, for all wells, except for VDW-8 where an average value of
0.05 ng/L was recorded for unfiltered samples.
3.5 Condition 6(8) (e) – Sport and Small Fish Mercury Body Burdens
Sport (large) fish are sampled as part of the Victor Mine monitoring program, at three year
intervals with the last sampling year being 2013. Consequently there are no sport fish sampling
results to report for 2015. The next sampling period scheduled for sport fish is 2016. For
discussions of mercury tissue concentrations in sport fish, the reader is referred to the 2013
annual report (AMEC 2014b). Remaining discussions in this section are focused on small fish.
Small fish comparisons include annual surveys of average body burden mercury analysis for two
age classes, young of the year (YOY) and aged 1+ years, comparing experimental stations with
control sites. If total mercury concentrations in fish flesh from experimental stations are shown to
be significantly different from control station concentrations, at an alpha level of 0.05, a potential
concern will be deemed to exist, requiring further investigation (AMEC 2008). Small fish are a
critical component of the monitoring program, as they serve as indicators of mercury bioavailability
(AMEC 2008).
3.5.1 Methods
Small-bodied fish were collected in 2015 from:
North Granny Creek (NGC);
South Granny Creek (SGC);
Control Tributary 5A (ST-5A);
Nayshkootayaow River (downstream of the Granny Creek confluence, NAY-DS6; and
upstream, NAY-US3); and from
Four stations on the Attawapiskat River (upstream of the mine site, ATT-US;
approximately 500 m downstream of the well field discharge, ATT-NF; approximately 2 km
downstream of the well field discharge point, ATT-FF; and the north shore of the river,
parallel to the discharge location, ATT-REF2).

De Beers Canada Inc., Victor Mine Mercury Performance Monitoring, 2015 Annual Report per Certificate of Approval #3960-7Q4K2G, Conditions 7(5) and 7(6) July 2016
TC140504 Page 20
Sampling locations are shown in Figure 7.
The North and South Granny Creek locations are experimental stations, potentially influenced by
the Victor Mine. Tributary 5A is a small creek similar to the Granny Creek system, which is located
outside of the influence of mine related activities, and is the control site (reference area) for the
Granny Creek system.
The control station for the Nayshkootayaow River downstream station, is the Nayshkootayaow
River upstream station (upstream of Tributary 3). Pearl Dace (Margariscus margarita) were
captured in 2015 from the Nayshkootayaow River upstream and downstream sampling stations
allowing for statistical comparisons between areas, but were not captured from the upstream
station in 2014 due to a rapid increase in river discharge (Amec Foster Wheeler 2015). There is
no recent data for Pearl Dace captured from the upstream station, and consequently 2015 data
could not be compared to data from previous years.
In years prior to 2014, sampling from the Attawapiskat River was limited to three sampling
locations, with the upstream station (ATT-US) serving as the control station, and the ATT-NF and
ATT-FF stations serving as near-field and far-field experimental stations, respectively. In 2014
and 2015, a second reference area was added for the Attawapiskat River, located on the north
shore of the river, parallel to the discharge location and near-field exposure area. This location
was added as part of the 2014 Victor Mine Environmental Effects Monitoring (EEM) program, to
provide further indication of the natural variability inherent in the system. The ATT-REF2 station
is separated from the well field discharge location by an approximate 1,000 m cross-channel
section of river and a chain of mid-channel islands, and is not influenced in any way by the well
field discharge.
Small bodied fish were collected from the above locations using backpack electroshocking,
minnow trapping and dip netting (where applicable). Collected numbers of Pearl Dace allowed for
comparisons between North Granny Creek, South Granny Creek and Tributary 5A within the
Granny Creek system, and also allowed for comparisons between the upstream and downstream
areas of the Nayshkootayaow River. Two other species, Trout Perch (Percopsis omiscomaycus)
and Mottled Sculpin (Cottus bairdii), were used to compare upstream and downstream
Attawapiskat River locations. Trout Perch were also collected from the Nayshkootayaow River,
but were only captured in the downstream sampling area. Species-specific catch data for each
location are summarized in Tables 21 through 24 for electrofishing, dip netting, minnow trapping
and gill netting.
Small bodied fish were analyzed at the Biotron laboratory (University of Western Ontario, London
Ontario), a CALA-accredited facility, using ISO 17025. Fish tissue samples were analyzed by Flett
Research Ltd. in Winnipeg prior to 2009. A Comparative lab method study was conducted in 2013
between these laboratories and the MOECC contaminants branch laboratory. Overall, repeated
measures results indicate that the majority of samples were analyzed as having similar (within
20%) concentrations for total mercury (AMEC 2014b) and therefore results from the time series
were deemed adequate for comparative purposes.

De Beers Canada Inc., Victor Mine Mercury Performance Monitoring, 2015 Annual Report per Certificate of Approval #3960-7Q4K2G, Conditions 7(5) and 7(6) July 2016
TC140504 Page 21
Individual samples were thawed and sub-sampled for dorsal muscle on which total mercury
analysis was completed. A small mass was retained for oven-drying, and a minimum of two wet
samples (<0.5 g wet weight each) was used for analyses. Remaining tissue, if any, was kept
frozen for replicate analyses if required. Samples were analyzed and reported as wet weight as
per standard methods. Analysis was by thermal decomposition and atomic absorption detection
using a Milestone DMA-80 as per the requirements of US EPA Method 7473. Calibration and
instrument performance were verified through the analysis of fish tissue reference materials.
Dorsal muscle tissue was analyzed as opposed to whole fish tissue to further reduce the potential
variability of results due to multiple tissue types per organism. Data from the literature indicate
that when mercury concentrations in fish muscle or whole bodies are low (less than approximately
0.5 µg/g), mercury concentrations in muscle tissue are approximately double those in liver tissue
(Ray et al. 1984; Weiner et al. 1984; Barak and Mason 1990a, 1990b; Goldstein et al. 1996).
Small-bodied fish captured in the exposure areas of North Granny Creek (Pearl Dace) and the
Attawapiskat River (Trout-Perch) between 2008 and 2013 have shown average (± 1 SD) mercury
concentrations of 0.27 ± 0.2 µg/g and 0.095 ± 0.07 µg/g, respectively. These averages remain
below 0.5 µg/g. Whole body composite samples of Pearl Dace captured in an impacted area of
North Granny Creek and analysed as part of Victor Mine Landfill Leachate Mercury and Cadmium Bioaccumulation Study – Fish Tissue and Sediment Quality Components (AMEC 2012a, 2013),
had an average mercury concentration of 0.16 ± 0.04 µg/g (inclusive of 2011 and 2012 results).
This value is less than the upper limit of values obtained for the same species from the same
water body when analysing for muscle tissue. Therefore, using muscle tissue for analysis in small-
bodied fish is a more conservative approach for the study of body burden levels and the overall
protection of the environment.
Data was assessed for outliers and normality using the Shapiro-Wilk test at an alpha of 0.05, and
transformed if needed to meet assumptions of the given statistical test.
Fish descriptors (total length, weight and age) were investigated with separate one-way ANOVA
tests using the sample areas as independent factors. ANOVA tests were followed by post-hoc
between group tests (Tukey HSD) to evaluate differences between the sampling areas.
Two-way ANOVA with replication was used to assess the interaction between sampling areas
and age class (YOY or age 1+). Age class was determined from otolith aging structures. Two-way
ANOVA is used when there is one measurement variable (total mercury) and two nominal
variables (area and age class); and there is interest in the interaction between the two nominal
variables (the effect of one variable may depend on the value of the other; McDonald 2014). If the
interaction term was found to be significant, separate one-way ANOVA tests for each age class
were run to determine differences in total mercury levels between sampling areas.
Analysis of Covariance (ANCOVA) was used to test for differences in fish body burden mercury
concentrations between sampling areas while correcting for age and total length. Generalized
linear models were used and included a response variable and an interaction term between the

De Beers Canada Inc., Victor Mine Mercury Performance Monitoring, 2015 Annual Report per Certificate of Approval #3960-7Q4K2G, Conditions 7(5) and 7(6) July 2016
TC140504 Page 22
sampling areas and either total length or age. The inclusion of a covariate accounts for greater
amounts of variability in the model.
To compare total mercury body burden levels between site and year, a before-after-control-impact
(BACI) design was used with an ANCOVA, incorporating total length as the covariate. Interactions
between year and area were analyzed for significance to determine if an effect was evident. The
period of 2009 was used as a baseline and compared to the 2015 dataset to assess potential
impacts of the Victor Mine on fish body burden mercury levels. 2008 data was not suitable as a
baseline period for the BACI design as sample sizes were too small for SGC and NGC to be used
in ANCOVA.
Body burden mercury values from 2008 to 2015 were plotted to observe any trends between
areas over time. Two boxplots were developed for Pearl Dace which included all fish, regardless
of known age from otolith aging structures, for 2008 to 2015; and fish of known age class from
otolith aging structures for 2013 to 2015. Length frequency histograms were not generated for
Pearl Dace historical data to classify fish as YOY or age 1+ because sample sizes were often too
small at each sampling area to create a clear length cutoff between age classes.
For Trout Perch from the Attawapiskat River, boxplots were developed separately for YOY and
age 1+ fish (Figure 17). Years 2011, 2013, 2014 and 2015 were classified based on known ages
from otolith aging structures. Fish from 2008 were classified based on the length frequency
distribution developed for this species as a part of the Attawapiskat River Environmental Effects
Monitoring report (fish <45 mm classified as YOY) (AMEC 2008). Fish from 2009, 2010 and 2012
were classified based as YOY or age 1+ based on length frequency distributions generated in
2014 from historical data, as part of the 2014 Mercury Performance Monitoring Annual Report
(Amec Foster Wheeler 2015). Fish classified as YOY were <45 mm in 2009, <55 mm in 2010 and
<50 mm in 2012.
Trends in mercury levels over time were assessed using a Generalized Additive Model (GAM) for
small-bodied fish to complement the above analyses. A GAM is a useful approach that can deal
with non-linear data and provides statistical tests to determine if change over time has occurred.
In this case, a cubic regression spline smoother (with three nodes) was applied to values of total
mercury and year of collection. Due to the tendency of body burden mercury concentrations to
increase as fish grow, and the difficulty in obtaining similar length fish across all years, fish length
was also added to the model. A separate trend analysis was created for each species and each
site. Time series data are provided assuming a standardized size of fish (60 mm for Pearl Dace,
and 50 mm for Trout Perch) including 95% confidence intervals. GAM trend lines represent
mercury concentration for the standard size of fish for each species. The specific data points
provided represent the raw mercury concentration distribution for a given year, uncorrected for
size.
De Beers Canada Inc., Victor Mine Mercury Performance Monitoring, 2015 Annual Report per Certificate of Approval #3960-7Q4K2G, Conditions 7(5) and 7(6) July 2016
TC140504 Page 23
3.5.2 Results – Granny Creek System
Univariate statistics for 2015 Pearl Dace data from Granny Creek and the control Tributary 5A are
summarized in Table 25.
YOY Pearl Dace from control Tributary 5A exhibited significantly greater mean total lengths and
weights compared to those from NGC and SGC (47.60, 36.95 and 38.00 mm and 0.96, 0.40 and
0.43 g, respectively) (ANOVA, p<0.10; Tables 25 and 26). Aged 1+ Pearl Dace from NGC
exhibited significantly greater mean total lengths and weights compared to those from SGC and
ST-5A (85.22, 67.76 and 59.75 mm and 6.56, 3.07 and 2.20 g, respectively) (ANOVA, p<0.10;
Tables 25 and 26). Aged 1+ Pearl Dace from SGC had significantly greater mean total lengths
compared to those from ST-5A (ANOVA, p<10; Tables 25 and 26). Known age was not
significantly different between sampling areas for Pearl Dace aged 1+ (ANOVA, p>0.10;
Tables 25 and 26).
Two-way ANOVA indicated that there was an effect of sampling area and age class (YOY versus
age 1+) on body burden mercury concentrations in Pearl Dace (ANOVA, p<0.10; Table 27). There
was also a significant interaction between sampling area and age class (ANOVA, p<0.10;
Table 27). One-way ANOVA indicated significantly higher body burden mercury concentrations
for YOY Pearl Dace in NGC and SGC compared to ST-5A (0.37 and 0.28 mg/kg vs. 0.05 mg/kg)
(ANOVA, p<0.10; Tables 25 and 27; Figure 8). For Pearl Dace aged 1+, mercury concentrations
were significantly higher in fish from NGC compared to fish from both SGC and ST-5A (0.56, 0.23
and 0.08 mg/kg, respectively). Mercury concentrations were also significantly greater in Pearl
Dace aged 1+ from SGC compared to ST-5A (ANOVA, p<0.10; Tables 25 and 27; Figure 8). The
interaction between sampling area and age class is likely the result of the low proportion of YOY
captured at ST-5A (19%) in comparison to SGC and NGC (64 and 68%, respectively).
Known age was similar between fish captured from all three sampling areas for fish aged 1+
(ANOVA, p>0.10, Tables 25 and 26). Linear regressions of total length at age for fish aged 1+
exhibited similar slopes (p = 0.10), but NGC had a growth trajectory slightly higher than that of
SGC and ST-5A (Figure 9).
For Pearl Dace (age 1+), the least square (LS) mean of body burden mercury values adjusted for
total length was significantly higher for NGC compared to SGC and ST-5A (0.345 mg/kg versus
0.241 and 0.069 mg/kg, respectively) (ANCOVA, p<0.10; Table 28; Figure 10). Mercury values
were also significantly higher for SGC compared to ST-5A. For Pearl Dace aged 1+, least square
means of mercury concentrations adjusted for age also showed that fish from NGC had
significantly higher mercury body burden concentrations compared to fish from both SGC and
ST-5A (0.420 mg/kg versus 0.215 and 0.079 mg/kg, respectively) and mercury values were
significantly higher for SGC compared to ST-5A (ANCOVA, p<0.10; Table 29; Figure 10).
A BACI design using ANCOVA indicated a significant interaction between year and sampling
location for body burden mercury concentration in Pearl Dace from the Granny Creek system
from 2009 to 2015 (baseline to present) (Table 30, Figure 11). Body burden mercury levels in

De Beers Canada Inc., Victor Mine Mercury Performance Monitoring, 2015 Annual Report per Certificate of Approval #3960-7Q4K2G, Conditions 7(5) and 7(6) July 2016
TC140504 Page 24
Pearl Dace increased between 2009 and 2015 for fish from NGC and SGC when corrected for
total length; whereas total mercury levels remained relatively similar for this species at ST-5A
(Figure 11). Post hoc comparison showed a significant increase between 2009 and 2015 at NGC
(Table 30; Figure 11). There was also an increase from 2009 to 2015 at SGC, but this increase
was not statistically significant (Table 30; Figure 11). The ANCOVA used in the BACI design did
not satisfy the assumptions of equal slopes (p<0.10) due to variability in data over 6 years.
However, changes between sampling years in the LS means provides indication of NGCs
increase in body burden mercury from baseline conditions (Figure 11).
A comparison of body burden mercury levels at NGC, uncorrected for age or length, declined
from 2008 to 2009, began to rise from 2009 to 2012, then decreased from 2012 to 2014 with
another slight increase in 2015 (Figure 12). The trend at SGC showed a slight decrease in body
burden mercury from 2008 to 2012, followed by an increase from 2012 to 2015. Control
Tributary 5A remained relatively consistent between years. For YOY and aged 1+ Pearl Dace,
classified based on aging structures, there was a slight decrease in body burden mercury levels
from 2013 to 2014 at NGC, followed by increase in 2015 (Figure 13). YOY and age 1+ Pearl Dace
from SGC and ST-5A had body burden mercury levels that remained relatively consistent
(Figure 13).
The GAM model for Pearl Dace (Figure 14), standardizing for total length, was highly significant
when including both year and total length and explained 23.4%, 15.7%, and 36.4% (NGC, SGC
and ST5A, respectively) of the deviance in total mercury concentration in fish tissue. The trend
analysis indicates an increase in body burden mercury concentrations for fish from NGC since
2008 specific to a standardized fish size of 60 mm, with a peak reached in 2011 and 2012. This
peak was followed by a gradual reduction from 2013 through 2015. For SGC and ST-5A the trend
analysis showed near steady state conditions from 2008 with only a marginal increase from 2014
to 2015.
While elevated methyl mercury concentrations are noted in downstream Granny Creek waters
compared to background and reference conditions, the concentrations are still very low and well
below the federal guideline (CEQG) of 4 ng/L. Yet, mercury body burden levels for Granny Creek
small-bodied fish have remained elevated and are consistent with differences observed in surface
water quality. Methyl mercury concentrations for the Granny Creek system are also noted as
being consistently above the bioaccumulation threshold of 0.05 ng/L for filtered methyl mercury
samples cited by the US EPA (1997) for the protection of fish-eating wildlife species.
It should also be noted that the average concentrations of total mercury in small-bodied fish
remain above the CEQG tissue residue guideline for the protection of wildlife consumers of
aquatic biota (0.033 mg/kg as methyl mercury) at both the Granny Creek system and the control
(Tributary 5A). However, the exceedance of this guideline is marginal at the control. It should be
noted that methyl mercury concentrations in fish have not been analyzed to date. The proportion
of methyl mercury to total mercury in fish muscle tissue has been reported as ranging from 80 to
100% for freshwater adult fish, with the majority of these indicating a percent greater than 90%
(Bishop and Neary 1975; Huckabee et al. 1979; Jackson 1990; Bloom 1992, Lasorsa and

De Beers Canada Inc., Victor Mine Mercury Performance Monitoring, 2015 Annual Report per Certificate of Approval #3960-7Q4K2G, Conditions 7(5) and 7(6) July 2016
TC140504 Page 25
Allen-Gil 1995; Kannan et al. 1997; Jewett et al. 2003). Therefore monitoring total mercury
concentration in fish tissue and assuming greater than 95% of the concentration is in the form of
methylmercury provides a conservative approach to monitoring and assessing potential risk to
the environment and user groups.
There is no consumption of these small bodied fish by humans.
3.5.3 Results – Attawapiskat River
Trout Perch
Univariate statistics for 2015 Trout Perch from the four Attawapiskat River stations, and from the
downstream Nayshkootayaow River station, are summarized in Table 31.
There were no differences in mean total length and weight for YOY Trout Perch from the
Attawapiskat River (ANOVA, p<0.10; Tables 31 and 32. For age 1+ Trout Perch, mean total length
and weight were significantly greater at ATT-FF compared to ATT-REF2 (80.65 mm and 4.67 g
versus 72.94 mm and 3.27 g) (ANOVA, p<0.10; Tables 31 and 32). Mean total length was also
significantly greater at ATT-FF compared to ATT-NF (80.65 mm versus 73.96 mm). Trout Perch
age 1+ were older on average at ATT-FF compared to ATT-NF and ATT-REF2 (ANOVA, p<0.10;
Tables 31 and 32).
Two-way ANOVA indicated that there was an effect of sampling location and age class (YOY
versus age 1+) on body burden mercury concentrations in Trout Perch (ANOVA, p<0.10;
Table 33). There was also a significant interaction between sampling area and age class
(ANOVA, p<0.10; Table 33). One-way ANOVA indicated no difference in fish tissue total mercury
concentration between sampling areas for YOY Trout Perch, whereas age 1+ Trout Perch
exhibited higher total mercury levels at ATT-FF compared to ATT-REF2 (0.12 mg/kg compared
to 0.10 mg/kg) (ANOVA, p<0.10; Tables 31 and 33; Figure 15). However, there was no statistical
difference in fish tissue total mercury concentration in 2014 between both the NF and FF locations
and either reference location (ATT-US and ATT-REF2) (Amec Foster Wheeler 2015). The
interaction between sampling area and age class is likely the result of varying proportions in YOY
captured between sampling areas (52, 37, 52 and 50% for ATT-NF, ATT-FF, ATT-REF2 and
ATT-US, respectively).
Known age for fish aged 1+ was significantly higher for Trout Perch captured from ATT-FF
compared to ATT-NF and ATT-REF2 (1.49 years compared to 1.15 and 1.06, respectively)
(Tables 31 and 32). However, linear regressions for total length at age for fish aged 1+ showed a
slightly greater growth trajectory for Trout Perch captured at ATT-REF in comparison to the other
sampling locations (Figure 16).
For Trout Perch (Age 1+), the least square mean of total mercury adjusted for total length was
significantly higher at ATT-FF compared to ATT-REF2 (0.104 mg/kg versus 0.094 mg/kg)
(ANCOVA, p<0.10; Table 34; Figure 17). Contrary to this, 2014 results indicated total mercury
De Beers Canada Inc., Victor Mine Mercury Performance Monitoring, 2015 Annual Report per Certificate of Approval #3960-7Q4K2G, Conditions 7(5) and 7(6) July 2016
TC140504 Page 26
adjusted for total length in Trout Perch from ATT-FF was not significantly different from
ATT-REF2, and was significantly lower than Trout Perch from ATT-NF and ATT-US (Amec Foster
Wheeler 2015). Total mercury concentration in fish tissues were not different between
Attawapiskat River sampling areas in 2015 when adjusted for age.
The BACI design indicated a significant interaction between year and sampling location for body
burden mercury concentration in Trout Perch from the Attawapiskat River system from 2009 to
2015 (baseline to present) (Table 35, Figure 18). Post hoc comparison showed body burden
mercury levels in Trout Perch decreased significantly at ATT-NF from 2009 to 2015 (Table 35,
Figure 18). There was a slight increase at ATT-FF and ATT-US from 2009 to 2015, but these
differences were not significant (Table 35; Figure 18). The ANCOVA used in the BACI design did
not satisfy the assumptions of equal slopes (p<0.10) due to variability in data over 6 years.
However, changes between sampling years in the LS means provides indication of decrease in
body burden mercury from baseline conditions at ATT-NF (Figure 18).
Body burden mercury concentrations (uncorrected for length) for Trout Perch in the Attawapiskat
River remained relatively consistent from 2008 to 2015 for both YOY and age 1+ fish (Figure 19),
with the exception of 2009 for age 1+ fish when mercury concentrations were slightly lower.
The GAM model for Trout Perch, standardized for a total length of 50 mm, showed relatively
similar total mercury concentrations at ATT-NF from 2009 to 2015 (Figure 20). At ATT-FF total
mercury concentrations were slightly higher in 2008 and 2009, but began to decrease and
become consistent after 2009, with a small elevation in 2015. At ATT-US total mercury levels
remained relatively consistent between 2009 and 2015. Deviance explained by the model were
29.5%, 9.18%, and 25.7% for ATT-FF, ATT-NF and ATT-US, respectively.
The data collected thus far, when viewed in their entirety, has not confirmed an effect caused by
the mine on small fish body mercury concentrations within the Attawapiskat River. This is
indicative of the information presented in Section 3.3.4. Methyl mercury and total mercury values
at monitoring locations with the Attawapiskat River and Nayshkootayaow River have remained
consistent across control and impact stations with no appreciable increase over time. Average
concentrations of total mercury in Trout Perch and Mottled Sculpin from the Attawapiskat River
remain above the CEQG tissue residue guideline for the protection of wildlife consumers of
aquatic biota (0.033 mg/kg) at both control and impacted sites. Mottled Sculpin exhibit the least
exceedance of this guideline with respect to small bodied species sampled as part of this program.
Mottled Sculpin
Mottled Sculpin has not previously been included as part of this assessment. However, as a result
of reasonable water clarity during field sampling and subsequent improved catchability at study
areas, this species was included for analysis in 2015. Sculpin are benthic foragers and therefore
inhabit a lower level of the trophic system than Trout-Perch. They exhibit an affinity for their
localized habitat and therefore may be considered to provide a more suitable indication of
De Beers Canada Inc., Victor Mine Mercury Performance Monitoring, 2015 Annual Report per Certificate of Approval #3960-7Q4K2G, Conditions 7(5) and 7(6) July 2016
TC140504 Page 27
localized effects than other fish species, which are prone to greater movements both diurnally
and otherwise.
Univariate statistics for 2015 Mottled Sculpin from the four Attawapiskat River stations are
summarized in Table 36. Sample sizes of YOY Mottled Sculpin were less than 5 at each sampling
location, thus all statistical analyses were completed on fish age 1+ (Table 36).
Mean total length and weight were significantly lower for age 1+ Mottled Sculpin from ATT-REF2
compared to ATT-NF, ATT-FF and ATT-US (ANOVA, p<0.10; Tables 36 and 37) (60.45 mm and
2.65 g versus 68.85 mm and 3.77 g, 69.54 mm and 3.78 g, 70.27 mm and 4.09 g, respectively).
There was no significant difference in the known age of fish (aged 1+) sampled from each location
(ANOVA, p>0.10; Tables 36 and 37). Total fish tissue mercury in fish aged 1+ (uncorrected for
total length) was significantly higher at ATT-FF in comparison to ATT-NF, ATT-REF2 and ATT-US
(0.10 versus 0.07, 0.06 and 0.08 mg/kg, respectively) (ANOVA, p<0.10; Tables 36 and 37,
Figure 21).
For Mottled Sculpin (aged 1+), the least square mean of total mercury adjusted for total length
was significantly higher at ATT-FF compared to ATT-NF, ATT-REF2 and ATT-US (0.089 mg/kg
versus 0.062, 0.063 and 0.070 mg/kg, respectively) (ANCOVA, p<0.10; Table 38, Figure 22).
Similarly, the least square mean of total mercury adjusted for age in Mottled Sculpin age 1+ was
significantly higher at ATT-FF compared to ATT-NF, ATT-REF2 and ATT-US (0.094 versus 0.067,
0.058 and 0.069 mg.kg, respectively) (Table 39).
Although data for Mottled Sculpin in the Attawapiskat River is limited to 2015, at this point there
is no significant difference in fish tissue mercury concentrations in fish captured in the near field
exposure area (ATT-NF) and both reference areas (ATT-REF2 and ATT-US). As such, no mine
related effects were determined through this assessment. Monitoring data from future years will
be further assessed to provide additional information on this aspect.
3.5.4 Nayshkootayaow River
Univariate statistics for 2015 Pearl Dace from the upstream and downstream locations of the
Nayshkootayaow River are summarized in Table 40. Trout Perch were only captured in the
downstream sampling location of the Nayshkootayaow River in 2015, and are summarized in
Table 31.
Trout Perch body burden mercury concentrations for fish from the downstream Nayshkootayaow
River station for 2015, were comparable to those of the four Attawapiskat River stations
(Table 31), indicating no effect.
Mean total length and weight were significantly higher for YOY Pearl Dace from NAY-DS6
compared to NAY-US3 (ANOVA, p<0.10, Tables 40 and 41) (41.12 mm and 0.53 g versus
36.33 mm and 0.38 g). There was no significant difference in size for fish age 1+ between
upstream and downstream sampling locations.

De Beers Canada Inc., Victor Mine Mercury Performance Monitoring, 2015 Annual Report per Certificate of Approval #3960-7Q4K2G, Conditions 7(5) and 7(6) July 2016
TC140504 Page 28
Two-way ANOVA indicated that there was an effect of sampling location but not age class (YOY
versus age 1+) on body burden mercury concentrations in Pearl Dace (ANOVA, p<0.10;
Table 42). There was also a significant interaction between sampling area and age class
(ANOVA, p<0.10; Table 42). One way ANOVA indicated higher total mercury concentrations in
fish tissue for YOY Pearl Dace from NAY-DS6 compared to NAY-US3 (0.16 mg/kg versus
0.07 mg/kg). The same trend was observed for Pearl Dace age 1+ (0.13 mg/kg at NAY-DS6
versus 0.08 mg/kg at NAY-US3) (ANOVA, p<0.10; Tables 40 and 42; Figure 23).The proportions
of YOY captured at both sampling locations were similar (30 and 33% for NAY-DS6 and
NAY-US3, respectively). However, the 4 highest tissue mercury concentrations from both
locations were found at NAY-DS6, and 3 of these values were obtained from YOY fish, likely
resulting in the interaction between sampling area and age class on tissue mercury values.
For Pearl Dace (Age 1+), the least square mean of total mercury adjusted for total length was
significantly higher at NAY-DS6 compared to NAY-US3 (0.116 mg/kg versus 0.080 mg/kg)
(ANCOVA, p<0.10; Table 43; Figure 24). The least square mean of total mercury was also
significantly higher at NAY-DS6 compared to NAY-US3 when adjusted for known age
(0.116 mg/kg versus 0.080 mg/kg) (ANCOVA, p<0.10; Table 44).
Higher levels of total mercury in Pearl Dace fish tissue from the downstream Nayshkootayaow
River location (NAY-DS6) when compared to the upstream location (NAY-US3) is inconsistent
with results of previous annual mercury performance monitoring reports. Data from 2009, 2010
and 2011 were not statistically different between these sampling locations (AMEC 2010; AMEC
2011; AMEC 2012) (Table 45). Therefore, the long-term trend in comparative study of fish tissue
between control and impact sites in the Nayshkootayaow River does not indicate an effect from
either natural phenomenon or the mine to small-bodied fish tissue mercury concentrations. A
single year (2015) of significant difference between the control and impact areas for Pearl Dace
tissue mercury concentration may indicate natural site-specific effect or a mine related effect,
however, confirmation of a change in the long-term trend is important and will occur with
successive study in 2016 and beyond.
Furthermore, as discussed in Sections 3.3.4 and 3.5.3, no trend of increase for methyl-mercury
or total mercury was identified in surface water through monitoring of the Nayshkootayaow River
including at sites downstream of Granny Creek, for the entire period of record. Increased levels
of mercury uptake by fish through surface water is therefore unlikely in the Nayshkootayaow
River.

De Beers Canada Inc., Victor Mine Mercury Performance Monitoring, 2015 Annual Report per Certificate of Approval #3960-7Q4K2G, Conditions 7(5) and 7(6) July 2016
TC140504 Page 29
4.0 REPORTING – CONDITION 6(9) DATA
4.1 Annual Analysis of Peat Pore Water
As described in Section 3.2 and as a general observation, concentrations of total and methyl
mercury in the 2015 peat horizon water samples were not markedly higher or lower than the range
of data for previous years.
Statistical analyses of total and methyl mercury peat pore water concentrations are presented in
Table 46 for the: S-1 stations (Table 46a), the S-2 stations (Table 46b), the S-7 stations
(Table 46c), the S-8 stations (Table 46d), the S-9(1) stations (Table 46e), the S-9(2) stations
(Table 46f), and the S-V stations (Table 46g). None of these station clusters showed a statistically
significant location effect compared with the S-13 / S-15 background control stations baseline
using Two-Way Analysis of Variance at α = 0.05.
In 2014 the MS-8 peat horizon cluster, located to the north of the Victor Mine in an undisturbed
area of muskeg, had shown a statistically significant location effect for total mercury. It was
speculated in the last annual mercury report that the 2014 result for the MS-8 cluster of stations
might simply have been a random effect of carrying out larger numbers of statistical tests, wherein
one out of 20 test results would be expected to generate a statistically significant result at the 0.05
probability level due to random chance alone, when the samples are in fact not statistically
different. The 2015 results support this contention, but it is noted that the MS-8 samples were still
higher than the MS-13/MS-15 control station average for all four muskeg types, though not to the
extent observed in 2014. If the 2014 data are excluded from the MS-8 total mercury analysis there
is no temporal trend to the data except for the flat bog type, where a longer term trend to increasing
values is evident (Table 2a).
As per Section 1, it had been speculated by some reviewers during the provincial permitting
process that mine dewatering might cause extensive drying out of the muskeg environment
surrounding the Victor Mine, and that such drying out could release additional mercury to the
environment. Since the MS-8 series muskeg piezometers continue to be of interest and because
this cluster is within the current zone of upper bedrock dewatering (Figure 2) it is still important to
consider the MS-8 cluster monitoring results within the context of the original concern.
The 2013 Annual Mercury Report compared satellite imagery for 2006 (predevelopment) with
imagery from 2012. This analysis showed that muskeg environments surrounding the Victor Mine
remained generally saturated, but that localized areas of mine-related muskeg dewatering in
association with bioherms and bedrock subcrop zones were occurring. This effect was predicted
in the federal environmental assessment for the Victor Mine (Federal Authorities, 2005). With
specific regard to the MS-8 station cluster of peat piezometers, the satellite image for September
2015 clearly shows that environments associated with each of the four muskeg piezometers
remained saturated, with no evidence of drying ponds (Figure 26).
De Beers Canada Inc., Victor Mine Mercury Performance Monitoring, 2015 Annual Report per Certificate of Approval #3960-7Q4K2G, Conditions 7(5) and 7(6) July 2016
TC140504 Page 30
Groundwater level data recorded from the four muskeg piezometers also shows that the muskeg
environment associated with the four MS-8 series piezometers has remained saturated since
2007 despite depressurization of the underlying bedrock and marine sediment horizons
(Figure 27). However, over the last couple of years, groundwater level data for the MS-8 series
of piezometers do show increasing levels of seasonal variation within the four muskeg terrain
types. This variation shows up as a gradual decline in water levels over the winter months followed
by an abrupt return to background levels during the spring with water levels maintained over the
remainder of the open water period. Muskeg systems are therefore still effectively saturated, and
there is no evidence of muskeg drying out.
4.2 Annual Analysis of Mineral Soil Pore Water
Total and methyl mercury results from shallow and deep clay pore water samples have continued
to show generally low values, with no defining trends, other than for the S-15 bedrock samples
(Tables 2g, 2h and 2i). For 2015, filtered total mercury values were all <0.5 ng/L for shallow clay
samples, <0.2 ng/L for deep clay samples, and generally <1.0 ng/L for bedrock samples, with the
exception of Stations S-8, S-13 and S-15 which recorded values of 1.45, 1.29 and 2.44 ng/L,
respectively. Stations S-13 and S-15 are remote control stations (Figure 1). Filtered methyl
mercury values were all ≤0.05 ng/L for shallow clay samples, except for a 0.12 ng/L value for
Station S-8-Cl-3; ≤0.02 ng/L for all deep clay samples; and <0.02 ng/L for all bedrock samples,
with the exception of a 0.08 ng/L value for the S-7 location, and a 0.21 ng/L value for the
S-8 location.
One trend that has emerged is for the S-15 set of bedrock samples for filtered total mercury.
Except for 2013, this station has consistently shown the highest total mercury concentration. The
S-15 monitoring well is located 23 km west from the open pit centre, and is well beyond any mine
dewatering influence.
4.3 Annual Analysis of Surface Waters
Statistical analyses of total and methyl mercury concentrations in surface water samples are
presented in Table 47. Monthly analyses of total mercury concentrations for North Granny Creek
showed lower mercury concentrations for the intermediate DS-NWF-G2 station, compared with
upstream and downstream stations, for both unfiltered and filtered samples (Tables 47a and 47b).
The difference for filtered total mercury samples, based on two-way ANOVA, was statistically
significant at the 0.05 probability level (Table 47b). South Granny Creek total mercury
concentrations for upstream and downstream stations were not statistically different for either
unfiltered or filtered samples (Tables 47c and 47d).
Methyl mercury concentrations in upstream, mid-stream and downstream reaches for North
Granny Creek were statistically significant for both unfiltered and filtered samples (Tables 47a
and 47b). For both unfiltered and filtered samples, methyl mercury concentrations showed a
progressive increase from the upstream station (US-NWF-G1), through the mid-stream
(DS-NWF-G2) and further downstream (DS-NEF-G3) stations. Methyl mercury concentrations for
De Beers Canada Inc., Victor Mine Mercury Performance Monitoring, 2015 Annual Report per Certificate of Approval #3960-7Q4K2G, Conditions 7(5) and 7(6) July 2016
TC140504 Page 31
South Granny Creek were not statistically different between the upstream (UP-SWF-G5) and
downstream (DS-SWF-G6) stations (Tables 47c and 47d). The North Granny Creek G4 and South
Granny Creek G7 stations were not included in the analysis as these stations are only sampled
quarterly, as opposed to monthly. Also, there were some missing monthly samples for methyl
mercury for the South Granny Creek stations for unfiltered (August) and filtered (August and
September) samples.
If the analysis for methyl mercury for South Granny Creek is performed on quarterly samples
inclusive of stations G5, G6 and G7, a definite trend to increasing methyl mercury concentrations
was observed from upstream to downstream, but these trends were not statistically significant.
As described in Section 3.3.3, based on summer/fall (July/October) data, the Granny Creek
confluence station (G8) has, since 2011, shown lower filtered and unfiltered methyl mercury
concentrations compared with either of the downstream North and South Granny Creek stations
(G4 and G7), (Table 14). Methyl mercury concentrations for the Granny Creek confluence
G8 station have, in fact, remained stable at substantively lower concentrations throughout the
period of mine operations, suggesting that mercury demethylation may be occurring between the
G-4/G-7 stations and the G-8 station.
As per Section 3.3, it is likely that methyl mercury dynamics in peatlands around the mine site are
being influenced by elevated sulphate levels, and not by mine dewatering. However, while methyl
mercury values were elevated in downstream portions of the Granny Creek system, all values
were well below the CEQG value of 4 mg/L.
Data for the Nayshkootayaow and Attawapiskat Rivers show no upstream or downstream trends.
There were no statistically significant results for total or methyl mercury, on either unfiltered or
filtered samples, for either river (Tables 47e through 47h).
4.4 Trend Analysis of Well Field Water Discharge
Monthly well field discharge data are presented in Table 15. Similar to previous years, from 2009
to present, both total and methyl mercury remain, on average, at or below comparable
Attawapiskat River background concentrations (Tables 13 and 14). There are no evident trends
to the data other than a noted gradual small increase in unfiltered total mercury values (Figure 6).
4.5 Annual Analysis of Fish Mercury Body Burdens
Overall mercury levels in small-bodied fish tissues (Pearl Dace) continued to be higher for North
Granny Creek and South Granny Creek, compared with fish from control Tributary 5A. The
highest levels of mercury concentrations were observed in North Granny Creek in 2015. Pearl
Dace from NGC in 2015, were significantly larger (total length and weight) than their counterparts
for SGC and ST-5A. Although known age was similar for fish aged 1+ between all three sampling
locations implying a potentially greater growth rate for this species in NGC. This was confirmed
through length-at-age regression.

De Beers Canada Inc., Victor Mine Mercury Performance Monitoring, 2015 Annual Report per Certificate of Approval #3960-7Q4K2G, Conditions 7(5) and 7(6) July 2016
TC140504 Page 32
Bioaccumulation of mercury in fish is influenced by diet and growth rate. The availability of
different types of food sources and feeding preferences can influence the amount of mercury
ingested and metabolized, and between the three different creeks, could account for some
differences in fish tissue mercury concentrations in resident Pearl Dace. However, fish from the
same environment and same age with faster growth rates will typically see a slower rate of
bioaccumulation than smaller, slower growing individuals. This is due to somatic growth dilution
(SGD). Mercury is not as easily retained within the body of individuals with higher rates of
metabolic processes and is therefore discarded. Slow growing individuals may allow mercury to
assimilate itself into tissues with time and therefore have higher concentrations (Harris and
Bodaly, 1998; Simoneau et al., 2005). In the case of NGC where growth rates are greater than in
SGC or ST-5A the forage base may be high in bioavailable mercury as the dilution effect has not
shown a compensatory effect to fish tissue concentrations.
Data collected thus far for Trout Perch from the Attawapiskat River when viewed in their entirety
show a lack of consistency in results between years. Results from 2014 found body size (length
and weight) was similar between all sampling locations, and mercury concentrations adjusted for
total length also relatively similar between all sampling locations, with the far-field exposure area
(ATT-FF) having the lowest concentrations. Contrary to this, in 2015 fish from ATT-FF were larger
(length and weight), older, and had the higher tissue mercury concentrations than the other
sampling locations. Although the far field exposure area had mercury concentrations higher than
that of both reference areas, concentrations in the near field exposure area remained low and at
levels similar to the reference areas. Methyl mercury and total mercury values at monitoring
locations with the Attawapiskat River and Nayshkootayaow River have remained consistent
across control and impact stations with no appreciable increase over time. In addition to being
well below the CEQG of 4 ng/L for the protection of aquatic life, methyl mercury concentrations in
the Attawapiskat and Nayshkootayaow Rivers were also generally at or below the
bioaccumulation threshold of 0.05 ng/L for filtered methyl mercury samples (US EPA 1997) for
the protection of fish-eating wildlife species.
Mottled Sculpin from the Attawapiskat River were similar in size at all locations, yet tissue mercury
concentrations were significantly higher at ATT-FF, when compared to ATT-NF, ATT-REF2 and
ATT-US. Trout Perch and Mottled Sculpin occupy different trophic levels in the Attawapiskat
River, and both exhibit high levels of mercury in fish tissue at ATT-FF compared to all other
sampling locations. The root cause of high concentrations at ATT-FF in 2015 is not understood,
and is not consistent with observed water quality data for this syetm. Continued monitoring over
time of both Mottled Sculpin and Trout perch will determine if consistent trends in the data are
present. Study of Mottled Sculpin moving forward will provide for a secondary species which is
known to have greater site affinity and association with the benthic community of the system.
Average tissue mercury levels in Nayshkootayaow River Pearl Dace was significantly higher at
the impact area (NAY-DS6) compared to the upstream control area (NAY-US3). This difference
was present despite fish from both sampling locations being similar in total length, weight and age
(≥1 year). There is no long term species specific data for the Nayshkootayaow River, as the
sentinel species has alternated between Trout Perch and Pearl Dace based on yearly catchability

De Beers Canada Inc., Victor Mine Mercury Performance Monitoring, 2015 Annual Report per Certificate of Approval #3960-7Q4K2G, Conditions 7(5) and 7(6) July 2016
TC140504 Page 33
and environmental conditions, making it difficult to compare results between years. In previous
years where Pearl Dace were captured with sufficient abundance to complete statistical analyses
(2009, 2010 and 2012), no difference was found in tissue mercury concentrations between the
downstream and upstream sampling locations (Table 45).
In 2013, large-body fish species (Northern Pike, Walleye and White Sucker) from the
Nayshkootayaow River had similar tissue mercury concentrations when compared to the control
area (Monument Channel). Nayshkootayaow River large-bodied fish also had similar tissue
mercury concentrations from 2010 to 2013 (AMEC 2014b) thereby indicating no appreciable effect
to the upper trophic levels with respect to mercury bioaccumulation. In 2014, Pearl Dace were
captured from only the downstream location of the Nayshkootayaow River, and although
statistical comparison analyses could not be completed, tissue mercury concentrations were
similar in value to those from Tributary 5A (AMEC, 2015). Data collected thus far for small-bodied
fish species in the Nayshkootayaow River provides no indication of an effect, and surface water
methyl-mercury and total mercury concentrations were consistent across control and impact
locations in the Nayshkootayaow River with no indication of increase. Monitoring of small-bodied
fish species (in particular, Pearl Dace) will continue in 2016 and provide further information with
respect to mercury body burdens within the Nayshkootayaow River. Small-bodied fish from all
locations (control and impacted) and water bodies remained above the CEQG tissue residue
guideline for the protection of wildlife consumers of aquatic biota (0.033 mg/kg) in 2015.
Recommendations Section
Regarding the continued monitoring of small-bodied fish species as part of the annual mercury
performance monitoring study. The following is recommended:
Timing the sampling for Peal Dace within the Granny Creek system to coincide with the
end of the growth season, but prior to fall precipitation events and marked reductions in
air and water temperature, which reduce the catchability of this species. Sampling to be
conducted so as to target Pearl Dace in Granny Creek and the control tributary
(Tributary 5A) within the same period, and preferably late August to mid-September as in
previous years, when catchability was optimal. The year 2015 exhibited substantively
higher summer precipitation rates compared with other years, which influenced sampling.
Unpredictability of the timing of the onset of fall rain events from year to year poses annual
logistic considerations.
To reduce the potential for bias associated with age of Pearl Dace between sampling
areas and to provide adequate statistical power (90% or greater), sample size should be
increased above the minimum required by the C. of A. It is proposed that 30 YOY from
each of North Granny Creek, South Granny Creek and Tributary 5A be sampled for
analysis. Fish aged 1 year of age or greater should be sampled from each of the previously
listed watercourses at up to total of 50 individuals. Sampling should be random with
respect to size and age to provide for a representative sample of age structure by

De Beers Canada Inc., Victor Mine Mercury Performance Monitoring, 2015 Annual Report per Certificate of Approval #3960-7Q4K2G, Conditions 7(5) and 7(6) July 2016
TC140504 Page 34
watercourse. All individuals should have calcified age structures harvested if possible to
allow for assessment of known age for comparative analysis as conducted for 2015.
Continue to monitor the secondary reference area on the Attawapiskat River (ATT-REF2)
as it provides further information on the variability of mercury body burdens in sentinel
species and provides a location which has similarity to the near-field and far-field sampling
areas.
Continue to include Mottled Sculpin as a species for analysis from the Attawapiskat River
due to its site affinity and benthic association.
As able, capture both Pearl Dace and Trout Perch for analysis of tissue mercury
concentrations from the Nayshkootayaow River to provide context to previous year’s
results.
De Beers Canada Inc., Victor Mine Mercury Performance Monitoring, 2015 Annual Report per Certificate of Approval #3960-7Q4K2G, Conditions 7(5) and 7(6) July 2016
TC140504 Page 35
5.0 SULPHATE SOURCE INVESTIGATIONS AND CONTROL
Sulphate data for the period of 2010 through 2015 are provided in Tables 48a through 48f.
Sampling locations are shown in Figure 28. The 2015 data include a greater number of stations,
particularly in association with the waste rock stockpile, including sampling from three new wells
installed within the stockpile by a drilling program conducted in mid 2015 (WR-North, WR-Centre,
WR-East). One similar monitoring well (LG-South) was installed within the Low Grade Kimberlite
stockpile. The 2015 data show the following aspects:
Sulphate concentrations in the NEF final compliance point appear to have stabilized over
the past three years to an average annual concentration of approximately 70 mg/L.
Sulphate concentrations were highest in the proximal end of the NEF (i.e., NEF-M where
the fen borders the east side of the Attawapiskat River Road) in all years from 2011
onward, with the average annual value for 2015 being 155 mg/L, declining to 55.6 mg/L
at the mid fen station (NEF-M2) (Table 48a). These data suggest that sulphate is being
consumed by microorganisms within the fen, with some possible dilution effects from the
surrounding landscape.
Highest average sulphate concentrations occur within the central portion of the mine rock
stockpile (WR-Centre – 378.3 mg/L); at the eastern, central edge of the mine rock stockpile
(WR-East – 402.8 mg/L); and just east of the eastern, central edge of the mine rock
stockpile (WR-B – 369.5 mg/L, WR-C – 342.7 mg/L. These stations all fall along the line
of the original fen track through this area, and may therefor represent the dominant
subsurface seepage flow path for the mine rock stockpile, connecting with the proximal
end of the NEF.
Average sulphate concentrations associated with the WR-North well site (90.6 mg/L)
indicate some potential seepage from the northern portion of the mine rock stockpile that
may be entering North Granny Creek along a broad front in this area. Further investigation
in this area is planned for the summer of 2016.
The south portion of the mine rock stockpile drains to the fen track that borders the south
side of the stockpile. This fen track also collects drainage from the plant site area, and
ultimately drains to the Phase 1 Mine Water Pond bordering the north side of the open pit,
by way of the E House P1 station (average sulphate 36.5 mg/L). The Phase 1 Mine Water
Pond sulphate concentration averaged 72.0 mg/L.
Sulphate concentrations associated with the low grade ore stockpile averaged 157.8 mg/L
for surface water ponds at the west side of the stockpile, and 121.6 mg/L within the south
side of the stockpile, showing that sulphates are also draining to muskeg zones that report
to South Granny Creek. LG Pond 3 relates primarily to coarse processed kimberlite which
De Beers Canada Inc., Victor Mine Mercury Performance Monitoring, 2015 Annual Report per Certificate of Approval #3960-7Q4K2G, Conditions 7(5) and 7(6) July 2016
TC140504 Page 36
has been washed through the process plant, and contains lower levels of sulphate (50.4
mg/L).
Shallow groundwater samples collected from the perimeter of the landfill (stations LF3,
LF-4A, LF-4B, LF-5, LF-6 and LF-7) generally showed very low sulphate concentrations,
indicating that the landfill is not a significant source of sulphate. Positioning of the landfill
immediately adjacent to the southwest corner of the mine rock stockpile complicates
measured sulphate concentrations in this area.
The primary source of sulphate to the NEF, and to muskeg areas bordering the north side of the
mine rock stockpile that may also drain to North Granny Creek, is apparently the mine rock
stockpile. The low grade ore stockpile appears to be the primary source of sulphate loading to
muskeg zones that drain to South Granny Creek.
At mine closure, the water management strategy being pursued by De Beers (subject to further
investigation) is to force drainage from these stockpile areas to the open pit, through the
development of additional collection ditches. This will largely prevent sulphate containing waters
from the stockpiles from contacting the surrounding muskeg landscape. Hydrogeological
modeling for the open pit has shown that the pit will ultimately fill to within approximately 3 m of
the ground surface, and will maintain that approximate water level via subsurface groundwater
flow connections though the Upper Attawapiskat Formation (bedrock) connection to the
Attawapiskat River. Sulphate concentrations measured for the Upper Attawapiskat Formation in
the pre-development background condition average approximately 235 mg/L (AMEC 2004), such
that sulphate addition to the Attawapiskat River through this pathway would mimic natural
conditions.
During the interim condition, between mid-2015 and late 2018, De Beers is still evaluating the
option of collecting water from either the central portion of the stockpile using one or more wells,
or from the east, central margin of the mine rock stockpile via a sump, and pumping this water
directly to the Attawapiskat River through the existing well field pipeline. A series of water samples
collected from below the mine rock stockpile during 2015, from wells at stations WR-Centre, WR-
East and WR-North, showed low filtered methyl mercury concentrations averaging 0.036, 0.075
and 0.054 ng/L, respectively. A set of six samples was collected from each well.
Options for managing runoff and seepage from the low grade ore stockpile are still under
investigation, but potentially could include similar collection wells or sumps, pumped to the river
during the mine operations phase. The only well developed within the low grade ore stockpile
(LG-South) showed an average filtered methyl mercury concentration of 0.194 ng/L, based on a
set of seven samples. The reason for higher methyl mercury values observed for the LG-South
well, compared with the three mine rock wells (WR-Centre, WR-East and WR-North), is unclear.

De Beers Canada Inc., Victor Mine Mercury Performance Monitoring, 2015 Annual Report per Certificate of Approval #3960-7Q4K2G, Conditions 7(5) and 7(6) July 2016
TC140504 Page 37
6.0 CONCLUSIONS
6.1 Peat Pore Waters
Total and methyl mercury concentrations in peat pore waters remained considerably lower
than the respective CEQG values of 26 ng/L for total mercury and 4 ng/L for methyl
mercury, and there are no evident trends in the data.
Statistical analysis of peat pore waters showed no significant differences for total or methyl
mercury, between peat complexes located near to and at mid-distances from the mine
site, compared with more remote control stations.
6.2 Surface Waters
Total mercury concentrations measured in proximal area fen systems (NEF, SEF and
HgCON) were well below the CEQG value of 26 ng/L. An analysis of quarterly data for the
past three years for the open water period (May, July and October) has shown that
unfiltered and filtered total mercury values for the NEF have been lower than for either of
the two control fens (SEF and HgCON), and that these differences are statistically
significant (Table 7). It is speculated that the small stores of total mercury in the NEF may
be becoming depleted through the long-term generation and flushing of methyl mercury
from the NEF system (Section 3.3.1).
Methyl mercury concentrations in the NEF, which receives (or received) various site
effluents, continued to show elevated methyl mercury concentrations in 2015 compared
with the control fens (SEF and HgCON). Elevated methyl mercury concentrations in the
NEF are believed to be the result of sulphate-rich effluent waters which stimulate the
mercury methylation process, and are not a function of well field dewatering effects.
De Beers has continued to collect additional sulphate data from the general Victor Mine
site, and particularly in reference to NEF drainages. Some actions have been taken to
reduce sulphate loadings to the NEF. There is also evidence to suggest that mercury
methylation rates within the NEF may have peaked in 2011 and 2012, and have since
continued to decline (Section 3.3).
Analysis of total and methyl mercury concentrations for area ribbed fen systems show no
obvious increasing or decreasing trends; and no appreciable differences between stations
that are located within the mine dewatering 2 m drawdown contour (under drained sites)
and those stations that are located outside of this contour (remote sites).
Analysis of other parameters measured for ribbed fen systems (pH, DOC, sulphate and
iron) showed a positive correlation between filtered methyl mercury and DOC (r2 = 0.301)
and a weak negative correlation between filtered methyl mercury and pH (r2 = 0.155). No
correlation was shown with either iron or sulphate. The lack of a correlation between

De Beers Canada Inc., Victor Mine Mercury Performance Monitoring, 2015 Annual Report per Certificate of Approval #3960-7Q4K2G, Conditions 7(5) and 7(6) July 2016
TC140504 Page 38
methyl mercury and sulphate in area fen systems is likely a function of sulphate
concentrations being too low in these fens to trigger mercury methylation.
Total and methyl mercury concentrations measured in area surface waters (Granny Creek,
the Nayshkootayaow River and the Attawapiskat River) show mercury concentrations well
below the applicable CEQG values of 26 ng/L and 4 ng/L, respectively. Filtered methyl
mercury values for the Granny Creek system are, however, generally above the US EPA
bioaccumulation threshold criterion of 0.05 ng/L set for the protection of fish-eating wildlife
species such as Bald Eagle and River Otter.
The Nayshkootayaow and Attawapiskat River show essentially background
concentrations for total and methyl mercury, both upstream and downstream of the Victor
Mine, with no evident trends to the data.
North and South Granny Creek continue to show trends to elevated methyl mercury
concentrations in downstream waters, compared with the upstream stations for these two
creeks, and compared with the Tributary 5A control site. Observed downstream increases
in methyl mercury for the Granny Creek system are believed to be attributable to sulphate-
rich effluent waters which stimulate the mercury methylation process, and not a function
of well field dewatering effects. Long-term average annual filtered methyl mercury
concentrations for the downstream North Granny Creek stations ranged from <0.13 to
<0.18 ng/L, compared to <0.07 ng/L for the upstream station. Comparable values for
South Granny Creek were <0.08 to <0.21 ng/L for the downstream stations, and
<0.08 ng/L for the upstream station. Filtered methyl mercury concentrations between
upstream and downstream stations were statistically significant for North Granny Creek
stations, but not for South Granny Creek stations.
A comparison of filtered and unfiltered methyl mercury concentrations for the Granny
Creek confluence station (G-8), with values for the furthest downstream North and South
Granny Creek stations (G-4 and G-7), for the summer / fall (July / October) period showed
that elevated methyl mercury values from North and South Granny Creeks appeared to
decline to background values at the Granny Creek confluence station, possibly as a result
of bacterial demethylation processes.
Well field discharge total and methyl mercury concentrations are well below CEQG values,
and are also generally below Attawapiskat River background values upstream of the mine
discharge. There are no evident long-term trends in the data with the possible exception
of a slight increasing trend for unfiltered total mercury values.

De Beers Canada Inc., Victor Mine Mercury Performance Monitoring, 2015 Annual Report per Certificate of Approval #3960-7Q4K2G, Conditions 7(5) and 7(6) July 2016
TC140504 Page 39
6.3 Small Fish Mercury Body Burdens
Small-bodied fish from all locations (control and impacted) and water bodies remained
above the CEQG tissue residue guideline for the protection of wildlife consumers of
aquatic biota (0.033 mg/kg) in 2015.
In general there has been an increase in total mercury body burden levels in small fish
(Pearl Dace) within the Granny Creek system relative to baseline conditions, and to body
burden concentrations observed for this species from the control site (Tributary 5A). This
effect is attributed to increased sulphate loadings to localized muskeg environments near
to the Victor Mine, with sulphate stimulating the growth of sulphate reducing (mercury
methylating) bacteria.
Pearl Dace from North Granny Creek in 2015, were significantly larger (total length and
weight) than their counterparts for South Granny Creek and Tributary 5A. Although known
age was similar for fish aged 1+ between all three sampling locations implying a potentially
greater growth rate for this species in North Granny Creek. This was confirmed through
length-at-age regression. Mercury body burden levels were remained greater in the
Granny Creek system after correction for length or age.
Trend analysis indicated an increase in tissue mercury concentrations at a standard size
for Pearl Dace in North Granny Creek from 2008 to 2012, with a gradual decrease from
2013 through 2015. For South Granny Creek and Tributary 5A the trend analysis showed
near steady state conditions from 2008 to 2014 with only a marginal increase from 2014
to 2015.
The data collected thus far for small fish (Trout Perch) from the Attawapiskat River, when
viewed in their entirety, show that there has not been an effect on small fish body burden
mercury concentrations within the Attawapiskat River.
Despite Pearl Dace having a significantly higher mercury body burden level at the
downstream location of the Nayshkootayaow River compared to the upstream control
station, overall the data collected thus far for small-bodied fish species in the
Nayshkootayaow River provides no indication of an effect. Surface water methyl-mercury
and total mercury concentrations were consistent across control and impact locations in
the Nayshkootayaow River with no indication of increase. Monitoring of small-bodied fish
species (in particular, Pearl Dace) will continue in 2016 and provide further information
with respect to mercury body burdens within the Nayshkootayaow River.
6.4 Consistency with the 2008 Trigger Values Document
The AMEC 2008 trigger values document stipulated the following general responses to observed
increases mercury concentrations in water or in fish:
De Beers Canada Inc., Victor Mine Mercury Performance Monitoring, 2015 Annual Report per Certificate of Approval #3960-7Q4K2G, Conditions 7(5) and 7(6) July 2016
TC140504 Page 40
Level 1 response: if a statistically significant difference is observed between experimental
and control station results, at an alpha 0.05 level, then a potential concern will be deemed
to exist, requiring further investigation, principally through increased sampling effort to
confirm the result. It should be noted that the sampling program was already very
extensive from the outset, and that the program was proactively increased beyond C. of A.
requirements. Also independent research by a consortium of local universities was
proactively initiated.
Level 2 response: if increased sampling (or further investigation) confirms that a concern
continues to exist then a root cause analysis of the condition is to be undertaken, and if
appropriate, following consultation with the MOECC and the Attawapiskat First Nation
(AttFN), predictive modelling studies are to be undertaken to determine expected longer-
term performance of the system.
Level 3 response: if increased mercury concentrations are likely to result in an
Attawapiskat River mercury concentration increase of greater than 10%, or an increase in
the concentration of mercury in local pike flesh by greater than 10% over background
conditions, then a comprehensive risk assessment is to be undertaken.
Level 4 response: if the risk assessment carried out as per Level 3 indicates that there is
likely to be a meaningful adverse effect on aquatic life, a mitigation strategy is to be
developed to reduce the level of risk.
Statistically significant differences in methyl mercury concentrations, compared with control
stations, have been determined for Granny Creek water quality, and for total mercury body burden
levels in Granny Creek small fish. Additional sampling has been carried out in response to this
condition and a root cause analysis has been undertaken, which has identified sulphate release
to local muskeg environments as the most probable root cause of increased mercury methylation
in the system. Further investigations were undertaken to better understand the mechanisms of
sulphate release, and measures are being developed to better manage this release. Thus far
there is no indication of an expected increase in Attawapiskat River mercury concentrations for
either total or methyl mercury, and there is no indication of an increase in the concentration of
mercury in local pike flesh by greater than 10% over background conditions. Conditions of the
2008 trigger document have been met. Furthermore, there is no indication of a confirmed increase
in the Nayshkootayaow River for either total or methyl mercury, or in fish flesh.

De Beers Canada Inc., Victor Mine Mercury Performance Monitoring, 2015 Annual Report per Certificate of Approval #3960-7Q4K2G, Conditions 7(5) and 7(6) July 2016
TC140504 Page 41
7.0 RECOMMENDATIONS
The mercury monitoring program conducted at the Victor Mine is both extensive and robust, and
it is recommended that the monitoring program continue to be carried out in its current form.
De Beers is continuing to evaluate and consider the implementation of site-specific management
practices to limit sulphate loadings to adjacent muskeg areas, because of the effect of sulphate
on the mercury methylation process. Drilling three sampling wells through the central portion of
the mine rock stockpile and collecting a series of subsurface water samples from these was a
major step forward in understanding the loading pathway of sulphate rich water, emanating from
the stockpile.
Subject to further evaluation, it is anticipated that groundwater, runoff and seepage from the mine
rock and low grade ore stockpiles will be managed in one or more of the following ways:
Develop internal drainage gradients and associated collection points within or adjacent to
the stockpiles using wells, or sumps, with collected water to be pumped directly to the
Attawapiskat River (along with well field water) in the case of the mine rock stockpile; or
to the fine processed kimberlite containment facility for re-use in processing, in the case
of the low grade ore stockpile.
Construct perimeter ditching to capture runoff and seepage from the mine rock stockpile
and the low grade ore stockpile, before it contacts the muskeg environment. The collected
water could be pumped to the fine processed kimberlite containment facility for re-use in
processing, or be discharged to the Attawapiskat River along with well field water.
Cap completed portions of mine rock and possibly coarse processed kimberlite stockpiles
with a layer of marine sediments to shed runoff from the stockpile, thus minimizing the
leaching of sulphate present in pore water within the stockpiles.
Long-term management of drainage from mine rock stockpiles after closure of the mine,
to be achieved by directing drainage into the open pit, which is expected to be a local
drainage point into the underlying bedrock, with no discharge to surface waters.

De Beers Canada Inc., Victor Mine Mercury Performance Monitoring, 2015 Annual Report per Certificate of Approval #3960-7Q4K2G, Conditions 7(5) and 7(6) July 2016
TC140504 Page 42
8.0 REFERENCES
AMEC Environment & Infrastructure. 2008. Trigger Values for Mercury Concentrations and/or
Body Burdens in Fish as Per Condition 6(10) of Certificate of Approval # 8700-783LPK.
AMEC Environment & Infrastructure. 2008. De Beers Canada Inc. Victor Mine Mercury
Performance Monitoring 2008 Annual Report, as Per Conditions 7(5) and 7(6) of
Certificate of Approval #3960-7Q4K2G.
AMEC Environment & Infrastructure. 2009. De Beers Canada Inc. Victor Mine Mercury
Performance Monitoring 2009 Annual Report, as Per Conditions 7(5) and 7(6) of
Certificate of Approval #3960-7Q4K2G.
AMEC Environment & Infrastructure. 2010. De Beers Canada Inc. Victor Mine Mercury
Performance Monitoring 2010 Annual Report, as Per Conditions 7(5) and 7(6) of
Certificate of Approval #3960-7Q4K2G.
AMEC Earth & Environmental. 2012a. De Beers Canada Inc. Victor Mine Landfill Leachate
Mercury and Cadmium Bioaccumulation Study – Fish Tissue and Sediment Quality
Components. February 2012.
AMEC Environment & Infrastructure. 2012b. De Beers Canada Inc. Victor Mine Mercury
Performance Monitoring 2012 Annual Report, as Per Conditions 7(5) and 7(6) of
Certificate of Approval #3960-7Q4K2G.
AMEC Environment & Infrastructure. 2013. De Beers Canada Inc. Victor Mine Landfill Leachate
Mercury and Cadmium Bioaccumulation Study – Fish Tissue and Sediment Quality
Components. February 2013.
AMEC Environment & Infrastructure. 2014a. Victor Mine Closure Plan Amendment 3.
AMEC Environment & Infrastructure. 2014. De Beers Canada Inc. Victor Mine Mercury
Performance Monitoring 2013 Annual Report, as Per Conditions 7(5) and 7(6) of
Certificate of Approval #3960-7Q4K2G. June 2014.
Amec Foster Wheeler. 2015. De Beers Canada Inc. Victor Mine Mercury Performance Monitoring
2014 Annual Report as per Conditions 7(5) and 7(6) of Certificate of Approval #3960-
7Q4K2G.
Amec Foster Wheeler. 2016. Annual Groundwater and Subsidence Report for 2015 period up to
December 31 as per Condition 4.2.4 of Permit to Take Water #1201-9HHJ5G, Victor
Diamond Mine.

De Beers Canada Inc., Victor Mine Mercury Performance Monitoring, 2015 Annual Report per Certificate of Approval #3960-7Q4K2G, Conditions 7(5) and 7(6) July 2016
TC140504 Page 43
Barak, N.A.E., and Mason, C.F. 1990a. Mercury, cadmium and lead in eels and roach: the effects
of size, season and locality on metal concentrations in flesh and liver. Sci. Total
Environ.106: 249–256.
Barak, N.A.E., and Mason, C.F. 1990b. Mercury, cadmium and lead concentrations in five species
of freshwater fish from eastern England. Sci. Total Environ. 106: 257–263.
Benoit, J.M., C.C. Gilmour, R.P. Mason and A. Heyes. 1999. Sulphide Controls on Mercury
Speciation and Bioavailability to Methylating Bacteria in Sediment Pore Waters.
Environmental Science & Technology. 33: 951-957.
Bishop, J.N. and B.P. Neary. 1975. The Distribution of Mercury within the Tissues of Freshwater
Fish. Inorganic Trace Contaminants Section, Ontario Ministry of the Environment. August,
1975.
Bloom, N.S. 1992. On the Chemical Form of Mercury in Edible Fish and Marine Invertebrate
Tissue. Can. J. Fish. Aquat. Sci. 49: 1010 – 1017.
Federal Authorities. 2005. Victor Diamond Project Comprehensive Study Report (CSR), June 2005 (draft prepared by AMEC Earth & Environmental Limited).
Goldstein, R.M., Brigham, M.E., and Stauffer, J.C. 1996. Comparison of mercury concentrations in liver, muscle, whole bodies, and composites of fish from the Red River of the North. Can. J. Fish. Aquat. Sci. 53: 244–252.
Harris, R.C., and Bodaly, R.A. 1998. Temperature, growth and dietary effects on fish mercury dynamics in two Ontario lakes. Biogeochemistry. 40: 175-187.
Huckabee, J.W., J.W. Elwood, and S.G. Hildebrand. 1979. Accumulation of mercury in freshwater
biota. In The biogeochemistry of mercury in the environment. Edited by J.O. Nriagu.
Elsevier/North-Holland Biomedical Press, New York. pp. 277–302.
Jackson, T.A. 1990. Biological and Environmental Control of Mercury Accumulation by Fish in
Lakes and Reservoirs of Northern Manitoba, Canada. Can. J. Fish. Aquat. Sci. 48: 2449
– 2470.
Jeremiason, J.D, D.R. Engstrom, E.B. Swain, E.A. Nater, B.M. Johnson, J.E. Alemendinger,
B.A. Monson and R.K. Kolka. 2006. Sulfate Addition Increases Methylmercury Production
in and Experimental Wetland. Environ. Sci. Technol. 40(12): 3800 – 3806.
Jewett, S.C., X. Zhang, A.S. Naidu, J.J. Kelley, D. Dasher and L.K. Duffy. 2003. Comparison of
Mercury and Methylmercury in Northern Pike and Arctic Grayling from Wester Alaska
Rivers. Chemosphere 50: 283 – 392.
De Beers Canada Inc., Victor Mine Mercury Performance Monitoring, 2015 Annual Report per Certificate of Approval #3960-7Q4K2G, Conditions 7(5) and 7(6) July 2016
TC140504 Page 44
Kannan, K. R.G. Smith, Jr., R.F. Lee, H.L. Windom, P.T. Heitmuller, J.M. Macauley,
J.K. Summers. 1998. Distribution of Total Mercury and Methylmercury in Water, Sediment,
and Fish from South Florida Estuaries. Arch. Environ. Contam. Toxicol. 34: 109 – 118.
Kompanizare, M. and J.S. Price. 2014. Analytical solution for enhanced recharge around a
bedrock exposure caused by deep-aquifer dewatering through a variable thickness
aquitard. Advanced in Water Resources. Volume 74, December 2014, Pages 102-115.
Lasorsa, B. and S. Allen-Gil. 1995 The Methylmercury to Total Mercury Ratio in Selected Marine,
Freshwater, and Terrestrial Organisms. Water, Air and Soil Pollution 80: 905 – 913.
McDonald, J.H. 2014. Handbook of Biological Statistics (3rd ed.). Sparky House Publishing,
Baltimore, Maryland. Pages 173-179.
Orlova, Y. and B.A. Branfireun. 2014. Surface Water and Groundwater Contributions to
Streamflow in the James Bay Lowland, Canada. Arctic, Antarctic and Alpine Research.
Ray, S., Jessop, B.M., Coffin, J., and Swetnam, D.A. 1984. Mercury and polychlorinated biphenyls
in striped bass (Morone saxatilis) from two Nova Scotia Rivers. Water Air Soil Pollut. 21:
15–23.
Segade, S.R., T. Dias and E. Ramalhosa. 2010. Mercury Methylation versus Demethylation: Main
Processes Involved. In: A.P. Clampet eds., Methylmercury: Formation, Sources and
Health Effects. ISBN: 978-1-61761-838-3. Nova Science Publishers, Inc.
Simoneau, M., Lucotte, M., Garceau, S., and Laliberta, D. 2004. Fish growth rates modulate
mercury concentrations in walleye (Sander vitreus) from eastern Canadian lakes. Environ
Research. 98: 73-82.
Ulanowski, T.A. and B.A. Branfireun. 2013. Small-scale variability in peatland pore-water
biogeochemistry, Hudson Bay Lowland, Canada. Science of the Total Environment.
454-455: 211-218.
Ullrich, S.M., T.W. Tanton and S.A. Abdrashitova. 2001. Mercury in the Aquatic Environment: A
Review of Factors Affecting Methylation. Critical Reviews in Environmental Science and
Technology 31(3): 241-293.
US EPA Method 7473 Mercury in Solids and Solutions by Thermal Decomposition Amalgamation,
and Atomic Absorption Spectrophotometry. Revision 0, February 2007.
US EPA. 1997. Mercury Study Report to Congress. Volume 6: An Ecological Assessment for
Anthropogenic Mercury Emissions in the United States

De Beers Canada Inc., Victor Mine Mercury Performance Monitoring, 2015 Annual Report per Certificate of Approval #3960-7Q4K2G, Conditions 7(5) and 7(6) July 2016
TC140504 Page 45
Webb, J.S., S. McGinness and H.M. Lappin-Scott. 1998. Metal removal by sulphate-reducing
bacteria from natural and constructed wetlands. Journal of Applied Microbiology.
84: 240-248.Whittington, P. and J. Price. 2012. Effect of mine dewatering on peatlands of
the James Bay Lowland: the role of bioherms. Hydrological Processes. 26: 1818-1826.
Whittington, P. and J. Price. 2012. Effect of mine dewatering on peatlands of the James Bay
Lowland: the role of bioherms. Hydrological Processes. 26: 1818-1826.
Whittington, P. and J. Price. 2013. Effect of mine dewatering on the peatlands of the James Bay
Lowland: the role of marine sediments on mitigating peatland drainage. Hydrological
Processes. Published online in Wiley Online Library.
Wiener, J.G., Jackson, G.A., May, T.W., and Cole, B.P. 1984. Longitudinal distribution of trace
elements (As, Cd, Cr, Hg, Pb, and Se) in fishes and sediments in the Upper Mississippi
River. In Proceedings of the 15th Annual Meeting of the Mississippi River Research
Consortium: Contaminants in the Upper Mississippi River, LaCrosse, Wis., April 14–15,
1982. Edited by J.G. Weiner, R.V. Anderson, and D.R. McConville. Butterworth
Publishers, Boston, Mass. pp. 139–170.

De Beers Canada Inc., Victor MineMercury Performance Monitoring, 2015 Annual Report
per Certificate of Approval #3960-7Q4K2G, Conditions 7(5) and 7(6)
2007 2008 2009 2010 2011 (Aug)2011 (Sep /
Nov)2012 2013 2014 2015
Bedrock (Bioherm) MS-1-BR ES1-BR ES1BDR 1.30 - 0.27 <0.10 <0.10 <0.10 <0.10 <0.10 <0.10 <0.10 <0.25 <0.40
Clay - Deep MS-1-CL(1) ES1-BR ES1CLD 1.47 - 0.18 <0.10 <0.10 <0.10 0.19 <0.10 0.10 0.12 <0.27 <0.45
Clay - Shallow MS-1-CL(2) ES1-BR ES1CLS 0.27 - 0.16 <0.10 <0.10 <0.10 0.16 <0.10 0.15 0.19 <0.15 <0.06
Bedrock (Bioherm) DAS-1 EDAS-1 EDAS-1 0.23 - 0.24 0.45 <0.10 - <0.10 <0.10 <0.10 <0.10 <0.18 <0.13
MS-2-BR ES2-BR ES2BR 0.68 - - 0.38 <0.10 - 0.21 0.17 - - <0.31 <0.23
Clay - Deep MS-2-CL(1) ES2-BR ES2CLD - - 0.36 <0.10 <0.10 <0.10 0.18 - 0.31 <0.10 <0.18 <0.11
Clay - Shallow MS-2-CL(2) ES2-BR ES2CLS 0.98 - 0.17 <0.10 3.01 <0.10 <0.10 <0.10 0.95 0.32 <0.65 <0.96
BR Shallow NS7-BR NS7BRS 1.02 - 0.53 0.34 0.35 0.52 0.54 0.67 0.43 0.45 0.54 0.21
BR Intermediate NS7-BR NS7BRI 1.93 - 0.23 <0.10 <0.10 - 0.23 0.53 0.29 0.75 <0.52 <0.61
BR Deep NS7-BR NS7BRD 2.34 - 0.12 0.39 <0.10 <0.10 1.62 0.30 0.19 0.35 <0.61 <0.80
Clay - Deep MS-7-CL(1) NS7-CL NS7-CLD 0.59 - 0.25 <0.10 <0.10 <0.10 <0.10 0.22 1.46 <0.10 <0.34 <0.45
Clay - Intermediate NS7-CL NS7-CLI 0.41 - 0.13 <0.10 <0.10 <0.10 0.25 0.19 0.57 0.12 <0.22 <0.17
Clay - Shallow MS-7-CL(2) NS7-CL NS7-CLS 0.70 - 0.10 <0.10 0.96 <0.10 <0.10 0.18 0.29 0.11 <0.29 <0.32
Bedrock (Bioherm) MS-8-BR(1) NS8BR1 NS8B1S 7.46 - 1.56 7.14 1.37 - 0.79 0.54 0.27 0.71 2.48 3.01
Bedrock (Bioherm) MS-8-BR(2) NS8BR1 NS8B1I 4.36 - - 0.33 - - - - - 1.45 2.05 2.08
NS8BR1 NS8B1D 1.83 - - - - - - - - - 1.83 -
Clay - Deep MS-8-CL(1) NS8CL1 NS8C1D 0.31 - 0.24 <0.10 - - - - - - <0.22 <0.11
Clay - Middle MS-8-CL(2) NS8CL1 NS8C1I - - 0.26 - 0.32 0.47 0.21 1.05 0.80 0.42 0.50 0.31
Clay - Shallow MS-8-CL(3) NS8CL1 NS8C1S 0.89 - 0.28 0.50 <0.10 <0.10 - 1.13 - 0.32 <0.47 <0.40
Clay - Deep MS-8-CL(4) NS8CL2 NS8C2D 0.14 - 0.16 <0.10 <0.10 - <0.10 1.37 0.16 <0.10 <0.28 <0.44
Clay - Middle MS-8-CL(5) NS8CL2 NS8C2I 0.49 - - - - - - - - <0.10 <0.30 <0.28
Clay - Shallow MS-8-CL(6) NS8CL2 NS8C2S 0.33 - 0.59 <0.10 <0.10 0.17 <0.10 0.17 0.13 0.38 <0.23 <0.17
Bedrock (Bioherm) * MS-9(1)-BR - - - - - - - - - - - -
Clay - Deep MS-9(1)-CL(1) SS9CL1 SS9C1D 0.66 - <0.10 0.52 <0.10 <0.10 <0.10 0.32 0.29 0.23 <0.27 <0.20
Clay - Shallow MS-9(1)-CL(2) SS9CL1 SS9C1S 1.03 - 0.10 0.43 <0.10 <0.10 0.24 0.26 4.94 <0.10 <0.81 <1.58
Bedrock (Bioherm) * MS-9(2)-BR - - - - - - - - - - - -
Clay - Deep MS-9(2)-CL(1) SS9CL2 SS9C2D 1.09 - 0.30 0.38 <0.10 <0.10 <0.10 0.25 0.69 <0.10 <0.35 <0.34
Clay - Shallow MS-9(2)-CL(2) SS9CL2 SS9C2S 0.44 - 0.13 <0.10 <0.10 <0.10 0.51 0.17 0.80 <0.10 <0.27 <0.25
Bedrock (Bioherm) MS-13-BR WS13BR WS13BS 2.57 - 0.72 0.87 - - 0.56 0.92 0.75 1.29 1.10 0.69
WS13BR WS13BD 1.19 - - - - - - - - - 1.19 -
Clay - Deep MS-13-CL(1) WS13CL WS13CD 0.42 - <0.10 <0.10 <0.10 <0.10 - - 0.41 <0.10 <0.19 <0.15
WS13CL WS13CI 1.48 - 0.18 - <0.10 <0.10 - - 0.38 - <0.45 <0.59
Clay - Shallow MS-13-CL(2) WS13CL WS13CS 0.50 - <0.10 0.36 <0.10 - - - 0.71 0.43 <0.37 <0.24
Bedrock (Bioherm) MS-15-BR WS15BR WS15BS 2.00 - 2.34 2.74 2.46 - 2.02 0.88 12.19 2.44 3.38 3.60
WS15BR WS15BD 0.58 - - - - - - - - - 0.58 -
Clay - Deep MS-15-CL(1) WS15CL WS15CD - - - 0.59 - - - - - 0.11 0.35 0.34
WS15CL WS15CI 1.70 - - - - - - - - - 1.70 -
Clay - Shallow MS-15-CL(2) WS15CL WS15CS 0.69 - <0.10 <0.10 0.33 <0.10 - - - 0.32 <0.27 <0.23
- : total mercury concentration not determined
Near-field sites: MS-2; MS-8
Mid-field sites: MS-1; MS-7; MS-9(1); MS-9(2)
Far-field sites: MS-13; MS-15
MDLs have been adjusted for all years for uniformity (0.1 ng/L for total mercury), as per Section 1.
*Bedrock samples for stations MS-9(1) and MS-9(2) are collected at the overburden / bedrock interface and are reported as deep clay samples.
MS-15
MS-9(1)
MS-9(2)
MS-8
Cluster Location
MS-1
MS-2
MS-7
Total Mercury (Filtered)
AverageStandard Deviation
Table 1a: Muskey Monitoring Program - Annual Mercury Results for Clay and Bedrock; Total Mercury Filtered (2007-2015)(concentrations in ng/L)
MS-13
SampleCode
GPSCode
Well NameSubstrate / Condition
TC140504 Page 46
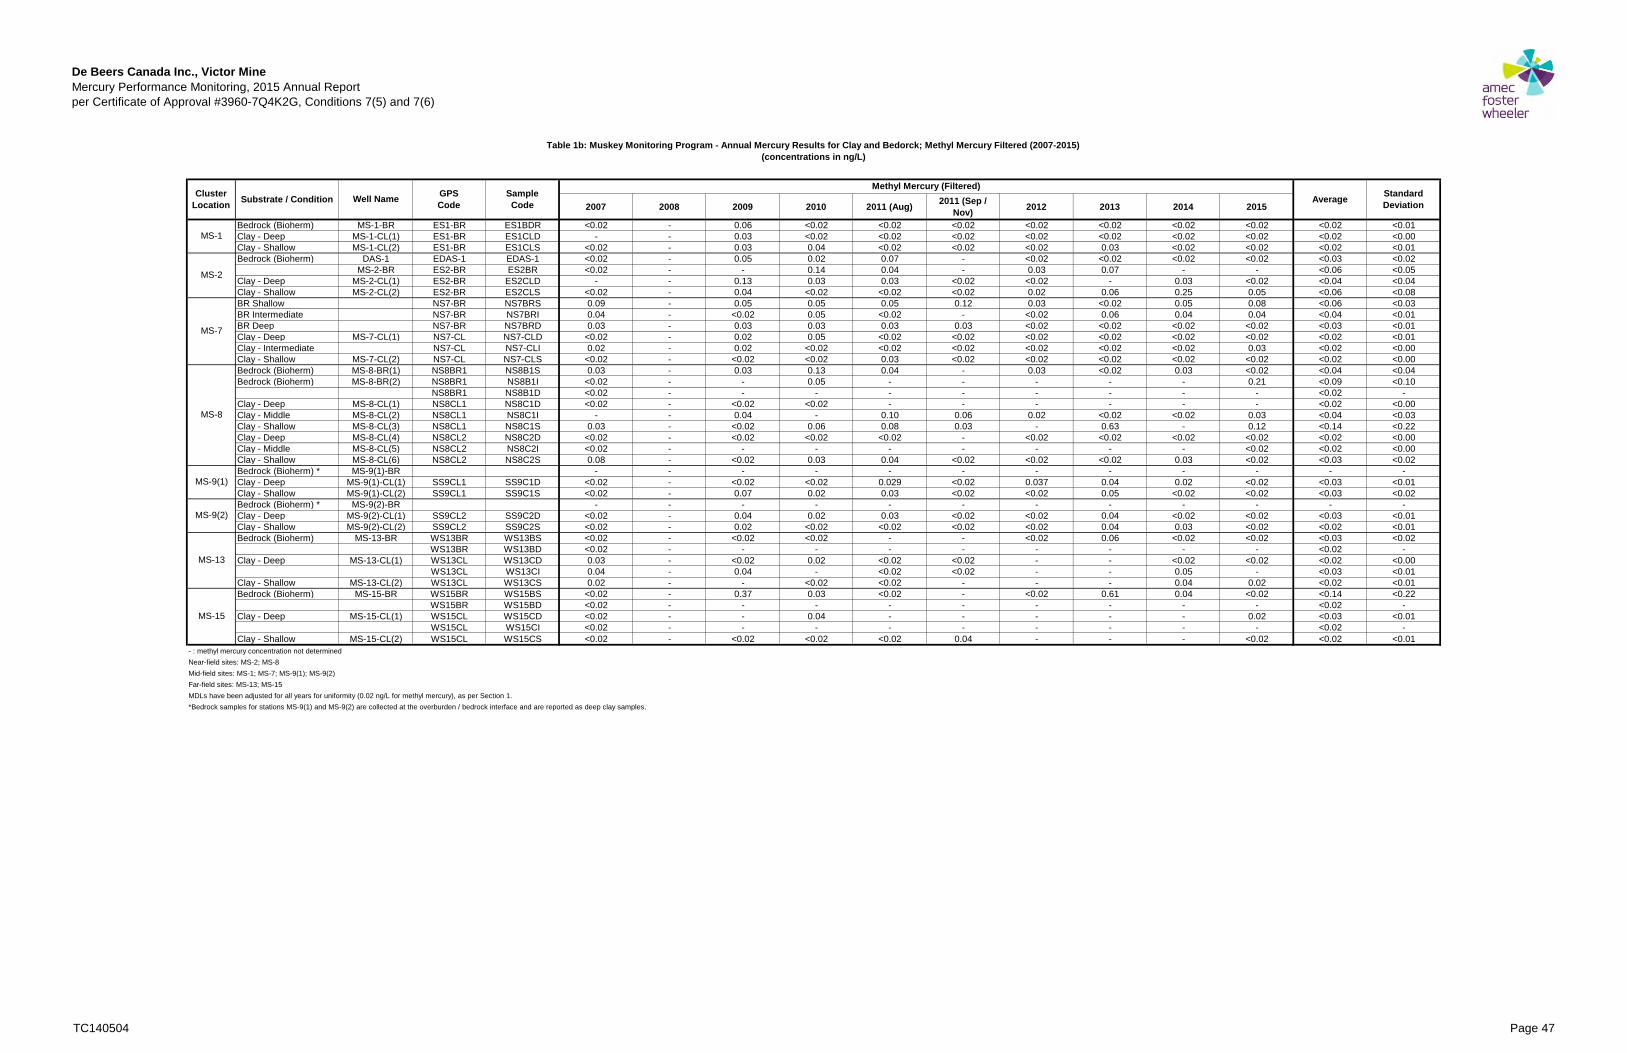
De Beers Canada Inc., Victor MineMercury Performance Monitoring, 2015 Annual Report
per Certificate of Approval #3960-7Q4K2G, Conditions 7(5) and 7(6)
2007 2008 2009 2010 2011 (Aug)2011 (Sep /
Nov)2012 2013 2014 2015
Bedrock (Bioherm) MS-1-BR ES1-BR ES1BDR <0.02 - 0.06 <0.02 <0.02 <0.02 <0.02 <0.02 <0.02 <0.02 <0.02 <0.01
Clay - Deep MS-1-CL(1) ES1-BR ES1CLD - - 0.03 <0.02 <0.02 <0.02 <0.02 <0.02 <0.02 <0.02 <0.02 <0.00
Clay - Shallow MS-1-CL(2) ES1-BR ES1CLS <0.02 - 0.03 0.04 <0.02 <0.02 <0.02 0.03 <0.02 <0.02 <0.02 <0.01
Bedrock (Bioherm) DAS-1 EDAS-1 EDAS-1 <0.02 - 0.05 0.02 0.07 - <0.02 <0.02 <0.02 <0.02 <0.03 <0.02
MS-2-BR ES2-BR ES2BR <0.02 - - 0.14 0.04 - 0.03 0.07 - - <0.06 <0.05
Clay - Deep MS-2-CL(1) ES2-BR ES2CLD - - 0.13 0.03 0.03 <0.02 <0.02 - 0.03 <0.02 <0.04 <0.04
Clay - Shallow MS-2-CL(2) ES2-BR ES2CLS <0.02 - 0.04 <0.02 <0.02 <0.02 0.02 0.06 0.25 0.05 <0.06 <0.08
BR Shallow NS7-BR NS7BRS 0.09 - 0.05 0.05 0.05 0.12 0.03 <0.02 0.05 0.08 <0.06 <0.03
BR Intermediate NS7-BR NS7BRI 0.04 - <0.02 0.05 <0.02 - <0.02 0.06 0.04 0.04 <0.04 <0.01
BR Deep NS7-BR NS7BRD 0.03 - 0.03 0.03 0.03 0.03 <0.02 <0.02 <0.02 <0.02 <0.03 <0.01
Clay - Deep MS-7-CL(1) NS7-CL NS7-CLD <0.02 - 0.02 0.05 <0.02 <0.02 <0.02 <0.02 <0.02 <0.02 <0.02 <0.01
Clay - Intermediate NS7-CL NS7-CLI 0.02 - 0.02 <0.02 <0.02 <0.02 <0.02 <0.02 <0.02 0.03 <0.02 <0.00
Clay - Shallow MS-7-CL(2) NS7-CL NS7-CLS <0.02 - <0.02 <0.02 0.03 <0.02 <0.02 <0.02 <0.02 <0.02 <0.02 <0.00
Bedrock (Bioherm) MS-8-BR(1) NS8BR1 NS8B1S 0.03 - 0.03 0.13 0.04 - 0.03 <0.02 0.03 <0.02 <0.04 <0.04
Bedrock (Bioherm) MS-8-BR(2) NS8BR1 NS8B1I <0.02 - - 0.05 - - - - - 0.21 <0.09 <0.10
NS8BR1 NS8B1D <0.02 - - - - - - - - - <0.02 -
Clay - Deep MS-8-CL(1) NS8CL1 NS8C1D <0.02 - <0.02 <0.02 - - - - - - <0.02 <0.00
Clay - Middle MS-8-CL(2) NS8CL1 NS8C1I - - 0.04 - 0.10 0.06 0.02 <0.02 <0.02 0.03 <0.04 <0.03
Clay - Shallow MS-8-CL(3) NS8CL1 NS8C1S 0.03 - <0.02 0.06 0.08 0.03 - 0.63 - 0.12 <0.14 <0.22
Clay - Deep MS-8-CL(4) NS8CL2 NS8C2D <0.02 - <0.02 <0.02 <0.02 - <0.02 <0.02 <0.02 <0.02 <0.02 <0.00
Clay - Middle MS-8-CL(5) NS8CL2 NS8C2I <0.02 - - - - - - - - <0.02 <0.02 <0.00
Clay - Shallow MS-8-CL(6) NS8CL2 NS8C2S 0.08 - <0.02 0.03 0.04 <0.02 <0.02 <0.02 0.03 <0.02 <0.03 <0.02
Bedrock (Bioherm) * MS-9(1)-BR - - - - - - - - - - - -
Clay - Deep MS-9(1)-CL(1) SS9CL1 SS9C1D <0.02 - <0.02 <0.02 0.029 <0.02 0.037 0.04 0.02 <0.02 <0.03 <0.01
Clay - Shallow MS-9(1)-CL(2) SS9CL1 SS9C1S <0.02 - 0.07 0.02 0.03 <0.02 <0.02 0.05 <0.02 <0.02 <0.03 <0.02
Bedrock (Bioherm) * MS-9(2)-BR - - - - - - - - - - - -
Clay - Deep MS-9(2)-CL(1) SS9CL2 SS9C2D <0.02 - 0.04 0.02 0.03 <0.02 <0.02 0.04 <0.02 <0.02 <0.03 <0.01
Clay - Shallow MS-9(2)-CL(2) SS9CL2 SS9C2S <0.02 - 0.02 <0.02 <0.02 <0.02 <0.02 0.04 0.03 <0.02 <0.02 <0.01
Bedrock (Bioherm) MS-13-BR WS13BR WS13BS <0.02 - <0.02 <0.02 - - <0.02 0.06 <0.02 <0.02 <0.03 <0.02
WS13BR WS13BD <0.02 - - - - - - - - - <0.02 -
Clay - Deep MS-13-CL(1) WS13CL WS13CD 0.03 - <0.02 0.02 <0.02 <0.02 - - <0.02 <0.02 <0.02 <0.00
WS13CL WS13CI 0.04 - 0.04 - <0.02 <0.02 - - 0.05 - <0.03 <0.01
Clay - Shallow MS-13-CL(2) WS13CL WS13CS 0.02 - - <0.02 <0.02 - - - 0.04 0.02 <0.02 <0.01
Bedrock (Bioherm) MS-15-BR WS15BR WS15BS <0.02 - 0.37 0.03 <0.02 - <0.02 0.61 0.04 <0.02 <0.14 <0.22
WS15BR WS15BD <0.02 - - - - - - - - - <0.02 -
Clay - Deep MS-15-CL(1) WS15CL WS15CD <0.02 - - 0.04 - - - - - 0.02 <0.03 <0.01
WS15CL WS15CI <0.02 - - - - - - - - - <0.02 -
Clay - Shallow MS-15-CL(2) WS15CL WS15CS <0.02 - <0.02 <0.02 <0.02 0.04 - - - <0.02 <0.02 <0.01
- : methyl mercury concentration not determined
Near-field sites: MS-2; MS-8
Mid-field sites: MS-1; MS-7; MS-9(1); MS-9(2)
Far-field sites: MS-13; MS-15
MDLs have been adjusted for all years for uniformity (0.02 ng/L for methyl mercury), as per Section 1.
*Bedrock samples for stations MS-9(1) and MS-9(2) are collected at the overburden / bedrock interface and are reported as deep clay samples.
AverageStandard Deviation
Table 1b: Muskey Monitoring Program - Annual Mercury Results for Clay and Bedorck; Methyl Mercury Filtered (2007-2015)(concentrations in ng/L)
Methyl Mercury (Filtered)
MS-13
Cluster Location
Substrate / Condition Well NameGPSCode
SampleCode
MS-15
MS-1
MS-2
MS-7
MS-8
MS-9(1)
MS-9(2)
TC140504 Page 47
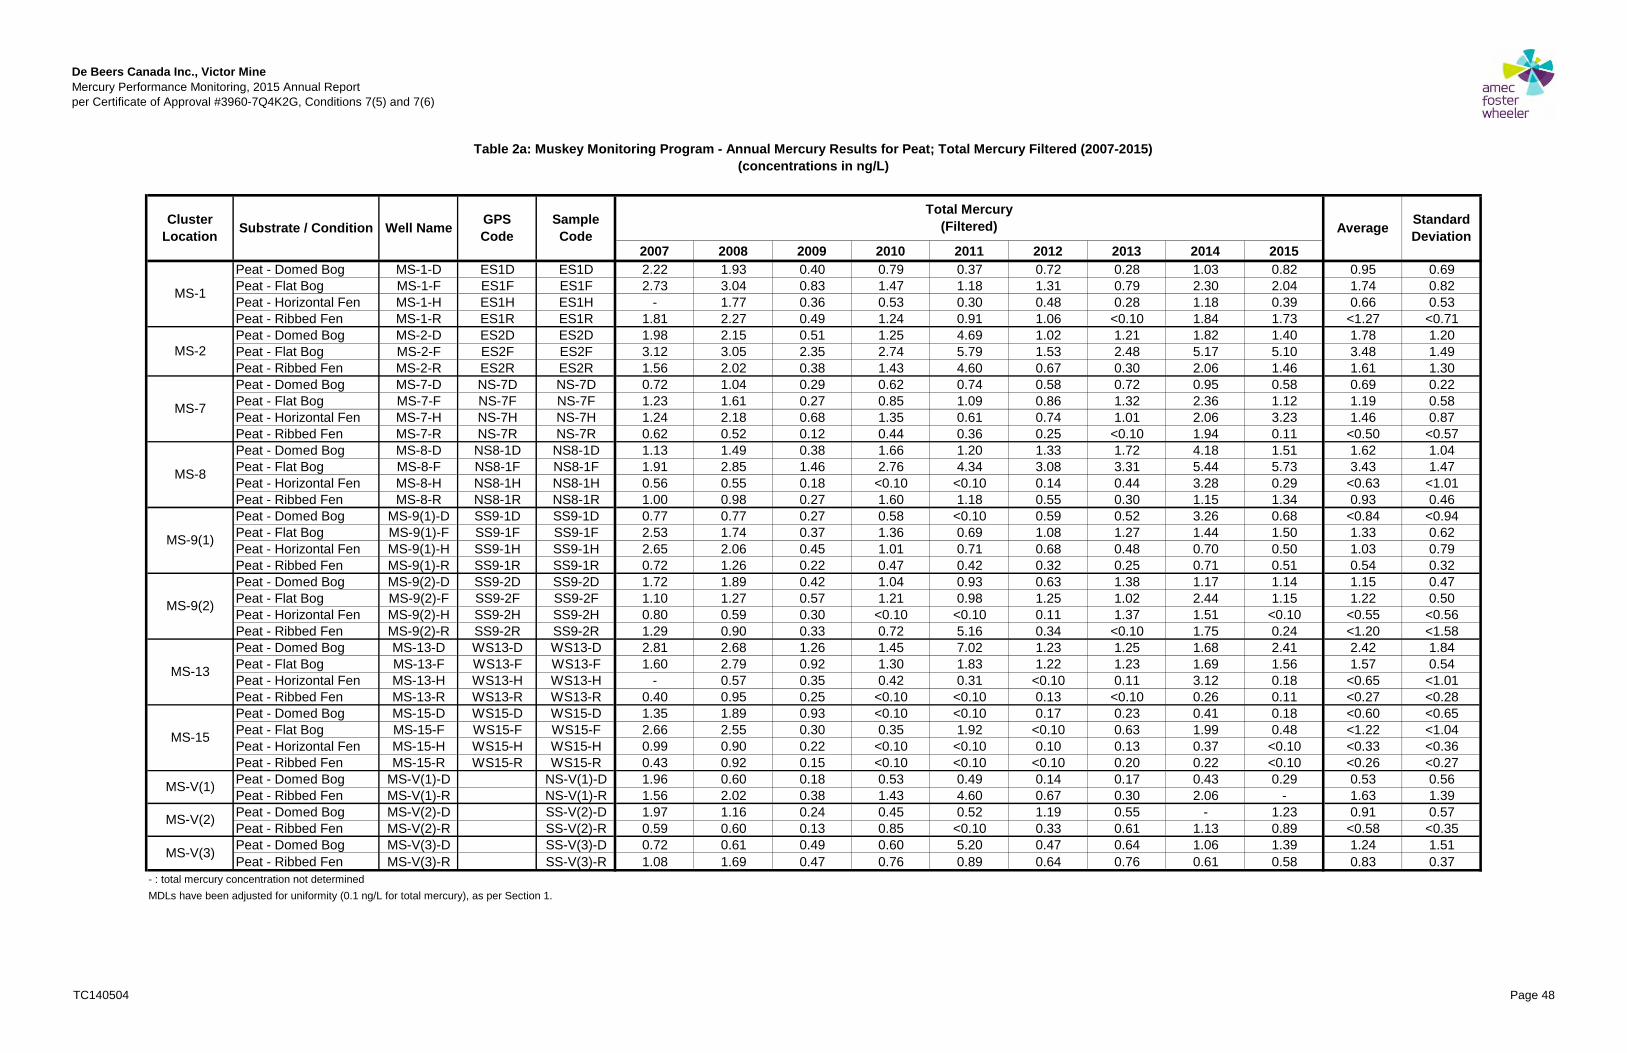
De Beers Canada Inc., Victor MineMercury Performance Monitoring, 2015 Annual Report
per Certificate of Approval #3960-7Q4K2G, Conditions 7(5) and 7(6)
2007 2008 2009 2010 2011 2012 2013 2014 2015Peat - Domed Bog MS-1-D ES1D ES1D 2.22 1.93 0.40 0.79 0.37 0.72 0.28 1.03 0.82 0.95 0.69
Peat - Flat Bog MS-1-F ES1F ES1F 2.73 3.04 0.83 1.47 1.18 1.31 0.79 2.30 2.04 1.74 0.82
Peat - Horizontal Fen MS-1-H ES1H ES1H - 1.77 0.36 0.53 0.30 0.48 0.28 1.18 0.39 0.66 0.53
Peat - Ribbed Fen MS-1-R ES1R ES1R 1.81 2.27 0.49 1.24 0.91 1.06 <0.10 1.84 1.73 <1.27 <0.71
Peat - Domed Bog MS-2-D ES2D ES2D 1.98 2.15 0.51 1.25 4.69 1.02 1.21 1.82 1.40 1.78 1.20
Peat - Flat Bog MS-2-F ES2F ES2F 3.12 3.05 2.35 2.74 5.79 1.53 2.48 5.17 5.10 3.48 1.49
Peat - Ribbed Fen MS-2-R ES2R ES2R 1.56 2.02 0.38 1.43 4.60 0.67 0.30 2.06 1.46 1.61 1.30
Peat - Domed Bog MS-7-D NS-7D NS-7D 0.72 1.04 0.29 0.62 0.74 0.58 0.72 0.95 0.58 0.69 0.22
Peat - Flat Bog MS-7-F NS-7F NS-7F 1.23 1.61 0.27 0.85 1.09 0.86 1.32 2.36 1.12 1.19 0.58
Peat - Horizontal Fen MS-7-H NS-7H NS-7H 1.24 2.18 0.68 1.35 0.61 0.74 1.01 2.06 3.23 1.46 0.87
Peat - Ribbed Fen MS-7-R NS-7R NS-7R 0.62 0.52 0.12 0.44 0.36 0.25 <0.10 1.94 0.11 <0.50 <0.57
Peat - Domed Bog MS-8-D NS8-1D NS8-1D 1.13 1.49 0.38 1.66 1.20 1.33 1.72 4.18 1.51 1.62 1.04
Peat - Flat Bog MS-8-F NS8-1F NS8-1F 1.91 2.85 1.46 2.76 4.34 3.08 3.31 5.44 5.73 3.43 1.47
Peat - Horizontal Fen MS-8-H NS8-1H NS8-1H 0.56 0.55 0.18 <0.10 <0.10 0.14 0.44 3.28 0.29 <0.63 <1.01
Peat - Ribbed Fen MS-8-R NS8-1R NS8-1R 1.00 0.98 0.27 1.60 1.18 0.55 0.30 1.15 1.34 0.93 0.46
Peat - Domed Bog MS-9(1)-D SS9-1D SS9-1D 0.77 0.77 0.27 0.58 <0.10 0.59 0.52 3.26 0.68 <0.84 <0.94
Peat - Flat Bog MS-9(1)-F SS9-1F SS9-1F 2.53 1.74 0.37 1.36 0.69 1.08 1.27 1.44 1.50 1.33 0.62
Peat - Horizontal Fen MS-9(1)-H SS9-1H SS9-1H 2.65 2.06 0.45 1.01 0.71 0.68 0.48 0.70 0.50 1.03 0.79
Peat - Ribbed Fen MS-9(1)-R SS9-1R SS9-1R 0.72 1.26 0.22 0.47 0.42 0.32 0.25 0.71 0.51 0.54 0.32
Peat - Domed Bog MS-9(2)-D SS9-2D SS9-2D 1.72 1.89 0.42 1.04 0.93 0.63 1.38 1.17 1.14 1.15 0.47
Peat - Flat Bog MS-9(2)-F SS9-2F SS9-2F 1.10 1.27 0.57 1.21 0.98 1.25 1.02 2.44 1.15 1.22 0.50
Peat - Horizontal Fen MS-9(2)-H SS9-2H SS9-2H 0.80 0.59 0.30 <0.10 <0.10 0.11 1.37 1.51 <0.10 <0.55 <0.56
Peat - Ribbed Fen MS-9(2)-R SS9-2R SS9-2R 1.29 0.90 0.33 0.72 5.16 0.34 <0.10 1.75 0.24 <1.20 <1.58
Peat - Domed Bog MS-13-D WS13-D WS13-D 2.81 2.68 1.26 1.45 7.02 1.23 1.25 1.68 2.41 2.42 1.84
Peat - Flat Bog MS-13-F WS13-F WS13-F 1.60 2.79 0.92 1.30 1.83 1.22 1.23 1.69 1.56 1.57 0.54
Peat - Horizontal Fen MS-13-H WS13-H WS13-H - 0.57 0.35 0.42 0.31 <0.10 0.11 3.12 0.18 <0.65 <1.01
Peat - Ribbed Fen MS-13-R WS13-R WS13-R 0.40 0.95 0.25 <0.10 <0.10 0.13 <0.10 0.26 0.11 <0.27 <0.28
Peat - Domed Bog MS-15-D WS15-D WS15-D 1.35 1.89 0.93 <0.10 <0.10 0.17 0.23 0.41 0.18 <0.60 <0.65
Peat - Flat Bog MS-15-F WS15-F WS15-F 2.66 2.55 0.30 0.35 1.92 <0.10 0.63 1.99 0.48 <1.22 <1.04
Peat - Horizontal Fen MS-15-H WS15-H WS15-H 0.99 0.90 0.22 <0.10 <0.10 0.10 0.13 0.37 <0.10 <0.33 <0.36
Peat - Ribbed Fen MS-15-R WS15-R WS15-R 0.43 0.92 0.15 <0.10 <0.10 <0.10 0.20 0.22 <0.10 <0.26 <0.27
Peat - Domed Bog MS-V(1)-D NS-V(1)-D 1.96 0.60 0.18 0.53 0.49 0.14 0.17 0.43 0.29 0.53 0.56
Peat - Ribbed Fen MS-V(1)-R NS-V(1)-R 1.56 2.02 0.38 1.43 4.60 0.67 0.30 2.06 - 1.63 1.39
Peat - Domed Bog MS-V(2)-D SS-V(2)-D 1.97 1.16 0.24 0.45 0.52 1.19 0.55 - 1.23 0.91 0.57
Peat - Ribbed Fen MS-V(2)-R SS-V(2)-R 0.59 0.60 0.13 0.85 <0.10 0.33 0.61 1.13 0.89 <0.58 <0.35
Peat - Domed Bog MS-V(3)-D SS-V(3)-D 0.72 0.61 0.49 0.60 5.20 0.47 0.64 1.06 1.39 1.24 1.51
Peat - Ribbed Fen MS-V(3)-R SS-V(3)-R 1.08 1.69 0.47 0.76 0.89 0.64 0.76 0.61 0.58 0.83 0.37
- : total mercury concentration not determined
MDLs have been adjusted for uniformity (0.1 ng/L for total mercury), as per Section 1.
MS-8
MS-V(3)
MS-13
MS-15
MS-9(1)
MS-9(2)
MS-V(1)
MS-V(2)
MS-7
Cluster Location
Substrate / Condition
MS-1
MS-2
AverageStandard Deviation
Table 2a: Muskey Monitoring Program - Annual Mercury Results for Peat; Total Mercury Filtered (2007-2015)(concentrations in ng/L)
SampleCode
Total Mercury(Filtered)Well Name
GPSCode
TC140504 Page 48

De Beers Canada Inc., Victor MineMercury Performance Monitoring, 2015 Annual Report
per Certificate of Approval #3960-7Q4K2G, Conditions 7(5) and 7(6)
2007 2008 2009 2010 2011 2012 2013 2014 2015Peat - Domed Bog MS-1-D ES1D ES1D 0.02 0.07 0.10 0.06 0.08 0.03 0.10 0.05 0.05 0.06 0.03
Peat - Flat Bog MS-1-F ES1F ES1F <0.02 0.18 0.19 0.14 <0.02 0.06 0.10 0.09 0.04 <0.09 <0.06
Peat - Horizontal Fen MS-1-H ES1H ES1H - - 0.10 0.04 <0.02 0.10 0.04 <0.02 <0.02 <0.05 <0.04
Peat - Ribbed Fen MS-1-R ES1R ES1R 0.02 0.07 0.06 0.06 0.05 <0.02 0.05 0.02 0.06 <0.04 <0.02
Peat - Domed Bog MS-2-D ES2D ES2D <0.02 0.02 0.04 0.05 <0.02 0.07 0.14 0.04 0.02 <0.05 <0.04
Peat - Flat Bog MS-2-F ES2F ES2F <0.02 0.10 0.07 0.11 0.10 0.09 0.20 0.08 0.05 <0.09 <0.05
Peat - Ribbed Fen MS-2-R ES2R ES2R <0.02 0.04 0.09 0.08 0.06 0.29 0.11 0.10 0.06 <0.09 <0.08
Peat - Domed Bog MS-7-D NS-7D NS-7D <0.02 <0.02 0.04 0.02 0.04 0.02 <0.02 <0.02 <0.02 <0.02 <0.01
Peat - Flat Bog MS-7-F NS-7F NS-7F <0.02 <0.02 0.05 <0.02 <0.02 <0.02 <0.02 <0.02 <0.02 <0.02 <0.01
Peat - Horizontal Fen MS-7-H NS-7H NS-7H 0.02 0.06 0.10 0.04 0.03 0.46 0.04 0.03 0.09 0.09 0.14
Peat - Ribbed Fen MS-7-R NS-7R NS-7R <0.02 <0.02 0.03 0.02 <0.02 <0.02 <0.02 <0.02 <0.02 <0.02 <0.00
Peat - Domed Bog MS-8-D NS8-1D NS8-1D <0.02 <0.02 0.06 0.29 0.11 0.07 0.23 0.11 0.06 <0.11 <0.09
Peat - Flat Bog MS-8-F NS8-1F NS8-1F <0.02 0.08 0.31 0.14 0.16 0.12 0.11 0.13 0.14 <0.13 <0.08
Peat - Horizontal Fen MS-8-H NS8-1H NS8-1H <0.02 <0.02 0.07 <0.02 <0.02 <0.02 <0.02 <0.02 0.06 <0.03 <0.02
Peat - Ribbed Fen MS-8-R NS8-1R NS8-1R <0.02 <0.02 0.09 <0.02 0.02 <0.02 0.07 0.06 0.10 0.05 0.03
Peat - Domed Bog MS-9(1)-D SS9-1D SS9-1D <0.02 <0.02 0.17 <0.02 <0.02 0.04 <0.02 <0.02 0.05 <0.04 <0.05
Peat - Flat Bog MS-9(1)-F SS9-1F SS9-1F <0.02 0.04 0.05 0.05 <0.02 0.05 <0.02 0.04 0.29 <0.06 <0.09
Peat - Horizontal Fen MS-9(1)-H SS9-1H SS9-1H 0.02 0.05 0.11 0.03 0.04 0.02 <0.02 <0.02 <0.02 <0.04 <0.03
Peat - Ribbed Fen MS-9(1)-R SS9-1R SS9-1R 0.02 0.03 0.04 <0.02 0.02 <0.02 <0.02 <0.02 0.09 <0.03 <0.02
Peat - Domed Bog MS-9(2)-D SS9-2D SS9-2D <0.02 0.02 0.02 <0.02 <0.02 <0.02 <0.02 <0.02 <0.02 <0.02 <0.00
Peat - Flat Bog MS-9(2)-F SS9-2F SS9-2F <0.02 0.06 0.12 0.03 0.05 0.04 <0.02 0.07 0.04 <0.05 <0.03
Peat - Horizontal Fen MS-9(2)-H SS9-2H SS9-2H <0.02 <0.02 0.08 <0.02 <0.02 <0.02 0.06 <0.02 <0.02 <0.03 <0.02
Peat - Ribbed Fen MS-9(2)-R SS9-2R SS9-2R <0.02 0.06 0.17 0.05 0.18 0.06 0.02 <0.02 <0.02 <0.07 <0.06
Peat - Domed Bog MS-13-D WS13-D WS13-D 0.03 0.12 0.24 0.11 0.08 0.06 0.06 0.11 0.11 0.10 0.06
Peat - Flat Bog MS-13-F WS13-F WS13-F 0.07 0.24 0.45 0.15 0.19 0.28 0.18 0.29 0.12 0.22 0.11
Peat - Horizontal Fen MS-13-H WS13-H WS13-H 0.02 <0.02 0.29 <0.02 0.02 <0.02 0.04 0.02 <0.02 <0.05 <0.09
Peat - Ribbed Fen MS-13-R WS13-R WS13-R 0.13 <0.02 0.05 <0.02 0.03 <0.02 0.03 <0.02 <0.02 <0.04 <0.04
Peat - Domed Bog MS-15-D WS15-D WS15-D <0.02 0.04 0.78 <0.02 0.05 <0.02 0.13 <0.02 <0.02 <0.12 <0.25
Peat - Flat Bog MS-15-F WS15-F WS15-F <0.02 0.07 0.17 <0.02 0.16 <0.02 0.04 0.07 0.03 <0.07 <0.06
Peat - Horizontal Fen MS-15-H WS15-H WS15-H - <0.02 0.10 <0.02 0.02 <0.02 <0.02 <0.02 <0.02 <0.03 <0.03
Peat - Ribbed Fen MS-15-R WS15-R WS15-R 0.02 0.02 <0.02 <0.02 <0.02 <0.02 0.03 0.02 <0.02 <0.02 <0.00
Peat - Domed Bog MS-V(1)-D NS-V(1)-D - <0.02 0.02 <0.02 0.03 <0.02 <0.02 <0.02 <0.02 <0.02 <0.00
Peat - Ribbed Fen MS-V(1)-R NS-V(1)-R <0.02 0.04 0.09 0.08 0.06 0.29 0.11 0.10 - <0.10 <0.08
Peat - Domed Bog MS-V(2)-D SS-V(2)-D - <0.02 <0.02 0.05 0.07 0.03 0.05 - 0.10 <0.05 <0.03
Peat - Ribbed Fen MS-V(2)-R SS-V(2)-R - <0.02 0.03 0.04 <0.02 <0.02 <0.02 <0.02 <0.02 <0.02 <0.01
Peat - Domed Bog MS-V(3)-D SS-V(3)-D - 0.10 0.03 <0.02 0.07 <0.02 <0.02 0.03 <0.02 <0.04 <0.03
Peat - Ribbed Fen MS-V(3)-R SS-V(3)-R - 0.02 0.04 <0.02 0.03 <0.02 0.05 <0.02 <0.02 <0.03 <0.01
- : methyl mercury concentration not determined
MDLs have been adjusted for uniformity (0.02 ng/L for methyl mercury), as per Section 1.
MS-V(1)
MS-V(2)
MS-V(3)
SampleCode
MS-9(1)
MS-9(2)
Cluster Location
Substrate / Condition Well NameGPSCode
MS-1
MS-2
MS-7
MS-8
AverageStandard Deviation
Table 2b: Muskeg Monitoring Program - Annual Mercury Results for Peat; Methyl Mercury Filtered (2007-2015)(concentrations in ng/L)
MS-13
MS-15
Methyl Mercury(Filtered)
TC140504 Page 49

De Beers Canada Inc., Victor MineMercury Performance Monitoring, 2015 Annual Report
per Certificate of Approval #3960-7Q4K2G, Conditions 7(5) and 7(6)
2007 2008 2009 2010 2011 2012 2013 2014 2015 2007 2008 2009 2010 2011 2012 2013 2014 2015MS-1 2.22 1.93 0.40 0.79 0.37 0.72 0.28 1.03 0.82 0.02 0.07 0.10 0.06 0.08 0.03 0.10 0.05 0.05
MS-2 1.98 2.15 0.51 1.25 4.69 1.02 1.21 1.82 1.40 <0.02 0.02 0.04 0.05 <0.02 0.07 0.14 0.04 0.02
MS-7 0.72 1.04 0.29 0.62 0.74 0.58 0.72 0.95 0.58 <0.02 <0.02 0.04 0.02 0.04 0.02 <0.02 <0.02 <0.02
MS-8 1.13 1.49 0.38 1.66 1.20 1.33 1.72 4.18 1.51 <0.02 <0.02 0.06 0.29 0.11 0.07 0.23 0.11 0.06
MS-9(1) 0.77 0.77 0.27 0.58 <0.10 0.59 0.52 3.26 0.68 <0.02 <0.02 0.17 <0.02 <0.02 0.04 <0.02 <0.02 0.05
MS-9(2) 1.72 1.89 0.42 1.04 0.93 0.63 1.38 1.17 1.14 <0.02 0.02 0.02 <0.02 <0.02 <0.02 <0.02 <0.02 <0.02
MS-13 2.81 2.68 1.26 1.45 7.02 1.23 1.25 1.68 2.41 0.03 0.12 0.24 0.11 0.08 0.06 0.06 0.11 0.11
MS-15 1.35 1.89 0.93 <0.10 0.34 0.17 0.23 0.41 0.18 <0.02 0.04 0.78 0.02 0.05 <0.02 0.13 0.02 <0.02
MS-V(1) 1.96 0.6 0.18 0.53 0.49 0.14 0.17 0.43 0.29 <0.02 0.02 0.02 0.03 <0.02 <0.02 0.02 <0.02
MS-V(2) 1.97 1.16 0.24 0.45 0.52 1.19 0.55 1.23 <0.02 <0.02 0.05 0.07 0.03 0.05 0.10
MS-V(3) 0.72 0.61 0.49 0.60 5.20 0.47 0.64 1.06 1.39 0.10 0.03 <0.02 0.07 <0.02 <0.02 0.03 <0.02
MDLs have been adjusted for uniformity (0.1 ng/L for total mercury and 0.02 ng/L for methyl mercury), as per Section 1.
Blank cells indicate concentration was not determined.
Cluster Location
Methyl MercuryTotal Mercury
Table 2c: Muskeg Pore Water - Domed Bog 2007-2015 (Filtered)(concentrations in ng/L)
0
1
2
3
4
5
6
7
8
MS-1 MS-2 MS-7 MS-8 MS-9(1) MS-9(2) MS-13 MS-15 MS-V(1) MS-V(2) MS-V(3)
Co
nce
ntr
atio
n (
ng
/L)
Station
DOMED BOG - TOTAL MERCURY CONCENTRATIONS
2007
2008
2009
2010
2011
2012
2013
2014
2015
0.0
0.2
0.4
0.6
0.8
MS-1 MS-2 MS-7 MS-8 MS-9(1) MS-9(2) MS-13 MS-15 MS-V(1) MS-V(2) MS-V(3)
Co
nce
ntr
atio
n (
ng
/L)
Station
DOMED BOG - METHYL MERCURY CONCENTRATIONS
2007
2008
2009
2010
2011
2012
2013
2014
2015
TC140504 Page 50
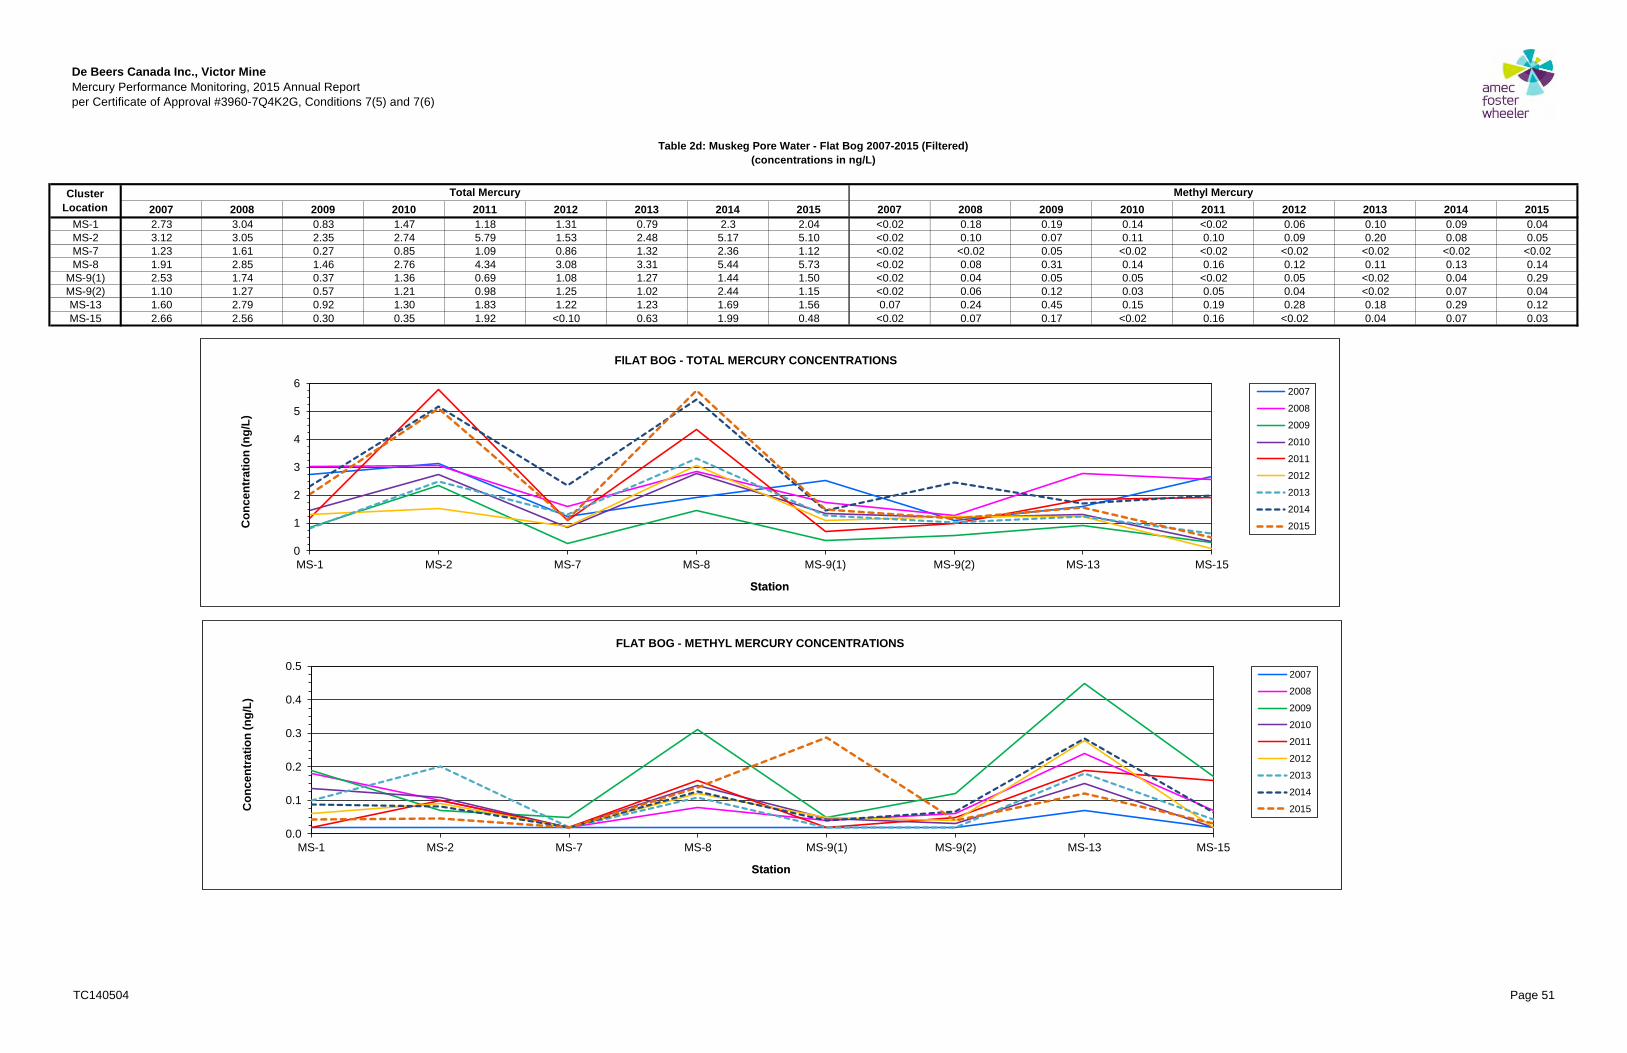
De Beers Canada Inc., Victor MineMercury Performance Monitoring, 2015 Annual Report
per Certificate of Approval #3960-7Q4K2G, Conditions 7(5) and 7(6)
2007 2008 2009 2010 2011 2012 2013 2014 2015 2007 2008 2009 2010 2011 2012 2013 2014 2015MS-1 2.73 3.04 0.83 1.47 1.18 1.31 0.79 2.3 2.04 <0.02 0.18 0.19 0.14 <0.02 0.06 0.10 0.09 0.04
MS-2 3.12 3.05 2.35 2.74 5.79 1.53 2.48 5.17 5.10 <0.02 0.10 0.07 0.11 0.10 0.09 0.20 0.08 0.05
MS-7 1.23 1.61 0.27 0.85 1.09 0.86 1.32 2.36 1.12 <0.02 <0.02 0.05 <0.02 <0.02 <0.02 <0.02 <0.02 <0.02
MS-8 1.91 2.85 1.46 2.76 4.34 3.08 3.31 5.44 5.73 <0.02 0.08 0.31 0.14 0.16 0.12 0.11 0.13 0.14
MS-9(1) 2.53 1.74 0.37 1.36 0.69 1.08 1.27 1.44 1.50 <0.02 0.04 0.05 0.05 <0.02 0.05 <0.02 0.04 0.29
MS-9(2) 1.10 1.27 0.57 1.21 0.98 1.25 1.02 2.44 1.15 <0.02 0.06 0.12 0.03 0.05 0.04 <0.02 0.07 0.04
MS-13 1.60 2.79 0.92 1.30 1.83 1.22 1.23 1.69 1.56 0.07 0.24 0.45 0.15 0.19 0.28 0.18 0.29 0.12
MS-15 2.66 2.56 0.30 0.35 1.92 <0.10 0.63 1.99 0.48 <0.02 0.07 0.17 <0.02 0.16 <0.02 0.04 0.07 0.03
Cluster Location
Total Mercury Methyl Mercury
Table 2d: Muskeg Pore Water - Flat Bog 2007-2015 (Filtered)(concentrations in ng/L)
0
1
2
3
4
5
6
MS-1 MS-2 MS-7 MS-8 MS-9(1) MS-9(2) MS-13 MS-15
Co
nce
ntr
atio
n (
ng
/L)
Station
FlLAT BOG - TOTAL MERCURY CONCENTRATIONS
2007
2008
2009
2010
2011
2012
2013
2014
2015
0.0
0.1
0.2
0.3
0.4
0.5
MS-1 MS-2 MS-7 MS-8 MS-9(1) MS-9(2) MS-13 MS-15
Co
nce
ntr
atio
n (
ng
/L)
Station
FLAT BOG - METHYL MERCURY CONCENTRATIONS
2007
2008
2009
2010
2011
2012
2013
2014
2015
TC140504 Page 51

De Beers Canada Inc., Victor MineMercury Performance Monitoring, 2015 Annual Report
per Certificate of Approval #3960-7Q4K2G, Conditions 7(5) and 7(6)
2007 2008 2009 2010 2011 2012 2013 2014 2015 2007 2008 2009 2010 2011 2012 2013 2014 2015MS-1 1.77 0.36 0.53 0.3 0.48 0.28 1.18 0.39 0.10 0.04 <0.02 0.10 0.04 0.02 <0.02
MS-7 1.24 2.18 0.68 1.35 0.61 0.74 1.01 2.06 3.23 0.02 0.06 0.10 0.04 0.03 0.46 0.04 0.03 0.09
MS-8 0.56 0.55 0.18 <0.10 <0.10 0.14 0.44 3.28 0.29 <0.02 <0.02 0.07 <0.02 <0.02 <0.02 <0.02 <0.02 0.06
MS-9(1) 2.65 2.06 0.45 1.01 0.71 0.68 0.48 0.7 0.50 0.02 0.05 0.11 0.03 0.04 0.02 <0.02 <0.02 <0.02
MS-9(2) 0.80 0.59 0.30 <0.10 <0.10 0.11 1.37 1.51 <0.10 <0.02 <0.02 0.08 0.02 <0.02 <0.02 0.06 0.02 <0.02
MS-13 0.57 0.35 0.42 0.31 <0.10 0.11 3.12 0.18 0.02 <0.02 0.29 <0.02 0.02 <0.02 0.04 0.02 <0.02
MS-15 0.99 0.90 0.22 <0.10 <0.10 0.10 0.13 0.37 <0.10 <0.02 0.10 <0.02 0.02 <0.02 <0.02 0.02 <0.02
MDLs have been adjusted for uniformity (0.1 ng/L for total mercury and 0.02 ng/L for methyl mercury), as per Section 1.
Blank cells indicate concentration was not determined.
Cluster Location
Methyl MercuryTotal Mercury
Table 2e: Muskeg Pore Water - Horizontal Fen 2007-2015 (Filtered)(concentrations in ng/L)
0
1
2
3
4
MS-1 MS-7 MS-8 MS-9(1) MS-9(2) MS-13 MS-15
Co
nce
ntr
atio
n (
ng
/L)
Station
HORIZONTAL FEN - TOTAL MERCURY CONCENTRATIONS
2007
2008
2009
2010
2011
2012
2013
2014
2015
0.0
0.1
0.2
0.3
0.4
0.5
MS-1 MS-7 MS-8 MS-9(1) MS-9(2) MS-13 MS-15
Co
nce
ntr
atio
n (
ng
/L)
Station
HORIZONTAL FEN - METHYL MERCURY CONCENTRATIONS
2007
2008
2009
2010
2011
2012
2013
2014
2015
TC140504 Page 52

De Beers Canada Inc., Victor MineMercury Performance Monitoring, 2015 Annual Report
per Certificate of Approval #3960-7Q4K2G, Conditions 7(5) and 7(6)
2007 2008 2009 2010 2011 2012 2013 2014 2015 2007 2008 2009 2010 2011 2012 2013 2014 2015MS-1 1.81 2.27 0.49 1.24 0.91 1.06 <0.10 1.84 1.73 0.02 0.07 0.06 0.06 0.05 <0.02 0.05 0.02 0.06
MS-2 1.56 2.02 0.38 1.43 4.6 0.67 0.3 2.06 1.46 <0.02 0.04 0.09 0.08 0.06 0.29 0.11 0.10 0.06
MS-7 0.62 0.52 0.12 0.44 0.36 0.25 <0.10 1.94 0.11 <0.02 <0.02 0.03 0.02 <0.02 <0.02 <0.02 <0.02 <0.02
MS-8 1.00 0.98 0.27 1.60 1.18 0.55 0.30 1.15 1.34 <0.02 <0.02 0.09 <0.02 0.02 <0.02 0.07 0.06 0.10
MS-9(1) 0.72 1.26 0.22 0.47 0.42 0.32 0.25 0.71 0.51 0.02 0.03 0.04 <0.02 0.02 <0.02 <0.02 <0.02 0.09
MS-9(2) 1.29 0.90 0.33 0.72 5.16 0.34 <0.10 1.75 0.24 <0.02 0.06 0.17 0.05 0.18 0.06 0.02 0.02 <0.02
MS-13 0.40 0.95 0.25 <0.10 <0.10 0.13 <0.10 0.26 0.11 0.13 <0.02 0.05 <0.02 0.03 <0.02 0.03 0.02 <0.02
MS-15 0.43 0.92 0.15 <0.10 <0.10 <0.10 0.20 0.22 <0.10 0.02 0.02 <0.02 0.02 <0.02 <0.02 0.03 0.02 <0.02
MS-V(2) 0.59 0.60 0.13 0.85 <0.10 0.33 0.61 1.13 0.89 <0.02 0.03 0.04 <0.02 <0.02 <0.02 <0.02 <0.02
MS-V(3) 1.08 1.69 0.47 0.76 0.89 0.64 0.76 0.61 0.58 0.02 0.04 <0.02 <0.02 <0.02 0.05 0.02 <0.02
MDLs have been adjusted for uniformity (0.1 ng/L for total mercury and 0.02 ng/L for methyl mercury), as per Section 1.
Blank cells indicate concentration was not determined.
Cluster Location
Table 2f: Muskeg Pore Water - Ribbed Fen 2007-2015 (Filtered)(concentrations in ng/L)
Total Mercury Methyl Mercury
0
1
2
3
4
5
6
MS-1 MS-2 MS-7 MS-8 MS-9(1) MS-9(2) MS-13 MS-15 MS-V(2) MS-V(3)
Co
nce
ntr
atio
n (
ng
/L)
Station
RIBBED FEN - TOTAL MERCURY CONCENTRATIONS
2007
2008
2009
2010
2011
2012
2013
2014
2015
0.0
0.1
0.2
0.3
MS-1 MS-2 MS-7 MS-8 MS-9(1) MS-9(2) MS-13 MS-15 MS-V(2) MS-V(3)
Co
nce
ntr
atio
n (
ng
/L)
Station
RIBBED FEN - METHYL MERCURY CONCENTRATIONS
2007
2008
2009
2010
2011
2012
2013
2014
2015
TC140504 Page 53
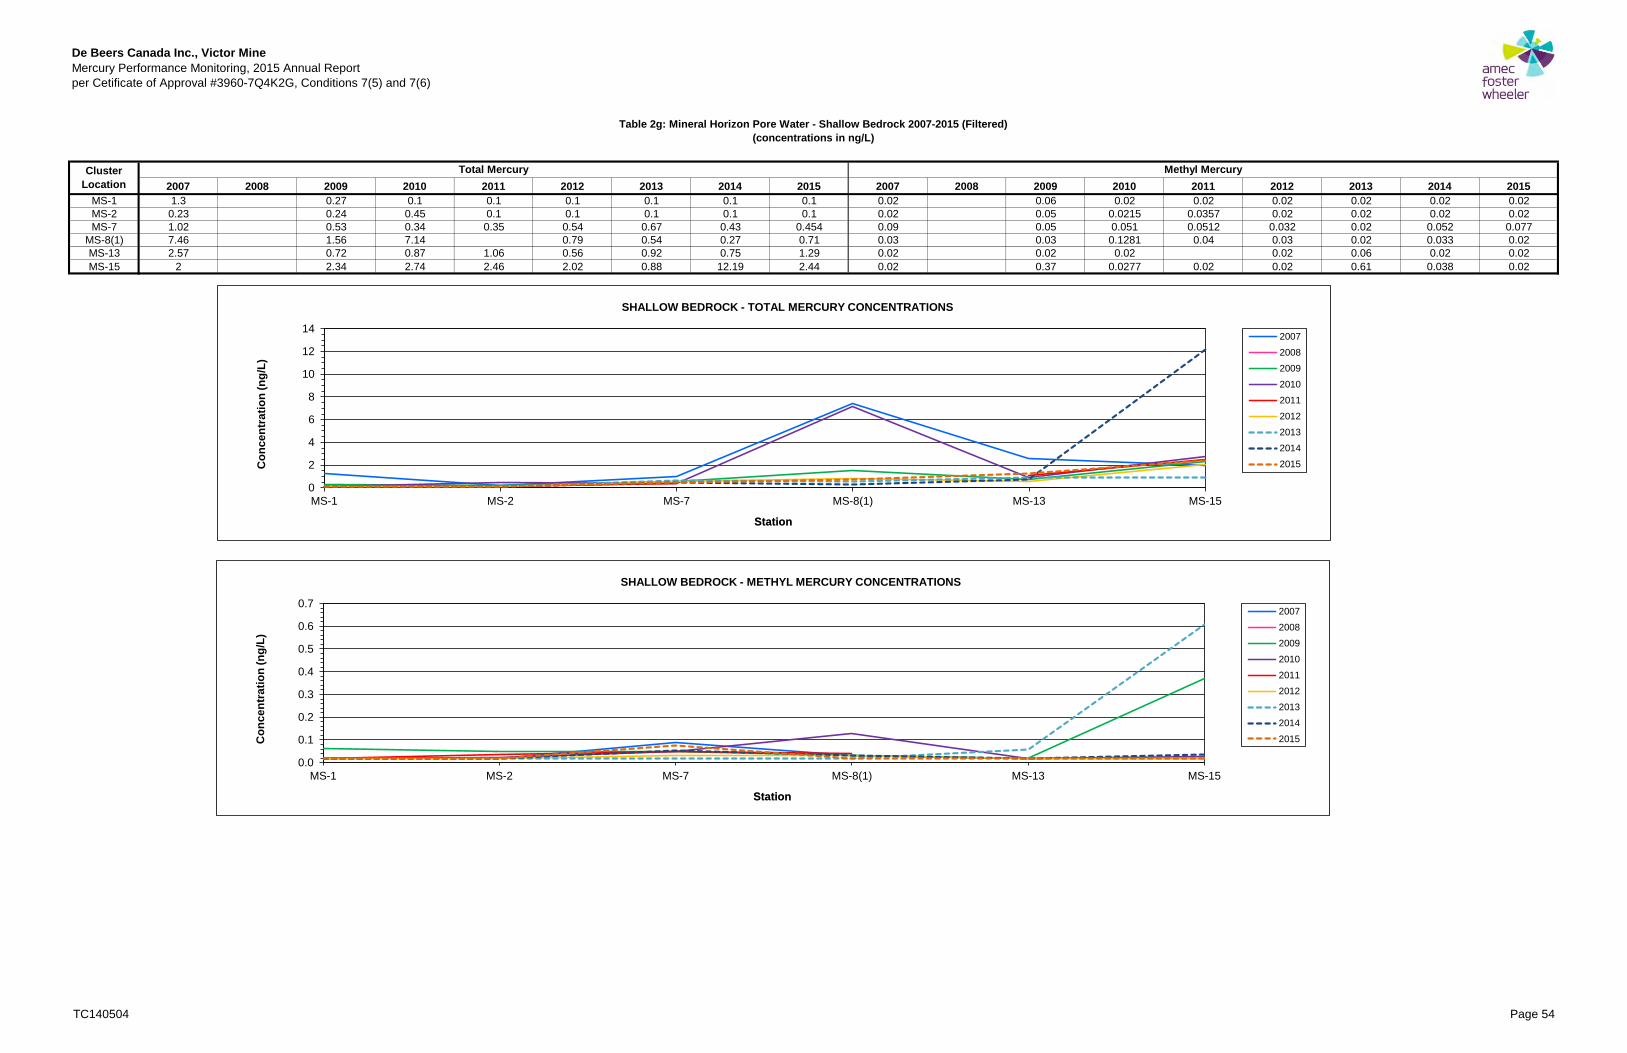
De Beers Canada Inc., Victor MineMercury Performance Monitoring, 2015 Annual Report
per Cetificate of Approval #3960-7Q4K2G, Conditions 7(5) and 7(6)
2007 2008 2009 2010 2011 2012 2013 2014 2015 2007 2008 2009 2010 2011 2012 2013 2014 2015MS-1 1.3 0.27 0.1 0.1 0.1 0.1 0.1 0.1 0.02 0.06 0.02 0.02 0.02 0.02 0.02 0.02
MS-2 0.23 0.24 0.45 0.1 0.1 0.1 0.1 0.1 0.02 0.05 0.0215 0.0357 0.02 0.02 0.02 0.02
MS-7 1.02 0.53 0.34 0.35 0.54 0.67 0.43 0.454 0.09 0.05 0.051 0.0512 0.032 0.02 0.052 0.077
MS-8(1) 7.46 1.56 7.14 0.79 0.54 0.27 0.71 0.03 0.03 0.1281 0.04 0.03 0.02 0.033 0.02
MS-13 2.57 0.72 0.87 1.06 0.56 0.92 0.75 1.29 0.02 0.02 0.02 0.02 0.06 0.02 0.02
MS-15 2 2.34 2.74 2.46 2.02 0.88 12.19 2.44 0.02 0.37 0.0277 0.02 0.02 0.61 0.038 0.02
Cluster Location
Total Mercury Methyl Mercury
Table 2g: Mineral Horizon Pore Water - Shallow Bedrock 2007-2015 (Filtered)(concentrations in ng/L)
0
2
4
6
8
10
12
14
MS-1 MS-2 MS-7 MS-8(1) MS-13 MS-15
Co
nce
ntr
atio
n (
ng
/L)
Station
SHALLOW BEDROCK - TOTAL MERCURY CONCENTRATIONS
2007
2008
2009
2010
2011
2012
2013
2014
2015
0.0
0.1
0.2
0.3
0.4
0.5
0.6
0.7
MS-1 MS-2 MS-7 MS-8(1) MS-13 MS-15
Co
nce
ntr
atio
n (
ng
/L)
Station
SHALLOW BEDROCK - METHYL MERCURY CONCENTRATIONS
2007
2008
2009
2010
2011
2012
2013
2014
2015
TC140504 Page 54

De Beers Canada Inc., Victor MineMercury Performance Monitoring, 2015 Annual Report
per Cetificate of Approval #3960-7Q4K2G, Conditions 7(5) and 7(6)
2007 2008 2009 2010 2011 2012 2013 2014 2015 2007 2008 2009 2010 2011 2012 2013 2014 2015MS-1 1.47 0.18 <0.10 <0.10 0.19 <0.10 0.10 0.12 0.03 <0.02 <0.02 <0.02 <0.02 <0.02 <0.02
MS-2 0.36 <0.10 <0.10 0.18 0.31 <0.10 0.13 0.03 0.03 <0.02 0.03 <0.02
MS-7 0.59 0.25 <0.10 <0.10 <0.10 0.22 1.46 <0.10 <0.02 0.02 0.05 <0.02 <0.02 <0.02 <0.02 <0.02
MS-8-CL(1) 0.31 0.24 <0.10 <0.02 <0.02 <0.02
MS-8-CL(4) 0.14 0.16 <0.10 <0.10 <0.10 1.37 0.16 <0.10 <0.02 0.02 <0.02 <0.02 <0.02 <0.02 <0.02 <0.02
MS-9(1) 0.66 <0.10 0.52 <0.10 <0.10 0.32 0.29 0.23 <0.02 <0.02 <0.02 0.03 0.04 0.04 0.02 <0.02
MS-9(2) 1.09 0.30 0.38 1.16 <0.10 0.25 0.69 <0.10 <0.02 0.04 0.02 0.05 <0.02 0.04 <0.02 <0.02
MS-13 0.42 <0.10 <0.10 <0.10 0.41 <0.10 0.03 0.02 0.02 <0.02 <0.02 <0.02
MS-15 0.59 0.11 <0.02 0.04 0.02
MDLs have been adjusted for uniformity (0.1 ng/L for total mercury and 0.02 ng/L for methyl mercury), as per Section 1.
Blank cells indicate concentration was not determined.
Cluster Location
Total Mercury Methyl Mercury
Table 2h: Mineral Horizon Pore Water - Deep Clay 2007-2015 (Filtered)(concentrations in ng/L)
0.0
0.5
1.0
1.5
MS-1 MS-2 MS-7 MS-8-CL(1) MS-8-CL(4) MS-9(1) MS-9(2) MS-13 MS-15
Co
nce
ntr
atio
n (
ng
/L)
Station
DEEP CLAY - TOTAL MERCURY CONCENTRATIONS
2007
2008
2009
2010
2011
2012
2013
2014
2015
0.00
0.05
0.10
0.15
MS-1 MS-2 MS-7 MS-8-CL(1) MS-8-CL(4) MS-9(1) MS-9(2) MS-13 MS-15
Co
nce
ntr
atio
n (
ng
/L)
Station
DEEP CLAY - METHYL MERCURY CONCENTRATIONS
2007
2008
2009
2010
2011
2012
2013
2014
2015
TC140504 Page 55

De Beers Canada Inc., Victor MineMercury Performance Monitoring, 2015 Annual Report
per Cetificate of Approval #3960-7Q4K2G, Conditions 7(5) and 7(6)
2007 2008 2009 2010 2011 2012 2013 2014 2015 2007 2008 2009 2010 2011 2012 2013 2014 2015MS-1 0.27 0.16 <0.10 <0.10 0.16 <0.10 0.15 0.19 <0.02 0.03 0.04 <0.02 <0.02 0.03 <0.02 <0.02
MS-2 0.98 0.17 <0.10 3.01 <0.10 <0.10 0.95 0.32 <0.02 0.04 <0.02 <0.02 0.02 0.06 0.25 0.05
MS-7 0.70 0.10 <0.10 0.96 <0.10 0.18 0.29 0.11 <0.02 <0.02 <0.02 0.03 <0.02 <0.02 <0.02 <0.02
MS-8-CL(3) 0.89 0.28 0.50 <0.10 1.13 0.32 0.03 0.02 0.06 0.08 0.63 0.12
MS-8-CL(6) 0.33 0.59 <0.10 <0.10 <0.10 0.17 0.13 0.38 0.08 <0.02 0.03 0.04 <0.02 <0.02 0.03 <0.02
MS-9(1) 1.03 0.10 0.43 <0.10 0.24 0.26 4.94 <0.10 <0.02 0.07 0.02 <0.02 <0.02 0.05 <0.02 <0.02
MS-9(2) 0.44 0.13 <0.10 <0.10 0.51 0.17 0.80 <0.10 <0.02 0.02 <0.02 <0.02 <0.02 0.04 0.03 <0.02
MS-13 0.50 <0.10 0.36 <0.10 0.71 0.43 0.02 <0.02 <0.02 0.04 0.02
MS-15 0.69 <0.10 <0.10 0.33 0.32 <0.02 <0.02 <0.02 <0.02 <0.02
MDLs have been adjusted for uniformity (0.1 ng/L for total mercury and 0.02 ng/L for methyl mercury), as per Section 1.
Blank cells indicate concentration was not determined.
Cluster Location
Total Mercury Methyl Mercury
Table 2i: Mineral Horizon Pore Water - Shallow Clay 2007-2015 (Filtered)(concentrations in ng/L)
0.0
1.0
2.0
3.0
4.0
5.0
MS-1 MS-2 MS-7 MS-8-CL(3) MS-8-CL(6) MS-9(1) MS-9(2) MS-13 MS-15
Co
nce
ntr
atio
n (
ng
/L)
Station
SHALLOW CLAY- TOTAL MERCURY CONCENTRATIONS
2007
2008
2009
2010
2011
2012
2013
2014
2015
0.0
0.1
0.2
0.3
0.4
0.5
0.6
0.7
MS-1 MS-2 MS-7 MS-8-CL(3) MS-8-CL(6) MS-9(1) MS-9(2) MS-13 MS-15
Co
nce
ntr
atio
n (
ng
/L)
Station
SHALLOW CLAY- METHYL MERCURY CONCENTRATIONS
2007
2008
2009
2010
2011
2012
2013
2014
2015
TC140504 Page 56

De Beers Canada Inc., Victor MineMercury Performance Monitoring, 2015 Annual Report
per Certificate of Approval #3960-7Q4K2G, Conditions 7(5) and 7(6)
Southwest Fen(SWF/F)
S-1
Northeast Fen(NEF/F)
S-2
Southeast Fen(SEF/F)
S-3
Northwest Control(HgCON)
S-4
May-06 0.77 0.62
Jun-06 2.44 1.72
Jul-06 2.49 1.26 2.51 2.64
Aug-06 1.86 0.83
Sep-06 1.29 1.25
Oct-06 1.59 0.53 1.09 1.70
Dec-06 4.65 1.08
Jan-07 3.01 0.86 1.51 2.77
Feb-07 2.84 0.99
Mar-07 F 3.14
Apr-07 F 2.34
May-07 2.07 1.31 1.43 1.25
Jun-07 1.96 1.21
Jul-07 2.40 0.87 1.57 2.87
Aug-07 3.85 1.30
Sep-07 2.28 1.32
Oct-07 3.74 1.12 3.57 4.51
Nov-07 2.86 0.68
Dec-07 3.42 1.41
Jan-08 6.55 3.33 13.30 4.36
Feb-08 5.70 3.52
Mar-08 9.79 4.64
Apr-08 16.30 5.67 F 2.80
May-08 1.78 1.33
Jun-08 2.37 1.11
Jul-08 3.19 1.54 2.42 3.47
Aug-08 2.98 2.51
Sep-08 2.76 2.22
Oct-08 1.84 1.02 1.44 1.60
Nov-08 1.80 0.76
Dec-08 2.19 0.92
Jan-09 F 3.43 1.83 2.66
Feb-09 8.61 5.14
Mar-09
Apr-09 4.89 7.35
May-09 1.44 2.92 2.60 2.91
Jun-09 ND 1.25
Jul-09 ND 1.46 2.12 2.97
Aug-09 ND 1.11
Sep-09 ND 1.42
Oct-09 ND 1.41 0.94 1.15
Nov-09 ND 0.38
Dec-09 ND 0.19
Jan-10 ND 3.21 3.16 2.93
Feb-10 ND
Mar-10 ND
Apr-10 ND 1.03 0.55
May-10 ND 0.70 1.20
Jun-10 ND 0.74
Jul-10 ND 1.34 1.21 1.21
Aug-10 ND 1.76
Sep-10 ND 1.15
Oct-10 ND 0.78 1.29 1.86
Nov-10 ND 0.56
Dec-10 ND 0.98
Jan-11 ND 1.26 1.61 1.87
Feb-11 ND F
Mar-11 ND F
Apr-11 ND 2.81 3.74 2.05
May-11 ND 1.23
Jun-11 ND 1.05
Jul-11 ND 3.18 1.41 1.99
Aug-11 ND 3.29
Sep-11** ND
Oct-11 ND 1.68 2.78 3.97
Nov-11 ND 1.23
Dec-11 ND 1.17
Jan-12 ND 5.31 7.75 5.49
Feb-12 ND
Mar-12 ND 1.88
Apr-12 ND 2.06 3.32 0.72
May-12 ND 0.68
Jun-12 ND 1.16
Jul-12 ND 3.59 1.36 1.90
Aug-12 ND 4.93
Sep-12 ND 3.79
Oct-12 ND 0.60 1.33 1.33
Nov-12 ND 2.70
Dec-12 ND 2.37
Jan-13 ND 3.30 4.59
Feb-13 ND
Mar-13 ND
Apr-13 ND 7.39
May-13 ND 0.64 2.55 3.36
Jun-13 ND 0.26
Jul-13 ND 1.52 1.11 1.67
Aug-13 ND 2.29
Sep-13 ND 3.06
Oct-13 ND 1.34 4.52 1.86
Nov-13 ND
Dec-13 ND 1.72
Jan-14 ND 1.40 8.49
Feb-14 ND
Mar-14 ND
Apr-14 ND 3.17
May-14 ND 2.92 6.13 3.17
Jun-14 ND 1.88
Jul-14 ND 3.27 2.62 3.25
Aug-14 ND 4.09
Sep-14 ND 2.28
Oct-14 ND 1.59 1.69 3.03
Nov-14 ND 1.44
Dec-14 ND 0.91
Jan-15 ND 2.77 5.49
Feb-15 ND
Mar-15 ND
Apr-15 ND 4.28
May-15 ND 0.44 1.22 2.84
Jun-15 ND 0.90
Jul-15 ND 1.75 2.89 4.11
Aug-15 ND 2.19
Sep-15 ND 1.92
Oct-15 ND 1.54 2.64 5.13
Nov-15 ND 3.53
Dec-15 ND 0.98
*Average 2009 5.03 2.31 1.87 2.42
*Average 2010 - 1.59 1.55 1.80
*Average 2011 - 2.23 2.39 2.47
*Average 2012 - 2.89 3.44 2.36
*Average 2013 - 1.70 2.73 2.87
*Average 2014 - 2.30 3.48 4.49
*Average 2015 - 1.63 2.25 4.39
Average All Years 3.62 1.99 2.68 2.93
F = Frozen (no sample)
ND: not determined (C. of A. #3374-6G7J2Y was revoked)
Southwest Fen - Receives effluent from central quarry (2006 only)
Northeast Fen - Receives effluent from plant site excavation, sewage treatment plant, landfill and pit sump
Southeast Fen - Control site
Northwest Control - Control site
*Annual average values are only for dates when control samples were collected
** Samples discarded due to lab miscommunicaton
MDLs have been adjusted for all years for uniformity (0.1 ng/L for total mercury), as per Section 1.
Blank cells indicate concentration was not determined.
Table 3: Total Mercury - Fens (Unfiltered)(concentrations in ng/L)
CEQG for Protection of Aquatic Life: 26 ng/L
Date
CEQG for Protection of Aquatic Life: 26 ng/L
0
2
4
6
8
10
12
14
16
18
Co
nce
ntr
atio
n (
ng
/L)
FENS - TOTAL MERCURY CONCENTRATIONS (Unfiltered)
Southwest Fen(SWF/F)S-1
Northeast Fen(NEF/F)S-2
Southeast Fen(SEF/F)S-3
Northwest Control(HgCON)S-4
TC140504 Page 57
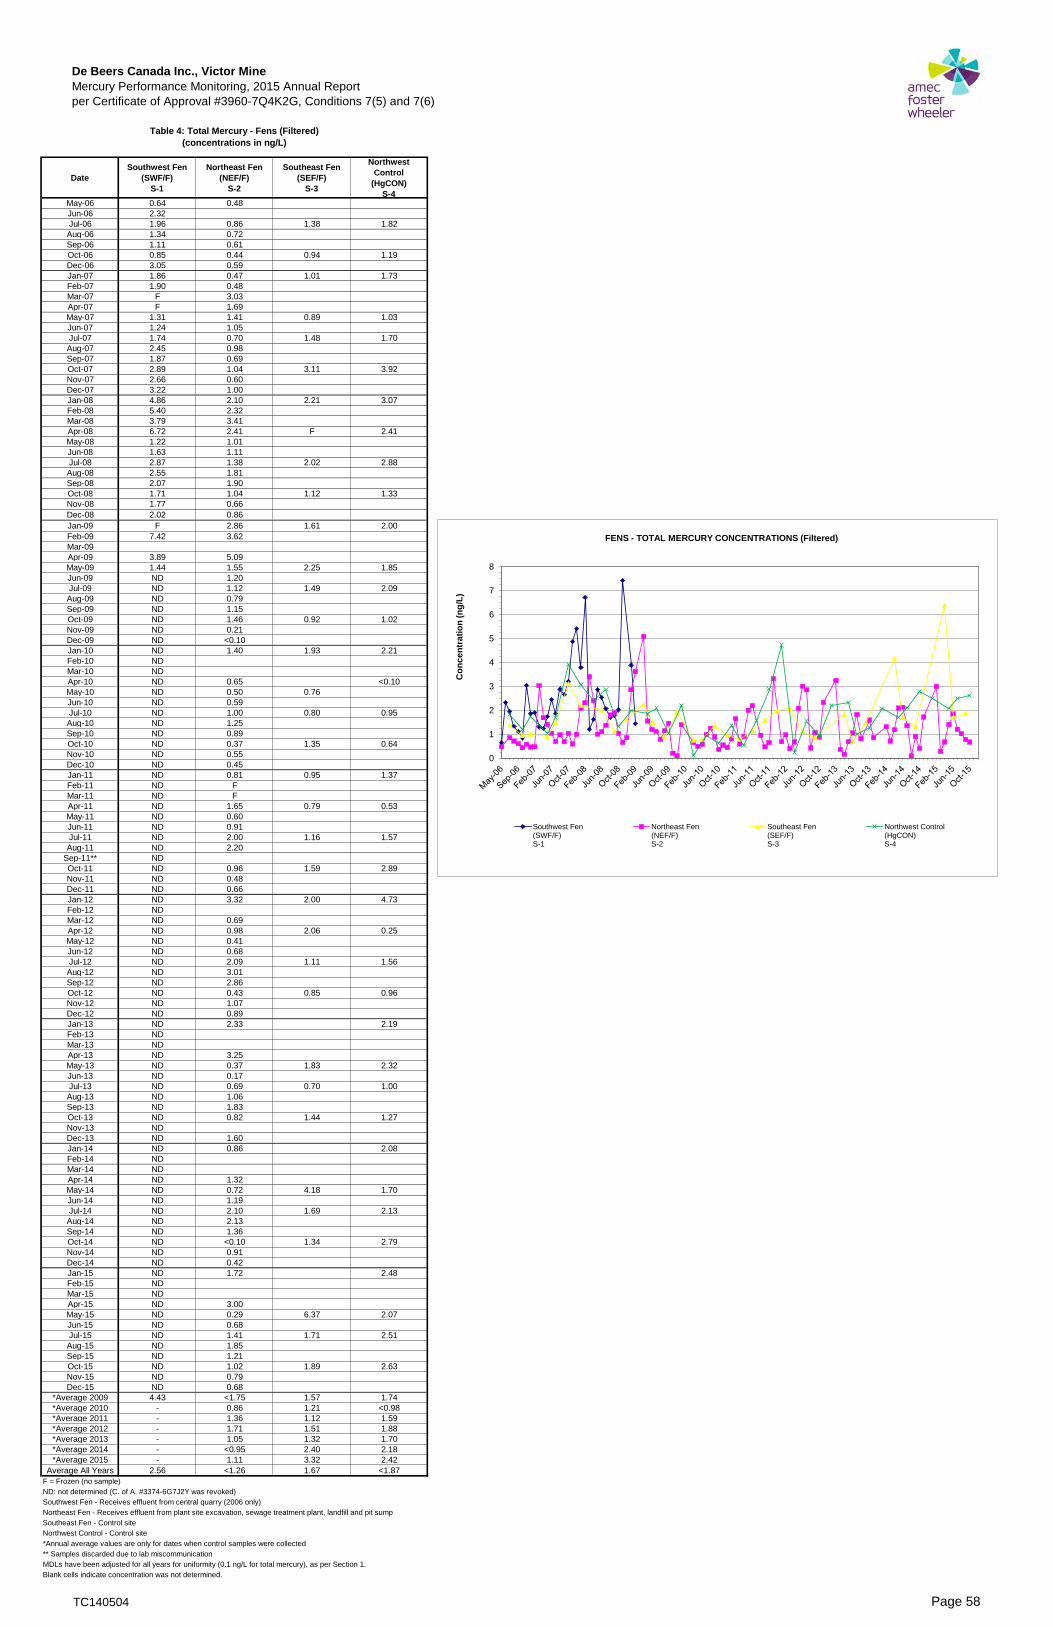
De Beers Canada Inc., Victor MineMercury Performance Monitoring, 2015 Annual Report
per Certificate of Approval #3960-7Q4K2G, Conditions 7(5) and 7(6)
DateSouthwest Fen
(SWF/F)S-1
Northeast Fen(NEF/F)
S-2
Southeast Fen(SEF/F)
S-3
Northwest Control
(HgCON) S-4
May-06 0.64 0.48
Jun-06 2.32
Jul-06 1.96 0.86 1.38 1.82
Aug-06 1.34 0.72
Sep-06 1.11 0.61
Oct-06 0.85 0.44 0.94 1.19
Dec-06 3.05 0.59
Jan-07 1.86 0.47 1.01 1.73
Feb-07 1.90 0.48
Mar-07 F 3.03
Apr-07 F 1.69
May-07 1.31 1.41 0.89 1.03
Jun-07 1.24 1.05
Jul-07 1.74 0.70 1.48 1.70
Aug-07 2.45 0.98
Sep-07 1.87 0.69
Oct-07 2.89 1.04 3.11 3.92
Nov-07 2.66 0.60
Dec-07 3.22 1.00
Jan-08 4.86 2.10 2.21 3.07
Feb-08 5.40 2.32
Mar-08 3.79 3.41
Apr-08 6.72 2.41 F 2.41
May-08 1.22 1.01
Jun-08 1.63 1.11
Jul-08 2.87 1.38 2.02 2.88
Aug-08 2.55 1.81
Sep-08 2.07 1.90
Oct-08 1.71 1.04 1.12 1.33
Nov-08 1.77 0.66
Dec-08 2.02 0.86
Jan-09 F 2.86 1.61 2.00
Feb-09 7.42 3.62
Mar-09
Apr-09 3.89 5.09
May-09 1.44 1.55 2.25 1.85
Jun-09 ND 1.20
Jul-09 ND 1.12 1.49 2.09
Aug-09 ND 0.79
Sep-09 ND 1.15
Oct-09 ND 1.46 0.92 1.02
Nov-09 ND 0.21
Dec-09 ND <0.10
Jan-10 ND 1.40 1.93 2.21
Feb-10 ND
Mar-10 ND
Apr-10 ND 0.65 <0.10
May-10 ND 0.50 0.76
Jun-10 ND 0.59
Jul-10 ND 1.00 0.80 0.95
Aug-10 ND 1.25
Sep-10 ND 0.89
Oct-10 ND 0.37 1.35 0.64
Nov-10 ND 0.55
Dec-10 ND 0.45
Jan-11 ND 0.81 0.95 1.37
Feb-11 ND F
Mar-11 ND F
Apr-11 ND 1.65 0.79 0.53
May-11 ND 0.60
Jun-11 ND 0.91
Jul-11 ND 2.00 1.16 1.57
Aug-11 ND 2.20
Sep-11** ND
Oct-11 ND 0.96 1.59 2.89
Nov-11 ND 0.48
Dec-11 ND 0.66
Jan-12 ND 3.32 2.00 4.73
Feb-12 ND
Mar-12 ND 0.69
Apr-12 ND 0.98 2.06 0.25
May-12 ND 0.41
Jun-12 ND 0.68
Jul-12 ND 2.09 1.11 1.56
Aug-12 ND 3.01
Sep-12 ND 2.86
Oct-12 ND 0.43 0.85 0.96
Nov-12 ND 1.07
Dec-12 ND 0.89
Jan-13 ND 2.33 2.19
Feb-13 ND
Mar-13 ND
Apr-13 ND 3.25
May-13 ND 0.37 1.83 2.32
Jun-13 ND 0.17
Jul-13 ND 0.69 0.70 1.00
Aug-13 ND 1.06
Sep-13 ND 1.83
Oct-13 ND 0.82 1.44 1.27
Nov-13 ND
Dec-13 ND 1.60
Jan-14 ND 0.86 2.08
Feb-14 ND
Mar-14 ND
Apr-14 ND 1.32
May-14 ND 0.72 4.18 1.70
Jun-14 ND 1.19
Jul-14 ND 2.10 1.69 2.13
Aug-14 ND 2.13
Sep-14 ND 1.36
Oct-14 ND <0.10 1.34 2.79
Nov-14 ND 0.91
Dec-14 ND 0.42
Jan-15 ND 1.72 2.48
Feb-15 ND
Mar-15 ND
Apr-15 ND 3.00
May-15 ND 0.29 6.37 2.07
Jun-15 ND 0.68
Jul-15 ND 1.41 1.71 2.51
Aug-15 ND 1.85
Sep-15 ND 1.21
Oct-15 ND 1.02 1.89 2.63
Nov-15 ND 0.79
Dec-15 ND 0.68
*Average 2009 4.43 <1.75 1.57 1.74
*Average 2010 - 0.86 1.21 <0.98
*Average 2011 - 1.36 1.12 1.59
*Average 2012 - 1.71 1.51 1.88
*Average 2013 - 1.05 1.32 1.70
*Average 2014 - <0.95 2.40 2.18
*Average 2015 - 1.11 3.32 2.42
Average All Years 2.56 <1.26 1.67 <1.87
F = Frozen (no sample)
ND: not determined (C. of A. #3374-6G7J2Y was revoked)
Southwest Fen - Receives effluent from central quarry (2006 only)
Northeast Fen - Receives effluent from plant site excavation, sewage treatment plant, landfill and pit sump
Southeast Fen - Control site
Northwest Control - Control site
*Annual average values are only for dates when control samples were collected
** Samples discarded due to lab miscommunication
MDLs have been adjusted for all years for uniformity (0.1 ng/L for total mercury), as per Section 1.
Blank cells indicate concentration was not determined.
Table 4: Total Mercury - Fens (Filtered)(concentrations in ng/L)
0
1
2
3
4
5
6
7
8
Co
nce
ntr
atio
n (
ng
/L)
FENS - TOTAL MERCURY CONCENTRATIONS (Filtered)
Southwest Fen(SWF/F)S-1
Northeast Fen(NEF/F)S-2
Southeast Fen(SEF/F)S-3
Northwest Control(HgCON)S-4
TC140504 Page 58

De Beers Canasda Inc., Victor MineMercury Performance Monitoring, 2015 Annual Report
per Certificate of Approval #3960-7Q4K2G, Conditions 7(5) and 7(6)
Southwest Fen(SWF/F)
S-1
Northeast Fen(NEF/F)
S-2
Southeast Fen(SEF/F)
S-3
Northwest Control(HgCON)
S-4
Jul-06 0.16 0.10 0.03 0.06
Oct-06 0.20 0.02 0.02 0.05
Jan-07 0.97 0.07 0.07 0.16
May-07 0.14 0.07 <0.02 0.04
Jul-07 0.68 0.10 0.02 0.05
Oct-07 0.81 0.15 0.08 0.09
Jan-08 5.58 1.72 1.07 0.34
Mar-08 F 2.07 F F
Apr-08 8.37 2.90 0.07 0.65
Jul-08 0.69 0.40 0.11 0.12
Oct-08 0.27 0.50 0.05 0.04
Jan-09 4.59 1.99 0.12 0.19
Apr/May-09 2.79 5.08 0.05 0.04
Jul-09 ND 0.34 <0.02 0.03
Oct-09 ND 0.12 0.03 0.04
Jan-10 ND 2.38 0.06 0.18
Apr-10 ND 0.21 0.04 0.06
Jul-10 ND 1.10 0.03 0.08
Oct-10 ND 0.24 0.03 0.07
Jan-11 ND 0.65 0.08 0.06
Apr-11 ND 0.13 0.18 0.18
Jul-11 ND 1.03 0.03 0.04
Oct-11 ND 0.23 0.07 0.07
Jan-12 ND 8.09 0.94 0.47
Apr-12 ND 0.49 0.10 0.05
Jul-12 ND 1.74 0.03 0.07
Oct-12 ND 0.15 0.02 0.03
Jan-13 ND 1.18 0.19
Apr/May-13 ND 6.05 0.08 0.04
Jul-13 ND 0.68 0.07 0.11
Oct-13 ND 0.48 <0.02 0.03
Jan-14 ND 0.49 0.50
Apr/May-14 ND 1.55 0.04 0.06
Jul-14 ND 1.56 0.05 0.19
Oct-14 ND 0.17 0.08 0.09
Jan-15 ND 1.16 0.98
May-15 ND 0.10 0.09 0.06
Jul-15 ND 1.02 0.07 0.14
Oct-15 ND 0.60 0.06 0.20
Average 2009 3.69 1.88 <0.05 0.07
Average 2010 - 0.98 0.04 0.10
Average 2011 - 0.51 0.09 0.09
Average 2012 - 2.62 0.27 0.16
Average 2013 - 2.10 <0.06 0.09
Average 2014 - 0.94 0.06 0.21
Average 2015 - 0.72 0.07 0.35
Average all Data 2.10 1.21 <0.11 0.15
F = Frozen (no sample)
ND: not determined (C. of A. #3374-6G7J2Y was revoked)
Southwest Fen - Received effluent from the Central Quarry (2006 only)
Northeast Fen - Receives effluent from plant site excavation, sewage treatment plant, landfill and pit sump
Southwest Fen - Control site
Northwest Control - Control site
Quarterly sampling in accordance with Amended C. of A. #3960-7Q4K2G
MDLs have been adjusted for all years for uniformity (0.02 ng/L for methyl mercury), as per Section 1.
Blank cells indicate concentration was not determined.
Table 5: Methyl Mercury - Fens (Unfiltered)(concentrations in ng/L)
CEQG for Protection of Aquatic Life: 4 ng/L
Date
CEQG for Protection of Aquatic Life: 4 ng/L
0
1
2
3
4
5
6
7
8
9
Co
nce
ntr
atio
n (
ng
/L)
FENS - METHYL MERCURY CONCENTRATIONS (Unfiltered)
Southwest Fen(SWF/F)S-1
Northeast Fen(NEF/F)S-2
Southeast Fen(SEF/F)S-3
Northwest Control(HgCON)S-4
TC140504 Page 59

De Beers Canasda Inc., Victor MineMercury Performance Monitoring, 2015 Annual Report
per Certificate of Approval #3960-7Q4K2G, Conditions 7(5) and 7(6)
Southwest Fen(SWF/F)
S-1
Northeast Fen(NEF/F)
S-2
Southeast Fen(SEF/F)
S-3
Northwest Control(HgCON)
S-4
Jul-06 0.13 0.08 0.02 <0.02
Oct-06 0.15 0.02 <0.02 0.02
Jan-07 0.68 0.04 0.06 0.10
May-07 0.08 0.06 0.02 0.04
Jul-07 0.30 0.10 0.02 0.04
Oct-07 0.63 0.12 0.04 0.09
Jan-08 3.48 1.29 0.39 0.17
Mar-08 F 1.34 F F
Apr-08 3.42 1.73 0.03 0.37
Jul-08 0.58 0.41 0.08 0.07
Oct-08 0.29 0.39 0.02 0.04
Jan-09 3.03 0.89 0.09 0.14
Apr/May-09 1.85 3.32 0.05 0.05
Jul-09 ND 0.16 0.07 0.08
Oct-09 ND 0.13 0.05 0.06
Jan-10 ND 0.76 0.11 0.07
Apr-10 ND 0.12 0.03 0.05
Jul-10 ND 0.59 0.02 0.04
Oct-10 ND 0.23 0.03 0.06
Jan-11 ND 0.40 0.03 0.03
Apr-11 ND <0.02 0.04 0.06
Jul-11 ND 0.88 0.02 0.04
Oct-11 ND 0.04 0.03 <0.02
Jan-12 ND 4.09 0.17 0.20
Apr-12 ND 0.27 0.07 <0.02
Jul-12 ND 1.18 0.02 0.04
Oct-12 ND 0.11 <0.02 0.03
Jan-13 ND 0.97 0.24
Apr/May-13 ND 2.85 <0.02 0.04
Jul-13 ND 0.45 0.06 0.09
Oct-13 ND 0.18 <0.02 <0.02
Jan-14 ND 0.31 0.07
Apr/May-14 ND 1.09 0.04 0.04
Jul-14 ND 0.68 0.03 0.19
Oct-14 ND 0.11 0.03 0.05
Jan-15 ND 0.46 0.68
May-15 ND 0.08 0.09 0.05
Jul-15 ND 0.76 <0.02 0.02
Oct-15 ND 0.23 0.05 0.17
Average 2009 2.44 1.12 0.07 0.08
Average 2010 - 0.43 0.05 0.06
Average 2011 - <0.33 0.03 <0.04
Average 2012 - 1.41 <0.07 <0.07
Average 2013 - 1.11 <0.03 <0.10
Average 2014 - 0.55 0.03 0.09
Average 2015 - 0.38 <0.05 0.23
Average All Data 1.22 <0.69 <0.05 <0.09
F = Frozen (no sample)
ND: not determined (C. of A. #3374-6G7J2Y was revoked)
Southwest Fen - Received effluent from the Central Quarry (2006 only)
Northeast Fen - Receives effluent from plant site excavation, sewage treatment plant, landfill and pit sump
Southwest Fen - Control site
Northwest Control - Control site
Quarterly sampling in accordance with Amended C. of A. #3960-7Q4K2G
MDLs have been adjusted for all years for uniformity (0.02 ng/L for methyl mercury), as per Section 1.
Blank cells indicate concentration was not determined.
Table 6: Methyl Mercury - Fens (Filtered)(concentrations in ng/L)
Draft USEPA Criteria: 0.05 ng/L
Date
Draft USEPA Criteria: 0.05 ng/L
0
1
2
3
4
5
Co
nce
ntr
atio
n (
ng
/L)
FENS - METHYL MERCURY CONCENTRATIONS (Filtered)
Southwest Fen(SWF/F)S-1
Northeast Fen(NEF/F)S-2
Southeast Fen(SEF/F)S-3
Northwest Control(HgCON)S-4
TC140504 Page 60

De Beers Canada Inc., Victor MineMercury Performance Monitoring, 2015 Annual Report
per Certificate of Approval #3960-7Q4K2G, Conditions 7(5) and 7(6)
Month / Year
Northeast Fen
(NEF/F)MS-2
Southeast Fen
(SEF/F)MS-3
Northwest Control Fen
(HgCON)MS-4
Sum r.
May-13 0.64 2.55 3.36 6.55 Total SS 47.456
Jul-13 1.52 1.11 1.67 4.30 Treat SS 10.980
Oct-13 1.34 4.52 1.86 7.72 Block SS 17.075
May-14 2.92 6.13 3.17 12.22 Error SS 19.400
Jul-14 3.27 2.62 3.25 9.14
Oct-14 1.59 1.69 3.03 6.31
May-15 0.44 1.22 2.84 4.50 Source V. d.f. SS MS Fcal Ftab 0.05
Jul-15 1.75 2.89 4.11 8.75 Total 26 47.456 -
Oct-15 1.54 2.64 5.13 9.31 Treatment 2 10.980 5.490 4.53 3.63Sum c. 15.01 25.37 28.42 68.80 Block 8 17.075 2.134 1.76 2.59
Error 16 19.400 1.213
Month / Year
Northeast Fen
(NEF/F)MS-2
Southeast Fen
(SEF/F)MS-3
Northwest Control Fen
(HgCON)MS-4
Sum r.
May-13 0.37 1.83 2.32 4.52 Total SS 43.026
Jul-13 0.69 0.7 1 2.39 Treat SS 11.557
Oct-13 0.82 1.44 1.27 3.53 Block SS 9.106
May-14 0.72 4.18 1.7 6.60 Error SS 22.363
Jul-14 2.1 1.69 2.13 5.92
Oct-14 0.1 1.34 2.79 4.23
May-15 0.29 6.37 2.07 8.73 Source V. d.f. SS MS Fcal Ftab 0.05
Jul-15 1.41 1.71 2.51 5.63 Total 26 43.026 -
Oct-15 1.02 1.89 2.63 5.54 Treatment 2 11.557 5.779 4.13 3.63Sum c. 7.52 21.15 18.42 47.09 Block 8 9.106 1.138 0.81 2.59
Error 16 22.363 1.398
r. - rows; c. - columns
CEQG for Protection of Aquatic Life: 26ng/L
ANOVA Table
Treatment Effect (i.e., difference between fen systems)
Significant
FILTERED DATA - TWO-WAY ANALYSIS OF VARIANCE TABLES
Table 7: Fen Systems - Statistical Analysis - Total Mercury(concentrations in ng/L)
UNFILTERED DATA - TWO-WAY ANALYSIS OF VARIANCE TABLES
ANOVA Table
Treatment Effect (i.e., difference between fen systems)
Significant
TC140504 Page 61

De Beers Canada Inc., Victor MineMercury Performance Monitoring, 2015 Annual Report
per Certificate of Approval #3960-7Q4K2G, Conditions 7(5) and 7(6)
MS-1-R(ES1-R)
MS-2-R(ES2-R)
MS-7-R(NS7-R)
MS-8-R(NS8-1R)
MS-9(1)-R(SS9-1R)
MS-9(2)-R(SS9-2R)
MS-13-R(WS13-R)
MS-15-R(WS15-R)
MS-V(1)-R(ES2-R)
MS-V(2)-R(SSV2-R)
MS-V(3)-R(SSV3-R)
Aug / Sep-07 NA NA NA NA NA NA NA NA NA NA NA
Nov-07 NA NA NA NA NA NA NA NA NA NA NA
May-08 NA NA NA NA NA NA NA NA NA NA NA
Aug-08 NA NA NA NA NA NA NA NA NA NA NA
Oct-08 NA NA NA NA NA NA NA NA NA NA NA
Jan-09 NA NA NA NA NA NA NA NA NA NA NA
May-09 3.29 2.65 3.50 3.38 5.26 1.85 3.85 1.95 2.65 2.05 2.98
Aug-09 1.50 1.47 1.29 1.74 4.13 0.90 2.84 0.96 1.47 2.10 1.88
Oct-09 1.29 1.64 1.40 1.56 1.42 1.51 2.47 0.73 1.64 2.18 1.94
Jan-10 1.46 1.34 0.97 4.94 1.64 0.92 0.79 0.71 1.34 1.29
May-10 1.88 1.48 0.61 1.48 1.22 0.71 2.19 0.58 1.48 0.68 2.17
Jul/Aug-10 2.46 2.42 4.24 1.92 1.48 2.24 2.61 0.98 2.42 1.81 1.98
Oct-10 1.32 1.52 0.93 2.04 2.47 1.32 3.11 0.62 1.52 1.31 1.77
Jan/Feb-11 12.98 5.22 2.61 1.13 1.98 3.03 13.34 12.98
Apr-11 2.41 1.32 1.78 2.30 1.12 1.89 8.96 1.32 1.32 3.25 1.24
Jul-11 2.88 14.02 1.69 2.41 1.89 1.50 3.36 0.66 14.02 2.64 1.74
Oct-11 3.09 2.80 6.02 4.07 2.22 2.43 4.40 1.25 2.80 2.66 5.75
Jan-12 5.10 12.32 4.52 2.76 2.48 5.64 1.26 5.74 9.23
May-12 2.29 4.01 1.41 1.48 1.55 1.64 2.49 0.77 4.01 1.06 1.21
Aug/Sep-12 2.16 2.56 1.81 1.68 2.00 2.37 3.75 0.85 2.56 1.67 3.88
Oct-12 2.35 2.33 3.93 2.15 1.57 1.04 3.54 0.78 2.33 1.19 3.73
Jan/Feb-13 2.91 4.25 7.24
May-13 2.96 2.91 2.55 1.95 1.96 2.27 3.19 1.44 2.91 3.50 3.45
Jul-13 1.38 1.29 0.67 1.21 0.63 0.64 2.05 0.52 1.29 0.86 1.33
Oct-13 2.37 1.87 0.77 2.15 1.62 2.67 3.88 0.66 1.87 0.95 1.51
Mar-14 8.80 11.00
May/Jun-14 3.23 3.13 6.51 2.50 1.85 2.12 3.05 1.25 3.13 4.20 4.02
Aug/Sep-14 9.14 2.30 1.29 1.71 7.46 1.77 3.71 1.17 2.30 1.38 1.25
Oct-14 3.72 3.72 2.67 4.02 6.22 2.77 5.04 1.61 3.72 2.73 3.28
Jun-15 3.41 2.77 4.75 3.74 2.27 2.58 3.50 1.40 2.77 4.69 3.57
Jul-15 2.98 2.58 4.88 5.56 1.59 2.10 4.38 1.38 2.58 2.42 3.86
Oct-15 2.40 1.14 3.36 3.04 2.10 4.91 4.93 0.81 1.14 2.96 2.48
2009 Average 2.03 1.92 2.06 2.23 3.60 1.42 3.05 1.21 1.92 2.11 2.27
2010 Average 1.78 1.69 1.69 2.60 1.70 1.30 2.18 0.72 1.69 1.27 1.97
2011 Average 2.79 7.78 3.68 2.85 1.59 1.95 4.94 4.14 7.78 2.85 2.91
2012 Average 2.98 2.97 4.87 2.46 1.97 1.88 3.86 0.92 2.97 2.42 4.51
2013 Average 2.24 2.02 1.33 1.77 1.78 2.46 3.04 2.47 2.02 1.77 2.10
2014 Average 5.36 3.05 3.49 2.74 6.08 2.22 3.93 3.76 3.05 2.77 2.85
2015 Average 2.93 2.16 4.33 4.11 1.99 3.20 4.27 1.20 2.16 3.36 3.30
Average All Years 2.83 3.23 3.11 2.67 2.66 2.03 3.61 2.12 3.23 2.32 2.92
MS-2-R and MS-V(1)-R are the same stations
Blank cells indicate concentration was not determined.
Stations located at or inside the Upper Bedrock 2 m drawdown contour
Stations located outside the Upper Bedrock 2 m drawdown contour
Data prior to May 2009 refers to groundwater concentrations.
Table 8a: Total Mercury - Ribbed Fen Surface Waters (Unfiltered)(concentrations in ng/L)
Amended C. of A. #3960-7Q4K2G provides for annual sampling of peat pore water and quarterly sampling of ribbed fen surface water (the previous C.
of A. #4111-7DXKQW provided for the same sampling frequency).
MDLs have been adjusted for all years for uniformity (0.1 ng/L for total mercury), as per Section 1.
Date
CEQG for Protection of Aquatic Life: 26 ng/L
CEQG for Protection of Aquatic Life: 26 ng/L
TC140504 Page 62
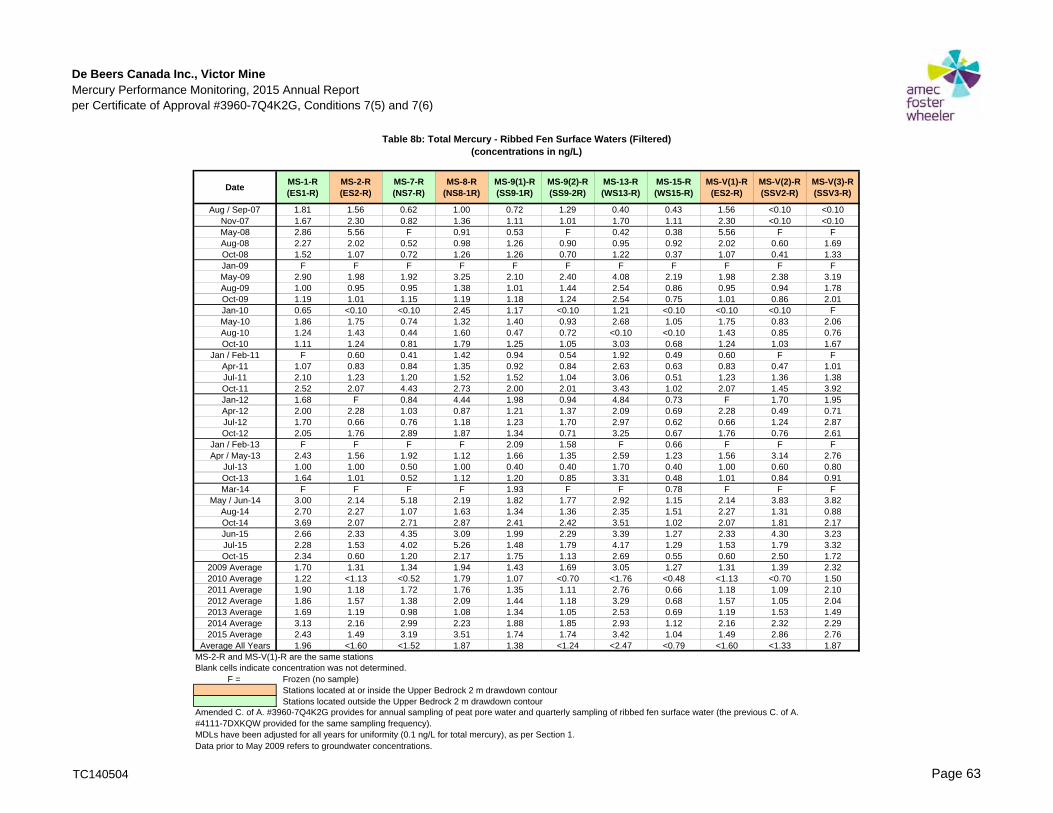
De Beers Canada Inc., Victor MineMercury Performance Monitoring, 2015 Annual Report
per Certificate of Approval #3960-7Q4K2G, Conditions 7(5) and 7(6)
DateMS-1-R(ES1-R)
MS-2-R(ES2-R)
MS-7-R(NS7-R)
MS-8-R(NS8-1R)
MS-9(1)-R(SS9-1R)
MS-9(2)-R(SS9-2R)
MS-13-R(WS13-R)
MS-15-R(WS15-R)
MS-V(1)-R(ES2-R)
MS-V(2)-R(SSV2-R)
MS-V(3)-R(SSV3-R)
Aug / Sep-07 1.81 1.56 0.62 1.00 0.72 1.29 0.40 0.43 1.56 <0.10 <0.10
Nov-07 1.67 2.30 0.82 1.36 1.11 1.01 1.70 1.11 2.30 <0.10 <0.10
May-08 2.86 5.56 F 0.91 0.53 F 0.42 0.38 5.56 F F
Aug-08 2.27 2.02 0.52 0.98 1.26 0.90 0.95 0.92 2.02 0.60 1.69
Oct-08 1.52 1.07 0.72 1.26 1.26 0.70 1.22 0.37 1.07 0.41 1.33
Jan-09 F F F F F F F F F F F
May-09 2.90 1.98 1.92 3.25 2.10 2.40 4.08 2.19 1.98 2.38 3.19
Aug-09 1.00 0.95 0.95 1.38 1.01 1.44 2.54 0.86 0.95 0.94 1.78
Oct-09 1.19 1.01 1.15 1.19 1.18 1.24 2.54 0.75 1.01 0.86 2.01
Jan-10 0.65 <0.10 <0.10 2.45 1.17 <0.10 1.21 <0.10 <0.10 <0.10 F
May-10 1.86 1.75 0.74 1.32 1.40 0.93 2.68 1.05 1.75 0.83 2.06
Aug-10 1.24 1.43 0.44 1.60 0.47 0.72 <0.10 <0.10 1.43 0.85 0.76
Oct-10 1.11 1.24 0.81 1.79 1.25 1.05 3.03 0.68 1.24 1.03 1.67
Jan / Feb-11 F 0.60 0.41 1.42 0.94 0.54 1.92 0.49 0.60 F F
Apr-11 1.07 0.83 0.84 1.35 0.92 0.84 2.63 0.63 0.83 0.47 1.01
Jul-11 2.10 1.23 1.20 1.52 1.52 1.04 3.06 0.51 1.23 1.36 1.38
Oct-11 2.52 2.07 4.43 2.73 2.00 2.01 3.43 1.02 2.07 1.45 3.92
Jan-12 1.68 F 0.84 4.44 1.98 0.94 4.84 0.73 F 1.70 1.95
Apr-12 2.00 2.28 1.03 0.87 1.21 1.37 2.09 0.69 2.28 0.49 0.71
Jul-12 1.70 0.66 0.76 1.18 1.23 1.70 2.97 0.62 0.66 1.24 2.87
Oct-12 2.05 1.76 2.89 1.87 1.34 0.71 3.25 0.67 1.76 0.76 2.61
Jan / Feb-13 F F F F 2.09 1.58 F 0.66 F F F
Apr / May-13 2.43 1.56 1.92 1.12 1.66 1.35 2.59 1.23 1.56 3.14 2.76
Jul-13 1.00 1.00 0.50 1.00 0.40 0.40 1.70 0.40 1.00 0.60 0.80
Oct-13 1.64 1.01 0.52 1.12 1.20 0.85 3.31 0.48 1.01 0.84 0.91
Mar-14 F F F F 1.93 F F 0.78 F F F
May / Jun-14 3.00 2.14 5.18 2.19 1.82 1.77 2.92 1.15 2.14 3.83 3.82
Aug-14 2.70 2.27 1.07 1.63 1.34 1.36 2.35 1.51 2.27 1.31 0.88
Oct-14 3.69 2.07 2.71 2.87 2.41 2.42 3.51 1.02 2.07 1.81 2.17
Jun-15 2.66 2.33 4.35 3.09 1.99 2.29 3.39 1.27 2.33 4.30 3.23
Jul-15 2.28 1.53 4.02 5.26 1.48 1.79 4.17 1.29 1.53 1.79 3.32
Oct-15 2.34 0.60 1.20 2.17 1.75 1.13 2.69 0.55 0.60 2.50 1.72
2009 Average 1.70 1.31 1.34 1.94 1.43 1.69 3.05 1.27 1.31 1.39 2.32
2010 Average 1.22 <1.13 <0.52 1.79 1.07 <0.70 <1.76 <0.48 <1.13 <0.70 1.50
2011 Average 1.90 1.18 1.72 1.76 1.35 1.11 2.76 0.66 1.18 1.09 2.10
2012 Average 1.86 1.57 1.38 2.09 1.44 1.18 3.29 0.68 1.57 1.05 2.04
2013 Average 1.69 1.19 0.98 1.08 1.34 1.05 2.53 0.69 1.19 1.53 1.49
2014 Average 3.13 2.16 2.99 2.23 1.88 1.85 2.93 1.12 2.16 2.32 2.29
2015 Average 2.43 1.49 3.19 3.51 1.74 1.74 3.42 1.04 1.49 2.86 2.76
Average All Years 1.96 <1.60 <1.52 1.87 1.38 <1.24 <2.47 <0.79 <1.60 <1.33 1.87
MS-2-R and MS-V(1)-R are the same stations
Blank cells indicate concentration was not determined.
F = Frozen (no sample)
Stations located at or inside the Upper Bedrock 2 m drawdown contour
Stations located outside the Upper Bedrock 2 m drawdown contour
Data prior to May 2009 refers to groundwater concentrations.
Table 8b: Total Mercury - Ribbed Fen Surface Waters (Filtered)(concentrations in ng/L)
Amended C. of A. #3960-7Q4K2G provides for annual sampling of peat pore water and quarterly sampling of ribbed fen surface water (the previous C. of A.
#4111-7DXKQW provided for the same sampling frequency).
MDLs have been adjusted for all years for uniformity (0.1 ng/L for total mercury), as per Section 1.
TC140504 Page 63
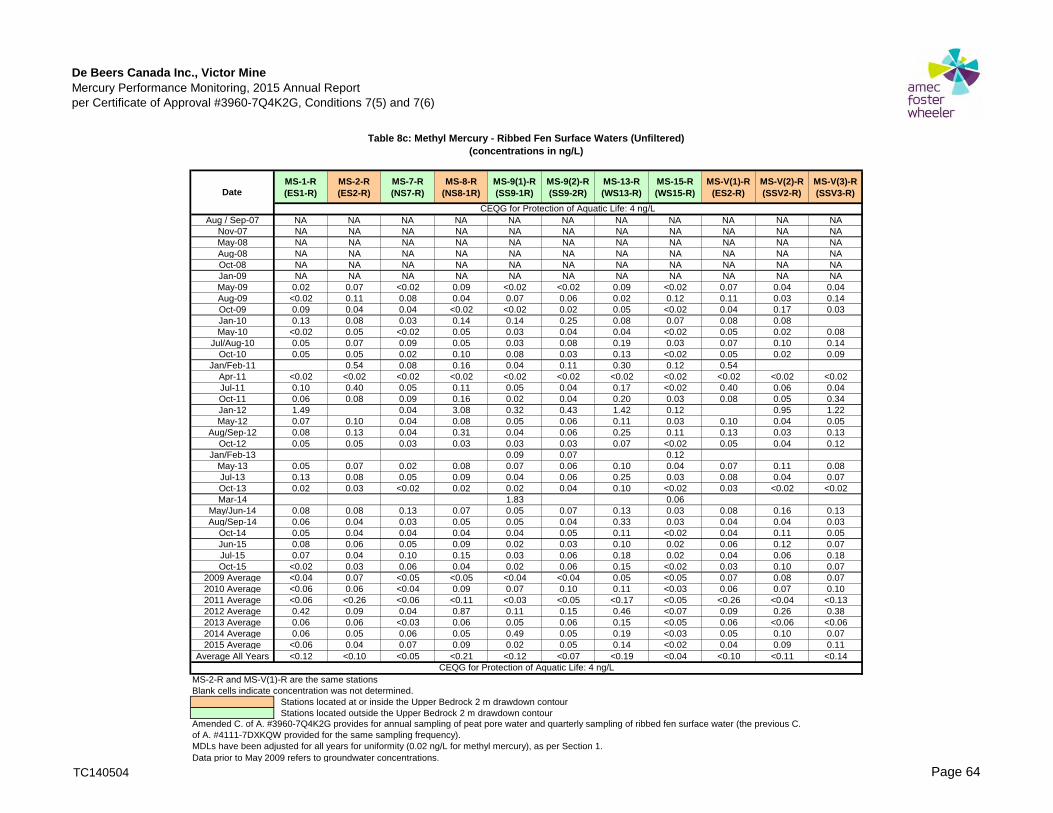
De Beers Canada Inc., Victor MineMercury Performance Monitoring, 2015 Annual Report
per Certificate of Approval #3960-7Q4K2G, Conditions 7(5) and 7(6)
MS-1-R(ES1-R)
MS-2-R(ES2-R)
MS-7-R(NS7-R)
MS-8-R(NS8-1R)
MS-9(1)-R(SS9-1R)
MS-9(2)-R(SS9-2R)
MS-13-R(WS13-R)
MS-15-R(WS15-R)
MS-V(1)-R(ES2-R)
MS-V(2)-R(SSV2-R)
MS-V(3)-R(SSV3-R)
Aug / Sep-07 NA NA NA NA NA NA NA NA NA NA NA
Nov-07 NA NA NA NA NA NA NA NA NA NA NA
May-08 NA NA NA NA NA NA NA NA NA NA NA
Aug-08 NA NA NA NA NA NA NA NA NA NA NA
Oct-08 NA NA NA NA NA NA NA NA NA NA NA
Jan-09 NA NA NA NA NA NA NA NA NA NA NA
May-09 0.02 0.07 <0.02 0.09 <0.02 <0.02 0.09 <0.02 0.07 0.04 0.04
Aug-09 <0.02 0.11 0.08 0.04 0.07 0.06 0.02 0.12 0.11 0.03 0.14
Oct-09 0.09 0.04 0.04 <0.02 <0.02 0.02 0.05 <0.02 0.04 0.17 0.03
Jan-10 0.13 0.08 0.03 0.14 0.14 0.25 0.08 0.07 0.08 0.08
May-10 <0.02 0.05 <0.02 0.05 0.03 0.04 0.04 <0.02 0.05 0.02 0.08
Jul/Aug-10 0.05 0.07 0.09 0.05 0.03 0.08 0.19 0.03 0.07 0.10 0.14
Oct-10 0.05 0.05 0.02 0.10 0.08 0.03 0.13 <0.02 0.05 0.02 0.09
Jan/Feb-11 0.54 0.08 0.16 0.04 0.11 0.30 0.12 0.54
Apr-11 <0.02 <0.02 <0.02 <0.02 <0.02 <0.02 <0.02 <0.02 <0.02 <0.02 <0.02
Jul-11 0.10 0.40 0.05 0.11 0.05 0.04 0.17 <0.02 0.40 0.06 0.04
Oct-11 0.06 0.08 0.09 0.16 0.02 0.04 0.20 0.03 0.08 0.05 0.34
Jan-12 1.49 0.04 3.08 0.32 0.43 1.42 0.12 0.95 1.22
May-12 0.07 0.10 0.04 0.08 0.05 0.06 0.11 0.03 0.10 0.04 0.05
Aug/Sep-12 0.08 0.13 0.04 0.31 0.04 0.06 0.25 0.11 0.13 0.03 0.13
Oct-12 0.05 0.05 0.03 0.03 0.03 0.03 0.07 <0.02 0.05 0.04 0.12
Jan/Feb-13 0.09 0.07 0.12
May-13 0.05 0.07 0.02 0.08 0.07 0.06 0.10 0.04 0.07 0.11 0.08
Jul-13 0.13 0.08 0.05 0.09 0.04 0.06 0.25 0.03 0.08 0.04 0.07
Oct-13 0.02 0.03 <0.02 0.02 0.02 0.04 0.10 <0.02 0.03 <0.02 <0.02
Mar-14 1.83 0.06
May/Jun-14 0.08 0.08 0.13 0.07 0.05 0.07 0.13 0.03 0.08 0.16 0.13
Aug/Sep-14 0.06 0.04 0.03 0.05 0.05 0.04 0.33 0.03 0.04 0.04 0.03
Oct-14 0.05 0.04 0.04 0.04 0.04 0.05 0.11 <0.02 0.04 0.11 0.05
Jun-15 0.08 0.06 0.05 0.09 0.02 0.03 0.10 0.02 0.06 0.12 0.07
Jul-15 0.07 0.04 0.10 0.15 0.03 0.06 0.18 0.02 0.04 0.06 0.18
Oct-15 <0.02 0.03 0.06 0.04 0.02 0.06 0.15 <0.02 0.03 0.10 0.07
2009 Average <0.04 0.07 <0.05 <0.05 <0.04 <0.04 0.05 <0.05 0.07 0.08 0.07
2010 Average <0.06 0.06 <0.04 0.09 0.07 0.10 0.11 <0.03 0.06 0.07 0.10
2011 Average <0.06 <0.26 <0.06 <0.11 <0.03 <0.05 <0.17 <0.05 <0.26 <0.04 <0.13
2012 Average 0.42 0.09 0.04 0.87 0.11 0.15 0.46 <0.07 0.09 0.26 0.38
2013 Average 0.06 0.06 <0.03 0.06 0.05 0.06 0.15 <0.05 0.06 <0.06 <0.06
2014 Average 0.06 0.05 0.06 0.05 0.49 0.05 0.19 <0.03 0.05 0.10 0.07
2015 Average <0.06 0.04 0.07 0.09 0.02 0.05 0.14 <0.02 0.04 0.09 0.11
Average All Years <0.12 <0.10 <0.05 <0.21 <0.12 <0.07 <0.19 <0.04 <0.10 <0.11 <0.14
MS-2-R and MS-V(1)-R are the same stations
Blank cells indicate concentration was not determined.
Stations located at or inside the Upper Bedrock 2 m drawdown contour
Stations located outside the Upper Bedrock 2 m drawdown contour
Data prior to May 2009 refers to groundwater concentrations.
Table 8c: Methyl Mercury - Ribbed Fen Surface Waters (Unfiltered)(concentrations in ng/L)
Amended C. of A. #3960-7Q4K2G provides for annual sampling of peat pore water and quarterly sampling of ribbed fen surface water (the previous C.
of A. #4111-7DXKQW provided for the same sampling frequency).
MDLs have been adjusted for all years for uniformity (0.02 ng/L for methyl mercury), as per Section 1.
Date
CEQG for Protection of Aquatic Life: 4 ng/L
CEQG for Protection of Aquatic Life: 4 ng/L
TC140504 Page 64

De Beers Canada Inc., Victor MineMercury Performance Monitoring, 2015 Annual Report
per Certificate of Approval #3960-7Q4K2G, Conditions 7(5) and 7(6)
MS-1-R(ES1-R)
MS-2-R(ES2-R)
MS-7-R(NS7-R)
MS-8-R(NS8-1R)
MS-9(1)-R(SS9-1R)
MS-9(2)-R(SS9-2R)
MS-13-R(WS13-R)
MS-15-R(WS15-R)
MS-V(1)-R(ES2-R)
MS-V(2)-R(SSV2-R)
MS-V(3)-R(SSV3-R)
Aug / Sep-07 0.02 <0.02 <0.02 <0.02 0.02 <0.02 0.13 0.02 <0.02 <0.02 <0.02
Nov-07 0.02 <0.02 <0.02 <0.02 <0.02 0.02 <0.02 <0.02 <0.02 <0.02 <0.02
May-08 0.11 0.07 F <0.02 <0.02 F <0.02 0.02 0.07 F F
Aug-08 0.07 0.04 <0.02 <0.02 0.03 0.06 <0.02 0.02 0.04 <0.02 0.02
Oct-08 0.02 <0.02 <0.02 <0.02 0.02 0.04 <0.02 0.02 <0.02 <0.02 <0.02
Jan-09 F F F F F F F F F F F
May / June-09 0.07 0.05 <0.02 0.08 0.02 <0.02 0.08 <0.02 0.05 0.04 0.04
Aug-09 0.03 0.05 0.03 0.09 <0.02 0.04 0.04 0.11 0.05 0.04 <0.02
Oct-09 0.05 0.03 0.05 0.06 0.04 0.04 0.09 0.02 0.03 0.05 0.14
Jan-10 0.07 <0.02 <0.02 0.10 <0.02 <0.02 0.05 0.02 <0.02 <0.02 F
May-10 0.04 0.04 0.03 0.03 0.04 0.03 0.07 0.02 0.04 0.03 0.06
Aug-10 0.06 0.08 0.02 <0.02 <0.02 0.05 <0.02 <0.02 0.08 0.04 <0.02
Oct-10 0.03 0.04 <0.02 0.08 0.03 <0.02 0.12 <0.02 0.04 <0.02 0.07
Jan / Feb-11 F 0.03 <0.02 0.03 0.09 <0.02 0.04 <0.02 0.03 F F
Apr-11 <0.02 <0.02 <0.02 <0.02 <0.02 <0.02 <0.02 <0.02 <0.02 <0.02 <0.02
Jul-11 0.05 0.07 0.03 0.05 0.03 <0.02 0.16 <0.02 0.07 0.03 0.03
Oct-11 0.07 0.06 0.08 0.14 0.03 0.04 0.15 <0.02 0.06 0.05 0.23
Jan-12 0.29 F 0.03 0.95 0.02 0.13 0.63 0.07 F 0.18 0.10
Apr-12 0.06 0.06 0.03 0.05 0.04 0.06 0.10 0.02 0.06 <0.02 0.03
Jul-12 0.04 0.05 <0.02 0.11 <0.02 0.05 0.20 <0.02 0.05 0.03 <0.02
Oct-12 0.04 0.02 0.02 0.03 <0.02 0.02 0.06 <0.02 0.02 <0.02 0.10
Jan / Feb-13 F F F F 0.05 0.09 F 0.04 F F F
Apr / May-13 <0.02 <0.02 <0.02 0.05 0.03 0.03 <0.02 0.03 <0.02 0.06 0.04
Jul-13 0.12 0.05 0.03 0.09 0.04 0.03 0.21 <0.02 0.05 <0.02 0.05
Oct-13 <0.02 <0.02 <0.02 <0.02 <0.02 0.04 0.09 <0.02 <0.02 <0.02 <0.02
Mar-14 F F F F 0.20 F F 0.03 F F F
May-14 0.07 0.06 0.07 0.06 0.03 0.04 0.12 <0.02 0.06 0.12 0.07
Aug-14 0.03 0.02 0.02 0.03 0.02 0.02 0.14 <0.02 0.02 <0.02 0.02
Oct-14 0.03 0.03 0.02 0.04 0.04 0.03 0.09 <0.02 0.03 0.06 0.04
Jun-15 0.05 0.05 0.04 0.08 0.03 0.03 0.11 0.05 0.12 0.10
Jul-15 <0.02 0.03 0.07 <0.02 <0.02 <0.02 0.08 <0.02 0.03 <0.02 0.04
Oct-15 0.04 0.03 0.04 0.03 0.03 0.03 0.13 0.03 0.12 0.08
2009 Average 0.05 0.04 <0.03 0.08 <0.03 <0.03 0.07 <0.05 0.04 0.04 <0.07
2010 Average 0.05 <0.05 <0.02 <0.06 <0.03 <0.03 <0.07 <0.02 <0.05 <0.03 <0.05
2011 Average <0.05 <0.04 <0.04 <0.06 <0.04 <0.03 <0.09 <0.02 <0.05 <0.03 <0.09
2012 Average 0.11 0.04 <0.02 0.28 <0.02 0.06 0.25 <0.03 0.04 <0.06 <0.06
2013 Average <0.05 <0.03 <0.02 <0.05 <0.04 0.05 <0.11 <0.03 <0.03 <0.03 <0.04
2014 Average 0.05 0.04 0.04 0.04 0.07 0.03 0.11 <0.02 0.04 <0.07 0.04
2015 Average <0.04 0.04 0.05 <0.04 <0.02 <0.03 0.11 <0.02 0.04 <0.09 0.07
Average All Years <0.06 <0.04 <0.03 <0.08 <0.03 <0.04 <0.10 <0.03 <0.04 <0.05 <0.05
MS-2-R and MS-V(1)-R are the same stations
Blank cells indicate concentration was not determined.
F = Frozen (no sample)
Stations located at or inside the Upper Bedrock 2 m drawdown contour
Stations located outside the Upper Bedrock 2 m drawdown contour
Data prior to May 2009 refers to groundwater concentrations.
Table 8d: Methyl Mercury - Ribbed Fen Surface Waters (Filtered)(concentrations in ng/L)
Amended C. of A. #3960-7Q4K2G provides for annual sampling of peat pore water and quarterly sampling of ribbed fen surface water (the previous C. of
A. #4111-7DXKQW provided for the same sampling frequency).
MDLs have been adjusted for all years for uniformity (0.02 ng/L for methyl mercury), as per Section 1.
Date
Draft USEPA Criteria: 0.05 ng/L
Draft USEPA Criteria: 0.05 ng/L
TC140504 Page 65
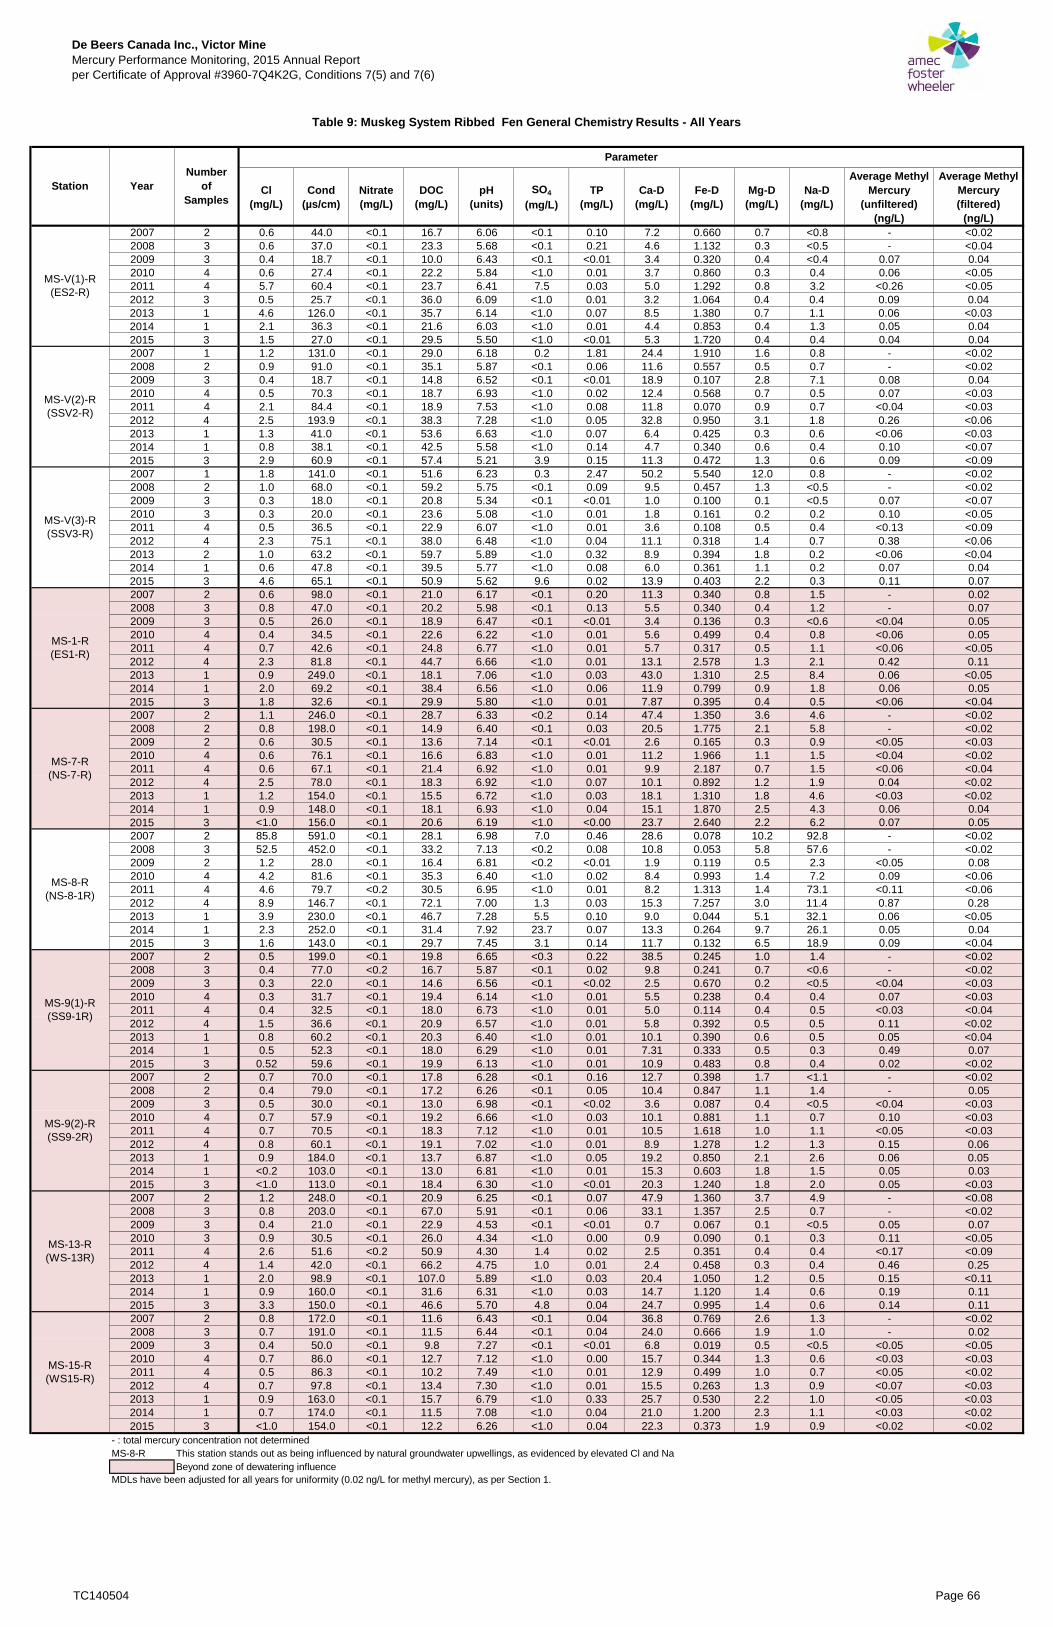
De Beers Canada Inc., Victor MineMercury Performance Monitoring, 2015 Annual Report
per Certificate of Approval #3960-7Q4K2G, Conditions 7(5) and 7(6)
Cl(mg/L)
Cond(µs/cm)
Nitrate(mg/L)
DOC(mg/L)
pH(units)
SO4
(mg/L)TP
(mg/L)Ca-D
(mg/L)Fe-D
(mg/L)Mg-D
(mg/L)Na-D
(mg/L)
Average Methyl Mercury
(unfiltered)(ng/L)
Average Methyl Mercury (filtered)
(ng/L)2007 2 0.6 44.0 <0.1 16.7 6.06 <0.1 0.10 7.2 0.660 0.7 <0.8 - <0.02
2008 3 0.6 37.0 <0.1 23.3 5.68 <0.1 0.21 4.6 1.132 0.3 <0.5 - <0.04
2009 3 0.4 18.7 <0.1 10.0 6.43 <0.1 <0.01 3.4 0.320 0.4 <0.4 0.07 0.04
2010 4 0.6 27.4 <0.1 22.2 5.84 <1.0 0.01 3.7 0.860 0.3 0.4 0.06 <0.05
2011 4 5.7 60.4 <0.1 23.7 6.41 7.5 0.03 5.0 1.292 0.8 3.2 <0.26 <0.05
2012 3 0.5 25.7 <0.1 36.0 6.09 <1.0 0.01 3.2 1.064 0.4 0.4 0.09 0.04
2013 1 4.6 126.0 <0.1 35.7 6.14 <1.0 0.07 8.5 1.380 0.7 1.1 0.06 <0.03
2014 1 2.1 36.3 <0.1 21.6 6.03 <1.0 0.01 4.4 0.853 0.4 1.3 0.05 0.04
2015 3 1.5 27.0 <0.1 29.5 5.50 <1.0 <0.01 5.3 1.720 0.4 0.4 0.04 0.04
2007 1 1.2 131.0 <0.1 29.0 6.18 0.2 1.81 24.4 1.910 1.6 0.8 - <0.02
2008 2 0.9 91.0 <0.1 35.1 5.87 <0.1 0.06 11.6 0.557 0.5 0.7 - <0.02
2009 3 0.4 18.7 <0.1 14.8 6.52 <0.1 <0.01 18.9 0.107 2.8 7.1 0.08 0.04
2010 4 0.5 70.3 <0.1 18.7 6.93 <1.0 0.02 12.4 0.568 0.7 0.5 0.07 <0.03
2011 4 2.1 84.4 <0.1 18.9 7.53 <1.0 0.08 11.8 0.070 0.9 0.7 <0.04 <0.03
2012 4 2.5 193.9 <0.1 38.3 7.28 <1.0 0.05 32.8 0.950 3.1 1.8 0.26 <0.06
2013 1 1.3 41.0 <0.1 53.6 6.63 <1.0 0.07 6.4 0.425 0.3 0.6 <0.06 <0.03
2014 1 0.8 38.1 <0.1 42.5 5.58 <1.0 0.14 4.7 0.340 0.6 0.4 0.10 <0.07
2015 3 2.9 60.9 <0.1 57.4 5.21 3.9 0.15 11.3 0.472 1.3 0.6 0.09 <0.09
2007 1 1.8 141.0 <0.1 51.6 6.23 0.3 2.47 50.2 5.540 12.0 0.8 - <0.02
2008 2 1.0 68.0 <0.1 59.2 5.75 <0.1 0.09 9.5 0.457 1.3 <0.5 - <0.02
2009 3 0.3 18.0 <0.1 20.8 5.34 <0.1 <0.01 1.0 0.100 0.1 <0.5 0.07 <0.07
2010 3 0.3 20.0 <0.1 23.6 5.08 <1.0 0.01 1.8 0.161 0.2 0.2 0.10 <0.05
2011 4 0.5 36.5 <0.1 22.9 6.07 <1.0 0.01 3.6 0.108 0.5 0.4 <0.13 <0.09
2012 4 2.3 75.1 <0.1 38.0 6.48 <1.0 0.04 11.1 0.318 1.4 0.7 0.38 <0.06
2013 2 1.0 63.2 <0.1 59.7 5.89 <1.0 0.32 8.9 0.394 1.8 0.2 <0.06 <0.04
2014 1 0.6 47.8 <0.1 39.5 5.77 <1.0 0.08 6.0 0.361 1.1 0.2 0.07 0.04
2015 3 4.6 65.1 <0.1 50.9 5.62 9.6 0.02 13.9 0.403 2.2 0.3 0.11 0.07
2007 2 0.6 98.0 <0.1 21.0 6.17 <0.1 0.20 11.3 0.340 0.8 1.5 - 0.02
2008 3 0.8 47.0 <0.1 20.2 5.98 <0.1 0.13 5.5 0.340 0.4 1.2 - 0.07
2009 3 0.5 26.0 <0.1 18.9 6.47 <0.1 <0.01 3.4 0.136 0.3 <0.6 <0.04 0.05
2010 4 0.4 34.5 <0.1 22.6 6.22 <1.0 0.01 5.6 0.499 0.4 0.8 <0.06 0.05
2011 4 0.7 42.6 <0.1 24.8 6.77 <1.0 0.01 5.7 0.317 0.5 1.1 <0.06 <0.05
2012 4 2.3 81.8 <0.1 44.7 6.66 <1.0 0.01 13.1 2.578 1.3 2.1 0.42 0.11
2013 1 0.9 249.0 <0.1 18.1 7.06 <1.0 0.03 43.0 1.310 2.5 8.4 0.06 <0.05
2014 1 2.0 69.2 <0.1 38.4 6.56 <1.0 0.06 11.9 0.799 0.9 1.8 0.06 0.05
2015 3 1.8 32.6 <0.1 29.9 5.80 <1.0 0.01 7.87 0.395 0.4 0.5 <0.06 <0.04
2007 2 1.1 246.0 <0.1 28.7 6.33 <0.2 0.14 47.4 1.350 3.6 4.6 - <0.02
2008 2 0.8 198.0 <0.1 14.9 6.40 <0.1 0.03 20.5 1.775 2.1 5.8 - <0.02
2009 2 0.6 30.5 <0.1 13.6 7.14 <0.1 <0.01 2.6 0.165 0.3 0.9 <0.05 <0.03
2010 4 0.6 76.1 <0.1 16.6 6.83 <1.0 0.01 11.2 1.966 1.1 1.5 <0.04 <0.02
2011 4 0.6 67.1 <0.1 21.4 6.92 <1.0 0.01 9.9 2.187 0.7 1.5 <0.06 <0.04
2012 4 2.5 78.0 <0.1 18.3 6.92 <1.0 0.07 10.1 0.892 1.2 1.9 0.04 <0.02
2013 1 1.2 154.0 <0.1 15.5 6.72 <1.0 0.03 18.1 1.310 1.8 4.6 <0.03 <0.02
2014 1 0.9 148.0 <0.1 18.1 6.93 <1.0 0.04 15.1 1.870 2.5 4.3 0.06 0.04
2015 3 <1.0 156.0 <0.1 20.6 6.19 <1.0 <0.00 23.7 2.640 2.2 6.2 0.07 0.05
2007 2 85.8 591.0 <0.1 28.1 6.98 7.0 0.46 28.6 0.078 10.2 92.8 - <0.02
2008 3 52.5 452.0 <0.1 33.2 7.13 <0.2 0.08 10.8 0.053 5.8 57.6 - <0.02
2009 2 1.2 28.0 <0.1 16.4 6.81 <0.2 <0.01 1.9 0.119 0.5 2.3 <0.05 0.08
2010 4 4.2 81.6 <0.1 35.3 6.40 <1.0 0.02 8.4 0.993 1.4 7.2 0.09 <0.06
2011 4 4.6 79.7 <0.2 30.5 6.95 <1.0 0.01 8.2 1.313 1.4 73.1 <0.11 <0.06
2012 4 8.9 146.7 <0.1 72.1 7.00 1.3 0.03 15.3 7.257 3.0 11.4 0.87 0.28
2013 1 3.9 230.0 <0.1 46.7 7.28 5.5 0.10 9.0 0.044 5.1 32.1 0.06 <0.05
2014 1 2.3 252.0 <0.1 31.4 7.92 23.7 0.07 13.3 0.264 9.7 26.1 0.05 0.04
2015 3 1.6 143.0 <0.1 29.7 7.45 3.1 0.14 11.7 0.132 6.5 18.9 0.09 <0.04
2007 2 0.5 199.0 <0.1 19.8 6.65 <0.3 0.22 38.5 0.245 1.0 1.4 - <0.02
2008 3 0.4 77.0 <0.2 16.7 5.87 <0.1 0.02 9.8 0.241 0.7 <0.6 - <0.02
2009 3 0.3 22.0 <0.1 14.6 6.56 <0.1 <0.02 2.5 0.670 0.2 <0.5 <0.04 <0.03
2010 4 0.3 31.7 <0.1 19.4 6.14 <1.0 0.01 5.5 0.238 0.4 0.4 0.07 <0.03
2011 4 0.4 32.5 <0.1 18.0 6.73 <1.0 0.01 5.0 0.114 0.4 0.5 <0.03 <0.04
2012 4 1.5 36.6 <0.1 20.9 6.57 <1.0 0.01 5.8 0.392 0.5 0.5 0.11 <0.02
2013 1 0.8 60.2 <0.1 20.3 6.40 <1.0 0.01 10.1 0.390 0.6 0.5 0.05 <0.04
2014 1 0.5 52.3 <0.1 18.0 6.29 <1.0 0.01 7.31 0.333 0.5 0.3 0.49 0.07
2015 3 0.52 59.6 <0.1 19.9 6.13 <1.0 0.01 10.9 0.483 0.8 0.4 0.02 <0.02
2007 2 0.7 70.0 <0.1 17.8 6.28 <0.1 0.16 12.7 0.398 1.7 <1.1 - <0.02
2008 2 0.4 79.0 <0.1 17.2 6.26 <0.1 0.05 10.4 0.847 1.1 1.4 - 0.05
2009 3 0.5 30.0 <0.1 13.0 6.98 <0.1 <0.02 3.6 0.087 0.4 <0.5 <0.04 <0.03
2010 4 0.7 57.9 <0.1 19.2 6.66 <1.0 0.03 10.1 0.881 1.1 0.7 0.10 <0.03
2011 4 0.7 70.5 <0.1 18.3 7.12 <1.0 0.01 10.5 1.618 1.0 1.1 <0.05 <0.03
2012 4 0.8 60.1 <0.1 19.1 7.02 <1.0 0.01 8.9 1.278 1.2 1.3 0.15 0.06
2013 1 0.9 184.0 <0.1 13.7 6.87 <1.0 0.05 19.2 0.850 2.1 2.6 0.06 0.05
2014 1 <0.2 103.0 <0.1 13.0 6.81 <1.0 0.01 15.3 0.603 1.8 1.5 0.05 0.03
2015 3 <1.0 113.0 <0.1 18.4 6.30 <1.0 <0.01 20.3 1.240 1.8 2.0 0.05 <0.03
2007 2 1.2 248.0 <0.1 20.9 6.25 <0.1 0.07 47.9 1.360 3.7 4.9 - <0.08
2008 3 0.8 203.0 <0.1 67.0 5.91 <0.1 0.06 33.1 1.357 2.5 0.7 - <0.02
2009 3 0.4 21.0 <0.1 22.9 4.53 <0.1 <0.01 0.7 0.067 0.1 <0.5 0.05 0.07
2010 3 0.9 30.5 <0.1 26.0 4.34 <1.0 0.00 0.9 0.090 0.1 0.3 0.11 <0.05
2011 4 2.6 51.6 <0.2 50.9 4.30 1.4 0.02 2.5 0.351 0.4 0.4 <0.17 <0.09
2012 4 1.4 42.0 <0.1 66.2 4.75 1.0 0.01 2.4 0.458 0.3 0.4 0.46 0.25
2013 1 2.0 98.9 <0.1 107.0 5.89 <1.0 0.03 20.4 1.050 1.2 0.5 0.15 <0.11
2014 1 0.9 160.0 <0.1 31.6 6.31 <1.0 0.03 14.7 1.120 1.4 0.6 0.19 0.11
2015 3 3.3 150.0 <0.1 46.6 5.70 4.8 0.04 24.7 0.995 1.4 0.6 0.14 0.11
2007 2 0.8 172.0 <0.1 11.6 6.43 <0.1 0.04 36.8 0.769 2.6 1.3 - <0.02
2008 3 0.7 191.0 <0.1 11.5 6.44 <0.1 0.04 24.0 0.666 1.9 1.0 - 0.02
2009 3 0.4 50.0 <0.1 9.8 7.27 <0.1 <0.01 6.8 0.019 0.5 <0.5 <0.05 <0.05
2010 4 0.7 86.0 <0.1 12.7 7.12 <1.0 0.00 15.7 0.344 1.3 0.6 <0.03 <0.03
2011 4 0.5 86.3 <0.1 10.2 7.49 <1.0 0.01 12.9 0.499 1.0 0.7 <0.05 <0.02
2012 4 0.7 97.8 <0.1 13.4 7.30 <1.0 0.01 15.5 0.263 1.3 0.9 <0.07 <0.03
2013 1 0.9 163.0 <0.1 15.7 6.79 <1.0 0.33 25.7 0.530 2.2 1.0 <0.05 <0.03
2014 1 0.7 174.0 <0.1 11.5 7.08 <1.0 0.04 21.0 1.200 2.3 1.1 <0.03 <0.02
2015 3 <1.0 154.0 <0.1 12.2 6.26 <1.0 0.04 22.3 0.373 1.9 0.9 <0.02 <0.02
- : total mercury concentration not determined
MS-8-R This station stands out as being influenced by natural groundwater upwellings, as evidenced by elevated Cl and Na
Beyond zone of dewatering influence
MDLs have been adjusted for all years for uniformity (0.02 ng/L for methyl mercury), as per Section 1.
Parameter
Table 9: Muskeg System Ribbed Fen General Chemistry Results - All Years
MS-7-R
(NS-7-R)
MS-15-R
(WS15-R)
MS-13-R
(WS-13R)
MS-9(2)-R
(SS9-2R)
MS-9(1)-R
(SS9-1R)
MS-8-R
(NS-8-1R)
MS-1-R
(ES1-R)
MS-V(3)-R
(SSV3-R)
MS-V(2)-R
(SSV2-R)
MS-V(1)-R
(ES2-R)
StationNumber
ofSamples
Year
TC140504 Page 66
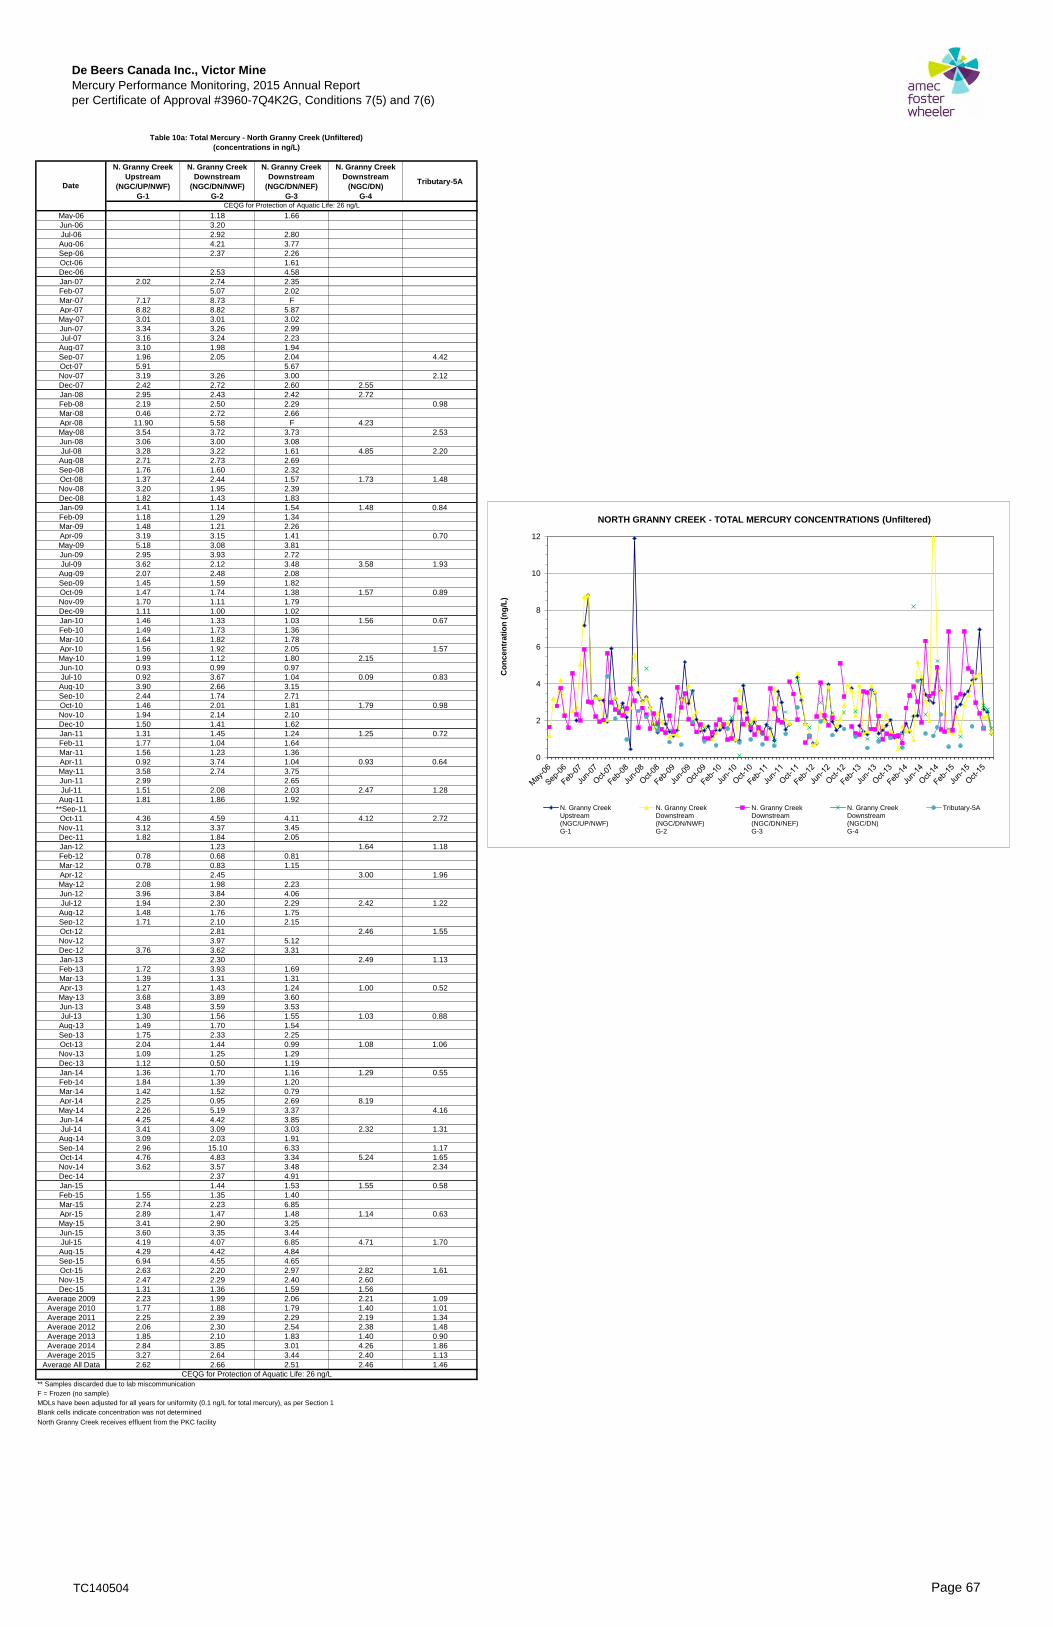
De Beers Canada Inc., Victor MineMercury Performance Monitoring, 2015 Annual Report
per Certificate of Approval #3960-7Q4K2G, Conditions 7(5) and 7(6)
N. Granny CreekUpstream
(NGC/UP/NWF)G-1
N. Granny CreekDownstream
(NGC/DN/NWF)G-2
N. Granny CreekDownstream
(NGC/DN/NEF)G-3
N. Granny CreekDownstream
(NGC/DN)G-4
Tributary-5A
May-06 1.18 1.66
Jun-06 3.20
Jul-06 2.92 2.80
Aug-06 4.21 3.77
Sep-06 2.37 2.26
Oct-06 1.61
Dec-06 2.53 4.58
Jan-07 2.02 2.74 2.35
Feb-07 5.07 2.02
Mar-07 7.17 8.73 F
Apr-07 8.82 8.82 5.87
May-07 3.01 3.01 3.02
Jun-07 3.34 3.26 2.99
Jul-07 3.16 3.24 2.23
Aug-07 3.10 1.98 1.94
Sep-07 1.96 2.05 2.04 4.42
Oct-07 5.91 5.67
Nov-07 3.19 3.26 3.00 2.12
Dec-07 2.42 2.72 2.60 2.55
Jan-08 2.95 2.43 2.42 2.72
Feb-08 2.19 2.50 2.29 0.98
Mar-08 0.46 2.72 2.66
Apr-08 11.90 5.58 F 4.23
May-08 3.54 3.72 3.73 2.53
Jun-08 3.06 3.00 3.08
Jul-08 3.28 3.22 1.61 4.85 2.20
Aug-08 2.71 2.73 2.69
Sep-08 1.76 1.60 2.32
Oct-08 1.37 2.44 1.57 1.73 1.48
Nov-08 3.20 1.95 2.39
Dec-08 1.82 1.43 1.83
Jan-09 1.41 1.14 1.54 1.48 0.84
Feb-09 1.18 1.29 1.34
Mar-09 1.48 1.21 2.26
Apr-09 3.19 3.15 1.41 0.70
May-09 5.18 3.08 3.81
Jun-09 2.95 3.93 2.72
Jul-09 3.62 2.12 3.48 3.58 1.93
Aug-09 2.07 2.48 2.08
Sep-09 1.45 1.59 1.82
Oct-09 1.47 1.74 1.38 1.57 0.89
Nov-09 1.70 1.11 1.79
Dec-09 1.11 1.00 1.02
Jan-10 1.46 1.33 1.03 1.56 0.67
Feb-10 1.49 1.73 1.36
Mar-10 1.64 1.82 1.78
Apr-10 1.56 1.92 2.05 1.57
May-10 1.99 1.12 1.80 2.15
Jun-10 0.93 0.99 0.97
Jul-10 0.92 3.67 1.04 0.09 0.83
Aug-10 3.90 2.66 3.15
Sep-10 2.44 1.74 2.71
Oct-10 1.46 2.01 1.81 1.79 0.98
Nov-10 1.94 2.14 2.10
Dec-10 1.50 1.41 1.62
Jan-11 1.31 1.45 1.24 1.25 0.72
Feb-11 1.77 1.04 1.64
Mar-11 1.56 1.23 1.36
Apr-11 0.92 3.74 1.04 0.93 0.64
May-11 3.58 2.74 3.75
Jun-11 2.99 2.65
Jul-11 1.51 2.08 2.03 2.47 1.28
Aug-11 1.81 1.86 1.92
**Sep-11
Oct-11 4.36 4.59 4.11 4.12 2.72
Nov-11 3.12 3.37 3.45
Dec-11 1.82 1.84 2.05
Jan-12 1.23 1.64 1.18
Feb-12 0.78 0.68 0.81
Mar-12 0.78 0.83 1.15
Apr-12 2.45 3.00 1.96
May-12 2.08 1.98 2.23
Jun-12 3.96 3.84 4.06
Jul-12 1.94 2.30 2.29 2.42 1.22
Aug-12 1.48 1.76 1.75
Sep-12 1.71 2.10 2.15
Oct-12 2.81 2.46 1.55
Nov-12 3.97 5.12
Dec-12 3.76 3.62 3.31
Jan-13 2.30 2.49 1.13
Feb-13 1.72 3.93 1.69
Mar-13 1.39 1.31 1.31
Apr-13 1.27 1.43 1.24 1.00 0.52
May-13 3.68 3.89 3.60
Jun-13 3.48 3.59 3.53
Jul-13 1.30 1.56 1.55 1.03 0.88
Aug-13 1.49 1.70 1.54
Sep-13 1.75 2.33 2.25
Oct-13 2.04 1.44 0.99 1.08 1.06
Nov-13 1.09 1.25 1.29
Dec-13 1.12 0.50 1.19
Jan-14 1.36 1.70 1.16 1.29 0.55
Feb-14 1.84 1.39 1.20
Mar-14 1.42 1.52 0.79
Apr-14 2.25 0.95 2.69 8.19
May-14 2.26 5.19 3.37 4.16
Jun-14 4.25 4.42 3.85
Jul-14 3.41 3.09 3.03 2.32 1.31
Aug-14 3.09 2.03 1.91
Sep-14 2.96 15.10 6.33 1.17
Oct-14 4.76 4.83 3.34 5.24 1.65
Nov-14 3.62 3.57 3.48 2.34
Dec-14 2.37 4.91
Jan-15 1.44 1.53 1.55 0.58
Feb-15 1.55 1.35 1.40
Mar-15 2.74 2.23 6.85
Apr-15 2.89 1.47 1.48 1.14 0.63
May-15 3.41 2.90 3.25
Jun-15 3.60 3.35 3.44
Jul-15 4.19 4.07 6.85 4.71 1.70
Aug-15 4.29 4.42 4.84
Sep-15 6.94 4.55 4.65
Oct-15 2.63 2.20 2.97 2.82 1.61
Nov-15 2.47 2.29 2.40 2.60
Dec-15 1.31 1.36 1.59 1.56
Average 2009 2.23 1.99 2.06 2.21 1.09
Average 2010 1.77 1.88 1.79 1.40 1.01
Average 2011 2.25 2.39 2.29 2.19 1.34
Average 2012 2.06 2.30 2.54 2.38 1.48
Average 2013 1.85 2.10 1.83 1.40 0.90
Average 2014 2.84 3.85 3.01 4.26 1.86
Average 2015 3.27 2.64 3.44 2.40 1.13
Average All Data 2.62 2.66 2.51 2.46 1.46
** Samples discarded due to lab miscommunication
F = Frozen (no sample)
MDLs have been adjusted for all years for uniformity (0.1 ng/L for total mercury), as per Section 1
Blank cells indicate concentration was not determined
North Granny Creek receives effluent from the PKC facility
Table 10a: Total Mercury - North Granny Creek (Unfiltered)(concentrations in ng/L)
CEQG for Protection of Aquatic Life: 26 ng/L
Date
CEQG for Protection of Aquatic Life: 26 ng/L
0
2
4
6
8
10
12
Co
nce
ntr
atio
n (
ng
/L)
NORTH GRANNY CREEK - TOTAL MERCURY CONCENTRATIONS (Unfiltered)
N. Granny CreekUpstream(NGC/UP/NWF)G-1
N. Granny CreekDownstream(NGC/DN/NWF)G-2
N. Granny CreekDownstream(NGC/DN/NEF)G-3
N. Granny CreekDownstream(NGC/DN)G-4
Tributary-5A
TC140504 Page 67

De Beers Canada Inc., Victor MineMercury Performance Monitoring, 2015 Annual Report
per Certificate of Approval #3960-7Q4K2G, Conditions 7(5) and 7(6)
S. Granny CreekUpstream
(SGC/UP/SWF)G-5
S. Granny CreekDownstream
(SGC/DS/SWF)G-6
S. Granny CreekDownstream
(SGC/DS)G-7
Tributary-5A
May-06 0.86 1.26
Jun-06 3.37 3.16
Jul-06 2.72 3.08
Aug-06 2.57 2.60
Sep-06 2.28 2.74
Oct-06 1.34 1.30
Dec-06 2.23 2.08
Jan-07 16.20 4.52
Feb-07 3.57 3.16
Mar-07 F 7.43
Apr-07 3.72 3.76
May-07 2.46 2.08
Jun-07 2.49 3.04
Jul-07 2.73 2.03
Aug-07 2.17
Sep-07 4.41 1.61 4.42
Oct-07 5.16 3.79
Nov-07 2.74 2.49 2.12
Dec-07 2.67 2.61 2.61
Jan-08 2.97 2.94 3.41
Feb-08 3.76 2.91 0.98
Mar-08 3.06 3.35
Apr-08 2.19 2.91 1.50
May-08 3.37 3.42 2.53
Jun-08 2.55 2.81
Jul-08 3.60 2.68 2.84 2.20
Aug-08 2.63 2.38
Sep-08 1.94 2.78
Oct-08 2.14 1.83 1.47 1.48
Nov-08 1.81
Dec-08 1.84 1.88
Jan-09 4.42 1.64 1.66 0.84
Feb-09 2.22 1.52
Mar-09 2.56 1.45
Apr-09 2.19 2.98 1.59 0.70
May-09 3.31 3.82
Jun-09 2.65 2.76
Jul-09 2.70 2.69 2.92 1.93
Aug-09 2.06 2.05
Sep-09 1.47 1.39
Oct-09 1.40 1.05 1.29 0.89
Nov-09 3.65 0.98
Dec-09 1.08 0.96
Jan-10 0.94 1.89 2.45 0.67
Feb-10 1.89 2.03
Mar-10 2.14 1.84
Apr-10 1.68 1.90 1.57
May-10 1.90 2.13 2.25
Jun-10 0.83 0.78
Jul-10 0.70 1.28 0.09 0.83
Aug-10 3.06 3.37
Sep-10 2.21 2.00
Oct-10 1.59 1.55 1.63 0.98
Nov-10 1.82 1.86
Dec-10 1.59 1.67
Jan-11 1.50 1.46 1.54 0.72
Feb-11 1.70 1.42
Mar-11 2.55 1.11
Apr-11 2.40 1.38 1.18 0.64
May-11 2.98 3.53
Jun-11 2.34 2.36
Jul-11 2.08 2.00 2.30 1.28
Aug-11 2.42 2.28
**Sep-11
Oct-11 3.67 3.57 4.14 2.72
Nov-11 3.00 2.72
Dec-11 2.32 1.97
Jan-12 2.33 1.56 1.15 1.18
Feb-12 2.06 0.95
Mar-12 29.4* 0.82
Apr-12 2.72 2.41 2.66 1.96
May-12 2.13 2.42
Jun-12 3.36 2.95
Jul-12 2.42 2.68 2.68 1.22
Aug-12 2.28 1.74
Sep-12 2.77 2.61
Oct-12 2.63 2.34 2.38 1.55
Nov-12 2.33 3.53
Dec-12 3.26 3.31
Jan-13 2.49 2.10 3.03 1.13
Feb-13 2.53 2.14
Mar-13 2.14 1.32
Apr-13 2.35 1.64 1.00 0.52
May-13 3.33 3.16
Jun-13 2.84 2.68
Jul-13 1.58 1.88 1.39 0.88
Aug-13 2.95 2.43
Sep-13 2.16 1.71
Oct-13 1.41 0.86 1.27 1.06
Nov-13 1.96 2.51
Dec-13 1.87 0.95
Jan-14 0.88 0.79 1.35 0.55
Feb-14 1.51 1.39
Mar-14 2.40 1.20
Apr-14 3.19 0.98 2.13
May-14 4.25 4.43 4.16
Jun-14 2.67 3.38
Jul-14 2.48 2.85 3.94 1.31
Aug-14 2.22 1.96
Sep-14 2.16 4.96 1.17
Oct-14 3.52 3.59 4.17 1.65
Nov-14 3.36 5.30 2.34
Dec-14
Jan-15 1.91 1.94 1.31 0.58
Feb-15 2.34 1.65
Mar-15 3.98 2.42
Apr-15 2.69 1.29 1.55 0.63
May-15 3.01 3.28
Jun-15 2.64 3.08
Jul-15 2.27 2.26 3.79 1.70
Aug-15 3.41 3.69
Sep-15 4.81 5.30
Oct-15 2.92 2.86 2.33 1.61
Nov-15 4.96 2.48 2.31
Dec-15 2.35 1.85 2.48
Average 2009 2.48 1.94 1.87 1.09
Average 2010 1.70 1.86 1.61 1.01
Average 2011 2.45 2.16 2.29 1.34
Average 2012 2.57 2.28 2.22 1.48
Average 2013 2.30 1.95 1.67 0.90
Average 2014 2.60 2.80 2.90 1.86
Average 2015 3.11 2.68 2.30 1.13
Average All Data 2.66 2.39 2.17 1.46
* Samples excluded from annual average calculation
** Samples discarded due to lab miscommunication
F = Frozen (no sample)
MDLs have been adjusted for all years for uniformity (0.1 ng/L for total mercury), as per Section 1
Blank cells indicate concentration was not determined
Table 10b: Total Mercury - South Granny Creek (Unfiltered)(concentrations in ng/L)
Date
CEQG for Protection of Aquatic Life: 26 ng/L
CEQG for Protection of Aquatic Life: 26 ng/L
0
2
4
6
8
10
12
14
16
Co
nc
en
trat
ion
(n
g/L
)
SOUTH GRANNY CREEK - TOTAL MERCURY CONCENTRATIONS (Unfiltered)
S. Granny CreekUpstream(SGC/UP/SWF)G-5
S. Granny CreekDownstream(SGC/DS/SWF)G-6
S. Granny CreekDownstream(SGC/DS)G-7
Tributary-5A
TC140504 Page 68
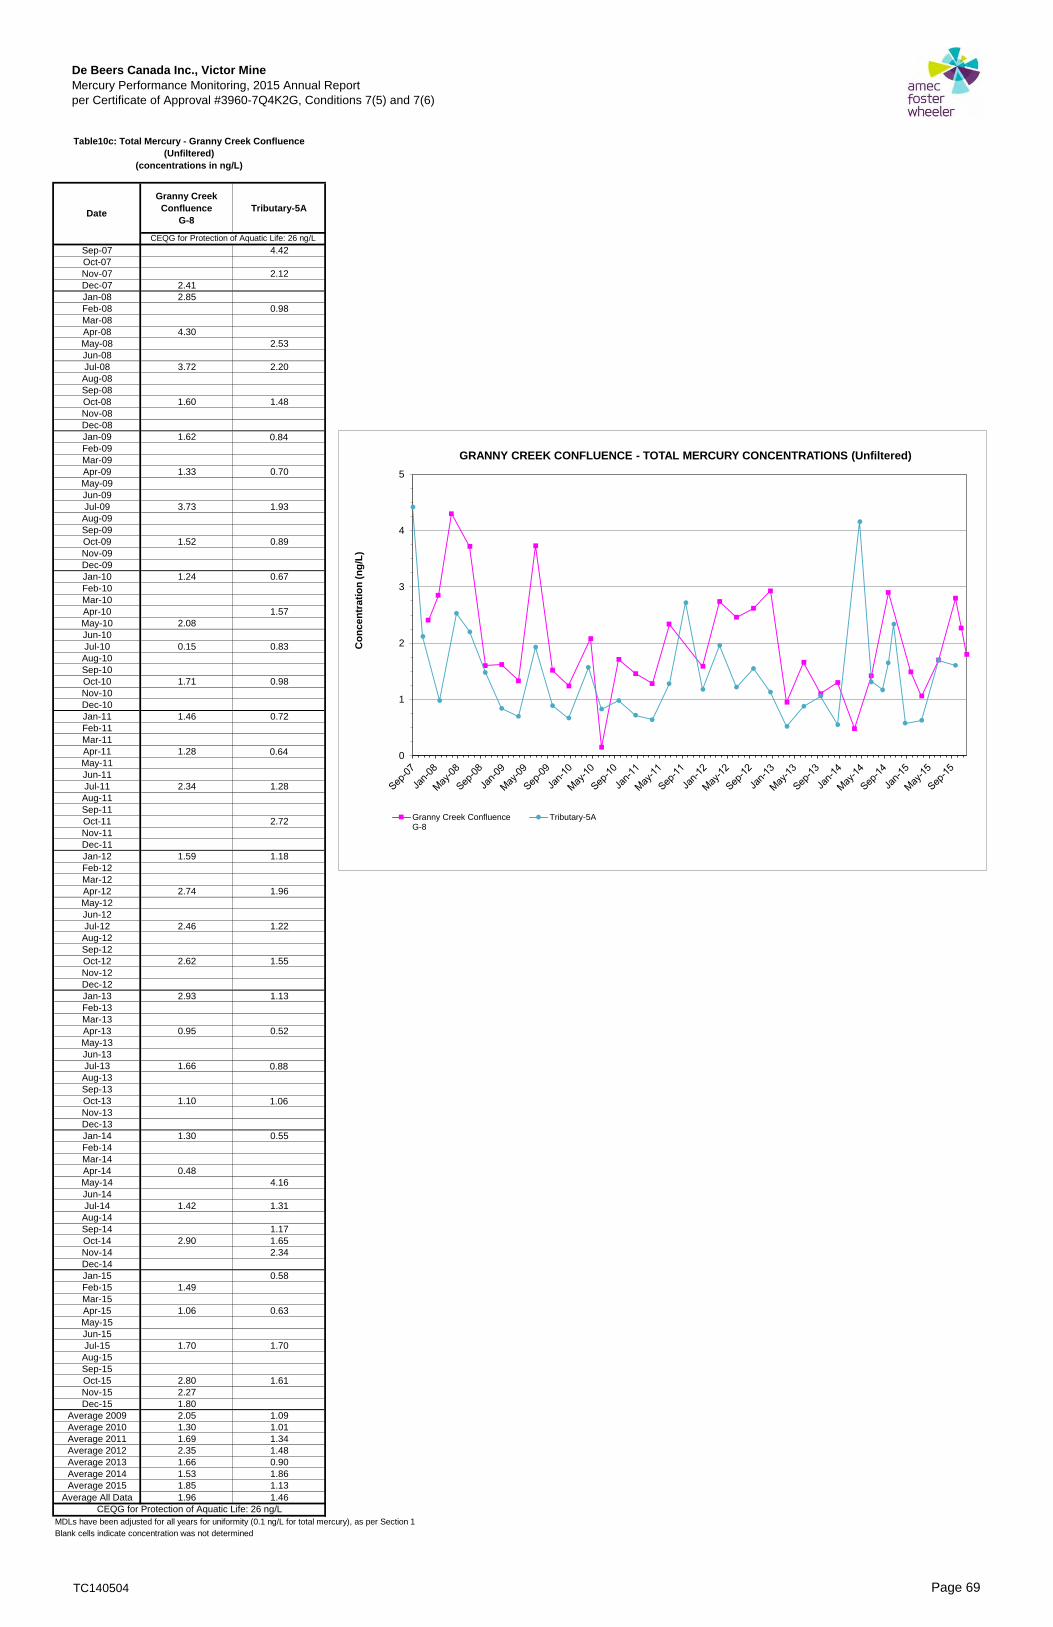
De Beers Canada Inc., Victor MineMercury Performance Monitoring, 2015 Annual Report
per Certificate of Approval #3960-7Q4K2G, Conditions 7(5) and 7(6)
Granny Creek Confluence
G-8Tributary-5A
Sep-07 4.42
Oct-07
Nov-07 2.12
Dec-07 2.41
Jan-08 2.85
Feb-08 0.98
Mar-08
Apr-08 4.30
May-08 2.53
Jun-08
Jul-08 3.72 2.20
Aug-08
Sep-08
Oct-08 1.60 1.48
Nov-08
Dec-08
Jan-09 1.62 0.84
Feb-09
Mar-09
Apr-09 1.33 0.70
May-09
Jun-09
Jul-09 3.73 1.93
Aug-09
Sep-09
Oct-09 1.52 0.89
Nov-09
Dec-09
Jan-10 1.24 0.67
Feb-10
Mar-10
Apr-10 1.57
May-10 2.08
Jun-10
Jul-10 0.15 0.83
Aug-10
Sep-10
Oct-10 1.71 0.98
Nov-10
Dec-10
Jan-11 1.46 0.72
Feb-11
Mar-11
Apr-11 1.28 0.64
May-11
Jun-11
Jul-11 2.34 1.28
Aug-11
Sep-11
Oct-11 2.72
Nov-11
Dec-11
Jan-12 1.59 1.18
Feb-12
Mar-12
Apr-12 2.74 1.96
May-12
Jun-12
Jul-12 2.46 1.22
Aug-12
Sep-12
Oct-12 2.62 1.55
Nov-12
Dec-12
Jan-13 2.93 1.13
Feb-13
Mar-13
Apr-13 0.95 0.52
May-13
Jun-13
Jul-13 1.66 0.88
Aug-13
Sep-13
Oct-13 1.10 1.06
Nov-13
Dec-13
Jan-14 1.30 0.55
Feb-14
Mar-14
Apr-14 0.48
May-14 4.16
Jun-14
Jul-14 1.42 1.31
Aug-14
Sep-14 1.17
Oct-14 2.90 1.65
Nov-14 2.34
Dec-14
Jan-15 0.58
Feb-15 1.49
Mar-15
Apr-15 1.06 0.63
May-15
Jun-15
Jul-15 1.70 1.70
Aug-15
Sep-15
Oct-15 2.80 1.61
Nov-15 2.27
Dec-15 1.80
Average 2009 2.05 1.09
Average 2010 1.30 1.01
Average 2011 1.69 1.34
Average 2012 2.35 1.48
Average 2013 1.66 0.90
Average 2014 1.53 1.86
Average 2015 1.85 1.13
Average All Data 1.96 1.46
MDLs have been adjusted for all years for uniformity (0.1 ng/L for total mercury), as per Section 1
Blank cells indicate concentration was not determined
Table10c: Total Mercury - Granny Creek Confluence (Unfiltered)
(concentrations in ng/L)
CEQG for Protection of Aquatic Life: 26 ng/L
Date
CEQG for Protection of Aquatic Life: 26 ng/L
0
1
2
3
4
5
Co
nce
ntr
atio
n (
ng
/L)
GRANNY CREEK CONFLUENCE - TOTAL MERCURY CONCENTRATIONS (Unfiltered)
Granny Creek ConfluenceG-8
Tributary-5A
TC140504 Page 69

De Beers Canada Inc., Victor MineMercury Performance Monitoring, 2015 Annual Report
per Certificate of Approval #3960-7Q4K2G, Conditions 7(5) and 7(6)
Date
N. Granny CreekUpstream
(NGC/UP/NWF)G-1
N. Granny CreekDownstream
(NGC/DN/NWF)G-2
N. Granny CreekDownstream
(NGC/DN/NEF)G-3
N. Granny CreekDownstream
(NGC/DN)G-4
Tributary-5A
May-06 0.87 0.90
Jun-06 2.91
Jul-06 2.33 2.22
Aug-06 3.43 3.03
Sep-06 1.64 1.70
Oct-06 1.30
Dec-06 1.98 3.98
Jan-07 1.06 1.23 1.40
Feb-07 0.75
Mar-07 7.05 5.74 F
Apr-07 4.19 4.19 2.50
May-07 2.40 2.40 2.56
Jun-07 2.51 2.81 2.64
Jul-07 2.96 1.97 2.10
Aug-07 1.52 1.90 1.81
Sep-07 1.96 1.94 1.75 4.05
Oct-07 5.19 5.60
Nov-07 2.91 3.01 2.74 1.97
Dec-07 2.05 2.22 2.18 2.10
Jan-08 1.42 1.65 1.63 1.85
Feb-08 1.91 1.74 1.60 0.73
Mar-08 1.76 1.64 1.63
Apr-08 1.84 2.57 F 3.29
May-08 3.16 3.27 3.21 2.21
Jun-08 2.74 2.81 2.72
Jul-08 2.95 2.94 1.49 4.17 2.16
Aug-08 2.39 2.42 2.34
Sep-08 1.35 1.88
Oct-08 1.19 1.44 1.40 1.55 1.16
Nov-08 2.28 2.23 2.15
Dec-08 1.30 1.72 1.65
Jan-09 1.33 1.20 1.27 1.25 0.59
Feb-09 1.15 1.18 1.05
Mar-09 1.15 1.05 1.40
Apr-09 1.56 0.96 1.09 0.53
May-09 2.43 2.12 2.34
Jun-09 3.24 3.16 3.19
Jul-09 2.57 2.37 2.93 2.19 1.47
Aug-09 1.66 1.69 1.69
Sep-09 1.54 1.63 1.63
Oct-09 1.45 1.65 1.38 1.45 0.69
Nov-09 1.51 1.51 1.45
Dec-09 0.97 0.99 0.68
Jan-10 1.07 1.12 1.11 1.00 <0.10
Feb-10 0.88 1.08 1.05
Mar-10 0.96 1.08 1.02
Apr-10 0.97 0.99 1.10 1.16
May-10 1.43 1.37 1.11 1.48
Jun-10 1.47 0.91 0.87
Jul-10 0.89 0.61 0.65 0.71 0.67
Aug-10 3.33 2.54 2.10
Sep-10 1.66 1.85 1.57
Oct-10 1.38 1.69 0.54 1.74 0.38
Nov-10 1.59 1.56 1.63
Dec-10 0.98 0.98 0.92
Jan-11 0.82 0.86 0.81 0.76 0.62
Feb-11 1.30 1.05 1.44
Mar-11 0.94 0.66 0.70
Apr-11 0.69 1.13 0.73 0.90 0.56
May-11 2.24 2.06 1.95
Jun-11 2.94 2.59 2.45
Jul-11 1.19 1.42 1.85 1.69 0.98
Aug-11 0.73 0.86 0.84
**Sep-11
Oct-11 2.96 2.56 2.36 3.19 2.01
Nov-11 2.53 2.59 2.40
Dec-11 1.05 1.22 1.20
Jan-12 0.93 0.87 0.52
Feb-12 0.46 0.41 0.38
Mar-12 0.42 0.33* 0.34
Apr-12 1.62 1.93 1.39
May-12 1.66 1.56 1.56
Jun-12 3.47 3.26 3.16
Jul-12 1.54 1.52 1.60 1.64 0.84
Aug-12 0.86 0.97 0.98
Sep-12 1.13 1.51 1.46
Oct-12 1.91 1.47 1.10
Nov-12 1.94 3.10
Dec-12 1.59 1.58 1.88
Jan-13 1.85 1.78 0.62
Feb-13 1.27 1.30 1.13
Mar-13 0.86 0.86 0.79
Apr-13 0.82 0.79 0.82 0.64 0.44
May-13 3.25 3.20 2.86
Jun-13 2.86 2.90 2.72
Jul-13 0.80 0.90 0.90 0.70 0.50
Aug-13 0.79 1.06 0.82
Sep-13 1.27 1.71 1.69
Oct-13 0.83 0.98 0.91 0.76 0.88
Nov-13 0.76 0.73 0.71
Dec-13 0.72 1.31 0.56
Jan-14 0.68 0.74 0.63 1.00 0.26
Feb-14 0.82 1.15 0.80
Mar-14 0.70 0.62 0.58
Apr-14 0.90 0.73 0.46 0.62
May-14 2.19 3.04 1.21 2.46
Jun-14 3.54 3.34 3.12
Jul-14 1.94 2.17 2.07 1.13 1.11
Aug-14 0.99 0.93 0.87
Sep-14 1.61 2.18 2.16 1.01
Oct-14 4.04 3.44 2.67 3.33 1.30
Nov-14 2.84 2.90 2.73 1.45
Dec-14 1.35 2.02
Jan-15 1.30 1.11 1.06 0.58
Feb-15 1.08 0.83 0.86
Mar-15 1.80 1.73 1.63
Apr-15 2.37 0.80 0.96 0.70 0.18
May-15 3.48 3.20 2.94
Jun-15 3.40 0.25 2.75
Jul-15 3.97 3.02 4.00 3.64 1.42
Aug-15 2.89 2.84 3.60
Sep-15 5.74 2.03 2.42
Oct-15 1.60 1.67 1.81 1.45 1.04
Nov-15 1.64 1.66 1.51 1.72
Dec-15 1.58 1.58 1.51 1.85
Average 2009 1.71 1.63 1.68 1.63 0.82
Average 2010 1.38 1.32 1.14 1.23 <0.58
Average 2011 1.58 1.55 1.52 1.64 1.04
Average 2012 1.39 1.56 1.61 1.48 0.96
Average 2013 1.29 1.47 1.26 0.97 0.61
Average 2014 1.84 1.88 1.61 1.52 1.27
Average 2015 2.69 1.74 2.09 1.74 0.81
Average All Data 1.90 1.79 1.72 1.64 <1.09
* Samples excluded from annual average calculation
** Samples discarded due to lab miscommunication
F = Frozen (no sample)
MDLs have been adjusted for all years for uniformity (0.1 ng/L for total mercury), as per Section 1.
Blank cells indicate concentration was not determined.
North Granny Creek receives effluent from the PKC facility
Table 11a: Total Mercury - North Granny Creek (Filtered)(concentrations in ng/L)
0
1
2
3
4
5
6
7
8C
on
cen
trat
ion
(n
g/L
)
NORTH GRANNY CREEK - TOTAL MERCURY CONCENTRATIONS (Filtered)
N. Granny CreekUpstream(NGC/UP/NWF)G-1
N. Granny CreekDownstream(NGC/DN/NWF)G-2
N. Granny CreekDownstream(NGC/DN/NEF)G-3
N. Granny CreekDownstream(NGC/DN)G-4
Tributary-5A
TC140504 Page 70

De Beers Canada Inc., Victor MineMercury Performance Monitoring, 2015 Annual Report
per Certificate of Approval #3960-7Q4K2G, Conditions 7(5) and 7(6)
Date
S. Granny CreekUpstream
(SGC/UP/SWF)G-5
S. Granny CreekDownstream
(SGC/DS/SWF)G-6
S. Granny CreekDownstream
(SGC/DS)G-7
Tributary-5A
May-06 0.55 0.90
Jun-06 2.83
Jul-06 2.07 1.94
Aug-06 2.07 1.94
Sep-06 1.34 2.11
Oct-06 1.11 0.97
Dec-06 1.92 1.58
Jan-07 2.01 3.37
Feb-07 0.79 1.90
Mar-07 F 2.92
Apr-07 1.96 1.84
May-07 2.40 1.83
Jun-07 2.26 1.79
Jul-07 2.32 2.01
Aug-07 1.70
Sep-07 3.87 1.49 4.05
Oct-07 4.76 3.42
Nov-07 2.45 2.16 1.97
Dec-07 2.35 2.61 1.48
Jan-08 2.21 2.33 2.49
Feb-08 2.24 2.08 0.73
Mar-08 1.76 1.98
Apr-08 1.63 2.06 0.78
May-08 2.90 2.97 2.21
Jun-08 2.29 2.36
Jul-08 2.84 2.32 2.48 2.16
Aug-08 2.23 2.06
Sep-08 1.62 1.60
Oct-08 1.88 1.27 1.34 1.16
Nov-08 1.73
Dec-08 1.77 1.71
Jan-09 2.05 1.34 1.35 0.59
Feb-09 1.68 1.19
Mar-09 1.75 1.22
Apr-09 1.34 1.78 1.19 0.53
May-09 1.98 2.19
Jun-09 2.75 2.71
Jul-09 2.20 1.96 2.07 1.47
Aug-09 1.80 1.59
Sep-09 1.39 1.39
Oct-09 1.01 1.08 1.02 0.69
Nov-09 2.01 0.80
Dec-09 0.95 0.75
Jan-10 1.29 1.31 1.05 <0.10
Feb-10 1.37 1.32
Mar-10 1.11 1.23
Apr-10 1.14 1.07 1.16
May-10 1.54 1.45 1.42
Jun-10 0.68 0.60
Jul-10 0.50 0.70 0.08 0.67
Aug-10 2.72 2.25
Sep-10 1.69 1.48
Oct-10 1.71 1.61 1.54 0.38
Nov-10 1.61 1.54
Dec-10 1.08 0.95
Jan-11 1.07 1.02 0.96 0.62
Feb-11 1.65 1.02
Mar-11 0.75 0.69
Apr-11 0.77 0.76 1.04 0.56
May-11 1.85 1.83
Jun-11 2.13 2.16
Jul-11 1.72 1.16 1.81 0.98
Aug-11 1.09 1.10
**Sep-11
Oct-11 2.71 2.30 2.71 2.01
Nov-11 2.45 1.95
Dec-11 1.67 1.21
Jan-12 1.68 0.99 0.68 0.52
Feb-12 1.03 0.49
Mar-12 0.41 0.38
Apr-12 1.84 1.44 1.45 1.39
May-12 1.58 1.52
Jun-12 2.63 2.28
Jul-12 1.57 1.61 1.44 0.84
Aug-12 1.30 1.02
Sep-12 2.09 2.09
Oct-12 2.13 1.48 1.40 1.10
Nov-12 1.94 1.81
Dec-12 1.67 1.49
Jan-13 1.50 1.10 1.85 0.62
Feb-13 1.56 1.29
Mar-13 1.08 0.81
Apr-13 0.70 0.82 0.57 0.44
May-13 2.05 2.59
Jun-13 2.58 2.20
Jul-13 1.00 1.20 0.90 0.50
Aug-13 0.73 1.09
Sep-13 1.10 1.37
Oct-13 0.69 0.85 0.78 0.88
Nov-13 1.00 0.10
Dec-13 0.63 0.72
Jan-14 0.59 0.64 0.49 0.26
Feb-14 0.78 0.85
Mar-14 0.31 0.65
Apr-14 0.44 0.70 0.56
May-14 3.27 2.76 2.46
Jun-14 2.51 2.81
Jul-14 1.47 1.99 1.55 1.11
Aug-14 1.13 0.75
Sep-14 1.49 1.65 1.01
Oct-14 3.27 3.19 1.70 1.30
Nov-14 2.68 1.87 1.45
Dec-14
Jan-15 1.41 1.19 0.94 0.58
Feb-15 1.17 1.07
Mar-15 1.78 1.78
Apr-15 0.63 0.92 0.73 0.18
May-15 3.08 2.02
Jun-15 2.35 2.77
Jul-15 2.10 1.95 2.67 1.42
Aug-15 2.68 3.00
Sep-15 3.08 2.53
Oct-15 1.83 1.92 1.47 1.04
Nov-15 2.21 1.46 1.28
Dec-15 1.73 1.67 1.80
Average 2009 1.74 1.50 1.41 0.82
Average 2010 1.37 1.29 1.02 <0.58
Average 2011 1.62 1.38 1.63 1.04
Average 2012 1.66 1.38 1.24 0.96
Average 2013 1.22 1.18 1.03 0.61
Average 2014 1.63 1.62 1.08 1.27
Average 2015 2.00 1.86 1.48 0.81
Average All Data 1.74 1.62 1.34 <1.09
** Samples discarded due to lab miscommunication
F = Frozen (no sample)
MDLs have been adjusted for all years for uniformity (0.1 ng/L for total mercury), as per Section 1.
Blank cells indicate concentration was not determined.
Table 11b: Total Mercury - South Granny Creek (Filtered)(concentrations in ng/L)
0
1
2
3
4
5
Co
nce
ntr
atio
n (
ng
/L)
SOUTH GRANNY CREEK - TOTAL MERCURY CONCENTRATIONS (Filtered)
S. Granny CreekUpstream(SGC/UP/SWF)G-5
S. Granny CreekDownstream(SGC/DS/SWF)G-6
S. Granny CreekDownstream(SGC/DS)G-7
Tributary-5A
TC140504 Page 71

De Beers Canada Inc., Victor MineMercury Performance Monitoring, 2015 Annual Report
per Certificate of Approval #3960-7Q4K2G, Conditions 7(5) and 7(6)
DateGranny Creek
ConfluenceG-8
Tributary-5A
Sep-07 4.05
Oct-07
Nov-07 1.97
Dec-07 2.15
Jan-08 2.11
Feb-08 0.73
Mar-08
Apr-08 3.65
May-08 2.21
Jun-08
Jul-08 3.24 2.16
Aug-08
Sep-08
Oct-08 1.43 1.16
Nov-08
Dec-08
Jan-09 1.37 0.59
Feb-09
Mar-09
Apr-09 1.03 0.53
May-09
Jun-09
Jul-09 2.22 1.47
Aug-09
Sep-09
Oct-09 1.27 0.69
Nov-09
Dec-09
Jan-10 0.89 <0.10
Feb-10
Mar-10
Apr-10 1.16
May-10 1.31
Jun-10
Jul-10 0.11 0.67
Aug-10
Sep-10
Oct-10 1.23 0.38
Nov-10
Dec-10
Jan-11 0.89 0.62
Feb-11
Mar-11
Apr-11 1.19 0.56
May-11
Jun-11
Jul-11 1.63 0.98
Aug-11
**Sep-11
Oct-11 1.24 2.01
Nov-11
Dec-11
Jan-12 0.85 0.52
Feb-12
Mar-12
Apr-12 1.77 1.39
May-12
Jun-12
Jul-12 1.59 0.84
Aug-12
Sep-12
Oct-12 1.54 1.10
Nov-12
Dec-12
Jan-13 1.87 0.62
Feb-13
Mar-13
Apr-13 0.53 0.44
May-13
Jun-13
Jul-13 1.00 0.50
Aug-13
Sep-13
Oct-13 0.68 0.88
Nov-13
Dec-13
Jan-14 0.69 0.26
Feb-14
Mar-14
Apr-14 0.39
May-14 2.46
Jun-14
Jul-14 1.07 1.11
Aug-14
Sep-14 1.01
Oct-14 1.86 1.30
Nov-14 1.45
Dec-14
Jan-15 0.58
Feb-15 0.94
Mar-15
Apr-15 0.64 0.18
May-15
Jun-15
Jul-15 1.60 1.42
Aug-15
Sep-15
Oct-15 1.62 1.04
Nov-15 1.07
Dec-15 1.55
Average 2009 1.47 0.82
Average 2010 0.89 <0.58
Average 2011 1.24 1.04
Average 2012 1.44 0.96
Average 2013 1.02 0.61
Average 2014 1.00 1.27
Average 2015 1.24 0.81
Average All Data 1.38 <1.09
** Samples discarded due to lab miscommunication
MDLs have been adjusted for all years for uniformity (0.1 ng/L for total mercury), as per Section 1
Blank cells indicate concentration was not determined
Table 11c: Total Mercury - Granny Creek Confluence (Filtered)
(concentrations in ng/L)
0
1
2
3
4
5
Co
nce
ntr
atio
n (
ng
/L)
GRANNY CREEK CONFLUENCE - TOTAL MERCURY CONCENTRATIONS (Filtered)
Granny Creek ConfluenceG-8
Tributary-5A
TC140504 Page 72

De Beers Canada Inc., Victor MineMercury Performance Monitoring, 2015 Annual Report
per Certificate of Approval #3960-7Q4K2G, Conditions 7(5) and 7(6)
N. Granny CreekUpstream
(NGC/UP/NWF)G-1
N. Granny CreekDownstream
(NGC/DN/NWF)G-2
N. Granny CreekDownstream
(NGC/DN/NEF)G-3
N. Granny CreekDownstream
(NGC/DN)G-4
Tributary-5A
Jul-06 0.11 0.10
Oct-06 0.13
Jan-07 0.12 0.18
Feb-07
Mar-07
Apr-07
May-07 0.07 0.09
Jun-07
Jul-07 0.09 0.07 0.10
Aug-07
Sep-07 0.08
Oct-07 0.09 0.15 0.10
Nov-07 0.03
Dec-07 0.20
Jan-08 <0.02 0.26 0.24
Feb-08 0.09 0.47 <0.02 0.12
Mar-08 <0.02 0.29
Apr-08 0.44 1.44 0.13 0.15
May-08 0.20
Jun-08
Jul-08 0.09 0.09 0.52 0.52 0.03
Aug-08
Sep-08
Oct-08 0.04 0.07 0.11 0.18 <0.02
Nov-08
Dec-08
Jan-09 0.04 0.04 0.08 0.06 0.03
Feb-09
Mar-09
Apr-09 0.04 <0.02 <0.02 <0.02
May-09
Jun-09
Jul-09 0.06 0.02 0.02 <0.02 0.04
Aug-09
Sep-09
Oct-09 <0.02 0.07 0.07 0.14 0.03
Nov-09
Dec-09
Jan-10 0.19 0.11 0.11 0.14 0.06
Feb-10
Mar-10
Apr-10 0.06 0.10 0.10 <0.02 0.05
May-10 0.03
Jun-10
Jul-10 0.06 0.04 0.19 1.13 0.07
Aug-10
Sep-10
Oct-10 0.07 0.12 0.16 0.19 0.02
Nov-10
Dec-10
Jan-11 0.07 0.07 0.09 0.11 0.02
Feb-11
Mar-11
Apr-11 <0.02 <0.02 0.06 <0.02 0.02
May-11 0.05 0.13
Jun-11 0.07 0.11
Jul-11 0.06 0.21 0.35 0.48 0.04
Aug-11 0.10 0.56 0.53
Sep-11
Oct-11 <0.02 0.21 0.30 0.03
Nov-11 0.11 0.16
Dec-11 0.08 0.17
Jan-12 0.09 0.18 0.08 0.09
Feb-12 0.03 0.08 0.07
Mar-12 0.03 0.05 0.04
Apr-12 0.07 0.22 0.08 0.05
May-12 0.05 0.09 0.11
Jun-12 0.05 0.10 0.12
Jul-12 0.06 0.20 0.24 0.28 0.04
Aug-12 0.02 0.40
Sep-12 0.07 0.47
Oct-12 0.16 0.19 0.27 <0.02
Nov-12 1.58
Dec-12 0.12 0.13
Jan-13 0.03 0.11 0.03
Feb-13 0.04 0.06 0.09
Mar-13 0.04 0.04 0.09
Apr-13 0.11 0.06 0.14 0.08 0.04
May-13 0.06 0.09
Jun-13 0.06 0.13
Jul-13 0.07 0.27 0.30 0.28 0.06
Aug-13 0.08 0.43 0.52
Sep-13 0.14 0.49 0.43
Oct-13 0.22 0.39 0.30 0.47 <0.02
Nov-13 0.05 0.12 0.16
Dec-13 0.03 0.09 0.14
Jan-14 <0.02 0.06 0.11 0.11 0.06
Feb-14 0.05 0.06 0.05
Mar-14 0.05 0.17 0.08
Apr-14 0.15 0.06 0.05 0.13
May-14 0.10 0.44 0.26 0.04
Jun-14 0.08 0.18 0.18
Jul-14 0.17 0.29 0.31 0.36 0.02
Aug-14 0.32 0.25 0.24
Sep-14 0.50 0.49 0.41 0.02
Oct-14 0.14 0.15 0.18 0.19 0.02
Nov-14 0.08 0.13 0.15 0.03
Dec-14 0.13 0.13
Jan-15 0.07 0.13 0.13 0.03
Feb-15 0.12 0.13 0.14
Mar-15 0.10 0.14 0.09
Apr-15 0.04 0.05 0.06 0.05 <0.02
May-15 0.05 0.04 0.06
Jun-15 0.08 0.09 0.09
Jul-15 0.16 0.25 2.31 0.73 0.04
Aug-15 0.25 0.49 1.55
Sep-15 0.15 0.65 1.29
Oct-15 0.12 0.08 0.29 0.29 <0.02
Nov-15 0.07 0.09 0.13 0.25
Dec-15 0.08 0.11 0.15 0.17
2009 Average <0.04 <0.04 <0.05 <0.07 <0.03
2010 Average 0.09 0.09 0.14 0.30 0.05
2011 Average <0.06 <0.18 0.26 <0.23 0.03
2012 Average 0.05 0.28 0.14 0.18 <0.05
2013 Average 0.08 0.18 0.24 0.24 <0.04
2014 Average <0.15 0.20 0.18 0.20 0.03
2015 Average 0.11 0.18 0.52 0.27 <0.03
Average All Years <0.09 <0.21 <0.24 <0.23 <0.04
Quarterly sampling in accordance with Amended C. of A. #3960-7Q4K2G
MDLs have been adjusted for all years for uniformity (0.02 ng/L for methyl mercury), as per Section 1.
Blank cells indicate concentration was not determined.
North Granny Creek receives effluent from the PKC facility
TABLE 12aMETHYL MERCURY - NORTH GRANNY CREEK (Unfiltered)
(concentrations in ng/L)
CEQG for Protection of Aquatic Life: 4 ng/L
Date
CEQG for Protection of Aquatic Life: 4 ng/L
0.0
0.5
1.0
1.5
2.0
2.5
Co
nce
ntr
atio
n (
ng
/L)
NORTH GRANNY CREEK - METHYL MERCURY CONCENTRATIONS (Unfiltered)
N. Granny CreekUpstream(NGC/UP/NWF)G-1
N. Granny CreekDownstream(NGC/DN/NWF)G-2
N. Granny CreekDownstream(NGC/DN/NEF)G-3
N. Granny CreekDownstream(NGC/DN)G-4
Tributary-5A
TC140504 Page 73

De Beers Canada Inc., Victor MineMercury Performance Monitoring, 2015 Annual Report
per Certificate of Approval #3960-7Q4K2G, Conditions 7(5) and 7(6)
S. Granny CreekUpstream
(SGC/UP/SWF)G-5
S. Granny CreekDownstream
(SGC/DS/SWF)G-6
S. Granny CreekDownstream
(SGC/DS)G-7
Tributary-5A
Jul-06 0.06 0.04
Oct-06 0.03 0.11
Jan-07 0.10 0.13
Feb-07
Mar-07
Apr-07
May-07 0.04 0.06
Jun-07
Jul-07 0.05 0.05
Aug-07
Sep-07 0.08
Oct-07 0.05 0.07
Nov-07 0.03
Dec-07 0.13
Jan-08 0.17
Feb-08 0.17 0.11 0.12
Mar-08
Apr-08 0.06 0.15 0.35
May-08 0.20
Jun-08
Jul-08 0.06 0.07 0.26 0.03
Aug-08
Sep-08
Oct-08 0.02 0.04 0.10 <0.02
Nov-08
Dec-08
Jan-09 <0.02 0.06 0.04 0.03
Feb-09
Mar-09
Apr-09 0.08 0.06 0.04 <0.02
May-09
Jun-09
Jul-09 <0.02 0.05 0.03 0.04
Aug-09
Sep-09
Oct-09 <0.02 <0.02 0.23 0.03
Nov-09
Dec-09
Jan-10 0.06 0.07 0.11 0.06
Feb-10
Mar-10
Apr-10 0.05 0.08 <0.02 0.05
May-10 0.11
Jun-10
Jul-10 0.06 0.08 1.22 0.07
Aug-10
Sep-10
Oct-10 0.04 0.07 0.15 0.02
Nov-10
Dec-10
Jan-11 0.03 0.17 0.11 0.02
Feb-11
Mar-11
Apr-11 0.09 <0.02 <0.02 0.02
May-11
Jun-11
Jul-11 0.05 0.14 0.46 0.04
Aug-11
Sep-11
Oct-11 0.04 0.23 0.03 0.03
Nov-11
Dec-11
Jan-12 0.25 0.07 0.10 0.09
Feb-12
Mar-12
Apr-12 0.08 0.07 0.08 0.05
May-12
Jun-12
Jul-12 0.07 0.17 0.19 0.04
Aug-12
Sep-12
Oct-12 0.03 0.09 0.37 <0.02
Nov-12
Dec-12
Jan-13 0.06 0.08 0.09 0.03
Feb-13 0.08 0.08
Mar-13 0.07 0.05
Apr-13 0.09 0.10 0.05 0.04
May-13
Jun-13
Jul-13 0.07 0.49 0.67 0.06
Aug-13
Sep-13
Oct-13 0.06 0.25 0.33 <0.02
Nov-13
Dec-13
Jan-14 0.11 0.06 0.13 0.06
Feb-14 0.07 0.05
Mar-14
Apr-14 0.08 0.03 0.08
May-14 0.04
Jun-14
Jul-14 0.19 0.06 1.26 0.02
Aug-14 0.08 0.26
Sep-14 0.05 0.43 0.02
Oct-14 0.14 0.04 0.23 0.02
Nov-14 0.05 0.29 0.03
Dec-14
Jan-15 0.05 0.11 0.22 0.03
Feb-15 0.08 0.17
Mar-15 0.06 0.07
Apr-15 0.05 0.05 0.07 <0.02
May-15 0.03 0.05
Jun-15 0.11 0.04
Jul-15 0.32 0.32 0.49 0.04
Aug-15 0.07 0.75
Sep-15
Oct-15 0.05 0.41 0.36 <0.02
Nov-15 0.73 0.13 0.31
Dec-15 0.04 0.13 0.22
2009 Average <0.04 <0.05 0.09 <0.03
2010 Average 0.05 0.08 0.32 0.05
2011 Average 0.05 <0.14 <0.15 0.03
2012 Average 0.11 0.10 0.18 <0.05
2013 Average 0.07 0.17 <0.29 <0.04
2014 Average 0.10 0.15 0.42 0.03
2015 Average 0.14 0.20 0.28 <0.03
Average All Years <0.09 <0.13 <0.24 <0.04
Quarterly sampling in accordance with Amended C. of A. #3960-7Q4K2G
MDLs have been adjusted for all years for uniformity (0.02 ng/L for methyl mercury), as per Section 1.
Blank cells indicate concentration was not determined.
TABLE 12bMETHYL MERCURY - SOUTH GRANNY CREEK (Unfiltered)
(concentrations in ng/L)
Date
CEQG for Protection of Aquatic Life: 4 ng/L
CEQG for Protection of Aquatic Life: 4 ng/L
0.0
0.1
0.2
0.3
0.4
0.5
0.6
0.7
0.8C
on
cen
trat
ion
(n
g/L
)
SOUTH GRANNY CREEK - METHYL MERCURY CONCENTRATIONS (Unfiltered)
S. Granny CreekUpstream(SGC/UP/SWF)G-5
S. Granny CreekDownstream(SGC/DS/SWF)G-6
S. Granny CreekDownstream(SGC/DS)G-7
Tributary-5A
TC140504 Page 74

De Beers Canada Inc., Victor MineMercury Performance Monitoring, 2015 Annual Report
per Certificate of Approval #3960-7Q4K2G, Conditions 7(5) and 7(6)
Granny CreekConfluence
G-8Tributary-5A
Sep-07 0.08
Oct-07
Nov-07 0.03
Dec-07 0.16
Jan-08 0.15
Feb-08 0.12
Mar-08
Apr-08 0.11
May-08 <0.20
Jun-08
Jul-08 0.33 0.03
Aug-08
Sep-08
Oct-08 0.14 <0.02
Nov-08
Dec-08
Jan-09 0.06 0.03
Feb-09
Mar-09
Apr-09 0.04 0.02
May-09
Jun-09
Jul-09 0.07 0.04
Aug-09
Sep-09
Oct-09 0.12 0.03
Nov-09
Dec-09
Jan-10 0.09 0.06
Feb-10
Mar-10
Apr-10 0.02 0.05
May-10 0.09
Jun-10
Jul-10 1.23 0.07
Aug-10
Sep-10
Oct-10 0.14 0.02
Nov-10
Dec-10
Jan-11 0.16 0.02
Feb-11
Mar-11
Apr-11 <0.02 0.02
May-11
Jun-11
Jul-11 0.39 0.04
Aug-11
**Sep-11
Oct-11 0.03
Nov-11
Dec-11
Jan-12 0.17 0.09
Feb-12
Mar-12
Apr-12 0.12 0.05
May-12
Jun-12
Jul-12 0.27 0.04
Aug-12
Sep-12
Oct-12 0.18 <0.02
Nov-12
Dec-12
Jan-13 0.07 0.03
Feb-13
Mar-13
Apr-13 0.10 0.04
May-13
Jun-13
Jul-13 0.27 0.06
Aug-13
Sep-13
Oct-13 0.27 <0.02
Nov-13
Dec-13
Jan-14 0.13 0.06
Feb-14
Mar-14
Apr-14 0.03
May-14 0.04
Jun-14
Jul-14 0.07 0.02
Aug-14
Sep-14 0.02
Oct-14 0.04 0.02
Nov-14 0.03
Dec-14
Jan-15 0.03
Feb-15 0.18
Mar-15
Apr-15 0.07 <0.02
May-15
Jun-15
Jul-15 0.07 0.04
Aug-15
Sep-15
Oct-15 0.33 <0.02
Nov-15 0.23
Dec-15 0.16
Average 2009 0.07 0.04
Average 2010 0.31 0.05
Average 2011 <0.19 0.03
Average 2012 0.18 <0.05
Average 2013 0.18 <0.04
Average 2014 0.07 0.03
Average 2015 0.17 <0.03
Average All Data <0.17 <0.04
Quarterly sampling in accordance with Amended C. of A. #3960-7Q4K2G
MDLs have been adjusted for all years for uniformity (0.02 ng/L for methyl mercury), as per Section 1.
Blank cells indicate concentration was not determined.
TABLE 12cMETHYL MERCURY - GRANNY CREEK CONFLUENCE
(Unfiltered)(concentrations in ng/L)
CEQG for Protection of Aquatic Life: 4 ng/L
Date
CEQG for Protection of Aquatic Life: 4 ng/L
0.0
0.1
0.2
0.3
0.4
0.5C
on
cen
trat
ion
(n
g/L
)
GRANNY CREEK CONFLUENCE - METHLY MERCURY CONCENTRATIONS (Unfiltered)
Granny CreekConfluenceG-8
Tributary-5A
TC140504 Page 75
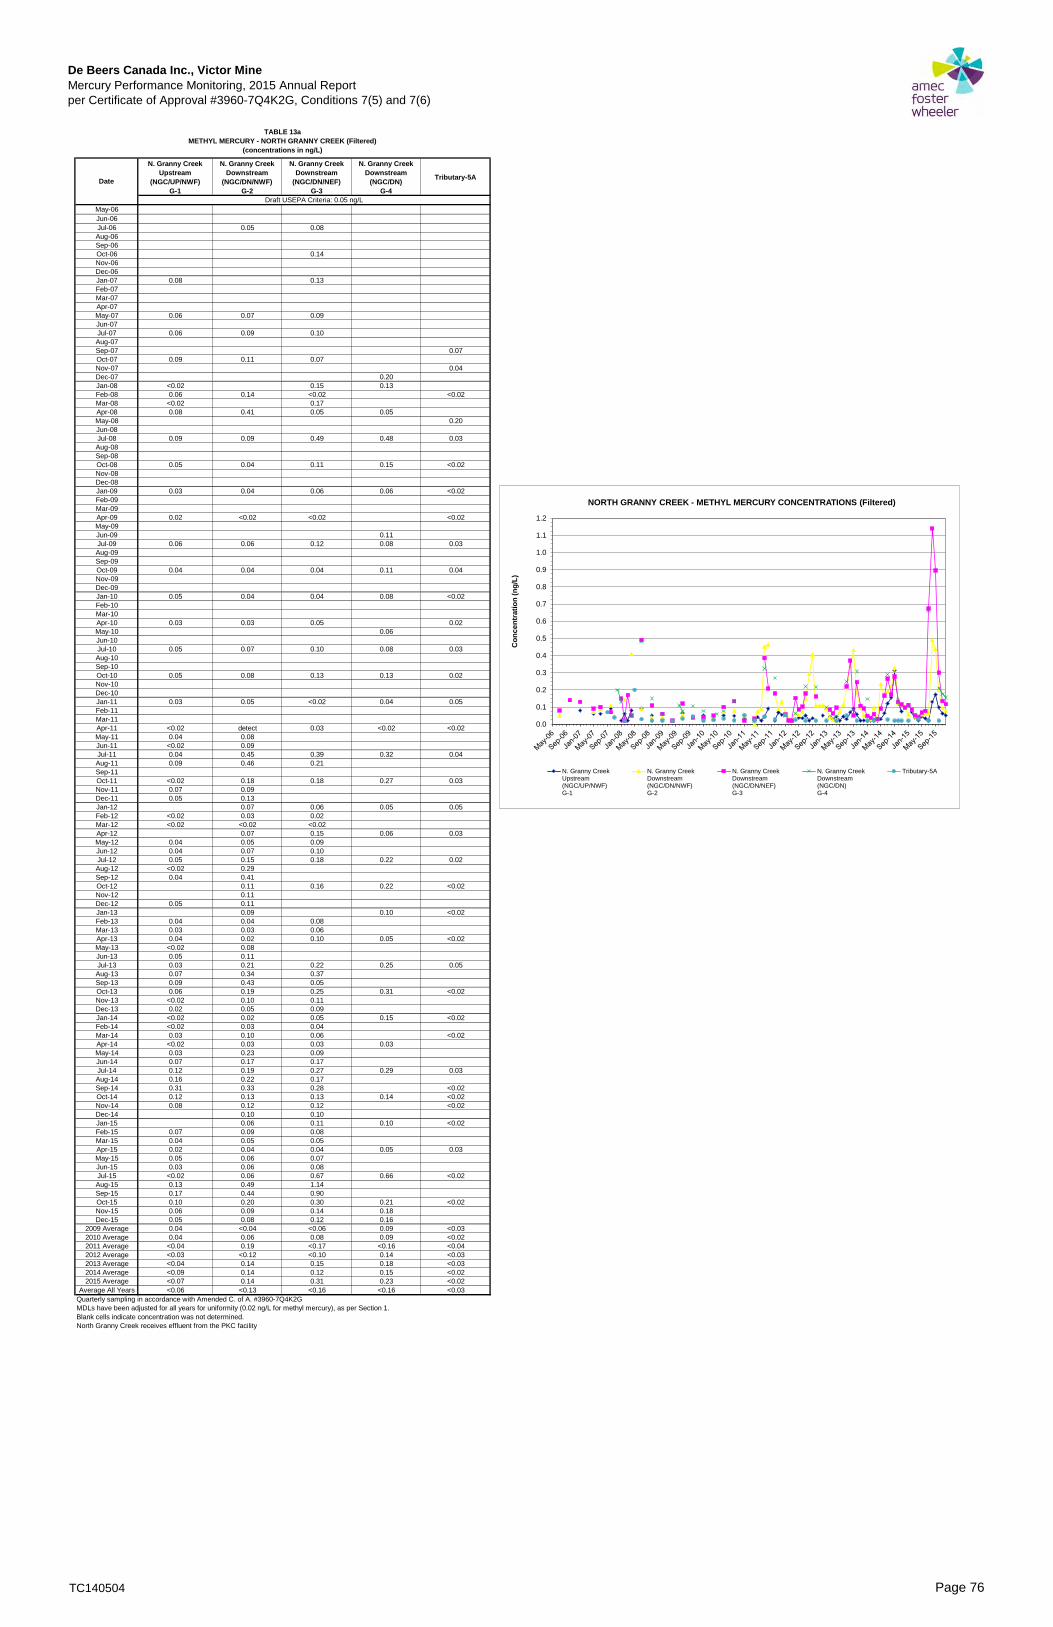
De Beers Canada Inc., Victor MineMercury Performance Monitoring, 2015 Annual Report
per Certificate of Approval #3960-7Q4K2G, Conditions 7(5) and 7(6)
N. Granny CreekUpstream
(NGC/UP/NWF)G-1
N. Granny CreekDownstream
(NGC/DN/NWF)G-2
N. Granny CreekDownstream
(NGC/DN/NEF)G-3
N. Granny CreekDownstream
(NGC/DN)G-4
Tributary-5A
May-06
Jun-06
Jul-06 0.05 0.08
Aug-06
Sep-06
Oct-06 0.14
Nov-06
Dec-06
Jan-07 0.08 0.13
Feb-07
Mar-07
Apr-07
May-07 0.06 0.07 0.09
Jun-07
Jul-07 0.06 0.09 0.10
Aug-07
Sep-07 0.07
Oct-07 0.09 0.11 0.07
Nov-07 0.04
Dec-07 0.20
Jan-08 <0.02 0.15 0.13
Feb-08 0.06 0.14 <0.02 <0.02
Mar-08 <0.02 0.17
Apr-08 0.08 0.41 0.05 0.05
May-08 0.20
Jun-08
Jul-08 0.09 0.09 0.49 0.48 0.03
Aug-08
Sep-08
Oct-08 0.05 0.04 0.11 0.15 <0.02
Nov-08
Dec-08
Jan-09 0.03 0.04 0.06 0.06 <0.02
Feb-09
Mar-09
Apr-09 0.02 <0.02 <0.02 <0.02
May-09
Jun-09 0.11
Jul-09 0.06 0.06 0.12 0.08 0.03
Aug-09
Sep-09
Oct-09 0.04 0.04 0.04 0.11 0.04
Nov-09
Dec-09
Jan-10 0.05 0.04 0.04 0.08 <0.02
Feb-10
Mar-10
Apr-10 0.03 0.03 0.05 0.02
May-10 0.06
Jun-10
Jul-10 0.05 0.07 0.10 0.08 0.03
Aug-10
Sep-10
Oct-10 0.05 0.08 0.13 0.13 0.02
Nov-10
Dec-10
Jan-11 0.03 0.05 <0.02 0.04 0.05
Feb-11
Mar-11
Apr-11 <0.02 detect 0.03 <0.02 <0.02
May-11 0.04 0.08
Jun-11 <0.02 0.09
Jul-11 0.04 0.45 0.39 0.32 0.04
Aug-11 0.09 0.46 0.21
Sep-11
Oct-11 <0.02 0.18 0.18 0.27 0.03
Nov-11 0.07 0.09
Dec-11 0.05 0.13
Jan-12 0.07 0.06 0.05 0.05
Feb-12 <0.02 0.03 0.02
Mar-12 <0.02 <0.02 <0.02
Apr-12 0.07 0.15 0.06 0.03
May-12 0.04 0.05 0.09
Jun-12 0.04 0.07 0.10
Jul-12 0.05 0.15 0.18 0.22 0.02
Aug-12 <0.02 0.29
Sep-12 0.04 0.41
Oct-12 0.11 0.16 0.22 <0.02
Nov-12 0.11
Dec-12 0.05 0.11
Jan-13 0.09 0.10 <0.02
Feb-13 0.04 0.04 0.08
Mar-13 0.03 0.03 0.06
Apr-13 0.04 0.02 0.10 0.05 <0.02
May-13 <0.02 0.08
Jun-13 0.05 0.11
Jul-13 0.03 0.21 0.22 0.25 0.05
Aug-13 0.07 0.34 0.37
Sep-13 0.09 0.43 0.05
Oct-13 0.06 0.19 0.25 0.31 <0.02
Nov-13 <0.02 0.10 0.11
Dec-13 0.02 0.05 0.09
Jan-14 <0.02 0.02 0.05 0.15 <0.02
Feb-14 <0.02 0.03 0.04
Mar-14 0.03 0.10 0.06 <0.02
Apr-14 <0.02 0.03 0.03 0.03
May-14 0.03 0.23 0.09
Jun-14 0.07 0.17 0.17
Jul-14 0.12 0.19 0.27 0.29 0.03
Aug-14 0.16 0.22 0.17
Sep-14 0.31 0.33 0.28 <0.02
Oct-14 0.12 0.13 0.13 0.14 <0.02
Nov-14 0.08 0.12 0.12 <0.02
Dec-14 0.10 0.10
Jan-15 0.06 0.11 0.10 <0.02
Feb-15 0.07 0.09 0.08
Mar-15 0.04 0.05 0.05
Apr-15 0.02 0.04 0.04 0.05 0.03
May-15 0.05 0.06 0.07
Jun-15 0.03 0.06 0.08
Jul-15 <0.02 0.06 0.67 0.66 <0.02
Aug-15 0.13 0.49 1.14
Sep-15 0.17 0.44 0.90
Oct-15 0.10 0.20 0.30 0.21 <0.02
Nov-15 0.06 0.09 0.14 0.18
Dec-15 0.05 0.08 0.12 0.16
2009 Average 0.04 <0.04 <0.06 0.09 <0.03
2010 Average 0.04 0.06 0.08 0.09 <0.02
2011 Average <0.04 0.19 <0.17 <0.16 <0.04
2012 Average <0.03 <0.12 <0.10 0.14 <0.03
2013 Average <0.04 0.14 0.15 0.18 <0.03
2014 Average <0.09 0.14 0.12 0.15 <0.02
2015 Average <0.07 0.14 0.31 0.23 <0.02
Average All Years <0.06 <0.13 <0.16 <0.16 <0.03
Quarterly sampling in accordance with Amended C. of A. #3960-7Q4K2G
MDLs have been adjusted for all years for uniformity (0.02 ng/L for methyl mercury), as per Section 1.
Blank cells indicate concentration was not determined.
North Granny Creek receives effluent from the PKC facility
TABLE 13aMETHYL MERCURY - NORTH GRANNY CREEK (Filtered)
(concentrations in ng/L)
Draft USEPA Criteria: 0.05 ng/L
Date
0.0
0.1
0.2
0.3
0.4
0.5
0.6
0.7
0.8
0.9
1.0
1.1
1.2C
on
cen
trat
ion
(n
g/L
)
NORTH GRANNY CREEK - METHYL MERCURY CONCENTRATIONS (Filtered)
N. Granny CreekUpstream(NGC/UP/NWF)G-1
N. Granny CreekDownstream(NGC/DN/NWF)G-2
N. Granny CreekDownstream(NGC/DN/NEF)G-3
N. Granny CreekDownstream(NGC/DN)G-4
Tributary-5A
TC140504 Page 76

De Beers Canada Inc., Victor MineMercury Performance Monitoring, 2015 Annual Report
per Certificate of Approval #3960-7Q4K2G, Conditions 7(5) and 7(6)
S. Granny CreekUpstream
(SGC/UP/SWF)G-5
S. Granny CreekDownstream
(SGC/DS/SWF)G-6
S. Granny CreekDownstream
(SGC/DS)G-7
Tributary-5A
Jul-06 0.05 0.02
Oct-06 0.03 0.08
Jan-07 0.08 0.10
Feb-07
Mar-07
Apr-07
May-07 0.04 0.06
Jun-07
Jul-07 0.05 0.04
Aug-07
Sep-07 0.07
Oct-07 0.04 0.05
Nov-07 0.04
Dec-07 0.09
Jan-08 0.09
Feb-08 0.10 0.07 <0.02
Mar-08
Apr-08 0.04 0.09 0.35/0.2
May-08 0.20
Jun-08
Jul-08 0.04 0.06 0.30 0.03
Aug-08
Sep-08
Oct-08 0.02 0.03 0.06 <0.02
Nov-08
Dec-08
Jan-09 0.06 0.04 0.04 <0.02
Feb-09
Mar-09
Apr-09 0.02 0.02 <0.02 <0.02
May-09
Jun-09
Jul-09 0.04 0.05 0.03 0.03
Aug-09
Sep-09
Oct-09 0.05 0.02 0.23 0.04
Nov-09
Dec-09
Jan-10 0.04 0.02 0.11 <0.02
Feb-10
Mar-10
Apr-10 0.04 0.05 <0.02 0.02
May-10 0.11
Jun-10
Jul-10 0.02 0.06 1.22 0.03
Aug-10
Sep-10
Oct-10 0.04 0.07 0.15 0.02
Nov-10
Dec-10
Jan-11 0.03 0.11 0.09 0.05
Feb-11
Mar-11
Apr-11 0.04 <0.02 <0.02 <0.02
May-11
Jun-11
Jul-11 0.05 0.11 0.35 0.04
Aug-11
Sep-11
Oct-11 <0.02 0.08 0.24 0.03
Nov-11
Dec-11
Jan-12 0.10 0.04 0.09 0.05
Feb-12
Mar-12
Apr-12 0.03 0.07 0.06 0.03
May-12
Jun-12
Jul-12 0.05 0.12 0.14 0.02
Aug-12
Sep-12
Oct-12 0.03 0.08 0.30 <0.02
Nov-12
Dec-12
Jan-13 0.04 0.06 0.08 <0.02
Feb-13
Mar-13
Apr-13 0.03 0.08 0.02 <0.02
May-13
Jun-13
Jul-13 0.05 0.33 0.48 0.05
Aug-13
Sep-13
Oct-13 0.05 0.16 0.24 <0.02
Nov-13
Dec-13
Jan-14 0.08 <0.02 0.05 <0.02
Feb-14
Mar-14 <0.02
Apr-14 <0.02 <0.02 0.03
May-14
Jun-14
Jul-14 0.15 0.05 1.06 0.03
Aug-14
Sep-14 <0.02
Oct-14 0.07 0.03 0.11 <0.02
Nov-14 <0.02
Dec-14
Jan-15 0.02 0.04 0.11 <0.02
Feb-15 0.05 0.13
Mar-15 0.04 0.06
Apr-15 0.04 0.03 0.09 0.03
May-15 0.03 0.06
Jun-15 0.09 0.05
Jul-15 0.12 0.12 0.63 <0.02
Aug-15
Sep-15
Oct-15 0.06 0.38 0.29 <0.02
Nov-15 0.73 0.12 0.21
Dec-15 0.03 0.11 0.19
2009 Average 0.04 0.03 <0.08 <0.03
2010 Average 0.04 0.05 0.32 <0.02
2011 Average <0.03 <0.08 <0.17 <0.04
2012 Average 0.05 0.08 0.15 <0.03
2013 Average 0.04 0.16 0.20 <0.03
2014 Average 0.08 <0.03 0.31 <0.02
2015 Average 0.12 0.11 0.25 <0.02
Average All Years <0.06 <0.08 <0.21 <0.03
Quarterly sampling in accordance with Amended C. of A. #3960-7Q4K2G
MDLs have been adjusted for all years for uniformity (0.02 ng/L for methyl mercury), as per Section 1.
Blank cells indicate concentration was not determined.
TABLE 13bMETHYL MERCURY - SOUTH GRANNY CREEK (Filtered)
(concentrations in ng/L)
Draft USEPA Criteria: 0.05 ng/L
Date
0.0
0.1
0.2
0.3
0.4
0.5
0.6
0.7
0.8
Co
nce
ntr
atio
n (
ng
/L)
SOUTH GRANNY CREEK - METHYL MERCURY CONCENTRATIONS (Filtered)
S. Granny CreekUpstream(SGC/UP/SWF)G-5
S. Granny CreekDownstream(SGC/DS/SWF)G-6
S. Granny CreekDownstream(SGC/DS)G-7
Tributary-5A
TC140504 Page 77
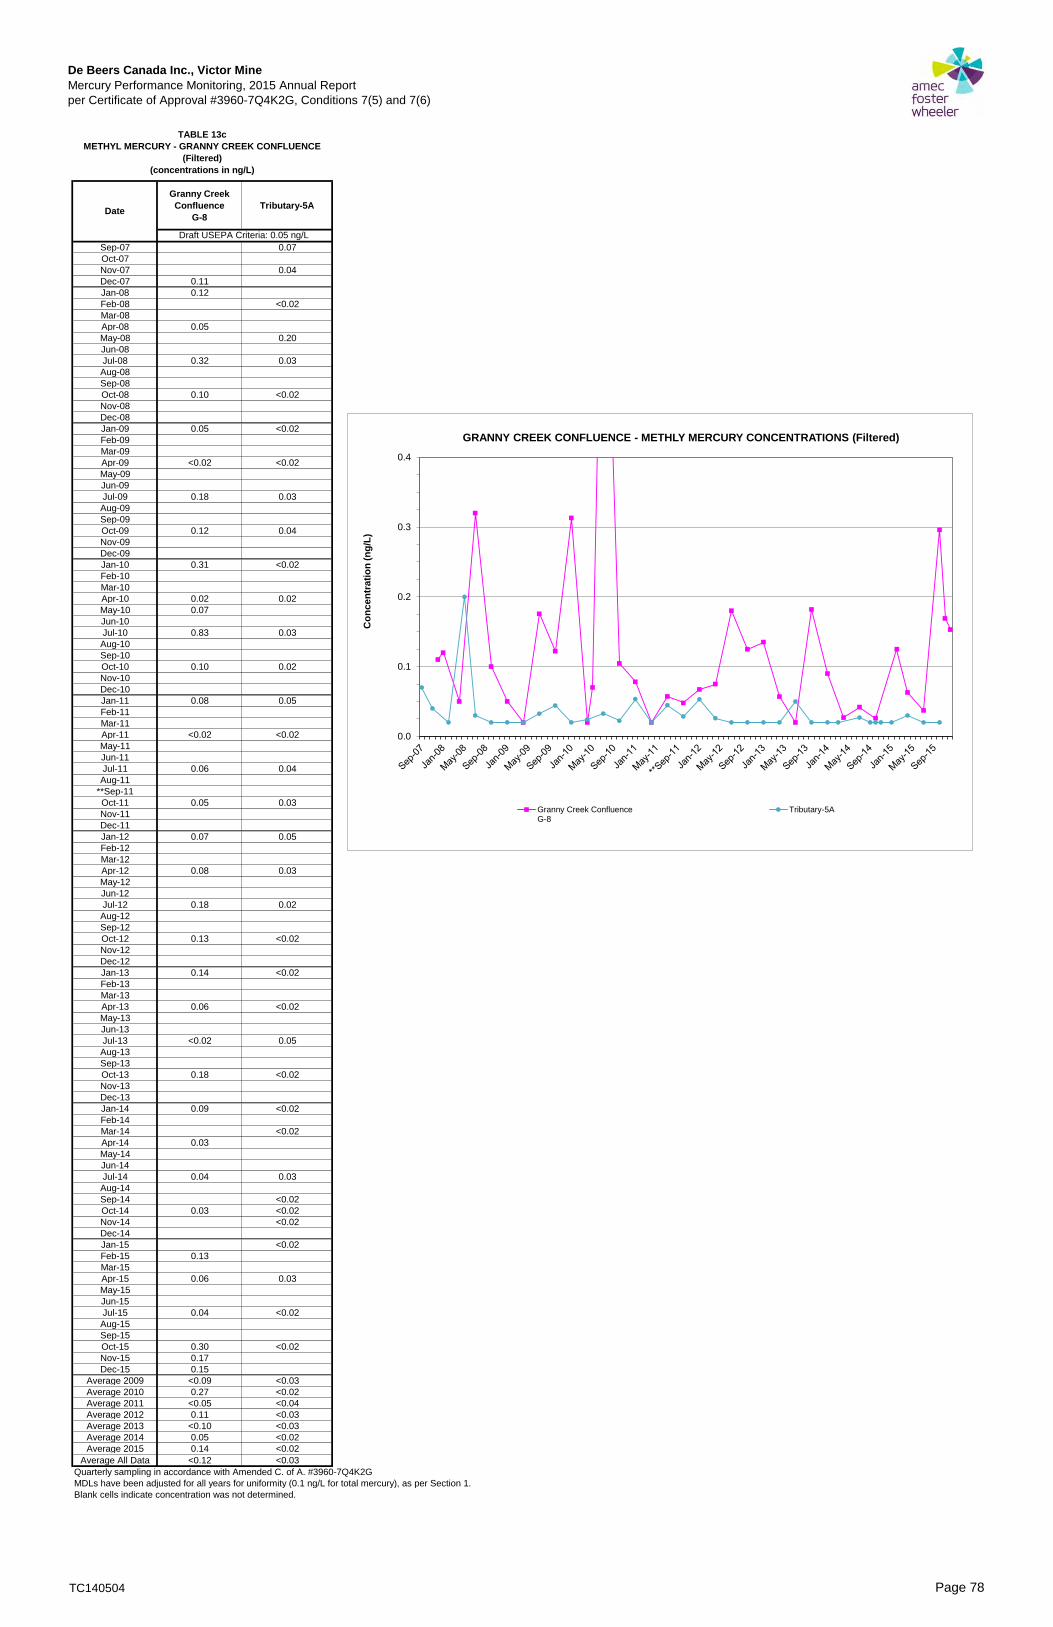
De Beers Canada Inc., Victor MineMercury Performance Monitoring, 2015 Annual Report
per Certificate of Approval #3960-7Q4K2G, Conditions 7(5) and 7(6)
Granny Creek Confluence
G-8Tributary-5A
Sep-07 0.07
Oct-07
Nov-07 0.04
Dec-07 0.11
Jan-08 0.12
Feb-08 <0.02
Mar-08
Apr-08 0.05
May-08 0.20
Jun-08
Jul-08 0.32 0.03
Aug-08
Sep-08
Oct-08 0.10 <0.02
Nov-08
Dec-08
Jan-09 0.05 <0.02
Feb-09
Mar-09
Apr-09 <0.02 <0.02
May-09
Jun-09
Jul-09 0.18 0.03
Aug-09
Sep-09
Oct-09 0.12 0.04
Nov-09
Dec-09
Jan-10 0.31 <0.02
Feb-10
Mar-10
Apr-10 0.02 0.02
May-10 0.07
Jun-10
Jul-10 0.83 0.03
Aug-10
Sep-10
Oct-10 0.10 0.02
Nov-10
Dec-10
Jan-11 0.08 0.05
Feb-11
Mar-11
Apr-11 <0.02 <0.02
May-11
Jun-11
Jul-11 0.06 0.04
Aug-11
**Sep-11
Oct-11 0.05 0.03
Nov-11
Dec-11
Jan-12 0.07 0.05
Feb-12
Mar-12
Apr-12 0.08 0.03
May-12
Jun-12
Jul-12 0.18 0.02
Aug-12
Sep-12
Oct-12 0.13 <0.02
Nov-12
Dec-12
Jan-13 0.14 <0.02
Feb-13
Mar-13
Apr-13 0.06 <0.02
May-13
Jun-13
Jul-13 <0.02 0.05
Aug-13
Sep-13
Oct-13 0.18 <0.02
Nov-13
Dec-13
Jan-14 0.09 <0.02
Feb-14
Mar-14 <0.02
Apr-14 0.03
May-14
Jun-14
Jul-14 0.04 0.03
Aug-14
Sep-14 <0.02
Oct-14 0.03 <0.02
Nov-14 <0.02
Dec-14
Jan-15 <0.02
Feb-15 0.13
Mar-15
Apr-15 0.06 0.03
May-15
Jun-15
Jul-15 0.04 <0.02
Aug-15
Sep-15
Oct-15 0.30 <0.02
Nov-15 0.17
Dec-15 0.15
Average 2009 <0.09 <0.03
Average 2010 0.27 <0.02
Average 2011 <0.05 <0.04
Average 2012 0.11 <0.03
Average 2013 <0.10 <0.03
Average 2014 0.05 <0.02
Average 2015 0.14 <0.02
Average All Data <0.12 <0.03
Quarterly sampling in accordance with Amended C. of A. #3960-7Q4K2G
MDLs have been adjusted for all years for uniformity (0.1 ng/L for total mercury), as per Section 1.
Blank cells indicate concentration was not determined.
TABLE 13cMETHYL MERCURY - GRANNY CREEK CONFLUENCE
(Filtered)(concentrations in ng/L)
Draft USEPA Criteria: 0.05 ng/L
Date
0.0
0.1
0.2
0.3
0.4
Co
nce
ntr
atio
n (
ng
/L)
GRANNY CREEK CONFLUENCE - METHLY MERCURY CONCENTRATIONS (Filtered)
Granny Creek ConfluenceG-8
Tributary-5A
TC140504 Page 78

De Beers Canada Inc., Victor MineMercury Performance Monitoring, 2015 Annual Report
per Certificate of Approval #3960-7Q4K2G, Conditions 7(5) and7(6)
NGC 5-day Average Flow at
NG-001
(m3/d)
NGC 5-day Average Flow
Supplementation Rate
(m3/d)
Fine PKC Effluent
Discharge
(m3/d)
NGC-DS-NEF (G-3)(Filtered)
(ng/L)
Flow Supplementation
Water(ng/L)
Fine PKC Discharge
(ng/L)
2013
01-Jul-13 11,886 5,209 0 0.22 <0.02 - 0.38
05-Aug-13 10,508 8,672 0 0.37 0.18 - 1.27
02-Sep-13 12,558 10,019 0 0.05 0.06 - 0.01
2014
02-Jun-14 61,422 0 0 0.17 0.04 - 0.17
07-Jul-14 18,118 1,056 0 0.27 0.03 - 0.28
04-Aug-14 11,798 9,385 0 0.17 0.04 - 0.68
01-Sep-14 21,821 2,590 0 0.28 0.05 - 0.31
2015
01-Jun-15 67,875 0 0 0.08 0.03 - 0.08
03-Jul-15 51,222 719 0 0.67 <0.02 - 0.68
03-Aug-15 74,630 0 4,701 1.14 0.05 0.34 1.19
07-Sep-15 142,070 0 10,772 0.90 0.04 0.38 0.94
NGC 5-day Average Flow at
NG-001
(m3/d)
NGC-DS-NEF G-3
(Filtered)(ng/L)
NGC 5-day Average Flow at
NG-001
(m3/d)
NGC-DS-NEF (G-3) Absence of Flow
Suppl or PKC Discharge(Filtered)
(ng/L)
11,886 0.22 11,886 0.38
10,508 0.37 10,508 1.27
12,558 0.05 12,558 0.01
61,422 0.17 61,422 0.17
18,118 0.27 18,118 0.28
11,798 0.17 11,798 0.68
21,821 0.28 21,821 0.31
67,875 0.08 67,875 0.08
51,222 0.67 51,222 0.68
74,630 1.14 74,630 1.19
142,070 0.90 142,070 0.94
YearNatural Flow
(m3/d)
NGC-DS-NEF (G-3)(Filtered)
(ng/L)
2013 6,677 0.22
2014 17,062 0.27
2015 50,503 0.67
YearNatural Flow
(m3/d)
NGC-DS-NEF (G-3)(Filtered)
(ng/L)
2013 1,836 0.37
2014 2,413 0.17
2015 69,929 1.14
YearNatural Flow
(m3/d)
NGC-DS-NEF (G-3)(Filtered)
(ng/L)
2013 2,539 0.05
2014 19,231 0.28
2015 131,298 0.9
Table 14f: Methyl Mercury as a Function of Natural Flow - September (data for Chart 1e)
Table 14: North Granny Creek Summer Condition Methyl Mercury Concentrations(concentrations in ng/L)
Table 14a: Flow and Water Quality Data with Loading Calculations
Table 14b: Data for Chart 1a Table 14c: Data for Chart 1b
Table 14d: Methyl Mercury as a Function of Natural Flow - July (data for Chart 1c)
Table 14e: Methyl Mercury as a Function of Natural Flow - August (data for Chart 1d)
Flow / Discharge Rates Water Quality
Year / Date
Calculated Water Quality in the Absence of
Supplementation or PKC Discharge
(ng/L)
y = 6E-06x + 0.1489R² = 0.4083
0.00
0.20
0.40
0.60
0.80
1.00
1.20
0 20,000 40,000 60,000 80,000 100,000 120,000 140,000 160,000
Co
nce
ntr
atio
n (
ng/
L)
Flow (m3/d)
Chart 14a: Unadjusted Filtered Methyl Mercury Concentration as a Function of Total Flow
y = 6E-06x + 0.093R² = 0.9791
0
0.1
0.2
0.3
0.4
0.5
0.6
0.7
0.8
0.9
1
0 20,000 40,000 60,000 80,000 100,000 120,000 140,000
Concentr
ation (
ng/L
)
Flow (m3/d)
Chart 14e: Unadjusted Filtered methyl Mercury Concentration as a Function of Natural flow -September
y = 1E-05x + 0.2432R² = 0.959
0
0.2
0.4
0.6
0.8
1
1.2
0 10,000 20,000 30,000 40,000 50,000 60,000 70,000 80,000
Concentr
ation (
ng/L
)
Flow (m3/d)
Chart 14d: Unadjusted Filtered Methyl Mercury Concentration as a Function of Natural Flow -August
y = 3E-06x + 0.4192R² = 0.0709
0.00
0.20
0.40
0.60
0.80
1.00
1.20
1.40
0 20,000 40,000 60,000 80,000 100,000 120,000 140,000 160,000
Co
nce
ntr
atio
n (
ng/
L)
Flow (m3/d)
Chart 14b: Adjusted Filtered Methyl Mercury Concentration as a Function of Total Flow
y = 1E-05x + 0.1223R² = 0.9839
0
0.1
0.2
0.3
0.4
0.5
0.6
0.7
0.8
0 10,000 20,000 30,000 40,000 50,000 60,000
Concentr
ation (
ng/L
)
Flow (m3/d)
Chart 14c: Unadjusted Filtered Methyl Mercury Concentration as a Function of Natural Flow -July
TC140504 Page 79

De Beers Canada Inc., Victor MineMercury Performance Monitoring, 2015 Annual Report
per Certificate of Approval #3960-7Q4K2G, Conditions 7(5) and 7(6)
July 2016
July Oct Average NGC-G4 SGC-G7 GC-G8
2008 0.32 0.18 0.21
2008 0.48 0.15 0.32 2009 0.10 0.13 0.15
2009 0.08 0.11 0.10 2010 0.11 0.69 0.47
2010 0.08 0.13 0.11 2011 0.30 0.30 0.06
2011 0.32 0.27 0.30 2012 0.22 0.22 0.16
2012 0.22 0.22 0.22 2013 0.28 0.36 0.10
2013 0.25 0.31 0.28 2014 0.22 0.59 0.04
2014 0.29 0.14 0.22 2015 0.44 0.46 0.17
2015 0.66 0.21 0.44
2008 0.30 0.06 0.18
2009 0.03 0.23 0.13
2010 1.22 0.15 0.69
2011 0.35 0.24 0.30
2012 0.14 0.30 0.22
2013 0.48 0.24 0.36
2014 1.06 0.11 0.59
2015 0.63 0.29 0.46
2008 0.32 0.10 0.21
2009 0.18 0.12 0.15
2010 0.83 0.10 0.47
2011 0.06 0.05 0.06
2012 0.18 0.13 0.16
2013 0.02 0.18 0.10
2014 0.04 0.03 0.04
2015 0.04 0.30 0.17
Conf
Table 15a: July / October Methyl Mercury Concentrations For Downstream Granny Creek Stations G4,G7 AND G8 (Filtered)(concentrations in ng/L)
Station / Year Month Station July/October Average
Year
G4
G7
0.00
0.10
0.20
0.30
0.40
0.50
0.60
0.70
0.80
2007 2008 2009 2010 2011 2012 2013 2014 2015 2016
Concentr
ation (
ng/L
)
Year
Granny Creek Sytem July/October Average Methyl Mercury Concentrations (Filtered)
NGC-G4 SGC-G7 GC-G8
TC140504 Page 80

De Beers Canada Inc., Victor MineMercury Performance Monitoring, 2015 Annual Report
per Certificate of Approval #3960-7Q4K2G, Conditions 7(5) and 7(6)
July 2016
July Oct Average NGC-G4 SGC-G7 GC-G8
2008 0.35 0.18 0.24
2008 0.52 0.18 0.35 2009 0.08 0.13 0.10
2009 0.02 0.14 0.08 2010 0.66 0.68 0.69
2010 1.13 0.19 0.66 2011 0.39 0.25 0.23
2011 0.48 0.30 0.39 2012 0.28 0.28 0.16
2012 0.28 0.27 0.28 2013 0.38 0.50 0.27
2013 0.28 0.47 0.38 2014 0.28 0.75 0.06
2014 0.36 0.19 0.28 2015 0.49 0.43 0.20
2015 0.73 0.25 0.49
2008 0.26 0.10 0.18
2009 0.03 0.22 0.13
2010 1.22 0.15 0.68
2011 0.46 0.03 0.25
2012 0.19 0.37 0.28
2013 0.67 0.33 0.50
2014 1.26 0.23 0.75
2015 0.49 0.36 0.43
2008 0.33 0.14 0.24
2009 0.07 0.12 0.10
2010 1.23 0.14 0.69
2011 0.27 0.18 0.23
2012 0.18 0.13 0.16
2013 0.27 0.27 0.27
2014 0.07 0.04 0.06
2015 0.07 0.33 0.20
G7
Conf
Table 15b: July / October Methyl Mercury Concentrations for Downstream Granny Creek Stations G4,G7 AND G8 (Unfiltered)(concentrations in ng/L)
Station / Year Month
YearStation July/October Average
G4
0.00
0.10
0.20
0.30
0.40
0.50
0.60
0.70
0.80
2007 2008 2009 2010 2011 2012 2013 2014 2015 2016
Concentr
ation (
ng/L
)
Year
Granny Creek Sytem July/October Average Methyl Mercury Concentrations (Unfiltered)
NGC-G4 SGC-G7 GC-G8
TC140504 Page 81

De Beers Canada Inc., Victor MineMercury Performance Monitoring, 2015 Annual Report
per Certificate of Approval #3960-7Q4K2G, Conditions 7(5) and 7(6)
Feb-08
May-08
Aug-08
Oct-08
Jan-09
Feb-09
Mar-09
Apr-09
May-09
Jun-09
Jul-09
Aug-09
Sep-09
Oct-09
Nov-09
Dec-09
Jan-10
Feb-10
Mar-10
Apr-10
May-10
Jun-10
Jul-10
Aug-10
Sep-10
Oct-10
Nov-10
Dec-10
Jan-11
Feb-11
Mar-11
Apr-11
May-11
Jun-11
Jul-11
Aug-11
Sep-11*
Oct-11
Nov-11
Dec-11
Jan-12
Feb-12
Mar-12
Apr-12
May-12
Jun-12
Jul-12
Aug-12
Sep-12
Oct-12
Nov-12
Dec-12
Jan-13
Feb-13
Mar-13
Apr-13
May-13
Jun-13
Jul-13
Aug-13
Sep-13
Oct-13
Nov-13
Dec-13
Jan-14
Feb-14
Mar-14
Apr-14
May-14
Jun-14
Jul-14
Aug-14
Sep-14
Oct-14
Nov-14
Dec-14
Jan-15
Feb-15
Mar-15
Apr-15
May-15
Jun-15
Jul-15
Aug-15
Sep-15
Oct-15
Nov-15
Dec-15
Average / Standard Deviation 2009 2.56 1.98 1.37 0.83 1.82 0.52 1.42 0.96 1.98 1.07 1.96 1.00 - - 1.96 0.80 1.85 1.10Average / Standard Deviation 2010 1.62 0.62 1.44 0.53 1.52 0.46 1.26 0.25 1.76 0.58 1.67 0.60 - - 1.59 0.58 1.61 0.81Average / Standard Deviation 2011 1.15 0.53 1.38 0.84 1.51 0.48 1.64 1.13 1.04 0.33 2.12 0.82 - - 1.70 0.80 1.30 0.51Average / Standard Deviation 2012 1.89 0.29 1.68 0.27 1.80 0.25 2.11 0.78 1.66 0.47 1.73 0.92 - - 1.73 0.95 1.56 0.59Average / Standard Deviation 2013 1.17 0.65 2.36 2.85 1.05 0.32 2.15 1.34 1.37 0.36 1.78 0.87 1.33 0.29 1.56 0.65 1.14 0.24Average / Standard Deviation 2014 1.41 0.70 1.42 1.09 1.91 1.28 <1.15 1.00 2.12 2.03 1.99 0.95 2.14 0.87 2.14 1.54 2.26 1.20Average / Standard Deviation 2015 1.63 0.53 1.61 0.39 1.60 0.32 1.62 0.43 1.66 0.40 1.87 0.17 1.74 0.58 1.78 0.23 1.62 0.40
Average / Standard Deviation All Years 1.74 0.99 1.87 1.55 1.91 1.07 <1.73 0.96 1.96 1.55 1.98 0.98 1.80 0.69 1.98 1.34 1.69 0.80- : total mercury concentration not determined
Sampling locations and frequency governed by Amended C. of A. #3960-7Q4K2G.
Bracketed sampling notations are field identifications.
MDLs have been adjusted for all years for uniformity (0.1 ng/L for total mercury), as per Section 1.
Date
1.48
4.31
0.81
3.15
-
-
CEQG for Protection of Aquatic Life: 26 ng/L
Nayshkootayaow RiverUpstream
N-1(Naysh Riv up)
Nayshkootayaow RiverMiddle
N-2(Naysh Riv dn)
Nayshkootayaow RiverDownstream
N-3(Naysh Riv up Att Riv)
MonumentChannel
(Naysh RivControl)
Attawapiskat RiverA-1
(Att Riv up 2)
Attawapiskat RiverA-2
(Att Riv up A2-1)
Attawapiskat RiverA-5
(Att Riv dn 500(40))
Attawapiskat RiverA-3
(Att Riv dn A3-1)
Attawapiskat RiverA-4
(Att Riv dn Naysh Riv)
-
5.26
-
2.80
-
1.98
2.30
1.39
-
-
1.39
-
-
2.54
-
-
0.80
-
-
-
-
0.86
-
-
0.69
1.28
-
-
1.27
-
1.90
-
-
1.53
-
-
-
1.16
-
-
-
-
1.82
-
-
-
-
2.22
-
2.00
-
0.77
-
-
0.96
2.13
-
-
0.82
-
0.98
-
-
1.71
-
-
-
-
-
0.69
1.61
-
1.03
-
-
2.24
-
-
2.24
-
-
-
-
-
1.11
-
-
-
1.47
4.58
2.14
2.31
1.19
-
-
1.00
-
-
2.58
-
-
0.70
-
1.66
-
-
1.35
-
-
0.86
-
2.21
-
1.10
-
-
-
-
2.53
-
-
-
0.66
-
-
1.46
-
1.79
-
-
1.80
1.28
-
-
-
1.86
0.88
-
-
0.76
-
-
-
6.63
-
-
-
-
0.81
-
-
-
1.16
-
-
0.30
-
-
-
-
7.05
-
0.66
1.81
-
-
2.75
-
1.33
-
-
-
1.50
1.23
-
-
5.33
3.30
2.28
2.53
2.00
-
-
1.47
-
-
2.47
-
-
-
-
1.79
-
-
1.28
-
-
-
-
2.17
-
1.12
-
1.67
-
-
2.09
0.98
-
-
1.30
-
-
2.06
-
1.77
-
-
-
1.47
-
-
-
-
0.78
-
-
-
1.91
-
-
1.47
-
0.63
-
-
1.32
0.84
-
-
1.12
-
3.62
-
-
-
4.78
-
-
2.07
-
-
-
-
1.82
-
-
-
0.68
-
-
1.90
0.69
-
-
2.83
-
2.13
1.86
1.07
-
-
1.03
-
1.60
-
-
-
1.07
-
-
-
-
0.74
-
-
0.68
1.10
-
-
1.30
-
2.99
-
-
0.94
-
-
-
2.14
-
-
-
-
2.56
-
-
-
-
2.54
-
2.39
-
0.99
-
-
1.08
3.72
-
-
2.79
-
0.52
-
-
1.74
-
-
-
<0.1
-
-
-
1.76
-
-
2.78
-
-
-
2.23
-
-
0.77
-
-
1.76
-
-
-
8.75
3.41
1.91
1.93
1.39
-
-
1.36
-
-
3.58
-
-
1.58
-
-
-
3.40
1.31
-
-
1.07
-
2.58
-
1.40
-
-
-
-
-
-
-
-
0.70
-
-
1.36
-
2.27
-
-
1.30
1.27
-
-
-
1.80
1.77
-
-
1.04
-
-
-
1.58
-
-
-
-
0.82
-
-
-
1.08
-
-
0.31
-
-
-
-
1.37
-
1.16
2.54
-
-
4.81
-
1.25
1.07
0.81
1.20
1.43
2.00
-
-
2.19
3.64
2.32
1.25
2.09
2.17
1.36
1.26
4.17
2.81
3.23
1.69
1.56
-
-
1.50
2.50
1.23
1.71
1.52
2.17
1.67
2.13
2.68
0.70
1.08
1.76
1.42
1.48
-
2.85
1.31
1.12
2.67
2.18
3.20
-
1.62
3.59
2.93
1.76
1.79
3.51
1.16
0.85
0.73
2.00
1.24
1.09
3.11
3.06
1.43
1.08
-
2.11
3.14
-
2.39
1.54
2.77
2.09
1.76
2.01
1.83
1.59
6.91
1.42
-
-
-
-
-
2.43
2.19
2.07
2.38
4.02
2.69
2.59
1.94
3.00
0.82
0.81
1.10
0.87
1.42
1.16
1.90
1.70
1.03
1.14
-
-
-
-
-
-
-
-
-
-
-
-
-
-
-
-
-
-
-
-
-
-
-
-
-
-
-
-
-
-
-
-
-
-
-
-
-
-
-
-
-
-
-
-
-
-
-
-
-
-
-
-
-
-
-
-
0.98
1.48
1.63
1.22
-
-
3.03
1.29
-
-
-
-
-
-
-
2.11
-
10.50
3.64
2.09
1.72
2.35
1.84
1.28
1.93
3.19
2.57
3.48
1.79
1.56
1.39
1.13
1.74
2.71
-
-
-
-
-
-
2.82
0.94
0.87
1.89
1.12
0.96
1.52
1.93
1.80
2.31
1.22
0.93
3.83
1.90
1.43
1.24
1.28
1.35
1.10
1.39
1.28
0.88
0.75
-
1.51
1.55
-
1.99
2.09
1.23
-
2.24
2.63
1.89
1.36
4.00
2.20
1.51
1.88
1.03
1.60
1.21
0.97
0.82
0.43
1.01
2.43
2.48
0.95
1.34
4.87
1.88
2.42
1.58
2.25
1.38
1.85
1.35
1.09
2.05
6.34
2.80
1.70
2.14
-
2.20
3.61
1.82
1.79
1.34
-
-
1.22
-
-
3.50
-
-
2.75
2.40
1.60
2.89
1.81
-
-
1.36
-
-
2.77
-
0.90
1.35
-
-
-
1.52
1.05
-
-
0.77
-
-
-
1.26
-
-
-
-
1.15
-
-
-
1.44
-
-
1.95
-
1.09
-
-
-
-
1.61
-
2.37
-
-
2.38
1.06
-
-
1.35
-
-
1.32
0.83
-
-
Table 16a: Total Mercury - Nayshkootayaow and Attawapiskat Rivers (Unfiltered)(concentrations in ng/L)
-
-
1.84
-
-
-
1.28
--
1.53
3.28
-
-
-
1.16
-
-
2.84
-
-
-
0.55
-
TC140504 Page 82
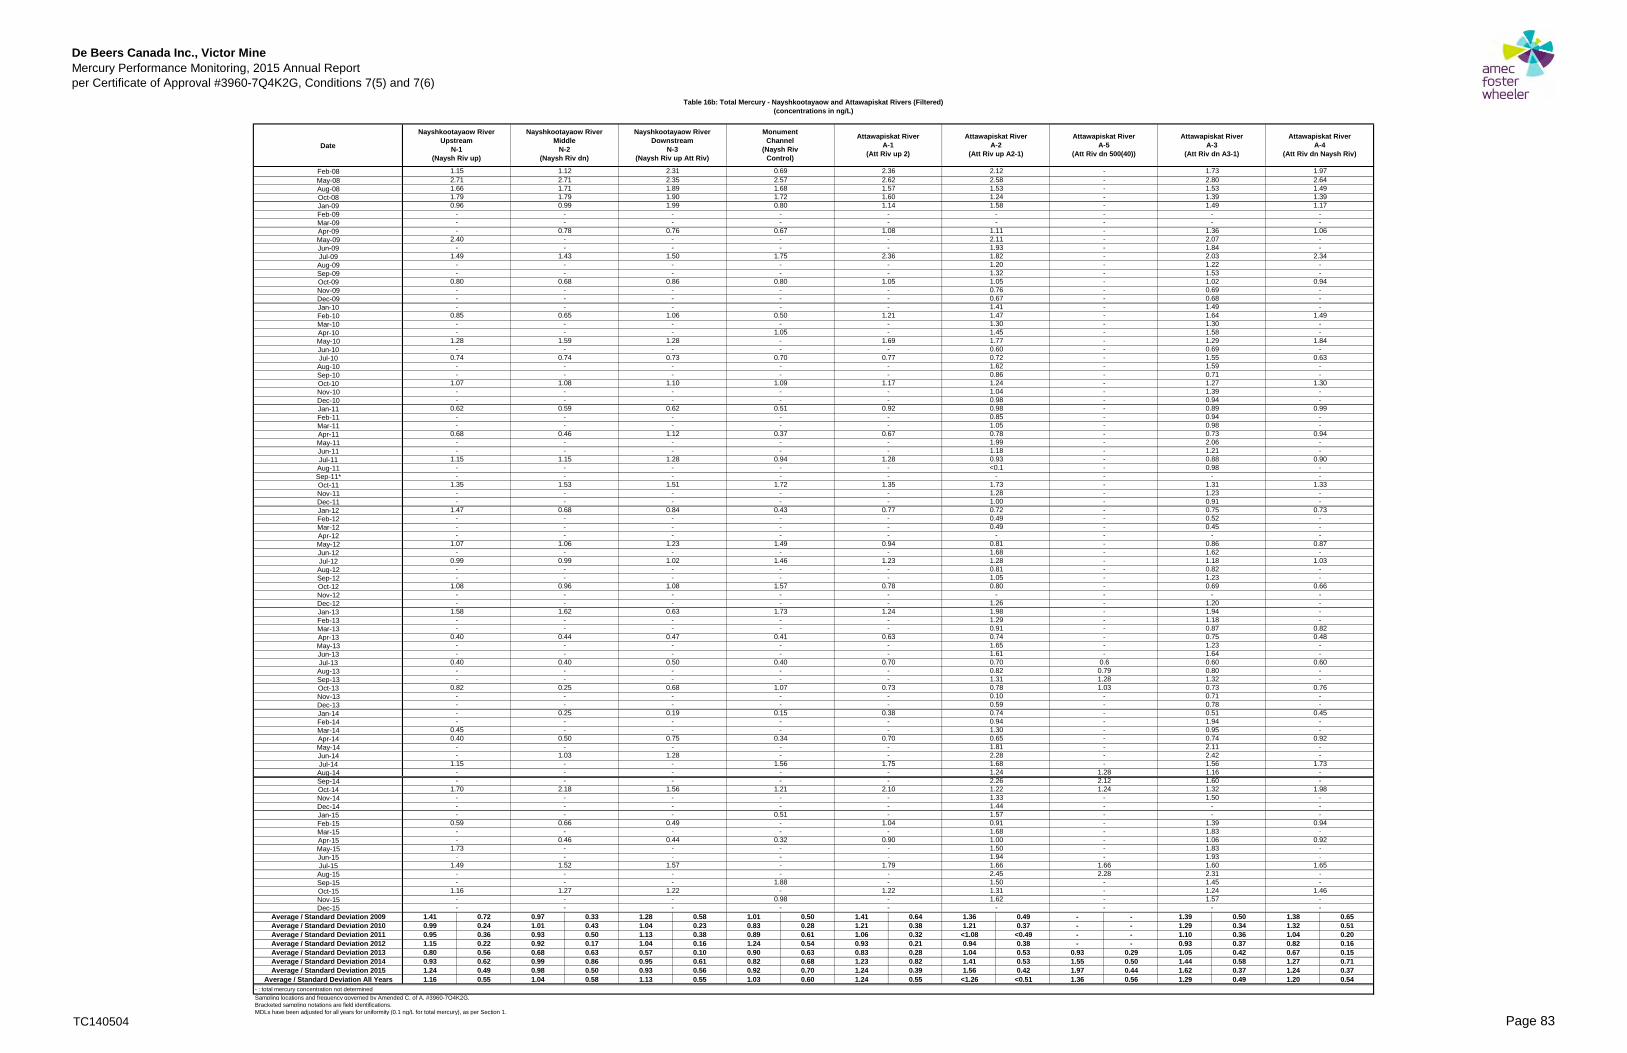
De Beers Canada Inc., Victor MineMercury Performance Monitoring, 2015 Annual Report
per Certificate of Approval #3960-7Q4K2G, Conditions 7(5) and 7(6)
Date
Feb-08
May-08
Aug-08
Oct-08
Jan-09
Feb-09
Mar-09
Apr-09
May-09
Jun-09
Jul-09
Aug-09
Sep-09
Oct-09
Nov-09
Dec-09
Jan-10
Feb-10
Mar-10
Apr-10
May-10
Jun-10
Jul-10
Aug-10
Sep-10
Oct-10
Nov-10
Dec-10
Jan-11
Feb-11
Mar-11
Apr-11
May-11
Jun-11
Jul-11
Aug-11
Sep-11*
Oct-11
Nov-11
Dec-11
Jan-12
Feb-12
Mar-12
Apr-12
May-12
Jun-12
Jul-12
Aug-12
Sep-12
Oct-12
Nov-12
Dec-12
Jan-13
Feb-13
Mar-13
Apr-13
May-13
Jun-13
Jul-13
Aug-13
Sep-13
Oct-13
Nov-13
Dec-13
Jan-14
Feb-14
Mar-14
Apr-14
May-14
Jun-14
Jul-14
Aug-14
Sep-14
Oct-14
Nov-14
Dec-14
Jan-15
Feb-15
Mar-15
Apr-15
May-15
Jun-15
Jul-15
Aug-15
Sep-15
Oct-15
Nov-15
Dec-15
Average / Standard Deviation 2009 1.41 0.72 0.97 0.33 1.28 0.58 1.01 0.50 1.41 0.64 1.36 0.49 - - 1.39 0.50 1.38 0.65Average / Standard Deviation 2010 0.99 0.24 1.01 0.43 1.04 0.23 0.83 0.28 1.21 0.38 1.21 0.37 - - 1.29 0.34 1.32 0.51Average / Standard Deviation 2011 0.95 0.36 0.93 0.50 1.13 0.38 0.89 0.61 1.06 0.32 <1.08 <0.49 - - 1.10 0.36 1.04 0.20Average / Standard Deviation 2012 1.15 0.22 0.92 0.17 1.04 0.16 1.24 0.54 0.93 0.21 0.94 0.38 - - 0.93 0.37 0.82 0.16Average / Standard Deviation 2013 0.80 0.56 0.68 0.63 0.57 0.10 0.90 0.63 0.83 0.28 1.04 0.53 0.93 0.29 1.05 0.42 0.67 0.15Average / Standard Deviation 2014 0.93 0.62 0.99 0.86 0.95 0.61 0.82 0.68 1.23 0.82 1.41 0.53 1.55 0.50 1.44 0.58 1.27 0.71Average / Standard Deviation 2015 1.24 0.49 0.98 0.50 0.93 0.56 0.92 0.70 1.24 0.39 1.56 0.42 1.97 0.44 1.62 0.37 1.24 0.37
Average / Standard Deviation All Years 1.16 0.55 1.04 0.58 1.13 0.55 1.03 0.60 1.24 0.55 <1.26 <0.51 1.36 0.56 1.29 0.49 1.20 0.54- : total mercury concentration not determined
Sampling locations and frequency governed by Amended C. of A. #3960-7Q4K2G.
Bracketed sampling notations are field identifications.
MDLs have been adjusted for all years for uniformity (0.1 ng/L for total mercury), as per Section 1.
1.73
2.80
1.53
1.39
0.69
2.57
1.68
1.72
Nayshkootayaow RiverUpstream
N-1(Naysh Riv up)
Nayshkootayaow RiverMiddle
N-2(Naysh Riv dn)
Nayshkootayaow RiverDownstream
N-3(Naysh Riv up Att Riv)
MonumentChannel
(Naysh RivControl)
Attawapiskat RiverA-1
(Att Riv up 2)
Attawapiskat RiverA-2
(Att Riv up A2-1)
Attawapiskat RiverA-5
(Att Riv dn 500(40))
Attawapiskat RiverA-3
(Att Riv dn A3-1)
1.84
2.03
1.22
1.53
1.02
1.49
-
-
1.36
2.07
1.58
1.29
0.69
1.55
1.59
0.69
0.68
1.49
1.64
1.30
0.94
0.98
0.73
2.06
1.21
0.71
1.27
1.39
0.94
0.89
0.91
0.75
0.52
0.45
-
0.88
0.98
-
1.31
1.23
0.69
-
1.20
1.94
1.18
0.86
1.62
1.18
0.82
1.23
0.80
1.32
0.73
0.71
0.78
0.87
0.75
1.23
1.64
0.60
1.39
1.83
2.42
1.56
1.16
1.60
1.32
0.51
1.94
0.95
0.74
2.11
1.45
1.24
1.57
-
-
-
-
-
-
-
-
-
-
-
-
-
1.06
1.83
1.93
1.60
2.31
1.50
-
-
-
-
-
-
-
-
-
-
-
-
-
-
-
-
-
-
-
-
-
-
-
-
-
-
-
-
-
-
-
-
-
-
-
-
-
-
-
-
-
-
-
0.6
0.79
1.28
1.03
-
-
-
-
-
-
-
-
-
1.28
-
-
-
-
-
-
-
-
-
-
-
-
2.12
1.24
-
-
-
0.67
1.41
1.47
1.30
1.45
-
2.12
2.58
1.53
1.24
1.58
-
-
1.11
2.11
1.93
1.82
1.20
1.32
1.05
0.76
1.66
2.28
-
1.24
1.04
0.98
0.98
0.85
1.77
0.60
0.72
1.62
0.86
<0.1
-
1.73
1.28
1.00
1.05
0.78
1.99
1.18
0.93
1.68
1.28
0.81
1.05
0.80
0.72
0.49
0.49
-
0.81
0.74
1.65
1.61
0.70
0.82
-
1.26
1.98
1.29
0.91
0.94
1.30
0.65
1.81
2.28
1.31
0.78
0.10
0.59
0.74
2.45
1.50
1.44
1.57
0.91
1.68
1.00
1.68
1.24
2.26
1.22
1.33
1.05
-
-
-
1.21
1.31
1.62
-
2.36
2.62
1.57
1.60
1.14
-
-
1.08
-
-
2.36
-
-
1.50
1.94
1.66
-
-
1.17
-
-
-
-
1.69
-
0.77
-
1.28
-
-
1.35
0.92
-
-
0.67
-
-
0.94
-
1.23
-
-
-
0.77
-
-
-
-
0.63
-
-
-
0.78
-
-
1.24
-
0.38
-
-
0.70
0.70
-
-
0.73
-
2.10
-
-
-
1.04
-
-
1.75
-
-
-
-
1.22
-
-
-
0.90-
-
1.79
-
1.75
-
-
0.80
0.80
-
-
0.67
-
1.05
-
-
0.70
-
-
-
-
0.50
-
-
-
0.37
-
-
-
1.09
-
-
0.51
-
0.43
-
-
-
0.94
-
-
1.72
-
1.57
-
-
1.73
-
1.49
-
1.46
-
-
-
-
1.07
-
-
-
0.41
-
-
0.40
-
-
-
1.56
-
-
1.21
0.15
-
-
0.34
-
1.88
-
0.98
-
2.31
2.35
1.89
1.90
1.99
-
-
0.76
-
-
1.50
-
0.32
-
-
-
-
-
-
0.51
1.06
-
-
1.28
-
-
0.86
-
-
-
-
0.62
-
-
1.12
0.73
-
-
1.10
-
1.51
-
-
0.84
-
-
-
1.28
-
-
-
-
1.08
-
-
-
-
1.23
-
1.02
-
0.50
-
-
0.68
0.63
-
-
0.47
-
0.75
-
1.28
-
-
-
-
0.19
-
-
1.22
-
0.49-
0.44-
-
-
1.56
-
-
-
-
-
0.65
-
-
-
1.12
2.71
1.71
1.79
0.99
-
-
0.78
-
-
1.43
-
-
0.68
-
1.57-
-
1.08
-
-
0.59
-
1.59
-
0.74
-
-
-
-
1.53
-
-
-
0.46
-
-
1.15
-
0.99
-
-
0.96
0.68
-
-
-
1.06
0.44
-
-
0.40
-
-
-
1.62
-
-
-
-
0.50
-
1.03
-
0.25
-
-
0.25
-
-
-
-
0.66
-
0.46
-
-
-
2.18
-
0.80
-
-
-
0.85
1.27
-
-
1.15
2.71
1.66
1.79
0.96
-
-
-
2.40
-
1.49
-
-
-
-
1.52
-
-
1.07
-
-
-
-
1.28
-
0.74
-
1.15
-
-
1.35
0.62
-
-
0.68
-
-
1.07
-
0.99
-
-
-
1.47
-
-
-
-
0.40
-
-
-
1.08
-
-
1.58
-
--
1.73-
1.49
1.70
-
-
-
0.59
Attawapiskat RiverA-4
(Att Riv dn Naysh Riv)
1.97
2.64
1.49
-
-
1.16
-
-
-
1.15
-
-
-
-
-
0.45
0.40
0.40
-
-
0.82
-
-
-
2.34
-
-
1.39
1.17
-
-
1.06
-
-
1.84
-
0.63
0.94
-
-
-
1.49
0.99
-
-
0.94
-
-
-
1.30
-
-
-
-
0.73
-
-
-
0.90
-
-
1.33
-
0.66
-
-
-
-
0.87
-
1.03
-
-
0.92
0.60
-
-
0.76
-
-
0.82
0.48
-
-
Table 16b: Total Mercury - Nayshkootayaow and Attawapiskat Rivers (Filtered)(concentrations in ng/L)
-
-
1.46
-
-
-
0.92-
-
1.65
1.98
-
-
-
0.94
-
-
1.73
-
-
-
0.45
-
TC140504 Page 83

De Beers Canada Inc., Victor MineMercury Performance Monitoring, 2015 Annual Report
per Certificate of Approval #3960-7Q4K2G, Conditions 7(5) and 7(6)
Feb-08
May-08
Aug-08
Oct-08
Jan-09
Feb-09
Mar-09
Apr-09
May-09
Jun-09
Jul-09
Aug-09
Sep-09
Oct-09
Nov-09
Dec-09
Jan-10
Feb-10
Mar-10
Apr-10
May-10
Jun-10
Jul-10
Aug-10
Sep-10
Oct-10
Nov-10
Dec-10
Jan-11
Feb-11
Mar-11
Apr-11
May-11
Jun-11
Jul-11
Aug-11
Sep-11*
Oct-11
Nov-11
Dec-11
Jan-12
Feb-12
Mar-12
Apr-12
May-12
Jun-12
Jul-12
Aug-12
Sep-12
Oct-12
Nov-12
Dec-12
Jan-13
Feb-13
Mar-13
Apr-13
May-13
Jun-13
Jul-13
Aug-13
Sep-13
Oct-13
Nov-13
Dec-13
Jan-14
Feb-14
Mar-14
Apr-14
May-14
Jun-14
Jul-14
Aug-14
Sep-14
Oct-14
Nov-14
Dec-14
Jan-15
Feb-15
Mar-15
Apr-15
May-15
Jun-15
Jul-15
Aug-15
Sep-15
Oct-15
Nov-15
Dec-15
Average / Standard Deviation 2009 0.04 0.01 0.04 0.01 0.03 0.01 0.05 0.04 0.04 0.03 0.05 0.03 - - <0.06 <0.03 0.04 0.04Average / Standard Deviation 2010 <0.08 <0.08 <0.05 <0.04 0.06 0.04 0.09 0.05 <0.06 <0.06 <0.05 <0.02 - - 0.06 0.02 <0.04 <0.03Average / Standard Deviation 2011 0.12 0.13 0.05 0.02 <0.06 <0.03 0.10 0.04 0.05 0.01 <0.05 <0.02 - - <0.04 <0.02 0.04 0.00Average / Standard Deviation 2012 0.06 0.02 0.06 0.02 0.06 0.01 0.11 0.04 <0.05 <0.02 <0.05 <0.02 - - <0.04 <0.02 0.05 0.01Average / Standard Deviation 2013 <0.07 <0.08 <0.04 <0.03 <0.03 <0.01 0.08 0.04 <0.03 <0.02 <0.05 <0.02 <0.04 <0.02 <0.04 <0.02 0.04 0.03Average / Standard Deviation 2014 0.05 0.02 <0.04 <0.02 0.06 0.03 0.09 0.06 <0.04 <0.02 0.05 0.02 0.08 0.03 <0.05 <0.02 0.05 0.01Average / Standard Deviation 2015 0.05 0.02 0.06 0.05 0.09 0.07 0.07 0.03 0.05 0.02 0.06 0.05 0.06 0.01 0.05 0.02 0.05 0.02
Average / Standard Deviation All Years <0.06 <0.06 <0.05 <0.03 <0.06 <0.04 0.08 0.04 <0.05 <0.03 <0.05 <0.03 <0.06 <0.02 <0.05 <0.03 <0.04 <0.02- : methyl mercury concentration not determined
Sampling locations and frequency governed by Amended C. of A. #3960-7Q4K2G.
Bracketed sampling notations are field identifications.
MDLs have been adjusted for all years for uniformity (0.02 ng/L for methyl mercury), as per Section 1.
0.05
-
-
-
0.05
-
-
0.07
-
-
-
-
0.03
-
-
-
0.03
-
-
0.07
0.04
-
-
0.04
0.08
-
-
0.02
-
-
-
-
0.04
0.02
-
-
0.04
-
-
-
-
0.04
-
0.06
-
-
-
0.06
-
-
-
0.03
-
-
0.04
0.04
-
-
-
-
-
-
0.03
-
-
-
-
<0.02
-
0.09
0.10
-
-
-
0.03
0.03
-
-
0.04
0.04
0.04
0.02
0.02
-
-
0.03
-
-
0.02
-
-
0.04
-
0.07
-
-
-
-
0.07
-
-
0.07
-
-
0.07
-
-
0.03
0.04
-
-
-
0.18
-
-
-
0.04
-
-
0.02
-
-
-
<0.02
-
-
-
0.07
-
-
0.03
0.08
-
-
-
0.05
-
-
0.27
-
-
-
-
-
-
0.07
0.04
-
-
0.03
-
0.05
-
<0.02
-
-
-
-
0.20
-
-
-
0.03
0.04
0.06
0.06
0.03
-
-
-
0.03
-
0.05
-
-
0.06
-
0.07
-
-
0.03
-
0.14
-
0.03
-
-
-
0.04
-
-
-
<0.02
-
-
0.07
-
-
-
<0.02
-
-
-
<0.02
-
-
0.08
0.03
-
-
0.03
-
-
-
0.04
-
-
-
-
0.05
-
0.07
0.08
-
-
0.09
-
-
-
0.06
-
-
0.03
-
-
-
0.10
-
-
0.05
-
-
<0.02
-
-
0.05
-
-
-
-
0.05
-
0.07
0.05
0.02
-
-
0.04
-
-
-
0.06
-
-
-
0.03
-
-
0.08
0.08
-
-
-
0.19
-
-
0.09
-
-
-
0.04
-
-
0.03
0.04
-
-
0.05
-
-
-
0.03
-
-
-
0.06
-
-
<0.02
-
0.05
-
0.08
-
-
-
0.06
-
-
-
0.08
-
-
0.08
<0.02
-
-
-
-
-
-
0.05
-
-
-
-
0.05
-
0.11
0.05
-
-
-
0.03
-
0.08
-
0.09
<0.02
0.11
0.07
0.04
-
-
0.02
-
-
0.03
-
-
-
-
-
-
0.10
-
0.05
-
-
0.04
0.18
-
-
0.08
-
-
-
0.05
-
-
-
0.11
-
-
0.05
0.09
-
-
0.03
-
-
-
0.10
-
-
-
0.17
-
-
0.07
0.12
-
-
-
0.10
-
-
0.12
-
-
-
-
-
-
0.13
0.14
-
-
0.05
-
-
-
0.14
-
-
-
-
0.02
-
0.07
-
0.04
0.08
0.14
0.06
0.05
-
-
0.02
-
-
0.03
-
-
0.10
-
0.07
-
-
0.03
-
0.05
-
0.03
-
-
-
0.05
-
-
-
0.03
-
-
0.06
-
-
-
<0.02
-
-
-
<0.02
-
-
0.04
<0.02
-
-
0.05
-
-
-
<0.02
-
-
-
-
0.07
-
0.06
-
-
-
0.06
-
-
-
0.05
-
-
-
0.04
-
-
-
0.15
-
-
0.03
-
0.04
-
-
<0.02
-
-
0.09
-
-
-
0.06
0.09
0.20
0.05
-
0.05
0.04
0.04
0.04
0.06
0.05
0.04
0.05
0.05
0.04
0.06
0.06
0.06
0.06
0.09
<0.02
0.03
0.03
0.02
0.02
0.04
0.05
0.07
0.04
0.03
0.04
0.03
0.08
0.04
0.07
0.04
0.02
-
0.05
0.04
-
0.06
<0.02
0.07
0.05
0.07
0.07
0.06
0.06
0.03
0.03
0.05
0.07
-
0.10
0.04
<0.02
0.03
0.06
0.07
0.08
0.04
0.03
0.07
<0.02
0.06
0.06
<0.02
0.08
0.04
0.06
0.04
0.08
0.09
0.05
-
-
-
0.03
0.07
0.05
0.02
0.04
-
-
0.02
0.02
0.10
0.04
-
-
-
-
0.06
0.07
-
-
-
-
-
-
-
0.05
0.08
0.10
-
-
-
-
-
-
0.05
<0.02
-
-
-
-
-
-
0.05
0.06
-
-
-
-
-
-
-
-
-
-
-
-
-
-
-
-
-
-
-
-
-
-
-
-
-
-
-
-
-
-
-
-
-
-
-
-
-
-
-
-
-
-
-
-
-
-
-
-
-
-
-
-
-
-
-
-
0.06
0.06
0.04
0.03
0.03
0.08
0.09
0.03
0.03
0.04
0.05
0.06
0.04
-
-
0.05
0.06
0.08
0.05
0.06
0.04
<0.02
<0.02
0.05
0.03
0.06
0.02
0.07
0.05
0.02
0.04
0.04
0.04
0.03
0.09
0.03
0.04
<0.02
-
0.05
0.03
-
0.06
0.08
0.04
0.07
0.06
0.04
0.08
<0.02
0.05
0.03
0.05
0.07
-
0.04
0.03
<0.02
<0.02
0.03
0.12
0.07
0.04
0.04
0.04
0.07
0.03
0.06
0.05
0.05
-
0.05
0.05
0.10
0.08
Table 17a: Methyl Mercury - Nayshkootayaow and Attawapiskat Rivers (Unfiltered)(concentrations in ng/L)
<0.02
0.02
0.07
0.10
-
0.03
0.03
0.03
-
-
0.03
-
-
0.04
-
0.06
0.04
0.02
-
-
0.03
-
-
Date
0.20
0.05
0.14
0.06
0.03
0.04
Attawapiskat RiverA-4
(Att Riv dn Naysh Riv)
Nayshkootayaow RiverUpstream
N-1(Naysh Riv up)
Nayshkootayaow RiverMiddle
N-2(Naysh Riv dn)
Nayshkootayaow RiverDownstream
N-3(Naysh Riv up Att Riv)
MonumentChannel
(Naysh RivControl)
Attawapiskat RiverA-1
(Att Riv up 2)
Attawapiskat RiverA-2
(Att Riv up A2-1)
Attawapiskat RiverA-5
(Att Riv dn 500(40))
Attawapiskat RiverA-3
(Att Riv dn A3-1)
CEQG for Protection of Aquatic Life: 4 ng/L
TC140504 Page 84

De Beers Canada Inc., Victor MineMercury Performance Monitoring, 2015 Annual Report
per Certificate of Approval #3960-7Q4K2G, Conditions 7(5) and 7(6)
Feb-08
May-08
Aug-08
Oct-08
Jan-09
Feb-09
Mar-09
Apr-09
May-09
Jun-09
Jul-09
Aug-09
Sep-09
Oct-09
Nov-09
Dec-09
Jan-10
Feb-10
Mar-10
Apr-10
May-10
Jun-10
Jul-10
Aug-10
Sep-10
Oct-10
Nov-10
Dec-10
Jan-11
Feb-11
Mar-11
Apr-11
May-11
Jun-11
Jul-11
Aug-11
Sep-11*
Oct-11
Nov-11
Dec-11
Jan-12
Feb-12
Mar-12
Apr-12
May-12
Jun-12
Jul-12
Aug-12
Sep-12
Oct-12
Nov-12
Dec-12
Jan-13
Feb-13
Mar-13
Apr-13
May-13
Jun-13
Jul-13
Aug-13
Sep-13
Oct-13
Nov-13
Dec-13
Jan-14
Feb-14
Mar-14
Apr-14
May-14
Jun-14
Jul-14
Aug-14
Sep-14
Oct-14
Nov-14
Dec-14
Jan-15
Feb-15
Mar-15
Apr-15
May-15
Jun-15
Jul-15
Aug-15
Sep-15
Oct-15
Nov-15
Dec-15
Average / Standard Deviation 2009 0.06 0.03 <0.05 <0.04 <0.05 <0.04 <0.04 <0.02 0.06 0.06 0.04 0.02 - - 0.05 0.04 <0.03 <0.02Average / Standard Deviation 2010 <0.04 <0.01 0.07 0.04 0.05 0.03 0.06 0.03 <0.04 <0.01 <0.03 <0.01 - - <0.03 <0.01 0.04 0.01Average / Standard Deviation 2011 <0.04 <0.02 <0.04 <0.02 <0.05 <0.03 0.06 0.05 0.03 0.01 <0.03 <0.02 - - <0.03 <0.02 <0.03 <0.01Average / Standard Deviation 2012 <0.03 <0.01 0.03 0.01 0.04 0.01 0.07 0.02 <0.03 <0.01 <0.04 <0.01 - - <0.03 <0.01 <0.02 <0.00Average / Standard Deviation 2013 <0.03 <0.02 <0.03 <0.01 <0.03 <0.01 <0.03 <0.01 <0.02 <0.00 <0.04 <0.04 <0.02 <0.00 <0.03 <0.01 <0.02 <0.00Average / Standard Deviation 2014 <0.02 <0.01 0.03 0.00 0.04 0.02 <0.05 <0.04 0.03 0.01 <0.03 <0.01 0.04 0.01 <0.03 <0.01 <0.02 <0.01Average / Standard Deviation 2015 0.03 0.01 <0.03 <0.01 0.04 0.01 <0.05 <0.02 0.05 0.02 <0.03 <0.01 0.04 0.02 <0.03 <0.01 <0.03 <0.01
Average / Standard Deviation All Years <0.04 <0.02 <0.04 <0.02 <0.04 <0.02 <0.05 <0.03 <0.03 <0.02 <0.04 <0.02 <0.03 <0.01 <0.03 <0.02 <0.03 <0.01- : methyl mercury concentration not determined
Sampling locations and frequency governed by Amended C. of A. #3960-7Q4K2G.
Bracketed sampling notations are field identifications.
MDLs have been adjusted for all years for uniformity (0.02 ng/L for methyl mercury), as per Section 1.
Table 17b: Methyl Mercury - Nayshkootayaow and Attawapiskat Rivers (Filtered)(concentrations in ng/L)
Date
Draft USEPA Criteria: 0.05 ng/L0.03 0.04
Attawapiskat RiverA-4
(Att Riv dn Naysh Riv)
Attawapiskat RiverA-3
(Att Riv dn A3-1)
Attawapiskat RiverA-5
(Att Riv dn 500(40))
Attawapiskat RiverA-2
(Att Riv up A2-1)
Attawapiskat RiverA-1
(Att Riv up 2)
MonumentChannel
(Naysh RivControl)
Nayshkootayaow RiverDownstream
N-3(Naysh Riv up Att Riv)
Nayshkootayaow RiverMiddle
N-2(Naysh Riv dn)
Nayshkootayaow RiverUpstream
N-1(Naysh Riv up)
0.02
-
-
0.09
-
0.04
<0.02
0.05
0.03
0.03
-
-
<0.02
-
-
0.04
-
-
0.07
-
-
-
-
<0.02
-
-
-
0.05
-
-
0.05
-
0.06
-
-
<0.02
-
-
-
0.04
-
0.04
-
-
0.02
-
-
-
-
0.04
-
-
-
<0.02
-
-
-
0.06
-
-
<0.02
0.02
0.02
-
-
<0.02
0.03
-
-
-
-
-
0.04
-
0.04
-
-
0.02
-
-
0.03
-
-
-
-
-
0.09
-
-
-
0.03
0.02
0.06
0.03
0.03
-
-
<0.02
-
-
0.11
-
-
0.06
-
0.02
-
-
0.05
-
-
<0.02
-
0.04
-
0.03
-
0.05
-
-
0.07
-
-
-
-
-
-
-
-
0.05
-
-
-
0.04
-
-
-
-
0.07
-
-
0.03
0.04
-
-
0.03
-
0.03
-
-
0.05
-
-
-
-
0.03
-
0.03
0.05
0.02
0.03
-
-
<0.02
-
-
-
0.10
-
0.04
-
-
-
-
0.05
-
-
-
0.04
-
-
-
<0.02
-
-
0.04
0.04
-
-
0.02
-
0.04
0.06
-
-
0.04
-
0.05
-
-
0.12
-
-
-
0.05
-
-
-
<0.02
-
-
-
-
-
0.02
-
0.05
0.06
-
-
0.02
-
0.04
-
-
<0.02
-
-
-
0.02
-
-
-
-
0.03
-
-
-
<0.02
-
-
0.05
-
0.03
-
-
-
0.02
-
-
0.03
-
-
-
0.04
-
0.04
-
<0.02
-
-
-
-
-
-
0.04
-
-
-
0.04
0.03
0.03
0.02
0.02
-
-
<0.02
-
-
0.03
-
-
0.07
-
0.03
-
-
0.03
0.06
0.10
0.04
0.02
-
-
<0.02
-
-
0.07
-
-
0.04
0.03
-
-
<0.02
-
0.05
-
0.04
0.05
-
-
0.07
-
-
-
-
0.03
-
-
-
-
-
-
-
0.10
-
-
0.03
-
0.08
-
-
-
0.03
-
-
0.11
-
0.04
-
-
0.02
-
0.08
-
0.09
-
-
-
-
0.04
-
-
-
0.04
-
-
<0.02
-
-
-
0.11
-
-
0.04
0.03
-
-
<0.02
-
0.07
-
0.05
-
-
-
0.03
-
-
0.04
-
-
0.02
-
-
-
<0.02
-
-
-
-
-
-
0.04
<0.02
-
-
-
-
0.02
-
0.02
-
-
-
-
<0.02
-
-
<0.02
<0.02
-
-
<0.02
0.05
-
-
0.03
-
-
<0.02
<0.02
-
-
<0.02
-
-
0.02
-
-
0.03
0.02
0.03
0.02
0.02
-
-
0.03
0.03
0.03
0.02
0.03
0.02
-
-
<0.02
-
-
-
-
0.05
0.03
0.03
0.04
<0.02
-
0.06
0.15
0.09
0.04
0.02
0.02
<0.02
<0.02
<0.02
0.04
0.05
<0.02
0.04
<0.02
0.04
0.04
0.03
0.05
<0.02
<0.02
0.02
0.02
0.07
-
0.03
0.03
<0.02
-
0.04
0.03
-
0.02
0.04
0.02
0.03
0.02
<0.02
0.04
<0.02
0.03
0.02
<0.02
<0.02
0.04
0.02
0.03
0.04
0.03
0.03
<0.02
<0.02
<0.02
<0.02
<0.02
0.03
0.03
0.03
0.04
0.03
0.03
0.05
0.03
<0.02
0.03
-
-
-
-
-
-
-
-
-
-
-
-
-
-
-
-
-
-
-
-
-
-
-
<0.02
0.04
0.04
-
-
-
-
-
-
-
-
-
-
-
-
-
-
-
-
-
-
-
-
-
-
-
-
-
-
-
-
-
-
-
-
-
0.03
<0.02
-
-
-
-
-
-
-
-
-
-
0.02
<0.02
-
-
-
0.05
-
-
-
-
-
-
-
0.03
0.05
0.02
-
0.05
0.03
0.08
<0.02
0.07
-
-
-
0.05
0.03
0.02
0.02
0.02
-
-
0.02
0.03
0.03
0.03
0.05
-
-
-
0.02
0.04
0.03
0.03
0.02
0.04
0.05
0.04
0.03
<0.02
0.03
<0.02
0.02
0.07
-
0.06
<0.02
<0.02
<0.02
<0.02
0.02
-
0.04
<0.02
0.05
0.04
0.04
<0.02
0.04
0.05
<0.02
0.04
<0.02
0.04
0.03
<0.02
0.03
0.03
-
0.06
0.03
-
0.05
<0.02
0.03
0.03
<0.02
0.03
0.03
0.04
0.03
0.03
<0.02
0.04
0.03
0.02
-
0.05
0.04
0.06
0.03
0.03
0.04
0.03
0.04
0.05
<0.02
0.03
<0.02
<0.02
<0.02
<0.02
0.18
0.06
0.04
<0.02
-
-
0.04
-
-
-
0.02
-
-
0.15
-
<0.02
-
-
0.04
-
0.04
-
-
0.05
-
-
-
0.02
-
-
-
0.02
-
-
-
-
-
0.03
-
-
0.05
-
-
<0.02
-
<0.02
-
-
0.02
0.03
-
-
<0.02
-
<0.02
-
-
0.03
-
-
-
<0.02
-
-
-
-
0.04
-
-
-
0.02
-
-
0.04
-
-
-
0.06
-
-
0.03
-
0.05
-
0.04
-
TC140504 Page 85

De Beers Canada Inc., Victor MineMercury Performance Monitoring, 2015 Annual Report
per Certificate of Approval #3960-7Q4K2G, Conditions 7(5) and 7(6)
Unfiltered Filtered Unfiltered Filtered
CEQG for Protection of Aquatic Life: 26 ng/L**
CEQG for Protection of Aquatic Life: 4 ng/L**
Draft USEPA Criteria: 0.05 ng/L**
Nov-07 1.33 1.32 <0.02 <0.02 VDW-6, 11 and 22
Dec-07 1.33 0.95 <0.02 <0.02 VDW-6, 11 and 22
Jan-08 0.87 0.61 <0.02 <0.02 VDW-6, 11, 15, 17 and 22
Feb-08 1.55 1.27 <0.02 <0.02 VDW-6, 11 and 22
Mar-08 0.70 0.69 <0.02 <0.02 VDW-6, 11, 15, 17 and 22
Apr-08 0.84 0.69 <0.02 <0.02 VDW-7, 11, 15, 17 and 22
May-08 0.78 0.63 <0.02 <0.02 VDW-7, 11, 15, 17 and 22
Jun-08 0.72 0.60 VDW-7, 11, 15, 17 and 22
Jul-08 0.65 0.47 <0.02 <0.02 VDW-6, 11, 15, 17 and 22
Aug-08 2.63 0.99 VDW-6, 11, 15, 17 and 22
Sep-08 0.67 0.57 VDW-6, 11, 15, 17 and 22
Oct-08 2.20 2.01 <0.02 <0.02 VDW-3, 6, 7, 11, 15, 17 and 22
Nov-08 1.00 0.92 VDW-3, 6, 7, 11, 15, 17 and 22
Dec-08 1.34 1.07 <0.02 <0.02 VDW-3, 6, 7, 11, 15, 17 and 22
Jan-09 1.01 1.13 <0.02 <0.02 VDW-3, 6, 7, 11, 15, 17 and 22
Feb-09 1.45 1.18 VDW-3, 6, 7, 11, 15, 17 and 22
Mar-09 1.49 1.32 <0.02 <0.02 VDW-3, 6, 7, 11, 15, 17 and 22
Apr-09 1.21 1.11 <0.02 <0.02 VDW-3, 6, 7, 11, 15, 17 and 22
May-09 1.49 0.83 <0.02 <0.02 VDW-3, 6, 7, 11, 15, 17 and 22
Jun-09 1.99 0.67 0.04 <0.02 VDW-3, 6, 7, 11, 15, 17 and 22
Jul-09 1.41 0.64 0.09 <0.02 VDW-3, 6, 7, 11, 15, 17 and 22
Aug-09 <0.10 <0.10 VDW-3, 6, 7, 11, 15, 17 and 22
Sep-09 1.25 <0.02 <0.02 VDW-3, 6, 7, 11, 15, 17 and 22
Oct-09 VDW-3, 6, 7, 11, 15, 17 and 22
Nov-09 VDW-3, 6, 7, 11, 15, 17 and 22
Dec-09 VDW-3, 6, 7, 11, 15, 17 and 22
Jan-10 0.93 0.40 0.04 <0.02 VDW-3, 6, 7, 11, 14, 15, 17 and 22
Feb-10 1.65 <0.10 0.04 <0.02 VDW-3, 6, 7, 11, 14, 15, 17 and 22
Mar-10 1.60 0.36 0.03 0.02 VDW-3, 6, 7, 11, 14, 15, 17 and 22
Apr-10 0.72 <0.10 <0.02 <0.02 VDW-3, 6, 7, 11, 14, 15, 17 and 22
May-10 1.25 <0.10 <0.02 <0.02 VDW-3, 6, 7, 11, 14, 15, 17 and 22
Jun-10 <0.10 <0.10 0.04 0.03 VDW-3, 6, 7, 11, 14, 15, 17 and 22
Jul-10 1.04 0.15 0.02 <0.02 VDW-3, 6, 7, 11, 14, 15, 17 and 22
Aug-10 1.61 <0.10 <0.02 0.03 VDW-3, 6, 7, 11, 14, 15, 17 and 22
Sep-10 1.23 <0.10 <0.02 <0.02 VDW-3, 6, 7, 11, 14, 15, 17 and 22
Oct-10 1.19 <0.10 <0.02 <0.02 VDW-3, 6, 7, 11, 14, 15, 17 and 22
Nov-10 1.44 <0.10 <0.02 <0.02 VDW-3, 6, 7, 11, 14, 15, 17 and 22
Dec-10 0.88 0.43 0.03 <0.02 VDW-3, 6, 7, 11, 14, 15, 17 and 22
Jan-11 1.01 0.10 0.04 VDW-6, 7, 11, 12, 14, 15, 17, 18 and 22
Feb-11 1.49 1.29 <0.02 <0.02 VDW-6, 7, 11, 12, 14, 15, 17, 18 and 22
Mar-11 1.22 0.63 <0.02 <0.02 VDW-6, 7, 11, 12, 14, 15, 17, 18 and 22
Apr-11 0.85 <0.10 <0.02 <0.02 VDW-6, 7, 11, 12, 14, 15, 17, 18 and 22
May-11 1.55 <0.10 <0.02 <0.02 VDW-6, 7, 11, 12, 14, 15, 17, 18 and 22
Jun-11 0.96 0.82 <0.02 <0.02 VDW-2, 6, 7, 11, 12, 14, 15, 17, 18 and 22
Jul-11 1.96 0.37 <0.02 <0.02 VDW-2, 6, 7, 11, 12, 14, 15, 17, 18 and 22
Aug-11 0.89 0.38 <0.02 <0.02 VDW-2, 7, 11, 12, 14, 15, 17, 18 and 22
Sep-11 VDW-2, 6, 7, 11, 12, 14, 15, 17, 18 and 22
Oct-11 11.65 0.60 0.04 <0.02 VDW-2, 6, 7, 11, 12, 14, 15, 17, 18 and 22
Nov-11 3.10 0.45 0.04 <0.02 VDW-2, 6, 7, 11, 12, 14, 15, 17, 18 and 22
Dec-11 1.07 0.24 0.02 <0.02 VDW-2, 6, 7, 12, 14, 15, 17, 18 and 22
Jan-12 1.17 <0.10 0.02 <0.02 VDW-2, 6, 7, 12, 14, 15, 17, 18, 21 and 22
Feb-12 0.62 0.24 <0.02 <0.02 VDW-2, 6, 7, 12, 14, 15, 17, 18, 21 and 22
Mar-12 0.51 0.11 <0.02 <0.02 VDW-2, 6, 7, 12, 14, 15, 17, 18, 21 and 22
Apr-12 1.33 0.26 <0.02 <0.02 VDW-2, 6, 7, 12, 14, 15, 17, 18, 21 and 22
May-12 2.11 0.18 0.27 <0.02 VDW-2, 6, 7, 11, 12, 14, 15, 17, 18, 21 and 22
Jun-12 1.38 0.15 <0.02 <0.02 VDW-2, 6, 7, 12, 14, 15, 17, 18, 21 and 22
Jul-12 0.80 0.27 0.02 <0.02 VDW-2, 6, 7, 12, 14, 15, 17, 18, 21 and 22
Aug-12 1.69 0.19 <0.02 VDW-2, 6, 7, 12, 14, 15, 17, 18, 21 and 22
Sep-12 3.55 1.31 <0.02 VDW-2, 6, 7, 12, 14, 15, 17, 18, 21 and 22
Oct-12 0.74 0.22 <0.02 <0.02 VDW-2, 6, 7, 12, 14, 15, 17, 18, 21 and 22
Nov-12 1.87 1.02 0.04 VDW-2, 6, 7, 12, 14, 15, 17, 18, 21 and 22
Dec-12 2.45 0.88 0.02 VDW-2, 6, 7, 12, 14, 15, 17, 18, 21 and 22
Jan-13 1.46 0.32 <0.02 0.02 VDW-2, 6, 7, 11, 12, 14, 15, 17, 18, 21 and 22
Feb-13 5.51 0.98 <0.02 <0.02 VDW-2, 6, 7, 11, 12, 14, 15, 17, 18, 21 and 22
Mar-13 2.63 0.94 <0.02 <0.02 VDW-2, 6, 7, 11, 12, 14, 15, 17, 18, 21 and 22
Apr-13 2.03 0.71 0.03 0.02 VDW-2, 6, 7, 11, 12, 14, 15, 17, 18, 21 and 22
May-13 2.12 0.99 0.04 <0.02 VDW-2, 6, 7, 11, 12, 14, 15, 17, 18, 21 and 22
Jun-13 1.84 0.72 <0.02 <0.02 VDW-2, 6, 7, 11, 12, 14, 15, 17, 18, 21 and 22
Jul-13 0.99 0.20 <0.02 <0.02 VDW-2, 6, 7, 11, 12, 14, 15, 17, 18, 21 and 22
Aug-13 2.69 0.83 <0.02 <0.02 VDW-2, 6, 7, 11, 12, 14, 15, 17, 18, 21, 22, 23 and 25
Sep-13 3.16 1.20 <0.02 <0.02 VDW-2, 6, 7, 11, 12, 14, 15, 17, 18, 21, 22, 23 and 25
Oct-13 2.97 0.80 0.04 <0.02 VDW-2, 6, 7, 11, 12, 14, 15, 17, 18, 21, 22, 23 and 25
Nov-13 VDW-2, 6, 7, 11, 12, 14, 15, 17, 18, 21, 22, 23 and 25
Dec-13 2.46 0.42 <0.02 <0.02 VDW-2, 6, 7, 11, 12, 14, 15, 17, 18, 21, 22, 23 and 25
Jan-14 7.40 1.05 <0.02 <0.02 VDW-2, 6, 7, 11, 12, 14, 15, 17, 18, 21, 22, 23 and 25
Feb-14 2.53 0.29 <0.02 <0.02 VDW-2, 6, 7, 11, 12, 14, 15, 17, 18, 21, 22, 23 and 25
Mar-14 3.33 1.05 0.02 <0.02 VDW-2, 6, 7, 11, 12, 14, 15, 17, 18, 21, 22, 23 and 25
Apr-14 3.19 1.50 <0.02 <0.02 VDW-2, 6, 7, 11, 12, 14, 15, 17, 18, 21, 22, 23 and 25
May-14 4.54 1.75 VDW-2, 6, 7, 11, 12, 14, 15, 17, 18, 21, 22, 23 and 25
Jun-14 4.73 1.07 VDW-2, 6, 7, 11, 12, 14, 15, 17, 18, 21, 22, 23, 25 and 31
Jul-14 3.35 1.54 <0.02 <0.02 VDW-2, 6, 7, 11, 12, 14, 15, 17, 18, 21, 22, 23, 25 and 31
Aug-14 3.56 0.78 0.05 <0.02 VDW-2, 6, 7, 11, 12, 14, 15, 17, 18, 21, 22, 23, 25 and 31
Sep-14 3.19 0.96 <0.02 <0.02 VDW-2, 6, 7, 11, 12, 14, 15, 17, 18, 21, 22, 23, 25 and 31
Oct-14 2.95 1.12 <0.02 <0.02 VDW-2, 6, 7, 11, 12, 14, 15, 17, 18, 21, 22, 23, 25 and 31
Nov-14 2.55 0.47 0.02 <0.02 VDW-2, 6, 7, 11, 12, 14, 15, 17, 18, 21, 22, 23, 25 and 31
Dec-14 2.52 0.72 <0.02 <0.02 VDW-2, 6, 7, 11, 12, 14, 15, 17, 18, 21, 22, 23, 25 and 31
Jan-15 1.48 0.32 VDW-2, 6, 7, 11, 12, 14, 15, 17, 18, 21, 22, 23 and 25
Feb-15 1.20 0.27 <0.02 <0.02 VDW-2, 6, 7, 11, 12, 14, 15, 17, 18, 21, 22, 23 and 25
Mar-15 2.15 0.95 0.06 VDW-2, 6, 7, 11, 12, 14, 15, 17, 18, 21, 22, 23 and 25
Apr-15 1.43 0.57 VDW-2, 6, 7, 11, 12, 14, 15, 17, 18, 21, 22, 23 and 25
May-15 2.32 0.47 VDW-2, 6, 7, 11, 12, 14, 15, 17, 18, 21, 22, 23 and 25
Jun-15 1.89 1.38 VDW-2, 6, 7, 11, 12, 14, 15, 17, 18, 21, 22, 23, 25 and 31
Jul-15 1.60 0.69 0.03 0.08 VDW-2, 6, 7, 11, 12, 14, 15, 17, 18, 21, 22, 23, 25 and 31
Aug-15 2.82 0.97 0.03 0.02 VDW-2, 6, 7, 11, 12, 14, 15, 17, 18, 21, 22, 23, 25 and 31
Sep-15 3.93 0.78 <0.02 <0.02 VDW-2, 6, 7, 11, 12, 14, 15, 17, 18, 21, 22, 23, 25 and 31
Oct-15 4.09 1.90 <0.02 VDW-2, 6, 7, 11, 12, 14, 15, 17, 18, 21, 22, 23, 25 and 31
Nov-15 4.79 2.17 <0.02 <0.02 VDW-2, 6, 7, 11, 12, 14, 15, 17, 18, 21, 22, 23, 25 and 31
Dec-15 5.61 2.01 <0.02 <0.02 VDW-2, 6, 7, 11, 12, 14, 15, 17, 18, 21, 22, 23, 25 and 31
Average 2009 <1.27 <0.91 <0.03 <0.02 VDW-2, 6, 7C, 8, 10, 11, 12, 14, 15, 17, 18, 21, 22, 23, and 31
Average 2010 <1.14 <0.18 <0.03 <0.02 VDW-2, 6, 7C, 8, 10, 11, 12, 14, 15, 17, 18, 21, 22, 23, and 31
Average 2011 2.34 <0.50 <0.03 <0.02 VDW-2, 6, 7C, 8, 10, 11, 12, 14, 15, 17, 18, 21, 22, 23, and 31
Average 2012 1.52 <0.41 <0.05 <0.02 VDW-2, 6, 7C, 8, 10, 11, 12, 14, 15, 17, 18, 21, 22, 23, and 31
Average 2013 2.53 0.74 <0.02 <0.02 VDW-2, 6, 7C, 8, 10, 11, 12, 14, 15, 17, 18, 21, 22, 23, and 31
Average 2014 3.65 1.03 <0.02 <0.02 VDW-2, 6, 7C, 8, 10, 11, 12, 14, 15, 17, 18, 21, 22, 23, and 31
Average 2015 2.78 1.04 <0.03 <0.03 VDW-2, 6, 7C, 8, 10, 11, 12, 14, 15, 17, 18, 21, 22, 23, and 31
Average All Years <2.06 <0.72 <0.03 <0.02 VDW-2, 6, 7C, 8, 10, 11, 12, 14, 15, 17, 18, 21, 22, 23, and 31
Blank cells indicate that a sample was not collected
Table18: Mercury Content in Well Field Discharge(concentrations in ng/L)
Total Mercury Methyl Mercury
MDLs have been adjusted for all years for uniformity (0.02 ng/L for methyl mercury and 0.1 ng/L for total mercury), as per Section 1
Date Wells in Production
TC140504 Page 86

De Beers Canada Inc., Victor MineMercury Performance Monitoring, 2015 Annual Report
per Certificate of Approval #3960-7Q4K2G, Conditions 7(5) and 7(6)
VDW-2 VDW-3 VDW-6 VDW-7 VDW-7C VDW-8 VDW-10 VDW-11 VDW-12 VDW-14 VDW-15 VDW-17 VDW-18 VDW-21 VDW-22 VDW-23 VDW-25 VDW-31
Nov-07 - - - - - - - - - - - - - - - - - -
Dec-07 - - <0.10 - - - - 1.31 - - - - - - 3.08 - - -
Jan-08 - - <0.10 - - - - 1.64 - - 0.29 <0.10 - - 3.66 - - -
Feb-08 - - 0.12 - - - - 1.41 - - - - - - 3.13 - - -
Mar-08 - - 0.33 - - - - 2.93 - - 0.22 0.28 - - 3.26 - - -
Apr-08 - - - - - - - 1.89 - - 0.64 0.31 - - 4.27 - - -
Jul-08 - - 0.14 - - - - 2.18 - - 0.20 0.19 - - 2.28 - - -
Oct-08 - <0.10 <0.10 0.42 - - - *38.6 - - <0.10 <0.10 - - 6.52 - - -
Jan-09 - <0.10 <0.10 0.25 - - - 3.33 - - <0.10 0.10 - - 6.56 - - -
Apr-09 - <0.10 <0.10 - - - - 3.34 - - <0.10 0.10 - - 5.59 - - -
Jul-09 - 0.74 0.52 1.11 - - - 3.50 - - 0.69 0.85 - - 4.37 - - -
Oct-09 - 0.14 0.63 0.16 - - - 1.55 - - 0.41 <0.10 - - 1.61 - - -
Jan-10 - <0.10 <0.10 <0.10 - - - 3.40 - <0.10 <0.10 <0.10 - - 3.80 - - -
Apr-10 - <0.10 <0.10 <0.10 - - - 2.59 - <0.10 <0.10 <0.10 - - 3.32 - - -
Jul-10 - 0.12 <0.10 0.28 - - - 3.00 - <0.10 <0.10 0.24 - - 3.36 - - -
Oct-10 - <0.10 <0.10 <0.10 - - - 4.31 - <0.10 <0.10 <0.10 0.35 - 5.18 - - -
Jan-11 - - - 0.23 - - - 3.34 1.39 0.20 <0.10 <0.10 <0.10 - 3.66 - - -
Apr-11 - - 0.39 0.72 - - - 3.76 1.37 1.07 0.44 0.66 0.40 - 2.92 - - -
Jul-11 0.85 - - 0.57 - - - 5.15 2.18 0.37 0.79 0.25 0.39 - 5.18 - - -
Oct-11 0.59 - 0.60 2.08 - - - 125.15* 2.75 0.67 0.55 0.95 1.21 - 15.86* - - -
Jan-12 0.43 - <0.10 0.43 - - - - 2.48 <0.10 0.41 <0.10 0.60 1.23 109.24* - - -
Apr-12 0.54 - 0.47 0.68 - - - - 3.65 0.51 0.56 0.32 1.00 0.89 6.63 - - -
Jul-12 0.12 - 0.13 0.28 - - - - 2.66 <0.10 0.12 <0.10 0.47 0.42 8.29 - - -
Oct-12 <0.10 - <0.10 0.69 - - - - 3.63 <0.10 <0.10 <0.10 1.19 0.66 9.69 - - -
Jan-13 1.15 - 0.34 0.33 - - - 29.80 4.00 1.92 0.71 1.26 2.43 2.63 8.97 - - -
Apr-13 0.12 - 0.16 0.28 - - - 20.99 3.26 0.18 0.12 0.13 0.96 0.42 10.19 - - -
Jul-13 <0.10 - 0.23 0.23 - - - 24.70 2.88 <0.10 0.24 <0.10 1.46 1.53 3.85 - - -
Aug-13 - - - - - - - - - - - - - - - 1.05 <0.10 -
Oct-13 0.33 - 0.39 9.50 - - - 34.40 1.98 0.36 0.49 <0.10 1.61 6.98 3.54 1.32 - -
Jan-14 0.28 - 0.28 0.45 - - - 16.8 3.14 0.22 0.18 <0.10 1.51 0.45 9.83 0.51 0.11 -
Apr-14 0.28 - 0.42 2.19 - - - 20.9 4.54 0.36 0.23 <0.10 2.88 26.1 25.3* 0.56 0.2 -
Jul-14 <0.10 - <0.10 0.44 - - - 18.2 8.11 0.21 <0.10 <0.10 1.86 5.95 27.2 <0.10 0.22 0.42
Oct-14 2.72 - 1.50 9.09 - - - 11.7 8.8 3.77 0.29 0.52 2.28 3.31 15.2 <0.10 0.57 0.36
Jan-15 0.49 - - - 0.83 - - 2.71 4.52 0.17 - - 2.27 1.46 14.00 0.11 - -
Feb-15 - - 1.58 - - - - - - - - - - - - - 0.11 -
Apr-15 <0.10 - 0.17 - 2.93 - - 1.19 5.13 0.20 <0.10 <0.10 0.15 4.74 14.90 <0.10 <0.10 <0.10
May-15 1.14 - - - - - - - - - - - - - - - - -
Jun-15 - - - - - - 1.10 - - - - - - - - - - -
Jul-15 0.14 - 0.25 - - - - - 8.02 0.12 <0.10 <0.10 - - 24.00 0.95 0.20 0.10
Aug-15 - - - - - - - - - - - - - 5.06 - - - -
Sep-15 - - - - - 38.06 - - - - - - - - - - - -
Oct-15 0.37 - 0.21 - - 81.58 19.04 - 0.41 0.30 0.25 0.26 0.73 3.15 - 0.60 <0.10 0.33
Average 2009 - <0.27 <0.34 0.51 - - - 2.93 - - <0.33 <0.29 - - 4.53 - - -
Average 2010 - <0.10 <0.10 <0.14 - - - 3.32 - <0.10 <0.10 <0.13 - - 3.91 - - -
Average 2011 0.72 - 0.50 0.90 - - - 4.08 1.92 0.58 <0.47 <0.49 <0.53 - 3.92 - - -
Average 2012 <0.30 - <0.20 0.52 - - - 7.55 3.11 <0.20 <0.30 <0.16 0.82 0.80 8.20 - - -
Average 2013 <0.43 - 0.28 2.59 - - - 27.47 3.03 <0.64 0.39 <0.40 1.62 2.89 6.64 1.19 <0.10 -
Average 2014 <0.85 - <0.58 3.04 - - - 16.90 6.15 1.14 <0.20 <0.21 2.13 8.95 17.41 <0.32 0.28 -
Average 2015 <0.45 - 0.55 - 1.88 59.82 10.07 1.95 4.52 0.20 <0.15 <0.15 1.05 3.60 17.63 <0.44 <0.13 <0.18
Average All Years <0.52 <0.18 <0.31 <1.28 1.88 59.82 10.07 8.52 3.74 <0.48 <0.28 <0.25 <1.19 4.06 7.36 <0.54 <0.19 <0.26- : total mercury concentration not determined
* Samples excluded from average calculations
** These limits do not apply to groundwater
Sampling locations and frequency governed by Amended C. of A. #3960-7Q4K2G.
MDLs have been adjusted for all years for uniformity (0.1 ng/L for total mercury), as per Section 1.
Table 19a: Total Mercury - Individual Mine Dewatering Wells (Unfiltered)(concentrations in ng/L)
CEQG for Protection of Aquatic Life: 26 ng/L**Date
TC140504 Page 87
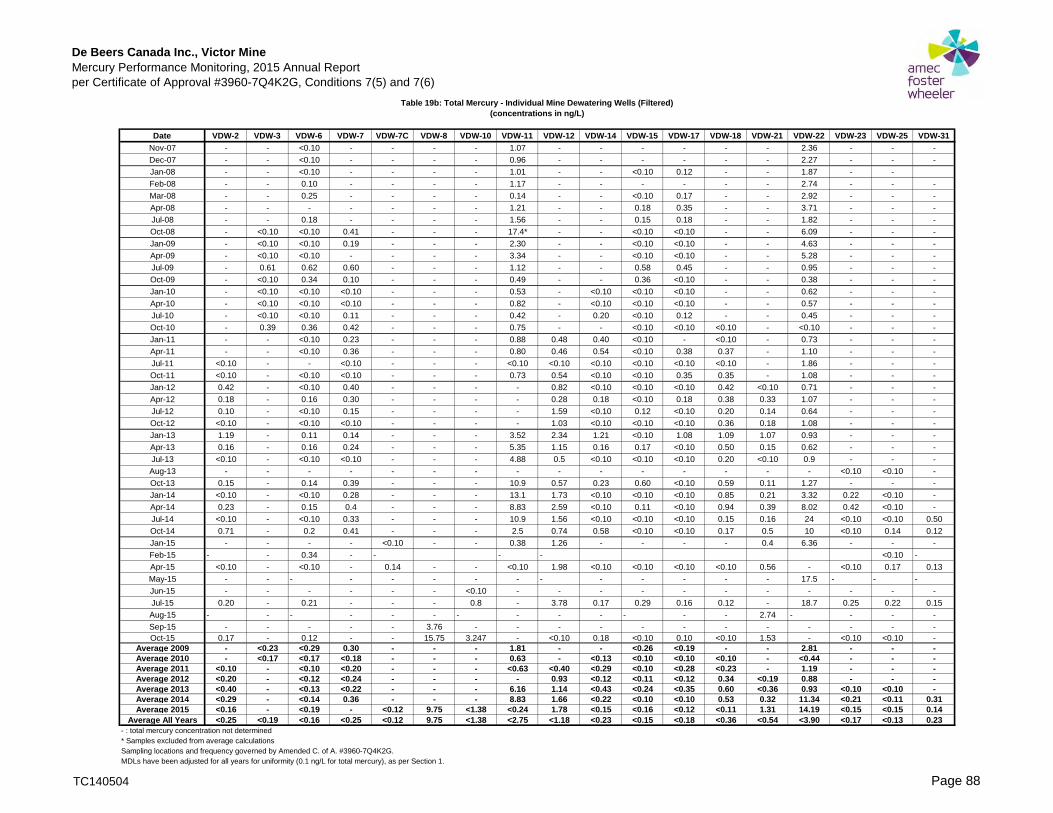
De Beers Canada Inc., Victor MineMercury Performance Monitoring, 2015 Annual Report
per Certificate of Approval #3960-7Q4K2G, Conditions 7(5) and 7(6)
Date VDW-2 VDW-3 VDW-6 VDW-7 VDW-7C VDW-8 VDW-10 VDW-11 VDW-12 VDW-14 VDW-15 VDW-17 VDW-18 VDW-21 VDW-22 VDW-23 VDW-25 VDW-31
Nov-07 - - <0.10 - - - - 1.07 - - - - - - 2.36 - - -
Dec-07 - - <0.10 - - - - 0.96 - - - - - - 2.27 - - -
Jan-08 - - <0.10 - - - - 1.01 - - <0.10 0.12 - - 1.87 - -
Feb-08 - - 0.10 - - - - 1.17 - - - - - - 2.74 - - -
Mar-08 - - 0.25 - - - - 0.14 - - <0.10 0.17 - - 2.92 - - -
Apr-08 - - - - - - - 1.21 - - 0.18 0.35 - - 3.71 - - -
Jul-08 - - 0.18 - - - - 1.56 - - 0.15 0.18 - - 1.82 - - -
Oct-08 - <0.10 <0.10 0.41 - - - 17.4* - - <0.10 <0.10 - - 6.09 - - -
Jan-09 - <0.10 <0.10 0.19 - - - 2.30 - - <0.10 <0.10 - - 4.63 - - -
Apr-09 - <0.10 <0.10 - - - - 3.34 - - <0.10 <0.10 - - 5.28 - - -
Jul-09 - 0.61 0.62 0.60 - - - 1.12 - - 0.58 0.45 - - 0.95 - - -
Oct-09 - <0.10 0.34 0.10 - - - 0.49 - - 0.36 <0.10 - - 0.38 - - -
Jan-10 - <0.10 <0.10 <0.10 - - - 0.53 - <0.10 <0.10 <0.10 - - 0.62 - - -
Apr-10 - <0.10 <0.10 <0.10 - - - 0.82 - <0.10 <0.10 <0.10 - - 0.57 - - -
Jul-10 - <0.10 <0.10 0.11 - - - 0.42 - 0.20 <0.10 0.12 - - 0.45 - - -
Oct-10 - 0.39 0.36 0.42 - - - 0.75 - - <0.10 <0.10 <0.10 - <0.10 - - -
Jan-11 - - <0.10 0.23 - - - 0.88 0.48 0.40 <0.10 - <0.10 - 0.73 - - -
Apr-11 - - <0.10 0.36 - - - 0.80 0.46 0.54 <0.10 0.38 0.37 - 1.10 - - -
Jul-11 <0.10 - - <0.10 - - - <0.10 <0.10 <0.10 <0.10 <0.10 <0.10 - 1.86 - - -
Oct-11 <0.10 - <0.10 <0.10 - - - 0.73 0.54 <0.10 <0.10 0.35 0.35 - 1.08 - - -
Jan-12 0.42 - <0.10 0.40 - - - - 0.82 <0.10 <0.10 <0.10 0.42 <0.10 0.71 - - -
Apr-12 0.18 - 0.16 0.30 - - - - 0.28 0.18 <0.10 0.18 0.38 0.33 1.07 - - -
Jul-12 0.10 - <0.10 0.15 - - - - 1.59 <0.10 0.12 <0.10 0.20 0.14 0.64 - - -
Oct-12 <0.10 - <0.10 <0.10 - - - - 1.03 <0.10 <0.10 <0.10 0.36 0.18 1.08 - - -
Jan-13 1.19 - 0.11 0.14 - - - 3.52 2.34 1.21 <0.10 1.08 1.09 1.07 0.93 - - -
Apr-13 0.16 - 0.16 0.24 - - - 5.35 1.15 0.16 0.17 <0.10 0.50 0.15 0.62 - - -
Jul-13 <0.10 - <0.10 <0.10 - - - 4.88 0.5 <0.10 <0.10 <0.10 0.20 <0.10 0.9 - - -
Aug-13 - - - - - - - - - - - - - - - <0.10 <0.10 -
Oct-13 0.15 - 0.14 0.39 - - - 10.9 0.57 0.23 0.60 <0.10 0.59 0.11 1.27 - - -
Jan-14 <0.10 - <0.10 0.28 - - - 13.1 1.73 <0.10 <0.10 <0.10 0.85 0.21 3.32 0.22 <0.10 -
Apr-14 0.23 - 0.15 0.4 - - - 8.83 2.59 <0.10 0.11 <0.10 0.94 0.39 8.02 0.42 <0.10 -
Jul-14 <0.10 - <0.10 0.33 - - - 10.9 1.56 <0.10 <0.10 <0.10 0.15 0.16 24 <0.10 <0.10 0.50
Oct-14 0.71 - 0.2 0.41 - - - 2.5 0.74 0.58 <0.10 <0.10 0.17 0.5 10 <0.10 0.14 0.12
Jan-15 - - - - <0.10 - - 0.38 1.26 - - - - 0.4 6.36 - - -
Feb-15 - - 0.34 - - - - <0.10 -
Apr-15 <0.10 - <0.10 - 0.14 - - <0.10 1.98 <0.10 <0.10 <0.10 <0.10 0.56 - <0.10 0.17 0.13
May-15 - - - - - - - - - - - - - - 17.5 - - -
Jun-15 - - - - - - <0.10 - - - - - - - - - - -
Jul-15 0.20 - 0.21 - - - 0.8 - 3.78 0.17 0.29 0.16 0.12 - 18.7 0.25 0.22 0.15
Aug-15 - - - - - - - - - - - - - 2.74 - - - -
Sep-15 - - - - - 3.76 - - - - - - - - - - - -
Oct-15 0.17 - 0.12 - - 15.75 3.247 - <0.10 0.18 <0.10 0.10 <0.10 1.53 - <0.10 <0.10 -
Average 2009 - <0.23 <0.29 0.30 - - - 1.81 - - <0.26 <0.19 - - 2.81 - - -Average 2010 - <0.17 <0.17 <0.18 - - - 0.63 - <0.13 <0.10 <0.10 <0.10 - <0.44 - - -Average 2011 <0.10 - <0.10 <0.20 - - - <0.63 <0.40 <0.29 <0.10 <0.28 <0.23 - 1.19 - - -Average 2012 <0.20 - <0.12 <0.24 - - - - 0.93 <0.12 <0.11 <0.12 0.34 <0.19 0.88 - - -Average 2013 <0.40 - <0.13 <0.22 - - - 6.16 1.14 <0.43 <0.24 <0.35 0.60 <0.36 0.93 <0.10 <0.10 -Average 2014 <0.29 - <0.14 0.36 - - - 8.83 1.66 <0.22 <0.10 <0.10 0.53 0.32 11.34 <0.21 <0.11 0.31Average 2015 <0.16 - <0.19 - <0.12 9.75 <1.38 <0.24 1.78 <0.15 <0.16 <0.12 <0.11 1.31 14.19 <0.15 <0.15 0.14
Average All Years <0.25 <0.19 <0.16 <0.25 <0.12 9.75 <1.38 <2.75 <1.18 <0.23 <0.15 <0.18 <0.36 <0.54 <3.90 <0.17 <0.13 0.23- : total mercury concentration not determined
* Samples excluded from average calculations
Sampling locations and frequency governed by Amended C. of A. #3960-7Q4K2G.
MDLs have been adjusted for all years for uniformity (0.1 ng/L for total mercury), as per Section 1.
Table 19b: Total Mercury - Individual Mine Dewatering Wells (Filtered)(concentrations in ng/L)
TC140504 Page 88
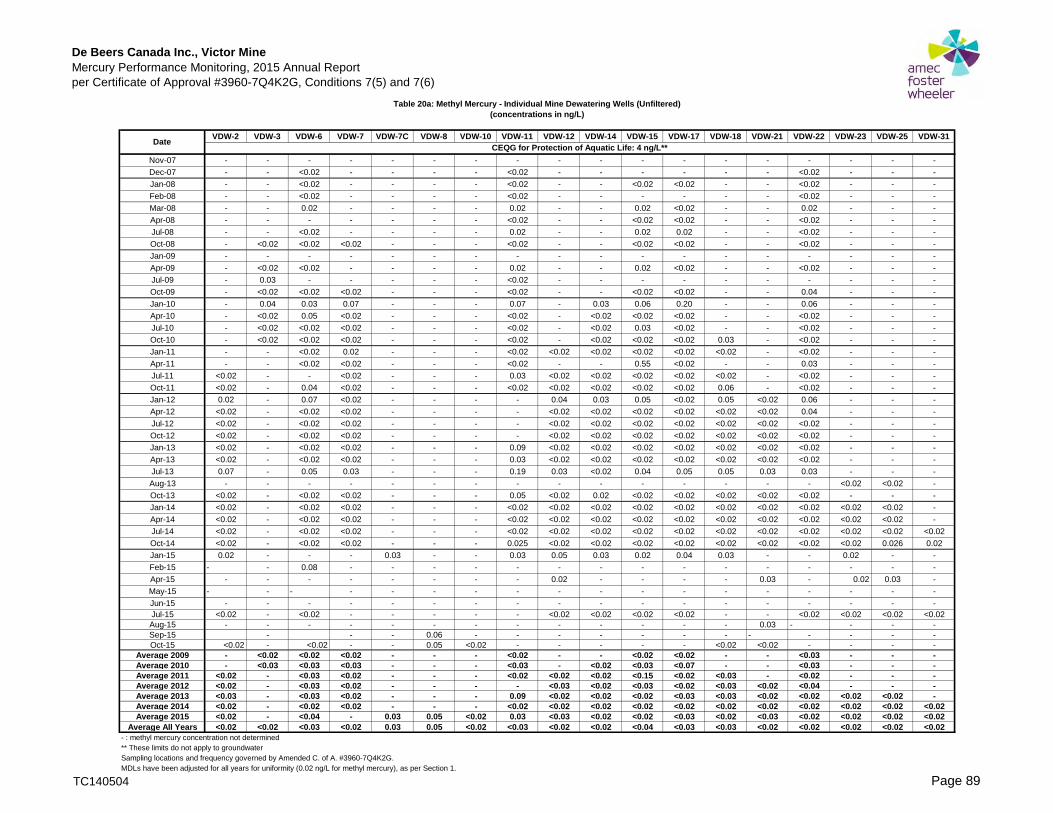
De Beers Canada Inc., Victor MineMercury Performance Monitoring, 2015 Annual Report
per Certificate of Approval #3960-7Q4K2G, Conditions 7(5) and 7(6)
VDW-2 VDW-3 VDW-6 VDW-7 VDW-7C VDW-8 VDW-10 VDW-11 VDW-12 VDW-14 VDW-15 VDW-17 VDW-18 VDW-21 VDW-22 VDW-23 VDW-25 VDW-31
Nov-07 - - - - - - - - - - - - - - - - - -
Dec-07 - - <0.02 - - - - <0.02 - - - - - - <0.02 - - -
Jan-08 - - <0.02 - - - - <0.02 - - <0.02 <0.02 - - <0.02 - - -
Feb-08 - - <0.02 - - - - <0.02 - - - - - - <0.02 - - -
Mar-08 - - 0.02 - - - - 0.02 - - 0.02 <0.02 - - 0.02 - - -
Apr-08 - - - - - - - <0.02 - - <0.02 <0.02 - - <0.02 - - -
Jul-08 - - <0.02 - - - - 0.02 - - 0.02 0.02 - - <0.02 - - -
Oct-08 - <0.02 <0.02 <0.02 - - - <0.02 - - <0.02 <0.02 - - <0.02 - - -
Jan-09 - - - - - - - - - - - - - - - - - -
Apr-09 - <0.02 <0.02 - - - - 0.02 - - 0.02 <0.02 - - <0.02 - - -
Jul-09 - 0.03 - - - - - <0.02 - - - - - - - - - -
Oct-09 - <0.02 <0.02 <0.02 - - - <0.02 - - <0.02 <0.02 - - 0.04 - - -
Jan-10 - 0.04 0.03 0.07 - - - 0.07 - 0.03 0.06 0.20 - - 0.06 - - -
Apr-10 - <0.02 0.05 <0.02 - - - <0.02 - <0.02 <0.02 <0.02 - - <0.02 - - -
Jul-10 - <0.02 <0.02 <0.02 - - - <0.02 - <0.02 0.03 <0.02 - - <0.02 - - -
Oct-10 - <0.02 <0.02 <0.02 - - - <0.02 - <0.02 <0.02 <0.02 0.03 - <0.02 - - -
Jan-11 - - <0.02 0.02 - - - <0.02 <0.02 <0.02 <0.02 <0.02 <0.02 - <0.02 - - -
Apr-11 - - <0.02 <0.02 - - - <0.02 - - 0.55 <0.02 - - 0.03 - - -
Jul-11 <0.02 - - <0.02 - - - 0.03 <0.02 <0.02 <0.02 <0.02 <0.02 - <0.02 - - -
Oct-11 <0.02 - 0.04 <0.02 - - - <0.02 <0.02 <0.02 <0.02 <0.02 0.06 - <0.02 - - -
Jan-12 0.02 - 0.07 <0.02 - - - - 0.04 0.03 0.05 <0.02 0.05 <0.02 0.06 - - -
Apr-12 <0.02 - <0.02 <0.02 - - - - <0.02 <0.02 <0.02 <0.02 <0.02 <0.02 0.04 - - -
Jul-12 <0.02 - <0.02 <0.02 - - - - <0.02 <0.02 <0.02 <0.02 <0.02 <0.02 <0.02 - - -
Oct-12 <0.02 - <0.02 <0.02 - - - - <0.02 <0.02 <0.02 <0.02 <0.02 <0.02 <0.02 - - -
Jan-13 <0.02 - <0.02 <0.02 - - - 0.09 <0.02 <0.02 <0.02 <0.02 <0.02 <0.02 <0.02 - - -
Apr-13 <0.02 - <0.02 <0.02 - - - 0.03 <0.02 <0.02 <0.02 <0.02 <0.02 <0.02 <0.02 - - -
Jul-13 0.07 - 0.05 0.03 - - - 0.19 0.03 <0.02 0.04 0.05 0.05 0.03 0.03 - - -
Aug-13 - - - - - - - - - - - - - - - <0.02 <0.02 -
Oct-13 <0.02 - <0.02 <0.02 - - - 0.05 <0.02 0.02 <0.02 <0.02 <0.02 <0.02 <0.02 - - -
Jan-14 <0.02 - <0.02 <0.02 - - - <0.02 <0.02 <0.02 <0.02 <0.02 <0.02 <0.02 <0.02 <0.02 <0.02 -
Apr-14 <0.02 - <0.02 <0.02 - - - <0.02 <0.02 <0.02 <0.02 <0.02 <0.02 <0.02 <0.02 <0.02 <0.02 -
Jul-14 <0.02 - <0.02 <0.02 - - - <0.02 <0.02 <0.02 <0.02 <0.02 <0.02 <0.02 <0.02 <0.02 <0.02 <0.02
Oct-14 <0.02 - <0.02 <0.02 - - - 0.025 <0.02 <0.02 <0.02 <0.02 <0.02 <0.02 <0.02 <0.02 0.026 0.02
Jan-15 0.02 - - - 0.03 - - 0.03 0.05 0.03 0.02 0.04 0.03 - - 0.02 - -
Feb-15 - - 0.08 - - - - - - - - - - - - - - -
Apr-15 - - - - - - - - 0.02 - - - - 0.03 - 0.02 0.03 -
May-15 - - - - - - - - - - - - - - - - - -
Jun-15 - - - - - - - - - - - - - - - - - -
Jul-15 <0.02 - <0.02 - - - - - <0.02 <0.02 <0.02 <0.02 - - <0.02 <0.02 <0.02 <0.02
Aug-15 - - - - - - - - - - - - - 0.03 - - - -
Sep-15 - - - 0.06 - - - - - - - - - - - -
Oct-15 <0.02 - <0.02 - - 0.05 <0.02 - - - - - <0.02 <0.02 - - - -
Average 2009 - <0.02 <0.02 <0.02 - - - <0.02 - - <0.02 <0.02 - - <0.03 - - -Average 2010 - <0.03 <0.03 <0.03 - - - <0.03 - <0.02 <0.03 <0.07 - - <0.03 - - -Average 2011 <0.02 - <0.03 <0.02 - - - <0.02 <0.02 <0.02 <0.15 <0.02 <0.03 - <0.02 - - -Average 2012 <0.02 - <0.03 <0.02 - - - - <0.03 <0.02 <0.03 <0.02 <0.03 <0.02 <0.04 - - -Average 2013 <0.03 - <0.03 <0.02 - - - 0.09 <0.02 <0.02 <0.02 <0.03 <0.03 <0.02 <0.02 <0.02 <0.02 -Average 2014 <0.02 - <0.02 <0.02 - - - <0.02 <0.02 <0.02 <0.02 <0.02 <0.02 <0.02 <0.02 <0.02 <0.02 <0.02Average 2015 <0.02 - <0.04 - 0.03 0.05 <0.02 0.03 <0.03 <0.02 <0.02 <0.03 <0.02 <0.03 <0.02 <0.02 <0.02 <0.02
Average All Years <0.02 <0.02 <0.03 <0.02 0.03 0.05 <0.02 <0.03 <0.02 <0.02 <0.04 <0.03 <0.03 <0.02 <0.02 <0.02 <0.02 <0.02- : methyl mercury concentration not determined
** These limits do not apply to groundwater
Sampling locations and frequency governed by Amended C. of A. #3960-7Q4K2G.
MDLs have been adjusted for all years for uniformity (0.02 ng/L for methyl mercury), as per Section 1.
Table 20a: Methyl Mercury - Individual Mine Dewatering Wells (Unfiltered)(concentrations in ng/L)
CEQG for Protection of Aquatic Life: 4 ng/L**Date
TC140504 Page 89

De Beers Canada Inc., Victor MineMercury Performance Monitoring, 2015 Annual Report
per Certificate of Approval #3960-7Q4K2G, Conditions 7(5) and 7(6)
VDW-2 VDW-3 VDW-6 VDW-7 VDW-7C VDW-8 VDW-10 VDW-11 VDW-12 VDW-14 VDW-15 VDW-17 VDW-18 VDW-21 VDW-22 VDW-23 VDW-25 VDW-31
Nov-07 - - <0.02 - - - - <0.02 - - - - - - <0.02 - - -
Dec-07 - - <0.02 - - - - <0.02 - - - - - - <0.02 - - -
Jan-08 - - <0.02 - - - - <0.02 - - <0.02 <0.02 - - <0.02 - - -
Feb-08 - - <0.02 - - - - <0.02 - - - - - - <0.02 - - -
Mar-08 - - <0.02 - - - - <0.02 - - <0.02 <0.02 - - 0.02 - - -
Apr-08 - - - - - - - <0.02 - - 0.02 <0.02 - - 0.02 - - -
Jul-08 - - 0.02 - - - - <0.02 - - <0.02 <0.02 - - 0.02 - - -
Oct-08 - <0.02 <0.02 <0.02 - - - <0.02 - - <0.02 <0.02 - - <0.02 - - -
Jan-09 - - - - - - - - - - - - - - - - - -
Apr-09 - <0.02 0.02 - - - - 0.02 - - 0.02 <0.02 - - 0.02 - - -
Jul-09 - 0.05 0.18 - - - - 0.06 - - 0.03 0.14 - - 0.03 - - -
Oct-09 - <0.02 <0.02 <0.02 - - - <0.02 - - <0.02 <0.02 - - <0.02 - - -
Jan-10 - 0.07 <0.02 0.04 - - - <0.02 - 0.04 <0.02 <0.02 - - <0.02 - - -
Apr-10 - <0.02 <0.02 <0.02 - - - 0.02 - <0.02 <0.02 <0.02 - - <0.02 - - -
Jul-10 - <0.02 0.02 <0.02 - - - <0.02 - 0.04 <0.02 <0.02 - - <0.02 - - -
Oct-10 - <0.02 <0.02 <0.02 - - - <0.02 - <0.02 <0.02 <0.02 0.05 - <0.02 - - -
Jan-11 - - 0.04 <0.02 - - - <0.02 <0.02 <0.02 <0.02 <0.02 <0.02 - <0.02 - - -
Apr-11 - - <0.02 <0.02 - - - <0.02 - - <0.02 <0.02 - - <0.02 - - -
Jul-11 <0.02 - - <0.02 - - - <0.02 <0.02 <0.02 <0.02 <0.02 <0.02 - <0.02 - - -
Oct-11 <0.02 - 0.04 <0.02 - - - <0.02 <0.02 <0.02 <0.02 <0.02 0.05 - <0.02 - - -
Jan-12 0.02 - 0.05 <0.02 - - - - 0.03 <0.02 <0.02 <0.02 0.03 <0.02 <0.02 - - -
Apr-12 <0.02 - <0.02 <0.02 - - - - <0.02 <0.02 <0.02 <0.02 <0.02 <0.02 <0.02 - - -
Jul-12 <0.02 - <0.02 <0.02 - - - - <0.02 <0.02 <0.02 <0.02 <0.02 <0.02 <0.02 - - -
Oct-12 <0.02 - <0.02 <0.02 - - - - <0.02 <0.02 <0.02 <0.02 <0.02 <0.02 <0.02 - - -
Jan-13 <0.02 - <0.02 <0.02 - - - 0.02 <0.02 <0.02 <0.02 <0.02 <0.02 0.02 <0.02 - - -
Apr-13 <0.02 - <0.02 <0.02 - - - <0.02 <0.02 <0.02 <0.02 <0.02 <0.02 <0.02 <0.02 - - -
Jul-13 <0.02 - <0.02 <0.02 - - - <0.02 <0.02 <0.02 <0.02 <0.02 <0.02 <0.02 <0.02 - - -
Aug-13 - - - - - - - - - - - - - - - <0.02 <0.02 -
Oct-13 <0.02 - <0.02 <0.02 - - - <0.02 <0.02 <0.02 <0.02 <0.02 <0.02 <0.02 <0.02 - - -
Jan-14 <0.02 - <0.02 <0.02 - - - <0.02 <0.02 <0.02 <0.02 <0.02 <0.02 <0.02 <0.02 <0.02 <0.02 -
Apr-14 <0.02 - <0.02 <0.02 - - - <0.02 <0.02 <0.02 <0.02 <0.02 <0.02 <0.02 <0.02 <0.02 <0.02 -
Jul-14 <0.02 - <0.02 <0.02 - - - <0.02 <0.02 <0.02 <0.02 <0.02 <0.02 <0.02 <0.02 <0.02 <0.02 <0.02
Oct-14 <0.02 - <0.02 <0.02 - - - <0.02 <0.02 <0.02 <0.02 <0.02 <0.02 <0.02 <0.02 <0.02 <0.02 <0.02
Jan-15 - - - - - - - 0.02 - - - - - - - - - -
Feb-15 - - 0.04 - - - - - - - - - - - - - <0.02 -
Apr-15 - - <0.02 - - - - - - - - - - - 0.06 - - -
May-15 - - - - - - - - - - - - - - - - 0.02 -
Jun-15 - - - - - - 0.02 - - - - - - - - - - -
Jul-15 0.02 - <0.02 - - - <0.02 - <0.02 <0.02 <0.02 <0.02 0.039 - 0.03 0.03 <0.02 <0.02
Aug-15 - - - - - - - - - - - - - <0.02 - - - -
Sep-15 - - - - - 0.03 - - - - - - - - - - - -
Oct-15 <0.02 - <0.02 - - <0.02 <0.02 - - - - - <0.02 - - - - -
Average 2009 - <0.03 <0.07 <0.02 <0.03 - - <0.02 <0.06 - - <0.02 - - -Average 2010 - <0.03 <0.02 <0.02 <0.02 - <0.03 <0.02 <0.02 0.05 - <0.02 - - -Average 2011 <0.02 - <0.03 <0.02 <0.02 <0.02 <0.02 <0.02 <0.02 <0.03 - <0.02 - - -Average 2012 <0.02 - <0.03 <0.02 - <0.02 <0.02 <0.02 <0.02 <0.02 <0.02 <0.02 - - -Average 2013 <0.02 - <0.02 <0.02 <0.02 <0.02 <0.02 <0.02 <0.02 <0.02 <0.02 <0.02 <0.02 <0.02 -Average 2014 <0.02 - <0.02 <0.02 <0.02 <0.02 <0.02 <0.02 <0.02 <0.02 <0.02 <0.02 <0.02 <0.02 <0.02Average 2015 <0.02 - <0.02 - - <0.02 <0.02 0.02 <0.02 <0.02 <0.02 <0.02 <0.03 <0.02 0.04 0.03 <0.02 <0.02
Average All Years <0.02 <0.03 <0.03 <0.02 - 0.02 <0.02 <0.02 <0.02 <0.02 <0.02 <0.02 <0.03 <0.02 <0.02 <0.02 <0.02 <0.02- : methyl mercury concentration not determined
** These limits do not apply to groundwater
Sampling locations and frequency governed by Amended C. of A. #3960-7Q4K2G.
MDLs have been adjusted for all years for uniformity (0.02 ng/L for methyl mercury), as per Section 1.
Table 20b: Methyl Mercury - Individual Mine Dewatering Wells (Filtered)(concentrations in ng/L)
Draft USEPA Criteria: 0.05 ng/L**Date
TC140504 Page 90

De Beers Canada Inc., Victor MineMercury Performance Monitoring, 2015 Annual Report
per Certificate of Approval #3960-7Q4K2G, Conditions 7(5) and 7(6)
July 2016
ATT-FF-E1 07/09/15 1833 0.03 0.00 0.00 0.00 0.00 0.00 0.00 0.07 0.07 0.00 0.03 0.00 0.03 0.00 0.07 0.16 0.00 3.37 0.03 0.00 0.07 3.93 120
ATT-FF-E2 07/09/15 1469 0.00 0.00 0.00 0.00 0.00 0.00 0.00 0.08 0.25 0.00 0.57 0.00 0.00 0.00 0.00 0.04 0.00 3.06 0.00 0.00 0.12 4.13 101
ATT-NF-E1 04/09/15 2568 0.00 0.00 0.00 0.02 0.14 0.00 0.00 0.12 0.00 0.00 0.05 0.00 0.00 0.00 0.00 0.00 0.02 0.96 0.02 0.00 0.02 1.36 58
ATT-NF-E2 04/09/15 3617 0.00 0.00 0.00 0.00 0.07 0.00 0.00 0.05 0.08 0.00 0.05 0.00 0.00 0.00 0.00 0.00 0.00 0.56 0.03 0.00 0.02 0.86 52
ATT-NF-E3 05/09/15 4462 0.04 0.00 0.00 0.00 0.03 0.00 0.00 0.08 0.09 0.01 0.09 0.00 0.00 0.00 0.00 0.05 0.03 0.63 0.03 0.00 0.03 1.12 83
ATT-NF-E4 12/09/15 3520 0.00 0.00 0.00 0.00 0.00 0.00 0.00 0.00 0.00 0.00 0.02 0.00 0.00 0.00 0.00 0.00 0.00 0.19 0.02 0.02 0.00 0.24 14
ATT-REF2-E1 05/09/15 1962 0.03 0.03 0.00 0.00 0.12 0.00 0.00 0.43 0.31 0.15 0.24 0.00 0.00 0.00 0.00 0.09 0.12 0.92 0.06 0.00 0.00 2.51 82
ATT-REF2-E2 04/09/15 1474 0.00 0.00 0.00 0.00 0.00 0.00 0.00 0.00 0.00 0.00 0.08 0.00 0.00 0.00 0.00 0.00 0.00 0.28 0.00 0.00 0.00 0.37 9
ATT-REF2-E3 05/09/15 3118 0.00 0.00 0.00 0.00 0.00 0.00 0.00 0.15 0.19 0.00 0.25 0.00 0.00 0.00 0.00 0.08 0.02 0.35 0.02 0.00 0.04 1.10 57
ATT-US-E1 03/09/15 3627 0.00 0.00 0.00 0.00 0.08 0.00 0.00 0.15 0.00 0.00 0.13 0.00 0.02 0.00 0.00 0.00 0.07 0.63 0.07 0.00 0.05 1.19 72
ATT-US-E2 03/09/15 2536 0.00 0.02 0.00 0.00 0.09 0.00 0.00 0.02 0.00 0.00 0.14 0.02 0.00 0.00 0.02 0.00 0.00 0.97 0.05 0.00 0.14 1.49 63
5 2 0 1 25 0 0 50 40 6 65 1 2 0 3 17 12 445 16 1 20 - 711
NGC-E1 04/09/15 1673 0.00 0.00 0.00 0.04 0.36 0.00 0.00 0.07 0.00 0.00 0.00 0.00 0.00 0.07 0.07 0.00 0.00 0.00 0.00 0.00 0.00 0.61 17
NGC-E2 06/09/15 1240 0.00 0.00 0.00 0.00 0.10 0.00 0.05 0.05 0.00 0.00 0.00 0.00 0.10 0.00 0.00 0.00 0.00 0.00 0.00 0.00 0.00 0.29 6
0 0 0 1 12 0 1 3 0 0 0 0 2 2 2 0 0 0 0 0 0 - 23
SGC-E1 07/09/15 1823 0.00 0.03 0.03 0.00 0.10 0.00 0.03 0.26 0.00 0.00 0.00 0.00 0.00 0.00 0.86 0.00 0.00 0.00 0.00 0.00 0.00 1.32 40
SGC-E2 08/09/15 4694 0.00 0.00 0.01 0.00 0.05 0.00 0.00 0.00 0.00 0.00 0.00 0.00 0.01 0.00 0.40 0.00 0.00 0.00 0.00 0.00 0.00 0.47 37
0 1 2 0 7 0 1 8 0 0 0 0 1 0 57 0 0 0 0 0 0 - 77
NAY-DS6-E1 09/09/15 3207 0.00 0.00 0.00 0.00 0.17 0.02 0.00 0.00 0.00 0.00 0.02 0.00 0.02 0.00 1.01 0.00 0.00 0.24 0.02 0.00 0.00 1.50 80
NAY-DS6-E2 09/09/15 3442 0.00 0.02 0.00 0.00 0.07 0.02 0.00 0.00 0.00 0.00 0.02 0.00 0.00 0.00 0.37 0.00 0.00 0.16 0.00 0.00 0.00 0.64 37
NAY-US3-E1 10/09/15 1840 0.03 0.00 0.00 0.00 0.33 0.03 0.00 0.03 0.00 0.00 0.00 0.00 0.00 0.00 0.62 0.00 0.00 0.00 0.00 0.00 0.00 1.04 32
NAY-US3-E2 10/09/15 2245 0.00 0.00 0.00 0.00 0.13 0.00 0.00 0.00 0.00 0.00 0.00 0.00 0.00 0.00 0.43 0.00 0.00 0.00 0.00 0.00 0.00 0.56 21
NAY-US3-E3 10/09/15 2206 0.00 0.00 0.00 0.00 0.30 0.00 0.00 0.00 0.00 0.00 0.00 0.00 0.00 0.00 0.52 0.00 0.00 0.00 0.00 0.00 0.00 0.82 30
1 1 0 0 39 3 0 1 0 0 2 0 1 0 129 0 0 22 1 0 0 - 200
Waterbody ID Station ID Date (DD/MM/YY)Effort
(seconds)
South Granny Creek
Species Catch Total (n)
Common White Sucker
Finescale Dace
Iowa Darter
Johnny Darter
Lake Chub
Nayshkootayoaw River
Species Catch Total (n)
Table 21: Boat Electrofishing Species-specific Catch per Unit Effort Summary
Site CPUE Total
Site Catch Total (n)
Attawapiskat River
Species Catch Total (n)
North Granny Creek
Species Catch Total (n)
Shorthead Redhorse
Spottail Shiner
Trout Perch
WalleyeLake
WhitefishYellow Perch
Log Perch
Mottled Scuplin
Ninespine Stickleback
Northern PikeNorthern
Redbelly DacePearl Dace
Species-specific Catch per Electro-Minute Total Catch / (Electrosecond / 60)
Blacknose Dace
Brook Stickleback
Brook Trout
Burbot
TC140504 Page 91

De Beers Canada Inc., Victor MineMercury Performance Monitoring, 2015 Annual Report
per Certificate of Approval #3960-7Q4K2G, Conditions 7(5) and 7(6)
July 2016
ST-5A-MT1 07/09/15 9 24.00 216.0 0.01 0.00 0.00 0.00 0.00 0.25 0.27 58
ST-5A-MT2 07/09/15 11 23.50 258.5 0.00 0.00 0.00 0.00 0.00 0.01 0.02 4
ST-5A-MT3 08/09/15 6 24.45 146.7 0.01 0.00 0.00 0.00 0.00 0.01 0.02 3ST-5A-MT4 08/09/15 12 42.00 504.0 0.01 0.01 0.21 0.00 0.00 0.17 0.40 202
9 3 106 1 1 147 - 267
NGC-MT1 06/09/15 5 17.5 87.5 0.00 0.00 0.00 0.00 0.00 0.00 0.00 0
NGC-MT2 06/09/15 5 17.5 87.5 0.00 0.00 0.00 0.00 0.00 0.00 0.00 0
NGC-MT3 08/09/15 10 48.3 483 0.00 0.00 0.00 0.00 0.00 1.00 1.00 1
NGC-MT4 09/09/15 10 26 260 0.00 0.00 0.00 0.00 0.00 3.00 3.00 3
NGC-MT5 10/09/15 12 18 216 0.00 0.00 0.00 0.00 0.00 0.00 0.00 0
NGC-MT6 11/09/15 12 20.25 243 0.00 0.00 0.00 0.00 0.00 2.00 2.00 2NGC-MT7 12/09/15 12 18.45 221.4 0.00 0.00 0.00 0.00 0.00 2.00 2.00 2
0 0 0 0 0 8 - 8
South Granny Creek SGC-MT1 06/09/15 16 46.5 0.00 0.00 0.00 0.00 0.00 0.00 0.00 0
0 0 0 0 0 0 0.000 0
Table 22: Minnow Trap Species-specific Catch per Unit Effort Summary
Waterbody IDWatercourse / Waterbody ID
Lift Date (DD/MM/YY)
# of Traps
SetHours
Total Trap Hours
(# traps*hours)
Species-Specific Catch per Trap Hour (# Fish / Trap Hours)
Brook Stickleback
Common White Sucker
Finescale Dace
Johnny Darter
Longnose Dace
Pearl Dace
Site CPUE Total
Site Catch Total (n)
Tributary 5A
Species Catch Total (n)
North Granny Creek
Species Catch Total (n)
Species Catch Total (n)
TC140504 Page 92
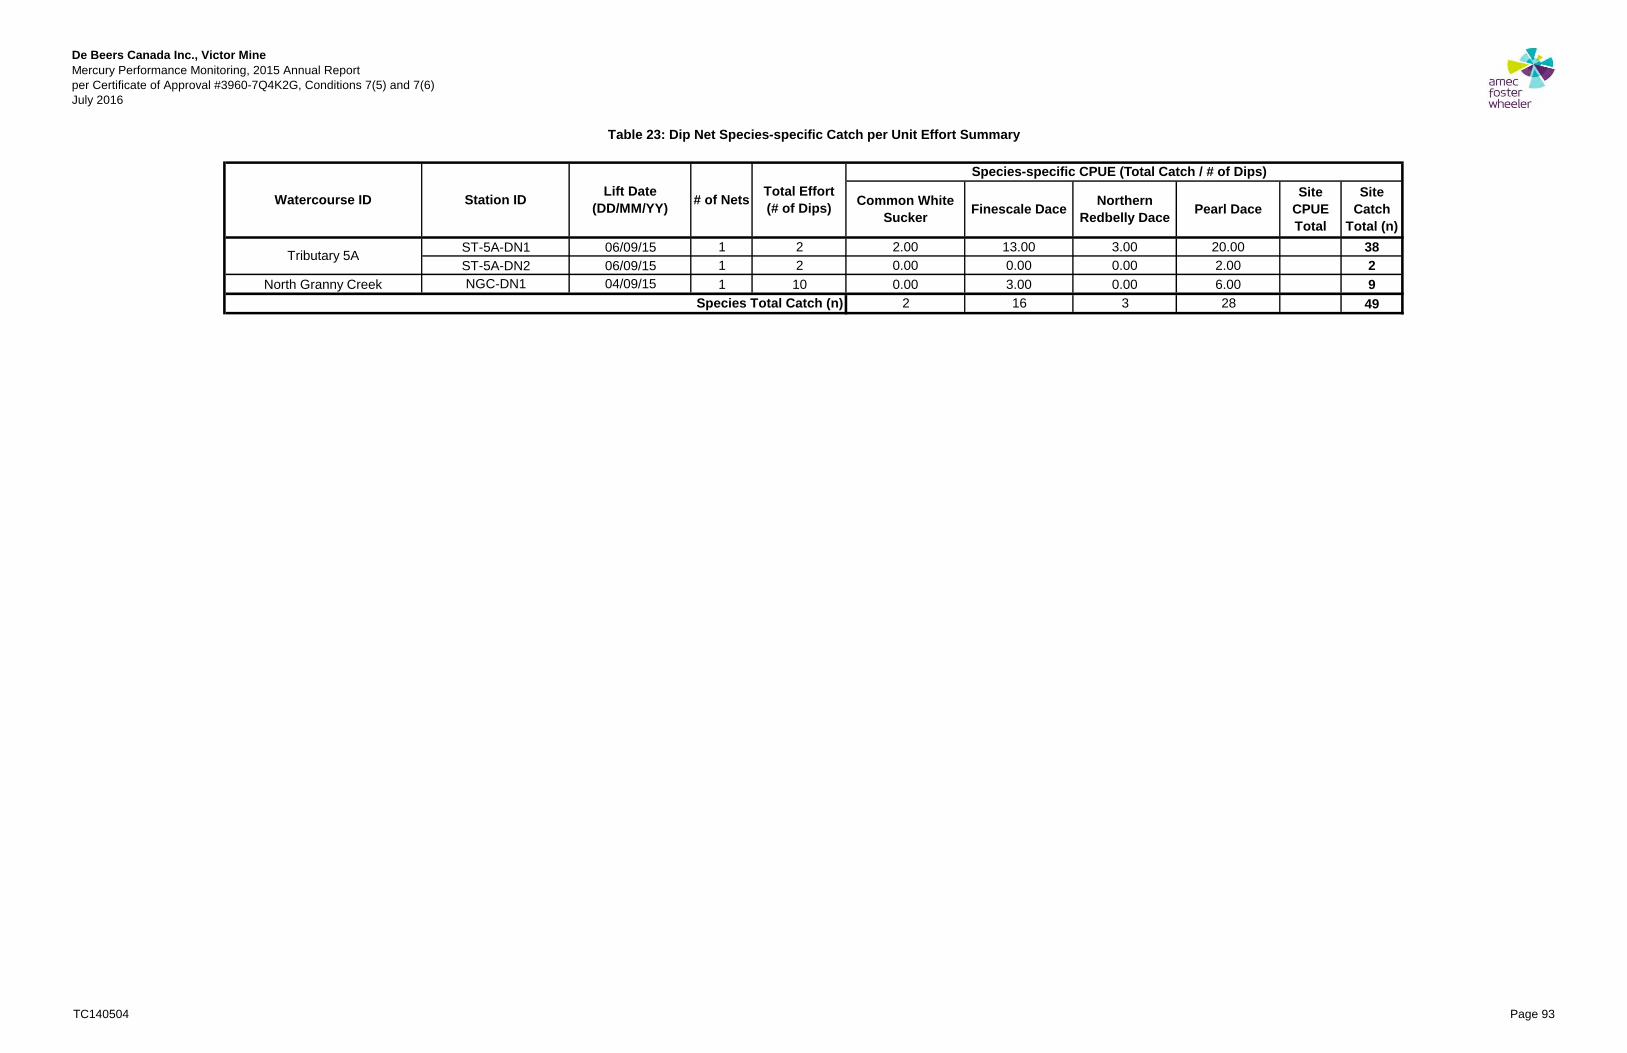
De Beers Canada Inc., Victor MineMercury Performance Monitoring, 2015 Annual Report
per Certificate of Approval #3960-7Q4K2G, Conditions 7(5) and 7(6)
July 2016
ST-5A-DN1 06/09/15 1 2 2.00 13.00 3.00 20.00 38
ST-5A-DN2 06/09/15 1 2 0.00 0.00 0.00 2.00 2
North Granny Creek NGC-DN1 04/09/15 1 10 0.00 3.00 0.00 6.00 9
2 16 3 28 49Species Total Catch (n)
Site CPUE Total
Site Catch
Total (n)
Tributary 5A
Table 23: Dip Net Species-specific Catch per Unit Effort Summary
Watercourse ID Station IDLift Date
(DD/MM/YY)# of Nets
Total Effort (# of Dips)
Species-specific CPUE (Total Catch / # of Dips)
Common White Sucker
Finescale DaceNorthern
Redbelly DacePearl Dace
TC140504 Page 93

De Beers Canada Inc., Victor MineMercury Performance Monitoring, 2015 Annual Report
per Certificate of Approval #3960-7Q4K2G, Conditions 7(5) and 7(6)
July 2016
NGC-GN1 04/09/15 7.6 0.00 0.00 0.00 0.00 0NGC-GN2 04/09/15 7.6 0.00 0.00 0.00 0.00 0
0 0 0 - 0
Table 24: Standard Gill Net Species-specific Catch per Hour per 15.24 m Set Summary
Watercourse / Waterbody ID Station IDLift Date (DD/MM/
YY)
Mesh Size in Gang(mm)
Net Length
(m)Hours
Species-specific Catch per Hour of 15.24 m Standard Gill Net Set
Brook SticklebackCommon White
SuckerFathead Minnow
Species Catch Total (n)
Site CPUE Total
Site Catch
Total (n)
North Granny Creek 13-38 15.2
TC140504 Page 94

De Beers Canada Inc., Victor MineMercury Performance Monitoring, 2015 Annual Report
per Certificate of Approval #3960-7Q4K2G, Conditions 7(5) and 7(6)
July 2016
NGC SGC ST-5A NGC SGC ST-5A NGC SGC ST-5A
n 19 30 15 9 17 65 28 47 80
Mean 36.95 38.00 47.60 85.22 67.76 59.75 52.46 48.77 57.48
SE 1.16 0.66 2.06 8.15 3.91 1.71 5.08 2.56 1.54
Median 37.00 38.50 48.00 84.00 63.00 54.00 40.00 41.00 54.00
Min 30.00 30.00 32.00 60.00 52.00 42.00 30.00 30.00 32.00
Max 46.00 43.00 60.00 135.00 102.00 106.00 135.00 102.00 106.00
n 19 30 15 9 17 65 28 47 80
Mean 0.40 0.43 0.96 6.56 3.07 2.20 2.38 1.39 1.97
SE 0.03 0.02 0.10 2.09 0.67 0.23 0.85 0.3 0.2
Median 0.35 0.46 0.97 5.21 1.63 1.47 0.52 0.52 1.39
Min 0.18 0.19 0.31 1.57 1.08 0.60 0.18 0.19 0.31
Max 0.66 0.60 1.60 21.30 10.90 10.76 21.30 10.9 10.76
n 19 30 15 9 17 65 28 47 80
Mean 0.37 0.28 0.05 0.56 0.23 0.08 0.43 0.26 0.07
SE 0.06 0.02 0.01 0.09 0.03 0.01 0.05 0.02 0.01
Median 0.22 0.27 0.04 0.64 0.20 0.08 0.46 0.24 0.08
Min 0.10 0.12 0.03 0.04 0.14 0.04 0.04 0.12 0.03
Max 0.97 0.70 0.08 0.86 0.67 0.12 0.97 0.7 0.12
n 9 17 65 28 47 80
Mean 1.78 1.47 1.42 0.57 0.53 1.15
SE 0.36 0.19 0.11 0.2 0.12 0.11
Median 1 1 1 0 0 1
Min 1 1 1 0 0 0
Max 4 3 5 4 3 5
Total Length (mm)
Weight (g)
Total Hg (mg/kg)
Age
YOY Pearl Dace
Table 25: Summary of Parl Dace Univariate Statistics by Age Class for 2015 Granny Creek System
Area
Age Class
Pearl Dace All Ages PooledAge ≥1 Pearl Dace
TC140504 Page 95

De Beers Canada Inc., Victor MineMercury Performance Monitoring, 2015 Annual Report
per Certificate of Approval #3960-7Q4K2G, Conditions 7(5) and 7(6)
July 2016
Source of Variation SS df MS F P-value p<0.05
Between Groups 0.115 2 0.058 17.381 <0.001 Y
Error 0.202 61 0.003
Source of Variation SS df MS F P-value p<0.05
Between Groups 0.193 2 0.096 11.146 <0.001 Y
Error 0.762 88 0.009
Source of Variation SS df MS F P-value p<0.05
Between Groups 1.389 2 0.695 23.671 <0.001 Y
Error 1.790 61 0.029
Source of Variation SS df MS F P-value p<0.05
Between Groups 1.39 2 0.70 8.914 <0.001 Y
Error 6.87 88 0.08
Source of Variation SS df MS F P-value p<0.05
Between Groups 14.12 2 7.06 7.846 <0.001 Y
Error 136.76 152 0.89
Source of Variation SS df MS F P-value p<0.05
Between Groups 1.04 2 0.52 0.658 0.521 N
Error 69.58 88 0.79
Only post significant post hoc comparisons are shown in table (≠)
SS = sum of squares
df = degrees of freedom
MS = Mean Square
F - Test statistic = between group variability / within group variability
p < 0.05 - indicates significance of test for null-hypothesis (equal means) at an alpha of 0.05
Y = Yes, N = No
* Significance based on Tukey HSD at α = 0.05
P-value = The level of marginal significance within a statistical hypothesis test, representing the probability of the
occurrence of a given event.
SGC≠NGC
NGC≠ST-5A
Age (Age 1+) Signficant post HOC
NGC≠ST-5A
Weight (Age 1+) Signficant post HOCSGC≠NGC
Age (All fish) Signficant post HOC
SGC≠ST-5A
Table 26: Total Length, Weight and Age Comparsion by Location for 2015Pearl Dace in the Granny Creek System using ANOVA
Total Length (YOY) * Signficant post HOC
≠ describes area comparisons that are not equal
NGC≠ST-5A
SGC≠ST-5A
SGC≠ST-5A
Notes:
NGC≠ST-5A
Total Length (Age 1+) Signficant post HOCNGC≠ST-5A
Weight (YOY) Signficant post HOC
SGC≠ST-5A
TC140504 Page 96

De Beers Canada Inc., Victor MineMercury Performance Monitoring, 2015 Annual Report
per Certificate of Approval #3960-7Q4K2G, Conditions 7(5) and 7(6)
July 2016
SS df MS F P-value p<0.05
Location 71.230 2 35.610 201.396 <0.001 Y
Ageclass 1.520 1 1.520 8.589 0.004 Y
Location:Ageclass 3.490 2 1.750 9.879 <0.001 Y
Residuals 26.350 149 0.180
Source of Variation SS df MS F P-value p<0.05
Between Groups 35.593 2 17.796 79.608 <0.001 Y
Error 13.637 61 0.224
Source of Variation SS df MS F P-value p<0.05
Between Groups 32.246 2 16.123 111.620 <0.001 Y
Error 12.711 88 0.144
Only post significant post hoc comparisons are shown in table (≠)
SS = sum of squares
df = degrees of freedom
MS = Mean Square
F - Test statistic = between group variability / within group variability
p < 0.05 - indicates significance of test for null-hypothesis (equal means) at an alpha of 0.05
Y = Yes, N = No
SGC≠NGC
≠ describes area comparisons that are not equal
* Significance based on Tukey HSD at α = 0.05
P-value = The level of marginal significance within a statistical hypothesis test, representing
the probability of the occurrence of a given event.
Notes:
Table 27: 2015 Results of Two Way ANOVA and One Way ANOVA for Pearl Dace from the Granny Creek System comparing Mercury Concentration by Area
SGC≠ST-5A
* Significant post HOC
NGC≠ST-5A
2 Way ANOVA
1 Way ANOVA (YOY)
1 Way ANOVA (Age 1+)
* Significant post HOC
NGC≠ST-5A
SGC≠ST-5A
TC140504 Page 97

De Beers Canada Inc., Victor MineMercury Performance Monitoring, 2015 Annual Report
per Certificate of Approval #3960-7Q4K2G, Conditions 7(5) and 7(6)
July 2016
Area NGC SGC ST-5A
LS Mean 0.345 0.241 0.069
SE 0.084 0.067 0.053
Area NGC SGC ST-5A
LS 0.420 0.215 0.079
SE 0.131 0.091 0.047
Table 28: Results of ANCOVA displaying LS Means of 2015 Pearl Dace Total HG Adjusted for Total Length and Post HOC Comparison Granny Creek System
Notes: LS Mean = Least Squared Mean
*Significant post HOC ComparisonsNGC≠SGC
LS Mean = Least Squared Mean
NGC≠ST-5A
SGC≠ST-5A
Pearl Dace (Age 1+)
Notes:
SE = Standard Error of Mean
SE = Standard Error of Mean
Pearl Dace (Age 1+)
NGC≠ST-5A
SGC≠ST-5A
Table 29: Results of ANCOVA displaying LS Means of 2015 Pearl DaceTotal HG Adjusted for Age and Post HOC Comparison Granny Creek System
*Significant post HOC ComparisonsNGC≠SGC
TC140504 Page 98

De Beers Canada Inc., Victor MineMercury Performance Monitoring, 2015 Annual Report
per Certificate of Approval #3960-7Q4K2G, Conditions 7(5) and 7(6)
July 2016
2009*NGC vs. 2009*SGC2009*NGC vs. 2015*NGC2009*NGC vs. 2015*SGC2009*SGC vs. 2009*ST5A2009*SGC vs. 2015*NGC2009*SGC vs. 2015*ST5A2009*ST5A vs. 2015* NGC2009*ST5A vs. 2015*SGC2015*NGC vs. 2015*SGC2015*NGC vs. 2015*ST5A2015*SGC vs. 2015*ST5A
Notes:
Table 30: BACI Design ANCOVA Results 2009 versus 2015 Control versus Impact Sites Granny Creek System
Comparison (Period*Site) Species n F-value P-valueSignificant Difference
*Significant Pairwise Comparisons
F-value and P-value are specific to the interaction term of Year*Location
Significance is based on α equal to 0.05
* Significance based on post-hoc pairwise comparisons at α = 0.05
2009*NGC | 2009*SGC | 2009* ST5A | 2015*NGC
| 2015*SGC | 2015* ST5APearl Dace 224 33.36 <0.001 Yes
TC140504 Page 99

De Beers Canada Inc., Victor MineMercury Performance Monitoring, 2015 Annual Report
per Certificate of Approval #3960-7Q4K2G, Conditions 7(5) and 7(6)
July 2016
ATT-NF ATT-FF ATT-US ATT-REF2 NAY-DS6 ATT-NF ATT-FF ATT-US ATT-REF2 NAY-DS6 ATT-NF ATT-FF ATT-US ATT-REF2 NAY-DS6
n 30 30 29 21 11 27 51 29 34 9 56 81 58 55 22
Mean 40.27 39.30 38.59 40.52 34.82 73.96 80.65 76.17 72.94 84.56 56.52 65.33 57.38 60.56 54.23
SE 0.94 0.90 0.62 0.94 1.15 1.17 1.89 1.99 1.34 3.15 2.39 2.55 2.69 2.32 5.71
Median 39.50 38.00 38.00 41.00 35.00 74.00 74.00 75.00 72.00 85.00 53.00 69.00 50.00 70.00 38.50
Min 31.00 30.00 29.00 31.00 28.00 62.00 65.00 54.00 48.00 66.00 31.00 30.00 29.00 31.00 24.00
Max 53.00 52.00 46.00 49.00 41.00 90.00 108.00 99.00 95.00 191.00 90.00 108.00 99.00 95.00 101.00
n 30 30 29 21 11 27 51 29 34 9 56 81 58 55 22
Mean 0.58 0.53 0.54 0.60 0.35 3.42 4.67 3.99 3.27 5.42 1.95 3.14 2.26 2.25 2.40
SE 0.04 0.04 0.03 0.04 0.04 0.19 0.36 0.34 0.19 0.59 0.21 0.32 0.28 0.21 0.60
Median 0.53 0.50 0.51 0.55 0.34 3.28 3.56 3.59 2.99 5.27 1.11 2.77 1.12 2.65 0.48
Min 0.27 0.29 0.20 0.30 0.18 1.90 2.14 1.33 0.88 2.43 0.27 0.29 0.20 0.30 0.11
Max 1.33 1.19 0.92 1.03 0.61 6.39 10.67 8.72 7.21 8.95 6.39 10.67 8.72 7.21 8.95
n 30 30 29 21 11 27 51 29 34 9 56 81 58 55 22
Mean 0.10 0.09 0.09 0.10 0.09 0.11 0.12 0.11 0.10 0.16 0.1 0.11 0.10 0.10 0.12
SE 0.01 0.01 0.01 0.01 0.01 0.01 0.01 0.01 0.01 0.02 0.01 0.01 0.01 0.01 0.01
Median 0.09 0.09 0.09 0.10 0.09 0.11 0.11 0.11 0.09 0.15 0.1 0.10 0.10 0.10 0.48
Min 0.06 0.07 0.06 0.07 0.06 0.07 0.08 0.08 0.07 0.08 0.06 0.07 0.06 0.07 0.06
Max 0.31 0.12 0.15 0.14 0.14 0.18 0.20 0.18 0.14 0.24 0.18 0.20 0.18 0.14 0.24
n 27 51 29 34 9 56 81 58 55 20
Mean 1.15 1.49 1.28 1.06 2.00 0.55 0.94 0.64 0.65 0.9
SE 0.07 0.11 0.10 0.04 0.17 0.08 0.1 0.1 0.07 0.24
Median 1 1 1 1 2 0 1 0.5 1 0
Min 1 1 1 1 1 0 0 0 0 0
Max 2 3 3 2 3 2 3 3 2 3
Total
Length
(mm)
Weight
(g)
Total Hg
(mg/kg)
Age
Table 31: Summary of Trout Perch Univariate Statistics by Age Class for 2015Attawapiskat and Nayskootayaow Rivers
Area
Age Class
YOY Trout Perch Age ≥1 Trout Perch Trout Perch All Ages Pooled
TC140504 Page 100
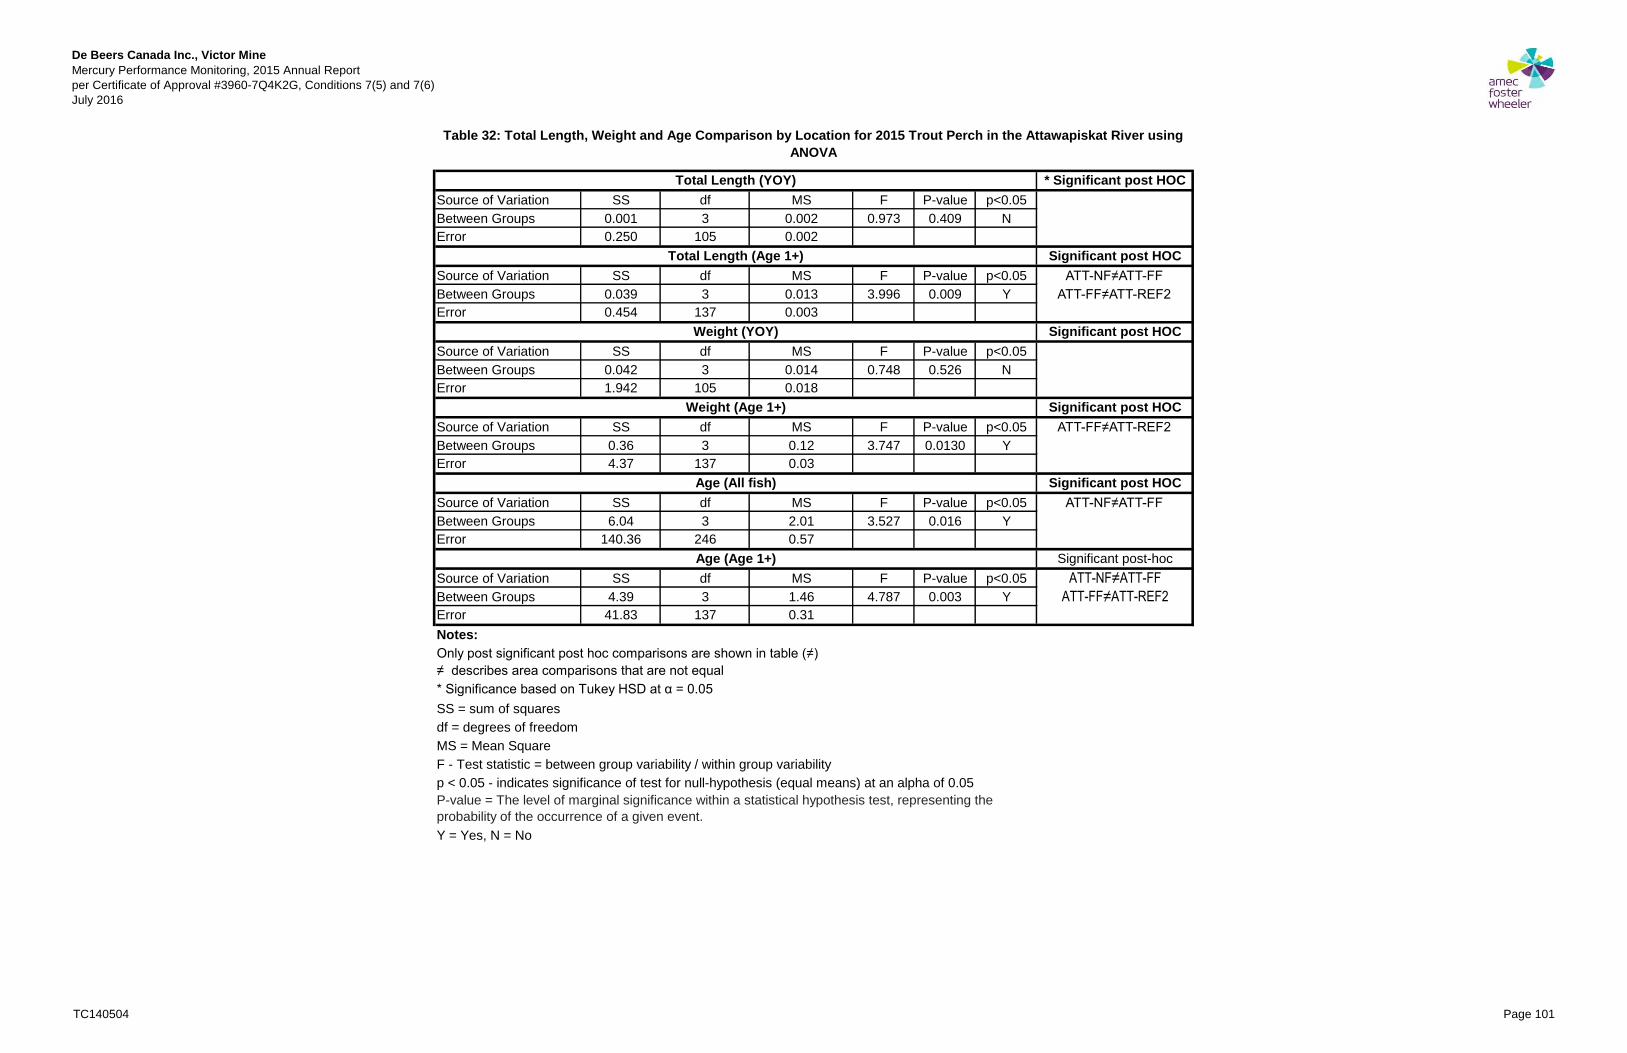
De Beers Canada Inc., Victor MineMercury Performance Monitoring, 2015 Annual Report
per Certificate of Approval #3960-7Q4K2G, Conditions 7(5) and 7(6)
July 2016
Source of Variation SS df MS F P-value p<0.05
Between Groups 0.001 3 0.002 0.973 0.409 N
Error 0.250 105 0.002
Source of Variation SS df MS F P-value p<0.05
Between Groups 0.039 3 0.013 3.996 0.009 Y
Error 0.454 137 0.003
Source of Variation SS df MS F P-value p<0.05
Between Groups 0.042 3 0.014 0.748 0.526 N
Error 1.942 105 0.018
Source of Variation SS df MS F P-value p<0.05
Between Groups 0.36 3 0.12 3.747 0.0130 Y
Error 4.37 137 0.03
Source of Variation SS df MS F P-value p<0.05
Between Groups 6.04 3 2.01 3.527 0.016 Y
Error 140.36 246 0.57
Source of Variation SS df MS F P-value p<0.05
Between Groups 4.39 3 1.46 4.787 0.003 Y
Error 41.83 137 0.31
Only post significant post hoc comparisons are shown in table (≠)
SS = sum of squares
df = degrees of freedom
MS = Mean Square
F - Test statistic = between group variability / within group variability
p < 0.05 - indicates significance of test for null-hypothesis (equal means) at an alpha of 0.05
Y = Yes, N = No
Table 32: Total Length, Weight and Age Comparison by Location for 2015 Trout Perch in the Attawapiskat River using ANOVA
ATT-FF≠ATT-REF2
Significant post HOC
* Significant post HOC
Significant post HOC
ATT-NF≠ATT-FF
ATT-NF≠ATT-FF
Total Length (YOY)
Total Length (Age 1+)
Weight (YOY)
Significant post HOC
ATT-FF≠ATT-REF2
Significant post HOC
P-value = The level of marginal significance within a statistical hypothesis test, representing the
probability of the occurrence of a given event.
Notes:
≠ describes area comparisons that are not equal
* Significance based on Tukey HSD at α = 0.05
ATT-FF≠ATT-REF2
Weight (Age 1+)
Age (All fish)
Age (Age 1+) Significant post-hoc
ATT-NF≠ATT-FF
TC140504 Page 101

De Beers Canada Inc., Victor MineMercury Performance Monitoring, 2015 Annual Report
per Certificate of Approval #3960-7Q4K2G, Conditions 7(5) and 7(6)
July 2016
SS df MS F P-value p<0.05
Location 0.447 3 0.149 3.443 0.018 Y
Ageclass 1.222 1 1.222 28.203 <0.001 Y
Location:Ageclass 0.379 3 0.379 2.915 0.035 Y
Residuals 10.484 242 10.484
Source of Variation SS df MS F P-value p<0.05
Between Groups 0.039 3 0.013 0.341 0.7960 N
Error 4.040 105 0.038
Source of Variation SS df MS F P-value p<0.05
Between Groups 0.719 3 0.239 5.098 0.0020 Y
Error 6.443 137 0.047
Only post significant post hoc comparisons are shown in table (≠)
SS = sum of squares
df = degrees of freedom
MS = Mean Square
F - Test statistic = between group variability / within group variabilityp < 0.05 - indicates significance of test for null-hypothesis (equal means) at an alpha of 0.05
Y = Yes, N = No
ATT-FF≠ATT-REF2
Table 33: 2015 Results of Two Way ANOVA and One Way ANOVA for Trout Perch from the Attawapiskat River
2 Way ANOVA
1 Way ANOVA (YOY) *Signficant post HOC
1 Way ANOVA (Age 1+) Signficant post HOC
Notes:
≠ describes area comparisons that are not equal
* Significance based on Tukey HSD at α = 0.05
P-value = The level of marginal significance within a statistical hypothesis test,
representing the probability of the occurrence of a given event.
TC140504 Page 102

De Beers Canada Inc., Victor MineMercury Performance Monitoring, 2015 Annual Report
per Certificate of Approval #3960-7Q4K2G, Conditions 7(5) and 7(6)
July 2016
ATT-NF ATT-FF ATT-REF2 ATT-US
LS Mean 0.100 0.104 0.094 0.099
SE 0.026 0.021 0.027 0.026
LS 0.110 0.109 0.100 0.107
SE 0.035 0.025 0.040 0.032
Only post significant post hoc comparisons are shown in table (≠)
Table 34: Results of ANCOVA displaying LS Means of 2015 Total Hg Adjusted for Total Length and Age with Post HOC Comparisons Attawapiskat River
Area
Fork-length
(mm)
≠ describes area comparisons that are not equal
* Significance based on post-hoc pairwise comparisons at α = 0.05
Age (years)
Adjusted For
(Covariate)
Trout Perch (Age 1+) *Significant post-hoc comparisons
ATT-FF≠ATT-REF2
LS Mean = Least Squared Mean
SE = Standard Error of Mean
Notes:
TC140504 Page 103

De Beers Canada Inc., Victor MineMercury Performance Monitoring, 2015 Annual Report
per Certificate of Approval #3960-7Q4K2G, Conditions 7(5) and 7(6)
July 2016
2009*ATT-FF vs. 2009*ATT-NF2009*ATT-NF vs. 2009*ATT-US2009*ATT-NF vs. 2015*ATT-FF2009*ATT-NF vs. ATT-NF*20152009*ATT-NF vs. 2015*ATT-US
Notes:
Table 35: BACI Design ANCOVA Results 2009 versus 2015 Control versus Impact Sites Attawapiskat River
Comparison (Period*Site) Species n F-value P-valueSignificant Difference
*Significant Pairwise Comparisons
F-value and P-value are specific to the interaction term of Year*Location
Significance is based on α equal to 0.05
* Significance based on post-hoc pairwise comparisons at α = 0.05
2009*ATT-US | 2009*ATT-NF | 2009* ATT-FF |
2015*ATT-US | 2015*ATT-NF | 2015*ATT-FFTrout Perch 283 15.904 <0.001 Yes
TC140504 Page 104
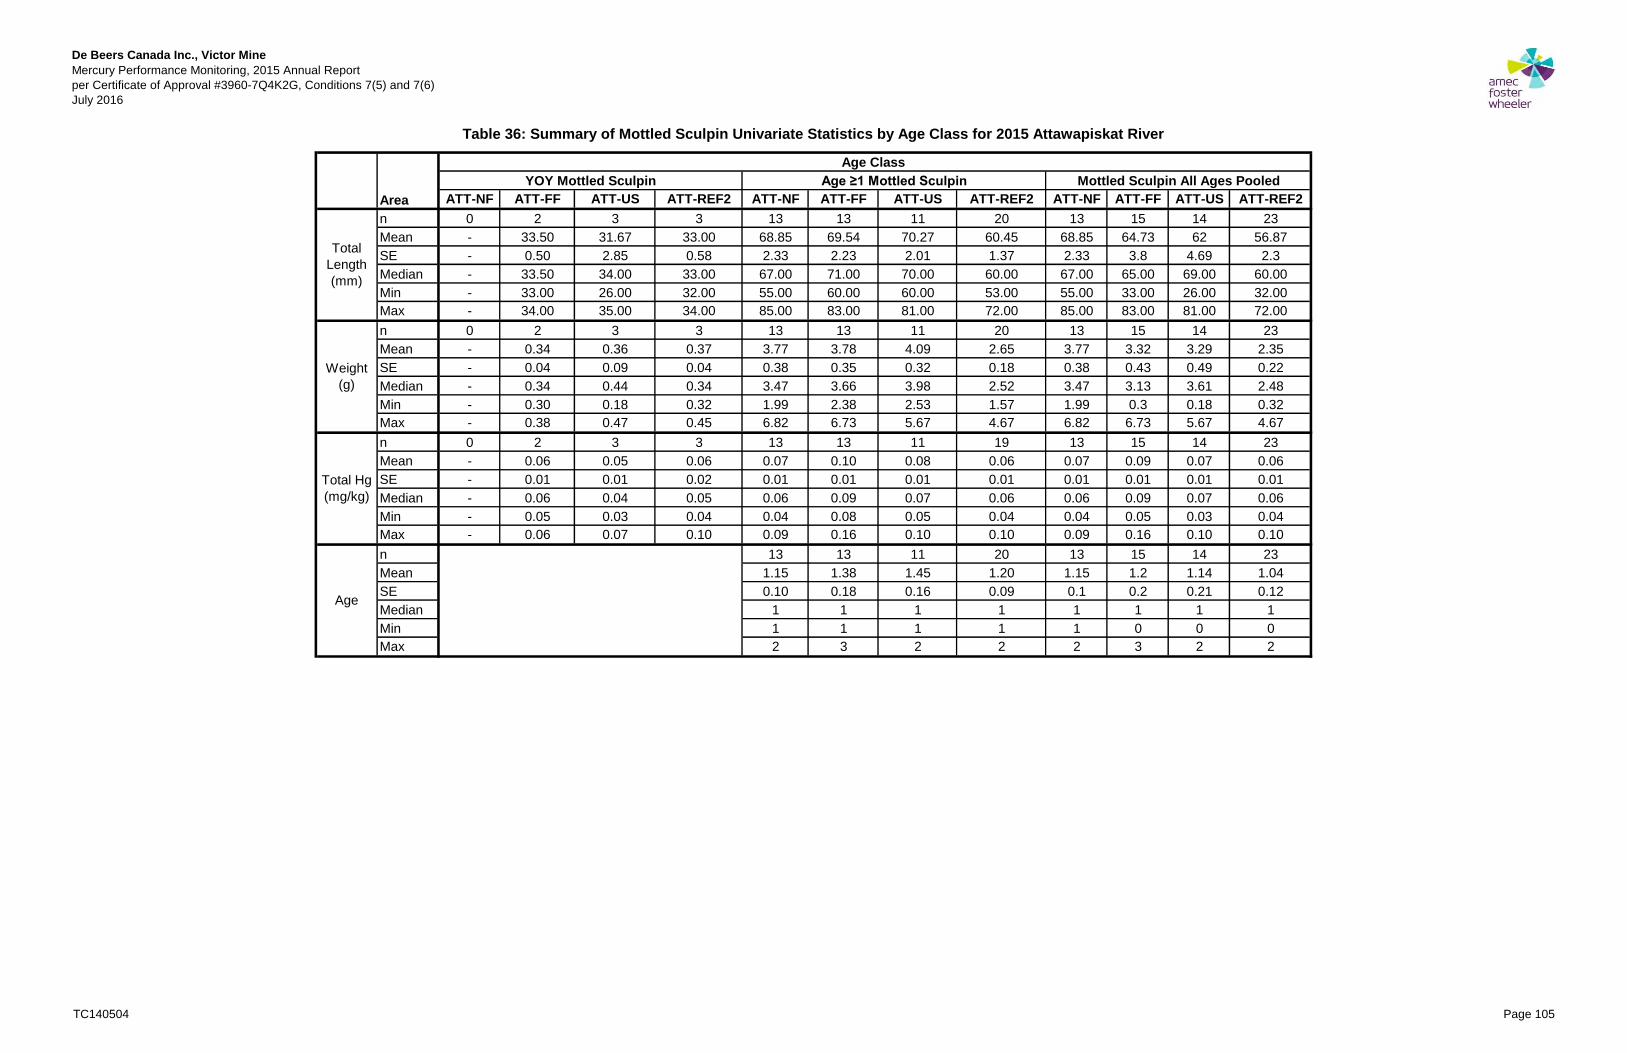
De Beers Canada Inc., Victor MineMercury Performance Monitoring, 2015 Annual Report
per Certificate of Approval #3960-7Q4K2G, Conditions 7(5) and 7(6)
July 2016
ATT-NF ATT-FF ATT-US ATT-REF2 ATT-NF ATT-FF ATT-US ATT-REF2 ATT-NF ATT-FF ATT-US ATT-REF2
n 0 2 3 3 13 13 11 20 13 15 14 23
Mean - 33.50 31.67 33.00 68.85 69.54 70.27 60.45 68.85 64.73 62 56.87
SE - 0.50 2.85 0.58 2.33 2.23 2.01 1.37 2.33 3.8 4.69 2.3
Median - 33.50 34.00 33.00 67.00 71.00 70.00 60.00 67.00 65.00 69.00 60.00
Min - 33.00 26.00 32.00 55.00 60.00 60.00 53.00 55.00 33.00 26.00 32.00
Max - 34.00 35.00 34.00 85.00 83.00 81.00 72.00 85.00 83.00 81.00 72.00
n 0 2 3 3 13 13 11 20 13 15 14 23
Mean - 0.34 0.36 0.37 3.77 3.78 4.09 2.65 3.77 3.32 3.29 2.35
SE - 0.04 0.09 0.04 0.38 0.35 0.32 0.18 0.38 0.43 0.49 0.22
Median - 0.34 0.44 0.34 3.47 3.66 3.98 2.52 3.47 3.13 3.61 2.48
Min - 0.30 0.18 0.32 1.99 2.38 2.53 1.57 1.99 0.3 0.18 0.32
Max - 0.38 0.47 0.45 6.82 6.73 5.67 4.67 6.82 6.73 5.67 4.67
n 0 2 3 3 13 13 11 19 13 15 14 23
Mean - 0.06 0.05 0.06 0.07 0.10 0.08 0.06 0.07 0.09 0.07 0.06
SE - 0.01 0.01 0.02 0.01 0.01 0.01 0.01 0.01 0.01 0.01 0.01
Median - 0.06 0.04 0.05 0.06 0.09 0.07 0.06 0.06 0.09 0.07 0.06
Min - 0.05 0.03 0.04 0.04 0.08 0.05 0.04 0.04 0.05 0.03 0.04
Max - 0.06 0.07 0.10 0.09 0.16 0.10 0.10 0.09 0.16 0.10 0.10
n 13 13 11 20 13 15 14 23
Mean 1.15 1.38 1.45 1.20 1.15 1.2 1.14 1.04
SE 0.10 0.18 0.16 0.09 0.1 0.2 0.21 0.12
Median 1 1 1 1 1 1 1 1
Min 1 1 1 1 1 0 0 0
Max 2 3 2 2 2 3 2 2
Total
Length
(mm)
Weight
(g)
Total Hg
(mg/kg)
Age
Table 36: Summary of Mottled Sculpin Univariate Statistics by Age Class for 2015 Attawapiskat River
Area
Age Class
YOY Mottled Sculpin Age ≥1 Mottled Sculpin Mottled Sculpin All Ages Pooled
TC140504 Page 105

De Beers Canada Inc., Victor MineMercury Performance Monitoring, 2015 Annual Report
per Certificate of Approval #3960-7Q4K2G, Conditions 7(5) and 7(6)
July 2016
Source of Variation SS df MS F P-value p<0.05
Between Groups 1078.600 3 359.500 6.845 <0.001 Y
Error 2784.100 53 52.530
Source of Variation SS df MS F P-value p<0.05
Between Groups 0.35 3 0.12 6.590 <0.001 Y
Error 0.93 53 0.02
Source of Variation SS df MS F P-value p<0.05
Between Groups 0.81 3 0.27 1.130 0.345 N
Error 12.70 53 0.24
Source of Variation SS df MS F P-value p<0.05
Between Groups 2.22 3 0.74 13.300 <0.001 Y
Error 2.90 52 0.06
SS = sum of squares
df = degrees of freedom
MS = Mean Square
F - Test statistic = between group variability / within group variability
p < 0.05 - indicates significance of test for null-hypothesis (equal means) at an alpha of 0.05
Y = Yes, N = No
* Significance based on Tukey HSD at α = 0.05
P-value = The level of marginal significance within a statistical hypothesis test, representing the
probability of the occurrence of a given event.
ATT-US≠ATT-REF2
Age (Age 1+) Signficant post-hoc
Weight (Age 1+) Signficant post-hoc
ATT-FF≠ATT-REF2
ATT-NF≠ATT-REF2
ATT-US≠ATT-REF2
Total Hg (Age 1+) Signficant post HOCATT-FF≠ATT-REF2
ATT-FF≠ATT-NF
ATT-FF≠ATT-US
ATT-FF≠ATT-REF2
ATT-NF≠ATT-REF2
Table 37: Total Length, Weight and Age Comparison by Location for 2015 Mottled Sculpin in the Attawapiskat River using ANOVA
Total Length (Age 1+) * Signficant post HOC
TC140504 Page 106
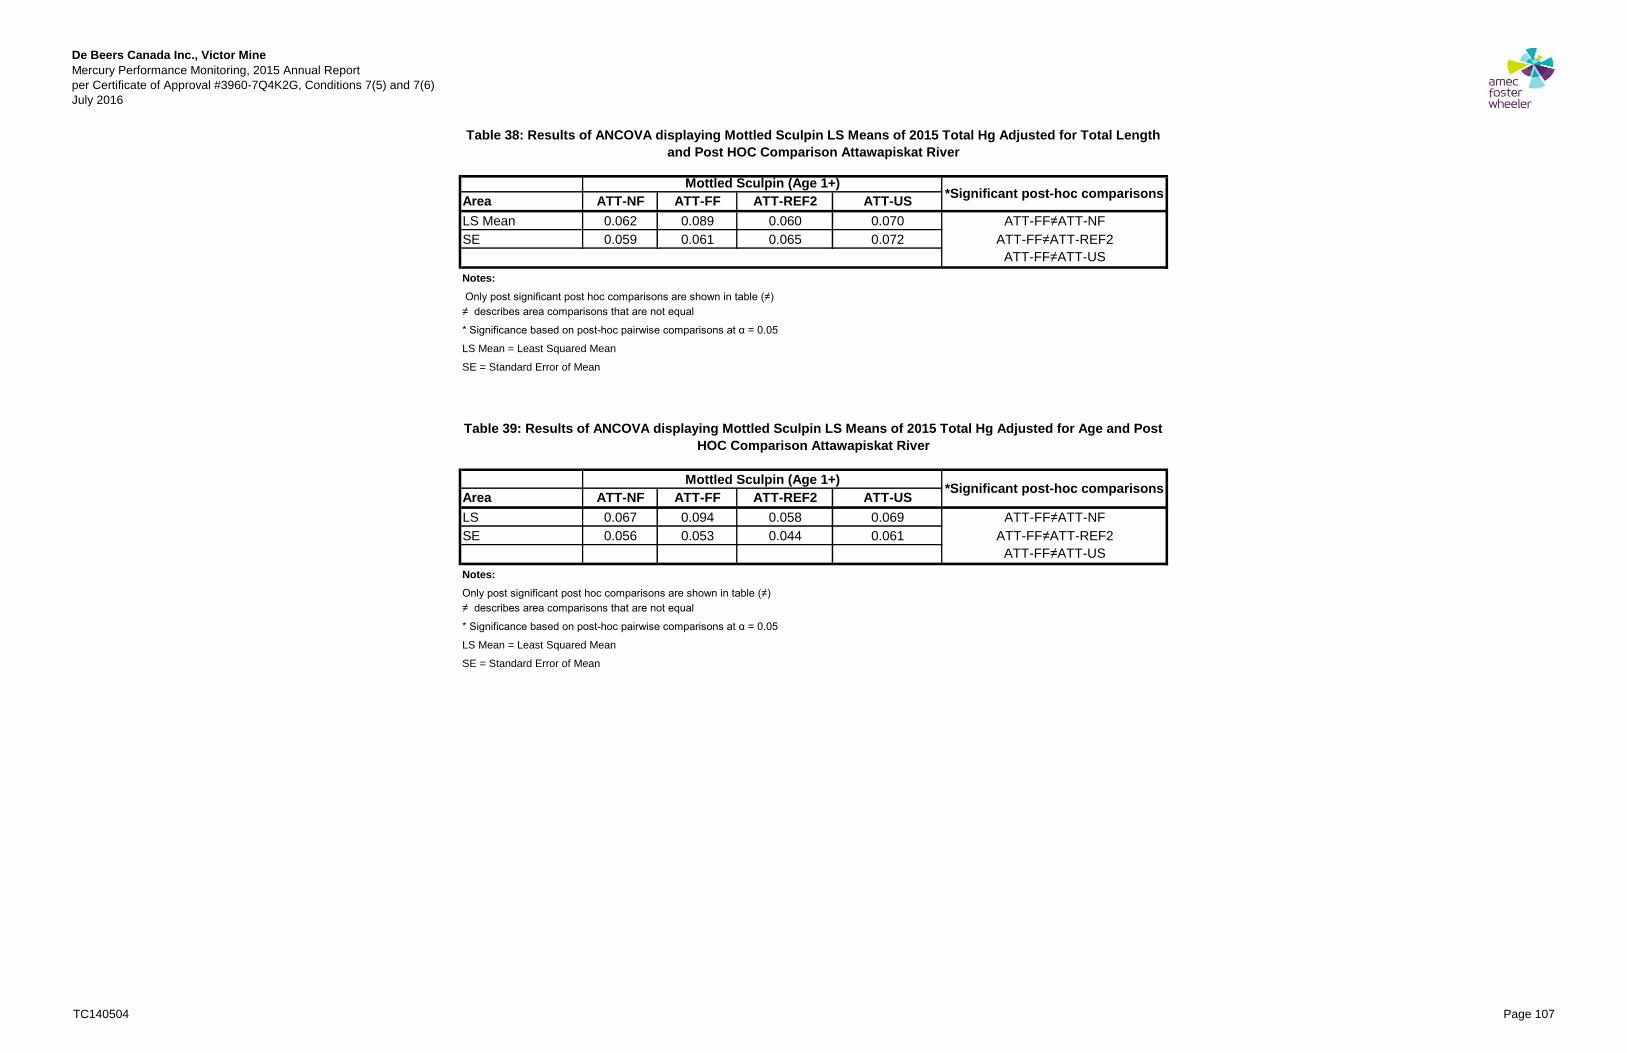
De Beers Canada Inc., Victor MineMercury Performance Monitoring, 2015 Annual Report
per Certificate of Approval #3960-7Q4K2G, Conditions 7(5) and 7(6)
July 2016
Area ATT-NF ATT-FF ATT-REF2 ATT-US
LS Mean 0.062 0.089 0.060 0.070
SE 0.059 0.061 0.065 0.072
Only post significant post hoc comparisons are shown in table (≠)
Area ATT-NF ATT-FF ATT-REF2 ATT-US
LS 0.067 0.094 0.058 0.069
SE 0.056 0.053 0.044 0.061
Only post significant post hoc comparisons are shown in table (≠)
≠ describes area comparisons that are not equal
* Significance based on post-hoc pairwise comparisons at α = 0.05
LS Mean = Least Squared Mean
SE = Standard Error of Mean
ATT-FF≠ATT-US
Notes:
ATT-FF≠ATT-REF2
ATT-FF≠ATT-REF2
Mottled Sculpin (Age 1+)*Significant post-hoc comparisons
ATT-FF≠ATT-NF
Notes:
≠ describes area comparisons that are not equal
* Significance based on post-hoc pairwise comparisons at α = 0.05
LS Mean = Least Squared Mean
SE = Standard Error of Mean
Table 39: Results of ANCOVA displaying Mottled Sculpin LS Means of 2015 Total Hg Adjusted for Age and Post HOC Comparison Attawapiskat River
ATT-FF≠ATT-US
Table 38: Results of ANCOVA displaying Mottled Sculpin LS Means of 2015 Total Hg Adjusted for Total Length and Post HOC Comparison Attawapiskat River
Mottled Sculpin (Age 1+)*Significant post-hoc comparisons
ATT-FF≠ATT-NF
TC140504 Page 107

De Beers Canada Inc., Victor MineMercury Performance Monitoring, 2015 Annual Report
per Certificate of Approval #3960-7Q4K2G, Conditions 7(5) and 7(6)
July 2016
NAY-DS6 NAY-US3 NAY-DS6 NAY-US3 NAY-DS6 NAY-US3
n 25 18 46 36 71 54
Mean 41.12 36.33 62.70 60.61 55.1 52.52
SE 0.51 0.87 1.80 1.62 1.7 1.92
Median 41.00 35.50 61.50 59.50 55.00 54.00
Min 37.00 31.00 42.00 46.00 37.00 31.00
Max 46.00 43.00 96.00 94.00 96.00 94.00
n 25 18 46 36 71 54
Mean 0.53 0.38 2.11 1.88 1.55 1.38
SE 0.02 0.03 0.23 0.17 0.17 0.15
Median 0.50 0.37 1.62 1.65 1.32 1.20
Min 0.37 0.21 0.36 0.76 0.36 0.21
Max 0.70 0.62 7.11 6.38 7.11 6.38
n 20 18 46 36 66 54
Mean 0.16 0.07 0.13 0.08 0.14 0.08
SE 0.02 0.01 0.01 0.01 0.01 0.01
Median 0.12 0.06 0.10 0.08 0.1 0.07
Min 0.06 0.05 0.07 0.05 0.06 0.05
Max 0.43 0.09 0.33 0.13 0.43 0.13
n 46 36 71 54
Mean 1.13 1.11 0.73 0.74
SE 0.05 0.05 0.07 0.08
Median 1 1 1 1
Min 1 1 0 0
Max 2 2 2 2
Total Length (mm)
Weight (g)
Total Hg (mg/kg)
Age
Table 40: Summary of 2015 Pearl Dace Univariate Statistics by Age Class for 2015 Nayskootayaow River
Area
Age Class
YOY Pearl Dace Age ≥1 Pearl Dace Pearl Dace All Ages Pooled
TC140504 Page 108

De Beers Canada Inc., Victor MineMercury Performance Monitoring, 2015 Annual Report
per Certificate of Approval #3960-7Q4K2G, Conditions 7(5) and 7(6)
July 2016
Source of Variation SS df MS F P-value p<0.05
Between Groups 239.780 1 329.780 25.040 <0.001 Y
Error 392.640 41 9.580
Source of Variation SS df MS F P-value p<0.05
Between Groups 0.003 1 0.003 0.570 0.452 N
Error 0.437 80 0.005
Source of Variation SS df MS F P-value p<0.05
Between Groups 0.218 1 0.218 18.630 <0.001 Y
Error 0.479 41 0.012
Source of Variation SS df MS F P-value p<0.05
Between Groups 0.004 1 0.003 0.076 0.452 N
Error 4.451 80 0.005
Source of Variation SS df MS F P-value p<0.05
Between Groups 0.002 1 0.002 0.006 0.939 N
Error 44.286 123 0.360
Source of Variation SS df MS F P-value p<0.05
Between Groups 0.008 1 0.008 0.069 0.794 N
Error 8.773 80 0.109
Only post significant post hoc comparisons are shown in table (≠)
SS = sum of squares
df = degrees of freedom
MS = Mean Square
F - Test statistic = between group variability / within group variability
p < 0.05 - indicates significance of test for null-hypothesis (equal means) at an alpha of 0.05
Y = Yes, N = No
Weight (Age 1+)
Age (All fish)
Weight (YOY)
Total Length (Age 1+)
Table 41: Total Length, eight and Age Comparison by Location for 2015 Pearl Dace in the Nayskootayaow River using ANOVA
Total Length (YOY)
Notes:
≠ describes area comparisons that are not equal
* Significance based on Tukey HSD at α = 0.05
P-value = The level of marginal significance within a statistical hypothesis test, representing the
probability of the occurrence of a given event.
Age (Age 1+)
TC140504 Page 109

De Beers Canada Inc., Victor MineMercury Performance Monitoring, 2015 Annual Report
per Certificate of Approval #3960-7Q4K2G, Conditions 7(5) and 7(6)
July 2016
SS df MS F P-value p<0.05
Location 7.201 1 7.201 50.030 <0.001 Y
Ageclass 0.000 1 0.000 0.001 0.970 N
Location:Ageclass 0.730 1 0.730 5.074 0.026 Y
Residuals 16.695 116 0.144
Source of Variation SS df MS F P-value p<0.05
Between Groups 4.929 1 4.929 26.839 <0.001 Y
Error 6.612 80 0.184
Source of Variation SS df MS F P-value p<0.05
Between Groups 2.991 1 2.991 23.732 <0.001 Y
Error 10.083 80 0.126
Only post significant post hoc comparisons are shown in table (≠)
SS = sum of squares
df = degrees of freedom
MS = Mean Square
F - Test statistic = between group variability / within group variability
p < 0.05 - indicates significance of test for null-hypothesis (equal means) at an alpha of 0.05
Y = Yes, N = No
Table 42: 2015 Results of Two Way ANOVA and One Way ANOVA for Pearl Dace from the Nayskootayaow River
≠ describes area comparisons that are not equal
* Significance based on Tukey HSD at α = 0.05
P-value = The level of marginal significance within a statistical hypothesis test, representing
the probability of the occurrence of a given event.
1 Way ANOVA (Age 1+)
2 Way ANOVA
1 Way ANOVA (YOY)
Notes:
TC140504 Page 110

De Beers Canada Inc., Victor MineMercury Performance Monitoring, 2015 Annual Report
per Certificate of Approval #3960-7Q4K2G, Conditions 7(5) and 7(6)
July 2016
Area NAY-DS6 NAY-US3 P-value p<0.05
LS Mean 0.116 0.080 <0.001 Y
SE 0.052 0.059
Area NAY-DS6 NAY-US3 P-value p<0.05
LS 0.116 0.080 <0.001 Y
SE 0.053 0.060
Table 43: Results of ANCOVA displaying LS Means of 2015 Pearl Dace Total Hg Adjusted for Total Length and Post HOC Comparison Nayskootayaow River
Pearl Dace (Age 1+)
LS Mean = Least Squared Mean
SE = Standard Error of Mean
Pearl Dace (Age 1+)
Notes:
Notes: LS Mean = Least Squared Mean
SE = Standard Error of Mean
Table 44: Results of ANCOVA displaying LS Means of 2015 Pearl Dace Total Hg Adjusted for Age and Post HOC Comparison Nayskootayaow River
TC140504 Page 111

De Beers Canada Inc., Victor MineMercury Performance Monitoring, 2015 Annual Report
per Certificate of Approval #3960-7Q4K2G, Conditions 7(5) and 7(6)
July 2016
Year Species Locations Sampled ANOVA Results
2008 Trout Perch NR-E1 N/A*
2009 Pearl Dace NAY-US-T3, NAY-DS-T6 No difference
2010 Pearl Dace NAY-US-T3, NAY-DS-T6 No difference
2011 Trout Perch NAY-US-T3, NAY-DS-T6 NAY-US-T3 > NAY-DS-T6
2012 Pearl Dace NAY-US-T3, NAY-DS-T6 No difference
2013 Trout Perch NAY-US-T3, NAY-DS-T6 No difference
2014 Pearl Dace, TroutPerch NAY-DS-T6 N/A*
2015 Pearl Dace NAY-US-T3, NAY-DS-T6 NAY-DS-T6 > NAY-US-T3
Notes:
* Statistical analyses not completed for given year
Table 45: Sentinel Species from the Nayskootayaow River used in Statistical Analyses 2008 - Present
TC140504 Page 112

De Beers Canada Inc., Victor MineMercury Performance Monitoring, 2015 Annual Report
per Certificate of Approval #3960-7Q4K2G, Conditions 7(5) and 7(6)
Cluster Location
Substrate/Condition Well NameTotal Mercury
(Filtered)
Methyl Mercury(Filtered)
HabitatControlMean
(S13+S15)S-1 Sum r.
Peat - Domed Bog MS-1-D 0.82 0.05 D. Bog 1.30 0.82 2.115 Total SS 3.609
Peat - Flat Bog MS-1-F 2.04 0.04 F. Bog 1.02 2.036 3.056 Treat SS 0.729
Peat - Horizontal Fen MS-1-H 0.39 <0.02 H. Fen 0.14 0.39 0.532 Block SS 1.629
Peat - Ribbed Fen MS-1-R 1.73 0.06 R. Fen 0.11 1.73 1.835 Error SS 1.251
Peat - Domed Bog MS-2-D 1.40 0.02 Sum c. 2.56 4.976 7.538
Peat - Flat Bog MS-2-F 5.10 0.05
Peat - Ribbed Fen MS-2-R 1.46 0.06
Peat - Domed Bog MS-7-D 0.58 <0.02 Source V. d.f. SS MS Fcal Ftab 0.05
Peat - Flat Bog MS-7-F 1.12 <0.02 Total 7 3.609 -
Peat - Horizontal Fen MS-7-H 3.23 0.09 Treatment 1 0.729 0.729 1.75 10.1
Peat - Ribbed Fen MS-7-R 0.11 <0.02 Block 3 1.629 0.543 1.30 9.28
Peat - Domed Bog MS-8-D 1.51 0.06 Error 3 1.251 0.417
Peat - Flat Bog MS-8-F 5.73 0.14
Peat - Horizontal Fen MS-8-H 0.29 0.06 Treatment Effect (i.e., difference between Control and S-1) Not SignificantPeat - Ribbed Fen MS-8-R 1.34 0.10
Peat - Domed Bog MS-9(1)-D 0.68 0.05
Peat - Flat Bog MS-9(1)-F 1.50 0.29
Peat - Horizontal Fen MS-9(1)-H 0.50 <0.02
Peat - Ribbed Fen MS-9(1)-R 0.51 0.09
Peat - Domed Bog MS-9(2)-D 1.14 <0.02
Peat - Flat Bog MS-9(2)-F 1.15 0.04
Peat - Horizontal Fen MS-9(2)-H <0.10 <0.02 D. Bog 0.07 0.05 0.115 Total SS 0.003
Peat - Ribbed Fen MS-9(2)-R 0.24 <0.02 F. Bog 0.08 0.04 0.120 Treat SS 0.000
Peat - Domed Bog MS-13-D 2.41 0.11 H. Fen 0.02 0.02 0.040 Block SS 0.002
Peat - Flat Bog MS-13-F 1.56 0.12 R. Fen 0.02 0.06 0.080 Error SS 0.001
Peat - Horizontal Fen MS-13-H 0.18 <0.02 Sum c. 0.181 0.174 0.355
Peat - Ribbed Fen MS-13-R 0.11 <0.02
Peat - Domed Bog MS-15-D 0.18 <0.02
Peat - Flat Bog MS-15-F 0.48 0.03 Source V. d.f. SS MS Fcal Ftab 0.05
Peat - Horizontal Fen MS-15-H <0.10 <0.02 Total 7 0.003 -
Peat - Ribbed Fen MS-15-R <0.10 <0.02 Treatment 1 0.000 0.000 0.013 10.1
Peat - Domed Bog MS-V(1)-D 0.29 <0.02 Block 3 0.002 0.001 1.45 9.28
Peat - Ribbed Fen MS-V(1)-R Error 3 0.001 0.000
Peat - Domed Bog MS-V(2)-D 1.23 0.10
Peat - Ribbed Fen MS-V(2)-R 0.89 <0.02 Treatment Effect (i.e., difference between Control and S-1) Not SignificantPeat - Domed Bog MS-V(3)-D 1.39 <0.02
Peat - Ribbed Fen MS-V(3)-R 0.58 <0.02
Clusters used for statistical analysis
MDLs have been adjusted for all years for uniformity (0.02 ng/L for methyl mercury and 0.1 ng/L for total mercury), as per Section 1.
Blank cells indicate concentration was not determined.
MS-V(3)
MS-13
MS-15
ANOVA Table
MS-V(1)
MS-V(2)
MS-2
ANOVA Table
MS-7
MS-8
MS-9(1)
METHYL MERCURY
HabitatControlMean
(S13+S15)S-1 Sum r.
MS-9(2)
Table 46a: Muskeg Monitoring Program - Statistical Anslysis of Cluster Peat Horizon Mercury Pore Waters Annual Sampling Program 2015 Results - Cluster S-1
TOTAL AND METHYL MERCURY PORE WATER CONCENTRATIONS (ng/L)
TWO-WAY ANALYSIS OF VARIANCE TABLES
TOTAL MERCURY
MS-1
TC140504 Page 113

De Beers Canada Inc., Victor MineMercury Performance Monitoring, 2015 Annual Report
per Certificate of Approval #3960-7Q4K2G, Conditions 7(5) and 7(6)
Cluster Location
Substrate/Condition Well NameTotal Mercury
(Filtered)
Methyl Mercury(Filtered)
HabitatControlMean
(S13+S15)S-2 Sum r.
Peat - Domed Bog MS-1-D 0.82 0.05 D. Bog 1.30 1.403 2.698 Total SS 14.886
Peat - Flat Bog MS-1-F 2.04 0.04 F. Bog 1.02 5.102 6.122 Treat SS 5.119
Peat - Horizontal Fen MS-1-H 0.39 <0.02 R. Fen 0.11 1.457 1.562 Block SS 5.635
Peat - Ribbed Fen MS-1-R 1.73 0.06 Sum c. 2.42 7.962 10.382 Error SS 4.132
Peat - Domed Bog MS-2-D 1.40 0.02
Peat - Flat Bog MS-2-F 5.10 0.05
Peat - Ribbed Fen MS-2-R 1.46 0.06
Peat - Domed Bog MS-7-D 0.58 <0.02 Source V. d.f. SS MS Fcal Ftab 0.05
Peat - Flat Bog MS-7-F 1.12 <0.02 Total 5 14.886 -
Peat - Horizontal Fen MS-7-H 3.23 0.09 Treatment 1 5.119 5.119 2.48 18.5
Peat - Ribbed Fen MS-7-R 0.11 <0.02 Block 2 5.635 2.817 1.36 19.0
Peat - Domed Bog MS-8-D 1.51 0.06 Error 2 4.132 2.066
Peat - Flat Bog MS-8-F 5.73 0.14
Peat - Horizontal Fen MS-8-H 0.29 0.06 Treatment Effect (i.e., difference between Control and S-2) Not SignificantPeat - Ribbed Fen MS-8-R 1.34 0.10
Peat - Domed Bog MS-9(1)-D 0.68 0.05
Peat - Flat Bog MS-9(1)-F 1.50 0.29
Peat - Horizontal Fen MS-9(1)-H 0.50 <0.02
Peat - Ribbed Fen MS-9(1)-R 0.51 0.09
Peat - Domed Bog MS-9(2)-D 1.14 <0.02
Peat - Flat Bog MS-9(2)-F 1.15 0.04
Peat - Horizontal Fen MS-9(2)-H <0.10 <0.02 D. Bog 0.07 0.02 0.089 Total SS 0.002
Peat - Ribbed Fen MS-9(2)-R 0.24 <0.02 F. Bog 0.08 0.05 0.122 Treat SS 0.000
Peat - Domed Bog MS-13-D 2.41 0.11 R. Fen 0.02 0.06 0.075 Block SS 0.001
Peat - Flat Bog MS-13-F 1.56 0.12 Sum c. 0.161 0.125 0.286 Error SS 0.002
Peat - Horizontal Fen MS-13-H 0.18 <0.02
Peat - Ribbed Fen MS-13-R 0.11 <0.02
Peat - Domed Bog MS-15-D 0.18 <0.02
Peat - Flat Bog MS-15-F 0.48 0.03 Source V. d.f. SS MS Fcal Ftab 0.05
Peat - Horizontal Fen MS-15-H <0.10 <0.02 Total 5 0.002 -
Peat - Ribbed Fen MS-15-R <0.10 <0.02 Treatment 1 0.000 0.000 0.26 18.5
Peat - Domed Bog MS-V(1)-D 0.29 <0.02 Block 2 0.001 0.000 0.35 19.0
Peat - Ribbed Fen MS-V(1)-R Error 2 0.002 0.001
Peat - Domed Bog MS-V(2)-D 1.23 0.10
Peat - Ribbed Fen MS-V(2)-R 0.89 <0.02
Peat - Domed Bog MS-V(3)-D 1.39 <0.02
Peat - Ribbed Fen MS-V(3)-R 0.58 <0.02
Clusters used for statistical analysis
MDLs have been adjusted for all years for uniformity (0.02 ng/L for methyl mercury and 0.1 ng/L for total mercury), as per Section 1.
Blank cells indicate concentration was not determined.
MS-V(3)
MS-13
MS-15
ANOVA Table
MS-V(1)
MS-V(2)Treatment Effect (i.e., difference between Control and S-2) Not Significant
MS-2
ANOVA Table
MS-7
MS-8
MS-9(1)
METHYL MERCURY
HabitatControlMean
(S13+S15)S-2 Sum r.
MS-9(2)
Table 46b: Muskey Monitoring Program - Statistical Analysis of Cluster Peat Horizon Mercury Pore Waters Annual Sampling Program 2015 Results - Cluster S-2
TOTAL AND METHYL MERCURY PORE WATER CONCENTRATIONS (ng/L)TWO-WAY ANALYSIS OF VARIANCE TABLES
TOTAL MERCURY
MS-1
TC140504 Page 114

De Beers Canada Inc., Victor MineMercury Performance Monitoring, 2015 Annual Report
per Certificate of Approval #3960-7Q4K2G, Conditions 7(5) and 7(6)
Cluster Location
Substrate/Condition Well NameTotal Mercury
(Filtered)
Methyl Mercury(Filtered)
HabitatControlMean
(S13+S15)S-7 Sum r.
Peat - Domed Bog MS-1-D 0.82 0.05 D. Bog 1.30 0.579 1.874 Total SS 7.555
Peat - Flat Bog MS-1-F 2.04 0.04 F. Bog 1.02 1.115 2.135 Treat SS 0.759
Peat - Horizontal Fen MS-1-H 0.39 <0.02 H. Fen 0.14 3.227 3.369 Block SS 2.534
Peat - Ribbed Fen MS-1-R 1.73 0.06 R. Fen 0.11 0.105 0.210 Error SS 4.262
Peat - Domed Bog MS-2-D 1.40 0.02 Sum c. 2.5615 5.026 7.588
Peat - Flat Bog MS-2-F 5.10 0.05
Peat - Ribbed Fen MS-2-R 1.46 0.06
Peat - Domed Bog MS-7-D 0.58 <0.02 Source V. d.f. SS MS Fcal Ftab 0.05
Peat - Flat Bog MS-7-F 1.12 <0.02 Total 7 7.555 -
Peat - Horizontal Fen MS-7-H 3.23 0.09 Treatment 1 0.759 0.759 0.53 10.1
Peat - Ribbed Fen MS-7-R 0.11 <0.02 Block 3 2.534 0.845 0.59 9.28
Peat - Domed Bog MS-8-D 1.51 0.06 Error 3 4.262 1.421
Peat - Flat Bog MS-8-F 5.73 0.14
Peat - Horizontal Fen MS-8-H 0.29 0.06 Treatment Effect (i.e., difference between Control and S-7) Not SignificantPeat - Ribbed Fen MS-8-R 1.34 0.10
Peat - Domed Bog MS-9(1)-D 0.68 0.05
Peat - Flat Bog MS-9(1)-F 1.50 0.29
Peat - Horizontal Fen MS-9(1)-H 0.50 <0.02
Peat - Ribbed Fen MS-9(1)-R 0.51 0.09
Peat - Domed Bog MS-9(2)-D 1.14 <0.02
Peat - Flat Bog MS-9(2)-F 1.15 0.04
Peat - Horizontal Fen MS-9(2)-H <0.10 <0.02 D. Bog 0.07 0.02 0.085 Total SS 0.006
Peat - Ribbed Fen MS-9(2)-R 0.24 <0.02 F. Bog 0.08 0.02 0.096 Treat SS 0.000
Peat - Domed Bog MS-13-D 2.41 0.11 H. Fen 0.02 0.09 0.106 Block SS 0.001
Peat - Flat Bog MS-13-F 1.56 0.12 R. Fen 0.02 0.02 0.040 Error SS 0.005
Peat - Horizontal Fen MS-13-H 0.18 <0.02 Sum c. 0.181 0.146 0.327
Peat - Ribbed Fen MS-13-R 0.11 <0.02
Peat - Domed Bog MS-15-D 0.18 <0.02
Peat - Flat Bog MS-15-F 0.48 0.03 Source V. d.f. SS MS Fcal Ftab 0.05
Peat - Horizontal Fen MS-15-H <0.10 <0.02 Total 7 0.006 -
Peat - Ribbed Fen MS-15-R <0.10 <0.02 Treatment 1 0.000 0.000 0.10 10.1
Peat - Domed Bog MS-V(1)-D 0.29 <0.02 Block 3 0.001 0.000 0.28 9.28
Peat - Ribbed Fen MS-V(1)-R Error 3 0.005 0.002
Peat - Domed Bog MS-V(2)-D 1.23 0.10
Peat - Ribbed Fen MS-V(2)-R 0.89 <0.02 Treatment Effect (i.e., difference between Control and S-7) Not SignificantPeat - Domed Bog MS-V(3)-D 1.39 <0.02
Peat - Ribbed Fen MS-V(3)-R 0.58 <0.02
Clusters used for statistical analysis
MDLs have been adjusted for all years for uniformity (0.02 ng/L for methyl mercury and 0.1 ng/L for total mercury), as per Section 1.
Blank cells indicate concentration was not determined.
MS-V(3)
MS-13
MS-15
ANOVA Table
MS-V(1)
MS-V(2)
MS-2
ANOVA Table
MS-7
MS-8
MS-9(1)
METHYL MERCURY
HabitatControlMean
(S13+S15)S-7 Sum r.
MS-9(2)
Table 46c: Muskey Monitoring Program - Statistical Analysis of Cluster Peat Horizon Mercury Pore Waters Annual Samplinjg Program 2015 Results - Cluster S-7
TOTAL AND METHYL MERCURY PORE WATER CONCENTRATIONS (ng/L)
TWO-WAY ANALYSIS OF VARIANCE TABLES
TOTAL MERCURY
MS-1
TC140504 Page 115

De Beers Canada Inc., Victor MineMercury Performance Monitoring, 2015 Annual Report
per Certificate of Approval #3960-7Q4K2G, Conditions 7(5) and 7(6)
Cluster Location
Substrate/Condition Well NameTotal Mercury
(Filtered)
Methyl Mercury(Filtered)
HabitatControlMean
(S13+S15)S-8 Sum r.
Peat - Domed Bog MS-1-D 0.82 0.05 D. Bog 1.30 1.509 2.804 Total SS 23.435
Peat - Flat Bog MS-1-F 2.04 0.04 F. Bog 1.02 5.732 6.752 Treat SS 4.968
Peat - Horizontal Fen MS-1-H 0.39 <0.02 H. Fen 0.14 0.29 0.427 Block SS 11.537
Peat - Ribbed Fen MS-1-R 1.73 0.06 R. Fen 0.11 1.34 1.445 Error SS 6.929
Peat - Domed Bog MS-2-D 1.40 0.02 Sum c. 2.5615 8.866 11.428
Peat - Flat Bog MS-2-F 5.10 0.05
Peat - Ribbed Fen MS-2-R 1.46 0.06
Peat - Domed Bog MS-7-D 0.58 <0.02 Source V. d.f. SS MS Fcal Ftab 0.05
Peat - Flat Bog MS-7-F 1.12 <0.02 Total 7 23.435 -
Peat - Horizontal Fen MS-7-H 3.23 0.09 Treatment 1 4.968 4.968 2.15 10.1
Peat - Ribbed Fen MS-7-R 0.11 <0.02 Block 3 11.537 3.846 1.67 9.28
Peat - Domed Bog MS-8-D 1.51 0.06 Error 3 6.929 2.310
Peat - Flat Bog MS-8-F 5.73 0.14
Peat - Horizontal Fen MS-8-H 0.29 0.06 Treatment Effect (i.e., difference between Control and S-8) Not Peat - Ribbed Fen MS-8-R 1.34 0.10 SignificantPeat - Domed Bog MS-9(1)-D 0.68 0.05
Peat - Flat Bog MS-9(1)-F 1.50 0.29
Peat - Horizontal Fen MS-9(1)-H 0.50 <0.02
Peat - Ribbed Fen MS-9(1)-R 0.51 0.09
Peat - Domed Bog MS-9(2)-D 1.14 <0.02
Peat - Flat Bog MS-9(2)-F 1.15 0.04
Peat - Horizontal Fen MS-9(2)-H <0.10 <0.02 D. Bog 0.07 0.06 0.129 Total SS 0.010
Peat - Ribbed Fen MS-9(2)-R 0.24 <0.02 F. Bog 0.08 0.14 0.213 Treat SS 0.004
Peat - Domed Bog MS-13-D 2.41 0.11 H. Fen 0.02 0.06 0.081 Block SS 0.005
Peat - Flat Bog MS-13-F 1.56 0.12 R. Fen 0.02 0.10 0.117 Error SS 0.002
Peat - Horizontal Fen MS-13-H 0.18 <0.02 Sum c. 0.181 0.359 0.540
Peat - Ribbed Fen MS-13-R 0.11 <0.02
Peat - Domed Bog MS-15-D 0.18 <0.02
Peat - Flat Bog MS-15-F 0.48 0.03 Source V. d.f. SS MS Fcal Ftab 0.05
Peat - Horizontal Fen MS-15-H <0.10 <0.02 Total 7 0.010 -
Peat - Ribbed Fen MS-15-R <0.10 <0.02 Treatment 1 0.004 0.004 6.97 10.1
Peat - Domed Bog MS-V(1)-D 0.29 <0.02 Block 3 0.005 0.002 2.74 9.28
Peat - Ribbed Fen MS-V(1)-R Error 3 0.002 0.001
Peat - Domed Bog MS-V(2)-D 1.23 0.10
Peat - Ribbed Fen MS-V(2)-R 0.89 <0.02 Treatment Effect (i.e., difference between Control and S-8) Not SignificantPeat - Domed Bog MS-V(3)-D 1.39 <0.02
Peat - Ribbed Fen MS-V(3)-R 0.58 <0.02
Clusters used for statistical analysis
MDLs have been adjusted for all years for uniformity (0.02 ng/L for methyl mercury and 0.1 ng/L for total mercury), as per Section 1.
Blank cells indicate concentration was not determined.
MS-V(3)
MS-13
MS-15
ANOVA Table
MS-V(1)
MS-V(2)
MS-2
ANOVA Table
MS-7
MS-8
MS-9(1)
METHYL MERCURY
HabitatControlMean
(S13+S15)S-8 Sum r.
MS-9(2)
Table 46d: Muskey Monitoring Program - Statistical Analysis of Cluster Peat Horizon Mercury Pore Waters Annual Sampling Program 2015 Results - Cluster S-8
TOTAL AND METHYL MERCURY PORE WATER CONCENTRATIONS (ng/L)
TWO-WAY ANALYSIS OF VARIANCE TABLES
TOTAL MERCURY
MS-1
TC140504 Page 116

De Beers Canada Inc., Victor MineMercury Performance Monitoring, 2015 Annual Report
per Certificate of Approval #3960-7Q4K2G, Conditions 7(5) and 7(6)
Cluster Location
Substrate/Condition Well NameTotal Mercury
(Filtered)
Methyl Mercury(Filtered)
HabitatControlMean
(S13+S15)S-9(1) Sum r.
Peat - Domed Bog MS-1-D 0.82 0.05 D. Bog 1.30 0.68 1.975 Total SS 1.836
Peat - Flat Bog MS-1-F 2.04 0.04 F. Bog 1.02 1.5 2.520 Treat SS 0.049
Peat - Horizontal Fen MS-1-H 0.39 <0.02 H. Fen 0.14 0.5 0.642 Block SS 1.385
Peat - Ribbed Fen MS-1-R 1.73 0.06 R. Fen 0.11 0.51 0.615 Error SS 0.401
Peat - Domed Bog MS-2-D 1.40 0.02 Sum c. 2.5615 3.190 5.752
Peat - Flat Bog MS-2-F 5.10 0.05
Peat - Ribbed Fen MS-2-R 1.46 0.06
Peat - Domed Bog MS-7-D 0.58 <0.02 Source V. d.f. SS MS Fcal Ftab 0.05
Peat - Flat Bog MS-7-F 1.12 <0.02 Total 7 1.836 -
Peat - Horizontal Fen MS-7-H 3.23 0.09 Treatment 1 0.049 0.049 0.37 10.1
Peat - Ribbed Fen MS-7-R 0.11 <0.02 Block 3 1.385 0.462 3.45 9.28
Peat - Domed Bog MS-8-D 1.51 0.06 Error 3 0.401 0.134
Peat - Flat Bog MS-8-F 5.73 0.14
Peat - Horizontal Fen MS-8-H 0.29 0.06 Treatment Effect (i.e., difference between Control and S-9[1]) Not SignificantPeat - Ribbed Fen MS-8-R 1.34 0.10
Peat - Domed Bog MS-9(1)-D 0.68 0.05
Peat - Flat Bog MS-9(1)-F 1.50 0.29
Peat - Horizontal Fen MS-9(1)-H 0.50 <0.02
Peat - Ribbed Fen MS-9(1)-R 0.51 0.09
Peat - Domed Bog MS-9(2)-D 1.14 <0.02
Peat - Flat Bog MS-9(2)-F 1.15 0.04
Peat - Horizontal Fen MS-9(2)-H <0.10 <0.02 D. Bog 0.07 0.05 0.110 Total SS 0.056
Peat - Ribbed Fen MS-9(2)-R 0.24 <0.02 F. Bog 0.08 0.29 0.365 Treat SS 0.008
Peat - Domed Bog MS-13-D 2.41 0.11 H. Fen 0.02 0.02 0.040 Block SS 0.031
Peat - Flat Bog MS-13-F 1.56 0.12 R. Fen 0.02 0.09 0.107 Error SS 0.017
Peat - Horizontal Fen MS-13-H 0.18 <0.02 Sum c. 0.181 0.441 0.622
Peat - Ribbed Fen MS-13-R 0.11 <0.02
Peat - Domed Bog MS-15-D 0.18 <0.02
Peat - Flat Bog MS-15-F 0.48 0.03 Source V. d.f. SS MS Fcal Ftab 0.05
Peat - Horizontal Fen MS-15-H <0.10 <0.02 Total 7 0.056 -
Peat - Ribbed Fen MS-15-R <0.10 <0.02 Treatment 1 0.008 0.008 1.52 10.1
Peat - Domed Bog MS-V(1)-D 0.29 <0.02 Block 3 0.031 0.010 1.85 9.28
Peat - Ribbed Fen MS-V(1)-R Error 3 0.017 0.006
Peat - Domed Bog MS-V(2)-D 1.23 0.10
Peat - Ribbed Fen MS-V(2)-R 0.89 <0.02 Treatment Effect (i.e., difference between Control and S-9[1]) Not SignificantPeat - Domed Bog MS-V(3)-D 1.39 <0.02
Peat - Ribbed Fen MS-V(3)-R 0.58 <0.02
Clusters used for statistical analysis
MDLs have been adjusted for all years for uniformity (0.02 ng/L for methyl mercury and 0.1 ng/L for total mercury), as per Section 1.
Blank cells indicate concentration was not determined.
MS-V(3)
MS-13
MS-15
ANOVA Table
MS-V(1)
MS-V(2)
MS-2
ANOVA Table
MS-7
MS-8
MS-9(1)
METHYL MERCURY
HabitatControlMean
(S13+S15)S-9(1) Sum r.
MS-9(2)
Table 46e: Muskey Monitoring Program - Statistical Analysis of Cluster Peat Horizon Mercury Pore Waters Annual Sampling Program 2015 Results - Cluster S-9(1)
TOTAL AND METHYL MERCURY PORE WATER CONCENTRATIONS (ng/L)
TWO-WAY ANALYSIS OF VARIANCE TABLES
TOTAL MERCURY
MS-1
TC140504 Page 117

De Beers Canada Inc., Victor MineMercury Performance Monitoring, 2015 Annual Report
per Certificate of Approval #3960-7Q4K2G, Conditions 7(5) and 7(6)
Cluster Location
Substrate/Condition Well NameTotal Mercury
(Filtered)
Methyl Mercury(Filtered)
HabitatControlMean
(S13+S15)S-9(2) Sum r.
Peat - Domed Bog MS-1-D 0.82 0.05 D. Bog 1.30 1.14 2.438 Total SS 2.072
Peat - Flat Bog MS-1-F 2.04 0.04 F. Bog 1.02 1.15 2.171 Treat SS 0.001
Peat - Horizontal Fen MS-1-H 0.39 <0.02 H. Fen 0.14 0.10 0.242 Block SS 2.041
Peat - Ribbed Fen MS-1-R 1.73 0.06 R. Fen 0.11 0.24 0.347 Error SS 0.030
Peat - Domed Bog MS-2-D 1.40 0.02 Sum c. 2.5615 2.636 5.198
Peat - Flat Bog MS-2-F 5.10 0.05
Peat - Ribbed Fen MS-2-R 1.46 0.06
Peat - Domed Bog MS-7-D 0.58 <0.02 Source V. d.f. SS MS Fcal Ftab 0.05
Peat - Flat Bog MS-7-F 1.12 <0.02 Total 7 2.072 -
Peat - Horizontal Fen MS-7-H 3.23 0.09 Treatment 1 0.001 0.001 0.07 10.1
Peat - Ribbed Fen MS-7-R 0.11 <0.02 Block 3 2.041 0.680 68.76 9.28
Peat - Domed Bog MS-8-D 1.51 0.06 Error 3 0.030 0.010
Peat - Flat Bog MS-8-F 5.73 0.14
Peat - Horizontal Fen MS-8-H 0.29 0.06 Treatment Effect (i.e., difference between Control and S-9[2]) Not SignificantPeat - Ribbed Fen MS-8-R 1.34 0.10
Peat - Domed Bog MS-9(1)-D 0.68 0.05
Peat - Flat Bog MS-9(1)-F 1.50 0.29
Peat - Horizontal Fen MS-9(1)-H 0.50 <0.02
Peat - Ribbed Fen MS-9(1)-R 0.51 0.09
Peat - Domed Bog MS-9(2)-D 1.14 <0.02
Peat - Flat Bog MS-9(2)-F 1.15 0.04
Peat - Horizontal Fen MS-9(2)-H <0.10 <0.02 D. Bog 0.07 0.02 0.085 Total SS 0.004
Peat - Ribbed Fen MS-9(2)-R 0.24 <0.02 F. Bog 0.08 0.04 0.117 Treat SS 0.001
Peat - Domed Bog MS-13-D 2.41 0.11 H. Fen 0.02 0.02 0.040 Block SS 0.002
Peat - Flat Bog MS-13-F 1.56 0.12 R. Fen 0.02 0.02 0.040 Error SS 0.001
Peat - Horizontal Fen MS-13-H 0.18 <0.02 Sum c. 0.181 0.101 0.282
Peat - Ribbed Fen MS-13-R 0.11 <0.02
Peat - Domed Bog MS-15-D 0.18 <0.02
Peat - Flat Bog MS-15-F 0.48 0.03 Source V. d.f. SS MS Fcal Ftab 0.05
Peat - Horizontal Fen MS-15-H <0.10 <0.02 Total 7 0.004 -
Peat - Ribbed Fen MS-15-R <0.10 <0.02 Treatment 1 0.001 0.001 2.91 10.1
Peat - Domed Bog MS-V(1)-D 0.29 <0.02 Block 3 0.002 0.001 2.57 9.28
Peat - Ribbed Fen MS-V(1)-R Error 3 0.001 0.000
Peat - Domed Bog MS-V(2)-D 1.23 0.10
Peat - Ribbed Fen MS-V(2)-R 0.89 <0.02 Treatment Effect (i.e., difference between Control and S-9[2]) Not SignificantPeat - Domed Bog MS-V(3)-D 1.39 <0.02
Peat - Ribbed Fen MS-V(3)-R 0.58 <0.02
Clusters used for statistical analysis
MDLs have been adjusted for all years for uniformity (0.02 ng/L for methyl mercury and 0.1 ng/L for total mercury), as per Section 1.
Blank cells indicate concentration was not determined.
MS-V(3)
MS-13
MS-15
ANOVA Table
MS-V(1)
MS-V(2)
MS-2
ANOVA Table
MS-7
MS-8
MS-9(1)
METHYL MERCURY
HabitatControlMean
(S13+S15)S-9(2) Sum r.
MS-9(2)
Table 46f: Muskeg Monitoring Program - Statistical Analaysis of Cluster Peat Horizon Mercury Pore Waters Annual Sampling Program 2015 Results - Cluster S-9(2)
TOTAL AND METHYL MERCURY PORE WATER CONCENTRATIONS (ng/L)
TWO-WAY ANALYSIS OF VARIANCE TABLES
TOTAL MERCURY
MS-1
TC140504 Page 118

De Beers Canada Inc., Victor MineMercury Performance Monitoring, 2015 Annual Report
per Certificate of Approval #3960-7Q4K2G, Conditions 7(5) and 7(6)
Cluster Location
Substrate/Condition Well NameTotal Mercury
(Filtered)
Methyl Mercury(Filtered)
HabitatControlMean
(S13+S15)S-V1 S-V2 S-V3 Sum r.
Peat - Domed Bog MS-1-D 0.82 0.05 D. Bog 1.30 0.29 1.23 1.39 4.21 Total SS 2.176
Peat - Flat Bog MS-1-F 2.04 0.04 R. Fen 0.11 0.00 0.89 0.58 1.57 Treat SS 1.034
Peat - Horizontal Fen MS-1-H 0.39 <0.02 Sum c. 1.40 0.29 2.12 1.97 5.78 Block SS 0.869
Peat - Ribbed Fen MS-1-R 1.73 0.06 Error SS 0.273
Peat - Domed Bog MS-2-D 1.40 0.02
Peat - Flat Bog MS-2-F 5.10 0.05
Peat - Ribbed Fen MS-2-R 1.46 0.06
Peat - Domed Bog MS-7-D 0.58 <0.02 Source V. d.f. SS MS Fcal Ftab 0.05
Peat - Flat Bog MS-7-F 1.12 <0.02 Total 7 2.176 -
Peat - Horizontal Fen MS-7-H 3.23 0.09 Treatment 3 1.034 0.345 3.78 9.28Peat - Ribbed Fen MS-7-R 0.11 <0.02 Block 1 0.869 0.869 9.54 10.1
Peat - Domed Bog MS-8-D 1.51 0.06 Error 3 0.273 0.091
Peat - Flat Bog MS-8-F 5.73 0.14
Peat - Horizontal Fen MS-8-H 0.29 0.06 Treatment Effect (i.e., difference between Control and S-V Series) Not SignificantPeat - Ribbed Fen MS-8-R 1.34 0.10
Peat - Domed Bog MS-9(1)-D 0.68 0.05
Peat - Flat Bog MS-9(1)-F 1.50 0.29
Peat - Horizontal Fen MS-9(1)-H 0.50 <0.02
Peat - Ribbed Fen MS-9(1)-R 0.51 0.09
Peat - Domed Bog MS-9(2)-D 1.14 <0.02
Peat - Flat Bog MS-9(2)-F 1.15 0.04 D. Bog 0.07 0.02 0.10 0.02 0.21 Total SS 0.007
Peat - Horizontal Fen MS-9(2)-H <0.10 <0.02 R. Fen 0.02 0.00 0.02 0.02 0.06 Treat SS 0.003
Peat - Ribbed Fen MS-9(2)-R 0.24 <0.02 Sum c. 0.09 0.02 0.12 0.04 0.27 Block SS 0.003
Peat - Domed Bog MS-13-D 2.41 0.11 Error SS 0.002
Peat - Flat Bog MS-13-F 1.56 0.12
Peat - Horizontal Fen MS-13-H 0.18 <0.02
Peat - Ribbed Fen MS-13-R 0.11 <0.02
Peat - Domed Bog MS-15-D 0.18 <0.02
Peat - Flat Bog MS-15-F 0.48 0.03 Source V. d.f. SS MS Fcal Ftab 0.05
Peat - Horizontal Fen MS-15-H <0.10 <0.02 Total 7 0.007 -
Peat - Ribbed Fen MS-15-R <0.10 <0.02 Treatment 3 0.003 0.001 1.70 9.28Peat - Domed Bog MS-V(1)-D 0.29 <0.02 Block 1 0.003 0.003 4.42 10.1
Peat - Ribbed Fen MS-V(1)-R Error 3 0.002 0.001
Peat - Domed Bog MS-V(2)-D 1.23 0.10
Peat - Ribbed Fen MS-V(2)-R 0.89 <0.02 Treatment Effect (i.e., difference between Control and S-V Series) Not SignificantPeat - Domed Bog MS-V(3)-D 1.39 <0.02
Peat - Ribbed Fen MS-V(3)-R 0.58 <0.02
Clusters used for statistical analysis
MDLs have been adjusted for all years for uniformity (0.02 ng/L for methyl mercury and 0.1 ng/L for total mercury), as per Section 1.
Blank cells indicate concentration was not determined.
MS-V(3)
MS-9(2)
MS-13
MS-15
ANOVA Table
MS-V(1)
MS-V(2)
MS-2
ANOVA Table
MS-7
MS-8
MS-9(1)
METHYL MERCURY
HabitatControlMean
(S13+S15)S-V1 S-V2 S-V3 Sum r.
Table 46g: Muskeg Monitoring Program - Statistical Anslysis of Cluster Peat Horizon Mercury Pore Waters Annual Sampling Program 2015 Results - Cluster S-V Series
TOTAL AND METHYL MERCURY PORE WATER CONCENTRATIONS (ng/L)
TWO-WAY ANALYSIS OF VARIANCE TABLES
TOTAL MERCURY
MS-1
TC140504 Page 119

De Beers Canada Inc., Victor MineMercury Performance Monitoring, 2015 Annual Report
per Certificate of Approval #3960-7Q4K2G, Conditions 7(5) and 7(6)
DateUS
NWF(G-1)
DSNWF(G-2)
DSNEF(G-3)
Sum r.
Feb 1.55 1.35 1.40 4.30 Total SS 81.549
Mar 2.74 2.23 6.85 11.82 Treat SS 4.186
Apr 2.89 1.47 1.48 5.84 Block SS 58.057
May 3.41 2.90 3.25 9.56 Error SS 19.305
Jun 3.60 3.35 3.44 10.39
Jul 4.19 4.07 6.85 15.11
Aug 4.29 4.42 4.84 13.55 Source V. d.f. SS MS Fcal Ftab 0.05
Sept 6.94 4.55 4.65 16.14 Total 32 81.549 -
Oct 2.63 2.20 2.97 7.80 Treatment 2 4.186 2.093 2.17 3.49Nov 2.47 2.29 2.40 7.16 Block 10 58.057 5.806 6.01 2.98
Dec 1.31 1.36 1.59 4.26 Error 20 19.305 0.965
Sum c. 36.02 30.19 39.71 105.93
US NWF - Upstream Northwest Fen; DS NWF - Downstream Northwest Fen; DS NEF - Downstream Northeast Fen; US CONF - Upstream Confluence
r. - rows; c. - columns
CEQG for Protection of Aquatic Life: 26ng/L
MDLs have been adjusted for all years for uniformity (0.1 ng/L for total mercury), as per Section 1.
DateUS
NWF(G-1)
DSNWF(G-2)
DSNEF(G-3)
Sum r.
Feb 0.12 0.13 0.14 0.40 Total SS 7.796
Mar 0.10 0.14 0.09 0.33 Treat SS 1.258
Apr 0.04 0.05 0.06 0.15 Block SS 3.205
May 0.05 0.04 0.06 0.15 Error SS 3.333
Jun 0.08 0.09 0.09 0.26
Jul 0.16 0.25 2.31 2.72
Aug 0.25 0.49 1.55 2.29 Source V. d.f. SS MS Fcal Ftab 0.05
Sept 0.15 0.65 1.29 2.09 Total 32 7.796 -
Oct 0.12 0.08 0.29 0.49 Treatment 2 1.258 0.629 3.77 3.49Nov 0.07 0.09 0.13 0.30 Block 10 3.205 0.320 1.92 4.76
Dec 0.08 0.11 0.15 0.33 Error 20 3.333 0.167
Sum c. 1.21 2.13 6.16 9.50
r. - rows; c. - columns
CEQG for Protection of Aquatic Life: 4ng/L
MDLs have been adjusted for all years for uniformity (0.02 ng/L for total mercury), as per Section 1.
Table 47a: North Granny Creek - Statistical Analysis - Mercury - 2015 (Unfiltered) (concentrations in ng/L)
TOTAL MERCURY DATA AND TWO-WAY ANALYSIS OF VARIANCE TABLES
METHYL MERCURY DATA AND TWO-WAY ANALYSIS OF VARIANCE TABLES
US NWF - Upstream Northwest Fen; DS NWF - Downstream Northwest Fen; DS NEF - Downstream Northeast Fen; US CONF -
Upstream Confluence
ANOVA Table
Treatment Effect (i.e., difference between US and DS)
Significant
ANOVA Table
Treatment Effect (i.e., difference between US and DS)
Not Significant
TC140504 Page 120
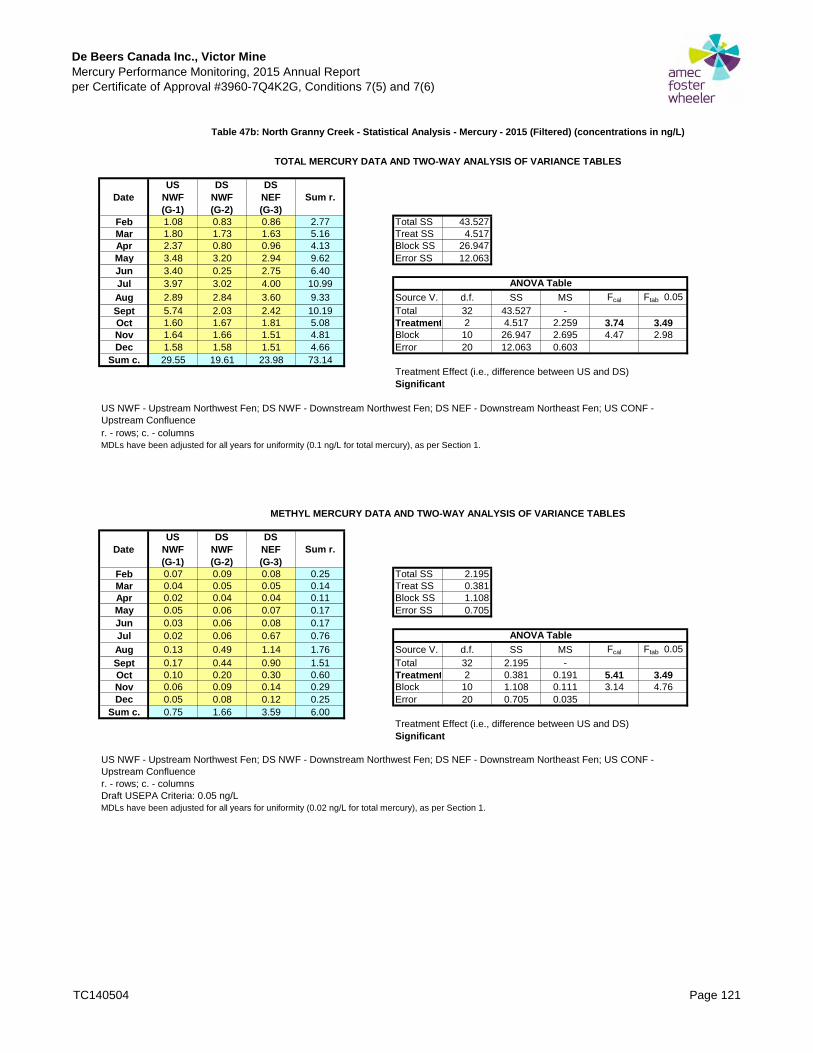
De Beers Canada Inc., Victor MineMercury Performance Monitoring, 2015 Annual Report
per Certificate of Approval #3960-7Q4K2G, Conditions 7(5) and 7(6)
DateUS
NWF(G-1)
DSNWF(G-2)
DSNEF(G-3)
Sum r.
Feb 1.08 0.83 0.86 2.77 Total SS 43.527
Mar 1.80 1.73 1.63 5.16 Treat SS 4.517
Apr 2.37 0.80 0.96 4.13 Block SS 26.947
May 3.48 3.20 2.94 9.62 Error SS 12.063
Jun 3.40 0.25 2.75 6.40
Jul 3.97 3.02 4.00 10.99
Aug 2.89 2.84 3.60 9.33 Source V. d.f. SS MS Fcal Ftab 0.05
Sept 5.74 2.03 2.42 10.19 Total 32 43.527 -
Oct 1.60 1.67 1.81 5.08 Treatment 2 4.517 2.259 3.74 3.49Nov 1.64 1.66 1.51 4.81 Block 10 26.947 2.695 4.47 2.98
Dec 1.58 1.58 1.51 4.66 Error 20 12.063 0.603
Sum c. 29.55 19.61 23.98 73.14
r. - rows; c. - columns
MDLs have been adjusted for all years for uniformity (0.1 ng/L for total mercury), as per Section 1.
DateUS
NWF(G-1)
DSNWF(G-2)
DSNEF(G-3)
Sum r.
Feb 0.07 0.09 0.08 0.25 Total SS 2.195
Mar 0.04 0.05 0.05 0.14 Treat SS 0.381
Apr 0.02 0.04 0.04 0.11 Block SS 1.108
May 0.05 0.06 0.07 0.17 Error SS 0.705
Jun 0.03 0.06 0.08 0.17
Jul 0.02 0.06 0.67 0.76
Aug 0.13 0.49 1.14 1.76 Source V. d.f. SS MS Fcal Ftab 0.05
Sept 0.17 0.44 0.90 1.51 Total 32 2.195 -
Oct 0.10 0.20 0.30 0.60 Treatment 2 0.381 0.191 5.41 3.49Nov 0.06 0.09 0.14 0.29 Block 10 1.108 0.111 3.14 4.76
Dec 0.05 0.08 0.12 0.25 Error 20 0.705 0.035
Sum c. 0.75 1.66 3.59 6.00
r. - rows; c. - columns
Draft USEPA Criteria: 0.05 ng/L
MDLs have been adjusted for all years for uniformity (0.02 ng/L for total mercury), as per Section 1.
Table 47b: North Granny Creek - Statistical Analysis - Mercury - 2015 (Filtered) (concentrations in ng/L)
TOTAL MERCURY DATA AND TWO-WAY ANALYSIS OF VARIANCE TABLES
METHYL MERCURY DATA AND TWO-WAY ANALYSIS OF VARIANCE TABLES
US NWF - Upstream Northwest Fen; DS NWF - Downstream Northwest Fen; DS NEF - Downstream Northeast Fen; US CONF -
Upstream Confluence
US NWF - Upstream Northwest Fen; DS NWF - Downstream Northwest Fen; DS NEF - Downstream Northeast Fen; US CONF -
Upstream Confluence
Treatment Effect (i.e., difference between US and DS)
Significant
ANOVA Table
Treatment Effect (i.e., difference between US and DS)
Significant
ANOVA Table
TC140504 Page 121
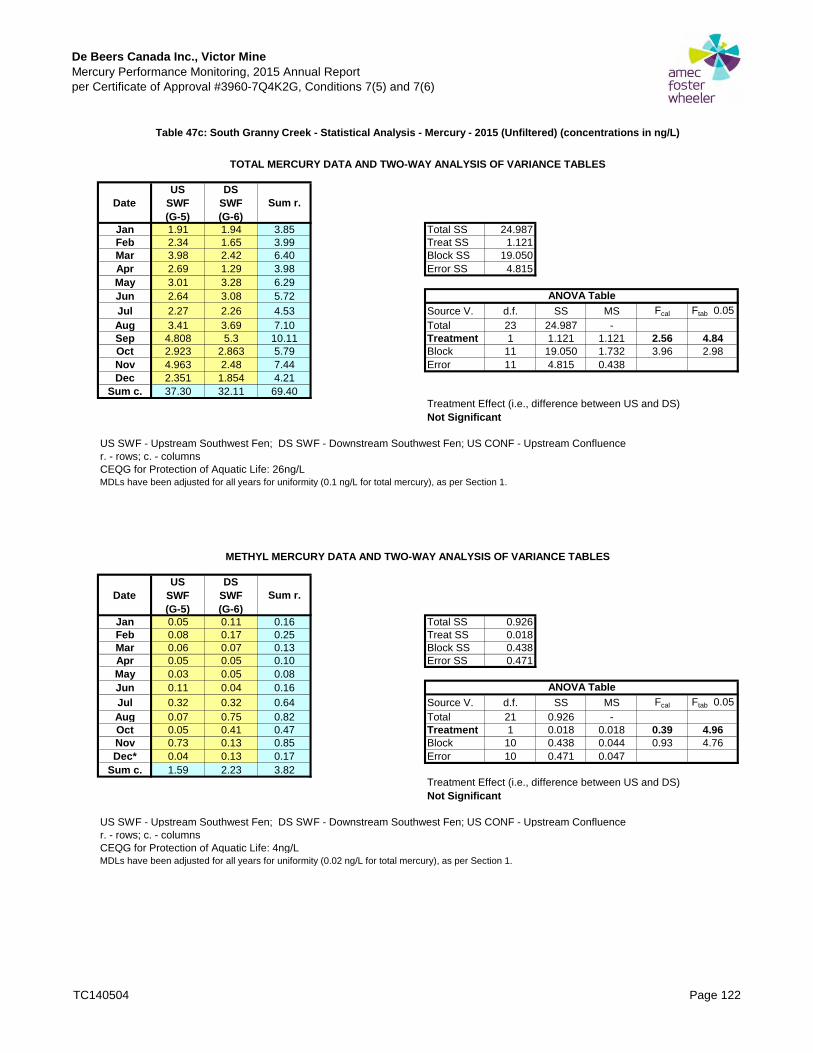
De Beers Canada Inc., Victor MineMercury Performance Monitoring, 2015 Annual Report
per Certificate of Approval #3960-7Q4K2G, Conditions 7(5) and 7(6)
DateUS
SWF(G-5)
DSSWF(G-6)
Sum r.
Jan 1.91 1.94 3.85 Total SS 24.987
Feb 2.34 1.65 3.99 Treat SS 1.121
Mar 3.98 2.42 6.40 Block SS 19.050
Apr 2.69 1.29 3.98 Error SS 4.815
May 3.01 3.28 6.29
Jun 2.64 3.08 5.72
Jul 2.27 2.26 4.53 Source V. d.f. SS MS Fcal Ftab 0.05
Aug 3.41 3.69 7.10 Total 23 24.987 -
Sep 4.808 5.3 10.11 Treatment 1 1.121 1.121 2.56 4.84Oct 2.923 2.863 5.79 Block 11 19.050 1.732 3.96 2.98
Nov 4.963 2.48 7.44 Error 11 4.815 0.438
Dec 2.351 1.854 4.21
Sum c. 37.30 32.11 69.40
US SWF - Upstream Southwest Fen; DS SWF - Downstream Southwest Fen; US CONF - Upstream Confluence
r. - rows; c. - columns
CEQG for Protection of Aquatic Life: 26ng/L
MDLs have been adjusted for all years for uniformity (0.1 ng/L for total mercury), as per Section 1.
DateUS
SWF(G-5)
DSSWF(G-6)
Sum r.
Jan 0.05 0.11 0.16 Total SS 0.926
Feb 0.08 0.17 0.25 Treat SS 0.018
Mar 0.06 0.07 0.13 Block SS 0.438
Apr 0.05 0.05 0.10 Error SS 0.471
May 0.03 0.05 0.08
Jun 0.11 0.04 0.16
Jul 0.32 0.32 0.64 Source V. d.f. SS MS Fcal Ftab 0.05
Aug 0.07 0.75 0.82 Total 21 0.926 -
Oct 0.05 0.41 0.47 Treatment 1 0.018 0.018 0.39 4.96Nov 0.73 0.13 0.85 Block 10 0.438 0.044 0.93 4.76
Dec* 0.04 0.13 0.17 Error 10 0.471 0.047
Sum c. 1.59 2.23 3.82
US SWF - Upstream Southwest Fen; DS SWF - Downstream Southwest Fen; US CONF - Upstream Confluence
r. - rows; c. - columns
CEQG for Protection of Aquatic Life: 4ng/L
MDLs have been adjusted for all years for uniformity (0.02 ng/L for total mercury), as per Section 1.
Table 47c: South Granny Creek - Statistical Analysis - Mercury - 2015 (Unfiltered) (concentrations in ng/L)
ANOVA Table
Treatment Effect (i.e., difference between US and DS)
Not Significant
METHYL MERCURY DATA AND TWO-WAY ANALYSIS OF VARIANCE TABLES
TOTAL MERCURY DATA AND TWO-WAY ANALYSIS OF VARIANCE TABLES
ANOVA Table
Treatment Effect (i.e., difference between US and DS)
Not Significant
TC140504 Page 122
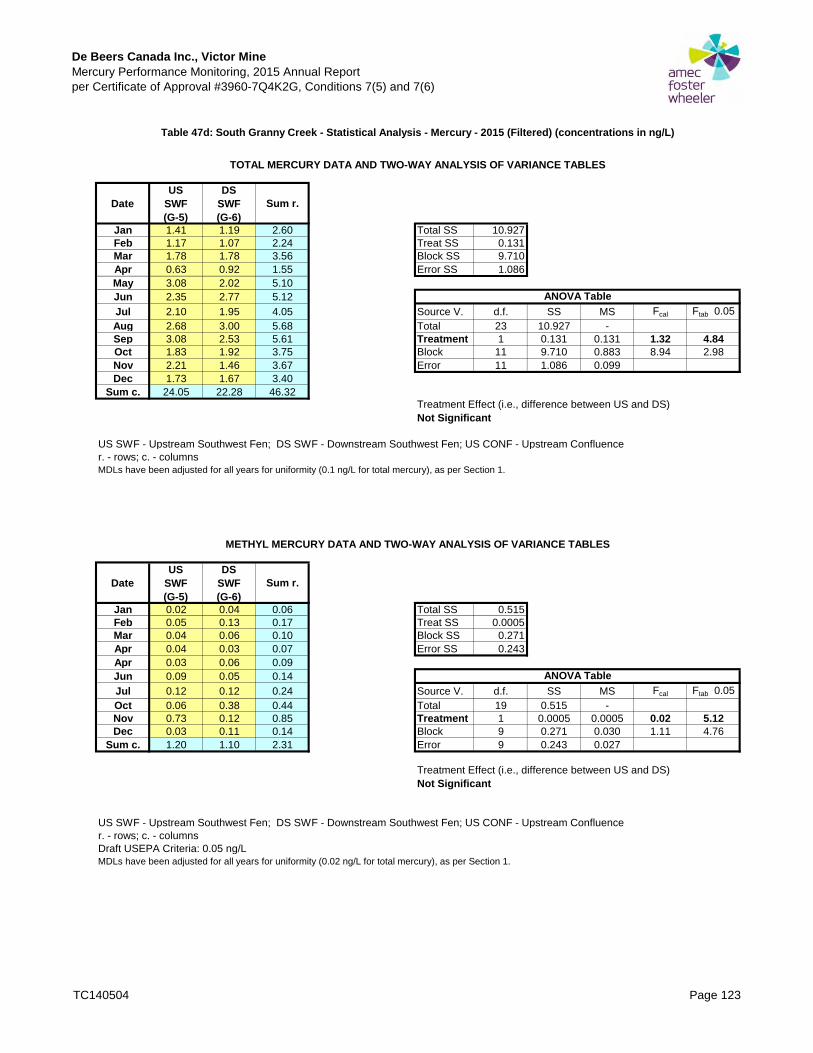
De Beers Canada Inc., Victor MineMercury Performance Monitoring, 2015 Annual Report
per Certificate of Approval #3960-7Q4K2G, Conditions 7(5) and 7(6)
DateUS
SWF(G-5)
DSSWF(G-6)
Sum r.
Jan 1.41 1.19 2.60 Total SS 10.927
Feb 1.17 1.07 2.24 Treat SS 0.131
Mar 1.78 1.78 3.56 Block SS 9.710
Apr 0.63 0.92 1.55 Error SS 1.086
May 3.08 2.02 5.10
Jun 2.35 2.77 5.12
Jul 2.10 1.95 4.05 Source V. d.f. SS MS Fcal Ftab 0.05
Aug 2.68 3.00 5.68 Total 23 10.927 -
Sep 3.08 2.53 5.61 Treatment 1 0.131 0.131 1.32 4.84Oct 1.83 1.92 3.75 Block 11 9.710 0.883 8.94 2.98
Nov 2.21 1.46 3.67 Error 11 1.086 0.099
Dec 1.73 1.67 3.40
Sum c. 24.05 22.28 46.32
US SWF - Upstream Southwest Fen; DS SWF - Downstream Southwest Fen; US CONF - Upstream Confluence
r. - rows; c. - columns
MDLs have been adjusted for all years for uniformity (0.1 ng/L for total mercury), as per Section 1.
DateUS
SWF(G-5)
DSSWF(G-6)
Sum r.
Jan 0.02 0.04 0.06 Total SS 0.515
Feb 0.05 0.13 0.17 Treat SS 0.0005
Mar 0.04 0.06 0.10 Block SS 0.271
Apr 0.04 0.03 0.07 Error SS 0.243
Apr 0.03 0.06 0.09
Jun 0.09 0.05 0.14
Jul 0.12 0.12 0.24 Source V. d.f. SS MS Fcal Ftab 0.05
Oct 0.06 0.38 0.44 Total 19 0.515 -
Nov 0.73 0.12 0.85 Treatment 1 0.0005 0.0005 0.02 5.12Dec 0.03 0.11 0.14 Block 9 0.271 0.030 1.11 4.76
Sum c. 1.20 1.10 2.31 Error 9 0.243 0.027
US SWF - Upstream Southwest Fen; DS SWF - Downstream Southwest Fen; US CONF - Upstream Confluence
r. - rows; c. - columns
Draft USEPA Criteria: 0.05 ng/L
MDLs have been adjusted for all years for uniformity (0.02 ng/L for total mercury), as per Section 1.
Table 47d: South Granny Creek - Statistical Analysis - Mercury - 2015 (Filtered) (concentrations in ng/L)
Treatment Effect (i.e., difference between US and DS)
Not Significant
TOTAL MERCURY DATA AND TWO-WAY ANALYSIS OF VARIANCE TABLES
ANOVA Table
Treatment Effect (i.e., difference between US and DS)
Not Significant
METHYL MERCURY DATA AND TWO-WAY ANALYSIS OF VARIANCE TABLES
ANOVA Table
TC140504 Page 123

De Beers Canada Inc., Victor MineMercury Performance Monitoring, 2015 Annual Report
per Certificate of Approval #3960-7Q4K2G, Conditions 7(5) and 7(6)
HabitatNaysh R.
US(N-1)
Naysh R.M
(N-2)
Naysh R.DS
(N-3)Sum r.
Feb 1.03 7.05 4.78 12.86 Total SS 38.220
Apr / May 2.24 0.66 0.68 3.58 Treat SS 2.247
Jul 1.66 1.79 1.90 5.35 Block SS 17.880
Oct 1.61 1.23 1.82 4.66 Error SS 18.092
Sum c. 6.54 10.73 9.18 26.45
US - Upstream; M - Middle; DS - Downstream Source V. d.f. SS MS Fcal Ftab 0.05
r. - rows; c. - columns Total 11 38.220 -
CEQG for Protection of Aquatic Life: 26 ng/L Treatment 2 2.247 1.124 0.37 5.14Block 3 17.880 5.960 1.98 4.76
Error 6 18.092 3.015
HabitatNaysh R.
US(N-1)
Naysh R.M
(N-2)
Naysh R.DS
(N-3)Sum r.
Feb 0.07 0.14 0.19 0.39 Total SS 0.028
Apr / May 0.04 0.03 0.03 0.09 Treat SS 0.003
Jul 0.07 0.07 0.08 0.22 Block SS 0.019
Oct 0.03 0.03 0.06 0.12 Error SS 0.006
Sum c. 0.20 0.26 0.36 0.82
US - Upstream; M - Middle; DS - Downstream Source V. d.f. SS MS Fcal Ftab 0.05
r. - rows; c. - columns Total 11 0.028 -
CEQG for Protection of Aquatic Life: 4ng/L Treatment 2 0.003 0.002 1.82 5.14Block 3 0.019 0.006 6.82 4.76
Error 6 0.006 0.001
Treatment Effect (i.e., difference between US and DS)
Not Significant
Table 47e: Nayshkootayaow River - Statistical Analysis - Mercury - 2015 (Unfiltered) (concentrations in ng/L)
TOTAL MERCURY DATA AND TWO-WAY ANALYSIS OF VARIANCE TABLES
ANOVA Table
Treatment Effect (i.e., difference between US and DS)
Not Significant
METHYL MERCURY DATA AND TWO-WAY ANALYSIS OF VARIANCE TABLES
ANOVA Table
MDLs have been adjusted for all years for uniformity (0.1 ng/L for total
mercury), as per Section 1.
MDLs have been adjusted for all years for uniformity (0.02 ng/L for
total mercury), as per Section 1.
TC140504 Page 124

De Beers Canada Inc., Victor MineMercury Performance Monitoring, 2015 Annual Report
per Certificate of Approval #3960-7Q4K2G, Conditions 7(5) and 7(6)
HabitatNaysh R.
US(N-1)
Naysh R.M
(N-2)
Naysh R.DS
(N-3)Sum r.
Feb 0.59 0.66 0.49 1.74 Total SS 2.633
Apr / May 1.73 0.46 0.44 2.63 Treat SS 0.225
Jul 1.49 1.52 1.57 4.58 Block SS 1.517
Oct 1.16 1.27 1.22 3.65 Error SS 0.892
Sum c. 4.97 3.91 3.72 12.60
US - Upstream; M - Middle; DS - Downstream Source V. d.f. SS MS Fcal Ftab 0.05
r. - rows; c. - columns Total 11 2.633 -
Treatment 2 0.225 0.112 0.76 5.14Block 3 1.517 0.506 3.40 4.76
Error 6 0.892 0.149
HabitatNaysh R.
US(N-1)
Naysh R.M
(N-2)
Naysh R.DS
(N-3)Sum r.
Feb 0.04 0.04 0.03 0.11 Total SS 0.001
Apr / May 0.02 0.02 0.03 0.07 Treat SS 0.0002
Jul 0.02 0.03 0.05 0.10 Block SS 0.001
Oct 0.04 0.04 0.05 0.12 Error SS 0.001
Sum c. 0.13 0.12 0.16 0.40
US - Upstream; M - Middle; DS - Downstream Source V. d.f. SS MS Fcal Ftab 0.05
r. - rows; c. - columns Total 11 0.001 -
Draft USEPA Criteria: 0.05 ng/L Treatment 2 0.000 0.000 1.27 5.14Block 3 0.001 0.000 2.00 4.76
Error 6 0.001 0.000
Treatment Effect (i.e., difference between US and DS)
Not Significant
ANOVA Table
ANOVA Table
Table 47f: Nayshkootayaow River - Statistical Analysis - Mercury - 2015 (Filtered) (concentrations in ng/L)
TOTAL MERCURY DATA AND TWO-WAY ANALYSIS OF VARIANCE TABLES
METHYL MERCURY DATA AND TWO-WAY ANALYSIS OF VARIANCE TABLES
Treatment Effect (i.e., difference between US and DS)
Not Significant
MDLs have been adjusted for all years for uniformity (0.1 ng/L for total
mercury), as per Section 1.
MDLs have been adjusted for all years for uniformity (0.02 ng/L for
total mercury), as per Section 1.
TC140504 Page 125

De Beers Canada Inc., Victor MineMercury Performance Monitoring, 2015 Annual Report
per Certificate of Approval #3960-7Q4K2G, Conditions 7(5) and 7(6)
HabitatAtt R.(A-1)
Att R.(A-2)
Att R.(A-3)
Att R.(A-4)
Sum r.
Feb 1.37 1.42 1.36 1.16 5.31 Total SS 1.199
Apr 1.16 1.54 1.88 1.28 5.86 Treat SS 0.154
Jul 1.50 1.76 1.60 1.53 6.39 Block SS 0.731
Oct 2.00 2.07 1.70 1.84 7.62 Error SS 0.314
Sum c. 6.03 6.79 6.54 5.81 25.18
Source V. d.f. SS MS Fcal Ftab 0.05
Total 15 1.199 -
Treatment 3 0.154 0.051 1.47 3.86Block 3 0.731 0.244 6.98 3.86
Error 9 0.314 0.035
r. - rows; c. - columns
CEQG for Protection of Aquatic Life: 26ng/L
HabitatAtt R.(A-1)
Att R.(A-2)
Att R.(A-3)
Att R.(A-4)
Sum r.
Feb 0.05 0.04 0.08 0.05 0.23 Total SS 0.027
Apr 0.03 0.04 0.03 0.03 0.12 Treat SS 0.005
Jul 0.07 0.06 0.06 0.07 0.27 Block SS 0.004
Oct 0.03 0.20 0.03 0.03 0.30 Error SS 0.018
Sum c. 0.18 0.35 0.21 0.19 0.92
Source V. d.f. SS MS Fcal Ftab 0.05
Total 15 0.027 -
Treatment 3 0.005 0.002 0.75 3.86Block 3 0.004 0.001 0.73 3.86
Error 9 0.018 0.002
r. - rows; c. - columns
CEQG for Protection of Aquatic Life: 4ng/L
Table 47g: Attawapiskat River - Statistical Analysis - Mercury - 2015 (Unfiltered) (concentrations in ng/L)
TOTAL MERCURY DATA AND TWO-WAY ANALYSIS OF VARIANCE TABLES
ANOVA Table
Treatment Effect (i.e., difference between US and DS)
Not Significant
METHYL MERCURY DATA AND TWO-WAY ANALYSIS OF VARIANCE TABLES
MDLs have been adjusted for all years for uniformity (0.1 ng/L for total mercury), as
per Section 1.
ANOVA Table
MDLs have been adjusted for all years for uniformity (0.02 ng/L for total mercury), as
per Section 1.
Treatment Effect (i.e., difference between US and DS)
Significant
TC140504 Page 126

De Beers Canada Inc., Victor MineMercury Performance Monitoring, 2015 Annual Report
per Certificate of Approval #3960-7Q4K2G, Conditions 7(5) and 7(6)
HabitatAtt R.(A-1)
Att R.(A-2)
Att R.(A-3)
Att R.(A-4)
Sum r.
Feb 1.04 0.91 1.39 0.94 4.28 Total SS 1.396
Apr 0.90 1.00 1.06 0.92 3.88 Treat SS 0.025
Jul 1.79 1.66 1.60 1.65 6.70 Block SS 1.178
Oct 1.22 1.31 1.24 1.46 5.23 Error SS 0.192
Sum c. 4.95 4.88 5.29 4.97 20.09
Source V. d.f. SS MS Fcal Ftab 0.05
Total 15 1.396 -
Treatment 3 0.025 0.008 0.39 3.86Block 3 1.178 0.393 18.37 3.86
Error 9 0.192 0.021
r. - rows; c. - columns
CEQG for Protection of Aquatic Life: 26ng/L
HabitatAtt R.(A-1)
Att R.(A-2)
Att R.(A-3)
Att R.(A-4)
Sum r.
Feb 0.05 0.03 0.03 0.05 0.16 Total SS 0.003
Apr 0.04 0.02 0.03 0.02 0.11 Treat SS 0.001
Jul 0.06 0.02 0.02 0.02 0.12 Block SS 0.000
Oct 0.03 0.06 0.03 0.02 0.15 Error SS 0.002
Sum c. 0.19 0.13 0.11 0.11 0.54
Source V. d.f. SS MS Fcal Ftab 0.05
Total 15 0.003 -
Treatment 3 0.001 0.000 1.46 3.86Block 3 0.000 0.000 0.65 3.86
Error 9 0.002 0.000
r. - rows; c. - columns
CEQG for Protection of Aquatic Life: 4ng/L
Treatment Effect (i.e., difference between US and DS)
Significant
MDLs have been adjusted for all years for uniformity (0.02 ng/L for total mercury), as
per Section 1.
Table 47h: Attawapiskat River - Statistical Analysis - Mercury - 2015 (Filtered) (concentrations in ng/L)
TOTAL MERCURY DATA AND TWO-WAY ANALYSIS OF VARIANCE TABLES
ANOVA Table
Treatment Effect (i.e., difference between US and DS)
Not SignificantMDLs have been adjusted for all years for uniformity (0.1 ng/L for total mercury), as
per Section 1.
METHYL MERCURY DATA AND TWO-WAY ANALYSIS OF VARIANCE TABLES
ANOVA Table
TC140504 Page 127
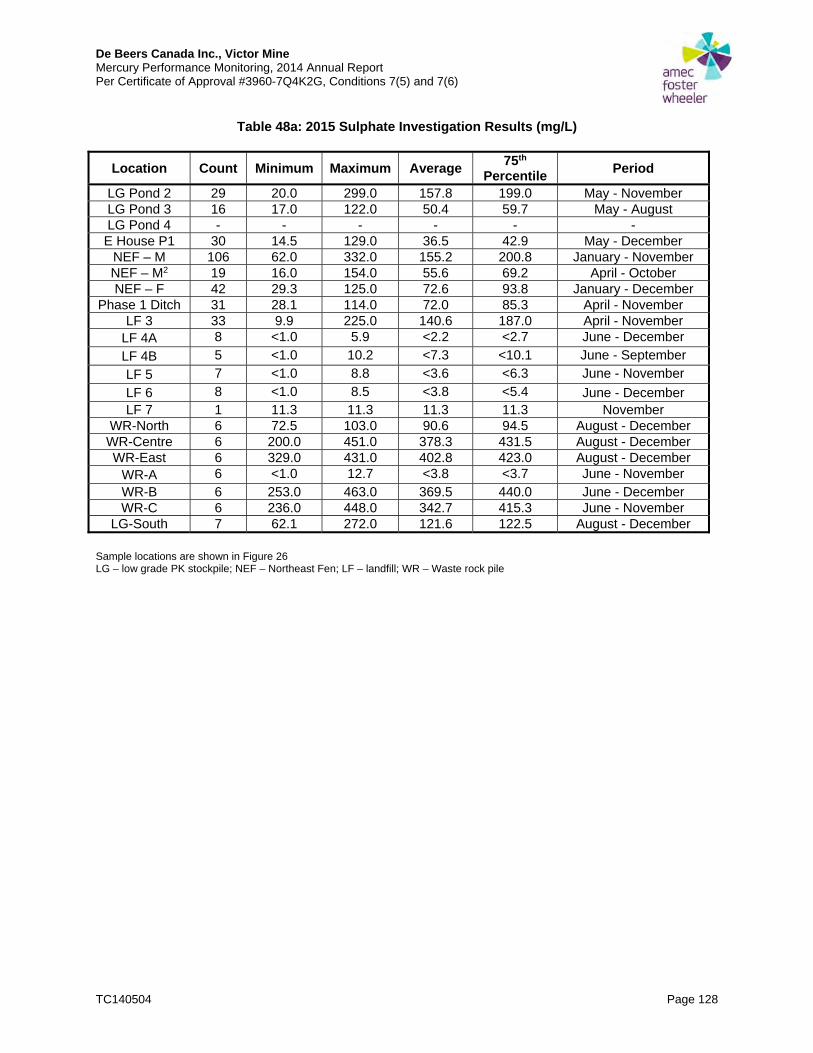
De Beers Canada Inc., Victor Mine Mercury Performance Monitoring, 2014 Annual Report Per Certificate of Approval #3960-7Q4K2G, Conditions 7(5) and 7(6)
TC140504 Page 128
Table 48a: 2015 Sulphate Investigation Results (mg/L)
Location Count Minimum Maximum Average 75th
Percentile Period
LG Pond 2 29 20.0 299.0 157.8 199.0 May - November
LG Pond 3 16 17.0 122.0 50.4 59.7 May - August
LG Pond 4 - - - - - -
E House P1 30 14.5 129.0 36.5 42.9 May - December
NEF – M 106 62.0 332.0 155.2 200.8 January - November
NEF – M2 19 16.0 154.0 55.6 69.2 April - October
NEF – F 42 29.3 125.0 72.6 93.8 January - December
Phase 1 Ditch 31 28.1 114.0 72.0 85.3 April - November
LF 3 33 9.9 225.0 140.6 187.0 April - November
LF 4A 8 <1.0 5.9 <2.2 <2.7 June - December
LF 4B 5 <1.0 10.2 <7.3 <10.1 June - September
LF 5 7 <1.0 8.8 <3.6 <6.3 June - November
LF 6 8 <1.0 8.5 <3.8 <5.4 June - December
LF 7 1 11.3 11.3 11.3 11.3 November
WR-North 6 72.5 103.0 90.6 94.5 August - December
WR-Centre 6 200.0 451.0 378.3 431.5 August - December
WR-East 6 329.0 431.0 402.8 423.0 August - December
WR-A 6 <1.0 12.7 <3.8 <3.7 June - November
WR-B 6 253.0 463.0 369.5 440.0 June - December
WR-C 6 236.0 448.0 342.7 415.3 June - November
LG-South 7 62.1 272.0 121.6 122.5 August - December
Sample locations are shown in Figure 26 LG – low grade PK stockpile; NEF – Northeast Fen; LF – landfill; WR – Waste rock pile

De Beers Canada Inc., Victor Mine Mercury Performance Monitoring, 2014 Annual Report Per Certificate of Approval #3960-7Q4K2G, Conditions 7(5) and 7(6)
TC140504 Page 129
Table 48b: 2014 Sulphate Investigation Results (mg/L)
Location Count Minimum Maximum Average 75th
Percentile Period
LG Pond 1 7 68.4 192.0 150.9 181.0 August - October
LG Pond 2 9 5.1 24.8 13.1 15.5 August - October
LG Pond 3 9 2.2 17.0 10.1 13.3 August - October
LG Pond 4 9 15.2 35.2 23.8 25.8 August - October
E House P1 21 18.2 116.0 54.7 76.8 July - November
NEF – M 112 37.2 287.0 120.0 146.0 January - December
NEF – M2 23 4.2 113.0 44.9 68.1 May - October
NEF – F 43 12.6 101.0 60.2 79.2 January - December
Phase 1 Ditch 28 2.2 109.0 70.8 81.9 April - November
LF 3 29 3.0 223.0 151.7 190.0 May - November
LF 4A 6 1.3 2.9 1.7 155.0 July - October
LF 4B 7 13.4 61.4 31.8 47.0 June - October
LF 5 7 <1.0 3.1 <1.5 <1.7 June - November
LF 6 7 <1.0 29.3 <14.4 <23.3 June - November
Sample locations are shown in Figure 26 LG – low grade PK stockpile; NEF – Northeast Fen; LF – landfill

De Beers Canada Inc., Victor Mine Mercury Performance Monitoring, 2014 Annual Report Per Certificate of Approval #3960-7Q4K2G, Conditions 7(5) and 7(6)
TC140504 Page 130
Table 48c: 2013 Sulphate Investigation Results (mg/L)
Location Count Minimum Maximum Average 75th
Percentile Period
NEF – M 80 <1.0 280.0 <177.2 <203.3 January - December
NEF – M2 2 30.5 41.2 35.9 38.5 July - October
NEF – F 44 40.4 129.0 74.5 81.2 January - December
Phase 1 Ditch 27 24.2 102 73.6 83.85 April - October
LF 3 33 9.1 411.0 168.5 211.0 April - November
LF 4A 8 <1.0 51.3 <7.9 <3.1 June - November
LF 4B 8 <1.0 59.5 <23.9 <37.2 June - November
LF 5 8 <1.0 5.4 <3.2 <3.6 May - November
LF 6 8 5.2 22.7 10.2 12.0 May - November
Sample locations are shown in Figure 26 NEF – Northeast Fen; LF – landfill

De Beers Canada Inc., Victor Mine Mercury Performance Monitoring, 2014 Annual Report Per Certificate of Approval #3960-7Q4K2G, Conditions 7(5) and 7(6)
TC140504 Page 131
Table 48d: 2012 Sulphate Investigation Results (mg/L)
Location Count Minimum Maximum Average 75th
Percentile Period
NEF – M 3 38.8 172.0 115.3 153.5 April - October
NEF – M2 2 65.7 110.0 87.9 98.9 July - October
NEF – F 48 1.4 643.0 97.5 113.8 January - December
Phase 1 Ditch 35 3.7 142.0 80.6 102.0 March - November
LF 2 1 11.3 11.3 11.3 11.3 June
LF 3 34 17.1 472.0 137.8 150.0 March - December
LF 4A 7 1.0 2.7 1.7 2.3 June - November
LF 4B 7 <1.00 6.40 <2.49 <3.5 June - November
LF 5 7 <1.0 6.0 <2.3 <3.2 June - November
LF 6 8 4.0 43.0 17.5 21.3 July - November
Sample locations are shown in Figure 26 NEF – Northeast Fen; LF – landfill

De Beers Canada Inc., Victor Mine Mercury Performance Monitoring, 2014 Annual Report Per Certificate of Approval #3960-7Q4K2G, Conditions 7(5) and 7(6)
TC140504 Page 132
Table 48e: 2011 Sulphate Investigation Results (mg/L)
Location Count Minimum Maximum Average75th
Percentile Period
NEF – M 2 120.0 253.0 186.5 219.8 July - October
NEF – M2 2 4.4 113.0 58.7 85.9 July - October
NEF – F 45 1.9 166.0 59.7 108.0 January - December
Phase 1 Ditch 30 20.9 126.0 70.0 92.3 April - November
LF 2 9 <1.0 59.6 <16.5 <20.4 May - December
LF 3 4 77.5 248.0 141.6 156.5 May - September
LF 4A 9 <1.0 6.0 <2.1 <2.1 May - December
LF 4B 9 <1.0 3.9 <1.9 <3.2 May - December
LF 5 2 <1.0 5.2 <3.1 <4.2 November - December
Sample locations are shown in Figure 26 NEF – Northeast Fen; LF – landfill

De Beers Canada Inc., Victor Mine Mercury Performance Monitoring, 2014 Annual Report Per Certificate of Approval #3960-7Q4K2G, Conditions 7(5) and 7(6)
TC140504 Page 133
Table 48f: 2010 Sulphate Investigation Results (mg/L)
Location Count Minimum Maximum Average 75th
Percentile Period
NEF – M 3 7.8 36.4 23.3 31.1 April - October
NEF – M2 3 5.3 40.6 17.5 23.6 April - October
NEF – F 44 2.8 65.2 30.6 47.5 January - December
Phase 1 Ditch 31 1.2 84.0 39.4 54.6 April - November
LF 2 2 <1.0 <1.0 <1.0 <1.0 August - October
LF 3 2 143.0 144.0 143.5 143.8 August - October
LF 4A 2 3.5 10.3 6.9 8.6 August - October
LF 4B 2 <1.0 <1.0 <1.0 <1.0 August - October
Sample locations are shown in Figure 26 NEF – Northeast Fen; LF – landfill

Open Pit
Cluster MS-13
Cluster MS-15
Cluster MS-9-1Cluster MS-9-2
Cluster MS-2
Cluster MS-8-2
Cluster MS-8-1
Cluster MS-7 Cluster MS-1
MS-2F
MS-2D
MS-1HMS-1R
MS-1FMS-1DMS-7D
MS-7F
MS-7R
MS-7H
MS-2-RMS-8-H
MS-8-R
MS-8-F
MS-8-D
MS-15F
MS-15RMS-15H
MS-15D
MS-13D
MS-13H
MS-13F
MS-13R
MS-1-BR
MS-9-2HMS-9-2R
MS-9-2F
MS-9-2D
MS-7 BR
MS-9-1D
MS-9-1FMS-9-1R
MS-9-1HMS-15CL
MS-13CL
MS-V-3-RMS-V-3-D
MS-V-1-D
MS-V-2-DMS-V-2-R
MS-15 BR
MS-13 BR
MS-V-3-CL
MS-V-2-CL
MS-V-1-CL
MS-8-2 BR
MS-8-1 BR
MS-9(2)-BRMS-9(1)-BR
MS-2-CL & WBR
MS-1-CL & WBR
MS-7-CL & WBR
MS-8-4 CL & WBRMS-8-1 CL & WBR
MS-8-3 CL & WBR
MS-8-2 CL & WBR
MS-9-2-CL & WBR
DAS-1 (MS-2 BR)
MS-9-1-CL & WBR
275000 280000 285000 290000 295000 300000 305000 310000 315000 320000
5845
000
5850
000
5855
000
5860
000
5865
000
²0 6.5 13 19.5 26 32.53.25
Kilometres
LEGEND
Datum: NAD83
Projection: UTM Zone 17N
NOTES:- Mine site features current as of September 2015 (Pleides satellite platform)- Area surrounding mine site features current as of September 20, 2012 (GeoEye-1 satellite platform) VICTOR DIAMOND MINE
FIGURE: 1DATE: July 2016
PROJECT No: TC140504
SCALE: 1:115,000
Muskeg Monitoring StationsBedrock Monitoring WellClay/Peat/Bedrock PiezometerClay/Peat Piezometer
Muskeg Monitoring Locations
P:\
20
14\P
roje
cts
\TC
14
05
04
_D
e_
Bee
rs_
Vic
tor_
Min
e_
20
14
\09
_G
IS\H
g_R
epo
rt_2
01
5\M
XD
\Muske
g O
ve
rvie
w_M
uskeg
Mo
nitori
ngS
tation
s_
1.m
xd
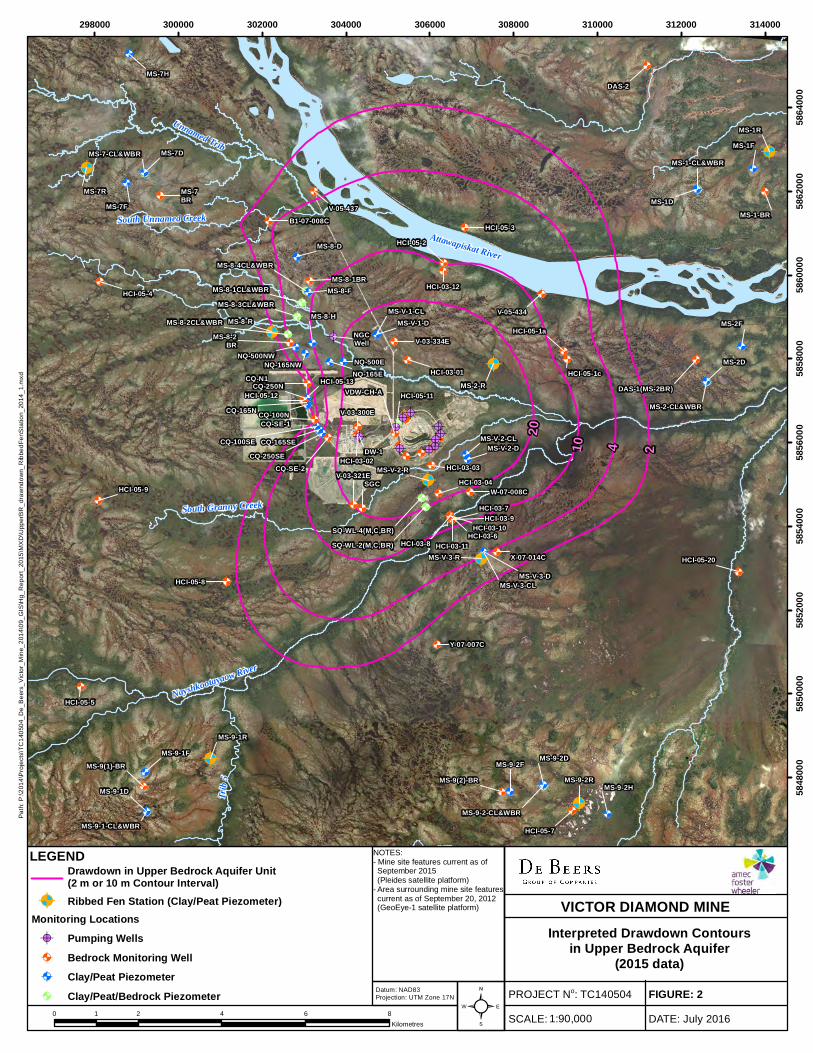
@A
@A
@A
@A
@A@A
@A
@A@A @A
@A
@A
@A
@A
@A
@A
@A
@
@
@
@
@
@
@
@
@
@@@@
@@
A
A
A
A
A
A
A
A
A
AAAA
AA
@
@
@
@
@@
@
@@
@
@
@@
@
@
@
@@@
@ @
@@@
@@@
@
@
@
@
@
@
A
A
A
A
AA
A
AA
A
A
AA
A
A
A
AAA
AA
AAA
AAA
A
A
A
A
A
A
@
@
@
@
@
@
@
@
@
@
@
@
@
@
@
@@
@
@
@@@@
@@
@@
@
@
@@@@@@
@
@@
A
A
A
A
A
A
A
A
A
A
A
A
A
A
A
AA
A
A
AAAA
AA
AA
A
A
AAAAAA
A
AA
!
!
!
!
!
!
!!
! !
!
A
A
AA
AA
AA
A A
A
@A
@A@A
@A
@A
@A
@A
@A
South Unnamed CreekTr
ib 5
Nayshkootayaow River
Attawapiskat River
South Granny Creek
Unnamed Trib
MS-9-1-CL&WBR
HCI-05-5
HCI-05-8
MS-9-1F
MS-9-1D
HCI-05-9
MS-7-CL&WBR
MS-7BR
HCI-05-4
MS-7H
MS-7F
MS-7D
HCI-05-3
DAS-2
MS-1-CL&WBR
MS-1D
MS-1F
DAS-1(MS-2BR)
MS-2-CL&WBR
MS-2D
MS-2F
HCI-05-20
HCI-05-7
MS-9-2-CL&WBR
MS-9-2DMS-9-2F
MS-9-2H
MS-8-D
MS-8-F
NQ-500NWNQ-165NW
MS-8-H
NQ-165ENQ-500E
MS-8-1BR
MS-8-2BR
MS-8-2CL&WBR
MS-8-3CL&WBRMS-8-1CL&WBR
MS-8-4CL&WBR
CQ-N1
CQ-SE-1
CQ-SE-2
HCI-05-13HCI-05-12
CQ-250N
CQ-165N CQ-100N
CQ-100SE CQ-165SECQ-250SE DW-1
HCI-03-02
V-05-437
V-03-300E
HCI-03-01
HCI-05-11
V-03-334E
HCI-05-2
HCI-03-12
HCI-05-1a
HCI-05-1c
V-05-434
V-03-321ESGC
HCI-03-03HCI-03-04
HCI-03-6HCI-03-8
HCI-03-10SQ-WL-4(M,C,BR)SQ-WL-2(M,C,BR) HCI-03-11
HCI-03-7HCI-03-9
MS-1-BR
MS-9(1)-BRMS-9(2)-BR
NGCWell
MS-V-1-CL
MS-V-2-CL
MS-V-3-CL
MS-V-2-D
MS-V-1-D
MS-V-3-D
VDW-CH-A
W-07-008C
B1-07-008C
X-07-014C
Y-07-007C
20
10 4 2
MS-9-1R
MS-7R
MS-1R
MS-9-2R
MS-8-R
MS-2-R
MS-V-2-R
MS-V-3-R
298000 300000 302000 304000 306000 308000 310000 312000 314000
5848
000
5850
000
5852
000
5854
000
5856
000
5858
000
5860
000
5862
000
5864
000
²0 2 4 6 81
Kilometres
LEGEND
Datum: NAD83
Projection: UTM Zone 17N
Pa
th:
P:\2
01
4\P
roje
cts
\TC
140
50
4_
De
_B
eers
_V
icto
r_M
ine_
201
4\0
9_
GIS
\Hg
_R
ep
ort
_20
15
\MX
D\U
pp
erB
R_
dra
wnd
ow
n_
Rib
be
dF
enS
tatio
n_
20
14
_1.m
xd
VICTOR DIAMOND MINE
SCALE:
PROJECT No: TC140504
DATE: July 2016
FIGURE: 21:90,000
Interpreted Drawdown Contoursin Upper Bedrock Aquifer
(2015 data)
NOTES:- Mine site features current as of September 2015 (Pleides satellite platform)- Area surrounding mine site features current as of September 20, 2012 (GeoEye-1 satellite platform)
Drawdown in Upper Bedrock Aquifer Unit(2 m or 10 m Contour Interval)
@A Ribbed Fen Station (Clay/Peat Piezometer)Monitoring Locations!A Pumping Wells@A Bedrock Monitoring Well@A Clay/Peat Piezometer@A Clay/Peat/Bedrock Piezometer
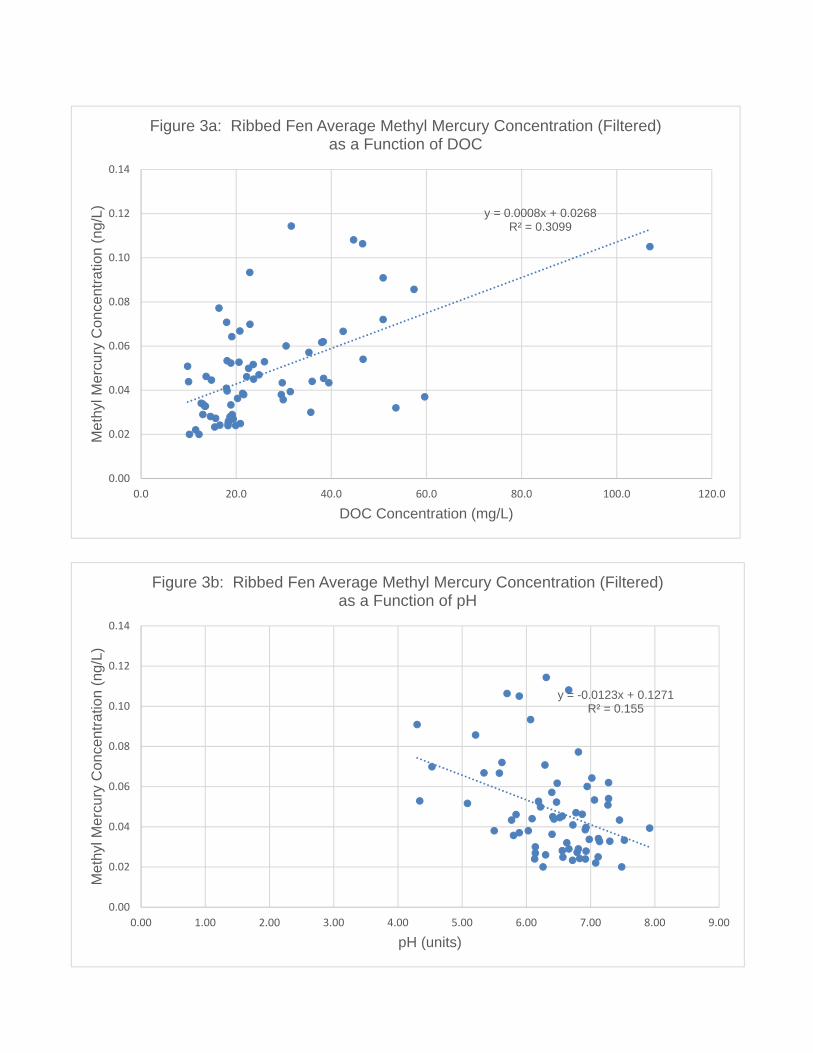
y = -0.0123x + 0.1271R² = 0.155
0.00
0.02
0.04
0.06
0.08
0.10
0.12
0.14
0.00 1.00 2.00 3.00 4.00 5.00 6.00 7.00 8.00 9.00
Me
thyl M
erc
ury
Co
nce
ntr
atio
n (
ng
/L)
pH (units)
Figure 3b: Ribbed Fen Average Methyl Mercury Concentration (Filtered) as a Function of pH
y = 0.0008x + 0.0268R² = 0.3099
0.00
0.02
0.04
0.06
0.08
0.10
0.12
0.14
0.0 20.0 40.0 60.0 80.0 100.0 120.0
Me
thyl M
erc
ury
Co
nce
ntr
atio
n (
ng
/L)
DOC Concentration (mg/L)
Figure 3a: Ribbed Fen Average Methyl Mercury Concentration (Filtered) as a Function of DOC
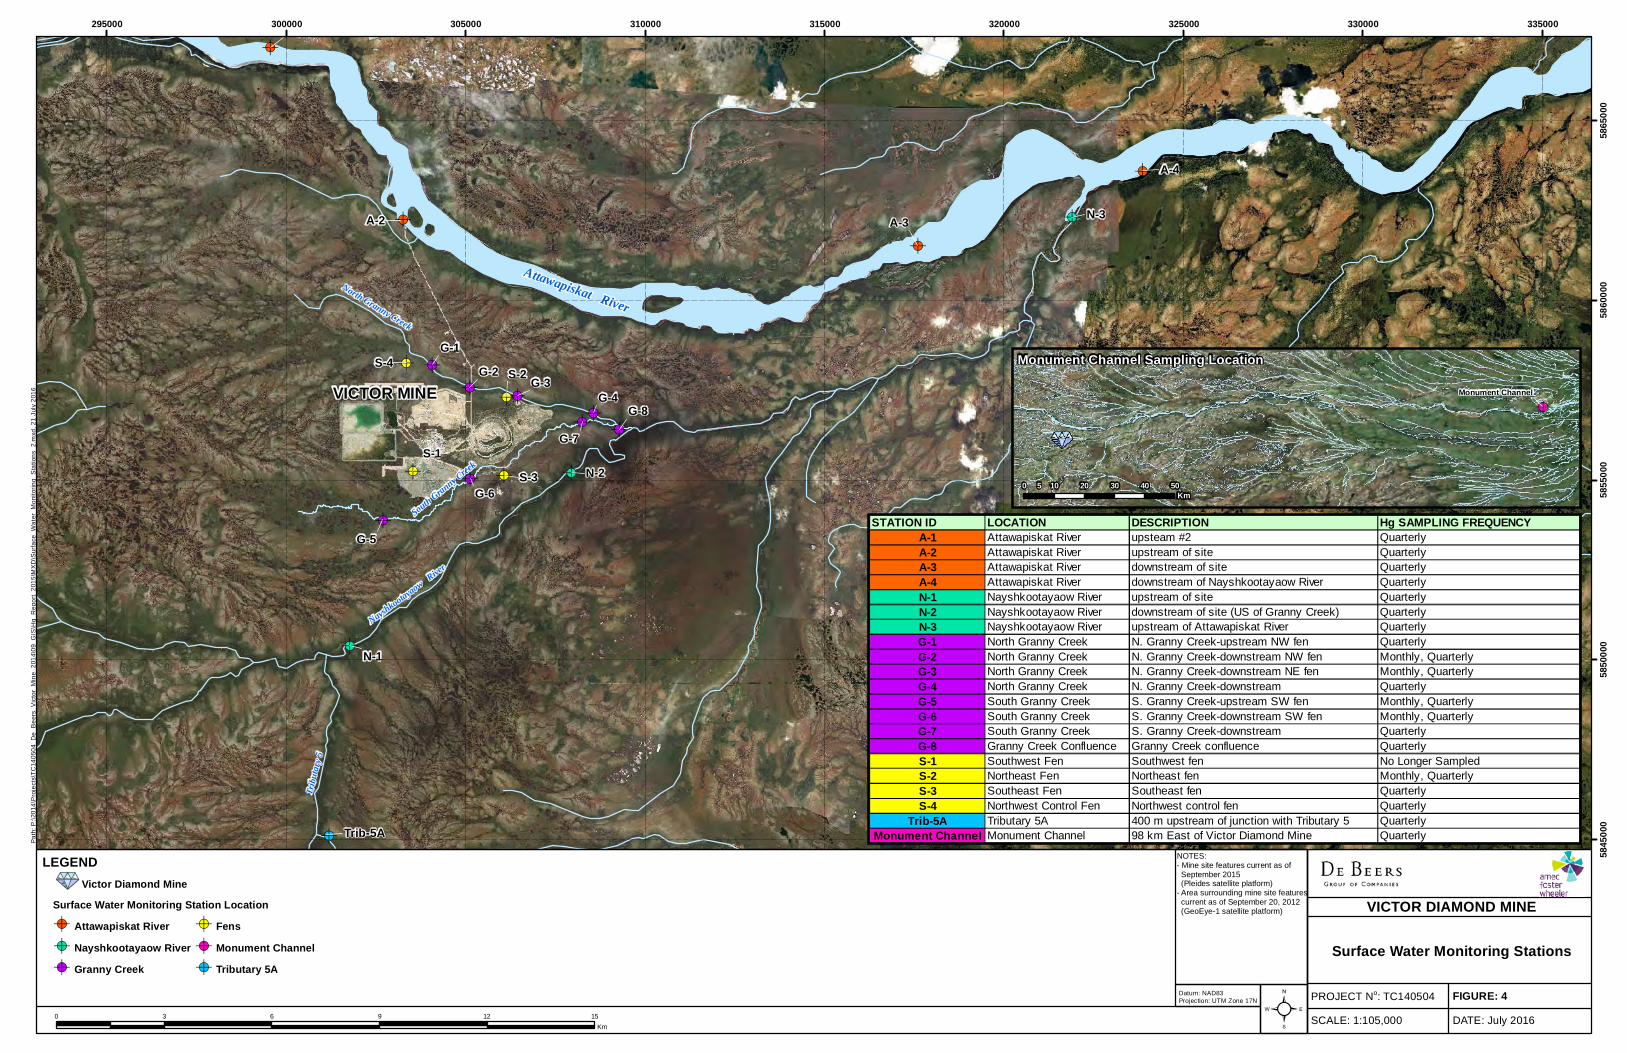
!A
!A
!A
!A
!A
!A
!A
!A!A !A
!A
!A
!A
!A !A
!A
!A
!A
!A
!A
Attawapiskat River
Nayshkoo
tayaow
River
VICTOR MINE
South
Granny Cree
k
North Granny Creek
Trib
utar
y5
Trib-5A
S-4
S-3
S-2
S-1
G-8
G-7
G-6
G-5
G-4G-3
G-2
G-1
N-3
N-2
N-1
A-4
A-3A-2
295000 300000 305000 310000 315000 320000 325000 330000 335000
5845
000
5850
000
5855
000
5860
000
5865
000
²0 3 6 9 12 15
Km
LEGEND
Datum: NAD83
Projection: UTM Zone 17N
Pa
th:
P:\
20
14
\Pro
jects
\TC
14
050
4_
De
_B
eers
_V
icto
r_M
ine_
201
4\0
9_
GIS
\Hg_
Re
po
rt_2
01
5\M
XD
\Surf
ace
_W
ate
r_M
onitori
ng_
Sta
tion
s_
2.m
xd
, 2
1 J
uly
201
6
NOTES:- Mine site features current as of September 2015 (Pleides satellite platform)- Area surrounding mine site features current as of September 20, 2012 (GeoEye-1 satellite platform) VICTOR DIAMOND MINE
Surface Water Monitoring Stations
FIGURE: 4
DATE: July 2016
PROJECT No: TC140504
SCALE: 1:105,000
Surface Water Monitoring Station Location
!A Attawapiskat River
!A Nayshkootayaow River
!A Granny Creek
!A Fens
!A Monument Channel
!A Tributary 5A
Monument Channel
STATION ID LOCATION DESCRIPTION Hg SAMPLING FREQUENCYA-1 Attawapiskat River upsteam #2 Quarterly
A-2 Attawapiskat River upstream of site Quarterly
A-3 Attawapiskat River downstream of site Quarterly
A-4 Attawapiskat River downstream of Nayshkootayaow River Quarterly
N-1 Nayshkootayaow River upstream of site Quarterly
N-2 Nayshkootayaow River downstream of site (US of Granny Creek) Quarterly
N-3 Nayshkootayaow River upstream of Attawapiskat River Quarterly
G-1 North Granny Creek N. Granny Creek-upstream NW fen Quarterly
G-2 North Granny Creek N. Granny Creek-downstream NW fen Monthly, Quarterly
G-3 North Granny Creek N. Granny Creek-downstream NE fen Monthly, Quarterly
G-4 North Granny Creek N. Granny Creek-downstream Quarterly
G-5 South Granny Creek S. Granny Creek-upstream SW fen Monthly, Quarterly
G-6 South Granny Creek S. Granny Creek-downstream SW fen Monthly, Quarterly
G-7 South Granny Creek S. Granny Creek-downstream Quarterly
G-8 Granny Creek Confluence Granny Creek confluence Quarterly
S-1 Southwest Fen Southwest fen No Longer Sampled
S-2 Northeast Fen Northeast fen Monthly, Quarterly
S-3 Southeast Fen Southeast fen Quarterly
S-4 Northwest Control Fen Northwest control fen Quarterly
Trib-5A Tributary 5A 400 m upstream of junction with Tributary 5 Quarterly
Monument Channel Monument Channel 98 km East of Victor Diamond Mine Quarterly
Monument Channel Sampling Location
0 10 20 30 40 505Km
Victor Diamond Mine

Figure 5a: Nayshkootayaow River Total and Methyl Mercury Trends (Filtered and Unfiltered)
0.00
1.00
2.00
3.00
4.00
5.00
6.00
7.00
8.00
Co
nce
ntr
atio
n (
ng/L
)
Nayshkootayaow River Total Mercury Values (Unfiltered)
N-1 N-2 N-3
0.00
0.05
0.10
0.15
0.20
0.25
0.30
Co
nce
ntr
ation
(ng/L
)
Nayshkootayaow River Methyl Mercury Values (Unfiltered)
N-1 N-2 N-3
0.00
0.02
0.04
0.06
0.08
0.10
0.12
0.14
Co
nce
ntr
atio
n (
ng/L
)
Nayshkootayaow River Methyl Mercury Values (Filtered)
N-1 N-2 N-3
0.00
0.50
1.00
1.50
2.00
2.50
3.00
Co
nce
ntr
atio
n (
ng
/L)
Nayshkootayaow River Total Mercury Values (Filtered)
N-1 N-2 N-3
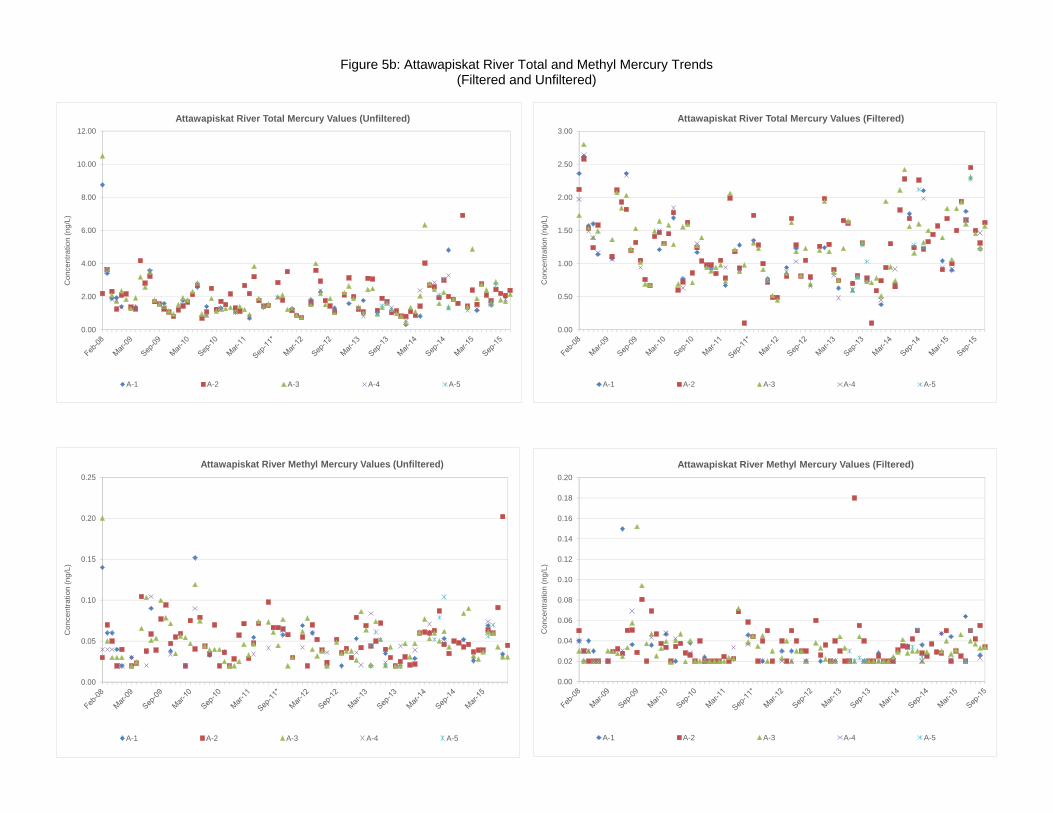
Figure 5b: Attawapiskat River Total and Methyl Mercury Trends (Filtered and Unfiltered)
0.00
2.00
4.00
6.00
8.00
10.00
12.00
Co
nce
ntr
atio
n (
ng/L
)
Attawapiskat River Total Mercury Values (Unfiltered)
A-1 A-2 A-3 A-4 A-5
0.00
0.05
0.10
0.15
0.20
0.25
Co
nce
ntr
atio
n (
ng/L
)
Attawapiskat River Methyl Mercury Values (Unfiltered)
A-1 A-2 A-3 A-4 A-5
0.00
0.02
0.04
0.06
0.08
0.10
0.12
0.14
0.16
0.18
0.20
Co
nce
ntr
ation
(n
g/L
)
Attawapiskat River Methyl Mercury Values (Filtered)
A-1 A-2 A-3 A-4 A-5
0.00
0.50
1.00
1.50
2.00
2.50
3.00
Co
nce
ntr
atio
n (
ng/L
)
Attawapiskat River Total Mercury Values (Filtered)
A-1 A-2 A-3 A-4 A-5
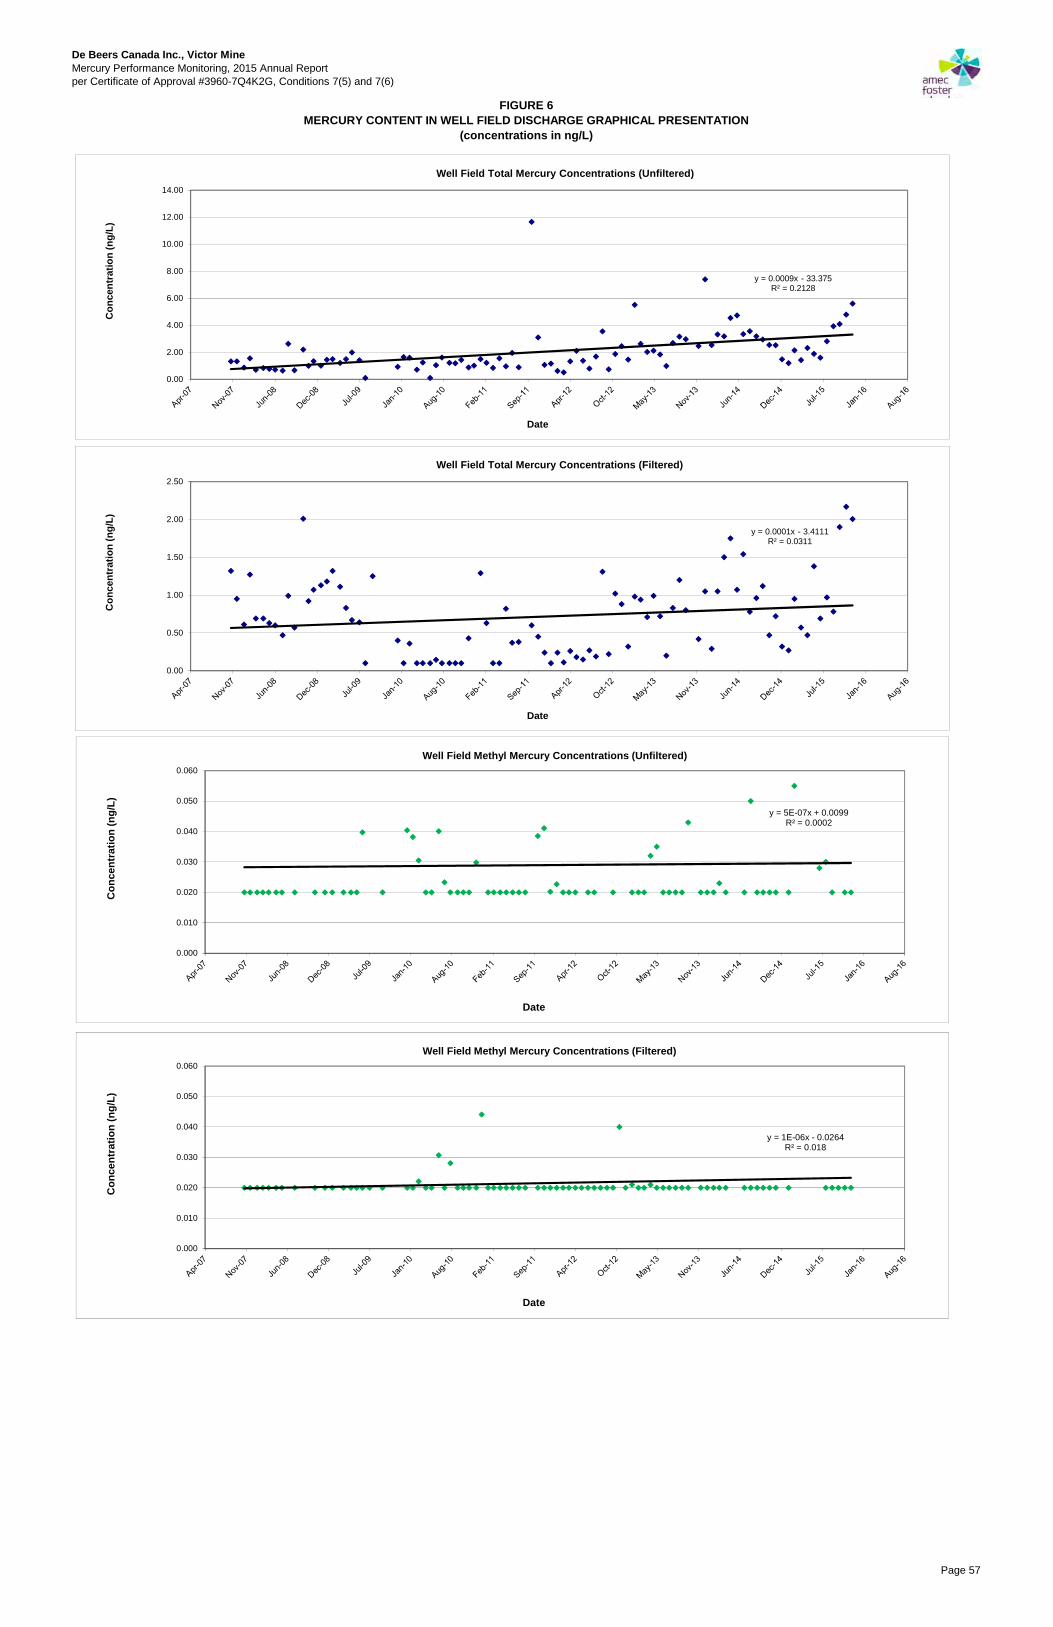
De Beers Canada Inc., Victor MineMercury Performance Monitoring, 2015 Annual Report
per Certificate of Approval #3960-7Q4K2G, Conditions 7(5) and 7(6)
FIGURE 6MERCURY CONTENT IN WELL FIELD DISCHARGE GRAPHICAL PRESENTATION
(concentrations in ng/L)
y = 5E-07x + 0.0099R² = 0.0002
0.000
0.010
0.020
0.030
0.040
0.050
0.060
Co
nce
ntr
atio
n (
ng
/L)
Date
Well Field Methyl Mercury Concentrations (Unfiltered)
y = 0.0009x - 33.375R² = 0.2128
0.00
2.00
4.00
6.00
8.00
10.00
12.00
14.00
Co
nce
ntr
atio
n (
ng
/L)
Date
Well Field Total Mercury Concentrations (Unfiltered)
y = 0.0001x - 3.4111R² = 0.0311
0.00
0.50
1.00
1.50
2.00
2.50
Co
nce
ntr
atio
n (
ng
/L)
Date
Well Field Total Mercury Concentrations (Filtered)
y = 1E-06x - 0.0264R² = 0.018
0.000
0.010
0.020
0.030
0.040
0.050
0.060
Co
nce
ntr
atio
n (
ng
/L)
Date
Well Field Methyl Mercury Concentrations (Filtered)
Page 57
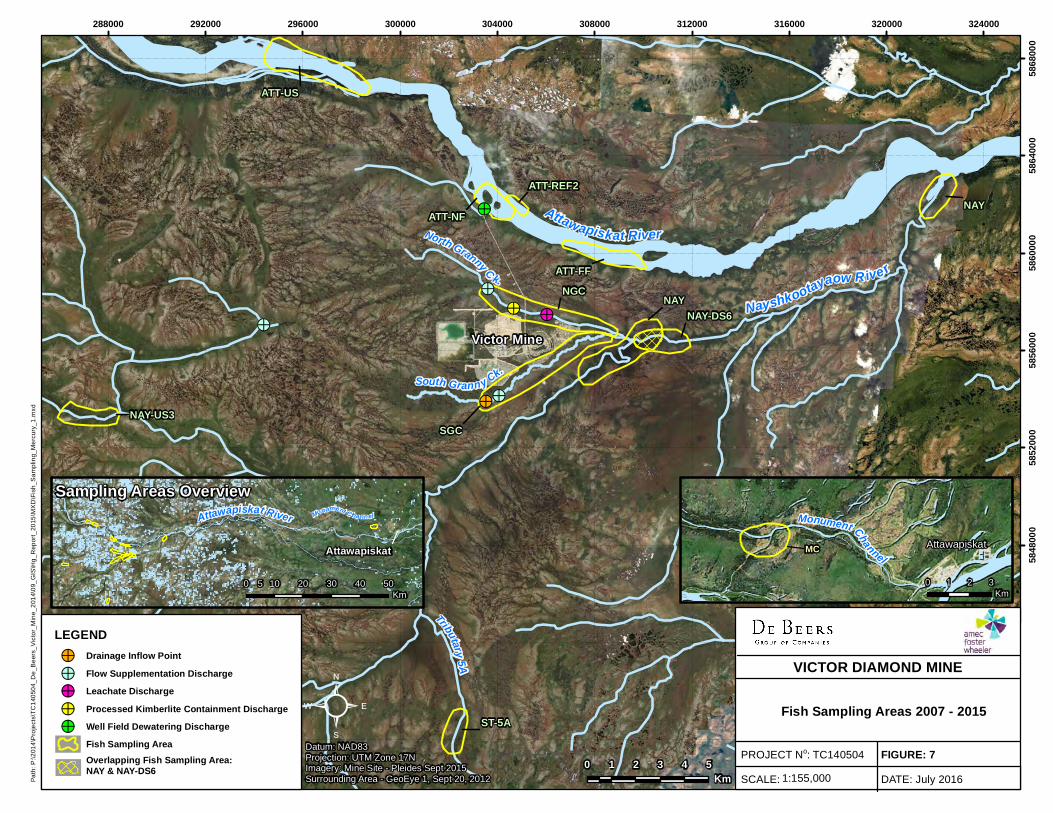
!>!>
!>
!>
!>
!>
!>
Victor Mine
North Granny C k.
South Granny Ck.
Attawapiskat River
ATT-REF2
Nayshkootayaow R ive r
Tributary 5A
ATT-US
ATT-NF
ATT-FF
NAY
NAY-DS6NAY
SGC
NGC
NAY-US3
ST-5A
288000 292000 296000 300000 304000 308000 312000 316000 320000 324000
5840
000
5844
000
5848
000
5852
000
5856
000
5860
000
5864
000
5868
000
0 1 2 3 4 5Km
²Datum: NAD83Projection: UTM Zone 17NImagery: Mine Site - Pleides Sept 2015Surrounding Area - GeoEye 1, Sept 20, 2012P
ath
: P
:\2
01
4\P
roje
cts
\TC
140
50
4_
De
_B
eers
_V
icto
r_M
ine_
201
4\0
9_
GIS
\Hg
_R
ep
ort
_20
15
\MX
D\F
ish
_S
am
plin
g_
Me
rcu
ry_1
.mxd
Attawapiskat
Monument ChannelMC
0 1 2 3
Km
Sampling Areas OverviewAttawapiskat River Monument C hannel
Attawapiskat
0 10 20 30 40 505
Km
VICTOR DIAMOND MINE
SCALE:
PROJECT No: TC140504
DATE: July 2016
FIGURE: 7
Fish Sampling Areas 2007 - 2015
1:155,000
LEGEND!> Drainage Inflow Point!> Flow Supplementation Discharge!> Leachate Discharge!> Processed Kimberlite Containment Discharge!> Well Field Dewatering Discharge
Fish Sampling AreaOverlapping Fish Sampling Area:NAY & NAY-DS6

De Beers Canada Inc., Victor MineMercury Perofrmance Monitoring, 2015 Annual Report
per Certificate of Approval #3960-7Q4K2G, Conditions 7(5) and 7(6)
July 2016
FIGURE 8TOTAL MERCURY BY AGE CLASS FOR 2015 PEARL DACE GRANNY CREEK SYSTEM
Comparison of total Hg levels (mg/kg) for YOY and aged 1+Pearl Dace in the granny creek system sampling areas. Each box shows the first
quartile, median and third quartile. Whiskers show minimum and maximum values. Small dots represent outliers. Large black dots represent mean
Hg values.
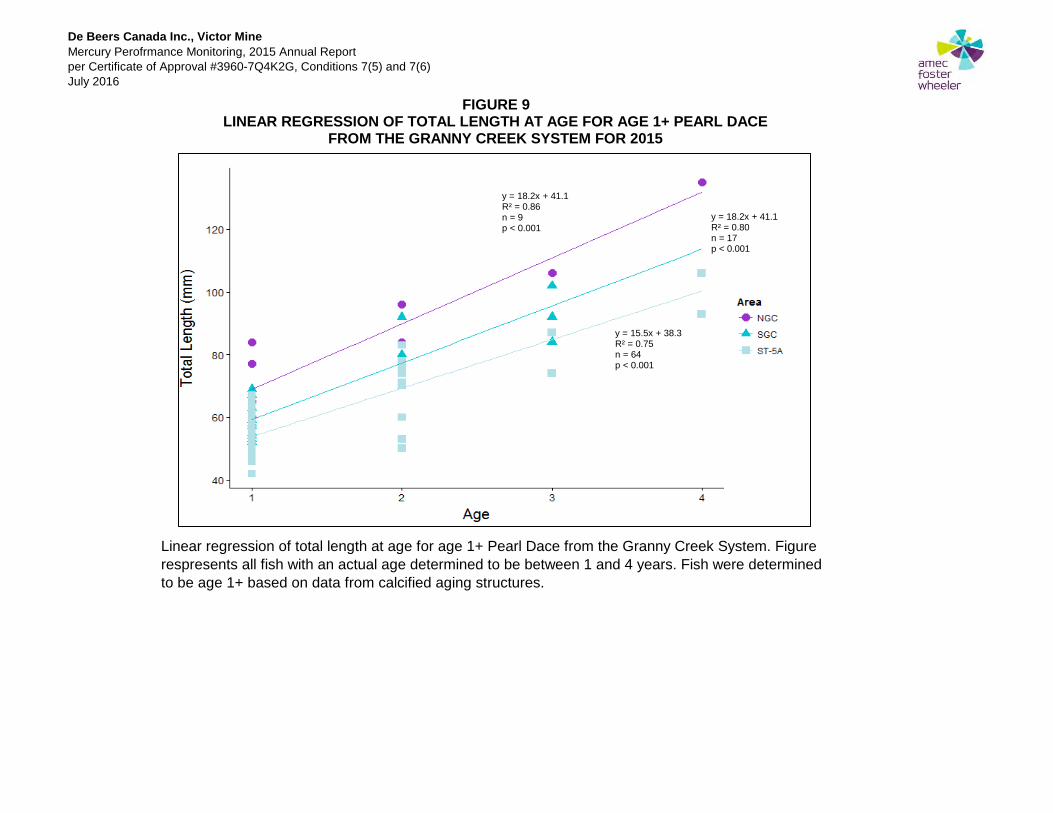
De Beers Canada Inc., Victor MineMercury Perofrmance Monitoring, 2015 Annual Report
per Certificate of Approval #3960-7Q4K2G, Conditions 7(5) and 7(6)
July 2016
FIGURE 9
Linear regression of total length at age for age 1+ Pearl Dace from the Granny Creek System. Figure
respresents all fish with an actual age determined to be between 1 and 4 years. Fish were determined
to be age 1+ based on data from calcified aging structures.
LINEAR REGRESSION OF TOTAL LENGTH AT AGE FOR AGE 1+ PEARL DACE FROM THE GRANNY CREEK SYSTEM FOR 2015
y = 15.5x + 38.3R² = 0.75n = 64p < 0.001
y = 18.2x + 41.1R² = 0.80n = 17p < 0.001
y = 18.2x + 41.1R² = 0.86n = 9p < 0.001
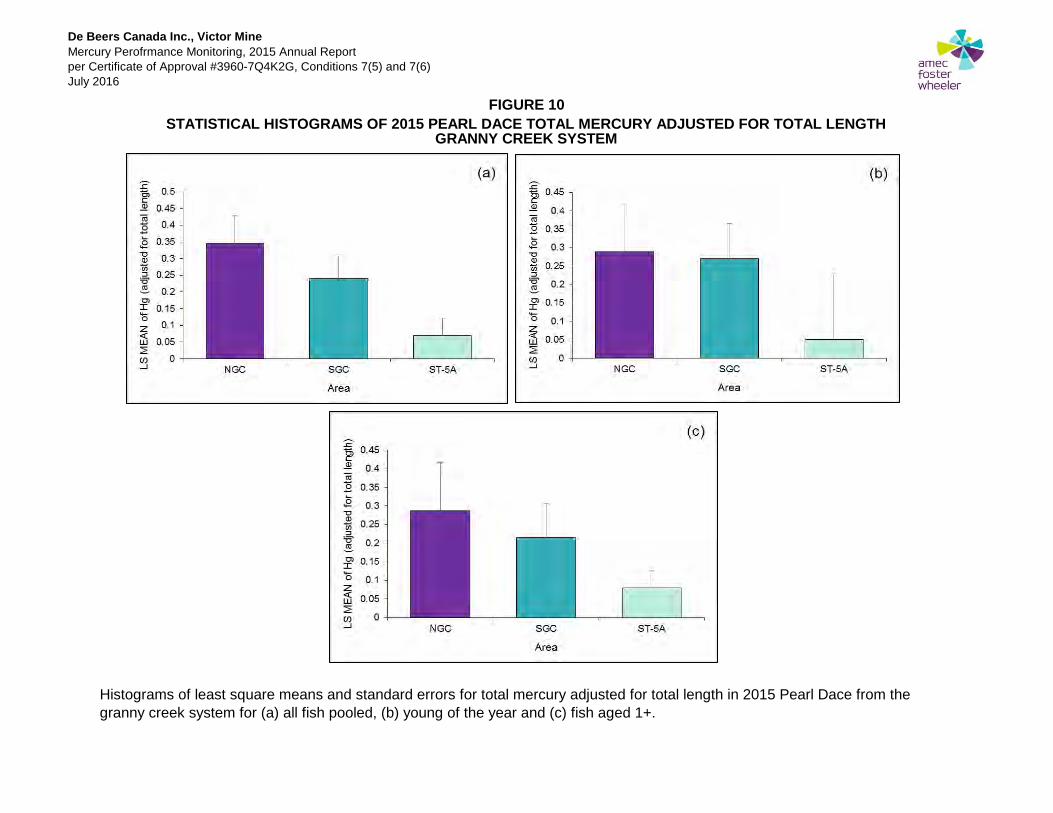
De Beers Canada Inc., Victor MineMercury Perofrmance Monitoring, 2015 Annual Report
per Certificate of Approval #3960-7Q4K2G, Conditions 7(5) and 7(6)
July 2016
FIGURE 10STATISTICAL HISTOGRAMS OF 2015 PEARL DACE TOTAL MERCURY ADJUSTED FOR TOTAL LENGTH
Histograms of least square means and standard errors for total mercury adjusted for total length in 2015 Pearl Dace from the
granny creek system for (a) all fish pooled, (b) young of the year and (c) fish aged 1+.
GRANNY CREEK SYSTEM

De Beers Canada Inc., Victor MineMercury Perofrmance Monitoring, 2015 Annual Report
per Certificate of Approval #3960-7Q4K2G, Conditions 7(5) and 7(6)
July 2016
FIGURE 11LEAST SQUARE PLOTS OF 2015 PEARL DACE TOTAL MERCURY
Plot of least square means of total mercury adjusted for length, year and area comparisons for Pearl
Dace in 2009 and 2015 from the granny creek system
GRANNY CREEK SYSTEM
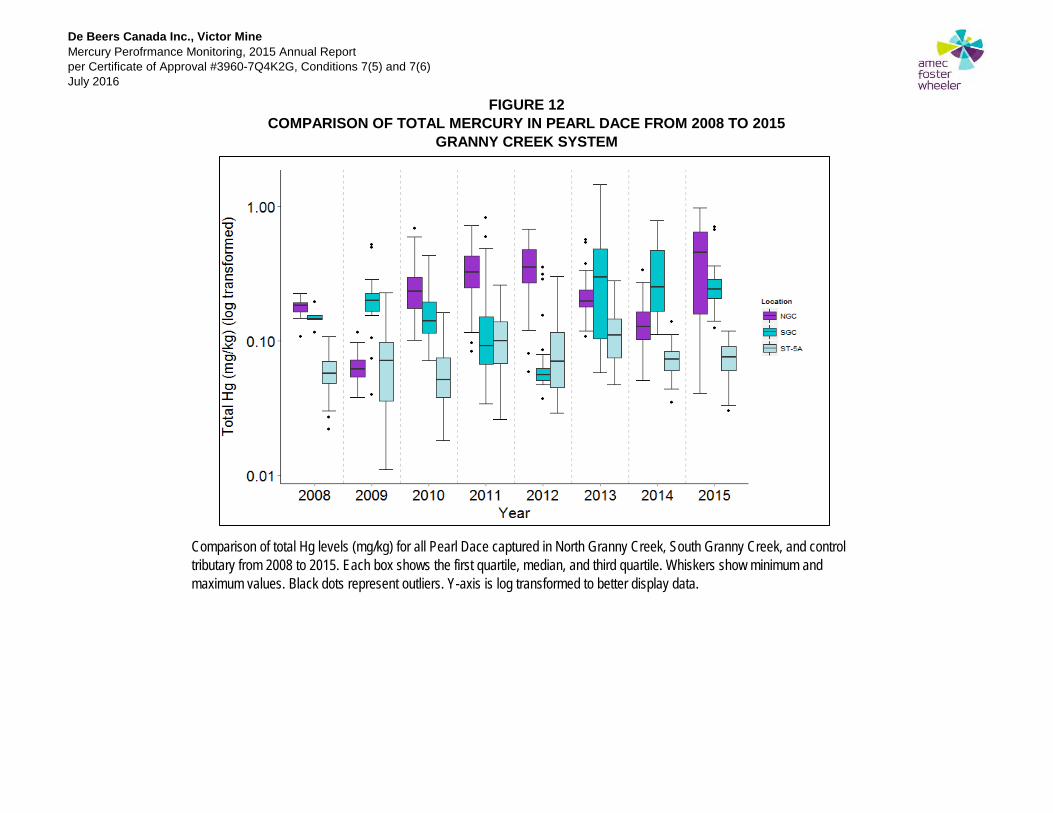
De Beers Canada Inc., Victor MineMercury Perofrmance Monitoring, 2015 Annual Report
per Certificate of Approval #3960-7Q4K2G, Conditions 7(5) and 7(6)
July 2016
Comparison of total Hg levels (mg/kg) for all Pearl Dace captured in North Granny Creek, South Granny Creek, and control
tributary from 2008 to 2015. Each box shows the first quartile, median, and third quartile. Whiskers show minimum and
maximum values. Black dots represent outliers. Y-axis is log transformed to better display data.
COMPARISON OF TOTAL MERCURY IN PEARL DACE FROM 2008 TO 2015FIGURE 12
GRANNY CREEK SYSTEM

De Beers Canada Inc., Victor MineMercury Perofrmance Monitoring, 2015 Annual Report
per Certificate of Approval #3960-7Q4K2G, Conditions 7(5) and 7(6)
July 2016
FIGURE 13COMPARISON OF TOTAL MERCURY BY AGE CLASS IN PEARL DACE FROM 2013 TO 2015
Comparison of total Hg levels (mg/kg) for YOY and age 1+ Pearl Dace in North Granny Creek, South Granny Creek, and control
triburaty from years with age data from otolith aging structures (2013, 2014 and 2015). Each box shows the first quartile, median, and
third quartile. Whiskers show minimum and maximum values. Black dots represent outliers. No YOY Pearl Dace captured from SGC in
2014. Y-axis is log transformed to better display data.
GRANNY CREEK SYSTEM
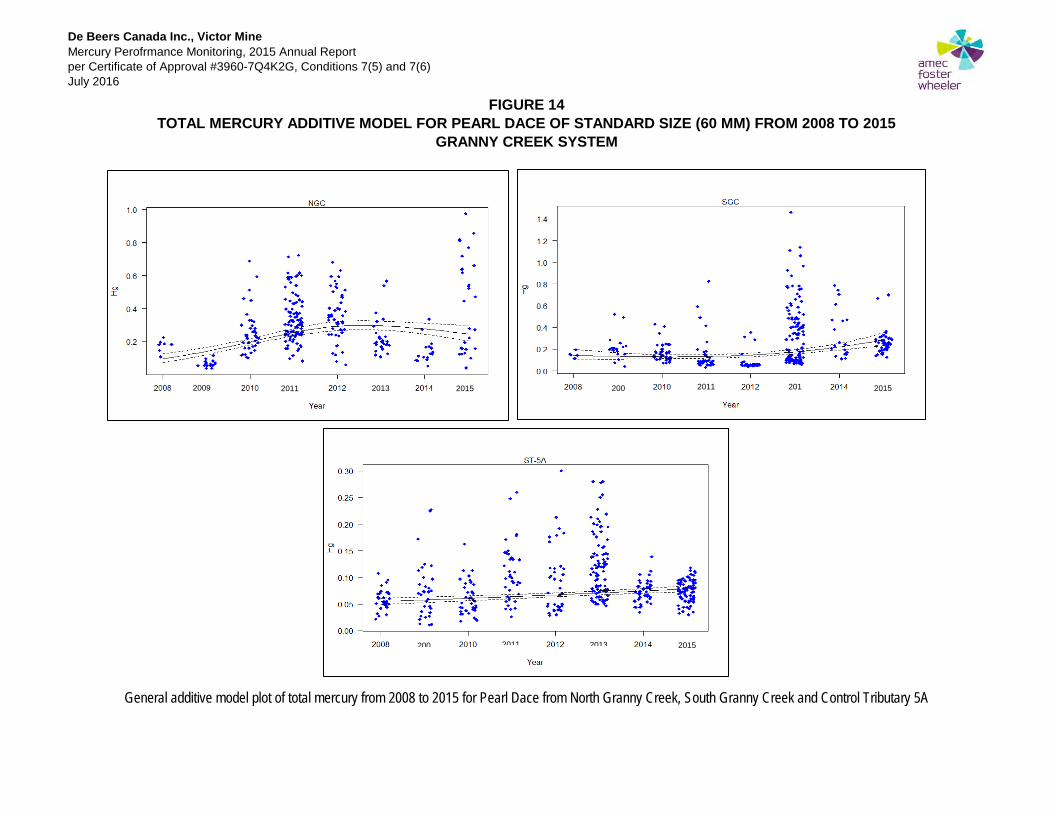
De Beers Canada Inc., Victor MineMercury Perofrmance Monitoring, 2015 Annual Report
per Certificate of Approval #3960-7Q4K2G, Conditions 7(5) and 7(6)
July 2016
FIGURE 14TOTAL MERCURY ADDITIVE MODEL FOR PEARL DACE OF STANDARD SIZE (60 MM) FROM 2008 TO 2015
General additive model plot of total mercury from 2008 to 2015 for Pearl Dace from North Granny Creek, South Granny Creek and Control Tributary 5A
GRANNY CREEK SYSTEM
2002009 2011 20112013 2015 201 2015
200 2011 2013 2015
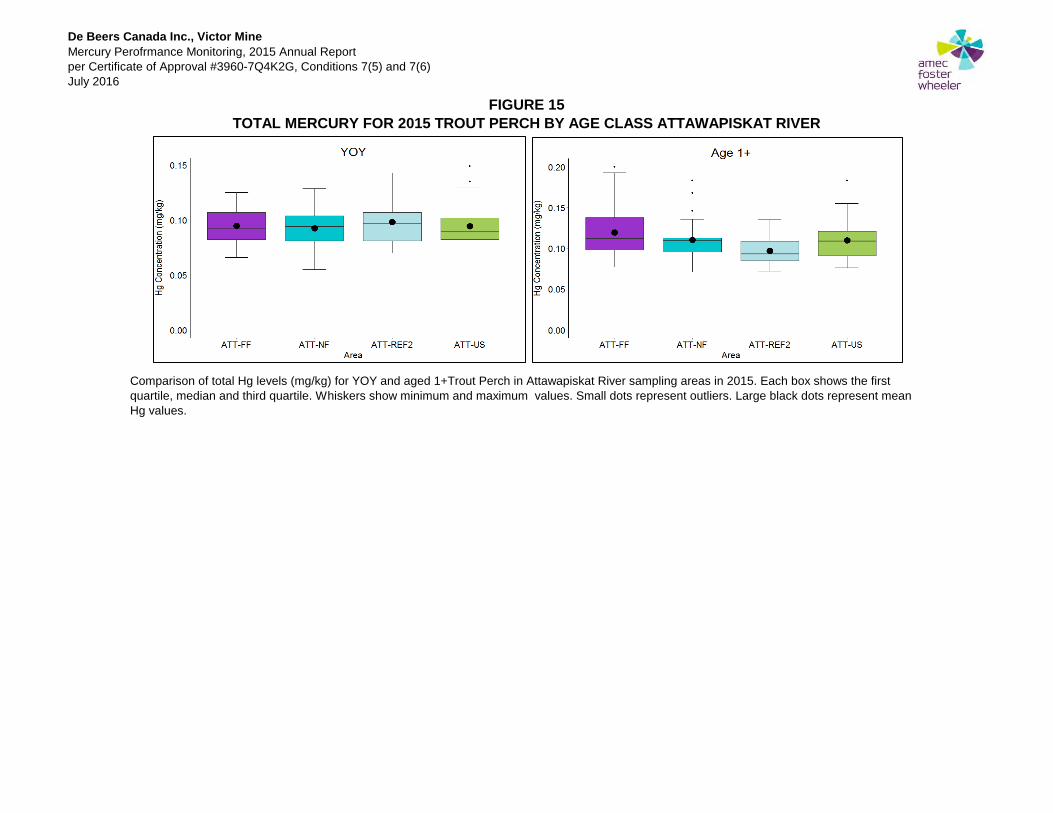
De Beers Canada Inc., Victor MineMercury Perofrmance Monitoring, 2015 Annual Report
per Certificate of Approval #3960-7Q4K2G, Conditions 7(5) and 7(6)
July 2016
FIGURE 15TOTAL MERCURY FOR 2015 TROUT PERCH BY AGE CLASS ATTAWAPISKAT RIVER
Comparison of total Hg levels (mg/kg) for YOY and aged 1+Trout Perch in Attawapiskat River sampling areas in 2015. Each box shows the first
quartile, median and third quartile. Whiskers show minimum and maximum values. Small dots represent outliers. Large black dots represent mean
Hg values.

De Beers Canada Inc., Victor MineMercury Perofrmance Monitoring, 2015 Annual Report
per Certificate of Approval #3960-7Q4K2G, Conditions 7(5) and 7(6)
July 2016
FIGURE 16
Linear regression of total length at age for age 1+ Trout Perch from the Attawapiskat River. Figure
respresents all fish with an actual known age . Fish were determined to be age 1+ based on data from
calcified aging structures.
LINEAR REGRESSION OF TOTAL LENGTH AT AGE FOR AGE 1+ TROUT PERCH IN 2015ATTAWAPISKAT RIVER
ATT-REF2y = 20.8x + 50.9R² = 0.39n = 34p < 0.001
ATT-FFy = 16.5x + 55.9R² = 0.86n = 51p < 0.001
ATT-NFy = 5.9x + 67.2 R² = 0.09n = 27p = 0.07
ATT-USy = 14.7x + 57.4R² = 0.51n = 29p < 0.001

De Beers Canada Inc., Victor MineMercury Perofrmance Monitoring, 2015 Annual Report
per Certificate of Approval #3960-7Q4K2G, Conditions 7(5) and 7(6)
July 2016
Histograms of least square means and standard errors for total mercury adjusted for total length in Trout Perch from the
Attawapiskat River for (a) all fish pooled, (b) young of the year and (c) fish aged 1+.
FIGURE 17STATISTICAL HISTOGRAMS OF 2015 TROUT PERCH TOTAL MERCURY ADJUSTED FOR TOTAL LENGTH
ATTAWAPISKAT RIVER

De Beers Canada Inc., Victor MineMercury Perofrmance Monitoring, 2015 Annual Report
per Certificate of Approval #3960-7Q4K2G, Conditions 7(5) and 7(6)
July 2016
FIGURE 18LEAST SQUARE PLOT OF 2009 AND 2015 TROUT PERCH TOTAL MERCURY
Plot of least square means of total mercury adjusted for length, year and area comparisons for Trout
Perch in 2009 and 2015 from the Attawapiskat River
ATTAWAPISKAT RIVER

De Beers Canada Inc., Victor MineMercury Perofrmance Monitoring, 2015 Annual Report
per Certificate of Approval #3960-7Q4K2G, Conditions 7(5) and 7(6)
July 2016
FIGURE 19
Comparison of total Hg levels (mg/kg) for YOY and age 1+ Trout Perch in the Attawapiskat River from 2008 to 2015. Age class
was determined by otolith aging structures in 2011, 2013, 2014 and 2015, and length frequency distributions from 2008-2010 and
2012. Each box shows the first quartile, median and third quartile. Whiskers show minimum and maximum values. Black dots
represent outliers. Y- axis is log transformed for YOY to better present data.
COMPARISON OF TOTAL MERCURY FROM 2008 TO 2015 BY AGE CLASS IN TROUT PERCH ATTAWAPISKAT RIVER

De Beers Canada Inc., Victor MineMercury Perofrmance Monitoring, 2015 Annual Report
per Certificate of Approval #3960-7Q4K2G, Conditions 7(5) and 7(6)
July 2016
FIGURE 20TOTAL MERCURY ADDITIVE MODEL FOR TROUT PERCH OF STANDARD SIZE (50 MM) FROM 2008 TO 2015
General additive model plot of total mercury from 2008 to 2015 for Trout Perch from the Attawapiskat River sampling locations
ATTAWAPISKAT RIVER
2009 20132011 2015
2009 2011 2013 2015
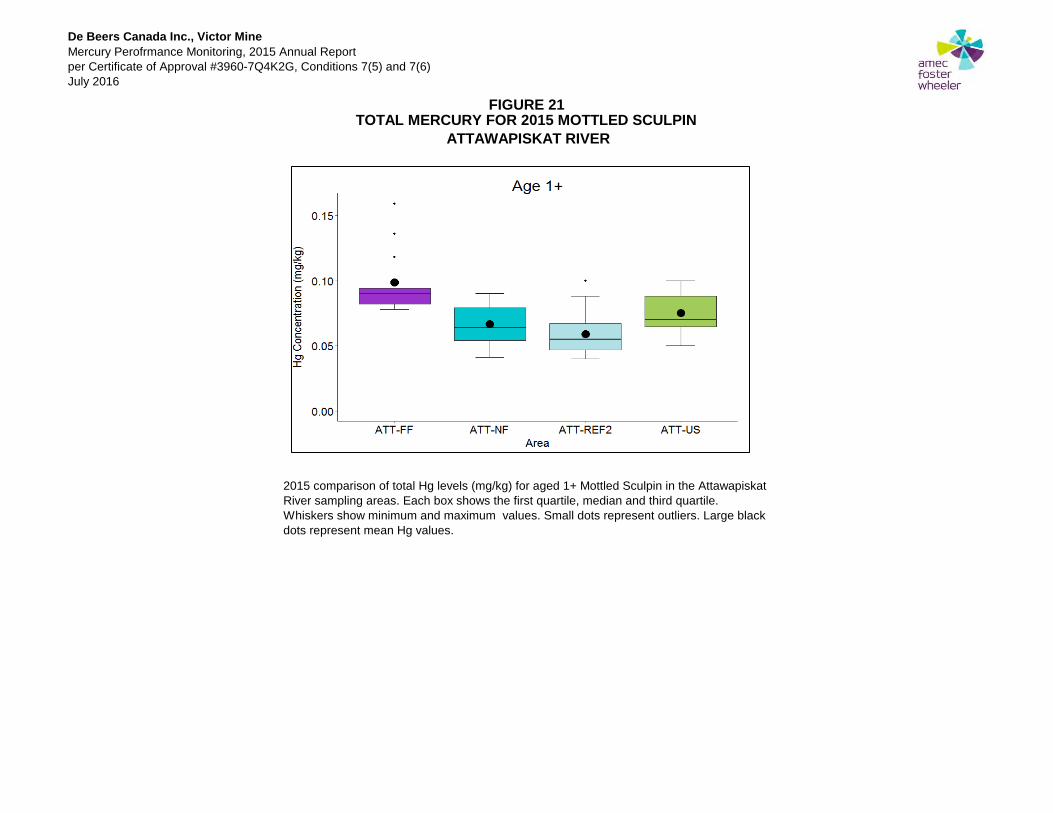
De Beers Canada Inc., Victor MineMercury Perofrmance Monitoring, 2015 Annual Report
per Certificate of Approval #3960-7Q4K2G, Conditions 7(5) and 7(6)
July 2016
FIGURE 21
2015 comparison of total Hg levels (mg/kg) for aged 1+ Mottled Sculpin in the Attawapiskat
River sampling areas. Each box shows the first quartile, median and third quartile.
Whiskers show minimum and maximum values. Small dots represent outliers. Large black
dots represent mean Hg values.
TOTAL MERCURY FOR 2015 MOTTLED SCULPIN ATTAWAPISKAT RIVER

De Beers Canada Inc., Victor MineMercury Perofrmance Monitoring, 2015 Annual Report
per Certificate of Approval #3960-7Q4K2G, Conditions 7(5) and 7(6)
July 2016
FIGURE 22STATISTICAL HISTOGRAMS OF 2015 MOTTLED SCULPIN TOTAL MERCURY BY AGE CLASS
Histograms of least square means and standard errors for total mercury adjusted for total length in Mottled Scuplin from the
Attawapiskat River for (a) all fish pooled, (b) fish aged 1+ (c) all fish pooled
ATTAWAPISKAT RIVER
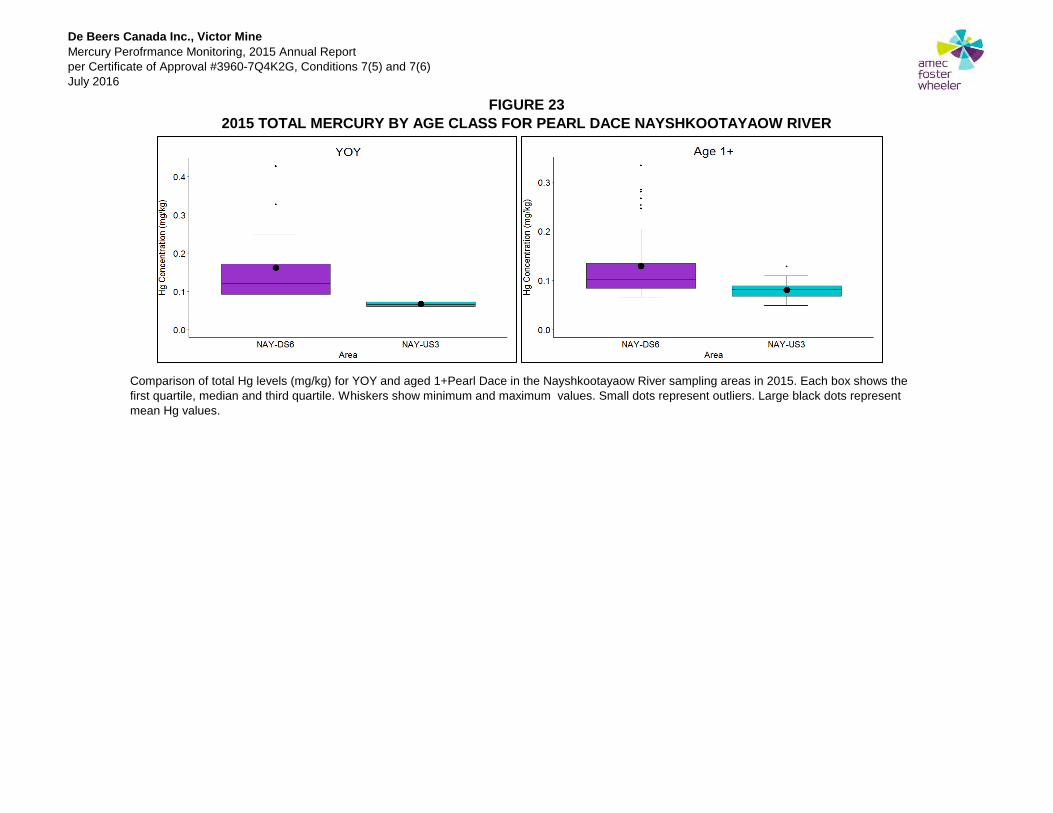
De Beers Canada Inc., Victor MineMercury Perofrmance Monitoring, 2015 Annual Report
per Certificate of Approval #3960-7Q4K2G, Conditions 7(5) and 7(6)
July 2016
FIGURE 232015 TOTAL MERCURY BY AGE CLASS FOR PEARL DACE NAYSHKOOTAYAOW RIVER
Comparison of total Hg levels (mg/kg) for YOY and aged 1+Pearl Dace in the Nayshkootayaow River sampling areas in 2015. Each box shows the
first quartile, median and third quartile. Whiskers show minimum and maximum values. Small dots represent outliers. Large black dots represent
mean Hg values.

De Beers Canada Inc., Victor MineMercury Perofrmance Monitoring, 2015 Annual Report
per Certificate of Approval #3960-7Q4K2G, Conditions 7(5) and 7(6)
July 2016
FIGURE 24STATISTICAL HISTOGRAMS OF 2015 PEARL DACE TOTAL MERCURY BY AGE CLASS
Histograms of least square means and standard errors for total mercury adjusted for total length in Pearl Dace from the
Nayskootayaow River for (a) all fish pooled, (b) young of the year and (c) fish aged 1+.
NAYSHKOOTAYAOW RIVER

0
1
2
3
4
5
6
7
2006 2007 2008 2009 2010 2011 2012 2013 2014 2015 2016
Con
ce
ntr
atio
n (
ng/L
)
Year
FIGURE 25: MS-8 PIEZOMETER TRENDS IN TOTAL MERCURY CONCENTRATIONS - 2007 - 2015
Domed Bog
Flat Bog
Horz Fen
Ribbed Fen

!
!
!
!
!
!
!
!
!
!
!
!
!
!
!
!
!
!
!
!
!
!
!
!
!
!
!
!
!
!
!
!
!
!
!
!
!
!
!
!
!
!
!
!
!
!
!
!
!
!
!
!
!
!
!
!
!
!
!
!
!
! ! ! ! ! ! ! ! ! ! ! ! ! ! ! !
!(
!(
!(
!(
11
6
5
1
2
3 21
20
19
24
North Granny Creek
South Grann y Cree
k
Attawapiskat River
Nayshkootayao wRiver
10
8
9
25
18
4
227
2310
12 1314
15
16
17
2627
28
29
30
31
32
3635
33
34
37
38
39
2
MS-8-H
MS-8-R
MS-8-F
MS-8-D
20
10
4
2
10
302000 303000 304000 305000 306000 307000
5854
000
5855
000
5856
000
5857
000
5858
000
5859
000
5860
000
5861
000
5862
000
²0 0.5 1 1.5 20.25
Kilometres
LEGEND
Datum: NAD83
Projection: UTM Zone 17N
VICTOR DIAMOND MINE
SCALE:
PROJECT No: TC140504
DATE: July 2016
FIGURE: 261:24,000
MS-8 Piezometer Locations
NOTES:- Site plan extracted from as built De Beers CAD drawing 130916- Pleides Satellite imagery scene date is September 2015
P:\
20
14\P
roje
cts
\TC
14
05
04
_D
e_
Bee
rs_
Vic
tor_
Min
e_
20
14
\09
_G
IS\H
g_R
epo
rt_2
01
5\M
XD
\MS
_8
_P
iezom
ete
r_1
.mxd
Mine Feature2015 Drawdown in Upper Bedrock Aquifer Unit (2 m or 10 m Contour Interval)Watercourse
Muskeg Monitoring Stations!( Clay/Peat Piezometer
1 - Airstrip2 - Airstrip Muskeg / Overburden Stockpile3 - Polishing Pond (Former Central Quarry)4 - Polishing Pond Discharge Ditch5 - Fine Processed Kimberlite Containment Facility Cell 16 - Fine Processed Kimberlite Containment Facility Cell 27 - Fine Processed Kimberlite Containment Collection Ditch8 - West Muskeg Stockpile9 - Coarse Processed Kimberlite and Overburden Stockpile10 - Mine Rock Stockpile11 - Low-grade Ore and Coarse Processed Kimberlite Stockpile12 - Construction Accommodation Complex13 - Permanent Accommodation Complex14 - Process Plant15 - Crusher16 - Fuel Storage Tanks17 - Services (Potable Water, SewageTreatment Plant, Incinerator)18 - Landfill19 - Open Pit20 - Southwest Overburden Stockpile21 - Northeast Overburden Stockpile22 - Overburden Dyke23 - Phase 1 Mine Water Settling Pond24 - North Muskeg Stockpile25 - 115 kV Transmission Line26 - South Quarry27 - Southeast Fen28 - Exploration Camp29 - South Winter Road30 - Bulk Emulsion Plant31 - Ammonium Nitrate Storage32 - Explosives Magazine33 - Attawapiskat River Intake Road34 - Attawapiskat River Pumphouse35 - Northwest Fen36 - Northeast Fen37 - Nayshkootayaow River Flow Supplementation Pipeline38 - North Granny Creek Supplementation Pipeline39 - South Granny Creek Supplementation Pipeline
MINE FEATURES

Appendix AAmec Foster Wheeler Environment & Infrastructure
TC121511
70
72
74
76
78
80
82
84
86
88
90
Gro
un
dw
ate
r E
levati
on
(m
AS
L)
Date
Figure 27: Groundwater Elevations at Muskeg Monitoring Site MS-8
MS-8-1D Domed Bog MS-8-1F Flat Bog
MS-8-1H Horizontal Fen MS-8-1R Ribbed Fen
MS-8-1BR Deep (Lower Attawapiskat) MS-8-1BR Intermediate (Upper Attawapiskat)
MS-8-1-CL D (Weathered BR?) MS-8-1 CL M Intermediate
MS-8-1-CL S (Clay) MS-8-2-BR Deep (Upper Attawapiskat)
MS-8-2-BR Shallow MS-8-2 WBR
MS-8-2 deep clay MS-8-2 intermediate clay
MS-8-2 shallow clay MS-8-3 CL D (Weathered BR)
MS-8-4 CL S (Clay) MS-8-4 CL D (Weathered BR)
MS-8-1H (12h)
Dry Wells:
HCI-03-31 (Upper) since September 2009
MS-8-4 series wells dry since 2009
MS-8-1WBR since Dec 2012.
Transducer not immersed:
MS-8-1-CLS: Feb. 2010 - Apr. 2010
MS-8-1-BR I: Dec. 2010 - Apr. 2011
Ms-8-1-BR D: Mar. 2010- May 2010
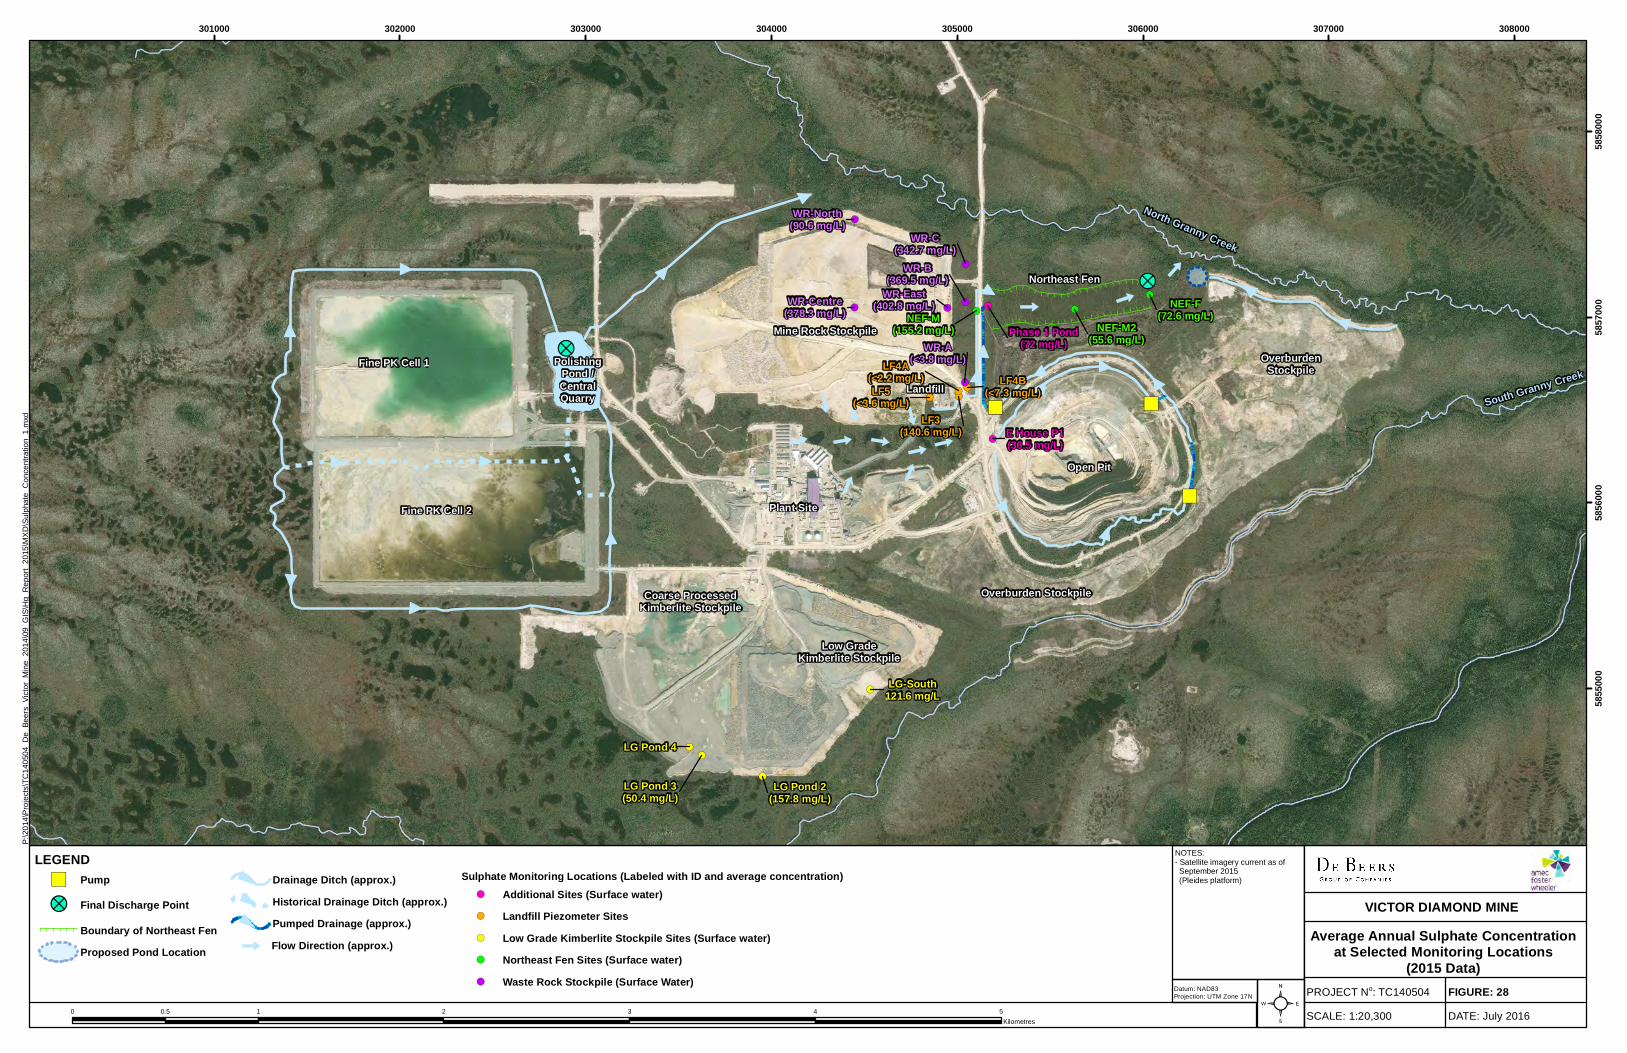
!>
!>
")
") ")!(!(!(
!(
!(
!(!(
!( !(!(!(
!(
!(
!( !(
!(
!(
!(
!(
Fine PK Cell 1 PolishingPond /CentralQuarry
Mine Rock Stockpile
Plant Site
Landfill
Coarse ProcessedKimberlite Stockpile
Low GradeKimberlite Stockpile
Open Pit
OverburdenStockpile
Overburden Stockpile
Northeast Fen
North Granny Creek
South Granny Creek
Fine PK Cell 2
â â
â
â
â â
â
â
â
â âââ
LF5(<3.6 mg/L)
WR-A(<3.8 mg/L)
LG-South121.6 mg/L
WR-C(342.7 mg/L)
WR-B(369.5 mg/L)
NEF-F(72.6 mg/L)
NEF-M2(55.6 mg/L)
NEF-M(155.2 mg/L)
LG Pond 4
WR-East(402.8 mg/L)
WR-North(90.6 mg/L)
LG Pond 3(50.4 mg/L)
WR-Centre(378.3 mg/L)
E House P1(36.5 mg/L)
LG Pond 2(157.8 mg/L)
LF4B(<7.3 mg/L)
LF4A(<2.2 mg/L)
LF3(140.6 mg/L)
Phase 1 Pond(72 mg/L)
301000 302000 303000 304000 305000 306000 307000 308000
5855
000
5856
000
5857
000
5858
000
²0 1 2 3 4 50.5
Kilometres
LEGEND
Datum: NAD83
Projection: UTM Zone 17N
NOTES:- Satellite imagery current as of September 2015 (Pleides platform)
VICTOR DIAMOND MINE
FIGURE: 28DATE: July 2016
PROJECT No: TC140504
SCALE: 1:20,300
") Pump
!> Final Discharge Point
Boundary of Northeast FenProposed Pond Location
Drainage Ditch (approx.)Historical Drainage Ditch (approx.)Pumped Drainage (approx.)
Sulphate Monitoring Locations (Labeled with ID and average concentration)!( Additional Sites (Surface water)!( Landfill Piezometer Sites!( Low Grade Kimberlite Stockpile Sites (Surface water)!( Northeast Fen Sites (Surface water)!( Waste Rock Stockpile (Surface Water)
Flow Direction (approx.) Average Annual Sulphate Concentrationat Selected Monitoring Locations
(2015 Data)â
P:\
20
14
\Pro
jects
\TC
14
050
4_
De
_B
ee
rs_
Vic
tor_
Min
e_
20
14
\09
_G
IS\H
g_
Re
po
rt_
20
15
\MX
D\S
ulp
ha
te_
Co
nce
ntr
atio
n_
1.m
xd