mercury mact development for coal-fired power plants a presentation by the west associates at the...
TRANSCRIPT
Mercury MACT Development for Coal-fired Power Plants
A Presentation by the
WEST Associates
at the
EPA’s HAPs MACT Working GroupWashington DC, September 9, 2002

Overview
• Introduction to WEST Associates
• Endorses Industry Recommendations, But WEST has Additional Concerns
• Mercury Emissions from Western Coal-fired Power Plants: Nature, Extent, and Fate
• Unique Western Concerns Related to the Role of Chlorine contents of Coal on Hg Emissions
• Recommendations
Who is WEST Associates?
• 17 public and private electric utility companies• Serves 15 million consumers in the rapidly-
growing 11 Western states and North Dakota• Played a constructive role since 1964 on energy
and environmental issues in the West– 1990 Clean Air Act Amendments– Grand Canyon Visibility Transport
Commission (GCVTC)– Western Regional Air Partnership (WRAP)

Who is WEST Associates?
AZ Arizona Electric Power Cooperative
Pinnacle West Capital Corp.
Salt River Project
Tucson Electric Power Co.
CA Glendale Public Service Dept.
Los Angeles Dept. of Water & Power
Southern California Edison
OR PacifiCorp
ID Idaho Power Company
NV Nevada Power Co/ Sierra Pacific Power Co
NM Public Service Co of NM, Xcel Energy and Tri-State G & T
CO Colorado Springs UtilitiesXcel EnergyPlatte River Power AuthorityTri-State G & T
UT PacifiCorp/Utah Power and Light
WY PacifiCorp, Xcel Energy and Tri-State G & T
ND Basin Electric Power
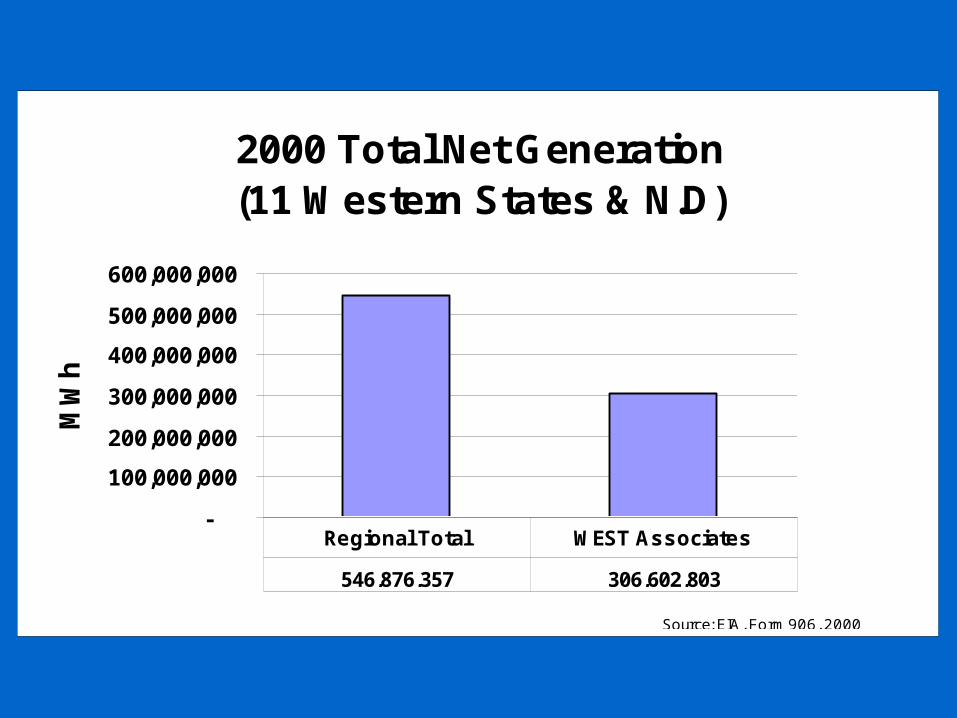
2000 Total Net Generation(11 Western States & N.D)
-
100,000,000
200,000,000
300,000,000
400,000,000
500,000,000
600,000,000
MW
h
546,876,357 306,602,803
Regional Total WEST Associates
Source: EIA, Form 906, 2000

2000 Coal Net Generation(11 Western States & N.D)
-
50,000,000
100,000,000
150,000,000
200,000,000
250,000,000
MW
h
237,509,837 197,787,790
Regional Total WEST Associates
Source: EIA, Form 906, 2000

Western Representation on Working Group
• Western States are not represented on the Working Group
• Western utilities are not represented on the Working Group
• Western utilities believe that unique Western issues of Hg emissions, deposition, and air quality are not being adequately addressed
• WEST Associates appreciates its recent inclusion in Working Group’s activities

Western Mercury Issues
• EPA’s “Regulatory Finding” in Dec. 2000 recognized the distinctly different Hg conditions in the West, stating– “EPA may also consider other relevant factors such as
geographic conditions in establishing subcategories”
• Western coal has lower Hg, sulfur, and chlorine content resulting in lower Hg emissions, mostly as elemental Hg
• Western Hg emissions are less than 10% of Eastern Hg emissions in roughly the same size geographic area
• Western Hg deposition levels are significantly lower than in the East
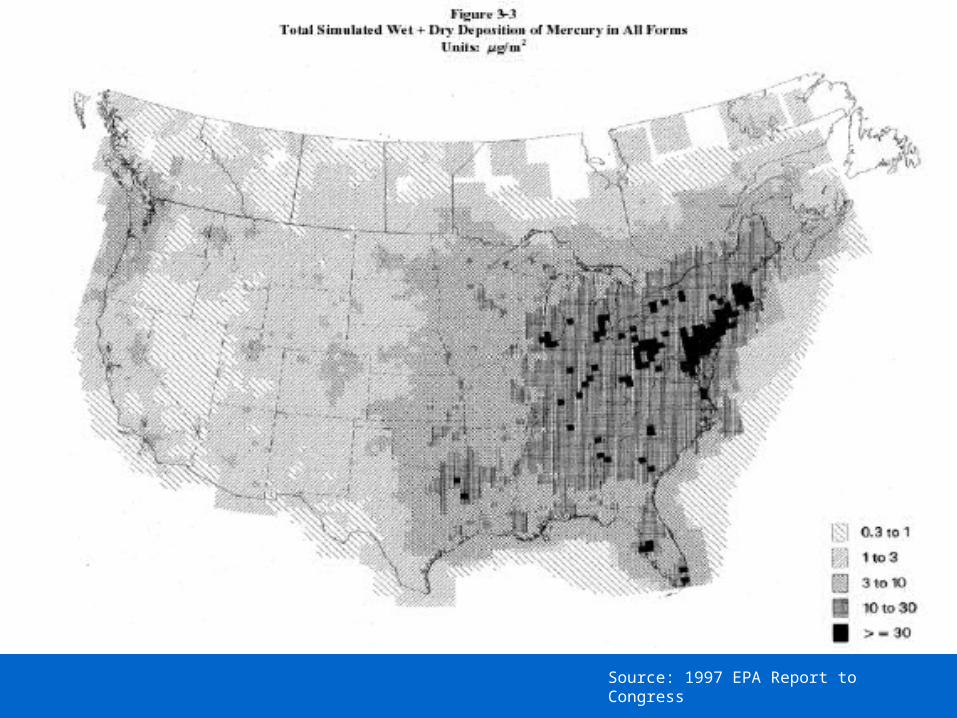
Source: 1997 EPA Report to Congress


Mercury Emissions from Power Plants: 1999
0.00
20,000.00
40,000.00
60,000.00
80,000.00
100,000.00
120,000.00
lbs
elemental 52,189.29 54% 6,814.13 85%
ionized 40,816.99 43% 1,127.86 14%
particulate 2,966.89 3% 92.62 1%
National - lbs % of total 11 Western States - lbs % of total

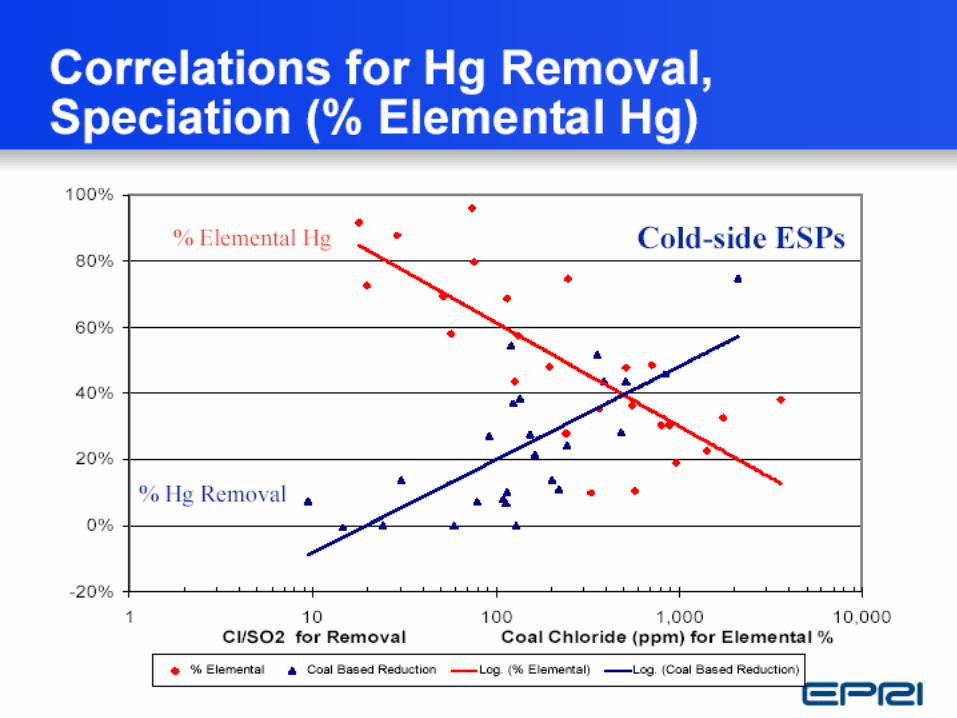
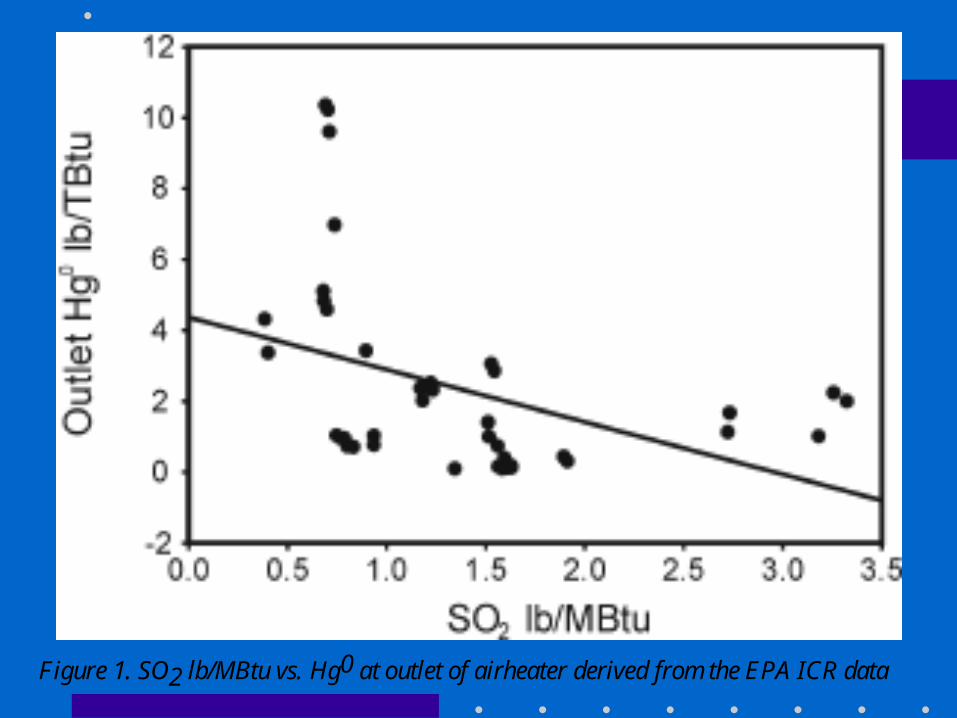
Figure 1. SO2 lb/MBtu vs. Hg0 at outlet of airheater derived from the EPA ICR data
0
10
20
30
40
50
60
70
80
90
100
10 100 1000 10000
Chlorine (ppm, mass)
Perc
en
t E
lem
en
tal M
erc
ury
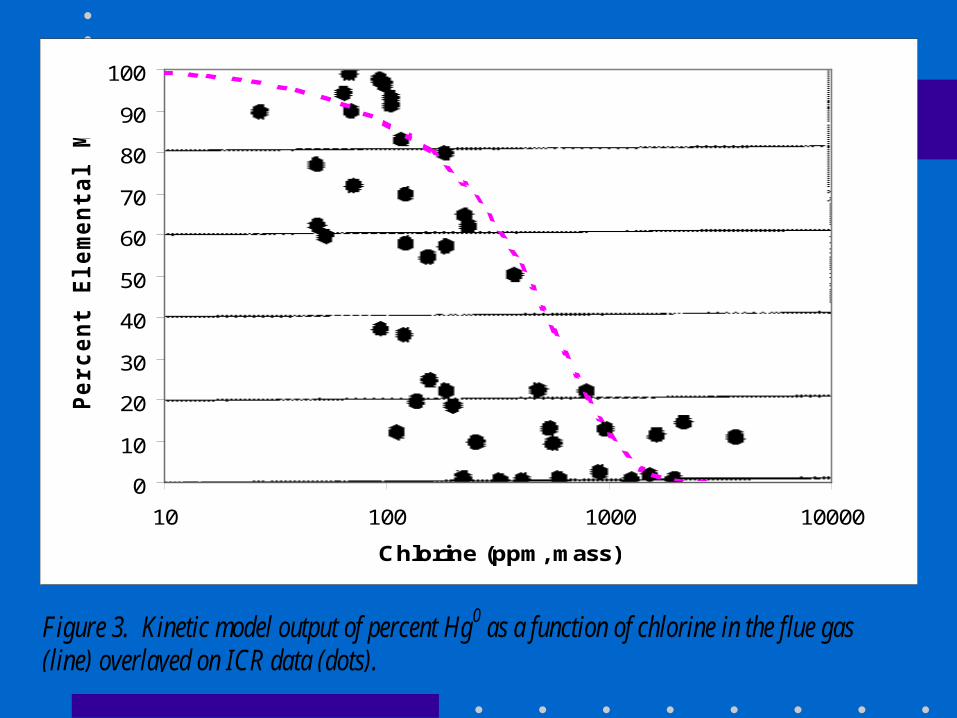
Figure 3. Kinetic model output of percent Hg0 as a function of chlorine in the flue gas(line) overlayed on ICR data (dots).

Sub-categorization by Coal Rank • Heat content and agglomeration-based ASTM method of
coal ranking does not distinguish the magnitude and controllability of Hg emissions, or Hg species causing different public health and environmental impacts
• Same mine can produce coals of differing ranks (e.g., Black Mesa in Arizona -- bituminous & sub-bituminous)
• Coal chlorine content affects controllability of Hg emissions and it should be taken into account when using ICR data to set MACT levels
• Hg control costs for Western coals are higher than those for Eastern coals at plants with PM and SO2 controls
ICR Data Analysis/Hg Tests• Our analysis of ICR data shows that coal rank,
coal mercury content, and the ratio of coal mercury to chlorine content are the three most statistically significant factors to be considered in setting MACT levels
• Additional Hg characterization measurements have just been completed using Black Mesa coal
• Results from these tests and a comparison of results with ICR data will be available by the October 17 Working Group meeting

Recommendations• WEST Associates recommends that sub-categorization
by coal rank be augmented with consideration of chlorine content of coal within coal rank
• Leaving out consideration of chlorine content in setting MACT levels may render Hg control efficiency data in the ICR database inappropriate in the case of Western coals
• WEST Associates would like to work with other stakeholders and EPA to develop appropriate adjustment factors to coal rank-based MACT levels to enable continued use of Western coal