mercury in the global environment · mercury in the global environment patterns of global seafood...
TRANSCRIPT
Mercury in the Global Environment
Patterns of Global Seafood Mercury Concentrations and their Relationship with Human Health

2
Report Overview
Mercury, the Marine Environment, and Risk of Human Exposure
Mercury (Hg) is a pollutant of global importance that adversely impacts ecological and human health. Concentrations of mercury in the global environment have increased approximately three-fold as a result of anthropogenic activities, and the world’s oceans are one of the primary reservoirs where mercury is deposited (Mason et al. 2012).
The consumption of marine shellfish, fish, and marine mammals represents one of the primary pathways through which humans are exposed to mercury. However, there is a gap in our understanding about the relationship between anthropogenic releases of mercury into the environment, the subsequent biomagnification and bioaccumulation of mercury in seafood such as lobster, tuna, swordfish, and toothed whales, and how this translates to exposure and risks for humans, on local, regional, and global scales.
This report, produced by Biodiversity Research Institute (BRI), examines seafood mercury concentrations from existing reputable sources and presents collated data on different types of seafood with the goal of explaining the significance of these findings as they relate to ecological and human health.
The report provides insight into the species of marine organisms with greatest concentrations of mercury. These data are then related to global seafood capture data to provide insight into the potential risks associated with consumption of marine species with high mercury concentrations. These data also identify marine species within the global seafood market that have low average mercury concentrations. Results outlined in this report can contribute toward the development of national fish consumption advisories for mercury.
The Governing Council of the United Nations Environment Programme (UNEP) is taking action to develop a global, legally binding treaty designed to monitor and regulate mercury emissions.
BRI’s study highlights the global scale of mercury polution and reinforces UNEP’s efforts towards ratifiying a global mercury treaty.
Major Findings
l The extent of mercury contamination is ubiquitous in global marine ecosystems and likely varies because of associated contaminant sources and the sensitivity of ecosystems from the input of mercury through atmospheric deposition and watershed sources.
l Various marine organisms regularly harvested and consumed by people have mercury concentrations that commonly exceed safe levels and include commercial seafood such as lobster, tuna, swordfish; for subsistence-dependent communities that includes marine mammals such as small whales. Conversely, there are many commonly harvested species including shrimp, cod, haddock, herring, and sardines that have low body burdens of mercury.
l GBMS provides a standardized and comprehensive platform to identify geographic and taxonomic mercury data gaps, describe specific areas where further research is needed to better understand the biogeochemical mechanisms causing elevated mercury concentrations in biota, and examine temporal trends of key biotic indicators that can be linked to evaluating the effectiveness of the global legally binding instrument on mercury.

3
Global Biotic Mercury Synthesis (GBMS) Database
Biodiversity Research Institute (BRI) has compiled a Global Biotic Mercury Synthesis (GBMS) Database in association with the United Nations Environment Programme’s Mercury Air Transport and Fate Research Partnership Group.
The database contains biotic mercury concentrations from peer-reviewed publications and governmental sources. As a project of the Transport and Fate Partnership Group, the objectives are to:
1. Determine global spatial and temporal patterns of biotic mercury concentrations;
2. Identify species or groups of organisms that are of greatest concern for ecological and human health;
3. Locate global biological mercury hotspots, link with major mercury source types and determine if concern is related to contaminated sites or ecosystems sensitive to even small amounts of mercury input;
4. Distribute information in easy-to-access and understandable approaches for interested parties at local, regional, and global levels;
5. Use GBMS as a baseline to evaluate the effectiveness of the future global legally binding instrument of mercury.
GBMS represents a comprehensive, standardized, and cost effective approach for documenting and tracking changes in environmental loads of mercury as reflected in fish and wildlife. The use of key indicator organisms, such as apex marine predators, that are sensitive to environmental change is an integral part of a long-term monitoring program (see Evers et al. 2008; Chen et al. 2012).
The data included in GBMS represents an important opportunity to better integrate mercury science into important policy decisions related to the long-term conservation of marine resources (Lambert et al. 2012).
United Nations Environment Programme Global Treaty on Mercury
As a member of the Mercury Air Transport and Fate Research Partnership Group of the United Nations Environment Programme (UNEP), BRI is contributing toward the first international treaty of a globally binding treaty to monitor and regulate mercury emissions.
The goal is for the intergovernmental negotiating committee (INC) to complete a document for the Governing Council by the end of 2013.
In response to concerns brought forward by UNEP, BRI is developing a Global Biotic Mercury Synthesis database, which will determine global distribution of biotic mercury concentrations that affect human and ecological health.
Behind the DataMercury data were compiled on a global scale from published literature and governmental sources. From each reference, mercury concentrations were averaged (using arithmetic means) at each location for each species sampled.
Seafood mercury concentrations in the GBMS database are recorded as total mercury. Consumption guidelines generally refer to methylmercury concentrations in fish because that is the more toxic form of mercury. Methylmercury is known to impact neurological development in infants and is also linked to cardiovascular disease in adults (Clarkson et al. 2003; Valera et al. 2011). Because greater than 95 percent of the mercury in fish is in the form of methylmercury (Bloom 1992), total mercury concentrations within GMBS are not converted to methylmercury.
The database holds information about the organism sampled as well as associated ecological data. For displaying and comparing the data, mercury concentrations represent muscle tissue on a parts per million (ppm) wet weight (ww) basis. Mercury data on a dry weight basis was converted to ww using a percent moisture content of 80 percent unless otherwise known to be different. Samples analyzed in tissues other than muscle were converted to muscle tissue.

4
Figure 1. The global distribution of fish, including shark, and marine mammal mercury concentrations. The mercury concentration is presented in parts per million (ppm) on a wet weight (ww) basis.
Geographic DistributionGBMS allows for geographic representation and comparison among studies, geographic locations, time, and ecosystem types. Data for this report only represent marine organisms and are from 200 different references from 324 unique locations around the world, totaling 1,379 averaged mercury samples from 25,826 total individuals sampled (Fig. 1).
While mercury in fish from open oceans originates from atmospheric deposition, nearshore areas where many
subsistence fishing occurs is most influenced by mercury input through rivers and their watersheds.

5
Global Fish Mercury Concentrations
Figure 2. The average muscle Hg concentration in fish with standard deivation compared against consumption guidance levels (Table 1). These fish represent species regularly consumed and having average muscle Hg concentrations >0.22 ppm (ww).
Figure 3. The average muscle Hg concentration in fish with standard deivation compared against consumption guidance levels (Table 1). These fish represent species regularly consumed and having average muscle Hg concentrations <0.22 ppm (ww).
Seafood mercury concentrations are best known for fin fish. They are most studied in North America and Europe and least studied in Asia and South America (Karimi et al. 2012). However, even in the U.S., monitoring of seafood mercury concentrations needs improvement to ensure accurate exposure estimates over time (Sunderland 2007).
Globally, mercury concentrations are highest in large, long-lived pelagic species. Marlin (representing multiple species within the Istiophoridae family), Pacific bluefin tuna (which can approach 1,000 pounds), and the wide-ranging swordfish and king mackerel have the highest mercury concentrations of any fish in the GBMS database (Fig. 2). In addition, several other commonly consumed fish species have average mercury body burdens that exceed the consumption guidance of one meal per month (Fig. 2, Table 1). Conversely, there are 11 regularly harvested fish such as anchovy, sardines, flounder, cod, salmon, and haddock, which can be consumed weekly (Fig. 3).
While less than one percent of the world seafood harvest includes sharks (Fig. 5), shark meat is sought after in several European countries and the demand for certain shark products (e.g., fins) in Asia drives a rapidly expanding shark fishery globally (Vannuccini 1999; Musick and Musick 2011). Generally, mercury concentrations in sharks exceed safe consumption guidelines (Fig. 4). For shark species commonly encountered such as bull, lemon, and nurse sharks, average mercury concentrations compared globally indicate highest levels in the Mediterranean Sea and the Gulf of Mexico (Fig. 4 ; n = 5,929).

6
Interpreting Mercury Concentrations and Risks of Exposure
Oceanic Region
North Pacific (n = 135)
South Atlantic (n = 918)
North Atlantic (n = 612)
South Pacific (n = 864)
Indian (n = 328)
Gulf of Mexico-
Caribbean (n = 756)
Mediterranean (n = 2316)
Ave
rage
Hg
in m
uscl
e (p
pm, w
w)
0.0
2.0
4.0
8.0
Figure 4. The average muscle Hg concentration in three shark orders (Carcharhiniformes - Ground sharks, Lamniformes - Mackerel sharks, and Squaliformes - Dogfish) with standard deviation and sample size (n) by oceanic region.
Concentrations by Seafood GroupFor this report, fin fish and marine mammal mercury concentrations can be compared with consumption guidelines in Table 1.
To provide context, the mercury concentrations presented can be compared with the number of seafood meals that could be eaten at various mercury concentrations, in order to stay within the U.S. EPA’s health-based reference dose for methylmercury (see Table 1 for the fish meal limits by methylmercury concentration, and see U.S. EPA [2001] for details on how the fish meal limits were calculated).
Also for further reference, the World Health Organization and the European Commission’s fish mercury concentration guidance level is 1.0 ppm (ww), above which fish may not be sold commercially. This guidance level is very similar to the 0.95 ppm “no consumption” limit based on the USEPA-based guidelines.
Table 1. Seafood methylmercury concentrations and associated meal frequency guidelines. The guidance is based on the U.S. EPA reference dose of 1x10⁻⁴ mg/kg-day, a body weight of 132 pounds (60 kg) for an adult female person, and a fish meal size of about 6 ounces (170 grams). These guidelines could also be used for muscle tissues in marine mammals because >95% of Hg is in the methyl form. However, shellfish Hg concentrations greatly vary in percent methyl and therefore the consumption guidance provided here cannot be directly used with shellfish Hg data provided herein.
Methylmercury in seafood(ppm, ww)
Consumption Guidance
≤0.05 unrestricted
0.05-0.112 meals per
week
0.11-0.221 meal per
week
0.22-0.951 meal per
month
>0.95no
consumption
7
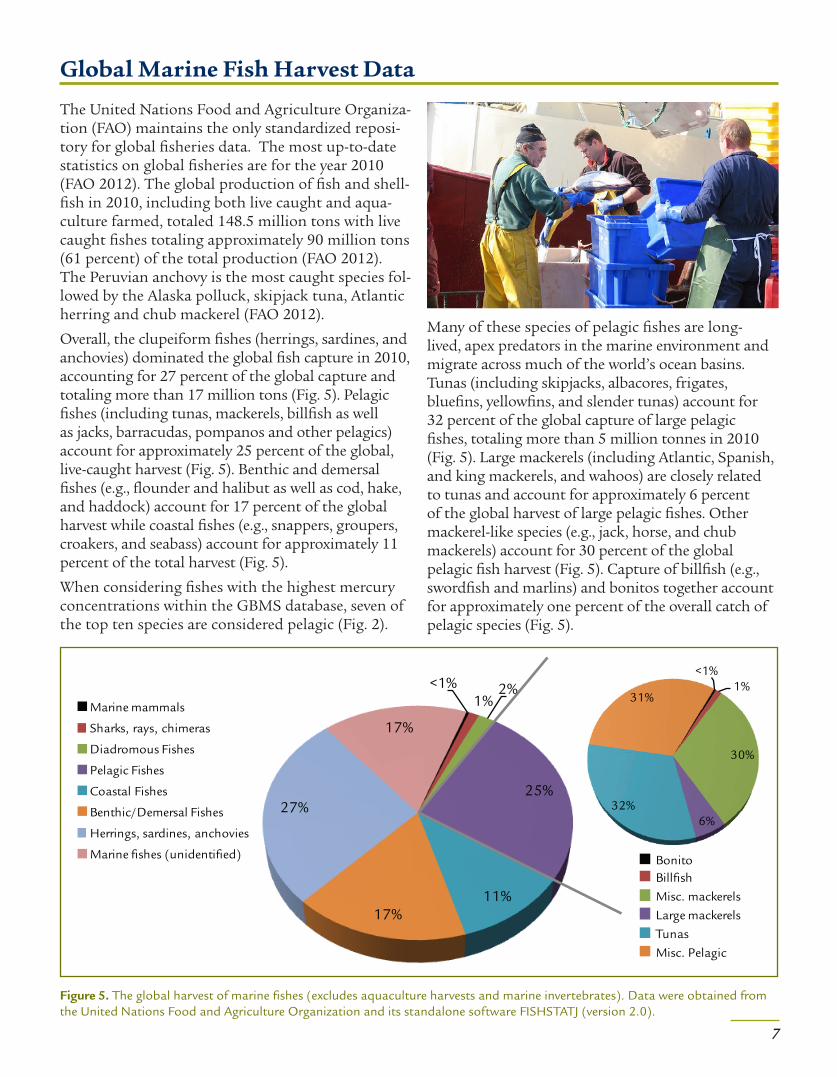
The United Nations Food and Agriculture Organiza-tion (FAO) maintains the only standardized reposi-tory for global fisheries data. The most up-to-date statistics on global fisheries are for the year 2010 (FAO 2012). The global production of fish and shell-fish in 2010, including both live caught and aqua-culture farmed, totaled 148.5 million tons with live caught fishes totaling approximately 90 million tons (61 percent) of the total production (FAO 2012). The Peruvian anchovy is the most caught species fol-lowed by the Alaska polluck, skipjack tuna, Atlantic herring and chub mackerel (FAO 2012).
Overall, the clupeiform fishes (herrings, sardines, and anchovies) dominated the global fish capture in 2010, accounting for 27 percent of the global capture and totaling more than 17 million tons (Fig. 5). Pelagic fishes (including tunas, mackerels, billfish as well as jacks, barracudas, pompanos and other pelagics) account for approximately 25 percent of the global, live-caught harvest (Fig. 5). Benthic and demersal fishes (e.g., flounder and halibut as well as cod, hake, and haddock) account for 17 percent of the global harvest while coastal fishes (e.g., snappers, groupers, croakers, and seabass) account for approximately 11 percent of the total harvest (Fig. 5).
When considering fishes with the highest mercury concentrations within the GBMS database, seven of the top ten species are considered pelagic (Fig. 2).
<1%1%
2%
25%
11%17%
27%
17%Marine mammals
Sharks, rays, chimeras
Diadromous Fishes
Pelagic Fishes
Coastal Fishes
Benthic/Demersal Fishes
Herrings, sardines, anchovies
Marine fishes (unidentified)
<1%1%
30%
6%32%
31%
BonitoBillfishMisc. mackerelsLarge mackerelsTunasMisc. Pelagic
Figure 5. The global harvest of marine fishes (excludes aquaculture harvests and marine invertebrates). Data were obtained from the United Nations Food and Agriculture Organization and its standalone software FISHSTATJ (version 2.0).
Global Marine Fish Harvest Data
Many of these species of pelagic fishes are long-lived, apex predators in the marine environment and migrate across much of the world’s ocean basins. Tunas (including skipjacks, albacores, frigates, bluefins, yellowfins, and slender tunas) account for 32 percent of the global capture of large pelagic fishes, totaling more than 5 million tonnes in 2010 (Fig. 5). Large mackerels (including Atlantic, Spanish, and king mackerels, and wahoos) are closely related to tunas and account for approximately 6 percent of the global harvest of large pelagic fishes. Other mackerel-like species (e.g., jack, horse, and chub mackerels) account for 30 percent of the global pelagic fish harvest (Fig. 5). Capture of billfish (e.g., swordfish and marlins) and bonitos together account for approximately one percent of the overall catch of pelagic species (Fig. 5).

8
Data from the United Nations Food and Agriculture Organization (FAO) state that nearly 40 percent of the global fish production enters international markets for either direct consumption or food processing (FAO 2012).
Tuna is consistently among the top five commodities in the global fish market. Yellowfin, skipjack, and albacore are the most common species utilized by the tuna canning industry, while bluefin tuna is highly sought after for direct consumption (FAO 2004).
Based on models by Sunderland et al. (2009), present atmospheric mercury deposition rates will result in mercury concentrations doubling in the North Pacific Ocean by 2050; such deposition rates are suspected to result in significant increases in pelagic marine fish, such as the Pacific bluefin tuna, if methylmercury production mimics projected mercury additions.
Tuna Species
Yellowfin tuna (n = 118)
Skipjack tuna (n = 10)
Albacore tuna (n = 81)
Bigeye tuna (n = 50)
Pacific bluefin tuna (n = 62)
Fish
Har
vest
ed (
tons
)
0
50,000
100,000
150,000
200,000
250,000
Ave
rage
Hg
in M
uscl
e (p
pm, w
w)
0.0
0.5
1.0
1.5
2.0tonsHg Average withstandard deviation
Figure 6. The Pacific Ocean tuna harvest by species in 2010 (FAO 2012) compared to the average muscle Hg concentration in each species with standard deviation captured in the Pacific Ocean.
Case Study: Tuna Mercury and Global Harvest

9
Marine shellfish accounted for approximately 23 percent of the global fishery and aquaculture harvest in 2010; shellfish, particularly shrimp, are considered the most highly valued commodity on the global fish market (FAO 2012).
The composition of the global shellfish harvest is dominated by three main taxonomic groups including shrimps and prawns (28 percent); cephalopods such as squids, octopuses, and cuttlefish (15 percent), and molluscs (14.5 percent) including clams, mussels, scallops, and other bivalves.
The Food and Agriculture Organization (FAO), in
collaboration with the World Health Organization (WHO), recently reviewed the risks and benefits of fish and shellfish consumption and provides mean mercury concentrations for a wide range of shellfish that are commonly consumed (FAO/WHO 2010). Mean mercury concentrations in shellfish vary by almost an order of magnitude (Figure 7).
Mussels such as clams and scallops have a mean total mercury concentration of approximately 0.02 ppm, wet weight (ww) while the American lobster has a mean THg of 0.22 ppm, ww. Squids account for the largest percentage of
cephalopods captured from the world’s oceans (~77 percent) and have a mean THg of 0.1 ppm, ww.
Figure 7. Total Hg concentrations in shellfish. Data are derived from a dataset without standard deviations or the spatial distribution of samples (FAO/WHO 2011).
Case Study: Shellfish Mercury and Global Harvest

10
While tracking seafood mercury concentrations commonly emphasizes shellfish and fish, marine mammals should also be considered for human health assessment purposes. Marine mammals are a traditional component of the diet of many subsistence communities around the world, particularly in the Arctic. Long-range transport of mercury at lower latitudes regularly moves to higher latitudes of the Arctic and there is now added concern that warmer temperatures may be rapidly remobilizing formerly bound mercury stores from thawing glaciers, sediment, and permafrost (AMAP 2011).
Increased levels of mercury in fish and wildlife within the Arctic may be resulting from increasing mercury inputs and changes in the Arctic ecosystems. Based on data collected from our GBMS, average marine mammal muscle tissue mercury concentrations are generally above safe consumption levels in all ocean basins, except the Antarctic Ocean (Fig. 8; n=3,109). Because human communities within the Arctic Ocean can have great dependency on marine mammals, mercury concentrations in dietary items are of especial concern.
Beluga and narwhals are commonly harvested and often have muscle mercury concentrations that exceed human health consumption guidelines of one meal per month (i.e., based on mercury concentrations between 0.22 and 0.92 ppm, ww). The effect thresholds for marine mammals are poorly understood, but based on mercury effect thresholds for terrestrial mammals, there could be significant adverse impacts on the reproductive success of marine mammals.
Continent
Africa (n = 118)
Americas (n = 1848)
Oceania (n = 69)
Europe (n = 606)
Asia (n = 468)
Cap
ture
(in
divi
dual
s)
0
5,000
10,000
75,000
100,000
125,000
150,000
175,000
Ave
rage
Hg
in m
uscl
e (p
pm, w
w)
0.0
2.0
4.0
6.0
12.0
14.0
16.0
captures Hg Average withstandard deviation
Figure 8. The average muscle Hg concentration in toothed marine mammals (Odontoceti) with standard deviation and sample size (n) by continent and capture data from 2010 (FAO 2012).
Case Study: Mercury in Marine Mammals and Global Harvest
Arctic Monitoring and Assessment ProgrammeThe Arctic Monitoring and Assessment Programme (AMAP), part of the Arctic Council, provides information on the status of, and threats to, the Arctic environment, and scientific advice on actions to be taken in order to support Arctic governments in their efforts to take remedial and preventive actions relating to contaminants, such as mercury.
The GBMS database has and will continue to incorporate marine mammal and other Arctic biota mercury datasets and will serve as a resource for AMAP goals.

11
References
Arctic Monitoring and Assessment Program [AMAP]. 2011. AMAP Assessment 2011: Mercury in the Arctic. Arctic Monitoring and Assessment Programme (AMAP). Oslo, Norway. 193 pp.
Bloom, N.S. 1992. On the chemical form of mercury in edible fish and marine invertebrate tissue. Canadian Journal of Fisheries and Aquatic Sciences 49: 1010-1017.
Chen, C.Y., C.T. Driscoll, K.F. Lambert, R.P. Mason, L.R. Rardin, C.V. Schmitt, N.S. Serrel, and E.M. Sunderland. 2012. Sources to Seafood: Mercury pollution in the marine environment. Hanover, NH: Toxic Metals Superfund Research Program, Dartmouth College.
Clarkson, T. W., Magos, L., & Myers, G. J. 2003. The toxicology of mercury—current exposures and clinical manifestations. The New England journal of medicine, 349(18), 1731–7.
Evers, D.C., R.P. Mason, N.C. Kamman, C.Y. Chen, A.L. Bogomolni, D.H. Taylor, C.R. Hammerschmidt, S.H. Jones, N.M. Burgess, K. Munney, K.C. Parsons. 2008. An integrated mercury monitoring program for temperate estuarine and marine ecosystems on the North American Atlantic Coast. EcoHealth 5:426-441.
European Commission. 2002. Commission regulation (EC) No 221/2002, amending regulation (EC) No 466/2001 setting maximum levels for certain contaminates in foodstuffs.
Food and Agriculture Organization [FAO]. 2004. World Tuna Markets. FAO Globe fish Research Programme 74. Rome, FAO. 104 pp.
Food and Agriculture Organization [FAO]. 2012. FAO yearbook. Fishery and Aquaculture Statistics, 2010. Rome, FAO. 78 pp.
Food and Agriculture Organization [FAO]/World Health Organization [WHO]. 2011. Report of the Joint FAO/WHO Expert Consultation on the Risks and Benefits of Fish Consumption. Rome, Food and Agriculture Organization of the United Nations; Geneva, World Health Organization. 50 pp.
Karimi, R., T.P. Fitzgerald, and N.S. Fisher. 2012. A quantitative synthesis of mercury in commercial seafood and implications for exposure in the U.S. Environ. Health Perspectives. http://dx.doi.org doi.org/10.1289/ehp.1205122.
Lambert, K.F., D.C. Evers, K.A. Warner, S.L. King, and N.E. Selin. 2012. Integrating mercury science and policy in the marine context: Challenges and opportunities. Environmental Research, http://dx.doi.org/10.1016/j.envres.2012.06.002.
Mason, R.P., A.L. Choi, W.F. Fitzgerald, C.R. Hammerschmidt, C.H. Lamborg, A.L. Soerensen, and E.M. Sunderland. 2012. Mercury biogeochemical cycling in the ocean and policy implications. Environmental Research, http://dx.doi.org/10.1016/j.envres.2012.03.013.
Musick, J.A. and S. Musick. 2011. Sharks. FAO Fisheries and Aquaculture Reviews and Studies. Rome, FAO 13 p.
Sunderland, E.M., D.P. Krabbenhoft, J.W. Moreau, S.A. Strode, and W.M. Landing. 2009. Mercury sources, distribution, and bioavailability in the North Pacific Ocean: Insights from data and models. Global Biogeochemical Cycles 23: GB2010. 14 pp.
Sunderland, E.M. 2007. Mercury exposure from domestic and imported estuarine and marine fish in the U.S. seafood market. Environ. Health Perspectives 115:235-242.
United States Environmental Protection Agency [USEPA]. 2001. Water quality for the protection of human health: methylmercury. EPA-823-R-01-001, USEPA, Office of Science and Technology, Office of Water, Washington, D.C. 20460.
Valera, B., Dewailly, E., & Poirier, P. 2011. Impact of mercury exposure on blood pressure and cardiac autonomic activity among Cree adults (James Bay, Quebec, Canada). Environmental research, 111(8), 1265–70.
Vannuccini, S. 1999. Shark utilization, marketing and trade. FAO Fisheries Technical Paper, N0. 389. Rome, FAO. 470 p.
Zero Mercury Working Group [ZMWG]. 2009. Mercury in fish, a global health hazard. Mercury Policy Project. http://mercurypolicy.org/wp-content/uploads/2009/02/MercuryInFishFullReportFinal021009.pdf.
CreditsMaps: p. 4: Madeline Turnquist; back cover: Ian Johnson. Source/citation: ESRI, i-cubed, USDA, USGS, AEX, GeoEye, Getmapping, Aerogrid, IGN , IGP and the GIS User Community.
Photography: Cover – Flikr WorldFish7; p. 2 Flikr WorldFish6; p.4 Flikr WorldFish4; p. 6 Flckr StormyDog; p. 7 Flckr-thehealthyIrishman; p. 9 iStock; p. 10 flckr Joyous King.
Suggested Citation for this ReportEvers, D.C., Turnquist, M.A., and Buck, D.G. 2012. Patterns of global seafood mercury concentrations and their relationship with human health, version 3. Biodiversity Research Institute. Gorham, Maine. BRI Science Communications Series 2012-45. 12 pages.
For copies of this report, please contact: Madeline Turnquist BRI’s Center for Mercury Research [email protected] www.briloon.org/hgcenter
Biodiversity Research Institute’s mission is to assess emerging threats to wildlife and ecosystems through collaborative research
and to use scientific findings to advance environmental awareness and inform
decision makers.

19 Flaggy Meadow Road, Gorham, Maine 03048 phone 207-839-7600
fax 207-887-7164
www.briloon.org