merck & co., inc. financial highlights package
TRANSCRIPT
Merck & Co., Inc.
Financial Highlights Package
Fourth Quarter 2016
Table of Contents
Table 1: GAAP P&L ..........................................................................1
Table 1a: GAAP P&L – Current Year and Prior Year by Quarter ......2
Table 2a: GAAP to Non-GAAP Reconciliation 4Q16 ........................3
Table 2b: GAAP to Non-GAAP Reconciliation Dec YTD 16 .............4
Table 2c: GAAP to Non-GAAP Reconciliation 4Q15 .........................5
Table 2d: GAAP to Non-GAAP Reconciliation Dec YTD 15 .............6
Table 3: Sales – Current Year and Prior Year by Quarter ...............7
Table 3a: Sales – U.S. / Ex- U.S. 4Q16 ............................................8
Table 3b: Sales – U.S. / Ex- U.S. Dec YTD 16 .................................9
Table 3c: Sales – Pharmaceutical Geographic Split ...................... 10
Table 4: Other (Income) Expense ................................................ 11
Supplement to 4Q 2016
Earnings Release
This Financial Highlights Package has been revised to include the impairment charge related to uprifosbuvir and other items as disclosed in the 8-K filed by the Company on February 23, 2017.
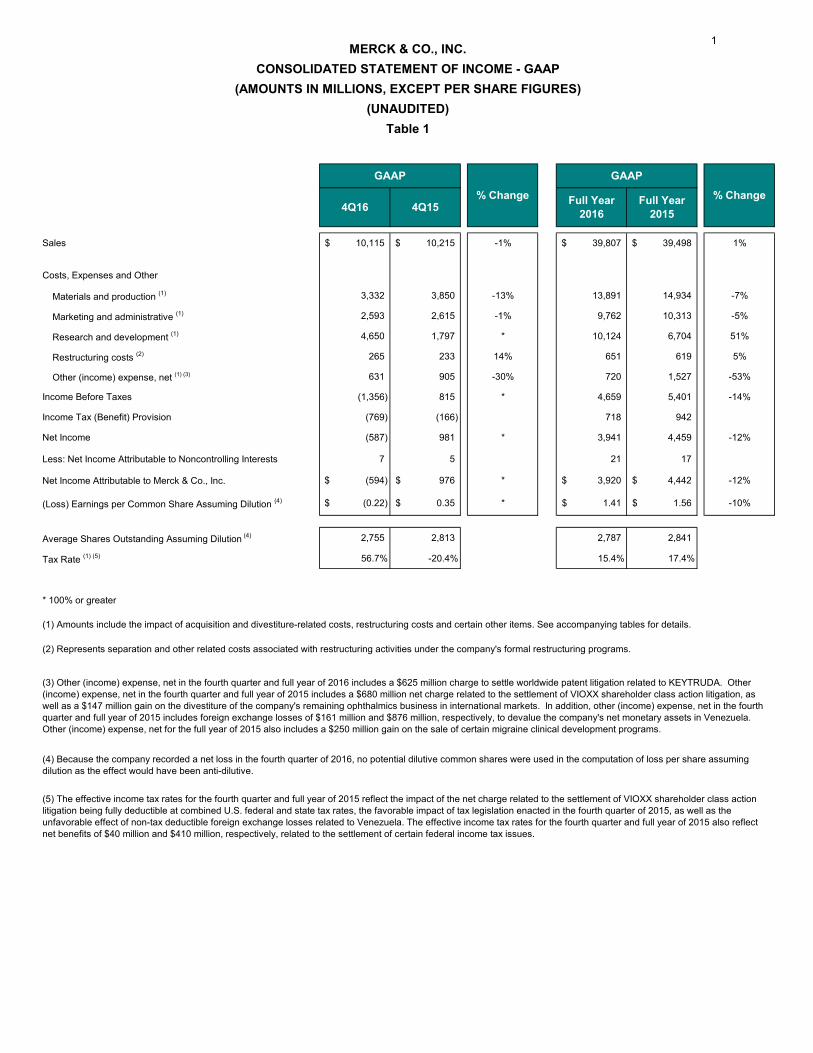
Sales 10,115$ 10,215$ -1% 39,807$ 39,498$ 1%
Costs, Expenses and Other
Materials and production (1) 3,332 3,850 -13% 13,891 14,934 -7%
Marketing and administrative (1) 2,593 2,615 -1% 9,762 10,313 -5%
Research and development (1) 4,650 1,797 * 10,124 6,704 51%
Restructuring costs (2) 265 233 14% 651 619 5%
Other (income) expense, net (1) (3) 631 905 -30% 720 1,527 -53%
Income Before Taxes (1,356) 815 * 4,659 5,401 -14%
Income Tax (Benefit) Provision (769) (166) 718 942
Net Income (587) 981 * 3,941 4,459 -12%
Less: Net Income Attributable to Noncontrolling Interests 7 5 21 17
Net Income Attributable to Merck & Co., Inc. (594)$ 976$ * 3,920$ 4,442$ -12%
(Loss) Earnings per Common Share Assuming Dilution (4) (0.22)$ 0.35$ * 1.41$ 1.56$ -10%
Average Shares Outstanding Assuming Dilution (4) 2,755 2,813 2,787 2,841
Tax Rate (1) (5) 56.7% -20.4% 15.4% 17.4%
* 100% or greater
MERCK & CO., INC.CONSOLIDATED STATEMENT OF INCOME - GAAP
(AMOUNTS IN MILLIONS, EXCEPT PER SHARE FIGURES)(UNAUDITED)
Table 1
Full Year 20154Q154Q16
GAAP
(5) The effective income tax rates for the fourth quarter and full year of 2015 reflect the impact of the net charge related to the settlement of VIOXX shareholder class action litigation being fully deductible at combined U.S. federal and state tax rates, the favorable impact of tax legislation enacted in the fourth quarter of 2015, as well as the unfavorable effect of non-tax deductible foreign exchange losses related to Venezuela. The effective income tax rates for the fourth quarter and full year of 2015 also reflect net benefits of $40 million and $410 million, respectively, related to the settlement of certain federal income tax issues.
% Change
(3) Other (income) expense, net in the fourth quarter and full year of 2016 includes a $625 million charge to settle worldwide patent litigation related to KEYTRUDA. Other (income) expense, net in the fourth quarter and full year of 2015 includes a $680 million net charge related to the settlement of VIOXX shareholder class action litigation, as well as a $147 million gain on the divestiture of the company's remaining ophthalmics business in international markets. In addition, other (income) expense, net in the fourth quarter and full year of 2015 includes foreign exchange losses of $161 million and $876 million, respectively, to devalue the company's net monetary assets in Venezuela. Other (income) expense, net for the full year of 2015 also includes a $250 million gain on the sale of certain migraine clinical development programs.
(1) Amounts include the impact of acquisition and divestiture-related costs, restructuring costs and certain other items. See accompanying tables for details.
(2) Represents separation and other related costs associated with restructuring activities under the company's formal restructuring programs.
GAAP
% ChangeFull Year 2016
(4) Because the company recorded a net loss in the fourth quarter of 2016, no potential dilutive common shares were used in the computation of loss per share assuming dilution as the effect would have been anti-dilutive.
1
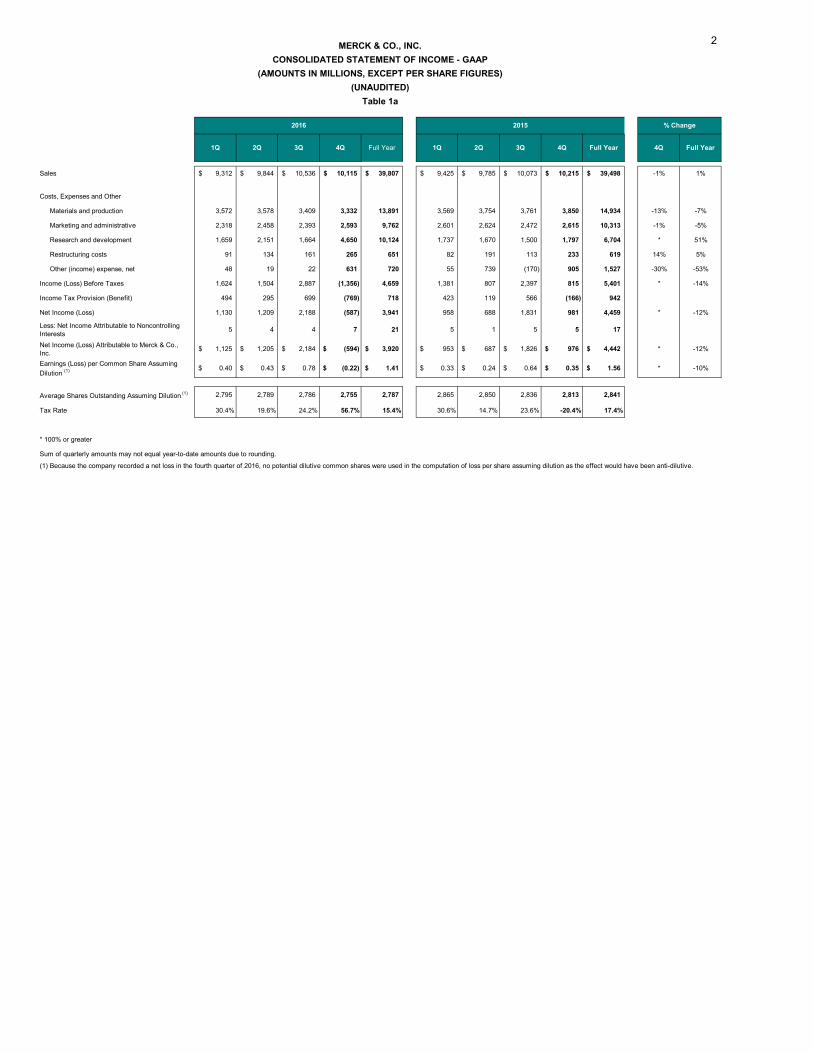
. .Sales 9,312$ 9,844$ 10,536$ 10,115$ 39,807$ 9,425$ 9,785$ 10,073$ 10,215$ 39,498$ -1% 1%
Costs, Expenses and Other
Materials and production 3,572 3,578 3,409 3,332 13,891 3,569 3,754 3,761 3,850 14,934 -13% -7%
Marketing and administrative 2,318 2,458 2,393 2,593 9,762 2,601 2,624 2,472 2,615 10,313 -1% -5%
Research and development 1,659 2,151 1,664 4,650 10,124 1,737 1,670 1,500 1,797 6,704 * 51%
Restructuring costs 91 134 161 265 651 82 191 113 233 619 14% 5%
Other (income) expense, net 48 19 22 631 720 55 739 (170) 905 1,527 -30% -53%
Income (Loss) Before Taxes 1,624 1,504 2,887 (1,356) 4,659 1,381 807 2,397 815 5,401 * -14%
Income Tax Provision (Benefit) 494 295 699 (769) 718 423 119 566 (166) 942
Net Income (Loss) 1,130 1,209 2,188 (587) 3,941 958 688 1,831 981 4,459 * -12%
Less: Net Income Attributable to Noncontrolling Interests
5 4 4 7 21 5 1 5 5 17
Net Income (Loss) Attributable to Merck & Co., Inc.
1,125$ 1,205$ 2,184$ (594)$ 3,920$ 953$ 687$ 1,826$ 976$ 4,442$ * -12%
Earnings (Loss) per Common Share Assuming Dilution (1) 0.40$ 0.43$ 0.78$ (0.22)$ 1.41$ 0.33$ 0.24$ 0.64$ 0.35$ 1.56$ * -10%
Average Shares Outstanding Assuming Dilution (1) 2,795 2,789 2,786 2,755 2,787 2,865 2,850 2,836 2,813 2,841
Tax Rate 30.4% 19.6% 24.2% 56.7% 15.4% 30.6% 14.7% 23.6% -20.4% 17.4%
* 100% or greater
Sum of quarterly amounts may not equal year-to-date amounts due to rounding.
(1) Because the company recorded a net loss in the fourth quarter of 2016, no potential dilutive common shares were used in the computation of loss per share assuming dilution as the effect would have been anti-dilutive.
MERCK & CO., INC.CONSOLIDATED STATEMENT OF INCOME - GAAP
(AMOUNTS IN MILLIONS, EXCEPT PER SHARE FIGURES)(UNAUDITED)
Table 1a
3Q Full Year
% Change2016
1Q 2Q 3Q 4Q
2015
1Q 4Q2Q4Q Full Year Full Year
2
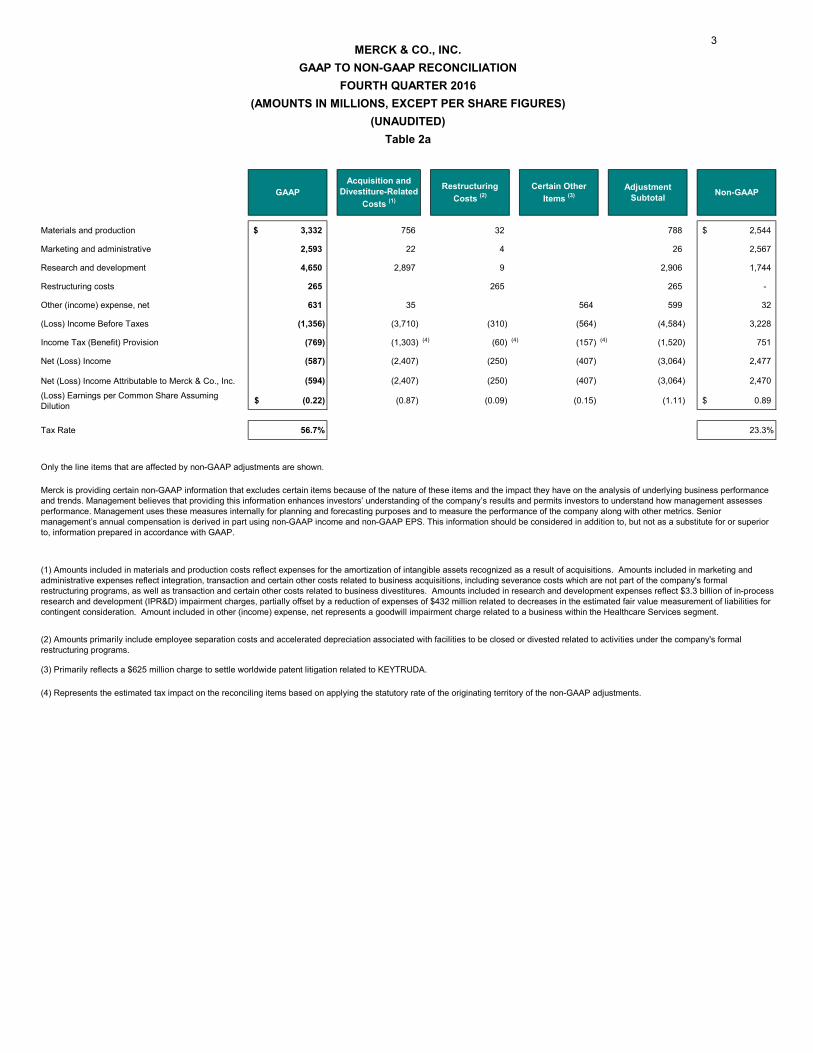
Materials and production 3,332$ 756 32 788 2,544$
Marketing and administrative 2,593 22 4 26 2,567
Research and development 4,650 2,897 9 2,906 1,744
Restructuring costs 265 265 265 -
Other (income) expense, net 631 35 564 599 32
(Loss) Income Before Taxes (1,356) (3,710) (310) (564) (4,584) 3,228
Income Tax (Benefit) Provision (769) (1,303) (4) (60) (4) (157) (4) (1,520) 751
Net (Loss) Income (587) (2,407) (250) (407) (3,064) 2,477
Net (Loss) Income Attributable to Merck & Co., Inc. (594) (2,407) (250) (407) (3,064) 2,470
(Loss) Earnings per Common Share Assuming Dilution (0.22)$ (0.87) (0.09) (0.15) (1.11) 0.89$
Tax Rate 56.7% 23.3%
Only the line items that are affected by non-GAAP adjustments are shown.
(4) Represents the estimated tax impact on the reconciling items based on applying the statutory rate of the originating territory of the non-GAAP adjustments.
Merck is providing certain non-GAAP information that excludes certain items because of the nature of these items and the impact they have on the analysis of underlying business performance and trends. Management believes that providing this information enhances investors’ understanding of the company’s results and permits investors to understand how management assesses performance. Management uses these measures internally for planning and forecasting purposes and to measure the performance of the company along with other metrics. Senior management’s annual compensation is derived in part using non-GAAP income and non-GAAP EPS. This information should be considered in addition to, but not as a substitute for or superior to, information prepared in accordance with GAAP.
(1) Amounts included in materials and production costs reflect expenses for the amortization of intangible assets recognized as a result of acquisitions. Amounts included in marketing and administrative expenses reflect integration, transaction and certain other costs related to business acquisitions, including severance costs which are not part of the company's formal restructuring programs, as well as transaction and certain other costs related to business divestitures. Amounts included in research and development expenses reflect $3.3 billion of in-process research and development (IPR&D) impairment charges, partially offset by a reduction of expenses of $432 million related to decreases in the estimated fair value measurement of liabilities for contingent consideration. Amount included in other (income) expense, net represents a goodwill impairment charge related to a business within the Healthcare Services segment.
(2) Amounts primarily include employee separation costs and accelerated depreciation associated with facilities to be closed or divested related to activities under the company's formal restructuring programs.
Adjustment Subtotal Non-GAAPGAAP
Acquisition and Divestiture-Related
Costs (1)
Restructuring Costs (2)
Certain Other Items (3)
(3) Primarily reflects a $625 million charge to settle worldwide patent litigation related to KEYTRUDA.
Table 2a
MERCK & CO., INC.GAAP TO NON-GAAP RECONCILIATION
FOURTH QUARTER 2016(AMOUNTS IN MILLIONS, EXCEPT PER SHARE FIGURES)
(UNAUDITED)
3
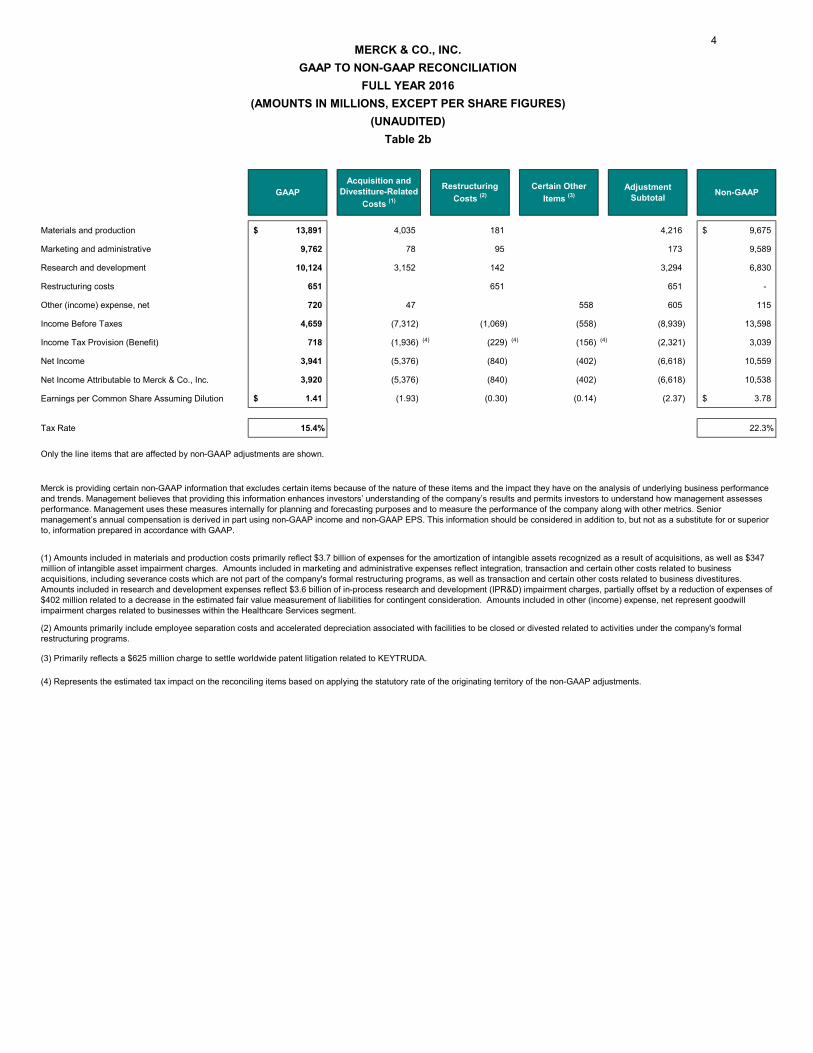
Materials and production 13,891$ 4,035 181 4,216 9,675$
Marketing and administrative 9,762 78 95 173 9,589
Research and development 10,124 3,152 142 3,294 6,830
Restructuring costs 651 651 651 -
Other (income) expense, net 720 47 558 605 115
Income Before Taxes 4,659 (7,312) (1,069) (558) (8,939) 13,598
Income Tax Provision (Benefit) 718 (1,936) (4) (229) (4) (156) (4) (2,321) 3,039
Net Income 3,941 (5,376) (840) (402) (6,618) 10,559
Net Income Attributable to Merck & Co., Inc. 3,920 (5,376) (840) (402) (6,618) 10,538
Earnings per Common Share Assuming Dilution 1.41$ (1.93) (0.30) (0.14) (2.37) 3.78$
Tax Rate 15.4% 22.3%
Only the line items that are affected by non-GAAP adjustments are shown.
(4) Represents the estimated tax impact on the reconciling items based on applying the statutory rate of the originating territory of the non-GAAP adjustments.
(UNAUDITED)
(1) Amounts included in materials and production costs primarily reflect $3.7 billion of expenses for the amortization of intangible assets recognized as a result of acquisitions, as well as $347 million of intangible asset impairment charges. Amounts included in marketing and administrative expenses reflect integration, transaction and certain other costs related to business acquisitions, including severance costs which are not part of the company's formal restructuring programs, as well as transaction and certain other costs related to business divestitures. Amounts included in research and development expenses reflect $3.6 billion of in-process research and development (IPR&D) impairment charges, partially offset by a reduction of expenses of $402 million related to a decrease in the estimated fair value measurement of liabilities for contingent consideration. Amounts included in other (income) expense, net represent goodwill impairment charges related to businesses within the Healthcare Services segment.
(2) Amounts primarily include employee separation costs and accelerated depreciation associated with facilities to be closed or divested related to activities under the company's formal restructuring programs.
(3) Primarily reflects a $625 million charge to settle worldwide patent litigation related to KEYTRUDA.
MERCK & CO., INC.GAAP TO NON-GAAP RECONCILIATION
FULL YEAR 2016(AMOUNTS IN MILLIONS, EXCEPT PER SHARE FIGURES)
Merck is providing certain non-GAAP information that excludes certain items because of the nature of these items and the impact they have on the analysis of underlying business performance and trends. Management believes that providing this information enhances investors’ understanding of the company’s results and permits investors to understand how management assesses performance. Management uses these measures internally for planning and forecasting purposes and to measure the performance of the company along with other metrics. Senior management’s annual compensation is derived in part using non-GAAP income and non-GAAP EPS. This information should be considered in addition to, but not as a substitute for or superior to, information prepared in accordance with GAAP.
Table 2b
GAAPAcquisition and
Divestiture-Related Costs (1)
Restructuring Costs (2)
Certain Other Items (3)
Adjustment Subtotal Non-GAAP
4
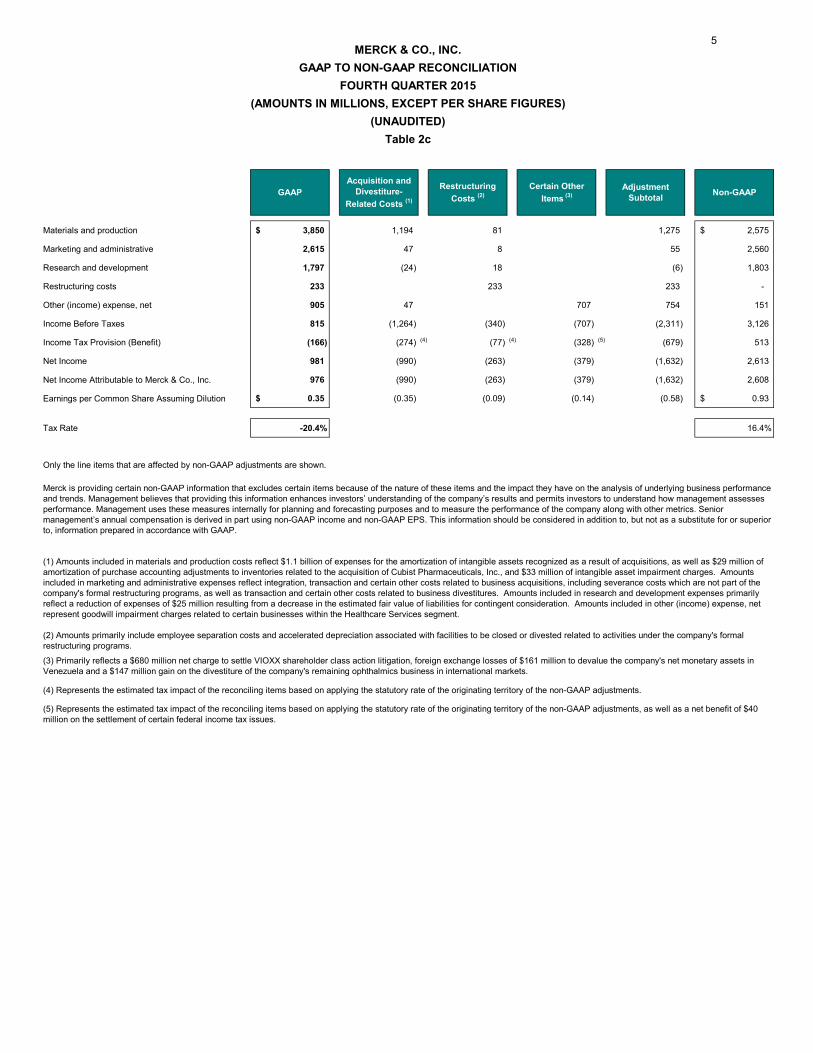
Materials and production 3,850$ 1,194 81 1,275 2,575$
Marketing and administrative 2,615 47 8 55 2,560
Research and development 1,797 (24) 18 (6) 1,803
Restructuring costs 233 233 233 -
Other (income) expense, net 905 47 707 754 151
Income Before Taxes 815 (1,264) (340) (707) (2,311) 3,126
Income Tax Provision (Benefit) (166) (274) (4) (77) (4) (328) (5) (679) 513
Net Income 981 (990) (263) (379) (1,632) 2,613
Net Income Attributable to Merck & Co., Inc. 976 (990) (263) (379) (1,632) 2,608
Earnings per Common Share Assuming Dilution 0.35$ (0.35) (0.09) (0.14) (0.58) 0.93$
Tax Rate -20.4% 16.4%
Only the line items that are affected by non-GAAP adjustments are shown.
(UNAUDITED)
MERCK & CO., INC.GAAP TO NON-GAAP RECONCILIATION
FOURTH QUARTER 2015(AMOUNTS IN MILLIONS, EXCEPT PER SHARE FIGURES)
Table 2c
GAAPAcquisition and
Divestiture-Related Costs (1)
Restructuring Costs (2)
Certain Other Items (3)
Adjustment Subtotal Non-GAAP
(5) Represents the estimated tax impact of the reconciling items based on applying the statutory rate of the originating territory of the non-GAAP adjustments, as well as a net benefit of $40 million on the settlement of certain federal income tax issues.
Merck is providing certain non-GAAP information that excludes certain items because of the nature of these items and the impact they have on the analysis of underlying business performance and trends. Management believes that providing this information enhances investors’ understanding of the company’s results and permits investors to understand how management assesses performance. Management uses these measures internally for planning and forecasting purposes and to measure the performance of the company along with other metrics. Senior management’s annual compensation is derived in part using non-GAAP income and non-GAAP EPS. This information should be considered in addition to, but not as a substitute for or superior to, information prepared in accordance with GAAP.
(1) Amounts included in materials and production costs reflect $1.1 billion of expenses for the amortization of intangible assets recognized as a result of acquisitions, as well as $29 million of amortization of purchase accounting adjustments to inventories related to the acquisition of Cubist Pharmaceuticals, Inc., and $33 million of intangible asset impairment charges. Amounts included in marketing and administrative expenses reflect integration, transaction and certain other costs related to business acquisitions, including severance costs which are not part of the company's formal restructuring programs, as well as transaction and certain other costs related to business divestitures. Amounts included in research and development expenses primarily reflect a reduction of expenses of $25 million resulting from a decrease in the estimated fair value of liabilities for contingent consideration. Amounts included in other (income) expense, net represent goodwill impairment charges related to certain businesses within the Healthcare Services segment.
(2) Amounts primarily include employee separation costs and accelerated depreciation associated with facilities to be closed or divested related to activities under the company's formal restructuring programs.
(3) Primarily reflects a $680 million net charge to settle VIOXX shareholder class action litigation, foreign exchange losses of $161 million to devalue the company's net monetary assets in Venezuela and a $147 million gain on the divestiture of the company's remaining ophthalmics business in international markets.
(4) Represents the estimated tax impact of the reconciling items based on applying the statutory rate of the originating territory of the non-GAAP adjustments.
5
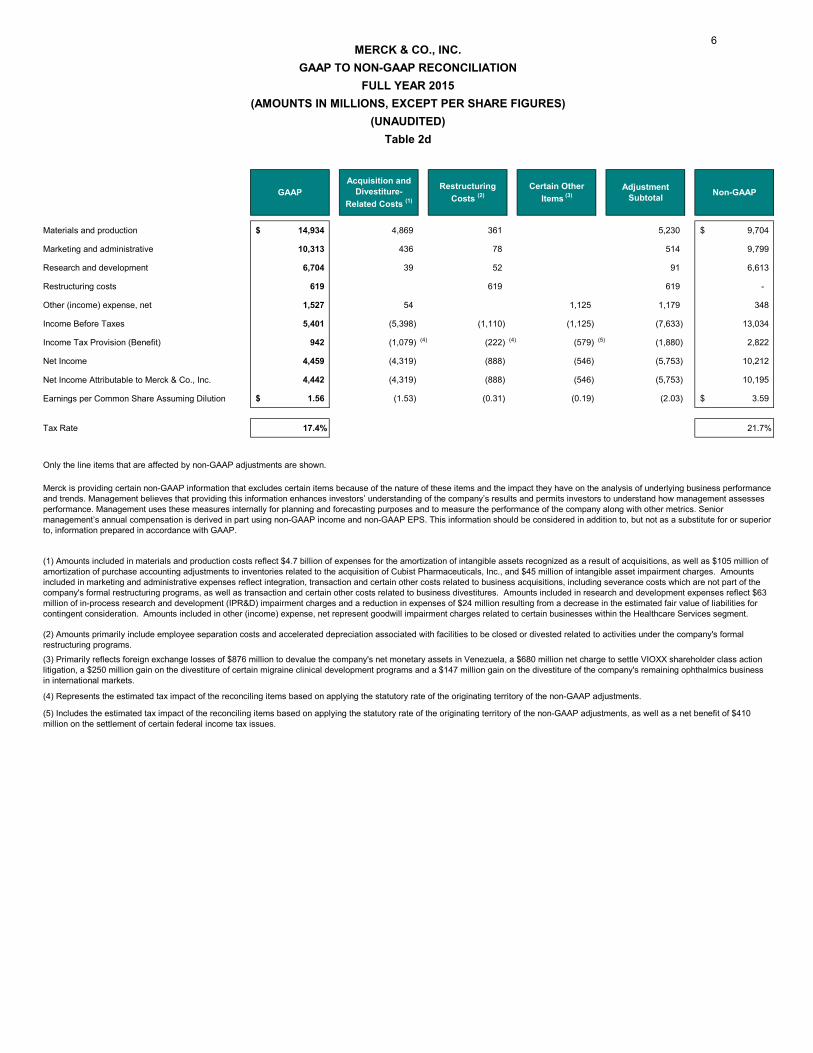
Materials and production 14,934$ 4,869 361 5,230 9,704$
Marketing and administrative 10,313 436 78 514 9,799
Research and development 6,704 39 52 91 6,613
Restructuring costs 619 619 619 -
Other (income) expense, net 1,527 54 1,125 1,179 348
Income Before Taxes 5,401 (5,398) (1,110) (1,125) (7,633) 13,034
Income Tax Provision (Benefit) 942 (1,079) (4) (222) (4) (579) (5) (1,880) 2,822
Net Income 4,459 (4,319) (888) (546) (5,753) 10,212
Net Income Attributable to Merck & Co., Inc. 4,442 (4,319) (888) (546) (5,753) 10,195
Earnings per Common Share Assuming Dilution 1.56$ (1.53) (0.31) (0.19) (2.03) 3.59$
Tax Rate 17.4% 21.7%
Only the line items that are affected by non-GAAP adjustments are shown.
(UNAUDITED)
MERCK & CO., INC.GAAP TO NON-GAAP RECONCILIATION
FULL YEAR 2015(AMOUNTS IN MILLIONS, EXCEPT PER SHARE FIGURES)
Table 2d
GAAPAcquisition and
Divestiture-Related Costs (1)
Restructuring Costs (2)
Certain Other Items (3)
Adjustment Subtotal Non-GAAP
(5) Includes the estimated tax impact of the reconciling items based on applying the statutory rate of the originating territory of the non-GAAP adjustments, as well as a net benefit of $410 million on the settlement of certain federal income tax issues.
Merck is providing certain non-GAAP information that excludes certain items because of the nature of these items and the impact they have on the analysis of underlying business performance and trends. Management believes that providing this information enhances investors’ understanding of the company’s results and permits investors to understand how management assesses performance. Management uses these measures internally for planning and forecasting purposes and to measure the performance of the company along with other metrics. Senior management’s annual compensation is derived in part using non-GAAP income and non-GAAP EPS. This information should be considered in addition to, but not as a substitute for or superior to, information prepared in accordance with GAAP.
(1) Amounts included in materials and production costs reflect $4.7 billion of expenses for the amortization of intangible assets recognized as a result of acquisitions, as well as $105 million of amortization of purchase accounting adjustments to inventories related to the acquisition of Cubist Pharmaceuticals, Inc., and $45 million of intangible asset impairment charges. Amounts included in marketing and administrative expenses reflect integration, transaction and certain other costs related to business acquisitions, including severance costs which are not part of the company's formal restructuring programs, as well as transaction and certain other costs related to business divestitures. Amounts included in research and development expenses reflect $63 million of in-process research and development (IPR&D) impairment charges and a reduction in expenses of $24 million resulting from a decrease in the estimated fair value of liabilities for contingent consideration. Amounts included in other (income) expense, net represent goodwill impairment charges related to certain businesses within the Healthcare Services segment.
(2) Amounts primarily include employee separation costs and accelerated depreciation associated with facilities to be closed or divested related to activities under the company's formal restructuring programs.
(3) Primarily reflects foreign exchange losses of $876 million to devalue the company's net monetary assets in Venezuela, a $680 million net charge to settle VIOXX shareholder class action litigation, a $250 million gain on the divestiture of certain migraine clinical development programs and a $147 million gain on the divestiture of the company's remaining ophthalmics business in international markets.
(4) Represents the estimated tax impact of the reconciling items based on applying the statutory rate of the originating territory of the non-GAAP adjustments.
6
1Q 2Q 3Q 4Q Full Year 1Q 2Q 3Q 4Q Full Year 4Q Full Year
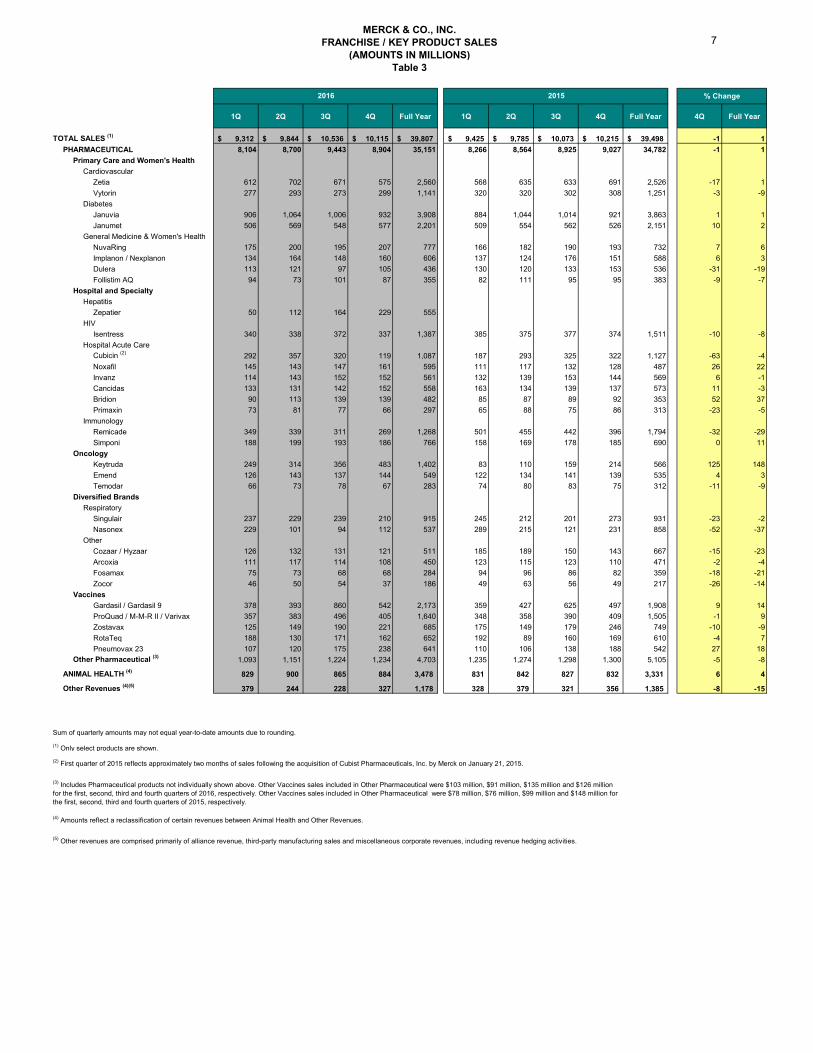
TOTAL SALES (1) 9,312$ 9,844$ 10,536$ 10,115$ 39,807$ 9,425$ 9,785$ 10,073$ 10,215$ 39,498$ -1 1PHARMACEUTICAL 8,104 8,700 9,443 8,904 35,151 8,266 8,564 8,925 9,027 34,782 -1 1
Primary Care and Women's HealthCardiovascular
Zetia 612 702 671 575 2,560 568 635 633 691 2,526 -17 1Vytorin 277 293 273 299 1,141 320 320 302 308 1,251 -3 -9
DiabetesJanuvia 906 1,064 1,006 932 3,908 884 1,044 1,014 921 3,863 1 1Janumet 506 569 548 577 2,201 509 554 562 526 2,151 10 2
General Medicine & Women's HealthNuvaRing 175 200 195 207 777 166 182 190 193 732 7 6Implanon / Nexplanon 134 164 148 160 606 137 124 176 151 588 6 3Dulera 113 121 97 105 436 130 120 133 153 536 -31 -19Follistim AQ 94 73 101 87 355 82 111 95 95 383 -9 -7
Hospital and SpecialtyHepatitis
Zepatier 50 112 164 229 555HIV
Isentress 340 338 372 337 1,387 385 375 377 374 1,511 -10 -8Hospital Acute Care
Cubicin (2) 292 357 320 119 1,087 187 293 325 322 1,127 -63 -4Noxafil 145 143 147 161 595 111 117 132 128 487 26 22Invanz 114 143 152 152 561 132 139 153 144 569 6 -1Cancidas 133 131 142 152 558 163 134 139 137 573 11 -3Bridion 90 113 139 139 482 85 87 89 92 353 52 37Primaxin 73 81 77 66 297 65 88 75 86 313 -23 -5
ImmunologyRemicade 349 339 311 269 1,268 501 455 442 396 1,794 -32 -29Simponi 188 199 193 186 766 158 169 178 185 690 0 11
OncologyKeytruda 249 314 356 483 1,402 83 110 159 214 566 125 148Emend 126 143 137 144 549 122 134 141 139 535 4 3Temodar 66 73 78 67 283 74 80 83 75 312 -11 -9
Diversified BrandsRespiratory
Singulair 237 229 239 210 915 245 212 201 273 931 -23 -2Nasonex 229 101 94 112 537 289 215 121 231 858 -52 -37
OtherCozaar / Hyzaar 126 132 131 121 511 185 189 150 143 667 -15 -23Arcoxia 111 117 114 108 450 123 115 123 110 471 -2 -4Fosamax 75 73 68 68 284 94 96 86 82 359 -18 -21Zocor 46 50 54 37 186 49 63 56 49 217 -26 -14
VaccinesGardasil / Gardasil 9 378 393 860 542 2,173 359 427 625 497 1,908 9 14ProQuad / M-M-R II / Varivax 357 383 496 405 1,640 348 358 390 409 1,505 -1 9Zostavax 125 149 190 221 685 175 149 179 246 749 -10 -9RotaTeq 188 130 171 162 652 192 89 160 169 610 -4 7Pneumovax 23 107 120 175 238 641 110 106 138 188 542 27 18
Other Pharmaceutical (3) 1,093 1,151 1,224 1,234 4,703 1,235 1,274 1,298 1,300 5,105 -5 -8
ANIMAL HEALTH (4) 829 900 865 884 3,478 831 842 827 832 3,331 6 4
Other Revenues (4)(5) 379 244 228 327 1,178 328 379 321 356 1,385 -8 -15
MERCK & CO., INC.
Table 3
2016 2015
FRANCHISE / KEY PRODUCT SALES(AMOUNTS IN MILLIONS)
(5) Other revenues are comprised primarily of alliance revenue, third-party manufacturing sales and miscellaneous corporate revenues, including revenue hedging activities.
% Change
(3) Includes Pharmaceutical products not individually shown above. Other Vaccines sales included in Other Pharmaceutical were $103 million, $91 million, $135 million and $126 million for the first, second, third and fourth quarters of 2016, respectively. Other Vaccines sales included in Other Pharmaceutical were $78 million, $76 million, $99 million and $148 million for the first, second, third and fourth quarters of 2015, respectively.
(4) Amounts reflect a reclassification of certain revenues between Animal Health and Other Revenues.
(1) Only select products are shown.
Sum of quarterly amounts may not equal year-to-date amounts due to rounding.
(2) First quarter of 2015 reflects approximately two months of sales following the acquisition of Cubist Pharmaceuticals, Inc. by Merck on January 21, 2015.
7
4Q 2016 4Q 2015 % Change 4Q 2016 4Q 2015 % Change 4Q 2016 4Q 2015 % Change
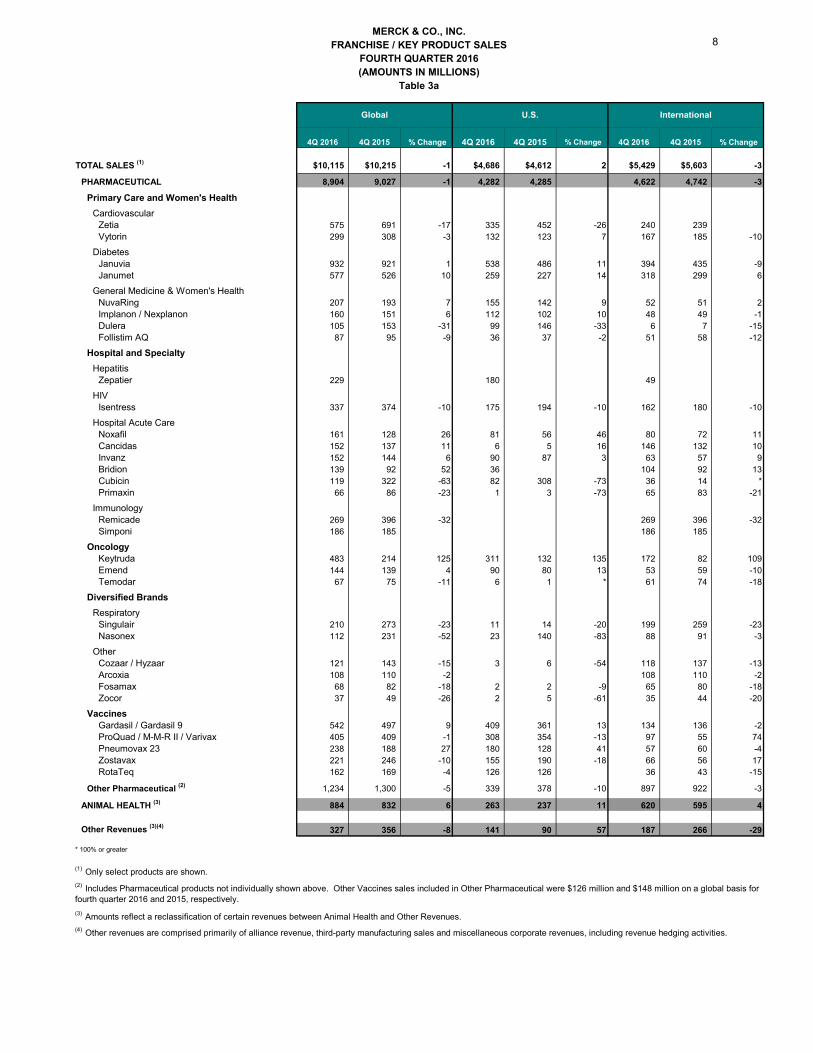
TOTAL SALES (1) $10,115 $10,215 -1 $4,686 $4,612 2 $5,429 $5,603 -3
PHARMACEUTICAL 8,904 9,027 -1 4,282 4,285 4,622 4,742 -3
Primary Care and Women's Health
CardiovascularZetia 575 691 -17 335 452 -26 240 239Vytorin 299 308 -3 132 123 7 167 185 -10
DiabetesJanuvia 932 921 1 538 486 11 394 435 -9Janumet 577 526 10 259 227 14 318 299 6
General Medicine & Women's HealthNuvaRing 207 193 7 155 142 9 52 51 2Implanon / Nexplanon 160 151 6 112 102 10 48 49 -1Dulera 105 153 -31 99 146 -33 6 7 -15Follistim AQ 87 95 -9 36 37 -2 51 58 -12
Hospital and Specialty
HepatitisZepatier 229 0 180 - 49 0
HIVIsentress 337 374 -10 175 194 -10 162 180 -10
Hospital Acute CareNoxafil 161 128 26 81 56 46 80 72 11Cancidas 152 137 11 6 5 16 146 132 10Invanz 152 144 6 90 87 3 63 57 9Bridion 139 92 52 36 - 104 92 13Cubicin 119 322 -63 82 308 -73 36 14 *Primaxin 66 86 -23 1 3 -73 65 83 -21
ImmunologyRemicade 269 396 -32 0 - 269 396 -32Simponi 186 185 0 - 186 185
OncologyKeytruda 483 214 125 311 132 135 172 82 109Emend 144 139 4 90 80 13 53 59 -10Temodar 67 75 -11 6 1 * 61 74 -18
Diversified Brands
RespiratorySingulair 210 273 -23 11 14 -20 199 259 -23Nasonex 112 231 -52 23 140 -83 88 91 -3
OtherCozaar / Hyzaar 121 143 -15 3 6 -54 118 137 -13Arcoxia 108 110 -2 0 - 108 110 -2Fosamax 68 82 -18 2 2 -9 65 80 -18Zocor 37 49 -26 2 5 -61 35 44 -20
VaccinesGardasil / Gardasil 9 542 497 9 409 361 13 134 136 -2ProQuad / M-M-R II / Varivax 405 409 -1 308 354 -13 97 55 74Pneumovax 23 238 188 27 180 128 41 57 60 -4Zostavax 221 246 -10 155 190 -18 66 56 17RotaTeq 162 169 -4 126 126 36 43 -15
Other Pharmaceutical (2) 1,234 1,300 -5 339 378 -10 897 922 -3
ANIMAL HEALTH (3) 884 832 6 263 237 11 620 595 4
Other Revenues (3)(4)327 356 -8 141 90 57 187 266 -29
* 100% or greater
Global International
(4) Other revenues are comprised primarily of alliance revenue, third-party manufacturing sales and miscellaneous corporate revenues, including revenue hedging activities.
MERCK & CO., INC.FRANCHISE / KEY PRODUCT SALES
FOURTH QUARTER 2016(AMOUNTS IN MILLIONS)
Table 3a
(2) Includes Pharmaceutical products not individually shown above. Other Vaccines sales included in Other Pharmaceutical were $126 million and $148 million on a global basis for fourth quarter 2016 and 2015, respectively.
(3) Amounts reflect a reclassification of certain revenues between Animal Health and Other Revenues.
(1) Only select products are shown.
U.S.
8
Full Year
2016 Full Year
2015 % Change Full Year
2016 Full Year
2015 % Change Full Year
2016 Full Year
2015 % Change
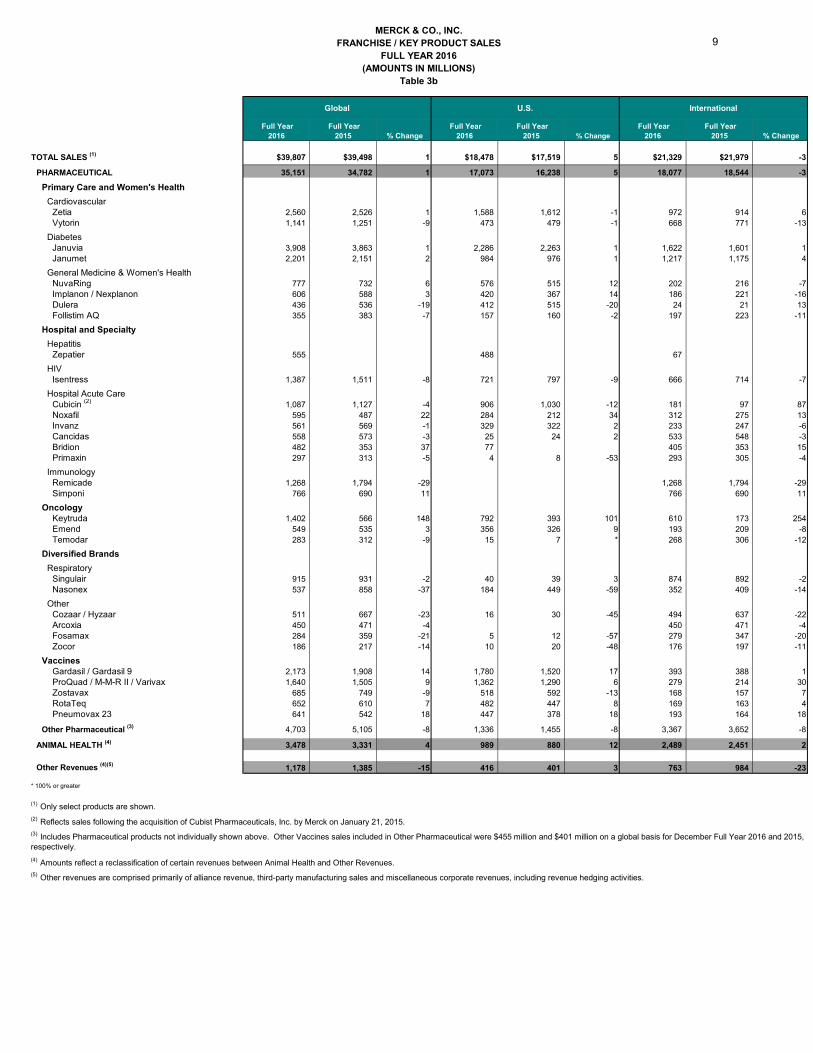
TOTAL SALES (1) $39,807 $39,498 1 $18,478 $17,519 5 $21,329 $21,979 -3
PHARMACEUTICAL 35,151 34,782 1 17,073 16,238 5 18,077 18,544 -3
Primary Care and Women's Health
CardiovascularZetia 2,560 2,526 1 1,588 1,612 -1 972 914 6Vytorin 1,141 1,251 -9 473 479 -1 668 771 -13
DiabetesJanuvia 3,908 3,863 1 2,286 2,263 1 1,622 1,601 1Janumet 2,201 2,151 2 984 976 1 1,217 1,175 4
General Medicine & Women's HealthNuvaRing 777 732 6 576 515 12 202 216 -7Implanon / Nexplanon 606 588 3 420 367 14 186 221 -16Dulera 436 536 -19 412 515 -20 24 21 13Follistim AQ 355 383 -7 157 160 -2 197 223 -11
Hospital and Specialty
HepatitisZepatier 555 0 488 - 67 0
HIVIsentress 1,387 1,511 -8 721 797 -9 666 714 -7
Hospital Acute CareCubicin (2) 1,087 1,127 -4 906 1,030 -12 181 97 87Noxafil 595 487 22 284 212 34 312 275 13Invanz 561 569 -1 329 322 2 233 247 -6Cancidas 558 573 -3 25 24 2 533 548 -3Bridion 482 353 37 77 - 405 353 15Primaxin 297 313 -5 4 8 -53 293 305 -4
ImmunologyRemicade 1,268 1,794 -29 0 - 1,268 1,794 -29Simponi 766 690 11 0 - 766 690 11
OncologyKeytruda 1,402 566 148 792 393 101 610 173 254Emend 549 535 3 356 326 9 193 209 -8Temodar 283 312 -9 15 7 * 268 306 -12
Diversified Brands
RespiratorySingulair 915 931 -2 40 39 3 874 892 -2Nasonex 537 858 -37 184 449 -59 352 409 -14
OtherCozaar / Hyzaar 511 667 -23 16 30 -45 494 637 -22Arcoxia 450 471 -4 0 - 450 471 -4Fosamax 284 359 -21 5 12 -57 279 347 -20Zocor 186 217 -14 10 20 -48 176 197 -11
VaccinesGardasil / Gardasil 9 2,173 1,908 14 1,780 1,520 17 393 388 1ProQuad / M-M-R II / Varivax 1,640 1,505 9 1,362 1,290 6 279 214 30Zostavax 685 749 -9 518 592 -13 168 157 7RotaTeq 652 610 7 482 447 8 169 163 4Pneumovax 23 641 542 18 447 378 18 193 164 18
Other Pharmaceutical (3) 4,703 5,105 -8 1,336 1,455 -8 3,367 3,652 -8
ANIMAL HEALTH (4) 3,478 3,331 4 989 880 12 2,489 2,451 2
Other Revenues (4)(5) 1,178 1,385 -15 416 401 3 763 984 -23
* 100% or greater
(5) Other revenues are comprised primarily of alliance revenue, third-party manufacturing sales and miscellaneous corporate revenues, including revenue hedging activities.
(4) Amounts reflect a reclassification of certain revenues between Animal Health and Other Revenues.
(1) Only select products are shown.
U.S.
(2) Reflects sales following the acquisition of Cubist Pharmaceuticals, Inc. by Merck on January 21, 2015.
Global International
MERCK & CO., INC.FRANCHISE / KEY PRODUCT SALES
FULL YEAR 2016(AMOUNTS IN MILLIONS)
Table 3b
(3) Includes Pharmaceutical products not individually shown above. Other Vaccines sales included in Other Pharmaceutical were $455 million and $401 million on a global basis for December Full Year 2016 and 2015, respectively.
9
1Q 2Q 3Q 4Q Full Year 1Q 2Q 3Q 4Q Full Year
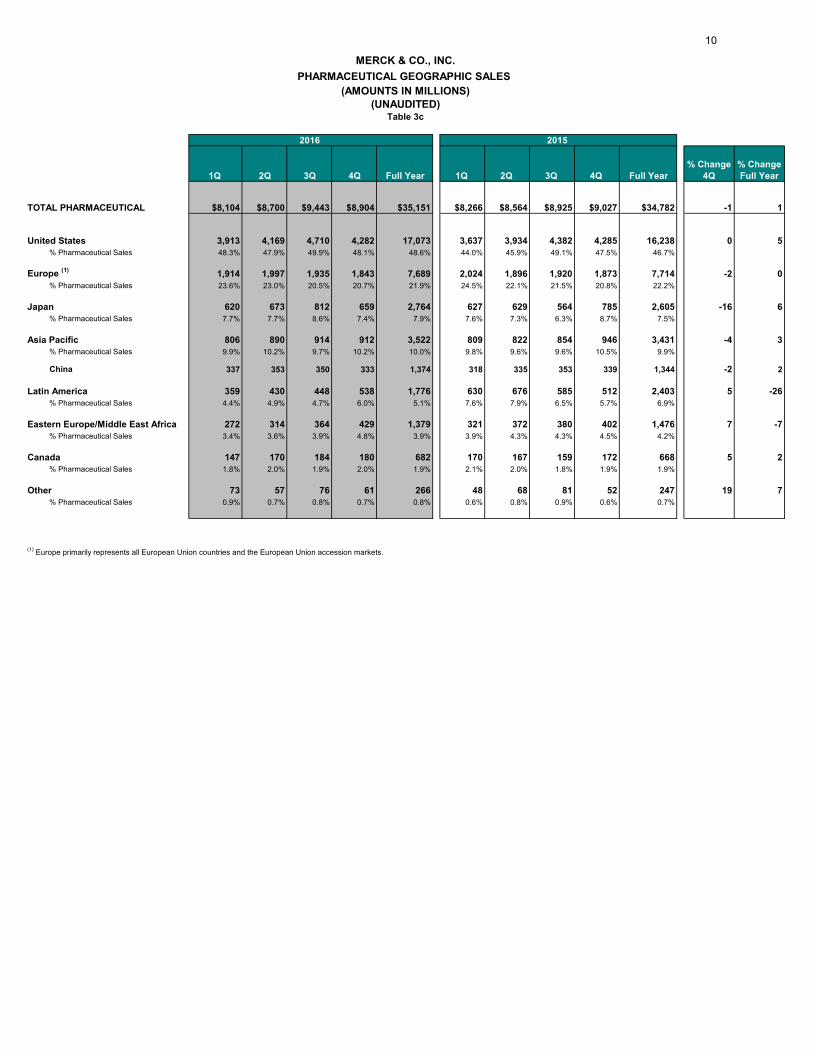
TOTAL PHARMACEUTICAL $8,104 $8,700 $9,443 $8,904 $35,151 $8,266 $8,564 $8,925 $9,027 $34,782 -1 1
United States 3,913 4,169 4,710 4,282 17,073 3,637 3,934 4,382 4,285 16,238 0 5% Pharmaceutical Sales 48.3% 47.9% 49.9% 48.1% 48.6% 44.0% 45.9% 49.1% 47.5% 46.7%
Europe (1) 1,914 1,997 1,935 1,843 7,689 2,024 1,896 1,920 1,873 7,714 -2 0% Pharmaceutical Sales 23.6% 23.0% 20.5% 20.7% 21.9% 24.5% 22.1% 21.5% 20.8% 22.2%
Japan 620 673 812 659 2,764 627 629 564 785 2,605 -16 6% Pharmaceutical Sales 7.7% 7.7% 8.6% 7.4% 7.9% 7.6% 7.3% 6.3% 8.7% 7.5%
Asia Pacific 806 890 914 912 3,522 809 822 854 946 3,431 -4 3% Pharmaceutical Sales 9.9% 10.2% 9.7% 10.2% 10.0% 9.8% 9.6% 9.6% 10.5% 9.9%
China 337 353 350 333 1,374 318 335 353 339 1,344 -2 2
Latin America 359 430 448 538 1,776 630 676 585 512 2,403 5 -26% Pharmaceutical Sales 4.4% 4.9% 4.7% 6.0% 5.1% 7.6% 7.9% 6.5% 5.7% 6.9%
Eastern Europe/Middle East Africa 272 314 364 429 1,379 321 372 380 402 1,476 7 -7% Pharmaceutical Sales 3.4% 3.6% 3.9% 4.8% 3.9% 3.9% 4.3% 4.3% 4.5% 4.2%
Canada 147 170 184 180 682 170 167 159 172 668 5 2% Pharmaceutical Sales 1.8% 2.0% 1.9% 2.0% 1.9% 2.1% 2.0% 1.8% 1.9% 1.9%
Other 73 57 76 61 266 48 68 81 52 247 19 7% Pharmaceutical Sales 0.9% 0.7% 0.8% 0.7% 0.8% 0.6% 0.8% 0.9% 0.6% 0.7%
20152016
(1) Europe primarily represents all European Union countries and the European Union accession markets.
MERCK & CO., INC.PHARMACEUTICAL GEOGRAPHIC SALES
(AMOUNTS IN MILLIONS)(UNAUDITED)
Table 3c
% Change 4Q
% Change Full Year
10
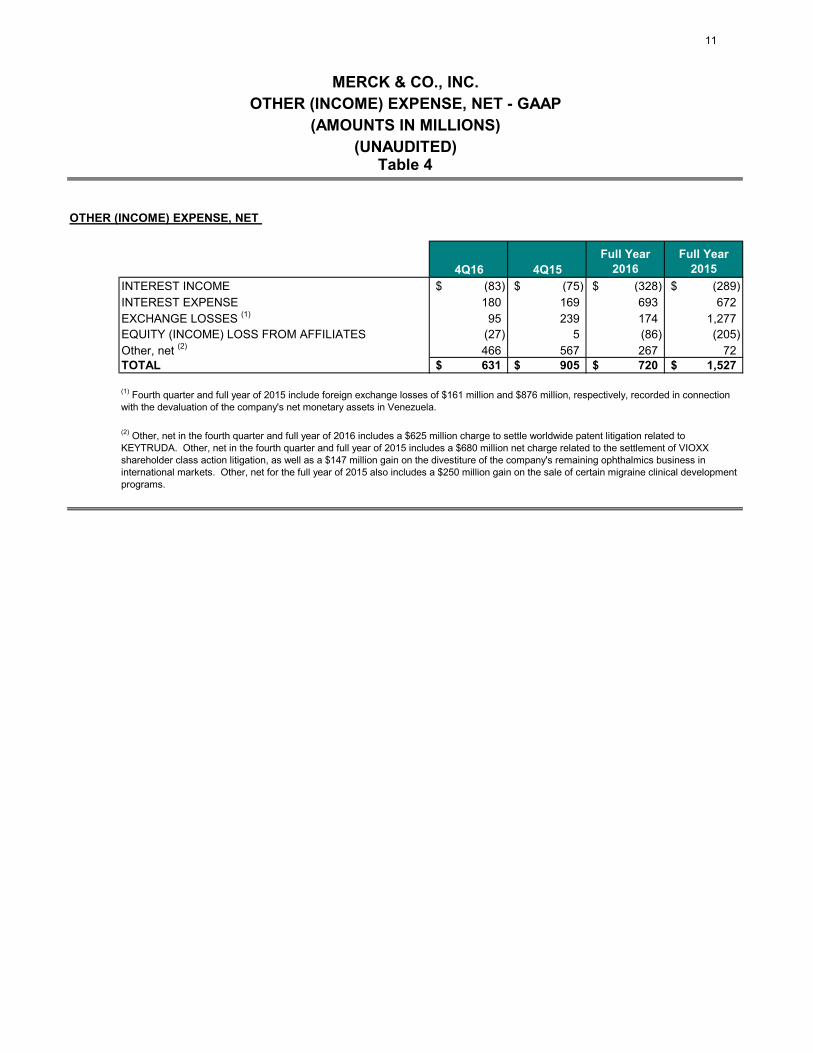
OTHER (INCOME) EXPENSE, NET
4Q16 4Q15Full Year
2016Full Year
2015INTEREST INCOME (83)$ (75)$ (328)$ (289)$ INTEREST EXPENSE 180 169 693 672 EXCHANGE LOSSES (1) 95 239 174 1,277 EQUITY (INCOME) LOSS FROM AFFILIATES (27) 5 (86) (205) Other, net (2) 466 567 267 72 TOTAL 631$ 905$ 720$ 1,527$
Table 4
MERCK & CO., INC.OTHER (INCOME) EXPENSE, NET - GAAP
(AMOUNTS IN MILLIONS)(UNAUDITED)
(1) Fourth quarter and full year of 2015 include foreign exchange losses of $161 million and $876 million, respectively, recorded in connection with the devaluation of the company's net monetary assets in Venezuela.
(2) Other, net in the fourth quarter and full year of 2016 includes a $625 million charge to settle worldwide patent litigation related to KEYTRUDA. Other, net in the fourth quarter and full year of 2015 includes a $680 million net charge related to the settlement of VIOXX shareholder class action litigation, as well as a $147 million gain on the divestiture of the company's remaining ophthalmics business in international markets. Other, net for the full year of 2015 also includes a $250 million gain on the sale of certain migraine clinical development programs.
11