mercer capital's value focus: professional services industry | year-end 2014
TRANSCRIPT

VALUE FOCUSProfessional Services Industry
www.mercercapital.com
Executive Summary Inside
• Macroeconomic factors have been favorable for the professional services industry since the recession, and the second half of 2014 has seen a continuation of these trends. Unemployment dropped to 5.6% while corporate profits and private investment continue to grow in the U.S. These indicators suggest a favorable, though conservative, outlook for the professional ser-vices industry.
• Despite a stronger economy, both the staffing and consulting sectors lagged the S&P 500 over the past twelve months. The staffing sector has seen median stock price decline of 6.2% during 2014, compared to an increase of 58.5% during 2013. Current and forward EV/EBITDA multi-ples for the staffing sector are 10.7x and 7.7x, respectively. The consulting sector has seen a median stock price decline of 2.7% in 2014,
although the sector was up 35.8% in 2013. Cur-rent and forward EV/EBITDA multiples for the consulting sector are 10.9x and 9.2x, respec-tively, which implies weaker EBITDA growth relative to the staffing companies. Overall, firms in the professional services industry saw exceptional growth in 2013, but lagged the S&P 500 significantly in 2014 as growth prospects have become more tempered going forward.
• M&A deal volume is on the rise for the consulting and staffing sectors. Annual volume for 2014 reached five-year high levels for each sector. Strategic buyers continue to be the driving force behind increased volume. Both sectors have experienced growth in the post-recession era, have high cash reserves, and continue to look for expansion opportunities.
Macroeconomic Trends 1
Market Performance 3
Professional Services
M&A Activity
Staffing Sector 4
Consulting Sector 6
Guideline Company Pricing
Staffing Sector 8
Consulting Sector 9
About Mercer Capital 10
Year-End 2014
The professional services industry includes consultancies, research firms, staffing and employment businesses, engi-neering, architecture, accounting, legal, and specialty professional practices. Many professional services firms are privately held, though two sectors include multiple public companies: consulting and staffing. This publication empha-sizes market and transaction activity for these two sectors, but the economic trends and valuation drivers discussed could apply to any professional services firm.
What are Professional Services Firms?
SPECIAL SUPPLEMENT
Fairness Opinions: Evaluating a
Buyer’s Shares from the Seller’s
Perspective
Mercer Capital’s Value Focus: Professional Services Industry Year-End 2014
© 2015 Mercer Capital 1 www.mercercapital.com
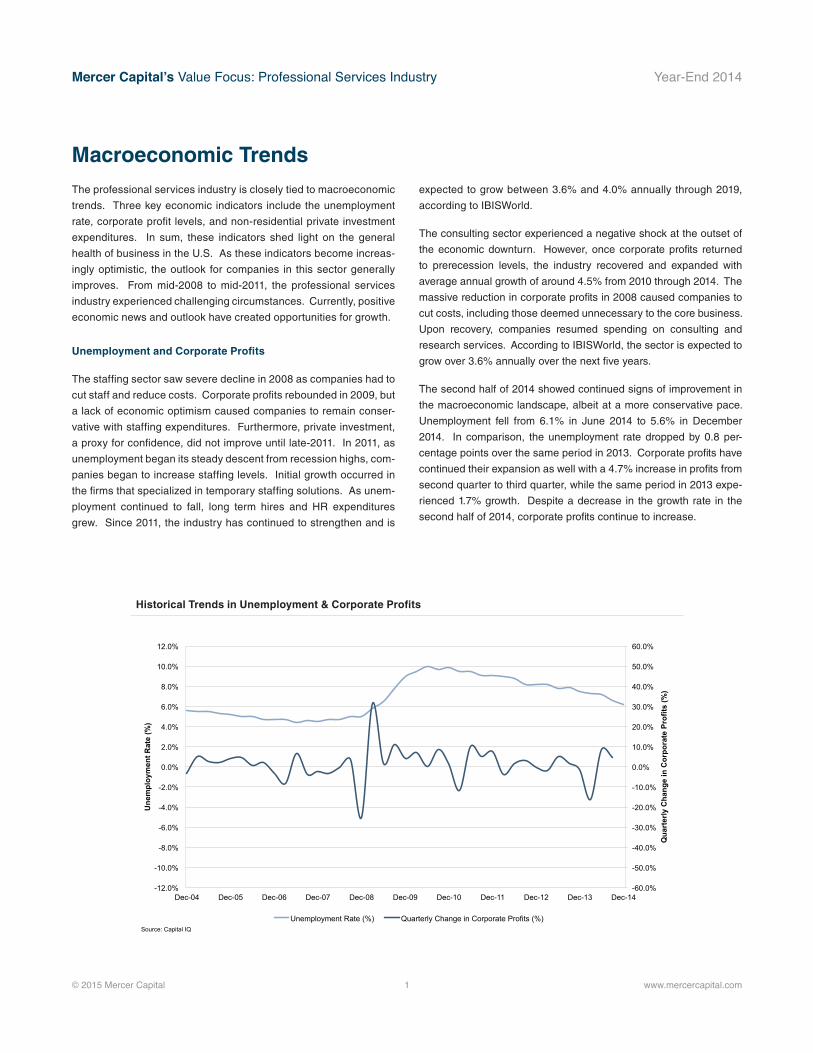
The professional services industry is closely tied to macroeconomic
trends. Three key economic indicators include the unemployment
rate, corporate profit levels, and non-residential private investment
expenditures. In sum, these indicators shed light on the general
health of business in the U.S. As these indicators become increas-
ingly optimistic, the outlook for companies in this sector generally
improves. From mid-2008 to mid-2011, the professional services
industry experienced challenging circumstances. Currently, positive
economic news and outlook have created opportunities for growth.
Unemployment and Corporate Profits
The staffing sector saw severe decline in 2008 as companies had to
cut staff and reduce costs. Corporate profits rebounded in 2009, but
a lack of economic optimism caused companies to remain conser-
vative with staffing expenditures. Furthermore, private investment,
a proxy for confidence, did not improve until late-2011. In 2011, as
unemployment began its steady descent from recession highs, com-
panies began to increase staffing levels. Initial growth occurred in
the firms that specialized in temporary staffing solutions. As unem-
ployment continued to fall, long term hires and HR expenditures
grew. Since 2011, the industry has continued to strengthen and is
expected to grow between 3.6% and 4.0% annually through 2019,
according to IBISWorld.
The consulting sector experienced a negative shock at the outset of
the economic downturn. However, once corporate profits returned
to prerecession levels, the industry recovered and expanded with
average annual growth of around 4.5% from 2010 through 2014. The
massive reduction in corporate profits in 2008 caused companies to
cut costs, including those deemed unnecessary to the core business.
Upon recovery, companies resumed spending on consulting and
research services. According to IBISWorld, the sector is expected to
grow over 3.6% annually over the next five years.
The second half of 2014 showed continued signs of improvement in
the macroeconomic landscape, albeit at a more conservative pace.
Unemployment fell from 6.1% in June 2014 to 5.6% in December
2014. In comparison, the unemployment rate dropped by 0.8 per-
centage points over the same period in 2013. Corporate profits have
continued their expansion as well with a 4.7% increase in profits from
second quarter to third quarter, while the same period in 2013 expe-
rienced 1.7% growth. Despite a decrease in the growth rate in the
second half of 2014, corporate profits continue to increase.
Macroeconomic Trends
-60.0%
-50.0%
-40.0%
-30.0%
-20.0%
-10.0%
0.0%
10.0%
20.0%
30.0%
40.0%
50.0%
60.0%
-12.0%
-10.0%
-8.0%
-6.0%
-4.0%
-2.0%
0.0%
2.0%
4.0%
6.0%
8.0%
10.0%
12.0%
Dec-04 Dec-05 Dec-06 Dec-07 Dec-08 Dec-09 Dec-10 Dec-11 Dec-12 Dec-13 Dec-14
Qua
rter
ly C
hang
e in
Cor
pora
te P
rofit
s (%
)
Une
mpl
oym
ent R
ate
(%)
Unemployment Rate (%) Quarterly Change in Corporate Profits (%) Source: Capital IQ
Historical Trends in Unemployment & Corporate Profits

Mercer Capital’s Value Focus: Professional Services Industry Year-End 2014
© 2015 Mercer Capital 2 www.mercercapital.com
Macroeconomic Trends
-8.0%
-6.0%
-4.0%
-2.0%
0.0%
2.0%
4.0%
6.0%
8.0%
Dec-08 Dec-09 Dec-10 Dec-11 Dec-12 Dec-13 Dec-14
Source: Federal Reserve Economic Data
0%
1%
2%
3%
4%
5%
6%
7%
8%
Office Staffing & Temp
Agencies
Scientific & Economic Consulting
Environmental Consulting
Management Consulting
Employment & Recruiting Agencies
Architects Accounting Services
HR Consulting Law Firms
Last 5 Years Next 5 Years
Non-Residential Private Investment
Non-residential private investment has
continued to climb, experiencing positive
growth since 2010. Between second
quarter and third quarter, private invest-
ment increased 0.5% compared to 2.8%
in the same period in 2013. As profits
continue to rise and private investment
increases, revenues and profits are
expected to increase for the professional
services industry. Growing employment
optimism can push growth for staffing
firms that will be utilized for recruiting in
an increasingly competitive marketplace.
Future growth for professional services is
expected to proceed at more moderate
levels and roughly mirror GDP, com-
pared to recent quarters that exceeded
expectations.
Growth Outlook
The growth outlook for the professional
services industry is varied when broken
into subsectors. The largest three
subsectors by revenue (Law Firms, Man-
agement Consulting, and Office Staffing
& Temp Agencies) expect growth in the
next five years to be below 4.0%. For
areas such as Management Consulting
and Office Staffing & Temp Agencies,
these forward growth rates represent a
decrease from the growth observed in
the previous five year period. The chart
represents average annual growth rates
for nine subsectors over the last five
years and for the next five years.
Quarterly Change in Private Non-Residential Fixed Investment
Industry Revenue Growth by Subsector
Source: IBIS World

Mercer Capital’s Value Focus: Professional Services Industry Year-End 2014
© 2015 Mercer Capital 3 www.mercercapital.com
The staffing sector lagged the S&P 500 during 2014 with a slight decline of 0.83%, relative to growth of 11.39% for the index. After strong growth in
2013, staffing expectations have fallen more in line with market performance. Furthermore, uncertainties exist as to what role staffing companies
will play as the economy strengthens. Industry observers suggest that, moving forward, individual company gains greater than GDP growth will
be mostly the result of market share gains as opposed to overall industry growth. Therefore, the last six months have seen tempered expectations
in the staffing sector.
The consulting sector also lagged the S&P 500 during 2014 and experienced a decline of 3.07%. Stock price performance saw a significant
decline from mid-August to mid-September as economists revised full-year estimates on national GDP. The industry faces multiple headwinds
such as continued uncertainty in government spending and the growth of more technology-focused consulting solutions. The information below
presents median valuation multiples and stock price changes for the two groups.
In general, the professional services industry outperformed the broader market in 2013, but slower growth translated into tempered performance
in 2014. Although economic outlook for the professional services industry remains positive, future growth is likely to be more in line with the
general economy.
Market Performance
11.39% 13.40%
-3.07% -0.83%
-20.00%
-15.00%
-10.00%
-5.00%
0.00%
5.00%
10.00%
15.00%
20.00%
S&P 500 Index NASDAQ Composite Index Consulting Staffing
Source: Capital IQ. Sector Indices are weighted by market capitalization
Index Performance
Summary Performance and Valuation
Number
of Companies
Median % Change
EV / Rev. LTM
EV / EBITDA
Segment YTD LTM LTM 2015E
Staffing 19 -6.20% 58.45% 0.59x 10.7x 7.7x
Consulting 18 -2.70% 35.81% 1.21x 10.9x 9.2x
Source: Capital IQ

Mercer Capital’s Value Focus: Professional Services Industry Year-End 2014
© 2014 Mercer Capital // Source: Capital IQ 4 www.mercercapital.com
Professional Services M&A Activity // Staffing Sector
Strategic Buyers 93%
Financial Buyers
7%
Public 18%
Private 82%
Source: Capital IQ
Strategic vs. Financial Buyer
YTD December 2014
Public vs. Private Buyer
YTD December 2014
84 86
128 126 132
66 66
0
20
40
60
80
100
120
140
2010 2011 2012 2013 2014 1st Half 2014
2nd Half 2014
Num
ber o
f Dea
ls
Source: Capital IQ
The final six months of 2014 saw 66
staffing transaction announcements by
61 different buyers. This volume is flat
when compared to the first six months
of 2014.
The sector has seen a general trend
upward in the number of transactions
being completed since 2010. The eco-
nomic downturn lowered cash reserves
and depressed deal volume. Volume
levels lagged behind the initial recovery
because companies remained conser-
vative on HR and staffing expenditures
until 2011. Increased sector strength
caused deal volume to increase 48.8%
from 2011 to 2012.
Deal volume during 2014 exceeded
100 deals for a third straight year,
and reached a five-year high of 132
announced deals. Increased activity
continues to be propelled primarily by
private, strategic buyers.
Annual Transaction Volume

Mercer Capital’s Value Focus: Professional Services Industry Year-End 2014
© 2015 Mercer Capital 5 www.mercercapital.com
The Advisory Board Company (NASD: ABCO) completed its acquisi-
tion of Royall & Company, Inc. on January 9, 2015. Royall & Company,
a Richmond, Virginia, based firm, provides strategic, data-driven stu-
dent engagement and enrollment management solutions, financial
aid optimization, and alumni fundraising for institutions for higher edu-
cation. ABCO acquired Royall & Company to broaden its offerings to
the education industry and become an industry leader in driving value
for institutions of higher education.
ClearStar, Inc. (AIM: CLST) finalized its acquisition of SingleSource
Services Corporation on December 16, 2014. SingleSource is a Flor-
ida-based background screening company that conducts over 2,000
pre-employment inquiries per day. ClearStar is a technology and
service provider to the background check industry. Robert J. Vale,
CEO of ClearStar, stated that “the acquisition of SingleSource is a
dramatic acceleration for ClearStar’s stated strategy of building its
direct sales and [he] firmly believe[s] that this will create value for our
shareholders.” SingleService’s CEO, Don Dymer, has entered into a
consulting agreement with ClearStar to aid in the integration process.
Investcorp Bank B.S.C. and Bahrain Mumtalakat Holding Company
completed their acquisition of PRO Unlimited, Inc. on October 30,
2014. PRO Unlimited is a leading provider of software and services
that aid large enterprises in managing their contingent workforces.
Investcorp Bank and Mumtalakat invest in alternative investments and
enable businesses to strengthen and grow, while returning value.
WageWorks, Inc (NYSE: WAGE) finalized its purchase of CONEXIS
from Word & Brown Insurance on August 1, 2014. CONEXIS, a rival
of WageWorks, administers consumer-driven health care plans and
other benefits. WageWorks purchased CONEXIS in order to gain
market share and strengthen its current product offerings. This
merger is expected to add between $23 million and $25 million in
revenue for 2014.
Professional Services M&A Activity // Staffing Sector (cont.)
Notable Transactions in the Staffing Sector
Closing
Date Target Acquirer
EV
($M)
LTM
Rev.
LTM
EBITDA
EV /
Rev.
EV /
EBITDA
01/09/2015 Royall & Company, Inc. The Advisory Board Company 850.0 nm nm nm nm
12/16/2014SingleSource Services
CorporationClearStar, Inc. 4.0 2.9 nm 1.38x nm
10/30/2014 PRO Unlimited, Inc.Investcorp Bank B.S.C.; Bahrain
Mumtalakat Holding Company 300.0 nm nm nm nm
08/01/2014 CONEXIS WageWorks, Inc. 118.0 nm nm nm nm
Source: Capital IQ

Mercer Capital’s Value Focus: Professional Services Industry Year-End 2014
© 2014 Mercer Capital // Source: Capital IQ 6 www.mercercapital.com
Professional Services M&A Activity // Consulting Sector
The consulting sector has experienced
high deal volume since 2010. The
economic downturn provided an oppor-
tunity for large firms to adsorb smaller,
distressed companies. Large consulting
companies experienced growth after
an uptick in corporate profits following
2009. Volume for the final six months of
2014 reached 141 transactions, which is
a 9.6% decline from the first half of 2014.
The consulting sector is a highly frag-
mented industry with many small firms
specializing in certain niches. It appears
that positive economic trends are con-
tinuing to drive consolidation as deal
volume increased 18.3% from 2013 to
2014. Increased activity in 2014 appears
to be driven primarily by private, stra-
tegic buyers.
Strategic Buyer 95%
Financial Buyer
5%
Public 16%
Private 84%
Source: Capital IQ
Strategic vs. Financial Buyer
YTD December 2014
Public vs. Private Buyer
YTD December 2014
256 249 246 251
297
156 141
0
50
100
150
200
250
300
350
2010 2011 2012 2013 2014 1st Half 2014
2nd Half 2014
Num
ber o
f Dea
ls
Source: Capital IQ
Annual Transaction Volume
Mercer Capital’s Value Focus: Professional Services Industry Year-End 2014
© 2015 Mercer Capital 7 www.mercercapital.com
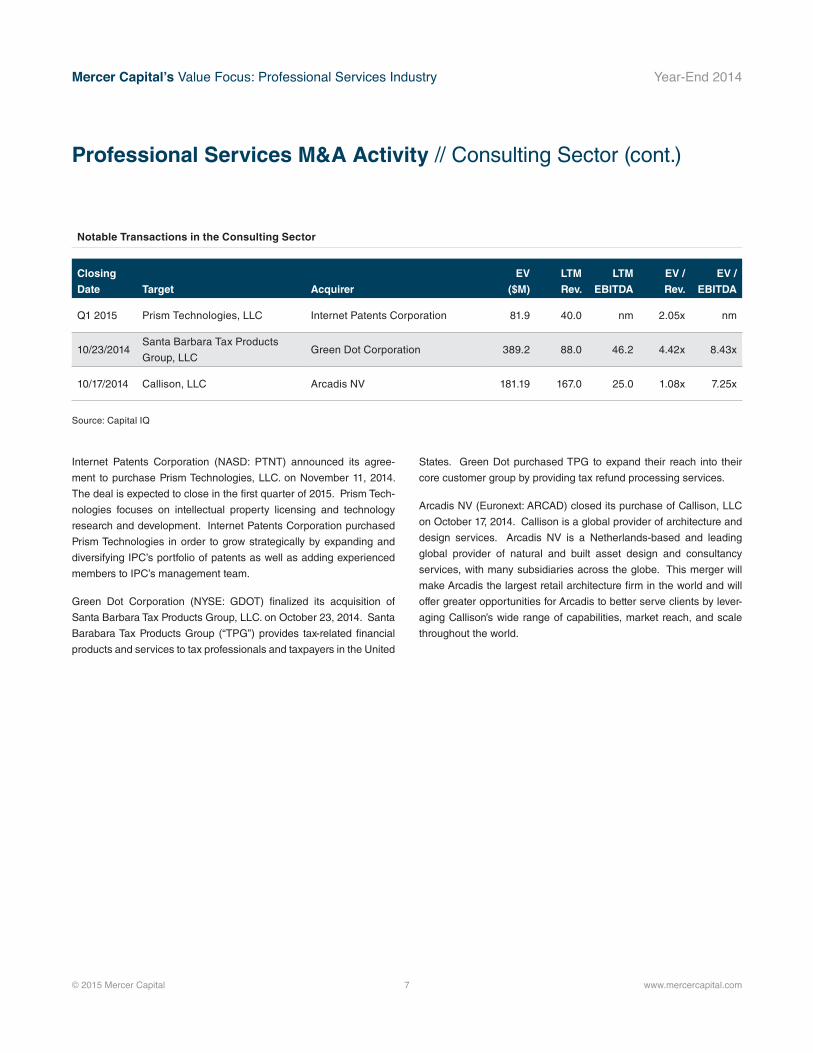
Internet Patents Corporation (NASD: PTNT) announced its agree-
ment to purchase Prism Technologies, LLC. on November 11, 2014.
The deal is expected to close in the first quarter of 2015. Prism Tech-
nologies focuses on intellectual property licensing and technology
research and development. Internet Patents Corporation purchased
Prism Technologies in order to grow strategically by expanding and
diversifying IPC’s portfolio of patents as well as adding experienced
members to IPC’s management team.
Green Dot Corporation (NYSE: GDOT) finalized its acquisition of
Santa Barbara Tax Products Group, LLC. on October 23, 2014. Santa
Barabara Tax Products Group (“TPG”) provides tax-related financial
products and services to tax professionals and taxpayers in the United
States. Green Dot purchased TPG to expand their reach into their
core customer group by providing tax refund processing services.
Arcadis NV (Euronext: ARCAD) closed its purchase of Callison, LLC
on October 17, 2014. Callison is a global provider of architecture and
design services. Arcadis NV is a Netherlands-based and leading
global provider of natural and built asset design and consultancy
services, with many subsidiaries across the globe. This merger will
make Arcadis the largest retail architecture firm in the world and will
offer greater opportunities for Arcadis to better serve clients by lever-
aging Callison’s wide range of capabilities, market reach, and scale
throughout the world.
Professional Services M&A Activity // Consulting Sector (cont.)
Notable Transactions in the Consulting Sector
Closing
Date Target Acquirer
EV
($M)
LTM
Rev.
LTM
EBITDA
EV /
Rev.
EV /
EBITDA
Q1 2015 Prism Technologies, LLC Internet Patents Corporation 81.9 40.0 nm 2.05x nm
10/23/2014Santa Barbara Tax Products
Group, LLCGreen Dot Corporation 389.2 88.0 46.2 4.42x 8.43x
10/17/2014 Callison, LLC Arcadis NV 181.19 167.0 25.0 1.08x 7.25x
Source: Capital IQ

Mercer Capital’s Value Focus: Professional Services Industry Year-End 2014
© 2014 Mercer Capital // Source: S&P Capital IQ 8 www.mercercapital.com
Staffing Sector
($ Millions, except per share data. Sorted by equity market capitalization)
Guideline Company Pricing
Company Name TickerPrice
12/31/14
Stock Price ChangeMarket
CapEnt.
Value LTM Rev.
EBITDA LTM EBITDA Margin
EV / Rev. LTM
EV / EBITDA Projected Growth
2014 2013 LTM 2015E LTM 2014E Rev. EBITDA
Towers Watson & Co. TW $113.17 -11.3% 127.0% $7,936.5 $7,630.4 $3,619.8 $690.6 $752.2 19.1% 2.11 11.0 10.1 1.7% 8.9%
Robert Half International Inc. RHI 58.38 39.0% 32.0% 7,935.2 7,645.6 4,695.0 546.3 635.2 11.6% 1.63 14.0 12.0 10.5% 16.3%
ManpowerGroup Inc. MAN 68.17 -20.6% 102.3% 5,395.0 5,218.2 20,762.8 810.5 803.8 3.9% 0.25 6.4 6.5 -6.8% -0.8%
TriNet Group, Inc. TNET 31.28 NM NM 2,177.0 2,629.2 2,071.5 171.1 185.2 8.3% 1.27 15.4 14.2 17.8% 8.3%
On Assignment Inc. ASGN 33.19 -5.0% 72.2% 1,737.4 2,111.2 1,859.9 183.7 203.0 9.9% 1.14 11.5 10.4 0.5% 10.5%
Korn/Ferry International KFY 28.76 10.1% 64.7% 1,448.6 1,174.4 1,000.8 129.7 161.9 13.0% 1.17 9.1 7.3 5.7% 24.9%
TrueBlue, Inc. TBI 22.25 -13.7% 63.7% 946.0 1,092.2 2,174.0 116.4 139.7 5.4% 0.50 9.4 7.8 19.5% 20.0%
Insperity, Inc. NSP 33.89 -6.2% 11.0% 858.5 633.1 2,357.8 68.4 100.0 2.9% 0.27 9.2 6.3 13.2% 46.1%
Kforce Inc. KFRC 24.13 17.9% 42.7% 738.1 750.4 1,217.3 58.9 76.5 4.8% 0.62 12.7 9.8 10.4% 29.9%
Kelly Services, Inc. KELY.A 17.02 -31.8% 58.4% 641.9 679.0 5,562.7 55.6 72.5 1.0% 0.12 12.2 9.4 4.6% 30.4%
GP Strategies Corp. GPX 33.93 13.9% 44.3% 580.0 575.7 501.9 52.4 57.8 10.4% 1.15 11.0 10.0 4.2% 10.3%
Heidrick & Struggles International Inc. HSII 23.05 14.4% 32.0% 420.5 291.8 494.3 43.8 44.6 8.9% 0.59 6.7 6.5 2.3% 1.8%
CDI Corp. CDI 17.71 -4.4% 8.2% 347.4 307.1 1,133.4 37.2 41.0 3.3% 0.27 8.3 7.5 0.5% 10.3%
Barrett Business Services Inc. BBSI 27.40 -70.5% 143.5% 195.0 113.4 636.2 (43.5) 41.9 NM 0.18 NM 2.7 NM NM
Corporate Resource Services, Inc. CRRS 1.20 -54.4% 484.4% 189.6 307.7 942.5 18.4 NM 2.0% 0.33 16.7 NM 21.9% NM
CTPartners Executive Search Inc. CTP 15.19 171.3% 22.8% 110.3 125.6 164.7 15.0 NM 9.1% 0.76 8.4 NM NM NM
Hudson Global, Inc HSON 3.10 -23.0% -10.3% 102.5 92.4 682.1 (5.0) (2.7) NM 0.14 NM NM -11.7% NM
BG Staffing, Inc. BGSF 13.00 NM NM 72.9 105.3 173.7 10.7 NM 6.1% 0.61 9.9 NM NM NM
Mastech Holdings, Inc. MHH 10.62 -24.1% 246.3% 45.7 43.2 113.5 5.7 NM 5.0% 0.38 7.6 NM NM NM
Median -6.2% 58.4% $641.9 $633.1 $1,133.4 $55.6 $100.0 6.1% 0.59x 9.9x 8.6x 4.6% 10.5%
Average 0.1% 90.9% $1,677.8 $1,659.3 $2,640.2 $156.1 $220.8 7.3% 0.71x 10.6x 8.6x 6.3% 16.7%

Mercer Capital’s Value Focus: Professional Services Industry Year-End 2014
© 2014 Mercer Capital // Source: S&P Capital IQ 9 www.mercercapital.com
Consulting Sector
($ Millions, except per share data. Sorted by equity market capitalization)
Guideline Company Pricing
Company Name TickerPrice
12/31/14
Stock Price ChangeMarket
CapEnt.
Value LTM Rev.
EBITDA LTM EBITDA Margin
EV / Rev. LTM
EV / EBITDA Projected Growth
2014 2013 LTM 2015E LTM 2014E Rev. EBITDA
Verisk Analytics, Inc. VRSK $64.05 -2.5% 28.9% $10,563.1 $11,403.6 $1,746.7 $790.1 $878.7 45.2% 6.53 14.4 13.0 8.0% 11.2%
IHS Inc. HIS 113.88 -4.9% 24.7% 7,763.5 9,413.5 2,230.8 510.6 749.1 22.9% 4.22 18.4 12.6 5.8% 46.7%
Dun & Bradstreet Corp. DNB 120.96 -1.5% 56.1% 4,343.7 5,675.7 1,681.8 507.7 513.0 30.2% 3.37 11.2 11.1 1.3% 1.0%
Corporate Executive Board Co. CEB 72.53 -6.3% 63.1% 2,439.9 2,861.0 909.0 206.4 246.1 22.7% 3.15 13.9 11.6 6.9% 19.2%
The Advisory Board Company ABCO 48.98 -23.1% 36.1% 1,765.9 1,743.4 574.2 63.7 170.5 11.1% 3.04 27.4 10.2 36.7% 167.7%
FTI Consulting, Inc. FCN 38.63 -6.1% 24.7% 1,584.7 2,117.0 1,756.2 206.0 229.0 11.7% 1.21 10.3 9.2 3.8% 11.1%
Huron Consulting Group Inc. HURN 68.39 9.1% 86.0% 1,495.3 1,631.2 889.2 156.8 178.6 17.6% 1.83 10.4 9.1 2.3% 13.9%
Exponent Inc. EXPO 82.50 6.8% 38.4% 1,061.5 919.9 288.6 67.0 77.2 23.2% 3.19 13.7 11.9 5.1% 15.2%
ICF International Inc. ECFI 40.98 18.1% 48.1% 795.0 902.7 1,003.5 89.2 126.1 8.9% 0.90 10.1 7.2 21.3% 41.4%
Navigant Consulting Inc. NCI 15.37 -19.9% 72.0% 745.4 899.1 766.6 116.7 115.3 15.2% 1.17 7.7 7.8 8.5% -1.2%
Resources Connection Inc. RECN 16.45 14.8% 20.1% 626.5 526.4 584.5 49.9 62.6 8.5% 0.90 10.5 8.4 6.0% 25.5%
CBIZ, Inc. CBZ 8.56 -6.1% 54.3% 422.2 625.8 719.5 75.5 NM 10.5% 0.87 8.3 NM 4.7% NM
Franklin Covey Co. FC 19.36 -2.6% 54.1% 326.7 343.6 209.6 30.7 39.5 14.7% 1.64 11.2 8.7 10.0% 28.7%
CRA International Inc. CRAI 30.32 53.1% 0.2% 288.9 245.9 303.6 29.7 51.9 9.8% 0.81 8.3 4.7 3.6% 74.7%
Hill International, Inc. HIL 3.84 -2.8% 7.9% 193.4 302.2 558.0 39.4 56.0 7.1% 0.54 7.7 5.4 17.4% 42.1%
Quest Resource Holding Corporation QRHC 1.44 -31.4% -27.6% 160.7 159.3 165.5 1.2 2.9 0.7% 0.96 NM NM 17.6% 132.9%
RCM Technologies Inc. RCMT 7.00 0.3% 35.5% 87.9 79.6 190.3 11.4 NM 6.0% 0.42 7.0 NM NM NM
Ecology & Environment, Inc. EEI 9.13 -17.0% -1.1% 39.2 39.5 126.9 1.9 NM 1.5% 0.31 21.0 NM NM NM
Median -2.7% 35.8% $770.2 $900.9 $652.0 $71.3 $126.1 11.4% 1.19x 10.5x 9.2x 6.5% 25.5%
Average -1.2% 34.5% $1,928.0 $2,216.1 $816.9 $164.1 $233.1 14.9% 1.95x 12.4x 9.4x 9.9% 42.0%

Mercer CapitalProfessional Services Industry
Contact Us
Copyright © 2015 Mercer Capital Management, Inc. All rights reserved. It is illegal under Federal law to reproduce this publication or any portion of its contents without the publisher’s permission. Media
quotations with source attribution are encouraged. Reporters requesting additional information or editorial comment should contact Barbara Walters Price at 901.685.2120. Mercer Capital’s Industry
Focus does not constitute legal or financial consulting advice. It is offered as an information service to our clients and friends. Those interested in specific guidance for legal or accounting matters should
seek competent professional advice. Inquiries to discuss specific valuation matters are welcomed. To add your name to our mailing list to receive this complimentary publication, visit our web site at
www.mercercapital.com.
Mercer Capital has expertise providing business valuation and financial advisory services to companies in the professional services industry.
Mercer Capital provides business valuation and financial advisory services to professional
services firms throughout the nation. We provide valuation services for tax purposes, buy-sell
agreements, partner buyouts, and other corporate planning purposes. Mercer Capital also works
with owners who are considering the sale of their firm or the acquisition of other professional
services firms.
Services Provided
• Valuation of professional services companies
• Transaction advisory for mergers, acquisitions and divestitures
• Valuations for purchase accounting, impairment testing, and other fair value measurement
• Fairness and solvency opinions
• Litigation support for economic damages and valuation and shareholder disputes
Contact a Mercer Capital professional to discuss your needs in confidence.
Lucas M. Parris, CFA, [email protected]
Timothy R. Lee, [email protected]
Matthew R. Crow, CFA, [email protected]
Robert T. [email protected]
Mercer Capital5100 Poplar Avenue, Suite 2600Memphis, Tennessee 38137901.685.2120
www.mercercapital.com
BUSINESS VALUATION & FINANCIAL ADVISORY SERVICES

Mercer Capital’s Value Focus: Professional Services Industry Year-End 2014
© 2015 Mercer Capital 11 www.mercercapital.com
Fairness OpinionsEvaluating a Buyer’s Shares from the Seller’s Perspective
M&A activity in the U.S. (and globally) has accelerated in 2014
after years of gradual improvement following the financial crisis.
According to Dealogic, M&A volume where the target was a U.S.
company totaled $1.4 trillion YTD through November 10, the highest
YTD volume on record and up 43% from the same period last year.
Excluding cross-border acquisitions, domestic-only M&A was $1.1
trillion, which represented the second highest YTD volume since
1999 and up 27% from last year. Healthcare and telecommunica-
tions were the first and second most targeted sectors.
The improvement has taken a long time even though corporate cash
is high, financing costs are very low and organic revenue growth
in most industries has been sluggish. Aside from improving confi-
dence, another key foundation for increased M&A activity fell into
place in 2013 when equity markets staged a strong rally as the S&P
500 rose 30% (32% with dividends) and the Russell 2000 increased
37% (39%). The absence of a meaningful pullback in 2014 and a
12% advance in the S&P 500 and 2% in the Russell 2000 have fur-
ther supported activity.
The rally in equities, like low borrowing rates, has reduced the cost
to finance acquisitions because the majority of stocks experienced
multiple expansion rather than material growth in EPS. It is easier for
a buyer to issue shares to finance an acquisition if the shares trade
at rich valuation than issuing “cheap” shares. As of November 24,
the S&P 500’s P/E based upon trailing earnings (as reported) was
20.0x compared to 18.2x at year-end 2013, 17.0x at year-end 2012
and 14.9x at year-end 2011. The long-term average P/E since 1871
is 15.5x (Source: http://www.multpl.com).
High multiple stocks can be viewed as strong acquisition currencies
for acquisitive companies because fewer shares have to be issued
to achieve a targeted dollar value. As such, it is no surprise that the
extended rally in equities has supported deal activity this year. How-
ever, high multiple stocks may represent an under-appreciated risk
to sellers who receive the shares as consideration. Accepting the
buyer’s stock raises a number of questions, most which fall into the
genre of: what are the investment merits of the buyer’s shares? The
answer may not be as obvious as it seems, even when the buyer’s
shares are actively traded.
Our experience is that some, if not most, members of a board
weighing an acquisition proposal do not have the background to
thoroughly evaluate the buyer’s shares. Even when financial advi-
sors are involved there still may not be a thorough vetting of the
buyer’s shares because there is too much focus on “price” instead
of, or in addition to, “value.”
A fairness opinion is more than a three or four page letter that opines
as to the fairness from a financial point of a contemplated transac-
tion; it should be backed by a robust analysis of all of the relevant
factors considered in rendering the opinion, including an evaluation
of the shares to be issued to the selling company’s shareholders.
The intent is not to express an opinion about where the shares may
trade in the future, but rather to evaluate the investment merits of the
shares before and after a transaction is consummated.
Key questions to ask about the buyer’s shares include the following:
• Liquidity of the Shares. What is the capacity to sell the shares
issued in the merger? SEC registration and even NASDAQ
and NYSE listings do not guarantee that large blocks can be
liquidated efficiently. Generally, the higher the institutional
ownership, the better the liquidity. Also, liquidity may improve

Mercer Capital’s Value Focus: Professional Services Industry Year-End 2014
© 2015 Mercer Capital 12 www.mercercapital.com
with an acquisition if the number of shares outstanding and
shareholders increase sufficiently.
• Profitability and Revenue Trends. The analysis should
consider the buyer’s historical growth and projected growth
in revenues, and operating earnings, (usually EBITDA or
EBITDA less capital expenditures) in addition to EPS. Issues
to be vetted include customer concentrations, the source of
growth, the source of any margin pressure and the like. The
quality of earnings and a comparison of core vs. reported earn-
ings over a multi-year period should be evaluated.
• Pro Forma Impact. The analysis should consider the impact
of a proposed transaction on revenues, EBITDA, margins, EPS
and capital structure. The per share accretion and dilution
analysis of such metrics as earnings, EBITDA and dividends
should consider both the buyer’s and seller’s perspectives.
• Dividends. In a yield starved world, dividend paying stocks
have greater attraction than in past years. Sellers should not
be overly swayed by the pick-up in dividends from swapping
into the buyer’s shares; however, multiple studies have demon-
strated that a sizable portion of an investor’s return comes
from dividends over long periods of time. If the dividend yield
is notably above the peer average, the seller should ask why?
Is it payout related, or are the shares depressed? Worse would
be if the market expected a dividend cut. These same ques-
tions should also be asked in the context of the prospects for
further increases.
• Capital Structure. Does the acquirer operate with an appro-
priate capital structure given industry norms, cyclicality of the
business and investment needs to sustain operations? Will
the proposed acquisition result in an over-leveraged company,
which in turn may lead to pressure on the buyer’s shares and/
or a rating downgrade if the buyer has rated debt?
• Balance Sheet Flexibility. Related to the capital structure
should be a detailed review of the buyer’s balance sheet that
examines such areas as liquidity, access to bank credit, and
the carrying value of assets such as deferred tax assets.
• Ability to Raise Cash to Close. What is the source of funds
for the buyer to fund the cash portion of consideration? If the
buyer has to go to market to issue equity and/or debt, what is
the contingency plan if unfavorable market conditions preclude
floating an issue?
• Consensus Analyst Estimates. If the buyer is publicly
traded and has analyst coverage, consideration should be
given to Street expectations vs. what the diligence process
determines. If Street expectations are too high, then the
shares may be vulnerable once investors reassess their
earnings and growth expectations.
• Valuation. Like profitability, valuation of the buyer’s shares
should be judged relative to its history and a peer group
presently as well as relative to a peer group through time to
examine how investors’ views of the shares may have evolved
through market and profit cycles.
• Share Performance. Sellers should understand the source
of the buyer’s shares performance over several multi-year
holding periods. For example, if the shares have significantly
outperformed an index over a given holding period, is it
because earnings growth accelerated? Or, is it because the
shares were depressed at the beginning of the measurement
period? Likewise, underperformance may signal disappointing
earnings, or it may reflect a starting point valuation that was
unusually high.
• Strategic Position. Assuming an acquisition is material for
the buyer, directors of the selling board should consider the
strategic position of the buyer, asking such questions about
the attractiveness of the pro forma company to other acquirers.
• Contingent Liabilities. Contingent liabilities are a standard
item on the due diligence punch list for a buyer. Sellers should
evaluate contingent liabilities too.
The list does not encompass every question that should be asked as
part of the fairness analysis, but it does illustrate that a liquid market
for a buyer’s shares does not necessarily answer questions about
value, growth potential and risk profile.
We at Mercer Capital have extensive experience in valuing and eval-
uating the shares (and debt) of financial and non-financial service
companies garnered from over three decades of business. Feel free
to contact us to discuss your situation in confidence.
Jeff K. Davis, CFA