mental health services act community services and … services and supports full service partnership...
TRANSCRIPT

Mental Health Services Act Community Services and Supports Full Service Partnership Program
Annual Report – Fiscal Year 2013-2014 Prepared by: Karisa Hyppolite, Program Planner Research, Evaluation and Performance Outcomes June 2015

1 | P a g e
The following Full Service Partnership (FSP) report analyzes demographics and outcomes for the seven FSPs currently serving partners in Sacramento County. All FSP program descriptions are included in the Addendum on page 23. The report focuses on partners served in FSPs from July 1, 2013 through June 30, 2014. With the adoption of the FSP assessment forms came the use of the word “partner” to describe clients who received services from FSP programs. “Partner” will be used from this point forward to reference those served in our FSP programs. The Department of Health Care Services requires all FSP programs to collect and report data using FSP assessment forms. Three forms are used to collect FSP outcome data (detailed below), and each form is tailored to an age group - Children/Youth, TAY, Adult, and Older Adult. Although each form is specific to one of the aforementioned age groups, the forms are similar in the types of data collected. The following provides a brief explanation of each of the FSP assessment forms.
1. Partnership Assessment Form (PAF): The PAF establishes the Partnership date which indicates the date a partner enters a FSP program for the very first time. The PAF is completed only when the partner enters his/her first FSP program, or again upon resuming FSP services after a year or longer break in services. The PAF collects the partner’s baseline, and current data. Baseline data for purposes of FSP Assessment forms, and FSP program analysis is defined as the 12 months prior to the Partnership Date. Baseline data is not collected at each subsequent admit to other FSP programs, unless there has been a year or longer lapse in FSP services. Data on the PAF is self-report, and collected from the partner during the first few weeks of service from the FSP.
2. Quarterly Assessment (3M): The 3M is completed every three months, following the Partnership Date (PAF date). It is used to update the status of certain data elements collected on the PAF. Data on the 3M is self-report, as well as reported based upon staff’s knowledge of the partner during the time of form completion.
3. Key Event Tracking (KET): The KET is used to report key event changes (such as residence change, incarceration, emergency room visits, etc.) within a week of occurrence, or as soon as possible after they occur. Data on the KET is also self-report, as well as reported based upon staff’s knowledge of the key event change. A KET must be completed to “open” and “close” a key event, such as homelessness or incarceration.
Various data sources were used for this report. Avatar data was used for demographics as well as psychiatric hospitalizations. FSP assessment forms were used for arrests/incarcerations, homelessness, emergency room visits, and employment information. The data collected and reported from these forms is primarily self-report, so there are limitations. Providers can only collect and submit information that is reported to them by the partner, or from a reliable source, such as the Public Guardian’s office. This may or may not present a full and accurate picture of the partner’s situation. Additionally, only data that is submitted and entered into the State’s Department of Health Care Services MHSA Data Collection and Reporting database (DCR) can be used for analysis. Because of the limitations of self-report data, it must be recognized that some data elements may be under-reported.

2 | P a g e
Executive Summary Utilization There were 1687 unduplicated partners served during the fiscal year, and the average length of stay in an FSP program was 2.1 years. While each program’s attrition rate varied, the overall attrition rate across all FSP programs was 23.8%. This means that 23.8% of clients cycled out of the programs, opening spots for new clients to enter. Demographics As previously stated, according to Avatar, there were 1687 unduplicated partners served in all FSP programs, during the 13/14 fiscal year. However, the total number served at each program (1692) will not equal the total unduplicated partners, as some partners were served by more than one program. Furthermore, there were only 1674 unduplicated clients who had outcome forms submitted on their behalf. Some of these partners were also served by more than one program, resulting in the sum of partners served at each program (1679) being greater than the unduplicated number of partners. While the majority of partners served in the FSP programs were adults (60.2%), FSP programs also served children ages 0-15 (9.0%), transitional age youth (TAY) ages 16-25 (14.1%) and older adults ages 60 and over (16.8%). Overall, slightly more men were served than women (50.7%). FSPs served partners from diverse cultures with 56.1% of all partners reporting a race other than Caucasian, and 17.1% speaking a language other than English. Avatar data revealed that 10.7% of partners reported being of Hispanic origin. Note, in the report, race and ethnicity are distinguished separately. Ethnic categories are broad groups for which people identify with (Hispanic or Non-Hispanic) and race refers to the specific racial group a person identifies with (Caucasian, African-American, Asian/Pacific Islander, etc.). The majority of partners (76.0%) reported being diagnosed with Depressive, Bipolar and Psychotic disorders. Discharges There were 326 discharges from FSP programs during fiscal year 13/14. The average length of stay in the FSP for discharged partners was 2.1 years with some partners staying as little as 3 days, and one staying 7 years. Across all FSPs the most common reasons given for discharge were “Receiving Services Elsewhere” (22%), “Completed Mental Health Services” (21%), and “Refused/Declined Services” (20%). These reasons remain consistent across race and Hispanic ethnicity. Emergency Room Visits During the fiscal year, 12.7% of partners who submitted FSP outcome forms (212 of 1674) reported an ER visit for a Mental Health reason, and 12.8% (214 of 1674) for a physical reason. This rate varied greatly between agencies with one agency reporting a low of 4.5% of partners experiencing a psychiatric ER visit, to another agency reporting a high of 34.9%.

3 | P a g e
Caucasian partners made up the greatest percent of psychiatric ER visits at 50.8%. The ethnic group with the highest percent Adults, ages 26 to 59, reported the greatest percentage of partners with physical ER visits at 70.6%, and the highest rate of psychiatric ER visits at 74.2%. Inpatient Admits Of all partners served in this fiscal year, 10.3% of them had an inpatient psychiatric hospital admit. This percent includes those admitted into the Sacramento County Mental Health Treatment Center (MHTC), and five other contracted facilities. During the fiscal year there were a total of 407 inpatient admits, resulting in a total of 4,673 inpatient days. Of those partners who reported their race, the highest rate of hospitalization was within the African American population with 12.6% of those partners being admitted. The ethnic group with the highest hospitalization rate was Hispanic, at 11.6%. The age group reporting the highest rate of hospitalization was TAY (16-25) at 14.7%. Homelessness During the fiscal year, 4.5% of partners with outcome forms (76 of 1,674) reported experiencing homelessness, for a total of 97 homeless occurrences, 5030 homeless days, and a 51.9 average number of homeless days per occurrence. To interpret homelessness data, a KET must be completed to report the date the partner became homeless, and another KET to report the date the partner became housed. There were some KETs submitted for the fiscal year that reported residence changes to homelessness, while the last KET on file also reported homelessness. Such KETs indicate missing data on the partner’s location in between occurrences of homelessness. As a result, the total days of homelessness are inflated. Of those partners reporting homeless occurrences, 50% were Caucasian, 27.6% were African American and 9.2% were Asian/Pacific Islander. Partners of Non-Hispanic ethnicity reported a higher percent of homelessness than did Hispanics, and of all age groups reporting homelessness, adults age 26-59 made up the greatest amount at 73.7%. Employment Across all programs, 3.6% of our partners were employed during the fiscal year. Employment rates ranged between agencies from a low of 0% to a high of 5%. Arrests and Incarceration Almost eight percent (7.9%) of all partners reported being arrested during the fiscal year, for a total of 178 arrests. Nine percent (9.0%) of all partners were reported to be incarcerated during the fiscal year, resulting in 209 different incarcerations, a total of 10,242 incarceration days, and an average of 49 incarceration days per incarceration. The highest arrest rate reported was for African-Americans, at 12.4%, with a 14.4% residence change into jail. Of the Hispanic population, 11.8% reported an arrest, and 15.7% reported a residence change into jail. This was significantly higher than the 7.8% of Non-Hispanic partners who reported an arrest, and 8.6% who reported a residence change into jail. Of all age groups, TAY (16-25) reported the highest percent of partners with an arrest (14.4%), and residence changes into jail (16.9%).

4 | P a g e
Program Description A brief program description of each FSP is included in the Addendum. Utilization During FY 13/14 there were a total of 1,687 unduplicated partners who received services at the FSPs. The table below gives information on the number of partners served, admits, discharges, length of stay, and attrition rate. Client attrition rate is the turnover rate of clients in the program, and is calculated as follows: Number of clients discharged, divided by the average number of clients served (clients at the beginning of the year, plus the number of clients at the end of the year, divided by two).
Unduplicated FSP Clients Served by Episode
Undup #
Served
Undup # of Ptnrs Admitted in Year
Undup # of Ptnrs
Discharged in Year
Avg LOS Attrition Rate
Total 1687 360 324 2.1 Years 23.8%
Admits are partners who had at least one service in FY13/14.
The tables below give information broken down by age group, race, and ethnicity.

5 | P a g e
Adults made up the largest age group of partners served at 60.2% of total partners
served. The average length of stay was greatest for the Older Adult population at 2.9 years. The highest attrition rate was experienced by Children at 63%.
FSPs served slightly more men than women (50.7%). Women had a longer length of stay, and men experienced a higher attrition rate.
Served by Age GroupUndup #
Served Percent
Undup #
of Ptnrs
Admitted
in Year
Undup # of
Ptnrs
Discharged
in Year
Avg LOSAttrition
Rate
0‐15 151 9.0% 68 57 1.1 Years 63.0%
16‐25 238 14.1% 68 79 1.3 Years 47.2%
26‐59 1015 60.2% 179 132 2.8 Years 15.1%
60+ 283 16.8% 45 56 2.9 Years 23.9%
Total 1687 100.0% 360 324 2.1 Years 23.8%
Served by Gender # Served Percent
Undup #
of Ptnrs
Admitted
in Year
Undup # of
Ptnrs
Discharged
in Year
Avg LOSAttrition
Rate
Male 856 50.7% 200 187 1.8 Years 27.7%
Female 830 49.2% 159 137 2.6 Years 19.9%
Unk/Not Reported 1 0.1% 1 0 0.0%
Total 1687 100.0% 360 324 2.1 Years 23.8%

6 | P a g e
The majority of partners served were of other racial backgrounds other than Caucasian
(56.1%). Partners of a Multi-Racial background experienced the longest average length of stay
at 4.8 years. Those of an unknown, or not reported, racial background experienced the highest
attrition rate at 44.4%.
Served by Race # Served Percent
Undup #
of Ptnrs
Admitted
in Year
Undup # of
Ptnrs
Discharged
in Year
Avg LOSAttrition
Rate
Caucasian 679 40.2% 120 118 2.3 Years 20.8%
African American 406 24.1% 95 75 1.9 Years 23.0%
Native American/
Alaskan Native 16 0.9% 3 2 1.4 Years 14.8%
Asian Pacific Islander 352 20.9% 74 69 2.2 Years 24.2%
Multi Race 21 1.2% 5 3 4.8 Years 17.6%
Other 152 9.0% 29 41 2.0 Years 33.9%
Unk/Not Reported 61 3.6% 34 16 1.8 Years 44.4%
Total 1687 100.0% 360 324 2.1 Years 23.8%

7 | P a g e
Across all programs, 17.1% of partners served spoke a language other than English.
Served by Ethnicity #
Served Percent
Undup # of Ptnrs Admitted in Year
Undup # of Ptnrs
Discharged in Year
Avg LOS Attrition Rate
Hispanic 181 10.7% 39 41 1.9 Years 28.4%
Not Hispanic 1396 82.8% 267 259 2.2 Years 22.6%
Unk/Not Reported 110 6.5% 54 24 1.3 Years 33.6%
Total 1687 100.0% 360 324 2.1 Years 23.8%
10.7% of partners reported Hispanic ethnicity Partners of unknown, or not reported, ethnicity experienced the highest attrition rate at
33.6%, and the shortest length of stay at 1.3 years.
Diagnosis

8 | P a g e
This section represents the principal diagnosis of partners served across all FSP programs. The graph below indicates the most recent diagnosis reported in Avatar.
The majority of partners (76.0%) reported diagnoses of Depressive, Bipolar or
Psychotic disorders. Discharges There were 326 discharges from the FSP programs during fiscal year 13/14. The average length of stay with a FSP (for discharged partners) was 2.1 years, with a range of 3 days to 7 years.
9 | P a g e
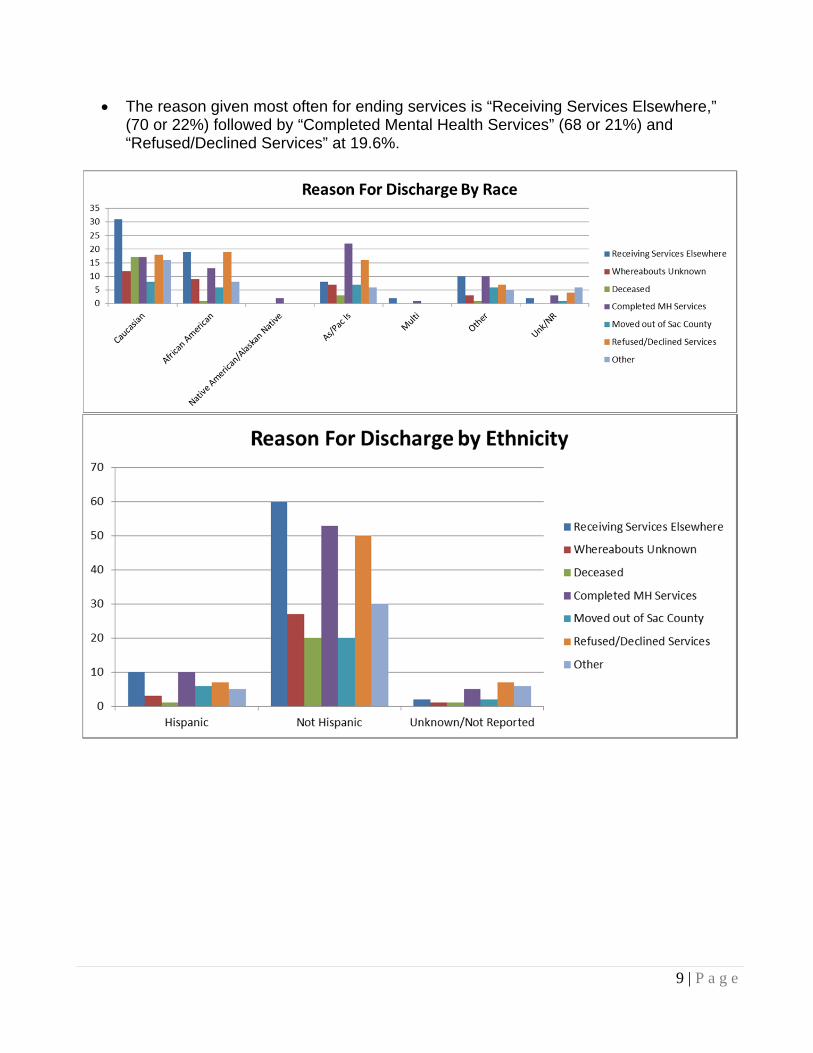
The reason given most often for ending services is “Receiving Services Elsewhere,”
(70 or 22%) followed by “Completed Mental Health Services” (68 or 21%) and “Refused/Declined Services” at 19.6%.

10 | P a g e

11 | P a g e
Outcome Measures This section of the report examines outcome data for the FSP programs. Data from this section is obtained from Avatar for inpatient hospitalization data, and from FSP outcome forms, as required by DHCS, for emergency room visits, homelessness, employment, arrests, and incarcerations. Below is information as reported on the three FSP outcome forms:
Emergency Room Visits Emergency room (ER) visits are captured using the KET form. Emergency room visits can be due to either a physical need, or a mental health need. Both reasons are captured on the KET. As with all data, the validity and integrity of the data rests upon the accuracy of the data reported by partners and staff, captured on a KET, and ultimately submitted for data entry. Failure, or inability, to capture and report data can lead to under-representation of emergency room visits. These data collection challenges should be kept in mind as you review the data in this section.
*Thirteen partners did not have outcome forms (including PAFs) submitted on their behalf.
Across all programs 12.8% of partners (214 of 1674) reported an ER visit for a Mental
Health reason, and 12.7% (212 of 1674) had an ER visit for a physical reason.
Caucasian partners reported the highest percentage of ER visits for a physical reason at 19.3%.
Caucasian partners had the highest percentage of psychiatric ER visits at 15.5%, followed by African American partners (14.4%) and those reporting their race as other (11.3%).
Unduplicated
Clients Served
With a PAF
Number of
Physical ER Visits
Unduplicated
Number of
Clients With
Physical ER
Visits
Avg Number of
Physical ER
Visits
% Of Clients
With Physical
ER Visit
Unduplicated
Number of
Clients With
Mental Health
ER Visits
Number of
Mental Health
ER Visits
Avg
Number of
Mental
Health ER
Visits
% Of
Clients
With
Mental
Health ER
Visits
1674* 407 214 1.9 12.8% 212 650 3.1 12.7%
ER Visits
ER Visits By RaceUnduplicated
Clients
Served With a
PAF
Number of
Physical ER
Visits
Unduplicated
Number of
Clients With
Physical ER
Visits
Average
Number of
Physical ER
Visits
% Of
Clients
With
Physical ER
Visit
Unduplicated
Number of
Clients With
Mental Health
ER Visits
Number of
Mental
Health ER
Visits
Average
Number
of
Mental
Health
ER Visits
% Of
Clients
With
Mental
Health
ER Visits
Caucasian 678 228 131 1.7 19.3% 105 330 3.1 15.5%
African American 403 82 39 2.1 9.7% 58 189 3.3 14.4%
American Indian 15 3 2 1.5 13.3% 1 1 1.0 6.7%
Asian/Pacific Islander 350 64 23 2.8 6.6% 29 75 2.6 8.3%
Multi‐Race 21 1 1 1.0 4.8% 0 0 0.0 0.0%
Other 151 23 14 1.6 9.3% 17 53 3.1 11.3%
Unknown/Not
Reported 56 6 4 1.5 7.1% 2 2 1.0 3.6%
12 | P a g e
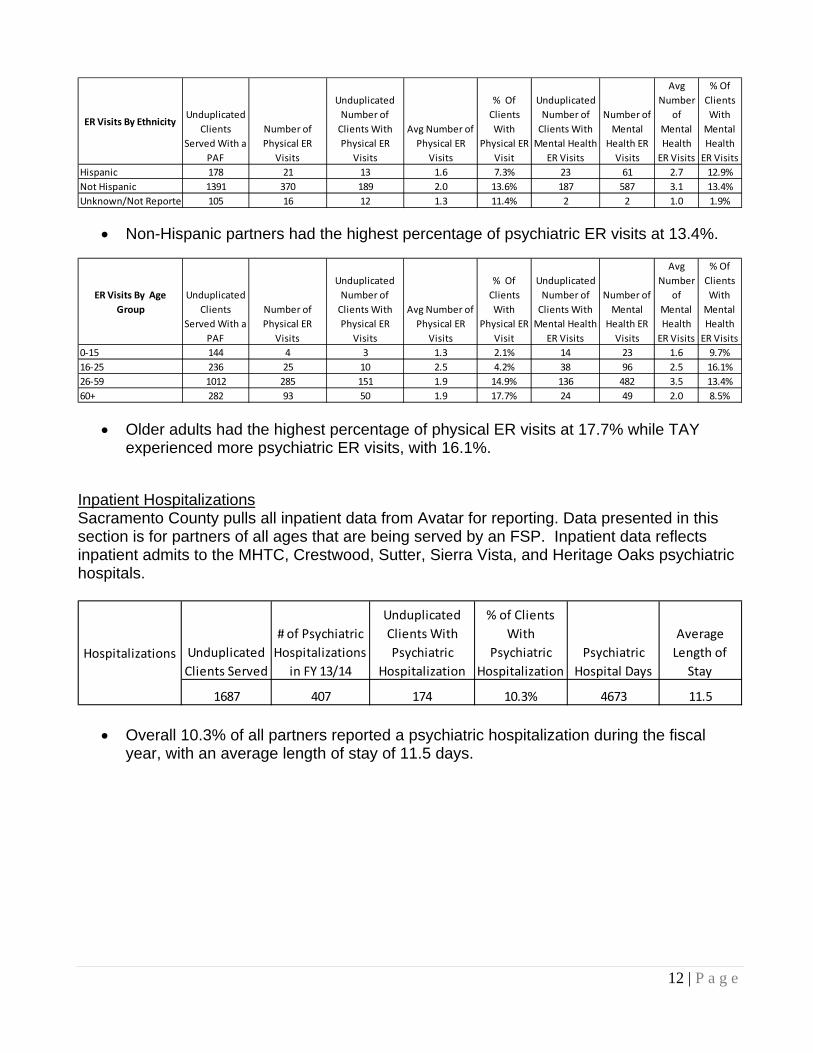
Non-Hispanic partners had the highest percentage of psychiatric ER visits at 13.4%.
Older adults had the highest percentage of physical ER visits at 17.7% while TAY experienced more psychiatric ER visits, with 16.1%.
Inpatient Hospitalizations Sacramento County pulls all inpatient data from Avatar for reporting. Data presented in this section is for partners of all ages that are being served by an FSP. Inpatient data reflects inpatient admits to the MHTC, Crestwood, Sutter, Sierra Vista, and Heritage Oaks psychiatric hospitals.
Overall 10.3% of all partners reported a psychiatric hospitalization during the fiscal year, with an average length of stay of 11.5 days.
ER Visits By EthnicityUnduplicated
Clients
Served With a
PAF
Number of
Physical ER
Visits
Unduplicated
Number of
Clients With
Physical ER
Visits
Avg Number of
Physical ER
Visits
% Of
Clients
With
Physical ER
Visit
Unduplicated
Number of
Clients With
Mental Health
ER Visits
Number of
Mental
Health ER
Visits
Avg
Number
of
Mental
Health
ER Visits
% Of
Clients
With
Mental
Health
ER Visits
Hispanic 178 21 13 1.6 7.3% 23 61 2.7 12.9%
Not Hispanic 1391 370 189 2.0 13.6% 187 587 3.1 13.4%
Unknown/Not Reported 105 16 12 1.3 11.4% 2 2 1.0 1.9%
ER Visits By Age
Group
Unduplicated
Clients
Served With a
PAF
Number of
Physical ER
Visits
Unduplicated
Number of
Clients With
Physical ER
Visits
Avg Number of
Physical ER
Visits
% Of
Clients
With
Physical ER
Visit
Unduplicated
Number of
Clients With
Mental Health
ER Visits
Number of
Mental
Health ER
Visits
Avg
Number
of
Mental
Health
ER Visits
% Of
Clients
With
Mental
Health
ER Visits
0‐15 144 4 3 1.3 2.1% 14 23 1.6 9.7%
16‐25 236 25 10 2.5 4.2% 38 96 2.5 16.1%
26‐59 1012 285 151 1.9 14.9% 136 482 3.5 13.4%
60+ 282 93 50 1.9 17.7% 24 49 2.0 8.5%
Unduplicated
Clients Served
# of Psychiatric
Hospitalizations
in FY 13/14
Unduplicated
Clients With
Psychiatric
Hospitalization
% of Clients
With
Psychiatric
Hospitalization
Psychiatric
Hospital Days
Average
Length of
Stay
1687 407 174 10.3% 4673 11.5
Hospitalizations

13 | P a g e
When looking at those reporting a specific race, African American partners represented
the highest percentage of partners with psychiatric hospitalizations at 12.6%, while Caucasian partners had the longest average length of stay in psychiatric hospitals (12.2 days).
Hispanic partners experienced the highest percentage of hospitalizations at 11.6%, while Non-Hispanic partners had a longer length of stay (11.6 days).
TAY partners (age 16-25) experienced the greatest percent of psychiatric hospitalizations; however, older adult partners (60+) had the longest average length of stay (14.1 days).
Homelessness Homelessness for purposes of this report refers to partners who reported being on the streets, or living in their car. It does not include data on partners in emergency shelters, or temporary housing. Homeless occurrences are captured using the KET form. To obtain data on homelessness, a KET must be completed to report the date the partner became homeless,
Hospitalizations By
Race
Unduplicated
Clients
Served
# of Psychiatric
Hospitalizations
in FY 13/14
Unduplicated
Clients With
Psychiatric
Hospitalization
% of Clients
With
Psychiatric
Hospitalization
Psychiatric
Hospital
Days
Avg Length of
Stay
Caucasian 679 191 78 11.5% 2333 12.2
African American 406 132 51 12.6% 1456 11.0
American Indian 16 0 0 0.0% 0 0.0
Asian/Pacific Islander 352 51 29 8.2% 535 10.5
Multi‐Race 21 0 0 0.0% 0 0.0
Other 152 33 16 10.5% 349 10.6
Unknown/Not Reported 61 0 0 0.0% 0 0.0
Hospitalizations By
Ethnicity
Unduplicated
Clients
Served
# of Psychiatric
Hospitalizations
in FY 13/14
Unduplicated
Clients With
Psychiatric
Hospitalization
% of Clients
With
Psychiatric
Hospitalization
Psychiatric
Hospital
Days
Avg Length of
Stay
Hispanic 181 43 21 11.6% 461 10.7
Not Hispanic 1396 361 151 10.8% 4197 11.6
Unknown/Not Reported 110 3 2 1.8% 15 5.0
Hospitalizations By
Age Group
Unduplicated
Clients
Served
# of Psychiatric
Hospitalizations
in FY 13/14
Unduplicated
Clients With
Psychiatric
Hospitalization
% of Clients
With
Psychiatric
Hospitalization
Psychiatric
Hospital
Days
Avg Length of
Stay
0‐15 151 15 11 7.3% 90 6.0
16‐25 238 101 35 14.7% 905 9.0
26‐59 1015 265 111 10.9% 3312 12.5
60+ 283 26 17 6.0% 366 14.1
14 | P a g e
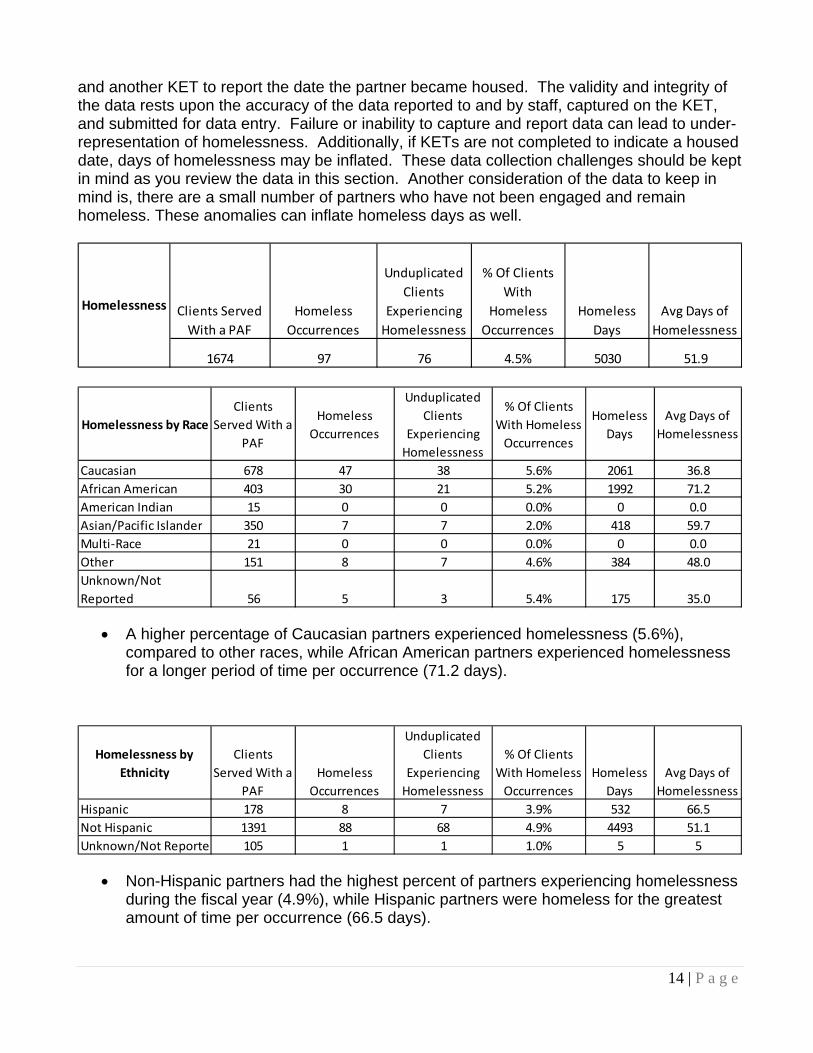
and another KET to report the date the partner became housed. The validity and integrity of the data rests upon the accuracy of the data reported to and by staff, captured on the KET, and submitted for data entry. Failure or inability to capture and report data can lead to under-representation of homelessness. Additionally, if KETs are not completed to indicate a housed date, days of homelessness may be inflated. These data collection challenges should be kept in mind as you review the data in this section. Another consideration of the data to keep in mind is, there are a small number of partners who have not been engaged and remain homeless. These anomalies can inflate homeless days as well.
A higher percentage of Caucasian partners experienced homelessness (5.6%), compared to other races, while African American partners experienced homelessness for a longer period of time per occurrence (71.2 days).
Non-Hispanic partners had the highest percent of partners experiencing homelessness during the fiscal year (4.9%), while Hispanic partners were homeless for the greatest amount of time per occurrence (66.5 days).
Clients Served
With a PAF
Homeless
Occurrences
Unduplicated
Clients
Experiencing
Homelessness
% Of Clients
With
Homeless
Occurrences
Homeless
Days
Avg Days of
Homelessness
1674 97 76 4.5% 5030 51.9
Homelessness
Homelessness by Race
Clients
Served With a
PAF
Homeless
Occurrences
Unduplicated
Clients
Experiencing
Homelessness
% Of Clients
With Homeless
Occurrences
Homeless
Days
Avg Days of
Homelessness
Caucasian 678 47 38 5.6% 2061 36.8
African American 403 30 21 5.2% 1992 71.2
American Indian 15 0 0 0.0% 0 0.0
Asian/Pacific Islander 350 7 7 2.0% 418 59.7
Multi‐Race 21 0 0 0.0% 0 0.0
Other 151 8 7 4.6% 384 48.0
Unknown/Not
Reported 56 5 3 5.4% 175 35.0
Homelessness by
Ethnicity
Clients
Served With a
PAF
Homeless
Occurrences
Unduplicated
Clients
Experiencing
Homelessness
% Of Clients
With Homeless
Occurrences
Homeless
Days
Avg Days of
Homelessness
Hispanic 178 8 7 3.9% 532 66.5
Not Hispanic 1391 88 68 4.9% 4493 51.1
Unknown/Not Reported 105 1 1 1.0% 5 5

15 | P a g e
Arrests and Incarcerations Arrests are captured using the KET form. As with the previous outcomes, the validity and integrity of the data rests upon accurate collection and submission. Failure or inability to capture and report data can lead to under-representation of arrests. Additionally, if KETs are not completed to indicate a release date, days of incarceration may be inflated. These data collection challenges should be kept in mind as you review the data in this section. While arrest data appears fairly consistent to incarceration data in regards to distribution across age categories, arrest data also highlights the discrepancies and challenges associated with data collection. For example, there were 209 reported incarcerations, yet only 178 reported arrests. While some individuals do not get arrested, but rather turn themselves in voluntarily, the likelihood of that happening to 15% of those incarcerated is unlikely. As a matter of fact, we might expect to see more arrests than incarcerations, because it is more likely to be arrested, and not spend the night in jail/juvenile hall, than it is to spend the night in jail/juvenile hall while not being arrested. Based on this inconsistency, interpretation of arrest data is limited. Incarceration refers to at least one night spent in jail, or a juvenile detention facility. Incarcerations are captured using the KET form. To interpret data on incarcerations, a KET must be completed to report the date the partner was incarcerated, and another KET to report that the partner was released.
Across all programs, 7.9% of partners experienced an arrest during the fiscal year, and 9.0% were actually incarcerated, with an average length of stay in jail of 49 days.
Homelessness by Age
Group
Clients
Served With a
PAF
Homeless
Occurrences
Unduplicated
Clients
Experiencing
Homelessness
% Of Clients
With Homeless
Occurrences
Homeless
Days
Avg Days of
Homelessness
0‐15 144 1 1 0.7% 115 115
16‐25 236 26 14 5.9% 1351 52.0
26‐59 1012 65 56 5.5% 3229 49.7
60+ 282 5 5 1.8% 335 67
Clients Served
With a PAF
Number of
Arrests
Unduplicated
Clients With
Arrests
% of Clients
With Arrests
Number of
Residential
Changes into
Jail
Unduplicated
Clients With
Residential
Changes into
Jail
% Of Clients
With
Residential
Changes into
Jail
Total Days
in Jail
Avg Days
in Jail
1674 178 132 7.9% 209 151 9.0% 10242 49.0
Arrests

16 | P a g e
African American partners had a considerably higher percentage of partners with arrests (12.4%) and incarcerations (14.4%), while Multi-Race and Other races had longer lengths of stay.
Partners reporting Hispanic ethnicity had a higher percentage of arrests (11.4%) and incarcerations (15.0%), while Non-Hispanics had longer lengths of stay.
In comparing arrest and incarceration rates between age groups, TAY youth (16-25) had the highest percentage of both arrests (14.4%) and incarcerations (16.9%).
Outcomes - Comparison Over Time Of 1,687 partners served, 1,674 of them had outcome forms entered into the State’s DCR database, enabling us to track outcomes. Data contained herein represents baseline measures (one year prior to enrollment) compared to FY 13/14 to illustrate changes over time.
Arrests and Jail by
Race Clients
Served With a
PAF
Number of
Arrests
Unduplicated
Clients With
Arrests
% of Clients
With Arrests
Number of
Residential
Changes
into Jail
Unduplicated
Clients With
Residential
Changes into
Jail
% Of
Clients
With
Residential
Changes
into Jail
Total
Days in
Jail
Avg Days
in Jail
Caucasian 678 75 56 8.3% 83 58 8.6% 3280 39.5
African American 403 75 50 12.4% 89 58 14.4% 4614 51.8
American Indian 15 0 0 0.0% 0 0 0.0% 0 0.0
Asian/Pacific Islander 350 10 9 2.6% 14 13 3.7% 797 56.9
Multi‐Race 21 2 2 9.5% 2 2 9.5% 244 122.0
Other 151 14 13 8.6% 18 17 11.3% 1230 68.3
Unknown/Not
Reported 56 2 2 3.6% 3 3 5.4% 77 25.7
Arrests and Jail by
Ethnicity Clients
Served With a
PAF
Number of
Arrests
Unduplicated
Clients With
Arrests
% of Clients
With Arrests
Number of
Residential
Changes
into Jail
Unduplicated
Clients With
Residential
Changes into
Jail
% Of
Clients
With
Residential
Changes
into Jail
Total
Days in
Jail
Avg Days
in Jail
Hispanic 178 31 21 11.8% 37 28 15.7% 1692 45.7
Non‐Hispanic 1391 144 108 7.8% 169 120 8.6% 8520 50.4
Unknown/Not
Reported 105 3 3 2.9% 3 3 2.9% 30 10.0
Arrests and Jail by Age
GroupClients
Served With a
PAF
Number of
Arrests
Unduplicated
Clients With
Arrests
% of Clients
With Arrests
Number of
Residential
Changes
into Jail
Unduplicated
Clients With
Residential
Changes into
Jail
% Of
Clients
With
Residential
Changes
into Jail
Total
Days in
Jail
Avg Days
in Jail
0‐15 144 11 11 7.6% 29 20 13.9% 2708 93.4
16‐25 236 49 34 14.4% 51 40 16.9% 2527 49.5
26‐59 1012 111 81 8.0% 123 87 8.6% 4835 39.3
60+ 282 7 6 2.1% 6 4 1.4% 172 28.7

17 | P a g e
This section of the report compares data over time for all partners who were served in a FSP Program in Sacramento County (Pathways, RO-JJDTP, TWC, Sierra, New Directions, Turning Point-ISA, and SOAR) between July 1, 2013 and June 30, 2014. The majority of data was pulled from the FSP forms, as described earlier (PAF, 3M, KET). However, inpatient hospitalizations, demographics, and diagnosis information was obtained from Avatar. For this reason, the total N for some outcomes will vary. For the data taken from Avatar, all partners served will be included in the N. For the data taken from FSP Outcome forms, only those partners who have data in the State’s database will be included in the N, which is slightly less. The following charts reflect partners’ baseline data, as it compares to their reported or annualized data during the fiscal year. Annualized data was calculated for partners who enrolled into a FSP after the fiscal year began, and is calculated as follows: number of occurrences (or days), divided by the number of days enrolled during the fiscal year, then multiplying that quotient by 365 days.
1730
803
0
300
600
900
1200
1500
1800
2100 Mental Health ER VisitsN = 1674
At Baseline
In FY 13‐14
56.6% Decrease
1184
429
0
200
400
600
800
1000
1200
1400
Physical Health ER Visits
At Baseline
In FY 13‐14
63.8% Decrease

18 | P a g e

19 | P a g e
78.1% Decrease
68.3% Decrease
71.9% Decrease
71.0% Decrease

20 | P a g e
74.7% Decrease
86.3% Decrease
70.3% Decrease
21 | P a g e
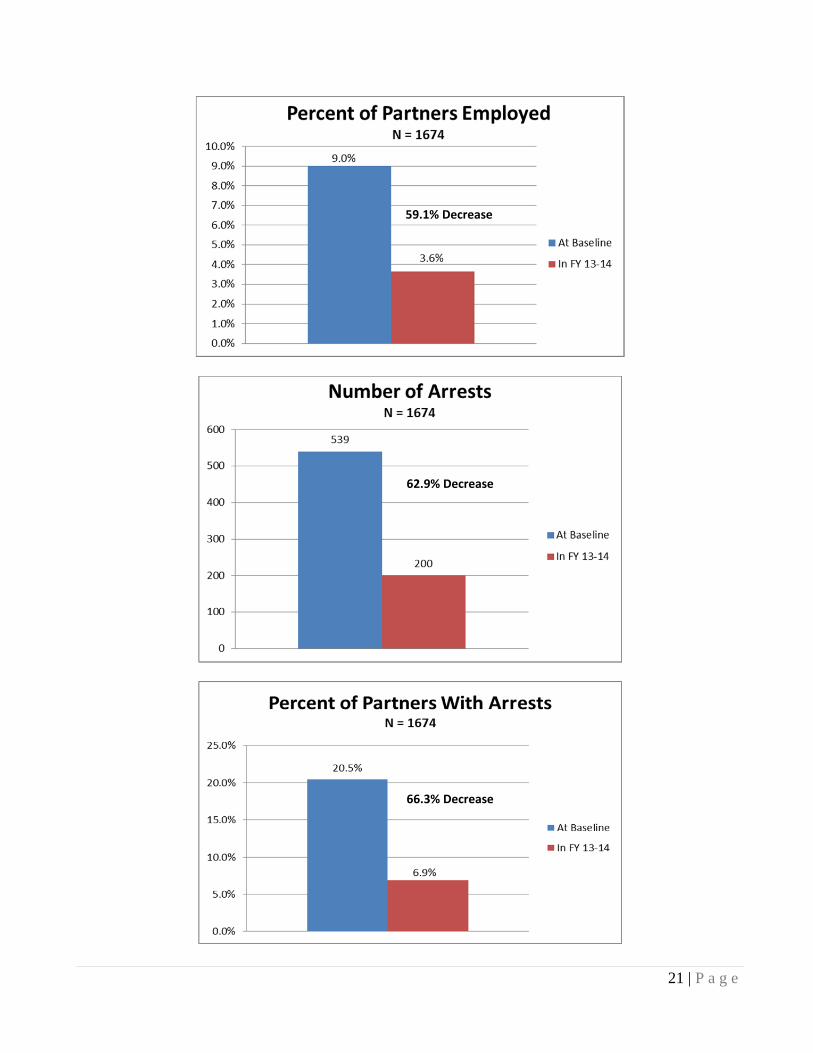
59.1% Decrease
62.9% Decrease
66.3% Decrease

22 | P a g e
36.3% Decrease
51.5% Decrease
29.6% Decrease 29.6% decrease

23 | P a g e
1086
1340
0
200
400
600
800
1000
1200
1400
1600
Partners with Primary Care PhysicianN = 1674
At Baseline
In FY 13‐14
54.4% Decrease
23.4% Increase
36.0% Decrease
55.6% Decrease
24 | P a g e
Conclusion Data collection and data integrity are essential in analyzing FSP services provided in Sacramento County. The Research, Evaluation, and Performance Outcome Unit (REPO) dedicates greater than one FTE to oversee the training, collection, and reporting of FSP Assessment Forms. REPO provides technical support and training on FSP data collection to all FSP providers on a regular basis. The 99.2% completion rate of Partnership Assessment Forms (PAF) attests to the diligence of both REPO, and the provider, in completing the initial assessment upon entrance into FSP programs. REPO continues to provide training in the collection of KETS, and is working with providers to increase the submission of these key outcome forms. Even though there is some caution needed when analyzing self-report data, the data contained in this report provides valuable information for program evaluation and improvement. Marked decreases are shown in nearly every key outcome, such as days incarcerated, arrests, inpatient hospitalization ER visits, etc. One of the key goals of the MHSA and FSP programs is to decrease the long-term impact of untreated serious mental illness. While partners receiving FSP services continue to experience incarcerations, arrests, hospitalizations, become homeless, and have emergency room visits, the data clearly shows that the incidences of these negative outcomes have decreased significantly after receiving FSP services. FSP programs in Sacramento County are helping the partners they serve, and are contributing to their wellness and recovery.
25 | P a g e
ADDENDUM
Program Descriptions There are currently seven FSP programs serving Children (0-15), TAY (16-25), Adults (26-59) and Older Adults (60+) throughout Sacramento County. FSPs are intended to use a “whatever it takes” approach to services, offering a broad range of services from the traditional medication management and crisis services, to more non-traditional services, such as housing and alternative healing practices. Every program provides a varying array of 24-hour, wrap around services to the people they serve. The following describes each program’s population served:
Turning Point-Integrated Services Agency (TP-ISA) - Serves Adults (18+) and Older Adults with persistent and significant mental health illness. The program assists clients to transition into the community from high-cost restrictive placements, such as the Sacramento County Mental Health Treatment Center, private psychiatric hospitals, incarcerations, or other secured settings.
Telecare - Sacramento Outreach Adult Recovery (SOAR) – Serves Adults (18+) and Older Adults with persistent and significant mental health illness. The program assists clients to transition into the community from high-cost restrictive placements, such as the Sacramento County Mental Health Treatment Center, private psychiatric hospitals, incarcerations, or other secured settings.
TLCS New Direction – provides permanent supportive housing and an FSP level of mental health services and supports for Adults (18+), including Older Adults, and their families. The program provides integrated, comprehensive services utilizing a “whatever it takes” approach to support consumers in meeting their desired recovery goals. New Direction provides short-term housing and focuses on rapid access to permanent housing within 30 days once income is secured. Longer term temporary housing is also available through New Directions
Turning Point – Pathways - Provides permanent supportive housing and an FSP level of mental health services and supports for children, youth, adults, older adults and families who are homeless or at risk of becoming homeless. The program provides integrated, comprehensive services utilizing a “whatever it takes” approach to support consumers and their families in meeting their desired recovery goals.
River Oak - Juvenile Justice Diversion and Treatment Program (JJDTP) – Serves pre-adjudicated and adjudicated youth, between the ages of 13 and 17 at time of admission, with serious emotional disturbance. JJDTP provides screenings, assessments and intensive mental health services and FSP supports to eligible youth (and their families) involved in the Juvenile Justice System.
Asian Pacific Community Counseling (APCC) - Transcultural Wellness Center (TWC) – Serves Children, TAY, Adults, and Older Adults in the Asian/Pacific Islander community, while addressing their unique cultural needs. TWC provides a full range of services, with interventions and treatments that incorporate cultural and religious beliefs and values; such as, traditional and natural healing practices, and ceremonies recognized by the API communities.
El Hogar - Sierra Elder Wellness – Serves Transition Age Older Adults ages 55 to 59, and Older Adults ages 60 and over. Sierra provides specialized geriatric psychiatric support, multidisciplinary mental health assessments, treatment, and intensive case management services for partners who have multiple co-occurring mental health, physical health, and/or substance abuse issues.

26 | P a g e
Utilization During FY 13/14 there were a total of 1,687 unduplicated partners who received services at the FSPs. The table below provides information, by program, on the number of partners served, admits, discharges, length of stay, and attrition rate. Client attrition rate is the turnover rate of clients in the program, and is calculated as follows: Number of clients discharged, divided by the average number of clients served (clients at the beginning of the year, plus the number of clients at the end of the year, divided by two).
Note: Total N is greater than the number of unduplicated partners, as some partners were served in multiple programs throughout the year
Unduplicated FSP Clients
Served by Episode
Undup #
Served
(N)
PercentUndup # of Ptnrs
Admitted in Year
Undup # of Ptnrs
Discharged in YearAvg LOS Attrition
Rate
ISA 169 10.0% 25 23 2.2 Years 15.6%
New Direction 307 18.1% 62 46 2.5 years 17.8%
Pathways 396 23.4% 42 41 3.0 Years 11.5%
JJDTP 163 9.6% 80 83 11.8 Months 98.8%
SOAR 173 10.2% 26 21 2.8 Years 14.0%
TWC 315 18.6% 86 71 2.1 Years 29.6%
Sierra 169 10.0% 48 39 2.9 Years 30.5%
Total 1692 100.0% 369 324 2.1 Years 23.8%

27 | P a g e
Discharges
Reasons were provided for all discharges during the fiscal year, with the most prominent reasons being Completed Mental Health Services, Receiving Services Elsewhere, and partner Refused/ Decline Services
Demographics Gender
TP-ISA, New Direction and RO-JJDTP serve more males than females Pathways, SOAR, TWC and serve more females than males JJDTP serves the highest percent of men and Sierra serves the highest percent of
women
Reason For Discharge
N = 326 ISA
New
Direction Pathways JJDTP SOAR TWC Sierra
Receiving Services Elsewhere 9 13 4 7 11 6 22
Whereabouts Unknown 3 8 9 1 1 5 4
Deceased 3 3 3 0 2 3 8
Completed MH Services 0 3 8 35 2 20 0
Moved out of Sac County 3 6 8 2 2 6 1
Refused/Declined Services 3 5 7 25 2 20 2
Other 3 9 2 13 1 11 2
Reason Not Available 0 0 0 0 0 0 0
Total 24 47 41 83 21 71 39
Percent of Total Discharges 7.4% 14.4% 12.6% 25.5% 6.4% 21.8% 12.0%

28 | P a g e
Age Group
Ethnicity
Race
Race
ISA
N=168
New
Direction
N=307
Pathways
N=394
JJDTP
N=163
SOAR
N=171
TWC
N=315
Sierra
N=169
Caucasian 53.0% 55.0% 44.7% 28.8% 49.7% 1.6% 61.5%
African American 18.5% 31.9% 35.3% 42.3% 25.1% 0.3% 18.3%
American Indian 0.0% 1.6% 1.8% 1.8% 0.6% 0.0% 0.6%
Asian/Pacific Islander 13.1% 2.3% 3.8% 5.5% 7.6% 88.3% 4.1%
Multi Race 0.6% 2.3% 1.0% 1.8% 0.0% 1.0% 1.2%
Other Race 11.9% 5.9% 9.4% 18.4% 14.6% 1.6% 8.9%
Unknown/Not Reported 3.0% 1.0% 4.1% 1.2% 2.3% 7.3% 5.3%

29 | P a g e
Primary Language
Diagnosis
Emergency Room Visits
Primary Language
ISA
N=168
New
Direction
N=307
Pathways
N=394
JJDTP
N=163
SOAR
N=171
TWC
N=315
Sierra
N=169
English 90.5% 98.4% 97.0% 96.9% 95.9% 26.3% 93.5%
Spanish 2.4% 1.0% 1.8% 2.5% 0.6% 1.3% 4.1%
Russian 1.8% 0.3% 0.3% 0.0% 1.2% 0.0% 0.6%
Cantonese 0.6% 0.0% 0.0% 0.0% 0.0% 11.1% 0.0%
Vietnamese 0.6% 0.0% 0.0% 0.0% 0.0% 19.7% 0.0%
Hmong 0.0% 0.0% 0.0% 0.0% 1.2% 23.2% 0.0%
Other 3.6% 0.3% 1.0% 0.6% 1.2% 15.6% 0.6%
Unknown/Not Reported 0.6% 0.0% 0.0% 0.0% 0.0% 2.9% 1.2%
Primary Diagnosis
TP‐ISA
N=169
Direction
N=307
Pathways
N=396
JJDTP
N=163
SOAR
N=173
TWC
N=315
Sierra
N=169
Depressive 1.2% 24.8% 23.6% 22.7% 3.5% 42.5% 17.2%
Bipolar 4.2% 27.7% 21.6% 0.6% 9.9% 5.1% 18.9%
Psychotic 93.5% 30.9% 24.6% 4.3% 84.8% 24.1% 60.4%
Anxiety/PTSD 1.2% 11.4% 18.5% 6.1% 0.6% 8.3% 0.6%
Disruptive Disorders 0.0% 0.0% 3.3% 61.3% 0.0% 7.9% 0.0%
Adjustment 0.0% 0.0% 3.6% 2.5% 0.0% 7.9% 0.0%
Substance Related 0.0% 0.0% 0.0% 0.0% 0.0% 0.0% 0.0%
Personality Disorder 0.0% 0.0% 0.0% 0.0% 0.0% 0.0% 0.0%
Other* 0.0% 5.2% 4.8% 1.8% 0.6% 2.2% 2.4%
Unknown/Not Reported 0.0% 0.0% 0.0% 0.6% 0.6% 1.9% 0.6%
ER VisitsUnduplicated
Clients
Served With a
PAF
Unduplicated
Number of
Clients With
Physical ER Visits
Number of
Physical ER
Visits
Avg Number of
Physical ER
Visits
% Of Clients
With
Physical ER
Visit
Unduplicated
Number of
Clients With
Mental Health
ER Visits
Number of
Mental Health
ER Visits
Avg
Number
of Mental
Health ER
Visits
% Of
Clients
With
Mental
Health
ER Visits
ISA 169 51 144 2.8 30.2% 59 225 3.8 34.9%
New Direction 305 37 50 1.4 12.1% 37 73 2.0 12.1%
Pathways 396 52 83 1.6 13.1% 29 88 3.0 7.3%
JJDTP 159 2 2 1.0 1.3% 13 16 1.2 8.2%
SOAR 173 20 33 1.7 11.6% 46 192 4.2 26.6%
TWC 308 14 27 1.9 4.5% 14 25 1.8 4.5%
Sierra 169 38 68 1.8 22.5% 17 31 1.8 10.1%

30 | P a g e
ISA partners reported the greatest percentage of ER visits, with 34.9% reporting a
Mental Health ER visit, and 30.2% reporting an ER visit of a physical nature.
Inpatient Hospitalizations
ISA partners had the highest percentage of partners with psychiatric hospitalizations at 22.5%, followed by Telecare SOAR partners at 20.8%
HospitalizationsUnduplicated
Clients
Served
# of Psychiatric
Hospitalizations
in FY 13/14
Unduplicated
Clients With
Psychiatric
Hospitalization
% of Clients
With
Psychiatric
Hospitalization
Psychiatric
Hospital
Days
Average
Length of Stay
ISA 169 90 38 22.5% 1301 14.5
New Direction 307 59 26 8.5% 832 14.1
Pathways 396 88 38 9.6% 665 7.6
JJDTP 163 10 7 4.3% 63 6.3
SOAR 173 112 36 20.8% 1332 11.9
TWC 315 27 15 4.8% 252 9.3
Sierra 169 21 14 8.3% 228 10.9

31 | P a g e
Homelessness
Arrests and Incarcerations
Homelessness Clients
Served With a
PAF
Homeless
Occurrences
Unduplicated
Clients
Experiencing
Homelessness
% Of Clients
With Homeless
Occurrences
Homeless
Days
Avg Days of
Homelessness
ISA 169 5 4 2.4% 90 18
New Direction 305 27 23 7.5% 885 32.78
Pathways 396 56 42 10.6% 3823 68.27
JJDTP 159 0 0 0.0% 0 0
SOAR 173 5 3 1.7% 35 7
TWC 308 2 2 0.6% 173 86.5
Sierra 169 2 2 1.2% 24 12
Arrests and Jail Clients
Served With a
PAF
Number of
Arrests
Unduplicated
Clients With
Arrests
% of Clients
With Arrests
Number of
Residential
Changes
into Jail
Unduplicated
Clients With
Residential
Changes into
Jail
% Of Clients
With
Residential
Changes into
Jail
Total Days
in Jail
Avg Days
in Jail
ISA 169 25 19 11.2% 22 20 11.8% 1017 46.2
New Direction 305 33 30 9.8% 39 33 10.8% 1566 40.2
Pathways 396 48 29 7.3% 47 34 8.6% 1506 32.0
JJDTP 159 33 25 15.7% 50 35 22.0% 4620 92.4
SOAR 173 34 24 13.9% 44 22 12.7% 1092 24.8
TWC 308 3 3 1.0% 5 5 1.6% 387 77.4
Sierra 169 2 2 1.2% 2 2 1.2% 54 27.0

32 | P a g e
Outcomes - Comparison Over Time Each program serves a unique population, so outcomes are going to differ between programs. The graphs below are meant for individual program comparison from baseline to FY 13/14 and not for comparison across programs.

33 | P a g e
Totals for each number of occurrences will not always equal sum of all agencies, as some partners were served by more than one agency
Partners With Residence
Change To Hospital
Baseline ISA New Direction Pathways JJDTP SOAR TWC Sierra Total
1 Occurrence 30 45 46 10 33 38 22 224
2 Occurrences 18 8 36 2 32 12 13 121
3 Or More Occurrences 39 24 26 1 33 13 19 155
Total Undup 87 77 108 13 98 63 54 500
Partners With Residence
Change To Hospital
FY13/14 ISA New Direction Pathways JJDTP SOAR TWC Sierra Total
1 Occurrence 17 14 15 3 12 7 3 71
2 Occurrences 8 2 10 1 8 3 2 34
3 Or More Occurrences 14 6 7 0 13 3 2 45
Total Undup 39 22 32 4 33 13 7 150

34 | P a g e

35 | P a g e

36 | P a g e

37 | P a g e
Totals for each number of occurrences will not always equal sum of all agencies, as some partners were
served by more than one agency
Partners With
Residence Change To
Jail Baseline TP‐ISA
TLCS
New Direction TP‐Pathways RO ‐ JJDTP
Telecare
SOAR APCC‐TWC El Hogar ‐ Sierra Total1 Occurrence 17 28 46 90 15 7 3 206
2 Occurrences 2 6 4 30 5 1 2 50
3 Or More Occurrences 4 5 6 9 2 1 0 27
Total Undup 23 39 56 129 22 9 5 283
Partners With
Residence Change To
Jail
FY 13/14 TP‐ISA
TLCS
New Direction TP‐Pathways RO ‐ JJDTP
Telecare
SOAR APCC‐TWC El Hogar ‐ Sierra Total1 Occurrence 16 24 21 19 9 3 2 94
2 Occurrences 2 3 7 12 6 1 1 32
3 Or More Occurrences 0 1 5 3 3 0 0 12
Total Undup 18 28 33 34 18 4 3 138