mengfei jiang, xi liang, david reiner, boqiang lin
TRANSCRIPT

www.eprg.group.cam.ac.uk
Stakeholder Views on Interactions between Low-carbon Policies and Carbon Markets in China: Lessons from the Guangdong ETS
EPRG Working Paper 1805
Cambridge Working Paper in Economics 1811
Mengfei Jiang, Xi Liang, David Reiner, Boqiang Lin, Maosheng Duan
Abstract China set up pilot Emission Trading Schemes (ETS) in seven cities and
provinces from 2013 as a new instrument to incentivise carbon dioxide emission reduction and
to reach its 40-45% carbon intensity reduction target by 2020. Using a two-stage survey (a
closed-form questionnaire followed by open interviews), we elicit views of stakeholders from
Guangdong province on carbon markets, with an emphasis on how ETS would interact with
other existing or proposed low-carbon and clean energy policies. Our survey shows that
academic stakeholders viewed the interactions between the carbon market and other low-
carbon policies as a significant potential problem but there was less awareness by stakeholders
from other sectors. There is a positive correlation between recognising such policy interactions
may pose a problem and the time spent working on energy saving and emission reduction
policies. Whereas both increasing renewable targets and imposing a carbon tax in addition to
an existing ETS would be expected to depress prices in the ETS, relatively few respondents
identified this effect correctly. Apart from government respondents, all other stakeholders
lacked confidence in China’s carbon markets, which is associated with both their lack of
knowledge and information about the market and concerns regarding uncertainties and
government policy design. The need for learning from the pilot schemes particularly on
monitoring, reporting and verification was seen as vital but challenging given the speed of
rolling out a national ETS.
Keywords Emissions trading, China, Carbon pricing; Guangdong ETS pilot; Stakeholder
survey; Climate change policy; Low-carbon policy interactions
JEL Classification H23, Q58, N45, Q48, Q54
Contact [email protected] Publication February 2018 Financial Support Foreign and Commonwealth Office

1
Stakeholder Views on Interactions between Low-carbon Policies and
Carbon Markets in China: Lessons from the Guangdong ETS
Mengfei Jiang1, Xi Liang1, David Reiner2, Boqiang Lin3, Maosheng Duan4
Abstract: China set up pilot Emission Trading Schemes (ETS) in seven cities and
provinces from 2013 as a new instrument to incentivise carbon dioxide emission
reduction and to reach its 40-45% carbon intensity reduction target by 2020. Using a
two-stage survey (a closed-form questionnaire followed by open interviews), we elicit
views of stakeholders from Guangdong province on carbon markets, with an emphasis
on how ETS would interact with other existing or proposed low-carbon and clean
energy policies. Our survey shows that academic stakeholders viewed the interactions
between the carbon market and other low-carbon policies as a significant potential
problem but there was less awareness by stakeholders from other sectors. There is a
positive correlation between recognising such policy interactions may pose a problem
and the time spent working on energy saving and emission reduction policies. Whereas
both increasing renewable targets and imposing a carbon tax in addition to an existing
ETS would be expected to depress prices in the ETS, relatively few respondents
identified this effect correctly. Apart from government respondents, all other
stakeholders lacked confidence in China’s carbon markets, which is associated with
both their lack of knowledge and information about the market and concerns regarding
uncertainties and government policy design. The need for learning from the pilot
schemes particularly on monitoring, reporting and verification was seen as vital but
challenging given the speed of rolling out a national ETS.
Keywords: Emissions trading, China, Carbon pricing; Guangdong ETS pilot;
Stakeholder survey, Climate change; Low-carbon policy interactions
JEL Codes: H23, Q58, N45, Q48, Q54
Acknowledgements: We thank the UK Foreign and Commonwealth Office’s EU-
Guangdong ETS Linkage Project for supporting this study. Thanks also to Philip Curry
for his detailed comments.
1 Centre for Business and Climate Change, University of Edinburgh Business School, Edinburgh, UK 2 Cambridge Judge Business School, University of Cambridge, Cambridge, UK 3 China Center for Energy Economics Research, Xiamen University, Xiamen, China 4 Institute of Energy, Environment and Economy, Tsinghua University, Beijing, China

2
1. Introduction
China’s economy has been growing at a sustained average annual rate of over 9% for
three decades and energy use has therefore increased five times since 1980 (to nearly 3
billion tons of oil equivalent in 2011) (IEA, 2016). In 2010, China’s energy
consumption exceeded the United States (Lee and Zhang, 2012). As coal continues to
dominate the primary energy structure and occupy a majority of incremental electricity
demand in China, energy consumption growth driven by rapid economic China to
become the world’s leading emitter of greenhouse gas emissions (GHGs) (Guan et al.,
2008). The Paris Accord agreed in December 2015 sets out a global action plan to put
the world on track to avoid dangerous climate change, by limiting global warming to
well below 2°C above pre-industrial levels in the long-term, and to pursue best efforts
to limit increased warming to 1.5°C (UNFCCC, 2015). China also formally submitted
its intended nationally determined contribution (INDC) to the new global climate
agreement as lowering carbon dioxide intensity by 60-65% from 2005 levels and
peaking its greenhouse gas emission by around 2030 (NDRC, 2015).
Since the emergence of the EU emissions trading scheme (ETS), which has been the
main means for Europe to drive emission reductions cost-effectively using market
forces, the world has witnessed a rapid growth in national and sub-national emission
trading schemes (World Bank, 2014). The New Zealand Emissions Trading Scheme
(NZ ETS) started in 2008 and is the first ETS covering the forestry and waste sectors.
The Swiss ETS was also introduced in 2008 and now covers 55 companies from 25
categories of activities, and in 2017 agreed to link to the EU ETS. In the U.S., the
Regional Greenhouse Gas Initiative (RGGI) began operation in 2009 and covers carbon
dioxide emissions from power plants in nine Northeast and Mid-Atlantic states. In
Canada, in 2007, the province of Alberta set up a GHGs reduction program under its
Specified Gas Emitters Regulation (SGER). The largest cap-and-trade system outside
of Europe is that of California, which in 2014 linked up to the smaller cap-and-trade
system in the province of Quebec and in 2018 expanded to the province of Ontario. In
addition, Japan has established various sub-national systems since 2010 including ETSs
in Tokyo, Kyoto and Saitama.
Although China has not adopted mandatory national emission abatement targets, initial
steps towards a national carbon market have been taken through piloting regional
carbon emission trading systems, with an eye to establishing a carbon pricing system
in the country. In March 2011, China officially included pilot ETSs into the Twelfth
Five-Year Plan with a view to helping meet its 2020 carbon intensity target (Cui et al.,
2014). In October 2011, seven pilot cities and provinces (Figure 1) were authorized to
proceed by the central policy-making body, the National Development Reform
Commission (NDRC) (NDRC, 2011). Since the final pilot ETS commenced trading in
Chongqing on 19 June 2014, all seven pilots in China have been in operation. Carbon
dioxide emissions are being monitored in China’s pilot schemes so far (although the
Chongqing pilot ETS also covers non-CO2 GHGs including CH4 and N2O), and the
trading period of the seven pilot ETS ran from 2013 through 2016, after which a

3
national ETS was launched on 19 December 2017 (NDRC, 2016; NDRC, 2017).
Initially, the seven Chinese pilot ETS were scheduled to end after three compliance
years and be replaced by the national ETS in 2016. However, as the launch of national
ETS was postponed to the end of 2017, the pilots were continue operating until then
and probably also beyond. The initial phase of the national ETS will give regulators the
opportunity to improve system design as well as allow market participants time to
familiarize themselves with the ETS based on experiences in the pilots.
243.1
MtCO2e 463.1 MtCO2e
215
MtCO2e
188.1
MtCO2e
297.7
MtCO2e
610.5 MtCO2e
153
MtCO2e
Per Capita GDP Growth in 2013:
Above 11.1%
9.1 – 11.0%
7.1 - 9.0%
Below 7.0%
Beijing
28 November, 2013
Tianjin
26 December, 2013
Shanghai
26 December, 2013
Hubei
2 April, 2014
Shenzhen
18 June, 2013Guangdong
18 December, 2013
Chongqing
19 June, 2014
Numbers in bubbles show the total GHG emissions (MtCO2e) in seven pilots in 2012
Figure 1 Map of seven pilot ETSs in China (Ernst & Young, 2014)
Each province or city participating in a pilot ETS has a different economic growth
outlook and GHG emissions profile, which implies each pilot ETS will have different
effective reduction targets and design characteristics in order to achieve its target. For
instance, Beijing, Tianjin, Shanghai, Shenzhen are commercial centres along the coast,
with relatively higher GDP per capita, and larger commercial and residential buildings
are covered in these ETS (Table 1). Conversely, Hubei and Chongqing are located in
central China with a lower GDP per capita but higher GDP growth rates and are less
commercialised. Accordingly, these pilot ETS cover heavy industrial sectors only, and

4
emissions offset credits must originate from within their own provinces, because the
abatement cost is expected to be cheaper within these provinces (Ernst & Young, 2014).
The diversity of the emissions trading market design roughly corresponds to the
regional income level, thus regional emission reduction targets can be achieved without
adversely affecting economic growth projections.
Guangdong Province, often referred to as the Pearl River Delta Economic Zone, has
some characteristics of an advanced industrialized economy. Guangdong Province
contributes 11.6% of national GDP in 2013, and the Guangdong ETS pilot is the largest
of the seven schemes, with an absolute cap of 408 MtCO2 in 2014, initially covering
the power and industry sectors, to be followed by the transportation sector. These
sectors account for more than half of the province’s emissions (ICAP, 2016). Hence,
the experiences of implementing carbon emission trading policies in Guangdong will
be important in designing and operating a larger national ETS. To avoid any confusion
with the other six pilot systems, survey respondents were asked to provide all their
answers with reference to the Guangdong pilot. The detailed survey design is described
in section 2.
1.1. Interactions across low-carbon incentive policies
Since the launch of the EU ETS in 2005, emissions trading has become a popular
instrument to encourage climate mitigation globally (Brouwers et al., 2016; Yang et al.,
2016; Wang et al., 2015; ECCC, 2015; Cui et al., 2014). However, the collapse of EU
allowances (EUAs) prices in 2008 following the global financial crisis significantly
weakened incentives to continue reducing emissions. Although the financial crisis of
2008-2009 and overly generous national allowance allocations (IETA, 2014; Zhang and
Wei, 2010; Schleich, et al., 2009) were generally recognized as the principal causes for
the drop, further studies have shown that the interactions between the emissions trading
market and competing energy and low-carbon policies also contributed to weakening
impact on the ETS.
Hone (2013) argues the EU ETS, in combination with other low-carbon policies
(notably binding European commitments on renewables) has ‘distorted emissions
mitigation economics across the EU, and the recession has further exacerbated the
situation’. Figure 2 demonstrates the shift of the abatement curve driven by parallel
low-carbon policies: the marginal abatement cost curve (MACC) is a set of points
reflecting the options with marginal costs and emission reductions (Ellerman and
Decaux, 1998). With the increasing emission reductions, the option with the lower
marginal abatement cost sets the price for emission permits. Total emission reductions
will be achieved at least cost until the equilibrium market price has been reached (Ekins,
et al., 2012) (Figure 2(a)). In principle, if a country adopts a stringent mandatory policy
to promote low-carbon technologies through parallel energy and low carbon policies
(such as an ambitious renewable obligation target, a mandatory energy efficiency
program, or a high carbon tax), the MACC would shift to the right (as illustrated in
Figure 2(b)) and thereby the carbon price visible in the market will fall.

5
Table 1 Overview of ETS pilots in China
Shenzhen Shanghai Beijing Guangdong Tianjin Hubei Chongqing
General Information
Starting Date 18 Jun. 2013 26 Nov. 2013 28 Nov. 2013 19 Dec. 2013 26 Dec. 2013 2 Apr. 2014 19 Jun. 2014
Reduction Target5 21% 20.5% 20.5% 20.5% 20.5% 19.5% 19.5%
GHG emissions6
(MtCO2e)
153 297.7 188.1 610.5 215 463.1 243.1
Per Capita GDP
(2013)
CNY 136,947
(EUR 18,727)
CNY 90,092
(EUR 12,320)
CNY 93, 213
(EUR 12,746)
CNY 58,540
(EUR 8,005 )
CNY 99,607
(EUR 13,621)
CNY 42,613
(EUR 5,827)
CNY 42,795
(EUR 5,852)
Per Capita GDP
Growth (2013)
11.5% 6.1% 5.2% 7.8% 7.9% 9.7% 11.3%
ETS Size
Absolute Cap
(MtCO2)
34.78
(2015)
155
(2016)
46
(2016)
422
(2016)
160-170
(2016)
253
(2016)
100.4
(2016)
Estimated Coverage 40% 57% 45% 60% 60% 35% 40%
Scope Industry; Power;
Buildings
Industry;
Transport;
Aviation;
Buildings
Industry; Power;
Buildings
Industry; Power Industry; Power;
Buildings
Industry; Power Industry;
Power
Firm or facility-level
threshold for inclusion
in ETS
Enterprise: 5,000
tCO2e/year;
public buildings:
20,000 m2;
government
buildings: 10,000
m2
Power and
industry: 20,000
tCO2/year; non-
industry: 10,000
tCO2/year
5,000 tCO2/year,
considering both
direct and indirect
emissions
20,000 tCO2/year
or 10,000 tce/year
energy
consumption
20,000 tCO2/year
considering both
direct and indirect
emissions
10,000 tce/year
energy
consumption
20,000
tCO2e/year
5 Carbon intensity reduction target by 2020 (end of the 13th Five-Year Plan), based on carbon intensity level in 2015. 6 Overall GHG emissions excluding LULUCF in 2012.

6
Allocation and Purchase
Allocation
methodology
Bench-marking Bench-marking
and Grand-
fathering7
Bench-marking
and Grand-
fathering8
Bench-marking
and Grand-
fathering9
Bench-marking
and Grand-
fathering
Grand-fathering Grand-fathering
Purchase allowance Auction (3% of
allowances in
2014)
One-off action
before
compliance
deadline
Buy or auction
allowances in
order to stabilize
the market.
Auction (3% in
2013 and 10% in
2015, 2016)
Buy or sell
allowances in
order to stabilize
the market
Auction
(small proportion)
Free allocation;
reduction factors
will be applied if
allocation
exceeds the cap;
Flexibility
Banking Allowed
Borrowing Not allowed
Offsetting10 Domestic offsets
Offset Limitation11 10% 5% 5% 10% 10% 10% 8%
Compliance
Compliance period one year
MRV Annual reporting of CO2; third-party verification is required
Penalties for non-
compliance
CNY 50,000-
150,000
(EUR 6,544-
19,632)
CNY 10,000-
50,000
(EUR 1,308-
6,544)
up to 50,000
(EUR 6,544)
CNY 10,000-
50,000
(EUR 1,308-
6,544)
No financial
penalties
CNY 10,000-
150,000
(EUR 1,309-
19,632)
No financial
penalties
Penalties for failing to
surrender enough
allowances
3 times the
average market
price
N/A 3-5 times of
average market
price
2 times of
allowances
deducted from
allocation for the
following year
Disqualified for
preferential
financial support
and policies for 3
years
1-3 times of the
average market
price
Disqualified for
preferential
financial support
and policies for 3
years
Sources: NDRC, 2013; ICAP, 2018; China Statistical Yearbook, 2014
7 Mainly free allocation through grandfathering based on 2009-2012 emissions or emissions intensity; Bench-marking is for specific entities. 8 Mainly free allocation through grandfathering based on 2009-2012 emissions or emissions intensity; Bench-marking for new entrants and entities with expanded capacity. 9 Mainly free allocation through grandfathering based on 2009-2012 emissions or emissions intensity; Bench-marking for electricity generators, certain cement and iron and steel industrial
processes and new entrants. 10 Domestic project-based carbon offset credits - China Certified Emission Reductions (CCER) are allowed. 11 The use of CCER credits is limited to corresponding proportion of the annual compliance obligation.

7
In theory, energy and low-carbon policies could act in a complementary manner: for
instance, renewable energy obligations could contribute to carbon emission reduction
targets while carbon abatement instruments should stimulate renewable energy
deployment (Fischer and Preonas, 2010). However, a number of studies highlight that
in practice there has been duplication and conflict between different policies that are all
nominally meant to work together to incentivize emission reductions: Sorrell (2003)
points out that the UK renewable obligation would interact with the EU ETS such that
emissions reductions would be double counted and no extra reduction would be
achieved. Furthermore, other studies show how a renewable obligation can depress
emission prices in an ETS (Pethig and Wittlich, 2009; Bohringer and Resendahl, 2010;
Sijm, 2011; Richstein et al., 2015), and do not contribute to long-term emissions
reductions (Syri and Cross, 2013). Although a number of studies on interactions have
focused on Europe, there are few studies of potential interactions between different
climate change and renewables policies in China.
Cost of carbon emission
reduction
MACC
MACC
Carbon emission reduction
amount
Real carbon price
Visible carbon price
Reduction target
Real reduction demand
Hidden carbon price
Carbon emission reduction
amount
Cost of carbon emission reduction
Mandatory
policies,
such as
Renewable
Obligations,
etc.
(a)
(b)
Figure 2 Impact of parallel low-carbon policies on marginal abatement cost curve
(MACC) (adopted from Hone, 2013)
1.2. Motivation and contribution
China is still at an early stage in establishing a functional and effective emission trading
system to facilitate GHG emissions reductions, so existing studies mainly describe the
market features and characteristics (Cheng and Zhang, 2011; Zhou and Duan, 2011;
Zhang, et al., 2014; Duan et al., 2014), market design and relevant legal and regulatory
issues (Fan and Wang, 2014; Wu et al., 2014; Jiang et al., 2016; Qi et al, 2014a), or
model the economic performance and impact of emission trading in China at some point

8
in the future (Zhou, et al., 2013; Qi, et al., 2014b). The history of potentially competing
policies, such as renewable energy support, is longer in China, but has taken many
forms over the past decade and has not settled into as clear a policy signal as, for
example, the Renewable Energy Directive in the European Union (Ragwitz and
Steinhilber, 2014).
The design and implementation of carbon market are influenced by different
stakeholders: government and industry who are directly involved in the markets,
academics and non-government organizations (NGOs) who have relevant expertise or
experience and will also contribute to market design and functioning. Consequently, it
is critically important to investigate stakeholder views on the Chinese carbon market
because policy construction would benefit from greater participant confidence, which
would contribute to wider public acceptance.
Although previous studies suggest parallel low-carbon policies could influence
allowance prices in the ETS and send industry the wrong signals, there has been little
work on the potential interactions between low-carbon policies and the pilot ETSs in
China and on related stakeholder views. Identifying policy interactions is vital for the
emerging carbon market in China, as a common understanding between stakeholders
would help improve national climate change (and energy) policy planning and avoid
some of the problems experienced in other countries and systems.
This is the first survey with a focus on the interaction of low-carbon and energy policies
interaction in China, which we hope can open the discussion and provide policy-makers
with a better understanding of some of the built-in biases and perceptions of key actors.
The structure of our study is as follows: section 2 describes the survey methodology
Section 3 presents the survey results and the last section provides discussion,
conclusions and policy recommendations.
2. Methodology and Demographic Information
A number of studies on both stakeholder and public perspectives towards climate
change issues have been conducted in a range of topics including stakeholder
perceptions on Carbon Capture and Storage (Liang and Reiner, 2013; Reiner and Liang,
2011; Li, et al., 2012, etc.), mandatory reporting of GHG emissions (Lai, 2014) or
climate adaptation (O’keeffe, et al., 2016). On the question of policy interactions,
Fischer and Preonas (2010) provide a theoretical rationale for why overlapping low-
carbon policies will have a depressing effect on emission markets, which have been
confirmed in empirical studies (Koch, et al., 2014) and economic models (Morris, et al.,
2010). However, there has been no studies at the intersection of stakeholder studies and
policy interaction, to determine, for example, whether analysts have effectively
conveyed the potential impact of these interactions and whether this has been
appreciated by stakeholders. Therefore, we adopt a survey approach to help examine
stakeholder awareness of policy interactions.

9
We employed a two-stage survey consisting of a questionnaire and follow-up
interviews. 100 internet-based questionnaires were sent out to stakeholders involved in
the Guangdong pilot ETS in June 2014, followed by semi-structured telephone
interviews with a subset of 10 respondents for a deeper understanding of stakeholder
views in August 2014.
2.1 Internet-based questionnaire design
The online survey system Wenjuan was adopted as the survey platform. The internet-
based questionnaire was made up of 22 questions, involving a combination of multiple-
choice, ranking and open-ended questions to obtain stakeholder views on a range of
issues including Chinese emission reduction policies and carbon markets,
understandings of the interactions between policies as well as views on potential
challenges in the implementation of the Chinese carbon markets. All stakeholders were
asked to respond based on their personal opinions, knowledge and experience.
The pool of respondents drew upon those with significant involvement in the
Guangdong pilot ETS with respect to market design and policy making, market
participation and relevant research. Specifically, we adopted an expert sampling
approach, selecting equal numbers of senior stakeholders from each of the key groups,
i.e., 25 government stakeholders of at least at director level within the relevant ministry;
25 industry stakeholders of at least deputy general manager level in listed companies in
the energy sector; 25 academic stakeholders that are lecturers or above working in
energy and environment; and another 25 stakeholders that work at managerial level in
environmental NGOs. An invitation letter and a participant information letter were sent
to each stakeholder by email at the same time describing the purpose of the study, and
the principle of anonymity and confidentiality that would be employed.
The questionnaire began with a set of general questions about their role and experience
of participants before turning to their evaluation of low-carbon policies and incentives.
The next set of questions focused on their perspectives regarding Chinese carbon
emission reductions including emissions trading and other emission reduction
instruments. Specifically, respondents were asked to estimate and rate the likelihood of
China achieving deep cuts in GHGs over the next 10 years, and to select the most cost-
effective policy instruments to reduce GHGs in China. We also asked how respondents
explained the collapse of the carbon price in the EU ETS as well as their assessment
and expectations of the pilot carbon markets in China.
Subsequently, what-if scenario questions were designed to explore stakeholder
opinions on the interactions between other low-carbon policies and the Guangdong
pilot ETS. They were asked to consider the most likely immediate impact on the carbon
price in the Guangdong pilot ETS if either a new short-term renewable energy
obligation or a carbon tax were to be enacted. Furthermore, stakeholders were asked
for their views on potential conflicts between energy saving and emission reduction
measures on the one hand, and between a national ETS and international systems on
10
the other. The last few questions covered issues associated with building markets,
including potential challenges for market regulation and implementation barriers.
2.2 Semi-structured telecom interview design
As a follow up to the questionnaire, we conducted semi-structured interviews to obtain
more detailed views. The main selection criterion was that the respondents indicated
that they spent more than 50% of their working time on energy saving and emission
reduction policies in China in the past year to be able to realistically have a more in-
depth discussion about the issues involved. Interviewees were asked to provide:
• A brief overview and outlook for Chinese pilot carbon markets;
• More detailed reasons to explain the options they chose in the what-if scenario
questions;
• Opinions on the main challenges for implementation of Chinese carbon market.
2.3 Demographic information of respondents
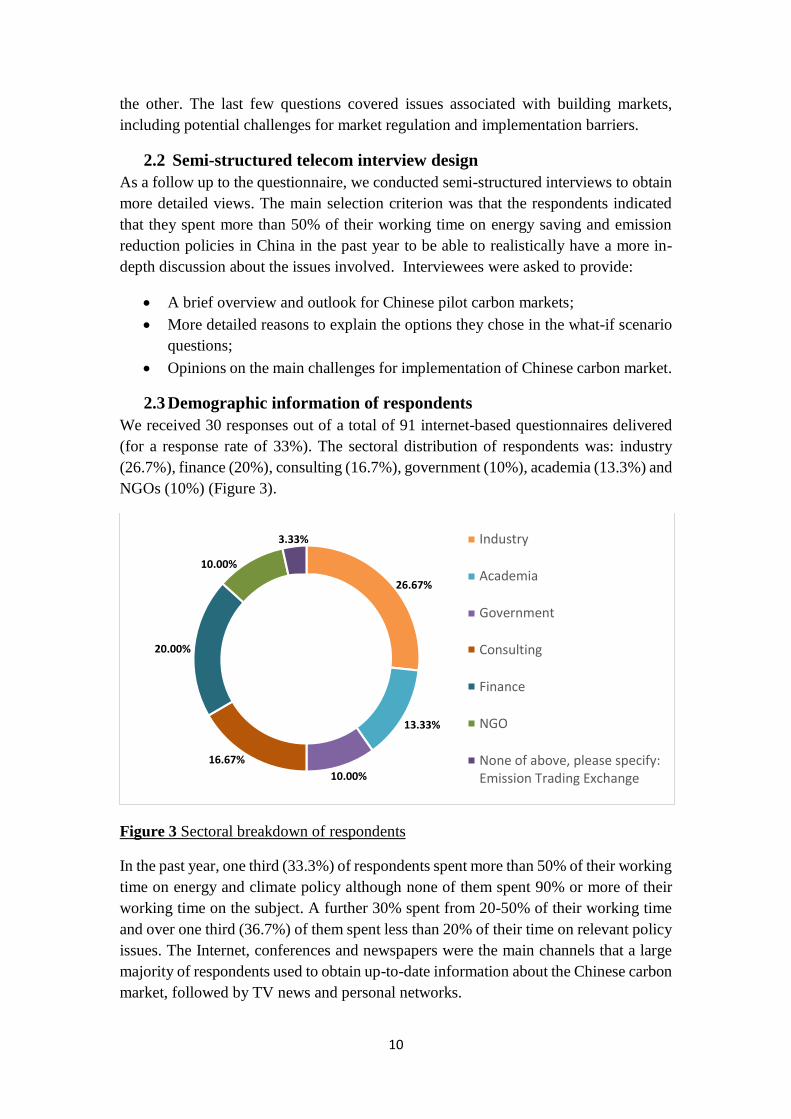
We received 30 responses out of a total of 91 internet-based questionnaires delivered
(for a response rate of 33%). The sectoral distribution of respondents was: industry
(26.7%), finance (20%), consulting (16.7%), government (10%), academia (13.3%) and
NGOs (10%) (Figure 3).
Figure 3 Sectoral breakdown of respondents
In the past year, one third (33.3%) of respondents spent more than 50% of their working
time on energy and climate policy although none of them spent 90% or more of their
working time on the subject. A further 30% spent from 20-50% of their working time
and over one third (36.7%) of them spent less than 20% of their time on relevant policy
issues. The Internet, conferences and newspapers were the main channels that a large
majority of respondents used to obtain up-to-date information about the Chinese carbon
market, followed by TV news and personal networks.
26.67%
13.33%
10.00%
16.67%
20.00%
10.00%
3.33% Industry
Academia
Government
Consulting
Finance
NGO
None of above, please specify:Emission Trading Exchange

11
3. Results and Findings
3.1. Perspectives on emissions reduction and carbon market in China
3.1.1 Predictions about emissions reductions in China
As the world’s largest emitter, China has started to develop low-carbon economy since
1990s: the first White Paper regarding sustainable development was published in 1994,
followed by the ‘Program of Action for Sustainable Development in China in the early
21st Century’ in 2003. China enacted its first ‘Renewable Energy Law’ in 2005, soon
to be followed by ‘Energy-saving and Emission Reduction’ national programme from
2006 (Wu et.al, 2012). It was not until the energy plan proposed in the Eleventh and
Twelfth Five-Year Plans in 2006 and 2011 that specific quantitative emission reduction
targets were set: reduce 40-45% GHG intensity by 2020 base on 2005 level (Hu and
Monroy, 2012; Yuan and Zuo, 2011). In the Thirteenth Five-Year Plan (2015-2020),
China has set a stronger and more ambitious reduction target of 48% reduction in GHG
intensity from 2005 levels by 2020, in line with China’s pledge at the CoP21 conference
in Paris in December 2015, where the Chinese government promised to peak carbon
emissions by 2030 as well as to lower GHG intensity by 60-65% below 2005 levels
(NDRC, 2015).
Asked about expectations on whether current climate policies in China could achieve
deep cuts in GHG intensity in the next 10 years, most respondents were pessimistic:
half (50%) considered it difficult to reach a stringent target, and another 20% of
stakeholders were not sure, although over one quarter (26.7%) of stakeholders believed
such reductions were likely, and one stakeholder (3.3%) believed it was ‘very likely’
(Figure 4). The results are consistent with a previous survey conducted in 2009, where
more than 80% of respondents believed it would be ‘difficult’ or ‘very difficult’ to
achieve deep cuts in GHG in the next 20 years (Liang et al., 2011).
Figure 4 Expectation of deep cuts in GHG intensity in China by sector of respondent
6.6
7%
3.3
3%
10
.00
%
6.6
7%
0.0
0%
3.3
3%
3.3
3%
3.3
3%
3.3
3%
0.0
0%
0.0
0%
0.0
0%
0.0
0%
6.6
7%
3.3
3%
3.3
3%
3.3
3%
3.3
3%
6.6
7%
0.0
0%
6.6
7%
10
.00
%
0.0
0%
3.3
3%
0.0
0%
3.3
3%
6.6
7%
0.0
0%
0.0
0%
0.0
0%
0.0
0%
0.0
0%
3.3
3%
0.0
0%
0.0
0%
23
.34
%
26
.67
%
20
.00
%
26
.67
%
3.3
3%
V E R Y U N L I K E L Y U N L I K E Y N O T S U R E L I K E L Y V E R Y L I K E L Y
Industry Academia Government Consulting Finance NGO None of above Total

12
Recent studies on emissions reductions in China may offer some reasons for the
somewhat bearish expectations. Empirical results show obvious inefficiency in China’s
regional energy saving and emission reduction (Guo et al., 2017), China’s carbon
emissions are still driven by significant longstanding inefficiencies in key industrial
sectors (Zhang et al., 2016), and the impact of recent low-carbon policies suffers from
a lag effect (Zhang et al., 2017). Nonetheless, Yi et al. (2016) indicate that the 40-45%
carbon intensity target is very likely to be achieved by 2020 if Chinese government put
more efforts in adjusting the industrial structure and primary energy mix, as well as
promoting energy efficiency during the 13th FYP. Green and Stern (2017) describe
important structural changes in the economy that are underway, which will enable
Chinese emissions to peak well before 2030.
Through a univariate regression using least squares method, where Gov stands for
dummy variables that take the value of 1, if the respondent is from government sector
and 0 otherwise. Expect are ordinal variables defining respondents’ expectation levels
from 1 to 5, while Expect =1 means one consider it is very unlikely to achieve deep cuts
in GHG intensity in the next 10 years and Expect =5 implies very likely. To regress
Expect against Gov , we find significant results that government stakeholders generally
believed that deep cuts in GHG intensity will likely be achieved (Table 2). It implies
that rather than stakeholders from other sectors, government stakeholders tend to be
more hopeful of success in slashing GHG emissions in China in the future.
Table 2 Output of univariate regression model Expect - Gov
VARIABLE Model Expect - Gov
Gov 1.593**
[2.428]
Constant 2.407***
[11.608]
Observations 30
R-squared 0.174
Adj. R-squared 0.144
t-statistics significance
*** p<0.01, ** p<0.05, * p<0.1
To achieve deep emissions reductions, fully 60% of respondents preferred a market-
based instrument – an emission trading scheme was viewed as the most cost-effective
policy instrument to slash GHG emissions in China (33.3%), followed by carbon
taxation (26.7%), even though historically the Chinese government has used non-
market-based forms of regulation to achieve its environmental goals (Lo, 2014). 16.7%
of the respondents preferred renewable energy subsidies/binding obligations or
industrial emission performance standards. Feed-in tariffs (FITs) and preferential
policies favoring natural gas and nuclear power were considered to be the least cost-
effective measures as only a single stakeholder (3.3%) voted for each (Figure 5).

13
Energy and low-carbon policies in China have gradually been switching from
command-and-control policy to market-based approaches (Wang and Chen, 2015).
There is no single policy, whether command-and-control or market-based, which has
all the characteristics needed to mitigate emissions and address the full range of energy
policy priorities including efficiency, effectiveness, promoting innovation, and security
of supply. However, empirical studies have shown that market-based instruments will
have significant impacts on efficiency improvement and emission reductions (Zhao et
al., 2015), although there may be regional differences in the effectiveness of different
instruments (Ren et al., 2016). Despite operating for only a short time and the immature
market environment, the pilot ETS in China appear relatively promising with regard to
carbon emissions reduction. (Zhang et al., 2017).
Figure 5 Belief in most cost-effective policy instrument to cut GHG emissions
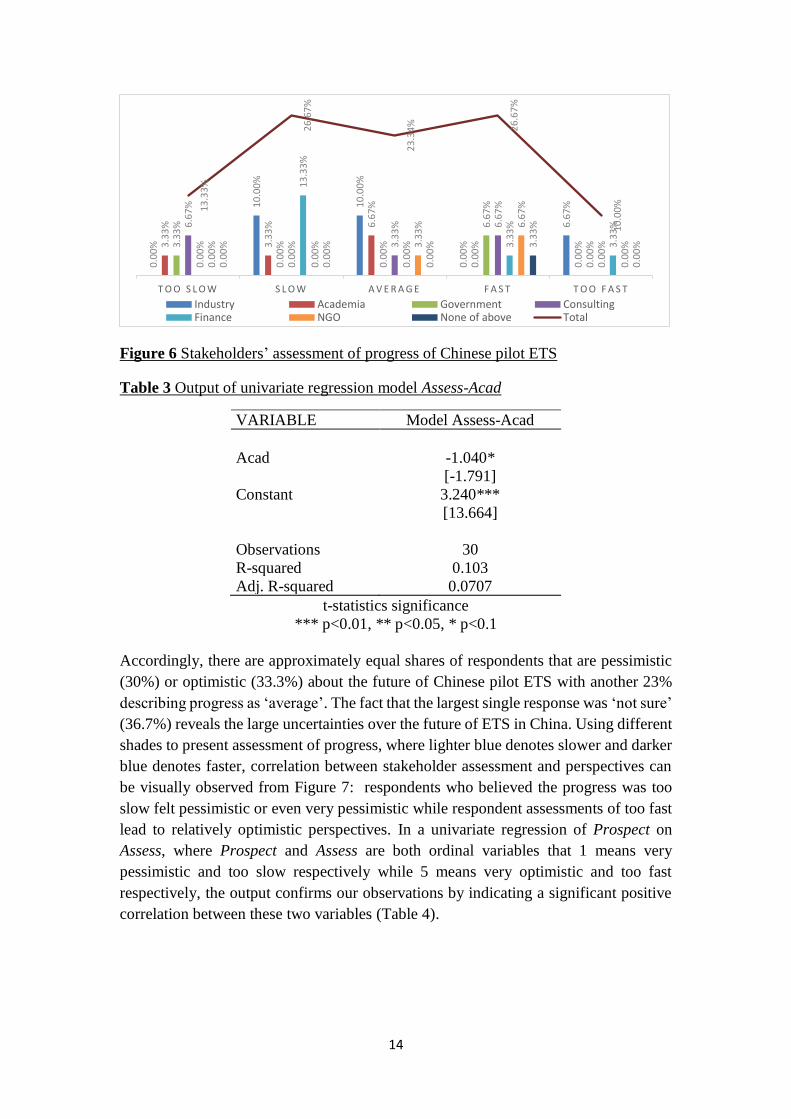
3.1.2 Assessment on progress of Chinese pilot ETS
Media coverage and many international observers have described Chinese carbon
markets as moving quickly since the pilot ETS policy was launched by the NDRC in
2010 (Zhang et al., 2014). By contrast, the bell shape of the solid line in Figure 6
demonstrates that there are approximately equal shares of respondents who consider the
development speed of ETS in China to be fast or slow: 36.7% of respondents agree the
progress has been fast (26.7%) or even too fast (10%); another 40% have the opposite
view and take progress to be slow (26.7%) or too slow (13.3%).
After further investigation of respondents’ sectoral affiliations, a trend can be found as
academic stakeholders tend to consider the development progress of ETS in China to
be slow (dashed line in Figure 6). A univariate regression of Assess on Acad confirms
the tendency (Table 3), where ACA are dummy variables that take the value of 1 if the
respondent is from academia sector and 0 otherwise and Assess are ordinal variables
defining respondents’ assessment levels from 1 to 5. Assess=1 means the respondent
considers progress to be too slow and 5 implies too fast.
0% 20% 40% 60% 80% 100%
33.33% 26.67% 3.33% 16.67% 16.67% 3.33%
emission trading scheme
carbon taxation
feed-in tariffs
renewable energy subsidies/binding obligations
industrial emission performance standards
preferential policy favoring natural gas and nuclear power
14
Figure 6 Stakeholders’ assessment of progress of Chinese pilot ETS
Table 3 Output of univariate regression model Assess-Acad
VARIABLE Model Assess-Acad
Acad -1.040*
[-1.791]
Constant 3.240***
[13.664]
Observations 30
R-squared 0.103
Adj. R-squared 0.0707
t-statistics significance
*** p<0.01, ** p<0.05, * p<0.1
Accordingly, there are approximately equal shares of respondents that are pessimistic
(30%) or optimistic (33.3%) about the future of Chinese pilot ETS with another 23%
describing progress as ‘average’. The fact that the largest single response was ‘not sure’
(36.7%) reveals the large uncertainties over the future of ETS in China. Using different
shades to present assessment of progress, where lighter blue denotes slower and darker
blue denotes faster, correlation between stakeholder assessment and perspectives can
be visually observed from Figure 7: respondents who believed the progress was too
slow felt pessimistic or even very pessimistic while respondent assessments of too fast
lead to relatively optimistic perspectives. In a univariate regression of Prospect on
Assess, where Prospect and Assess are both ordinal variables that 1 means very
pessimistic and too slow respectively while 5 means very optimistic and too fast
respectively, the output confirms our observations by indicating a significant positive
correlation between these two variables (Table 4).
0.0
0%
10
.00
%
10
.00
%
0.0
0%
6.6
7%
3.3
3%
3.3
3% 6
.67
%
0.0
0%
0.0
0%3
.33
%
0.0
0%
0.0
0%
6.6
7%
0.0
0%
6.6
7%
0.0
0% 3
.33
% 6.6
7%
0.0
0%
0.0
0%
13
.33
%
0.0
0% 3
.33
%
3.3
3%
0.0
0%
0.0
0% 3
.33
% 6.6
7%
0.0
0%
0.0
0%
0.0
0%
0.0
0% 3
.33
%
0.0
0%
13
.33
%
26
.67
%
23
.34
% 26
.67
%
10
.00
%
T O O S L O W S L O W A V E R A G E F A S T T O O F A S T
Industry Academia Government ConsultingFinance NGO None of above Total

15
Figure 7 Cross tabulation of stakeholder perspectives and assessment on Chinese
carbon market
Table 4 output of univariate regression model Prospect-Assess
VARIABLE Model Prospect-Assess
Assess 0.298**
[2.274]
Constant 2.053***
[4.755]
Observations 30
R-squared 0.156
Adj. R-squared 0.126
t-statistics in brackets
*** p<0.01, ** p<0.05, * p<0.1
As a matter of fact, the preparatory stage for the Chinese pilot carbon markets was
relatively short compared with other ETS developed around the world. Seven pilot ETS
were launched in China within two years, whereas it took almost five years for the EU
ETS (European Commission, 2015). The rapid development of ETS in China is largely
the result of the strong political will of the government. Although all pilots have been
launched, some of their design details have yet to be finalized, for instance, the
monitoring, reporting and verification (MRV) guidelines and regulations (ICAP, 2016).
Nonetheless, Chinese stakeholders tend to equate “speed of development” with the
rapid economic transition over the last few decades, which is overwhelmingly seen as
beneficial (Lo, 2014).
3.1.3 Expectation on Guangdong pilot ETS market price
A quarter of the stakeholders were uncertain about the expected range of the average
carbon price in Guangdong market. Nearly half (45.8%) expected the carbon price to
be between 51-100 CNY/t CO2 (7-14 EUR/t CO2), which is higher than the 32 CNY/t
CO2 (4 EUR/t CO2) found in the October, 2013 China Carbon Price Survey. Moreover,
one-sixth (16.7%) of respondents proposed an even higher range of 101-200 CNY/t
0.00%
5.00%
10.00%
15.00%
20.00%
Very pessimistic Pessimistic Not sure Optimistic Very optimistic
Too slow Slow Average Fast Too fast

16
CO2 (14-27 EUR/t CO2), while another third (33.3%) expected it to be lower, at 26-50
CNY/t CO2 (3.5-7 EUR/t CO2). Only 4.2% believe the price range would be as low as
0-25 CNY/tCO2 (3.5 EUR/t CO2) (Figure 8).
Figure 8 Perceived expectation on average carbon price in Guangdong pilot ETS
At the time of the survey, in mid-2014, the Guangdong market price was around 60
CNY/tCO2 (8 EUR/t CO2) with very low turnover (Figure 9). After decreasing over the
latter half of 2014, the price in the Guangdong ETS dropped to around 15 CNY/t CO2
(2 EUR/t CO2), which is consistent with the expectation of only a small fraction (4.2%)
of respondents.
Figure 9 Price and volume in Guangdong pilot ETS (1 Jan, 2016- 1 Sept, 2017)
Source: ChinaCarbon.net.cn
During follow-up interviews, stakeholders expressed mixed views on the impact of
carbon pricing through ETS in China. Government officials were far more confident
than industrial and academic stakeholders. One government official considered the
carbon market pilot in the province would be robust in response to the economic cycle,
4%
33%
46%
17%0%
0-25CNY/t CO2
26-50 CNY/t CO2
51-100 CNY/t CO2
101-200 CNY/t CO2
Above 200 CNY/t CO2

17
and he believed the intensity allowance cap scheme would adjust automatically. An
official from Guangdong (the largest pilot scheme with an absolute cap) suggested the
carbon price in Guangdong could be supported through a floor price in the auctioning
scheme, as a carbon floor price would create more certainty about the minimum price,
providing a clearer signal for investors.
Three stakeholders from carbon-intensive industries expressed some concern during
follow-up interviews about the impact of the economic cycle on carbon allowance
prices, but in general, they preferred retaining allowances for future compliance periods.
Through cross tabulation of stakeholder expectations on carbon price in Guangdong
ETS with respondents’ sectors, we see that industrial stakeholders are more likely to
expect the price to stay the same or fall.
Figure 10 Cross tabulation of stakeholders’ sectors and expectation on average carbon
price in Guangdong pilot ETS
Conversely, through a univariate regression of Price, ordinal variables representing
respondents’ price expectations (1 = 0-25 CNY/t CO2 while 5 = above 200 CNY/t CO2),
on Acad, whether the respondent is from academia (Acad=1 means respondents are
from academia while Acad=0 reflects non-academic respondents), we find that
academic stakeholders significantly expected (at 90% confidence level) the price to be
relatively high compared with other stakeholders (Table 5).
Table 5 Output of univariate regression model Price-Acad
VARIABLE model Price-Acad
Acad 1.200*
[1.936]
Constant 2.000***
3.3
3%
10
.00
%
10
.00
%
0.0
0%
0.0
0%
0.0
0%
0.0
0%
6.6
7%
6.6
7%
0.0
0%
0.0
0%
3.3
3%
3.3
3%
3.3
3%
0.0
0%
0.0
0%
3.3
3%
6.6
7%
0.0
0%
0.0
0%
0.0
0%
3.3
3%
6.6
7%
3.3
3%
0.0
0%
0.0
0%
6.6
7%
0.0
0%
0.0
0%
0.0
0%
0.0
0%
0.0
0%
3.3
3%
0.0
0%
0.0
0%
0 - 2 5 C N Y / T C O 2 2 6 - 5 0 C N Y / T C O 2 5 0 - 1 0 0 C N Y / T C O 2
1 0 1 - 2 0 0 C N Y / T C O 2
A B O V E 2 0 0 C N Y / T C O 2
Industry Academia Government Consulting
Finance NGO None of above Linear (Industry)

18
[7.906]
Observations 30
R-squared 0.118
Adj. R-squared 0.0866
t-statistics in brackets
*** p<0.01, ** p<0.05, * p<0.1
Still, one academic stakeholder involved in setting up the rules for one of the pilot
carbon markets believed there was significant over-allocation of allowances in most
pilot markets in China, and negative impacts would result during the compliance stage.
Another academic was concerned that the quality of the initial reporting of emissions
could damage the reputation of emissions trading more generally in China, and that this
effect was not been widely appreciated (i.e., there was significant over-reporting of
emissions at the initial stages).
3.2. Perceptions of interactions between incentives
In spite of the high political priority given to ETS as a policy instrument, the Chinese
energy system is primarily regulated by administrative measures rather than market-
based instruments (Lo, 2014). For example, China’s electricity market is not fully
liberalised and the electricity tariff is set by government, and industries suffering higher
cost in paying for carbon allowance or emission reductions cannot directly pass the cost
through to consumers. Meanwhile, in recent years, a range of policies including carbon
taxation, renewable obligations and energy efficiency quota trading mechanisms have
been mentioned by both government officials and leading academics in China. All such
parallel mechanisms could reduce the implied allowance price in the ETS and give
investors a misleading signal over the value of carbon in longer-term investments.
Figure 11 summarizes the existing low-carbon policies developed by central
government and the specific implementation plans in Guangdong Province.
Even though earlier literature indicates Chinese stakeholders preferred market-based
instruments such as emissions trading over regulation (Lo, 2014; Liang and Reiner,
2011) and in spite of the current moves towards a national emissions trading scheme
building on the seven pilots, a carbon tax is still being actively considered as a major
policy option by the Ministry of Finance in China. There have also been longstanding
discussions on how best to encourage renewable energy in China and having a binding
national renewable target is one of the options that has been discussed. Consequently,
for the case of Guangdong ETS Pilot, we have sought to explore opinions regarding the
interactions between the ETS and parallel carbon and energy policies.

19
15 May
2014
01 Apr.
2010
01 Jan.
2006
Central Government of China Specific Policies in Guangdong Province
Main existing low carbon and energy policies in China since 2006
Renewable Energy Law
Amendments to the PRC Renewable Energy Law
31 Aug.
2007
The Mid-and-long Term Development Plan for
Renewable Energy (NDRC)
In 2020, consumption of renewable energy contribute to
15% of total energy consumption
29 Oct.
2011
Notice of Implementing Pilot Carbon Emissions
Trading (NDRC)
Pilot ETS in Beijing, Tianjin, Shanghai, Chongqing,
Guangdong, Hubei, Shenzhen
2014-2015 Energy Saving and Emission Reduction
Development Action Plan (State Council)
Reduce carbon intensity by 4% and 3.5% in 2014 and
2015.
6 Aug.
2012
Energy Saving and Emission Reduction in the 12th
Five-Year Plan (State Council)
1 Jan.
2013
Energy Development in the 12th Five-Year Plan (State
Council)
7 Jun.
2014
2014-2015 Eenergy Development Action Plan (State
Council)
22 Feb.
2012
Guangdong Province Comprehensive Work
Plan of Energy Saving and Emission
Reduction in the 12th FYP
In 2015, reduce energy consumption intensity
by 18% and 31.46% compared to 2010, and
2005; reduce total CO2 emission by 14.8%
based on 2010.
11 Oct.
2014
Guangdong Province Energy Saving and
Emission Reduction Development Action
Plan in 2014-2015
2014-2015, reduce energy consumption
intensity by 3.4% and 2.32% during the two
years; reduce CO2 intensity 3.5% annually.
1 Dec.
2011
Notice of Control GHGs Emission Work Plan
in the 12th FYP
During the12th FYP, reduce CO2 intensity and
energy consumption by 19.5% and 18% based
on 2010.
18 Dec.
2013Guangdong Pilot ETS began operations
Forthcoming energy and low carbon policies, such as Renewable Energy Obligation, Carbon Taxation, etc.
Figure 11 existing main national and Guangdong province climate change policies
(Sources: www.ndrc.gov.cn; www.gov.cn)
3.2.1 Perceptions of the permit price collapse in the EU ETS
Before moving to the Chinese situation in detail, we asked how stakeholders viewed
the price collapse in the EU ETS. The EU allowance price experienced high volatility
(both in phase I before crashing in 2006 and in phase II the price again started relatively
high but then crashed by 2009,) the widely-held view for the causes are over-allocation
of permits to legacy emitters (Hintermann, 2010), the effects of the Global Financial
Crisis on economic growth and the weakness of its regulation, etc. (Perthuis and

20
Trotignon, 2014). Recent studies have found the overlapped public policies such as
renewable policies and use of international credits also helped to explain the price
plunge (Koch et al., 2014).
No surprise that litter awareness of overlapped low-carbon policies would impact the
price is also reflected in our survey. Global economic downturn was blamed by the
majority (18 out of 30 respondents), followed by excess emission allowance
allocations (12/30) and failure to reach binding international targets in the
international negotiations (9/30). Only a relatively small number blamed alternative
emission reduction mechanisms or increased volumes of Certified Emission
Reductions (CERs) from the Clean Development Mechanism.
Figure 12 Main reasons for collapse of carbon price in EU ETS
3.2.2 Attitudes onwards possible conflicts between multiple incentives
Accordingly, we designed two what-if scenario questions and two statement acceptance
questions to explore reactions to hypothetical major policy announcements that we
would expect to adversely affect the carbon price by reducing demand for allowances.
Firstly, stakeholders were asked to consider, if a higher than expected short-term
renewable energy target were enacted in the pilot cities (e.g. renewable energy target
increases from 10% to 15%), what would be the most likely impact on carbon price in
the pilot carbon market? Nearly half (48.3%) of respondents expected the carbon price
in these pilot carbon markets to decrease by a small amount, and a further 3.5%
expected a large decrease in the carbon price. However, almost a quarter (24.1%) of
respondents believed there would be a small increase in carbon price, and 3.5% thought
it would be a large increase. Over one fifth (20.7%) anticipated that the price would
remain the same and a renewable energy target would not impact on the carbon price
in the pilot carbon market (blue bar in Figure 13).
By contrast, when stakeholders were asked if an unexpected national carbon tax were
suddenly announced for immediate implementation across all major industry sectors,
surprisingly, a large majority (59.3%) of respondents believed the carbon price in the
ETS would increase and almost one fifth of the total sample (18.5%) thought it would
be a large increase. Only 25.9% of stakeholders believed that the carbon price would
18 12 9 5 5
Global economic downturn
Excess allocation of carbon emission permits by individual countries
Failure of United Nations negotiations to set binding international targets
Large volume of Certification Emission Reduction (CER) due to the increase in CDM projects
Alternative emission reduction mechanism such as carbon tax, renewable target or FITs

21
decrease if a carbon tax were to be introduced (orange bar in Figure 13). Three
respondents skipped the question.
Figure 13 Stakeholder expectations of carbon market response to imposing new
ambitious energy and climate policies
It is striking that the majority of stakeholders believed that the impact of introducing a
renewable target would be to depress carbon prices, while a new carbon tax was seen
as lifting the carbon allowance price. The reactions to introducing a tougher renewable
energy target and an unexpected national carbon tax provide contrasting results. In
theory at least, all else being equal, introducing either measure in addition to the carbon
market would reduce the allowance price in the ETS scheme.
The majority of stakeholders in follow-up interviews, appreciated that introducing low-
carbon policies in parallel (such as a carbon tax or renewable obligations) would affect
the carbon allowance price in the ETS but differed on both the likely magnitude and
direction. Two industry and two academic stakeholders during follow-up questioning
suggested that renewable energy targets might increase carbon reductions and in turn
increase the carbon allowance price, but that carbon taxation policies could provide a
‘carbon price floor’ to support the allowance prices. Another academic stakeholder
believed raising the renewable energy target by 5% could reduce total carbon emissions,
while a carbon tax could shift the ETS abatement cost curve to the right, and both
measures could significantly reduce the demand and price of carbon allowances in the
Chinese ETS.
In the follow-up interviews, two government stakeholders and one stakeholder from the
financial sector still did not believe the impact of other mechanisms on carbon pricing
mechanisms would be substantial. The two government officials, though recognizing
the potential impact of parallel low-carbon incentives on carbon allowance pricing,
believed that it was important to introduce more market-based instruments for emission
reductions and environmental protection in China, such as trading in energy efficiency
quota and water rights trading.
To further testify whether stakeholders would recognize possible conflicts that might
emerge when there are multiple incentives. Specifically, we asked about the extent to
3.5%
48.3%
20.7% 24.1%3.5%14.8% 11.1% 14.8%
40.7%
18.5%
0.0%
10.0%
20.0%
30.0%
40.0%
50.0%
60.0%
large decrease decrease unchanged increase large increase
renewable obligation carbon tax

22
which they agreed that “incentives, such as ‘cap and trade’ systems, carbon taxation,
renewable energy obligations, and emission performance standard etc., may conflict,
and generate different costs and benefits in different situations”. A significant fraction
(43.3%) of respondents agreed with the statement, while 23.3% disagreed (Figure 14).
Figure 14 Respondent attitudes on statement of policy interactions
As Figure 14 reveals, there is a slight tendency for stakeholders to recognize the
possible conflicts between carbon markets and overlapped climate change policies and
that academic stakeholders are slig. Take Attit as ordinal variables representing the
extent of agreement or disagreement with the statement, where 1 = strongly disagree
and 5 = strongly agree, significant result can be discovered from a univariate regression
of Attit on Acad (Table 6). The idea is generally more widely accepted among
academics than by stakeholders in other sectors.
Table 6 output of univariate regression model Attit-Acad
VARIABLE model Attit-Acad
Acad 0.720*
[1.906]
Constant 3.080***
[19.977]
Observations 30
R-squared 0.115
Adj. R-squared 0.0833
t-statistics in brackets
*** p<0.01, ** p<0.05, * p<0.1
0.0
0%
10
.00
%
10
.00
%
6.6
6%
0.0
0%
0.0
0%
0.0
0%
3.3
3%
10
.00
%
0.0
0%
0.0
0%
3.3
3%
3.3
3%
3.3
3%
0.0
0%
0.0
0%
6.6
7%
3.3
3%
6.6
6%
0.0
0%
0.0
0%
3.3
3%
6.6
7%
10
.00
%
0.0
0%
0.0
0%
0.0
0%
6.6
7%
3.3
3%
0.0
0%
0.0
0%
0.0
0%
0.0
0%
3.3
3%
0.0
0%
S T R O N G L Y D I S A G R E E
D I S A G R E E N O T S U R E A G R E E S T R O N G L Y A G R E E
IndustryAcademiaGovernmentConsultingFinanceNGONone of above, please specify: Emission Trading ExchangeLinear (Academia)
23
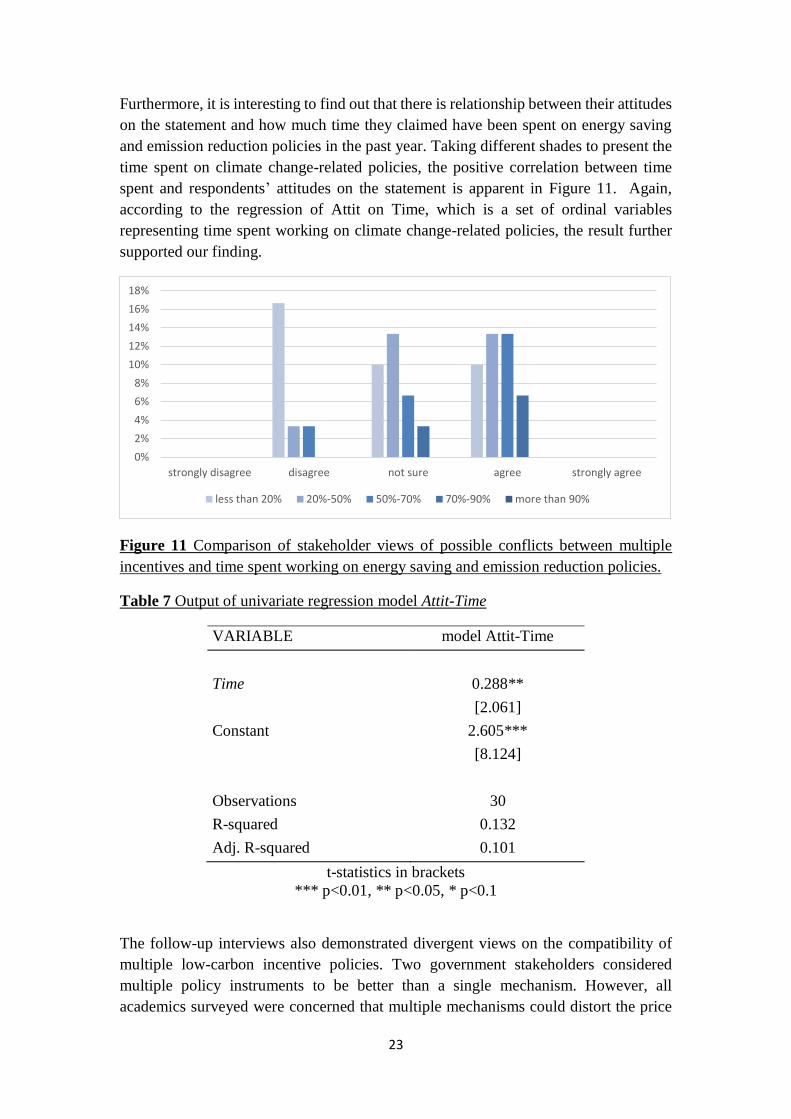
Furthermore, it is interesting to find out that there is relationship between their attitudes
on the statement and how much time they claimed have been spent on energy saving
and emission reduction policies in the past year. Taking different shades to present the
time spent on climate change-related policies, the positive correlation between time
spent and respondents’ attitudes on the statement is apparent in Figure 11. Again,
according to the regression of Attit on Time, which is a set of ordinal variables
representing time spent working on climate change-related policies, the result further
supported our finding.
Figure 11 Comparison of stakeholder views of possible conflicts between multiple
incentives and time spent working on energy saving and emission reduction policies.
Table 7 Output of univariate regression model Attit-Time
VARIABLE model Attit-Time
Time 0.288**
[2.061]
Constant 2.605***
[8.124]
Observations 30
R-squared 0.132
Adj. R-squared 0.101
t-statistics in brackets
*** p<0.01, ** p<0.05, * p<0.1
The follow-up interviews also demonstrated divergent views on the compatibility of
multiple low-carbon incentive policies. Two government stakeholders considered
multiple policy instruments to be better than a single mechanism. However, all
academics surveyed were concerned that multiple mechanisms could distort the price
0%
2%
4%
6%
8%
10%
12%
14%
16%
18%
strongly disagree disagree not sure agree strongly agree
less than 20% 20%-50% 50%-70% 70%-90% more than 90%

24
signal for environmental goods, and provide incorrect signals. Although quite a few
respondents (33.3%) selected the carbon market as their preferred mechanism in an
earlier question, no stakeholder in the follow-up interviews believed that the ETS by
itself could completely replace other parallel low-carbon incentives in China.
The situation in Europe is very similar. Most stakeholders perceive the trading scheme
as the main instrument to cut down GHGs, but there is a growing view that the ETS is
not the only instrument required and will need to be combined with other instruments
(Fujiwara, 2016). Many stakeholders expressed concern at the negative impact that
policies had on carbon prices, especially stakeholders from the power and energy
trading sectors (Gaast et al., 2016), and most welcomed the Market Stability Reserve
(MSR) as a means of addressing the surplus of allowances. Others still believe though
that policies supporting renewables have only limited negative impacts on the EU ETS
(Marcantonini et al., 2017).
3.2.3 Attitudes on linkages to international carbon markets
There have been many studies on the potential to link national and subnational emission
trading schemes, as in the case o Quebec and California, and as was explored for
Australia and the European Union (Ranson and Stavins, 2016; Mehling and Haites,
2009). With regard to the statement that ‘integrating the Chinese carbon trading market
into the international trading system could help reduce the adverse impact on carbon
price from the interactions of other national carbon reduction incentive mechanisms’, a
large number (36.7%) of stakeholders supported it, whereas only 13.3% did not.
Nevertheless, for both statements, a relatively large proportion (33.3% and 50%
respectively) could not decide and no stakeholder expressed a strongly-held attitude (i.e.
strongly agreed or strongly disagreed).
In follow-up interviews, one government official and two academic stakeholders
emphasized the importance of linking the Chinese carbon market with international
carbon markets, arguing that such links could help improve the design and operation of
the domestic carbon market in the long-term. Another government official was unsure
about the need for international linkages but believed that such linkage could boost the
liquidity of the pilot schemes. Industry stakeholders were also unsure about linkage but
two were very interested in the impact linkage would have on allowance prices in the
long-term. One academic strongly opposed linkage on the grounds that international
linkages might reduce the freedom of Chinese climate policy and constrain the Chinese
position in future international climate policy negotiations.
3.3. Challenges for Chinese carbon markets
3.3.1 MRV system in Chinese carbon markets
We asked stakeholders to rank potential problems with the monitoring, reporting and
verification (MRV) system that they believed could negatively affect the carbon market.
Technical issues aroused the greatest concern. The top challenge was viewed as
incorrect and incomplete historical databases, followed by incorrect carbon auditing

25
methodologies. The lack of third party verification and auditing organizations ranked
the third. A lack of skilled workers for carbon auditing and corruption during the
auditing process were at the bottom of the list (Table 8).
Table 8 Ranking of potential challenges with regards to MRV system
1 2 3 4 5 Average
ranking
Incorrect and incomplete historical database 62% 15% 12% 4% 8% 1.81
Incorrect carbon auditing methodology 19% 38% 19% 12% 12% 2.58
Lack of third party verification and auditing
organizations
19% 22% 22% 30% 7% 2.85
Lack of skilled workers in carbon auditing 4% 15% 23% 19% 38% 3.73
Corruption during auditing process 0% 8% 23% 35% 35% 3.96
3.3.2 Implementation of Chinese carbon trading market
In terms of potential implementation challenges, the pervasive lack of accurate and
relevant information and knowledge on the subject ranked first, as most respondents
agreed that ‘enterprises were still confused about carbon emission trading and worried
it might increase costs’. Concerns about potential negative impacts on GDP growth (i.e.,
that the ‘cap’ implied reduced energy consumption) came second. Stakeholders ranked
the challenge of limited financial instruments and the absence of derivatives in carbon
credit third, followed by impacts of other energy and low-carbon policies (e.g.,
emission performance standards and renewable energy obligations may reduce demand
for emissions reductions in carbon markets). Finally, limited financial instruments and
institutions were viewed as the least significant challenge of the five listed.
Table 9 Ranking potential challenges with regards to implementation
1 2 3 4 5 Average
ranking
Enterprises still confused about carbon
emission trading, and worried it may
increase costs
44% 44% 7% 4% 0% 1.7
The ‘Cap’ implies decreased energy
consumption, which may negatively
influence GDP growth
42% 19% 23% 0% 15% 2.27
Limited financial instruments; Lack of
carbon credit derivatives
8% 15% 31% 23% 23% 3.38
Limited relevant financial institutions 0% 12% 35% 27% 27% 3.69
Other energy and low-carbon policies
such as Emission Performance Standards
and Renewable Energy obligation may
decrease demand for emission reduction
in carbon trading markets
8% 8% 4% 46% 35% 3.92
Stakeholders also suggested other challenges for the Chinese carbon market including:
(a) absence of strong regulatory support from the central government; (b) the need to
develop novel carbon emission reduction technologies; (c) increased production costs

26
for business; (d) the difficulty of setting a ‘cap’ in any emission trading system; and (e)
the need for a comprehensive Chinese carbon market, which they felt would inevitably
prove costly.
During follow-up interviews, both government and industry stakeholders considered
the major challenge for the Chinese ETS to be how it might evolve towards a
comprehensive national scheme. Government officials considered the lack of trading
activities to be a short-term constraint on the carbon market. Two academic
stakeholders were concerned about the quality of data based on initial auditing, and
cited the limitations of budget, time and capacity to address these problems, noting
there was sometimes less than CNY 100,000 (approximately EUR 13,500) available
for an initial survey and audit at a large conglomerate or energy company. One
academic claimed the poor quality of initial data could pose serious challenges and lead
to a crisis of confidence affecting future development. An industry stakeholder
suggested that a professional standards institute should be established to better regulate
the quality of MRV.
4. Conclusions and Policy Recommendations
Given expectations of continued high levels of economic and energy demand growth
in China, half of the stakeholders surveyed considered a deep cut in emissions in the
next decade to be unlikely. Government stakeholders generally were more hopeful of
success in slashing GHG emissions in China and were far more confident than industrial
and academic stakeholders in the potential benefits from carbon pricing in China.
Academic stakeholders tended to consider the progress of ETS development in China
to be slow, and generally felt pessimistic about the potential of Chinese carbon markets
to reduce emissions due to over-allocation of permits and imperfect auditing regulations,
even though their expectations on the future market price in the Guangdong pilot were
relatively high compared with other stakeholders.
Analogously, industrial stakeholders also expressed concern over the impact of the
economic cycle on carbon allowance prices. Although there was a wide range of views
future carbon price, overall more expected the price to drop, led by industrial sector
stakeholders. Possible reasons for the bearish attitudes include concerns over an
incomplete MRV system, lack of awareness among many enterprises of the benefits of
carbon markets, they consider participation in the market as merely fulfilling the need
for governments’ encouragement, social responsibility or corporate strategy (Yang, et
al., 2016). By contrast, academic stakeholders were more bullish in their expectations.
There is relatively limited understanding of how other mechanisms might affect the
price of carbon allowances, even though more than one-third of respondents considered
the interaction to be a significant challenge. In theory, both a new additional carbon tax
and a more stringent renewable target would shift the abatement curve to the right
thereby reducing the allowance price. In our survey however, many stakeholders
27
believed that renewable targets would dampen the carbon price, but a majority expected
a carbon tax to actually boost the carbon price seen in the market. Most academic
respondents recognized that interactions between the carbon market and other energy
and low-carbon policies may decrease “demand” in emission trading markets. It is
noteworthy that the degree of understanding of interactions between instruments was
positively associated with claimed time spent working on energy saving and emission
reduction policies.
Energy and low-carbon policies in China has been shifting from command-and-control
policies to more market-based approaches. Past studies have indicated that a large
majority of Chinese stakeholders would prefer market-based instruments to control
GHGs (Liu et al., 2013; Lo, 2014). This enthusiasm for markets is consistent with our
results, as an emission trading mechanism was deemed the most cost-effective
instrument to achieve deep cuts in emissions in China. Therefore, disagreements over
the perceived interaction between overlapping energy and low-carbon policies may
undermine the ETS carbon price, even though in committing to launch a unified
national carbon market by 2017, support for an ETS was unequivocally and repeatedly
confirmed at the highest political level.
Objectively, the preparatory stage for the Chinese pilot carbon markets has been
relatively short compared with the systems in Korea, Quebec, and California (World
Bank, 2014), but very few stakeholders considered the pace to be “too fast”. The
development of a national ETS has taken place in parallel with the pilot schemes and
momentum has been growing in China toward a national ETS with the government
originally committing to a multi-sector ETS being up and running in 2017. While
discussion of whether Chinese national ETS should ultimately employ a top-down or
bottom-up approach is still ongoing, and the road map has not yet formally announced
beyond the initial announcement in December 2017, the NDRC has at least initially
adopted a top-down approach towards developing a national system. Moreover, the
effort to get a national system up and running so quickly may explain some of the
problems and delays encountered by the national ETS driven primarily by the lack of
baseline data and the need for an operational data collection system (Feng, 2017).
Our findings suggest there are still some important unresolved issues confronting the
new national system. It would have been more desirable if in the process of
implementing the national ETS, the Chinese authorities were able to learn lessons from
the pilot systems. The lack of transparency in disclosing market information, a lack of
knowledge among market participants, and an immature MRV system poses
uncertainties for carbon price setting. Fuss et al. (2008) claimed that climate change
policy uncertainties would induce industries to wait and see whether strong interests in
effective and efficient investment response to its policy signals will be brought out by
the government, which implies the degree of market information obtained would
influence industries’ investment decisions on carbon-saving technologies. In addition,
the diversity of stakeholders’ predictions of the carbon price reflect a lack of consensus.

28
Drawing on the findings of our study, we offer the following policy recommendations:
• Government and other key stakeholders have placed too much focus on the price
and volume of carbon allowances in the China’s pilot ETS schemes;
stakeholders and policymakers should seek to continuously assess and improve
the quality of regulation, market integrity and information disclosure.
• The inability of many stakeholders to understand that other low-carbon and
renewable policies would reduce the price in the carbon market, reflects the
need for capacity building among current and future market participants.
• As the carbon market is not likely to be the only major low-carbon policy
instrument in China, the ETS carbon price needs to be interpreted cautiously.
• Alternative carbon pricing signals, such as a government shadow carbon price
should be proposed alongside a carbon market allowance price to signal to
industry the short-term and long-term costs of CO2 emissions.
• Regulators and carbon exchanges should provide more transparent, real-time
information for market participants to facilitate price setting.
• The Chinese government should invest heavily in MRV systems, and establish
a set of best practices, to provide greater confidence for market participants.
• In the process of moving to a national carbon market, more effort should be
placed on improving the compatibility of carbon market pilots. China has the
relatively rare benefit of having conducted seven pilots with varying
specifications, so it is important that time is taken to learn from the different
pilots. We have conducted an in-depth assessment of only one of the seven
pilots from the perspective of different key stakeholders and before fully
launching a national system, a comprehensive review across all seven pilots
would be very beneficial.
References
1. Bohringer, C., Rosendahl, K., E., 2010. Green promotes the dirtiest: on the
interaction between black and green quotas in energy markets. Journal of
Regulatory Economics 37: 316-325.
http://dx.doi.org/10.1007/s11149-010-9116-1
2. Brouwers, R., Schoubben, F., Hulle, C. V. and Uytbergen, S. V., 2016. The
initial impact of EU ETS verification events on stock prices. Energy Policy
94: 138-149. http://dx.doi.org/10.1016/j.enpol.2016.04.006
3. Cheng, C., Zhang, X., 2011. A study on the construction of China’s carbon
emission trading system. Energy Procedia 5: 1037-1043.
http://dx.doi.org/10.1016/j.egypro.2011.03.183
4. Cui, L. B., Fan, Y., Zhu, L., Bi, Q. H., 2014. How will emission trading
scheme save costs for achieving China’s 2020 carbon intensity reduction
target. Applied Energy 136: 1043-1052.
http://dx.doi.org/10.1016/j.apenergy.2014.05.021

29
5. Duan, M., Pang, T., Zhang, X., 2014. Review of carbon emissions trading
pilots in China. Energy and Environment 25: 527-549.
http://eae.sagepub.com/content/25/3-4/527.full.pdf
6. Ellerman, A. D. and Decaux, A., 1998. Analysis of Post-Kyoto CO2 Emissions
Trading Using Marginal Abatement Curves. MIT Joint Program on the
Science and Policy of Global Change. http://hdl.handle.net/1721.1/3608
7. Energy and Climate Change Committee (ECC), 2015. Linking emissions
trading systems. House of Commons Energy and Climate Change Committee.
http://www.publications.parliament.uk/pa/cm201415/cmselect/cmenergy/739/
739.pdf
8. Ekins, P., Kesicki, F., Smith, A. Z. P., 2012. Marginal Abatement Cost
Curves: A call for caution. Climate Policy 12(2).
http://dx.doi.org/10.1080/14693062.2011.582347
9. Ernst & Young, 2014. Understanding China’s Emissions Trading Schemes
and Emissions Reporting. http://www.ey.com/Publication/vwLUAssets/EY-
Understanding_Chinas_Emissions_Trading_Schemes_and_Emissions_Reporti
ng/$FILE/EY-Understanding-Chinas-ETS-and-Emissions-Reporting.pdf
10. European Commission, 2015. EU ETS Handbook.
https://ec.europa.eu/clima/publications/docs/ets_handbook_en.pdf
11. Fan, Y. and Wang, X., 2014. Which sector should be included in the ETS in
the context of a unified carbon market in China? Energy and Environment 25
(3-4): 613-634. http://dx.doi.org/10.1260/0958-305X.25.3-4.613
12. Feng, E., 2017. China moves towards launch of carbon trading scheme.
Financial Times, 19 December. https://www.ft.com/content/cd549b9a-e088-
11e7-a8a4-0a1e63a52f9c
13. Feng, Z. H., Zou, L. L., Wei, Y. M., 2011. Carbon price volatility: Evidence
from the EU ETS, Applied Energy 88(3): 590-598.
http://dx.doi.org/10.1016/j.apenergy.2010.06.017
14. Fischer, C., Preonas, L., 2010. Combining Policies for Renewable Energy: Is
the Whole Less Than the Sum of Its Parts? International Review of
Environmental and Resource Economics, 4: 51-92.
http://dx.doi.org/10.1561/101.00000030
15. Fujiwara, N. (2016). Policy interaction between the EU Emissions Trading
System and the Renewable Energy Directive. CARISMA Working Documents
Series No. 2. file:///C:/Users/M/Downloads/SSRN-id2861124.pdf
16. Fuss, S., Szolgayova, J., Obersteiner, M., Gusti, M., 2008. Investment under
market and climate policy uncertainty. Applied Energy 85(8): 708-721.
http://dx.doi.org/10.1016/j.apenergy.2008.01.005
17. Gaast, W., Clochard, G., Alberola, E., Türk, A., Fujiwara, N. and Spyridaki,
N., 2016. Effects of Interactions between EU Climate and Energy Policies.
CARISMA Working Documents No. 3. https://www.i4ce.org/wp-core/wp-
content/uploads/2017/06/CARISMA-Working-Document-3-Policy-
Interactions.pdf

30
18. Green, F. and Stern, N., 2017. China's changing economy: implications for its
carbon dioxide emissions, Climate Policy 17(4): 423-442.
https://doi.org/10.1080/14693062.2016.1156515
19. Guan, D., Hubacek, K., Weber, C. L., Peters, G. P., & Reiner, D. M. (2008).
The drivers of Chinese CO2 emissions from 1980 to 2030. Global
Environmental Change 18(4): 626-634.
http://dx.doi.org/10.1016/j.gloenvcha.2008.08.001
20. Guo, X., Zhu, Q., Lv, L., Chu, J. and Wu, J., 2017. Efficiency evaluation of
regional energy saving and emission reduction in China: A modified slacks-
based measure approach. Journal of Cleaner Production 140(3): 1313-1321.
http://dx.doi.org/10.1016/j.jclepro.2016.10.021
21. Hone, D., 2013. The real price of CO2 in the EU. Shell Climate Change Blog.
http://blogs.shell.com/climatechange/2013/01/co2price/.
22. Hintermann, B., 2010. Allowance price drivers in the first phase of the EU
ETS. Journal of Environmental Economics and Management 59(1): 43-56.
http://dx.doi.org/10.1016/j.jeem.2009.07.002
23. Hu, Y., Monroy, C. R., 2012. Chinese energy and climate policies after
Durban: Save the Kyoto Protocol. Renewable and Sustainable Energy
Reviews 16: 3243-3250. http://dx.doi.org/10.1016/j.rser.2012.02.048
24. ICAP (International Carbon Action Partnership), 2015. Emission Trading
Worldwide: Status Report 2015.
https://icapcarbonaction.com/images/StatusReport2015/ICAP_Report_2015_0
2_10_online_version.pdf
25. ICAP (International Carbon Action Partnership), 2016. Emissions Trading
Worldwide: Status Report 2016.
https://icapcarbonaction.com/images/StatusReport2016/ICAP_Status_Report_
2016_Online.pdf
26. International Energy Agency (IEA), 2016. World Energy Statistics and
Balances 2016 Edition: II39-41&II242-244.
https://www.iea.org/statistics/relateddatabases/worldenergystatisticsandbalanc
es/
27. IETA, 2014. GHG Market Sentiment Survey 2014 9th Edition: A survey of
current market sentiment among IETA members. Geneva: International
Emissions Trading Association. http://www.ieta.org/Annual-GHG-Market-
Sentiment-Survey
28. Jiang, J., Xie, D., Ye, B., Shen B. and Chen, Z., 2016. Research on China’s
cap-and-trade carbon emission trading scheme: Overview and outlook.
Applied Energy 178: 902-917.
http://dx.doi.org/10.1016/j.apenergy.2016.06.100
29. Koch, N., Fuss, S., Grosjean, G. and Edenhofer, O., 2014. Causes of the EU
ETS price drop: Recession, CDM, renewable policies or a bit of everything? –
New evidence. Energy Policy 73: 676-685.
http://dx.doi.org/10.1016/j.enpol.2014.06.024

31
30. Lai, J. H. K., 2014. Mandatory reporting of greenhouse gas emissions from
buildings: Stakeholders’ opinions in Hong Kong. Energy Policy 75: 278-288.
http://dx.doi.org/10.1016/j.enpol.2014.10.004
31. Lee, M., Zhang, N., 2012. Technical efficiency, shadow price of carbon
dioxide emissions, and substitutability for energy in the Chinese
manufacturing industries. Energy Economics 34 (5): 1492-1497.
http://dx.doi.org/10.1016/j.eneco.2012.06.023
32. Li, J., Liang, X., Cockerill, T., Gibbins, J. and Reiner, D., 2012. Opportunities
and barriers for implementing CO2 capture ready designs: A case study of
stakeholder perceptions in Guangdong, China. Energy Policy 45: 243-251.
http://dx.doi.org/10.1016/j.enpol.2012.02.025
33. Liang, X. and Reiner, D.M., 2013. The Evolution of Stakeholder Perceptions
of Deploying CCS Technologies in China: Survey Results from Three
Stakeholder Consultations in 2006, 2009 and 2012. Energy Procedia 37: 7361-
7368. http://dx.doi.org/10.1016/j.egypro.2013.06.677
34. Liang, X., Reiner, D.M., Li, J., 2011. Perceptions of opinion leaders towards
CCS demonstration projects in China. Applied Energy 88: 1873-1885.
http://dx.doi.org/10.1016/j.apenergy.2010.10.034
35. Liu, M. R. and Wang, H. Y., 2014. A theoretical analysis of carbon emission
trading system in China and the perfection of its rules and regulations. Applied
Mechanics and Materials 448-453: 4530-4535.
http://dx.doi.org/10.4028/www.scientific.net/AMM.448-453.4530
36. Liu, Z., Guan, D., Crawford-Brown, D., Zhang, Q., He, K., Liu, J., 2013.
Energy Policy: A low-carbon road map for China. Nature 500, 143-145,
http://dx.doi.org/10.1038/500143a
37. Lo, K., 2014. A critical review of China’s rapidly developing renewable
energy and energy efficiency policies. Renewable and Sustainable Energy
Reviews 29: 508-516. http://dx.doi.org/10.1016/j.rser.2013.09.006
38. Marcantonini, C., Teixide-Figueras, J., Verde, S. F. and Labandeira, X., 2017.
The EU ETS and its Interactions with other Climate and Energy Policies.
Florence School of Regulation, RSCAS Policy Brief 2017/21.
http://cadmus.eui.eu/bitstream/handle/1814/47526/RSCAS_FSR_PB_2017_21
.pdf?sequence=2
39. Mehling, M. and Haites, E., 2009. Mechanisms for linking emissions trading
schemes. Climate Policy 9(2): 169-184.
http://dx.doi.org/10.3763/cpol.2008.0524
40. Morris, J. F., Reilly, J. M. and Paltsev, S., 2010. Combining a Renewable
Portfolio Standard with a Cap-and-Trade Policy: A General Equilibrium
Analysis. MIT Joint Program on the Science and Policy of Global Change,
Report No. 187.
41. National Development and Reform Commission (NDRC), 2010. Letter
including autonomous domestic mitigation actions.
http://unfccc.int/files/meetings/cop_15/copenhagen_accord/application/pdf/chi
nacphaccord_app2.pdf

32
42. National Development and Reform Commission (NDRC), 2011. Notice on
launching carbon emissions trading pilot.
http://www.sdpc.gov.cn/zcfb/zcfbtz/201201/t20120113_456506.html.
43. National Development and Reform Commission (NDRC), 2013. China’s
Policies and Actions for Addressing Climate Change.
http://en.ndrc.gov.cn/newsrelease/201311/P020131108611533042884.pdf
44. National Development and Reform Commission (NDRC), 2015. China’s
Intended Nationally Determined Contribution (INDC).
http://www4.unfccc.int/ndcregistry/PublishedDocuments/China%20First/Chin
a's%20First%20NDC%20Submission.pdf
45. National Development and Reform Commission (NDRC), 2016. Landmark
Notice on National ETS Guidance.
http://www.sdpc.gov.cn/zcfb/zcfbtz/201601/t20160122_772123.html.
46. National Development and Reform Commission (NDRC), 2017. Construction
Plan of National Carbon Emission Trading Market (Electricity Sector)
http://www.ndrc.gov.cn/zcfb/gfxwj/201712/W020171220566893899825.pdf
47. O’Keeffe, J. M., Cummins, V., Devoy, R. J. N., Lyons, D., Gault, J., 2016.
Stakeholder awareness of climate adaptation in the commercial seaport sector:
A case study from Ireland. Marine Policy. In Press.
http://dx.doi.org/10.1016/j.marpol.2016.04.044
48. Pethig, R., and Wittlich, C., 2009. Interaction of Carbon Reduction and Green
Energy Promotion in a Small Fossil-Fuel Importing Economy. CESifo
working paper No. 2749. https://www.cesifo-
group.de/pls/guestci/download/CESifo%20Working%20Papers%202009/CES
ifo%20Working%20Papers%20August%202009/cesifo1_wp2749.pdf
49. Perthuis. C., and Trotignon, R., 2014. Governance CO2 markets: Lessons from
the EU ETS. Energy Policy 75: 100-106.
http://dx.doi.org/10.1016/j.enpol.2014.05.033
50. Qi, S., Wang, B., Zhang, J. 2014a. Policy Design of the Hubei ETS Pilot in
China. Energy Policy 75: 31-38.
51. Qi, T., Zhang, X., Karplus, V. J., 2014b. The energy and CO2 emissions
impact of Renewable Energydevelopment in China. Energy Policy 68: 60-69.
http://dx.doi.org/10.1016/j.enpol.2013.12.035
52. Ranson, M. and Stavins, R., 2016. Linkage of greenhouse gas emissions
trading systems: Learning from experience. Climate Policy, 16(3), pp.284-
300. http://dx.doi.org/10.1080/14693062.2014.997658
53. Ragwitz, M., and Steinhilber, S., 2014. Effectiveness and Efficiency of
support schemes for electricity from renewable sources. Wiley
Interdisciplinary Reviews: Energy and Environment 3(2): 213-229.
http://dx.doi.org/10.1002/wene.85
54. Reiner, D.M. and Liang, X. 2011. Stakeholder Views on Financing Carbon
Capture and Storage Demonstration Projects in China, Environmental Science
& Technology 46(2):643-51.

33
55. Ren, S., Li, X., Yuan, B., Li, D. and Chen, X., 2018. The effects of three types
of environmental regulation on eco-efficiency: A cross-region analysis in
China. Journal of Cleaner Production 173: 245-255.
http://dx.doi.org/10.1016/j.jclepro.2016.08.113
56. Richstein, J. C., Chappin, E. J. L. and Vries, L. J., Adjusting the CO2 cap to
subsidised RES generation: Can CO2 prices be decoupled from renewable
policy? Applied Energy 156: 693-702.
http://dx.doi.org/10.1016/j.apenergy.2015.07.024
57. Schleich, J., Rogge, K.S., Betz, R., 2009. Incentives for energy efficiency in
the EU Emissions Trading Scheme. Energy Efficiency 2 (1): 37-67.
http://dx.doi.org/10.1007/s12053-008-9029-3
58. Sijm, J., 2011. The interaction between the EU emissions trading scheme and
national energy policies. Climate Policy 5(1): 79-96.
http://dx.doi.org/10.1080/14693062.2005.9685542
59. Sorrell, S., 2003. Who owns the carbon? Interactions between the EU
Emissions Trading Scheme and the UK Renewables Obligation and Energy
Efficiency Commitment. Energy & Environment 14(5): 677-703.
http://dx.doi.org/10.1260/095830503322663401
60. Syri, S., Cross, S., 2013. Weak EU emissions trading with strong renewables
obligation compromises long-term CO2 mitigation. Proceedings of the 10th
International Conference on European Energy Market (EEM), Stockholm, 27-
31 May 2013. http://ieeexplore.ieee.org/stamp/stamp.jsp?arnumber=6607395
61. UNFCCC, 2015. Paris Agreement.
http://unfccc.int/files/essential_background/convention/application/pdf/english
_paris_agreement.pdf. pp: 3.
62. Wang, P., Dai, H., Ren, S., Zhao, D. and Masio, T., 2015. Achieving
Copenhagen target through carbon emission trading: Economic impacts
assessment in Guangdong Province in China. Energy 79: 212-227.
http://dx.doi.org/10.1016/j.energy.2014.11.009
63. Wang, Q. and Chen, X., 2015. Energy policies for managing China’s carbon
emission. Renewable and Sustainable Energy Reviews 50: 470-479.
http://dx.doi.org/10.1016/j.rser.2015.05.033
64. Wu, L., Qian, H., Li, J., 2014. Advancing the experiment to reality:
Perspectives on Shanghai pilot carbon emission trading scheme. Energy Policy
75: 22-30. http://dx.doi.org/10.1016/j.enpol.2014.04.022
65. Wu, G., Liu, L., Han, Z. and Wei, Y., 2012. Climate protection and China’s
energy security: win-win or trade-off. Applied Energy 97: 157-163.
http://dx.doi.org/10.1016/j.apenergy.2011.11.061
66. World Bank, 2014. State and Trends of Carbon Pricing 2014. Washington,
DC: World Bank.
http://documents.worldbank.org/curated/en/505431468148506727/pdf/882840
AR0REPLA00EPI2102680Box385232.pdf
67. Yang, L., Li, F. and Zhang, X., 2016. Chinese companies’ awareness and
perceptions of the Emissions Trading Scheme (ETS): Evidence from a

34
national survey in China. Energy Policy 98: 254-265.
http://dx.doi.org/10.1016/j.enpol.2016.08.039
68. Yi, B., Xu, J. and Fan, Y., 2016. Determining factor and diverse scenarios of
CO2 emissions intensity reduction to achieve the 40-45% target by 2020 in
China – a historical and prospective analysis for the period 2005-2020. Journal
of Cleaner Production 122. 87-101.
http://dx.doi.org/10.1016/j.jclepro.2016.01.112
69. Zhang, D., Karplus, V. J., Cassisa, C., Zhang, X., 2014. Emission trading in
China: Progress and prospects. Energy Policy 75:09-16.
http://dx.doi.org/10.1016/j.enpol.2014.01.022
70. Zhang, Y., Hao, J. and Song, J., 2016. The CO2 emission efficiency, reduction
potential and spatial clustering in China’s industry: Evidence from the regional
level. Applied Energy 174: 213-223.
http://dx.doi.org/10.1016/j.apenergy.2016.04.109
71. Zhang, Y., Peng, Y., Ma, C., Shen, B., 2017. Can environmental innovation
facilitate carbon emissions reduction? Evidence from China. Energy Policy
100: 18-28. http://dx.doi.org/10.1016/j.enpol.2016.10.005
72. Zhang, Y. and Wei, Y., 2010. An over of current research on EU ETS:
Evidence from its operating mechanism and economic effect. Applied Energy
87(6): 1804-1814. http://dx.doi.org/10.1016/j.apenergy.2009.12.019
73. Zhao, X., Yin, H. and Zhao, Y., 2015. Impact of environmental regulations on
the efficiency and CO2 emissions of power plants in China. Applied Energy
149: 238-247. http://dx.doi.org/10.1016/j.apenergy.2015.03.112
74. Zhou, J. and Duan, M., 2011. Output-based Allowance Allocations under
China's Carbon Intensity Target. Energy Procedia 5: 1904-1909.
http://dx.doi.org/10.1016/j.egypro.2011.03.327
75. Zhou, P., Zhang, L., Zhou, D. Q., Xia, W. J., 2013. Modeling economic
performance of interprovincial CO2 emission reduction quota trading in China.
Applied Energy: 112: 1518-1.
http://dx.doi.org/10.1016/j.apenergy.2013.04.013