memorandum - swrcb.ca.gov · 24/1/2017 · a review and comparison of the regional board’s...
TRANSCRIPT

Memorandum
DA T E :
Airy Krich-Brinton
707 4th Street, Suite 200
Davis, CA 95616
530.753.6400 x226
530.753.7030 fax
January 24, 2017
T O: Betsy Elzufon
COP Y T O:
S UB J E CT : Seaside Lagoon Effluent Limits and RPA Review
INTRODUCTION
The Seaside Lagoon has received a Tentative Order of its NPDES permit (No. CA0064297) from
the Los Angeles Regional Water Quality Control Board (Regional Board) containing new effluent
limits for metals and carrying over the final effluent limits for certain conventionals and non-
conventionals. A review and comparison of the Regional Board’s analysis and effluent limits
calculation and a determination of compliance probability is described in this document.
REASONABLE POTENTIAL ANALYSIS
For priority pollutants such as metals and cyanide, the Regional Board compares the maximum
detected effluent concentration (MEC) and the maximum detected ambient concentration (B) to the
lowest applicable water quality objective (WQO) to determine whether effluent limits should be
assigned. This is called a reasonable potential analysis or RPA. LWA performed the analysis using
the same date ranges as the Regional Board: an effluent dataset extending from May 2011 –
September 2015, and the ambient dataset extended from August 2010 – September 2015. LWA’s
results were the same as the Regional Board’s as summarized below
Antimony, beryllium, chromium, chromium VI, nickel, and lead did not exceed the water
quality objectives and therefore were not assigned effluent limits.
Arsenic required effluent limits due to ambient exceedances (at RSW-001).
Cadmium, copper, mercury, selenium, silver, thallium, zinc and cyanide required effluent
limits due to effluent exceedances, although the more recent dataset (2014 onward) for
cadmium and cyanide have no exceedances of the WQO.
The Regional Board’s datasets contain lead concentrations reported in units of µg/L at
values varying by a factor of 10^6, suggesting a units reporting error. An ambient

January 24, 2017
Seaside Tentative Order Review Page 2
concentration was reported at 500 µg/L (with a MDL of 0.003 µg/L). The original lab
reports should be reviewed to verify whether the ambient maximum is actually 0.5 µg/L.
EFFLUENT LIMITS CALCULATION
The Regional Board calculated effluent limits for metals using the water quality objectives adjusted
by the effluent dataset coefficient of variation. The calculation was repeated by LWA and the
resulting numeric effluent limits were compared. The Regional Board’s calculations and resulting
effluent limits appear to be correct.
COMPLIANCE WITH PROPOSED EFFLUENT LIMITS
The daily and monthly effluent data and ambient data for metals, conventional, and non-
conventional pollutants were graphed from August 2010/May 2011 to September 2016 in the
following sections with the lowest water quality objective and the assigned effluent limits.
Arsenic
The graphs below present the effluent dataset used to determine reasonable potential (May 2011–
September 2015) as well as the most recent data available (through September 2016). The more
recent dataset (May 2014-September 2014) was used to determine the probability of future
compliance. Three ambient arsenic concentrations exceeded the water quality objective, the latest in
September 2014. Neither the daily or monthly average effluent concentrations have exceeded the
assigned effluent limits between May 2014 – September 2016.

January 24, 2017
Seaside Tentative Order Review Page 3
Cadmium
The graphs below present the effluent dataset used to determine reasonable potential (May 2011–
September 2015) as well as the most recent data available (through September 2016). The more
recent dataset (May 2014-September 2014) was used to determine the probability of future
compliance. The effluent and ambient cadmium datasets are non-detected between May 2014 –
September 2016. The data are all below detection limits, except for one value, and the reporting
limit is well below the effluent limits as well.

January 24, 2017
Seaside Tentative Order Review Page 4
Copper
The graphs below present the effluent dataset used to determine reasonable potential (May 2011 –
September 2015) as well as the most recent data available (through September 2016). The more
recent dataset (May 2014-September 2014) was used to determine the probability of future
compliance. Every detected copper concentration reported between May 2014 – September 2016
has exceeded the water quality objective. The most recently reported value is the second highest,
while the reporting limit is greater than the AMEL, causing all detected values to exceed the
assigned AMEL. Therefore it is likely that copper will have difficulty complying with the effluent
limits in the Tentative Order.

January 24, 2017
Seaside Tentative Order Review Page 5

January 24, 2017
Seaside Tentative Order Review Page 6
Mercury
The graphs below present the effluent dataset used to determine reasonable potential (May 2011 –
September 2015) as well as the most recent data available (through September 2016). The more
recent dataset (May 2014-September 2014) was used to determine the probability of future
compliance. Only three mercury concentrations were reported between May 2014 – September
2016, two of which exceed the water quality objective and AMEL (which are the same value).
Mercury may have difficulty complying with the effluent limits in the Tentative Order.

January 24, 2017
Seaside Tentative Order Review Page 7
Selenium
The graphs below present the effluent dataset used to determine reasonable potential (May 2011 –
September 2015) as well as the most recent data available (through September 2016). The more
recent dataset (May 2014-September 2014) was used to determine the probability of future
compliance. Selenium concentrations reported before October 2014 tended to exceed the assigned
MDEL and AMEL, however selenium has remained below the MDEL since October 2014.
Selenium continues to exceed the AMEL. Therefore, selenium may have difficulty complying with
the AMEL in the Tentative Order.

January 24, 2017
Seaside Tentative Order Review Page 8
Silver
The graphs below present the effluent dataset used to determine reasonable potential (May 2011 –
September 2015) as well as the most recent data available (through September 2016). The more
recent dataset (May 2014-September 2014) was used to determine the probability of future
compliance. Silver concentrations dropped significantly after October 2014, however detected
concentrations still exceed the assigned MDEL and AMEL. Silver will not be able to consistently
comply with the AMEL and MDEL assigned in the Tentative Order.

January 24, 2017
Seaside Tentative Order Review Page 9

January 24, 2017
Seaside Tentative Order Review Page 10
Thallium
The graphs below present the effluent dataset used to determine reasonable potential (May 2011 –
September 2015) as well as the most recent data available (through September 2016). The more
recent dataset (May 2014-September 2014) was used to determine the probability of future
compliance. The effluent thallium dataset contains only one detected value, reported at the reporting
limit, between May 2014 – September 2016, while the ambient dataset is all non-detected during
that time period. Non-detected values cannot trigger exceedances; however, reporting limits above
the effluent limits make the likelihood of exceedances greater. Thallium was non-detected in the
influent on the day of the detected effluent concentration, at the same reporting limit (10 µg/L).
January 24, 2017
Seaside Tentative Order Review Page 11
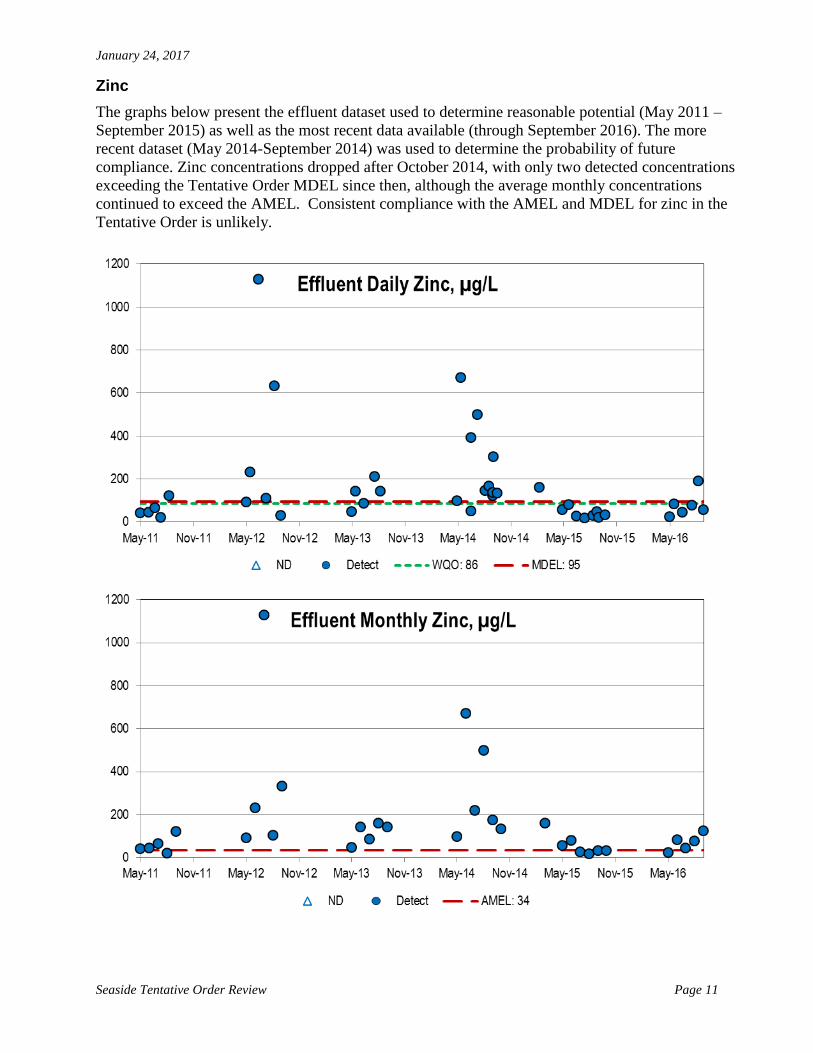
Zinc
The graphs below present the effluent dataset used to determine reasonable potential (May 2011 –
September 2015) as well as the most recent data available (through September 2016). The more
recent dataset (May 2014-September 2014) was used to determine the probability of future
compliance. Zinc concentrations dropped after October 2014, with only two detected concentrations
exceeding the Tentative Order MDEL since then, although the average monthly concentrations
continued to exceed the AMEL. Consistent compliance with the AMEL and MDEL for zinc in the
Tentative Order is unlikely.

January 24, 2017
Seaside Tentative Order Review Page 12
Cyanide
The graphs below present the effluent dataset used to determine reasonable potential (May 2011 –
September 2015) as well as the most recent data available (through September 2016). The more
recent dataset (May 2014-September 2014) was used to determine the probability of future
compliance. Only three cyanide data points were available between May 2014 – September 2016,
all non-detected in effluent and ambient. Non-detected values cannot trigger exceedances, however
reporting limits above the effluent limits make the likelihood of exceedances greater. The reporting
limit is significantly above the effluent limits, which would result in non-compliance if cyanide is
ever detected, as it was in August 2013.

January 24, 2017
Seaside Tentative Order Review Page 13
BOD
The effluent limits from the previous permit were carried over into the Tentative Order.
Oil and Grease
The effluent limits from the previous permit were carried over into the Tentative Order. Oil and
Grease concentrations have exceeded the proposed effluent limits repeatedly between May 2014 –
September 2016, therefore the likelihood of compliance is low.

January 24, 2017
Seaside Tentative Order Review Page 14
Total Suspended Solids
The TSS effluent limits from the previous permit were carried over into the Tentative Order. While
no exceedances have been observed after September 2013, TSS values appear to be trending
upward.

January 24, 2017
Seaside Tentative Order Review Page 15
pH
The effluent limits from the previous permit were carried over into the Tentative Order. pH has
exceeded the lower limit of 6.5 and occasionally come close to exceeding again since May 2014.
Chlorine
The effluent limits from the previous permit were carried over into the Tentative Order.
Temperature
The effluent limits from the previous permit were carried over into the Tentative Order.

January 24, 2017
Seaside Tentative Order Review Page 16
Turbidity
The effluent limits from the previous permit were carried over into the Tentative Order.
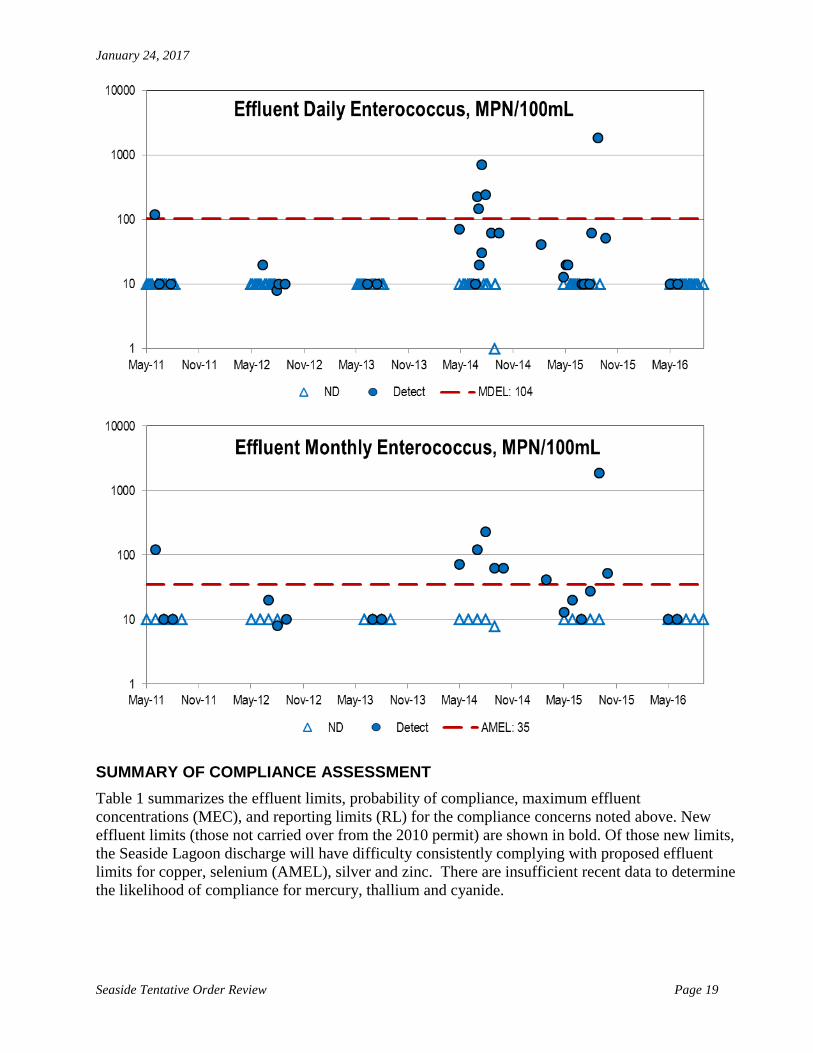
Total & Fecal Coliform, Enterococcus
The effluent limits from the previous permit were carried over into the Tentative Order. The most
recent data (2016) have not exceeded the effluent limits, although previous data have occasionally
been significantly higher (note the log-normal scale of the bacterial data graphs below).

January 24, 2017
Seaside Tentative Order Review Page 17

January 24, 2017
Seaside Tentative Order Review Page 18
January 24, 2017
Seaside Tentative Order Review Page 19
SUMMARY OF COMPLIANCE ASSESSMENT
Table 1 summarizes the effluent limits, probability of compliance, maximum effluent
concentrations (MEC), and reporting limits (RL) for the compliance concerns noted above. New
effluent limits (those not carried over from the 2010 permit) are shown in bold. Of those new limits,
the Seaside Lagoon discharge will have difficulty consistently complying with proposed effluent
limits for copper, selenium (AMEL), silver and zinc. There are insufficient recent data to determine
the likelihood of compliance for mercury, thallium and cyanide.

January 24, 2017
Seaside Tentative Order Review Page 20
Effluent concentrations of TSS have exceeded the effluent limits only once since 2011. However,
long-term TSS concentrations appear to be increasing in effluent and receiving water, which may
lead to exceedances during this permit term.
As shown in Table 1, a statistical analysis was performed to determine the probability of
compliance with the Tentative Order’s daily and monthly effluent limits, using data beginning no
earlier than May 2014.
Table 1. Probability of compliance for constituents with compliance concerns
Constituent
Tentative Order Probability of Compliance[b]
MEC RL AMEL MDEL AMEL MDEL
Oil & Grease, mg/L 10 15 47.3% 63.0% 60.1 6
Copper, µg/L 1.9 5.8 27.1% 66.4% 26 4
Mercury, µg/L 0.051 0.10 - - 0.088 0.2
Selenium, µg/L 56 122 43.3% 98.4% 88[a] 5.7
Silver, µg/L 0.92 2.2 0.1% 2.1% 15[a] 4
Thallium, µg/L 6.3 13 - - 10 10
Zinc, µg/L 34 95 20.6% 58.9% 190[a] -
Total Coliform, MPN/100mL 1,000 10,000 77.3% 96.7% 24,196 10
Fecal Coliform, MPN/100mL 200 400 86.0% 91.8% 8,664 10
Enterococcus, MPN/100mL 35 104 81.8% 89.9% 1,850 10
[a] From data collected after October 2014.
[b] Without the effect of intake credits. Intake credits are assessed below.

January 24, 2017
Seaside Tentative Order Review Page 21
ASSESSMENT OF COMPLIANCE THROUGH INTAKE CREDITS
Where applicable, influent data were graphed with recent effluent data (2014-2016) to show the
effect of intake credits on compliance. An analysis of the effect of intake credits on each constituent
is shown below.
Copper
Intake credits are allowed for copper. Three daily effluent results exceeded the MDEL when no
influent data were available. The percent daily compliance without intake credits is 52% (12
exceedances), and with intake credits 76% (6 exceedances). The percent monthly compliance is
44% (10 exceedances), and with intake credits 72% (5 exceedances).

January 24, 2017
Seaside Tentative Order Review Page 22
Selenium
Intake credits are allowed for selenium. As shown in the column graphs below, three daily effluent
results exceeded the MDEL when no influent data were available. The percent daily compliance
without intake credits is 72% (7 exceedances), and with intake credits 76% (6 exceedances). The
percent monthly compliance is 17% (15 exceedances), and with intake credits 50% (9 exceedances).
Therefore, although intake credits improve the probability of consistent compliance, the effluent
will still have difficulty consistently complying with the proposed effluent limits.

January 24, 2017
Seaside Tentative Order Review Page 23
Silver
Intake credits are allowed for silver. As shown in the column graphs below, four daily effluent
results exceeded the MDEL when no influent data were available. The percent daily compliance
without intake credits is 16% (21 exceedances), and with intake credits 64% (9 exceedances, 4 of
which occurred after October 2014). The percent monthly compliance is 11% (16 exceedances), and
with intake credits 61% (7 exceedances). Therefore, although intake credits improve the probability
of consistent compliance, the effluent will still have difficulty consistently complying with the
proposed effluent limits.

January 24, 2017
Seaside Tentative Order Review Page 24
Zinc
Intake credits are allowed for zinc. As shown in the column graphs below, three daily effluent
results exceeded the MDEL when no influent data were available. The percent daily compliance
without intake credits is 52% (12 exceedances), and with intake credits 72% (7 exceedances, 1 of
which occurred after October 2014). The percent monthly compliance is 28% (13 exceedances), and
with intake credits 56% (8 exceedances).

January 24, 2017
Seaside Tentative Order Review Page 25
Total Suspended Solids
Although no effluent limits would have been exceeded between 2014-2016, the influent TSS data
were reviewed to determine whether compliance could be assisted by intake credits, which are
allowed for TSS. As shown in the column graphs below, the daily influent concentrations have been
higher than the corresponding effluent concentrations 38% of the time and monthly 27% of the
time, suggesting that intake credits may assist with compliance should the effluent ever exceed, but
this cannot be guaranteed.
January 24, 2017
Seaside Tentative Order Review Page 26
For each constituent, a few effluent concentrations did not have corresponding influent
concentrations (June 2014, July 2014, May 2015). If these influent data points had been available,
the effect of intake credits on percent compliance may have been higher. A summary of the
potential effect of intake credits on compliance is shown in Table 2.
Table 2. Effect of Intake Credits on Compliance Between 2014-2016
Daily, MDEL[a] Monthly, AMEL[b]
% Compliance Without Intake Credits
% Compliance With Intake Credits
% Compliance Without Intake Credits
% Compliance With Intake Credits
Copper 52% 76% 44% 72%
Selenium 72% 76% 17% 50%
Silver 16% 64% 11% 61%
Thallium 100% 100% 78% 83%
Zinc 52% 72% 28% 56%
[a] For metals, there were 25 effluent and 21 influent daily data points available for this analysis.
[b] There were 18 effluent and 14 influent monthly data points available for this analysis
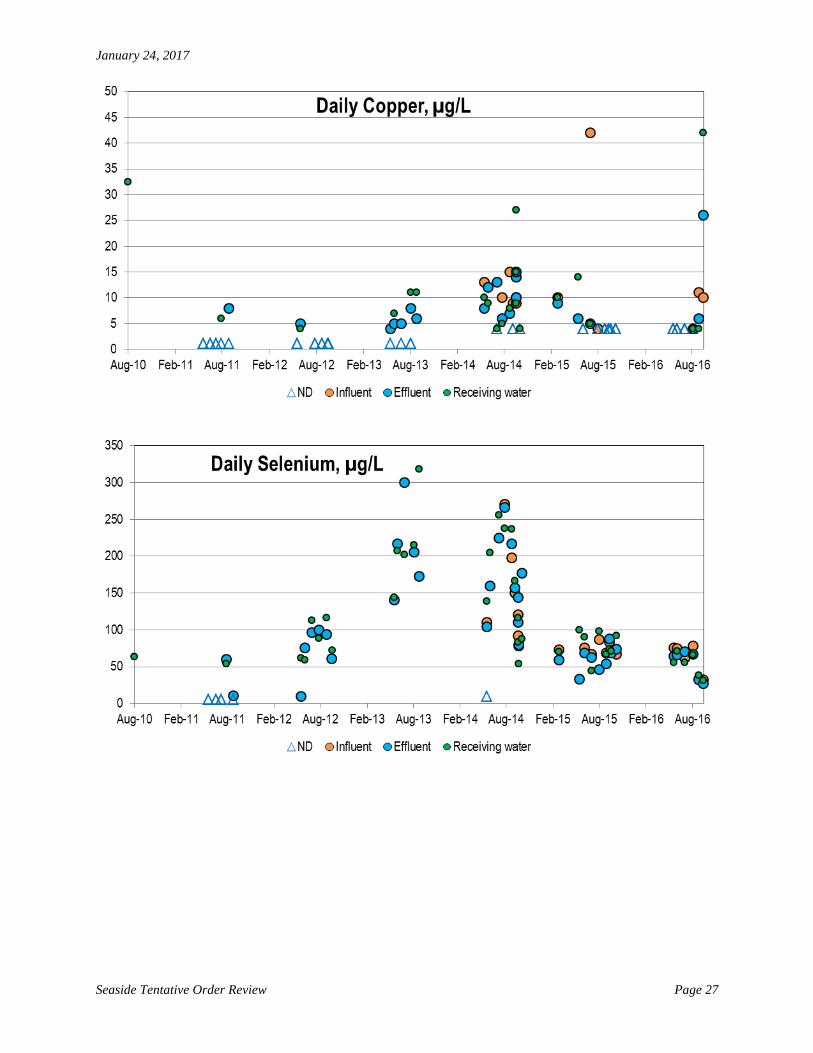
WATER QUALITY COMPARISON
The influent, effluent and receiving water data were graphed for copper, selenium, silver, zinc and
TSS. This was done to get a better understanding of the sources of each constituent and if there is a
possibility that a process occurs in the lagoon that changes the constituent concentrations.
A statistical regression analysis of differences between the 2014-2016 datasets was performed using
Minitab statistical software. The R2 values shown in Table 3 represent the results of the analysis. A
R2 value closer to 100% indicates that the two datasets are statistically similar, while a R2 value
closer to 0% indicates that the two datasets are statistically different. These results are shown in
bold, because they indicate the likelihood of some effect causing a statistical change in water
quality between the influent, effluent and/or receiving water.
Table 3. Regression Analysis Result (R2) – Dataset Similarity from 2014-2016
Effluent versus Influent Effluent versus Receiving Water
Influent versus Receiving Water
Arsenic Different Different Different
Nickel Different Similar Similar
Copper Different Similar Different
Selenium Similar Similar Similar
Silver Similar Similar Similar
Zinc Similar Similar Similar
TSS Different Different Different
Copper and TSS concentrations in influent, effluent and/or receiving water showed significant
differences in this analysis. The three datasets are graphed below (influent data were only available
beginning in 2014).
January 24, 2017
Seaside Tentative Order Review Page 27

January 24, 2017
Seaside Tentative Order Review Page 28

January 24, 2017
Seaside Tentative Order Review Page 29
A graph of the historic TSS concentrations from 6-60 µg/L is shown below. This shows that the
datasets are not similar, although the data clusters appear similar on a larger scale.