memorandum may 21, 1984 seltzej of women in panama
TRANSCRIPT

MEMORANDUM May 21 1984
TO See Distribution
FROM SampTPOPPDD Judith R Seltzej bull05
SUBJECT Report on the Socioeconomic Survey of Women in Panama
Attached is a report prepared by Ms Ana Hernandez de Pitti ofthe Statistics and Census Bureau in Panama Ms Hernandez was one of several authors from various developing countries whoparticipated in a project on census data on women The project was part of an AID- funded contract with DUALabs under the 1980 Round of Censuses project
The report describes the characteristics of womens status usingthe 1980 census of Panama This is the first completed reportunder the now ended project Authors from Kenya and Peru haveindicated that their reports may be completed in the near future
Attachment as
Distribution SampTiPoPiPDD S ClarkStaff SampTPOPOCS C Cromer LACDR R Corno LACCAP J Riley USAIDPanama City Mernik PPCWID S Tinsleyt
- x
S
J2J( 7-39
1 -t f i 1 iJ ] I -
REPUBLIC OF PANA1MA
SOCIOECONOMIC SURVEY OF WOMEN IN PANAMA
1980
ANA HERNANDEZ DE PITTI
PANAMA JULY 1983
I wish to express my gratitude to the Statistics and Census Bureau of the Comptroller General of the Republic for providing access to the statisshytical information of the 1980 Census (20 sampling) Special thanks to my colleagues in the Division of Social Planning of the Ministry of Planning and Economic Policy who offered their support in the various phases of this report
The Author
Index
Page No COUNTRY PRESENTATION
INTRODUCTION i - iii
CHAPTER
I DEMOGRAPHIC CHARACTERISTICS 1
A General Aspects
B The Female Population 16
II EDUCATIONe 30
A General Aspects 30
B Education in Panama and the Female Population 36
Literacy and Illiteracy 37
Participation in Enrollment 38
Level of Instruction 42
III THE PARTICIPATION OF WOMEN IN ECONOMIC LIFE 50
A General Aspects 50
B The Panamanian Woman in the Economically
52Active Population
1 Employed Women 56
2 Unemployment and Women 59
C Female Participation by Field of Activity 63
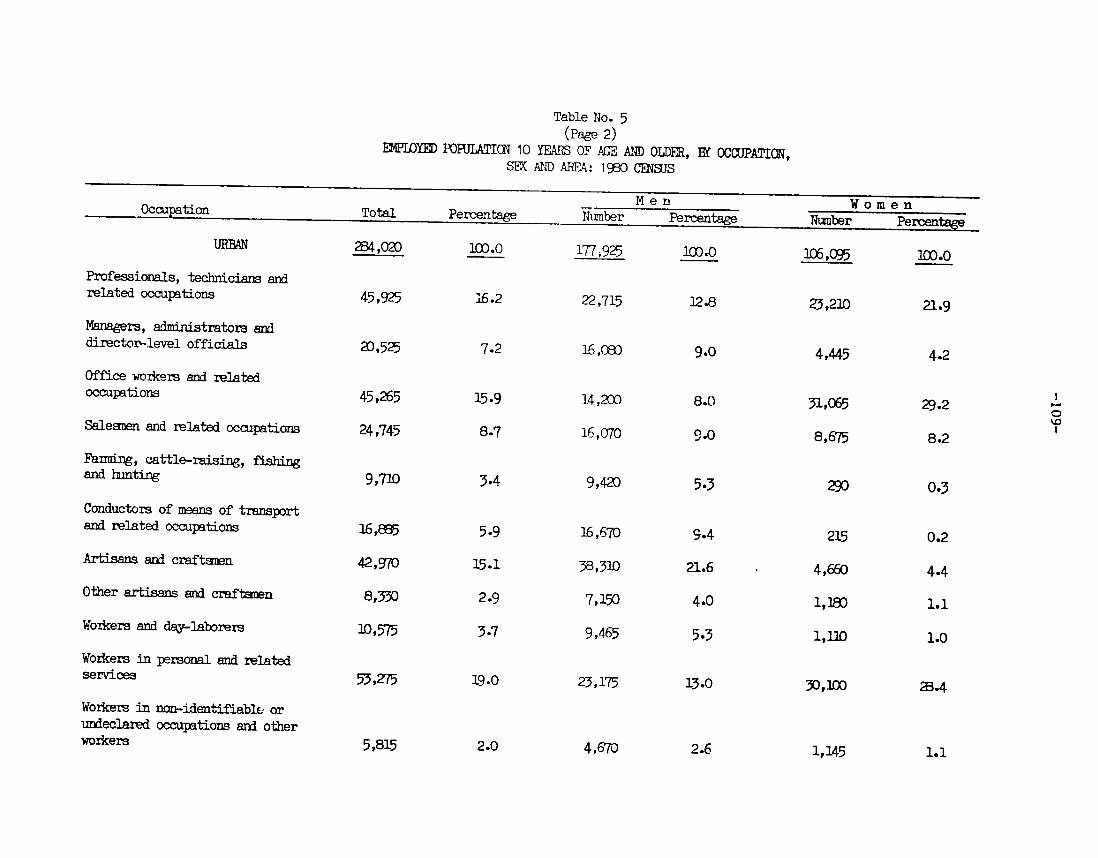
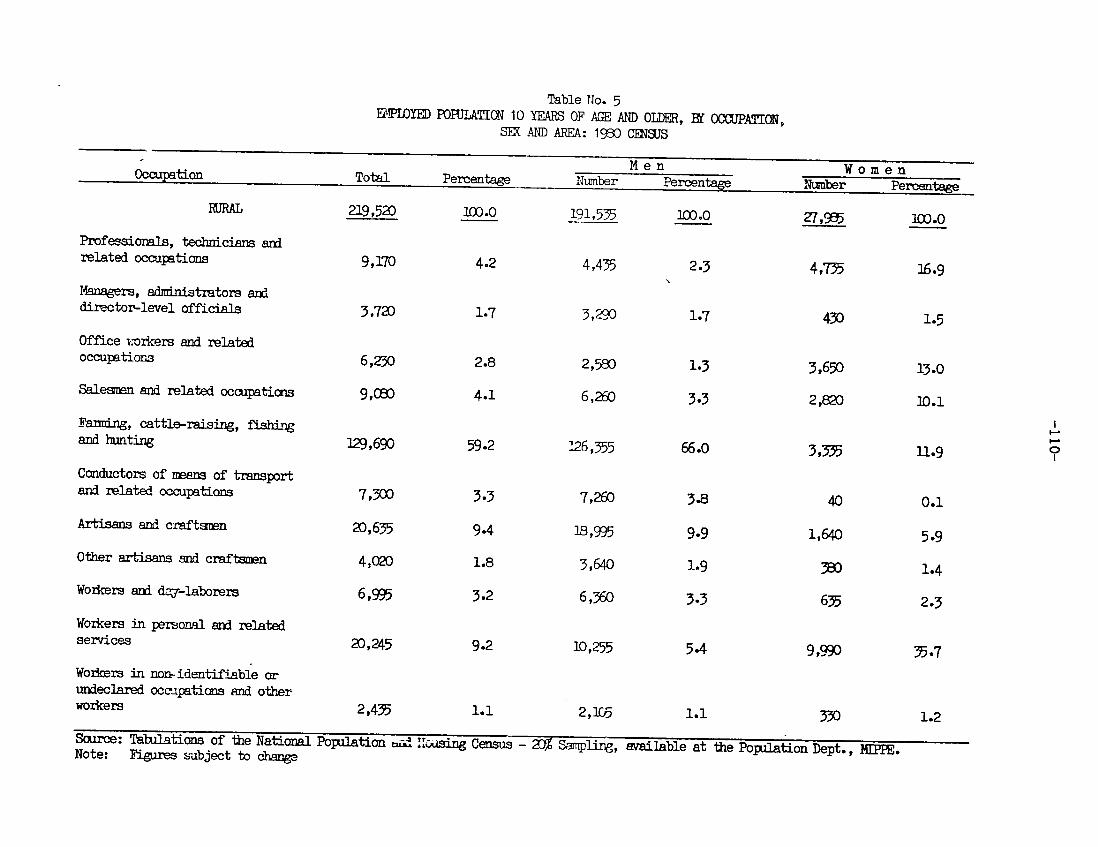
D Occupations of Women in Panama 69
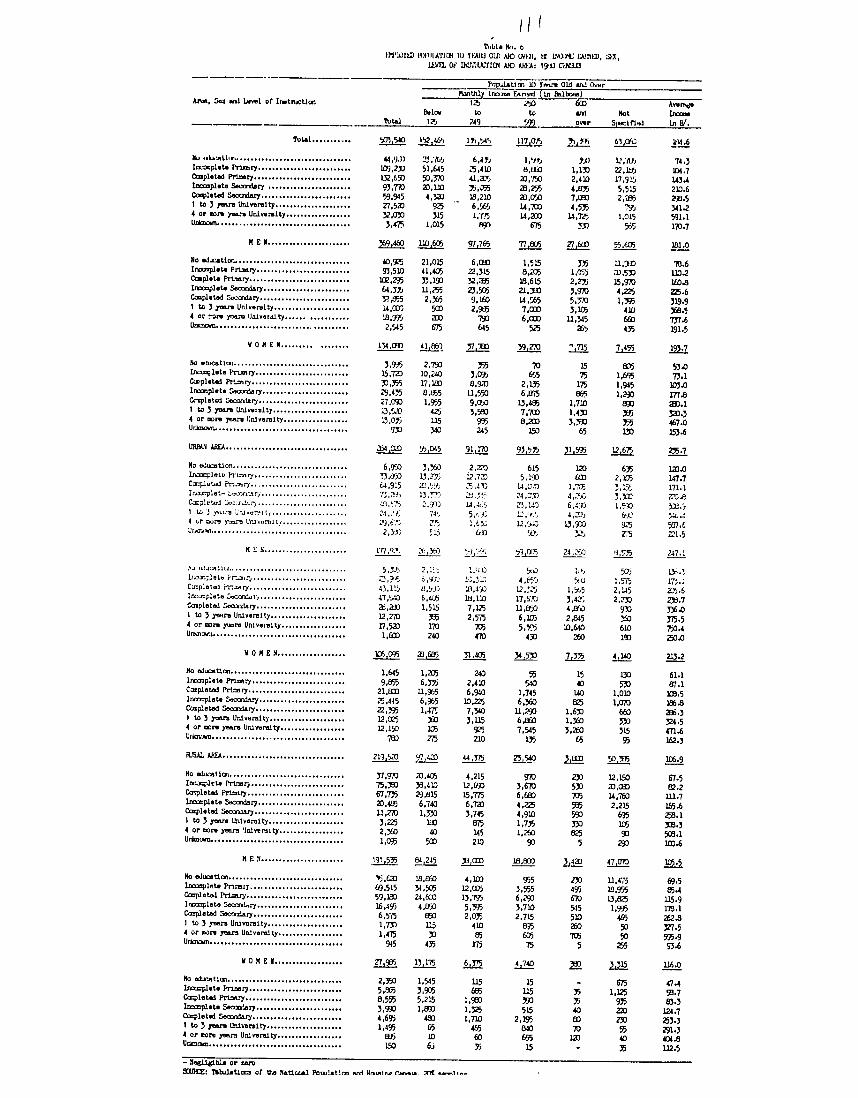
E Occupation Level of Instruction and Income 72
F Women and Categories of Employment 79
G The Economically Inactive Woman 83
87FINAL COMMENTS
ANNEXES
I Certain Legal Provisos that affect Female Labor 0 91
2 Statistical Annex 0 95
3 Family Form from the Eighth National Population Census and Fourth Housing Census 115
4 Some Notes on 1980 Census Procedures andEvaluations 125
BIBLIOGRAPHY o 128
MAP
PANAMA PLANNING REGIONS
bull -
9 -
-
BAHIA D ~ M
0 ~ ~ ~~d8 --
Prepared by PopuLation Dept - MIPPE
-~~~ CNE~ T R AL
M E T R 0 P 0 L I T AN
WE S T ER N
INTRODUCTION
In Panamanian society as in most countries important transformations
have occurred which have placed growing responsibilities on its members
Women who traditionally had many obligations intrinsic to their role as
mothers and providers of care in the home have seen this role evolve in resshy
ponse to changes in the countrys social political and economic orders
It is recognized that the situation of women has progressively improved
education and access to various levels of training have been decisive elements
in this change We cannot yet affirm however in view of certain persistent
situations that Panamanian women enjoy equality of conditions with men We
also accept that this reality is not exclusive to Panama but that it also
occurs in most countries throughout the world This recognition led the United
Nations to proclaim 1975 as The International Year of the Woman with the aim
of defining a society in which women participate truly and fully in economic
social and political life and preparing strategies for this society to
evolve
Since 1975 a series of international fora and statements have reaffirmed
womens right to work to receive equal remuneration as men for the same jobs
to benefit from equal conditions and opportunities for career advancement as
well as all other rights necessary for fulfilment in every walk of life in
their countries
That same year at the conference held in Mexico and which was the years
major event it was declared that discrimination against women is incompashy
tible with human ignity and with the well-being of the family and society and
prevents the participation of women in the political social economic and
cultural life of their countries under conditions of equality with men
-ii-
One of the most important legacies of The International Year of the Woman
was the approval of the World Action Plan which set forth a series of importshy
ant objectives and minimum targets to guide countries in planning actions and
designing programs for the benefit of their peoples This document which
directs the actions of countries throughout the decade states that adequate
information and data are indispensable to formulate policies modify attitudes
and introduce basic economic and social changes
In effect national planning activities continually require accurate and
timely statistics and at different levels of disaggregation in order to preshy
pare reports and diagnostics organize projects and take decisions leading to
transformations needed to achieve the well-being of the people
New orientations in the field of development at the international
regional and national levels give priority attention to those groups that have
been on the fringes of socio-economic change Based on the above it is impershy
ative that information gathered and processed in the different countries be
disaggregated by geographic area economic region age group sex and so
forth
Although considerable advances have been made in many countries includshy
ing Panama in gathering and processing census data this information is still
limited as concerns a precise knowledge of certain characteristics chiefly
related to the female population Among the most common are those that refer
to their participation in economic activity and which contain different
levels of sub-indicators This can be explained among other things by the
very patterns of female work and the design gathering and processing of
information activities where sexual prejudices occur A rather generalized
situation seems to be the inadequate classification of women as housewives
excluding them from statistics on labor force participation when they work in
-iiishy
traditional sectors of the economy which are considered extensions of the
home particularly in the case of rural workers
The present report Socio-Economic Survey of Women in Panama - 1980 is
the contribution of the Census Data on Women project an effort in which
various countries participated and which has been supported by Data Use and
Access Laboratories the US Agency for International Development and Data
for Development the latter an international association of volunteers which
promotes the use of data in the development process The objectives of the
project are to offer information on women based on censuses taken in various
countries at the beginning of the 1980s This research work has been based
primprily on data from the latest Population and Housing Census taken in
Panama in May 1980
Despite its limitations we consider this work of great utility since in
a very general manner it examines certain data available at the time of the
last census (20 sampling) in order to provide an overview of the socioshy
economic situation of Panamanian women
We hope that this modest effort will be useful to persons interested in
knowing the situation of women in Panama and also serve to motivate other reshy
searchers so that they will further analyze situations which are treated here
in summary fashion
COUNTRY PRESENTATION
Panama is one of the six republics that make up the isthmus of Central
America and territorially one of the smallest countries in the Americas It
has an area of 77082 km2 and according to the latest Census (May 11 1980)
a population of 1824796 with a density of 237 inhabitants per square kiloshy
meter To the North it borders on the Caribbean to the South the Pacific
Ocean to the East the Republic of Colombia and to the West the Republic of
Costa Rica Its political-administrative structure identifies nine provinces
65 districts or municipalities one Indian Reserve and 505 elector-l wards
The capital of the country is Panama located on the Pacific which at
the time of the latest census registration had about 600000 inhabitants
Other important urban centers in the country are the cities of Colon David
Chitr and Santiago
Panama began its life as an independent Republic on November 3 1903 For
eight decades the country has endeavored to gradually improve the well-being
of its citizens however like its other Latin American neighbors it contishy
nues to face the many problems inherent to its status as a developing country
MA P Nl
Boo FLORIDA (EUA)
GuLf of Mexico
AtLantic Ocean
HAITIA PUERTOEXIO EMJCO R
GUATEMALA HONDU RAS
EL SALVADOR NICARAGUA
CO TA770 0924 0pound511TDOST
PANAM303o0H oI CS( L O C
8deg PA tl of
0n
_M70 12 04 VENEZUELA ~ LATfTUD NORTE[ -
Pacific Ocean
C O0MBI
SECUADOR
P AN A MA I N T HE AME RI C AS (LOC A T 10N
I DEMOGRAPHIC CHARACTERISTICS
A General Aspects
Demographic data have a basic importance in the overall planning of a
countrys development particularly when oriented towards improving the
quality of life of its inhabitants through the provision of basic services to
the population especially in the fields of health employment housing and
education
While numerical indexes do not allow precise answers to the crucial
question of how a nations needs and aspirations are being satisfied they do
however provide some criteria for appreciation which are useful in estimating
the magnitude of certain problems and in guiding policy design
Panama has an excellent census tradition during its years as an
independent republic various censuses have been taken of which eight were
National Population Censuses The first was in 1911 while the others were in
years ending in zero the latest was taken on May 11 1980
The Republic of Panama had a total population of 1824796 inhabishy
tants according to the 20 sampling of the May 1980 Population Census This is
a 4435 increase over the figure for the first census taken in the country in
1911 (336742 inhabitants) that is in seven decades the population of the
national territory has more than quadrupled From Table 1 it can be seen that
the growth rate has varied throughout Panamas demographic evolution Between
1911 and 1950 a period of four decades the population doubled then doubled
again in less than three decades Figure 1 illustrates this growth
1 General Direction of Planning and Administration Office of the President Strategy for National Development 1970-80
-2-
TABLE 1 POPULATION OF THE REPUBLIC OF PANAMA
1911 TO 1980 CENSUSES
Annual Growth Year Total Rate (per 100 inshy
habitants) I
Population
1911 336742
317 1920 446098
047 1930 467459
276 1940 622576
256 1950 805285
2-94 1960 1075541
3o6 1970 1428082
18247961980 a 248
1 The exponential growth formula was used i Figures derived from a Sampling of the National Population Census
Source Statistics and Census Bureau Comptroller General of the Republic of Panama Panama in Figures Years 1976 to 1980
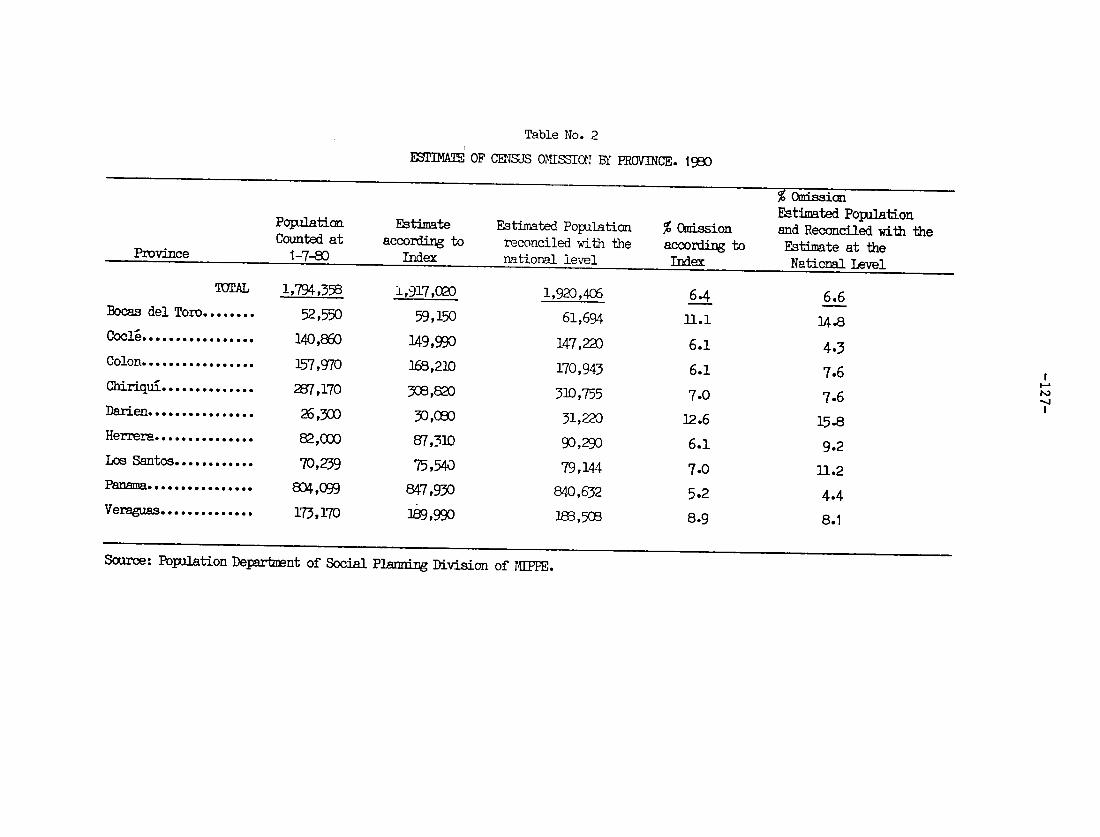
On the other hand there is no homogeneity in the growth rates of the
various political-administrative divisions that make up the Republic (see
Table 2) while some provinces particulprly the province of Panama have
shown relatively high rates others register the opposite case as clearly
illustrated by the province of Los Santos which presents very low and even
negative growth rates (see period 1970-1980) In this unequal distribution of
the population a very important role is played by the rural-urban migratory
flow which caused a rapid process of urbanization Three decades ago 64 of
the total population lived in rural areas while in 1980 this figure had
declined to51
FIGURE 1
POPULATION GROWTH IN THE REPUBLIC OF PANAMA Thousand Inhabitants 1911 TO 1980 CENSUSES AND
3000- PPnjFfTIONS TO YEAR 2000
28932812700
2180898 shy210 0 - ID
9e
800 - 1824796 V
1500shy
1428082
1200
1075541
00 - 467454
X 1911 1920 1930 1940 l9 -o1960 1970 1980 1985 1990 2000
CesC BEaCENS USES PreliSnr P R 0 J E C T 1 0 N SP O E TOSource Statistics and Census Bureau X-PreliminaryPrepared by MIPPE -Division of Social Planning Figures
POUFJI-TICn GROWIH TABLE 2
IN PANAMA B PVNCE 1911 - 1 W8
Year Total del
Toro Cocle Colon Chiriui Irien Herrera Loa Sartcle Panama Voraguas
Population 1911 -336742 1920 1099 1930 467459 1940 622578 1950 805285 1960 1075541 1970 I A1308 1983 a I 24796
AnqIal Groth Rate I per 100 inhabitantashy
22732 27239 15851 15523 22392 32600 43531 52416
35011 45151 48244 55737 73103 93156
118003 140524
32092 53250 57161 78119 90144
105416 134286 165622
63364 76470 76918
111206 138136 188350 236154 286418
8992 10728 13391 14930 14660 19715 22685 26247
23007 28984 31030 38118 50095 61672 72549 81 76
30075 3463B 41218 49621 61422 715-4 7238D 70272
61855 99035
114103 17332B 248335 372393 579 65 828553
59614 66603 69543 84994
106998 131695 151849 17286
1911 i92
1930 1940 o
i950
1970
199 )
317
047
276
256
294
306
248
203
-557
039
302
383
312
187
286
066
138
269
245
254
176
685
-019
301
141
15S
260
222
211
006
356
215
315
243
195
199
225
104
-018
30i
150
147
260
06B
19771 271
210
174
122
1581 5
176
1787 23
140
07
-029
52551
163
4051-519 3591
414
476
369
1242
043
22
210
152
130
I Me ezportial aroth formula wa enployeFiguw taken frcn a sampling of the National Census PoplationLxludes the Canal Area (Cristobal and Anm dd)
FIGURE 2
GENERAL MORTALITY RATE PER 1000 INHABITANTS IN THE REPUBLIC 1970 AND 1980
RATE
7
6
5 41
3
2shy
1970 1980
BIRTH RATE PER 1000 INHABITANTS IN THE REPUBLIC 1970 AND 1980
40 374
35
30-271
25shy
20shy
15shy
i0shy
5-
U A 1970 1980
SOURCE Panama in Figures Nov 1982 Prepared by MIPPE Population Dept
Division of Social PLanning
-6-
Panama can be classified as a country in full demographic transition
it has registered a gradual reduction in fertility along with a decline in
mortalityDuring the period 1970-80 the birth rate declined from 374 to 271
per thousand inhabitants while the mortality rate declined from 71 to 4-1 per
thousand (see Figure 2) Table 3 presents fertility and mortality indicators
for each year from 1970 to 1980
We can surmise that the improvement in these indicators is due to
various factors such as advances in health and environmental sanitation exshy
tension of coverage of educational services evolution of urbanization processhy
ses etc It is important to mention the increase in life expectancy at birth
which occured in recent years In the period 1970-75 it was 68 years of age
while it is expected to rise to 71 years of age for the period 1980-85
This index places Panama among the countries with the highest life
expectancy in the Americas This situation becomes apparent in the last decade
if we compare the mortality rate estimated for the Republic of Panama in the
years 1975-76 with that of other countries in the Americas Life expectancy at
birth as well as the annual mortality rate placed Panama among the most
favored countries as concerns this index Only Uruguay and Cuba among the
Latin American countries and Canada and the United States in North America
had lower mortality rates than Panama -
Furthermore it must be recognized that the extended coverage of
educational activities has led to positive changes in habits attitudes and
behavior while the extension of contraceptive practices has limited procreshy
ation and led to a reduction in the number of children per woman
1 National Demographic Survey of Panama Years 1975-1976 Chapter on Mortality - Statistics and Census Bureau Comptroller General of the Republic 1979
SOME DFX4GRAIRXC
TAKE 3
INDICATORS MR THE REIHJEITC
YEARS 1970-198O
1970 1971 1972 1973 1974 1975 1976 1977 1978 1979 1980 (P)
Live births I
Deaths
Deaths of infants lessthan one year old
Birth rate_ (per
thousand)
Mortality rate 1 (per
thousand)
Natural growth rate
(per thousand)
53287
10225
2156
371
71
300
54948
9857
2064
372
67
305
54910
9076
1848
360
60
300
52091
9161
1737
332
58
274
52772
9001
1663
326
56
270
53790
8683
1669
323
52
271
53002
8564
1951
308
50
258
52722
8036
1470
298
45
253
53040
7555
1294
291
41
250
52919
8192
1308
281
44
237
52611
7959
1144
271
41
230
1 From 1970 data calculated on the basis of revised population estimates at July 1
(P) Prelimrnny data
Source Statistics and Census Bureau Controller General of the Republic Panan in Figures Years 1976 to 198D
-8-
As a developing country Panama presents a series of distortions in
the economic and social realm which give rise to differences by area region
and political-administrative divisions the largest of which are the proshy
vinces
Demographic indicators show marked differences at both the regional
and provincial levels birth rates mortality rates and consequently natural
growth rates reveal contrasting situations (See Table 4)
Note that the Provinne of Bocas del Toro showed the highest birth
rate in 1980 - 41 births pef thousand inhabitants - followed in order by
Veraguas and Cocl with 309 and 285 respectively Los Santos and Panama
however show rates of only 20 and 25 births per thousand As for mortality
the Province of Panama has the lowest rate while Colon has the highest Bocas
del Toro and Veraguas also have high rates (they are provinces with important
percentages of Indian populations) These differences can be explained by the
level of access that the population has to health and education services and
by the general living conditions which result from the level of economic
development of each province It should be noted that the reliability of the
above rates is affected by population estimates age structures and by
incomplete vital statistics records For example in Darien Province the
records show a mortality rate of 14 per thousand which is considered unacshy
ceptable data given the provincess socio-economic conditions (it is the
easternmost province in the country with a high percentage of Indians in its
population and still suffers from difficult land communications with the
other provinces)
Infant mortality rates registered significant decreases over the
period 1970-80 at the national level they dropped from 405 to 217 per
thousand live births However this decrease varies in intensity by province
TABLE 4
NATALITY GENERAL AND INFANT MORTALITY AND NATURAL GROWTH IN THE REPUBLIC AND IN THE CITIES OF PANAMA AND COLON BY PROVINCE OF RESIDENCE 1980 1
City Area and Province Natality Mortality Natural
General Infant Growth
Total
Number
52625
Rate 3
271
Number
7959
RateL 3
41
Number
1144
Rate
217
4 Number
44667
Rate
230
3
Panama City Colon
Urban Rurtl
gocas del Toro Coc A Col6n
Chiriqu8 Darin
Los t Panam Veraguas
101B2 1968
25551 27075
2437 4337 4877
8553 647
2227 1483
22465 5540
219 253 255 289
410 285 280
284 245
265 199 254 309
1858 440
4055 3904
294 608 896
1281 38
347 347
3285 863
40 203 57 43 41 496 42 648
49 91 40 114 51 100 43 222 14 8
46 53 47 21 37---- 442 48 93
199 218 194 239
373 263 205 260 124 232 142 197 188
8324 1528
21496 23171
2143 3729 3981 7272
609
1940 1136
19180 4677
179 196 214 247
361 245 229 241 231
225 152 217 261
0
1 2 3
4
Figures subject to revision Excludes stillbirths Rate per thousand inhabitants based on the population estimate at July 1 of the respective year subject to revision Rate per thousand live births
5 Reliable mortality data for Darien Province are not available
Source Statistics and Census Bureau of the Controller General of the Republic - Vital Statistics
FIGURE 3
PERCENTAGE DISTRIBUTION OF THE POPULATION I N T H E R E P U B L I C B Y S E X A N D A G E 1980
AGE
030 80 amp up 034
038 75- 79 040
0-55 TO7- 75 052 65- 69 079
14 E N 113 60-64 4 W 0 M E N
434 55 - 59 124
L 50 - 54 149 S 45-49 176
216 40-44 -4
tx6r 35- 39 t 0 --- 5- 57i33ii
227 30- 3431
3825-29 __
482
20 - 24 15 19
_ _ 4 ~ 632
r~~
-9 8 7 6 5 4 3 2 I 0 0 I 2 3 4 5 6 78 9
SOURCE Statistics and Census tsureau IntergoernmentaL Team DEC-MIPPE-IFARHU-HEALTH 1983
-11-
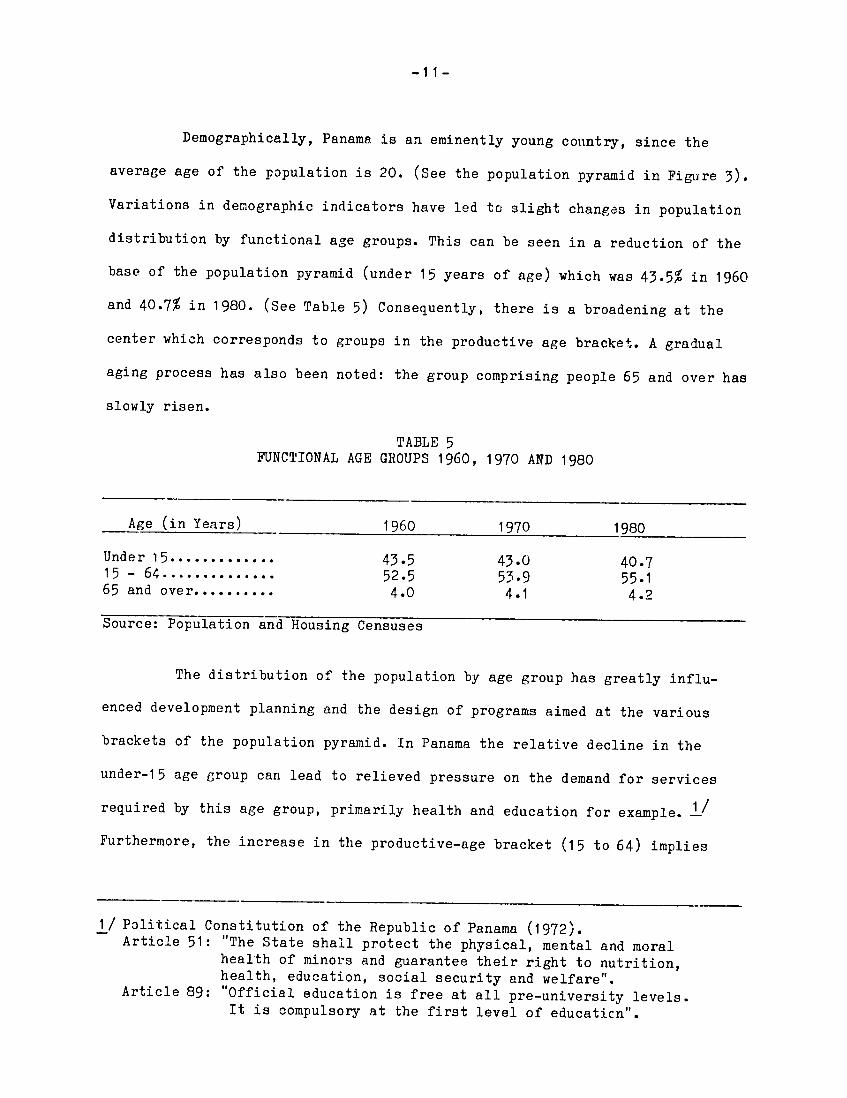
Demographically Panama is an eminently young country since the
average age of the population is 20 (See the population pyramid in Figure 3)
Variations in demographic indicators have led to slight changes in population
distribution by functional age groups This can be seen in a reduction of the
base of the population pyramid (under 15 years of age) which was 435 in 1960
and 407 in 1980 (See Table 5) Consequently there is a broadening at the
center which corresponds to groups in the productive age bracket A gradual
aging process has also been noted the group comprising people 65 and over has
slowly risen
TABLE 5 FUNCTIONAL AGE GROUPS 1960 1970 AND 1980
Age (in Years) 1960 1970 1980
Under 15 435 430 407 15 - 64 525 539 551 65 and over 40 41 42
Source Population and Housing Censuses
The distribution of the population by age group has greatly influshy
enced development planning and the design of programs aimed at the various
brackets of the population pyramid In Panama the relative decline in the
under-15 age group can lead to relieved pressure on the demand for services
required by this age group primarily health and education for example -
Furthermore the increase in the productive-age bracket (15 to 64) implies
I Political Constitution of the Republic of Panama (1972) Article 51 The State shall protect the physical mental and moral
health of minors and guarantee their right to nutrition health education social security and welfare
Article 89 Official education is free at all pre-university levels It is compulsory at the first level of educaticn
-12shy
more intensive population pressure on the job market and the need to promote a
greater productivity in order to ensure the right to work
Panama cannot escape a demographic phenomenon common to many counshy
tries particularly underdeveloped ones which is the unequal distribution of
the population nationwide the large concentrations of population in small
areas and a great dispersion throughout the territory
In effect there is a marked concentration of economic activity and
population in the Metropolitan Region (Provinces of Panama and Colon) in conshy
trast with the rest of the country (See Map No 3) In 1980 slightly less than
half the population of the Republic of Panama lived in this region and contrishy
buted about three-fourths of the Gross Domestic Product
This phenomenon which affects Panamas overall development was
clearly recognized by the National Government through its policy of National
Integration for the countrys regions and included among its priorities the
most effective exploitation of natural resources the expansion of the natioshy
nal market the integration of the entire territory through the creation of
basic physical infrastructure (such as highways airports ports and electrishy
fication) the strengthening of the countrys main urban centers with emphashy
sis on the cities of the interior and the expansion of the agricultural and
industrial base of production - This approach also considered the need to
seek alternatives to rural-urban migration given the abundant resources not
only of the populated Pacific coastal area but also of the lesser known
frontiers as yet unincorporated into the national development effort (Darien
and the Atlantic Coast) as well as the need to provide basic services gti the
rural population
1 National Development Strategy 1970-80 and National Development Plan 1976-80
-13-
Table 6 illustrates the contrast between the volume of production
concentrated in the Metropolitan Region and the other regions Note the
situation of the Metropolitan Region with 529 of the population while the
Eastern Region despite its size contains only 3 of the total population
One province alone Panama represented 454 of the 1980 census population
This situation is due primarily to the continual absorption by the
Metropolitan Region of the migratory flows from the other regions a pattern
which has persisted throughout the countrys history since this part of the
territory has been the political-administrative axis and the hub of the
principal income-generating activities
Earlier studies show that the deterioration of rural living standards
is closely linked to the migratory phenomenon Contributing factors are the
low income levels the gradual decline in property size the concentration of
the population on farms smaller than five hectares and the seasonality of
employment which typifies Panamanian agriculture
The wigratory phenomenon has important implications on various
aspects of the socio-economic reality among which is a rapid increase in the
supply of female labor that cannot find job opportunities thus generating high
unemployment rates particularly in the Metropolitan Region
The above situation requires special attention with urgent measures
needed to halt this permanent mobilization of the population which not only
causes serious disequilibria as to its geographic distribution but also leads
to serious maladjustments in society
MAP N3
02
S5
URBAN CENTERS
393633 inhab PAMAMAJ
i Q 157063 (SAN IUELIT I
DISTRIBUTION OF THE POPULATION IN THE VARIOUS UPRAW CFNTF - 198n CENSUS
Prepared by the Teenical Support Unit of the Populatioi Dept of the MIPPE Based on preliminary figures of
the 1980 National Census
59832
0 50621
O 30971
0 21809 I0OOQ-999
bull oo0-0 l el-w 15 q I ] below I+
(COLdN 1 3
(DAYID) 4
(CHORRERA) 5
SANTIAGO)(nAJANi
-15-
TALE 6 POPJLATI(C DISRIFJTICN AND DENSIT= BY
PROVINCE AND PLANNING IMlIONS
Population Area in Km2 DensityRegion and Province Inhabm
Number Percentage Number Percentage
Total 1830175 1000 770S20 1090 237
Eastern 55064 30 200090 260 28 Darien 26497 14 168030 218 16 San Blas 28567 16 32060 42 89
Metropolitan 968150 529 169830 220 570
Panama 830278 454 12022O 156 691 ColonI- 137872 75 49610 64 278
Central 465581 253 224150 290 208
Coc1e 140320 77 50350 65 279 Herrera 81866 45 24270 31 337 Los Santos 70200 38 38670 50 182
Veraguas 173195 95 110660 144 156 Western 3413890 186 17675o 230 193
Bocas del Toro 53579 29 89170 116 60 Chiriqui 257801 157 87580 114 329
1 Excludes San Blas
Sources Preliminary Figures from 19e0 Population Census Bireau of Statistics and Census Prepared by Population Department of MIPPE
-16-
B The Female Population
In reviewing distribution by sex in the census results we note that
there has always been a slightly lower ratio of women compared to men 49 and
51 respectively
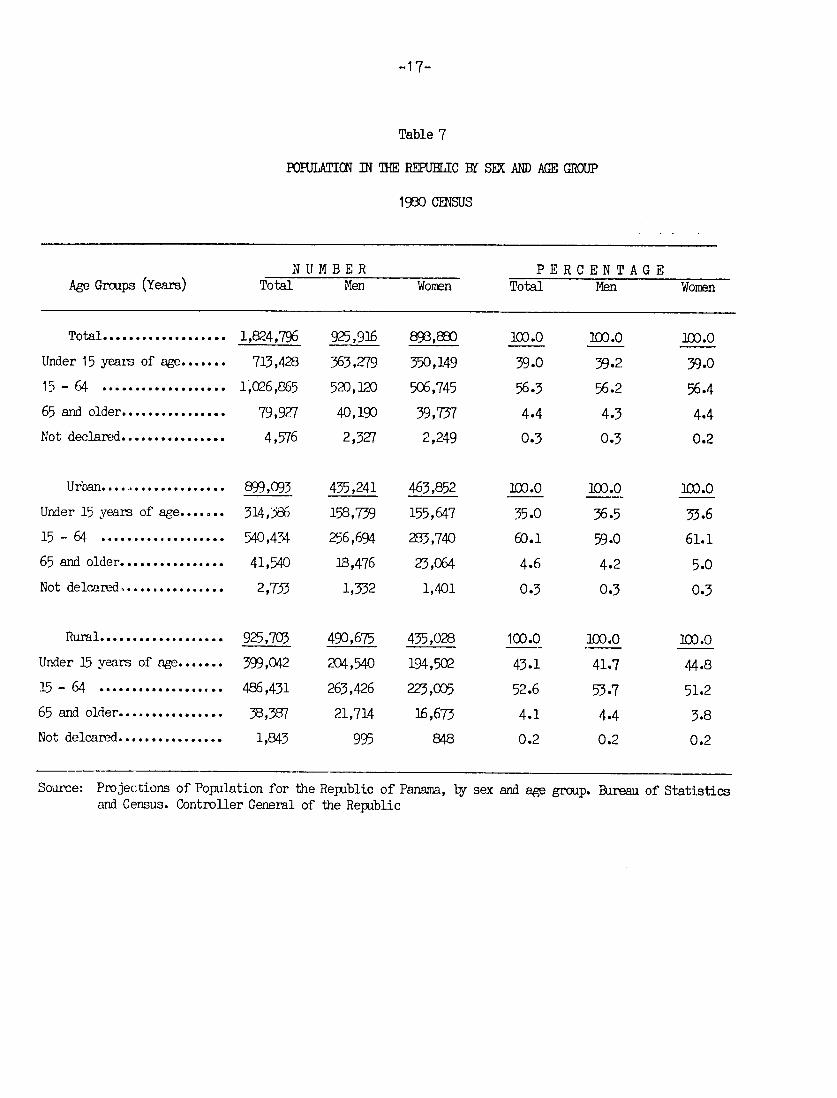
As concerns distribution by age groups (see Table 7) the most signishy
ficant group (564) is that in the productive ages This indicates that of
the countrys human resources women have a great potental contribution to
development if adequate mechanisms can be found to incorporate an evershy
growing number of them into the various activities which foster national
development
With regard to the geographic distribution of the female population
by age groups an important difference is seen by area as illustrated in
Table 7 The relative proportion of girls 15 and under in the female populashy
tion is fairly low in urban areas as compared with rural areas (34 and 45
respectively)
The opposite occurs in the productive ape group (15 to 64 years of
age) which within the total female population represents 611 in urban
areas and 512 in rural areas Among the reasons which explain this is the
considerable rural-urban migratory movement which occurs in the country
The unequal proportion of men and women in the older age groups is
clearly explained by the role of life expectancy at birth by sex During the
period 1975-1980 while life expectancy at birth for men was estimated to be
67 years on the average for women it was 71 years For the period 1980-1985
this indicator is estimated at 69 years for men and 73 years for women (see
Figure 4)
Information concerning the role of life expectancy and distribution
by age group is very useful for designing policies on which to execute pro
-17-
Table 7
POPUJATIC IN THE REPUBLIC BY SEX AND AGE GROUP
1980 CENSUS
NUMBER PERCENTAGE Age Groups (Years) Total Men Women Total Men Women
Total 1824796 925916 89890 1000 l000 1000
Under 15 years of age 713428 363279 350149 390 392 390
15 - 64 1O26865 520120 506745 563 562 564
65 and older 79927 40190 39757 44 43 44
Not declared 4576 2327 2249 03 03 02
Urban 899093 435241 463852 1000 i000 1CO0
Under 15 years of age 31426 158739 155647 350 365 336
15 - 64 540434 256694 283740 601 590 611
65 and older 41540 1B476 23064 46 42 50
Not delcared 2733 1332 1401 03 03 03
Rural 925703 490675 435028 1000 100 100O
Under 15 years of age 399042 204540 194502 431 417 448
15 - 64 486431 263426 223005 526 537 512
65 and older 38387 21714 16673 41 44 38
Not delcared 1843 995 848 02 02 02
Source Projections of Population for the Republic of Panama by sex and age group Bureau of Statistics and Census Controller General of the Republic
FIGURE 4
LIFE EXPECTANCY FOR THE PERIODS 1975-80 AND 1980-85 IN THE REPUBLIC
YEARS LIFE
EXPECTANCY
80
78
76 PROJECTION
74
72 7MEN
71
73
M
00
70 69
68 -
66- I 67
64shy
62- iid 60 LJ-- I -
Source 1975 i G80
Statistics and Census Bureau Interoovernmental Team DEC-MIPPE-IFARHU-Health
1985 YEARS - PERIOD
-19shy
grams geared to benefit the population in various areas An increase in life
expectancy will require a revision of the ages for retirement from economic
activity and for pension and retirement benefits Consideration should also be
given to programming geriatric and gerontological services and an answer must
be found to the housing problem which often afflicts this group
Given the demographic reality which Panama and other countries will have
to face in the medium and long terms the words of the Secretary General of
the World Aging Assembly Mr Williams K Kerrigon must be taken very much
into account There is no time to lose By the year 2000 people in the
over-60 age Froup will show the highest growth rate in most developed or
developing countries The economic well-being of society could be endangered
if the growing needs of this group and the potential human resources that
older people can offer to society are not taken into account
At the end of the 1970s clrse t) half of the population in the 60-andshy
over age group (54000 people) was not in the labor force was not retired
and was not receiving a pen3ion or prirate income This leads us to suppose
that they were dependent on other people for their economic subsistence This
situation affects women more than men in a ratio of 4 to 1 If to this we add
that most women in the age group have lost their husbands or companions it
seems logical to assume that they will have greater difficulties in obtaining
support According to the 1980 Census 70 of all women who stated they were
widows were over 60 Table 8 shows the ratio of men to women in the 60 and
over population with projections to the year 2000 It is claar that women
survive longer than men and in future years will make up an even larger share
of the aged dependent population
In effect the number of men and women in our society that reach the
age of 60 with pension rights is relatively low particularly women who have
-20shy
been less involved in remunerative employment where social security is proshy
vided Of every ten retired persons only three are women and only 14 of women
60 or older are retired pensioned or receiving private income
Based on the foregoing the guidelines emanating from the World
Assembly on Aging (August 1982) must be considered and some of the measures
contained in the International Action Plan approved at this Conference put
into practice The Plan notes that particular attention is given to the
special needs of this group for which looms the likelihood of an old age
aggravated by economic want loneliness and little or no probability of
remunerative employment
Table 8 MEN PER THOUSAND WOMEN IN THE 60 AND OVER POPULATION IN
THE REPUBLIC BY AGE GROUP
YEARS 1970 1980 1990 AND 200G1
Age (in years) 1970 1980 1990 2000
TOTAL 1025 1039 1004 955
60 - 64 1137 1092 1026 994
65 - 69 lO1l3 1086 1025 980
70 - 74 960 1061 1024 952
75 - 79 972 930 991 920
80 and older 924 869 870 856
l As of 1980 the population living in th3 Panama Canal Area is included
Source Population Projections by sex and age group Years 19qO-2025
Bureau of Statistics and Census Panamanian Statistic No 903 April 1983 Prepared by the Population Department of the Social Planning Division of the Ministry of Economic Planning and P-licy (MIPPE)
-21-
Although the latest census does not present information concerning
migration previous studies based on the 1970 census affirm that rural-urban
migrations are massive Most of them involve women Furthermore rural migrashy
tions towards urban centers aside from being primarily female are concenshy
trated in the 15-34 age group 604 and 614 of men and women migrate to the
city of Panama Also in the rural groups that migrate towards the smaller
cities of the country there is a higher proportion of women than men in the
15-34 age group 53 of all women who leave the countryside for these small
urban centers fall in this age range Among men only 42 are in the group
However among people over 35 female rural migrations abruptly decline while
those for the male sex show only a slight decline _ More recent information
on migratory movements towards the Metropolitan Region contained in a 1981
Socio-Econoinic Survey Z reveals that the predominantly female migratory trend
is carried over into the early part of the 1980s
Table 9 shows that the rate of emigration towards the principal
recipient region (the provinces of Panama and Colon which comprise the
Metropolitan Region) is greater for women than for men at the national level
as well as for all the other provinces in the country It can also be seen
that migrants are primarily young (10 to 19 years of age) and that the level
of migration declines with age
In general the mobility of the population in these age groups is
closely linked to the search for employment an objective which is not always
satisfied given the restrictions of the tight labor market in the recipient
region Furthermore women migrants for the most part are poorly qualified
1 Internal Migrations in Panama - Marco A Gandasegui Ministry of Health 1978
21Socio-Economic Survey of the Metropolitan Region MIPPE 1981
TABLE 9
RATE OF EMIGRATION (PER THOUSAND) TOWARDS THE METROPOLITAN REGION BY PROVINCE AND AGE GROUP
1976 - 1981
Sex and Age Total =sror iriqu Darien Herera Los Santos Veraguas
TOTAL 099 052 157 043 312 110 134 108
10 - 19 20 shy 29
30 -40 - 49 50 - 59 60 - +
193 074
053 030 056 015
149 -
----shy
170 106
073 010 043
070 048 024 018 015 019
470 -152 237 383 089 282
202 128 064 016 046 020
292 059 031
043
166 -
203 090 054 026 089
ME 080 050 110 030 253 090 142 087
10 - 19 20 29 30 39 40 - 49 50 - 59 60 shy +
146 062 052 039 046 012
153 --
-
- -
237 054 073 020 027 -
042 044 007 035
-
013
331 170 329 217 147 155
110 128 076 031 087 037
313 026 120 038 042
-
161 085 038 047 026
-
WOMEN 121 054 210 050 384 132 125 134
10 20 30 40 50 63
-19 - 29 - 39- - 49 fe- - 59 - + i
244 0879-054 021-067 018
146
-
-
-
461 162 072
-
62 -
100 052 041 -
033 027
618 130 113 609 -480
299 129 051
-
268 094 060 048 115
-
249 095 072
156
SOURCE Socio-Economic Survey of the Metropolitan Region MIPPEPopulation Department 1981
-23shy
which leads them by and large into the personal and domestic service sectors
Women in rural areas from time immemorial have performed double duty
as housewives and family farmworkers The attention that the rural woman gives
to this dual role implies devoting time and expending energy which in most
cases are not registered in the productive process By not assigning a value
to these activities womens opportunities for full participation (labor
social economic etc) are limited which encourages them to leave their
place of origin
In referring to the characteristics of the female population a
fundamental subject is the role of fertility a decisive component in the
dynamics of demography Earlier in this chapter it is mentioned that Panama is
in a process of demographic transition where a basic role is played by the
decline in fertility particularly as of the mid-1960s This phenomenon can be
attributed to various factors such as higher educational levels increased
participation in the labor market development of the urbanization process
and knowledge of and access to contraception
A document concerning recent fertility trends in Panama lists a series
of events mostly occuring in the second half of the 1960s which coincided
with the beginning of the decline in fertility in our society 1 Among them
was an expansion of and an emphasis on capital investment which require a
more sophisticated labor force Therefore efforts were made towards
professional training to develop skills and capabilities demanded by the new
production processes Efforts in the field of education particularly the
private sectors participation in these efforts also apparently contributed
1 See The Reduction of Fertility in Panama Hildebrando Araica Working Document MIPPE Panama February 1980
-24shy
to the decline Furthermore reference is made to the improvement of Social
Security and health recovery services in order to maximize the workers time
and improve hisher productivity and the profitability of investments The
same author adds that together with all the above conditions also favor
decision-making to adjust reproductive behavior particularly in urban popushy
lations and those more privileged as to education and income therefore the
objective of smaller families becomes widespread in these so7ial strata
It is worth noting that in Panama knowledge and use of contraceptive
methods has been greatly increasing The 1976 Fertility Survey showed that the
knowledge of these methods has apparently penetrated all layers of Panamanian
society The Survey revealed that 986 of all married women or women living
in consensual union know of the existence of some efficient contraceptive
method regardless of age or whether or not they had few children
Panamanian women at all social levels have access to the Ministry of
Healths Family Planning services through its Maternal Sub-Program which aims
to offer the couple the opportunity to have the number of children it desires
and diagnose and treat those infertile couples who want children
A recent document prepared on the basis of information Lontained in
the Maternal-Infant Health Program 1 shows that 146018 women entered the
program between 1970 and 1980 or 33 of all women in the fertile age group
(15-49) It also points out that a growing percentage of these entrants are
under 25
In 1979 a Survey on the Prevalence of Contraceptives was performed It
showed that two-thirds of all married women or women living in consensual
1 Demographic Aspects of the Population and the Family Department of Population - Division of Social Planning MIPPE March 1982
-25shy
union reported uAng some type of contraceptive In the urban area this ratio
was 71 while in the rural area it was 57
Among Panamanian women the generalized practice of sterilization as a
contraceptive method is noteworthy According to the above-mentioned survey
one out of every three women that accepted the use of some contraceptive
method stated that she had been sterilized with a strong increase noted in
recent years In 1970 sterilizations represented 14 of the methods employed
and 31 in 1980 1
Aside fom the Ministry of Health other agencies that offer family
planning services to the female population are the Social Security Board
(governmental) and the Panamanian Association for Family Planning (APLAFA)
which is a private scientific and social group that began its activities in
1965 and that has among its objectives the promotion of education and
reseirch on human reproduction of a psycho-medical-social nature
There can be no doubt as to the close correlation between the average
number of children per woman and a series of variables such as the conjugal
state the place of residence and the level of education
1 Survey on the Prevalence of Contraceptives Ministry of Health 1980
- 26 -
FIGURE 5
AVERAGE NUMBER OF CHILDREN PER WOMAN BY AREA OF RESIDENCE 1980
AVERAGE CHILDREN PER WOMAN
RURAL4_
NATIONAL 2
25 URBAN
2shy
_ _ _ _ _ _ _ _ _ deg _ _ _ I _ _
SOURCE Statistics and Census Bureau Intergovernmental Team - DECMIPPEIFARHUHEALTH - 1983
-27-
As seen in Figure 5 there is a marked influence of the urbanization
process with its characteristics inherent to modernization greater access to
different levels of education particuarly secondary and university level (see
Table 10 and Figure 6) more opportunities for incorporation into productive
activities and a larger social influence of communications on the
reproductive behavior of the population
Table 10 AVERAGE NUMBER OF CHILDREN PER WOMAN BY LEVEL OF EDUCATION
1980 CENSUS (1)
Level of Education Women 15 Years or Total Live Average Older Births Children Per
Woman
Total 495419 1581720 32
None 70808 386179 54
Some Primary 224403 870499 39
Some Secondary 160157 268458 17
Some University 37336 49101 13
Unknown 2755 7483 27
(1) 20 Sampling 1980 Population Census
Source Statisics and Census Bureau Prepared in the Population Department of the MIPPE
It is easier for a woman at a higher education level to have access to
knowledge concerning the various contraceptive methods It has also been
clearly proven that better training and education allow women to compete and
enter the labor market with greater advantages It is also a well-known fact
that there is a close connection between the length of stay in the educational
system and the delay in the age of matrimony particularly in the more
privileged social strata
FIGURE 6
AVERAGE NUMBER OF CHILDREN PER WOMAN BY LEVEL OF INSTRUCTION - 1980
AVERAGE NUMBEROF CHILDREN
6-Total Women 15 years of age and over 495419
54 Total live births 1581720
1581
4 39
AVERAGE TOTAL 32
2- 17
O- ~ 1 3 _ Ii
V LEVEL OFNO GRADE SOME PRIMARY SOME SECONDARY SOME UNIVERSITY INSTRUCTION
Source 20 Sampling of 1980 Population Census -SCB
Prepared by Population Dept Division of Social-PLanning - MIPPE
-29-
II EDUCATION
II
-30-
EDUCATION
A General Aspects
At the international level access to education is a basic right as
well as a fundamental factor which enhances social progress and reduces inshy
equalities between socio-economic groups and the sexes
Traditionally the Government of Panama has given particular priority
to education which has led to a continuous expansion of the system and conseshy
quently a yearly increment in educational facilities throughout the country
The Political Constitution of the Republic of Panama devotes an entire
chapter to Education Article 86 of the 1972 Political Constitution of the
Republic (revised) states that All citizens have the right to education and
the responsibility of being educated
During the 1970s the National Government channelled large amounts of
resources to the education sector which resulted in an increase in budgetary
allocations of 216 In 1970 the sectors allocation was 55 million and rose
to almost 175 million at the end of the period While the average cost per
student was B173 in 1970 it reached B326 in 1980 1
Also during the last decade efforts in the sector were aimed at proshy
viding education particularly to geographic areas and social strata previously
deprived of this attention This led to the expansion of the infrastructure
available to the education sector particularly in rural areas which pershy
mitted a massive incorporation of the rural population into the educational
process and which is demonstrated by a more rapid growth of enrollments in
the rural than in the urban area 2
1 A Decade of Social Development in Panama Social Planning MIPPE 1983 Bases for Panamas Economic and Social Development MIPPE (Working Document)
-31-
FIGURE 7
INCREASE OF SCHOOLS CLASSROOMS ENROLLMENT AND TEACHERS IN THE REPUBLIC SCHOOL YEARS 1970 AND 1980
AMOUNT PERSONNEL
17000 16523 680000
161000
6064
605673
6008000
121000 -44010
0
10000-520000
I1000 - m-- m 440000
- 00
9000- mmm -20
3 i 2800U
8 o7 i i
--
---- iii - m
mm~~m bull=degmm~~~~~ bull m degdego
24 97200005000 - C14-41000 810000 240000
000 24800010 0
- -- 1 9 8 0 t--d
SCHOOLS CLASSROOMS ENROLLMENT TEACHING STAFF
Source Statistics Department MINEDUC and Dept of Human Resources and Employment1970 EIIYof MIPFE190
19 oo8 0
-32-
An overview of the education sector at the beginning of the 1980s
shows considerable change over the previous decade During the period 1970-80
1185 new schools came into existence which represents a 50 increase as did
4635 new classrooms which represents a 40 growth and 10538 new teachers
were appointed which equals a 74 increase (see Figure 7)
The effort to provide a physical and human infrastructure at the
service of education allowed for a considerable increase in the number of pershy
sons benefiting from the educational system st itz various levels This can be
seen in the incorporation of 238430 new students which equals a 65 increase
in enrollments that is in 1980 the total number of students reached 605873
of which 89 were in the official educational system (see Table 11)
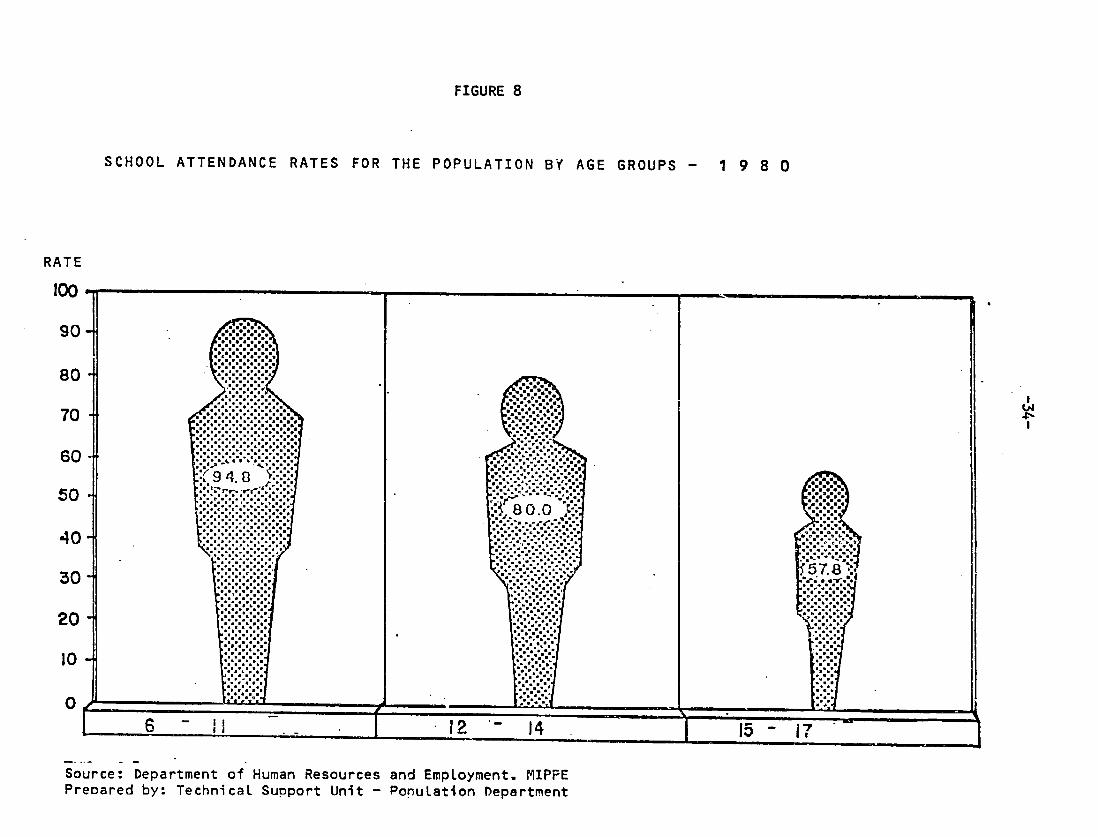
The increases noted for this period thus represent an important change
in enrollment rates particularly at the primary school level In 1970 789
of the population in the 6-11 age range attended primary school while in 1980
this figure had risen to 948 The percentage of 12-14 year olds who norshy
mally attend the first cycle of intermediate education rose from 751 to
800 while 15 to 17 year ols who attend secondary school or take teacher
training and professional and technical courses had an enrollment of 578 as
opposed to 433 at the beginning of the period - (see Figure 8)
Special relevance must be given to the accelerated growth in univershy
sity enrollments The University of Panama created in 1935 showed a modest
growth during its first three decades As of the mid-1960s and particularly
during the 1970s the first institute of higher learning in the country undershy
went a significant expansion at zhe Panama City campus as well as in the
University Centers created in other urban areas in the countrys interior
1 A Decade of Social Development Social Planning Division MIPPE 1983
-33-
TAEU I flIOEA IN St23LS cLAS2OaM EWi8LL)QMAND0A=G1 SEA IN Wl I8H IC
EY ISAL KID WMMt 0 W ATIGN3211 YEW 1970 AND1W52
Type Eofdcation level and Source Sdools
Claas-1
1970
Du -mmt
Teach-Ing
Staff Schcola Clae-
room
1980
Enroll-mt
Tea-ing
Staff Schowol
No
1ncroaae
Clasaomo No
Enrolwnt No
TeoddMn Staff
No
I=TA 23 It AM 367443 14159 3567 1652 605873 247 j83 4IA 4635 4E0 23B430 649 1053 74-4
Public Private
2064 318
10217 1671
320046 47397
12093 2066
3Z31 336
14712 1811
538424 67449
2189 208
1167 8
565 57
4495 X40
440 84
218378 20052
682 423
9736 82
805 388
C6tAIEIATION 1978 U517 342493 32960 2621 15 550M 643 325 3903 M9 2)756 606 96 743
Public Prit to
1775 10026 203 1491
30f6 41627
1113 1547
2429 iW
1395 1515
495230 54799
20035 2554
654 -1
368 -54
3879 24
387 16
194364 13172
646 316
8922 7
803 383
w1i1rd 1784 8916 255237 8714 22 U 9 337522 12261 29 3 2364 265 82235 _V 3647 418
Public Private
1719 65
8374 542
241616 13671
8322 392
2231 75
10592 688
316231 21291
U1700 661
512 10
298 154
2218 146
265 269
74615 7620
309 557
3o78 269
19 686
W192 242 7B259 3751 n6 3763 171M3 8138 11 5)j 1341 54 9304 118 4331 1166
PublIc Private
55 137
1487 935
5D909 27YO
23 1375
194 112
33) 763
142652 28621
6682 1456
139 2527 -25 -182
1513 -172
1017 -184
91743 1X2
1832 46
4=22 81
1805 59
HIM01UN ly~ 2 179 89$7 489 2 34 e 40369 1959 0 00 169 94A4 314M 3512 IM~ 750
Public Private
1 1
165 14
8341 606
409 a)
1 1
302 46
36C67 4302
1590 369
0 0
00 00
137 32
830 2286
27726 36
3324 6099
1181 289
743 3612
I41M 1141-0 - - _- - 7 29 835 131
Public Private
-
-
-
-
-- -
3 4
11 18
230 5D 58
63
M14POMAM1WI8i 4N 371 24950 1192 W1 11M 5584 2 1M 542 1342 32 1973 303 953 M278
Public Private
283 115
191 107
1910 5773
9303n[M 219 144
807 296
43194 12650
1794 314
513 29
1775 252
616 116
3225 644
24014 6AM
1252 1192
814 95
831 434
PR-P R 130 99 6921 218 3G5 6 19136 645 235 188 503 513-1 11215 1620 In IE2
Public Private
45 85
6 93
2933 38
84 14
234 131
78 229
11934 6W2
419 226
189 46
4320 541
372 136
62000 1462
91001 2214
369 555
335 92
3988 66
3ItIAL 12 129 1395 13 24 335 44N 362 12 1fl0 206 1597 2273 M2 1f81
Public Private
10 2
112 17
1234 151
123 12
23 1
331 4
4405 30
360 2 -1
13 0 -500
219 -13
1955 -765
3201 -121
2659 -80
257 -10
I7 -33
StU2-0f21 30 lfl 2754 117 22 132 10023 19B -8 -267 21 1__9 7269 2639 81 692
Public Private
5 25
41 70
1212 1542
49 68
11 11
69 63
3635 6 8
115 83
6 12 0 -14 -560
Z9 -7
683 -100
2423 4846
1999 3143
66 15
1347 181
L17AL) AUIZ~ 4111AT32 231 (a) IlmB7 -6BS 534 (a) M2918 f38 303 M12 89W 751 149 217
Public Private
2_9 3
(a)
11849 89
681 5
533 1
(a)
288 30
832 3
3D5 1338 -2 -667
9129 - 9
762 -663
151 -2
222 -400
IM2EM3ONAL Mlr 1 32 1982 43 1 29 22 pound0 - -3 -94 182 551_
Public 1 32 192 43 1 29 2342 6pound - -3 -94 360 182 25 581
(a)
UsedPrimry LAl Clzurozai Informtio rot anilable Not applicable I cluda Regiomal Univemrity Cmters Sairc Statistic lepar ment of MnLtty of F-hWcation ad D1poromno of Haran Reaaurces
and CaneA BurMu of the tinisty of PbAnnir and Exoaoic PoUc and opoycat of the Stntiatics
FIGURE 8
SCHOOL ATTENDANCE RATES FOR THE POPULATION BY AGE GROUPS - 1 9 8 0
RATE
100
90shy
80
70 60
oW
50-40
30shy
Klt808
00
20-I0 V
10 - X
6 fill 14 15 17
Source Department of Human Resources and Employment MIPPE Preoared by Technical Support Unit - Ponulation Department
-35shy
with the aim of offering opportunities for higher education to students intershy
ested in g~ing beyond the intermediate level
One of the National Governments objectives in strengthening the unishy
versity centers not just the one in Panama City is to contribute to preventshy
ing the transfer or migration of young people from other urban centers toward
the capital in the hope of expanding their horizons in higher education The
establishment and strengthening of other university centers also responds to a
desire to offer short or medium- erm careers that will allow the training of
technical-level professionals as demanded by the various development-related
activities throughout the country
Aside from the Central Governments efforts through substantial
allocations to the sector in the national budget another factor in thl
expansion of education in Panama has been Educational Security created by
Government Decree No 168 of July 27 1971 with the aim of promoting and
developing education at all levels to benefit all Panamanians particularly
the masses on the fringes of economic and social progress
Despite the efforts channelled towards the education sector and the
progress made illiteracy persists as a problem requiring special attention
Illiteracy and the lack of education and training in general are among the
negative elements that help maintain the vicious circle cf under-development
low levels of productivity and unfavorable health and welfare conditions
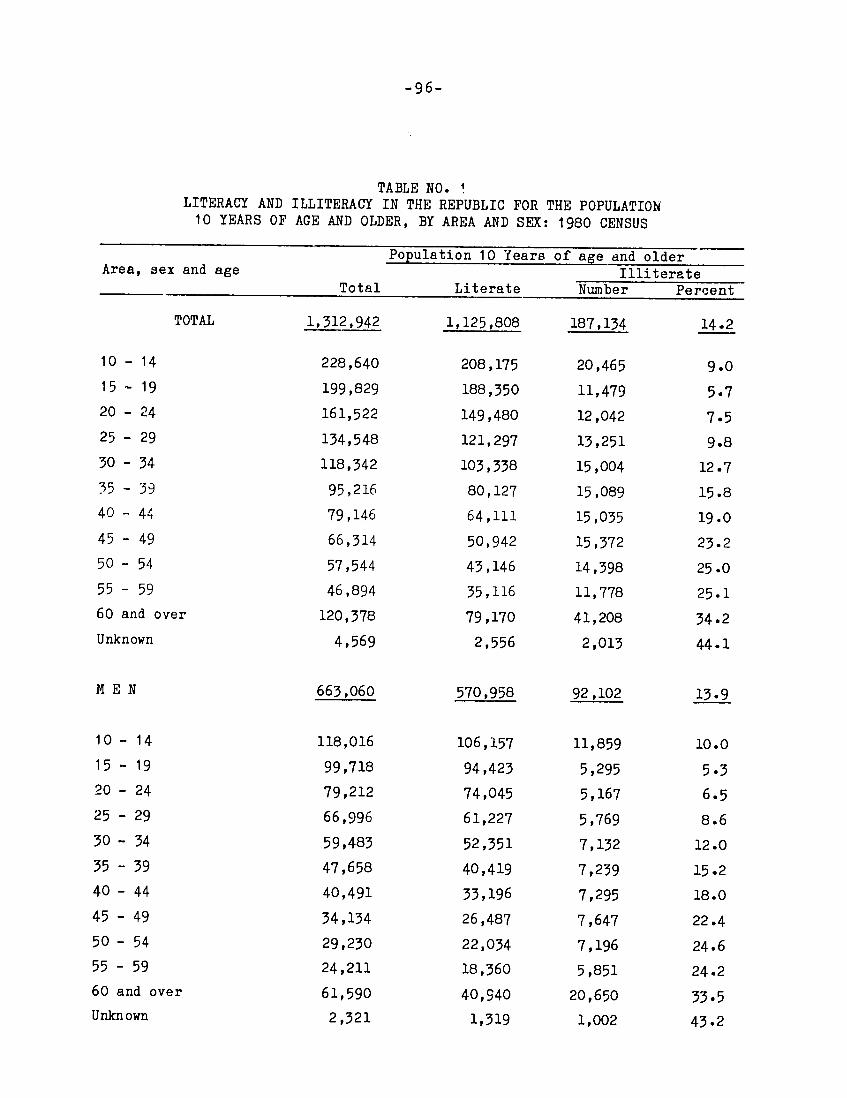
The 1970 Census showed that one-fifth of the population 10 years or
older was illiterate with the problem being more acute in rural areas 6 to 1
compared with urban areas The latest census shows that the problem affects
about 187134 persons which translates into 142 also concentrated in rural
areas
-36-
B Education in Panama and the Female Population
Transformations that occur throughout the world and at all levels
require the training of skilled people to respond to demands in the economic
political and social fields
As shown by the magnitude of government expenditures in the education
sector a primary objective of development in Panama has been to train the
population as an effective means of achieving the real participation of men
and women in development plans and projects
A very positive situation is the marked effort on the part of women
to succeed at the various educational levels and at the higher levels (technishy
cal and professional) in the last two decades
A highly favorable factor in Panamas social development is that
there is no discrimination against the integration of women into the various
education levels This har permitted the Panamanian woman to represent half
the total national student enrollment in 1980 including all levels of
education These indicators are most encouraging as to the perspectives for
women and their incorporation into the many activities related to national
development
In referring to the progress and achievements of the Panamanian woman
in recent years therefore access to education must be stressed as one of the
most positive aspects In effect educational facilities have been a determinshy
ing factor in the promotion and participation of women in an increasingly
dynamic way in the various activities that foster national development
Furthermore a very positive attitude is noted in both the female and
male population with regard to the value given to education as an instrument
of self-fulfillment
-37-
In an Opinion Survey performed in Panama during the International
Year of the Woman -L close to 80 of men and women agreed that women should
have the same education as men Wnen asked if women were interested in professhy
sional advancement 91 answered in the affirmative
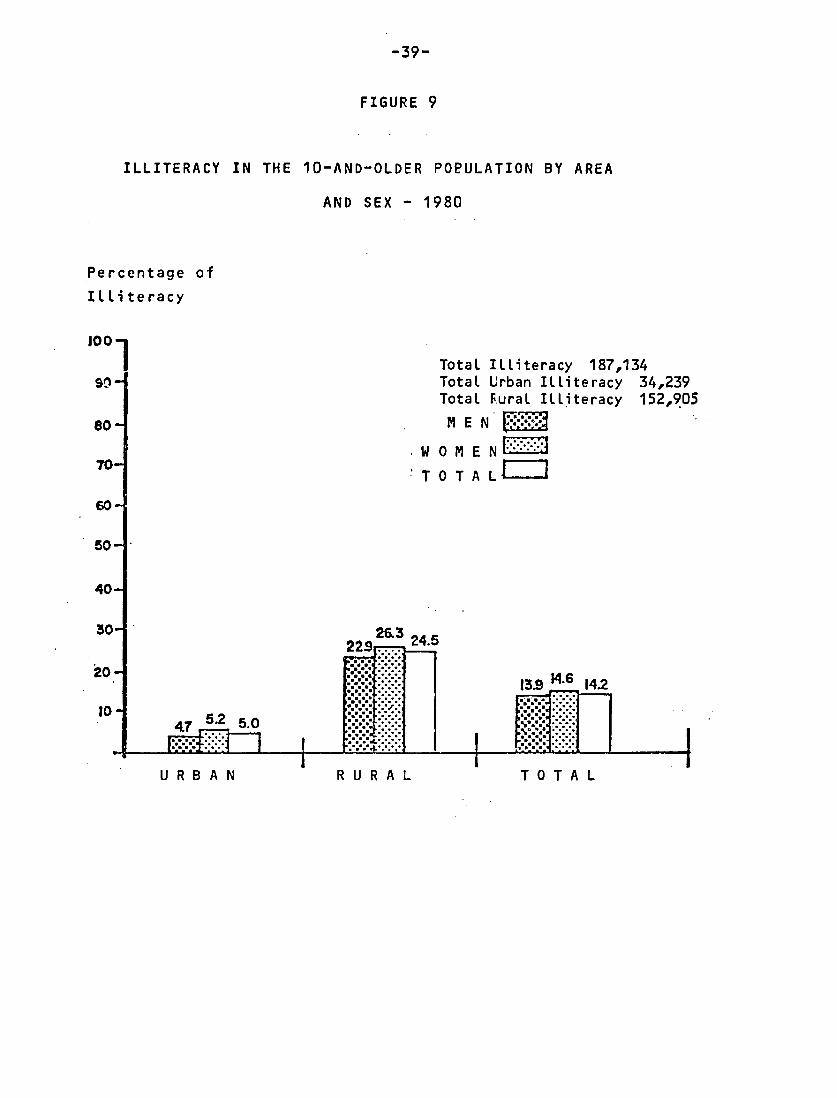
Literacy and Illiteracy
The priority that the Government of Panama has given to education has
had positive effects on the increase of literacy in Panama However according
to the latest census 14 out of every 100 Panamanians 10 years or older were
classified as illiterate
Table 12 shows that at the national level there are practically no
differences between men and women in illiteracy (139 and 146 respectiveshy
ly) If the situation is compared at the urban and rural levels the differshy
ences are also minor However illiteracy is considerably higher for both men
and women in rural areas than in urban areas as illustrated in Figure 9
One aspect that must be underlined as positive is that based or the
information contained in the 1980 Census there is a better outlook for reducshy
ing illiteracy in the future since an analysis of rates by age group shows
that illiteracy is celatively low in the younger population while the rates
are higher in the older groups This shows the effort that has been made to
extend educational services throughout the country in the last few decades
1 Opinion Survey on the Panamanian Woman Statistics and Census Bureau Controller General of the Republic 1975
2 See Statistical Annex Table No 1
-38-
Table 12
LITERACY AND ILLITERACY IN THE POPULATION 10 YEARS AND OLDER IN THE REPUBLIC BY AREA AND SEX 1980 CENSUS
Population 10 years old and older Area Sex Illiterate and Age Total Literate No
Total 1312942 1125808 187134 142
Men 663060 570958 92102 139
Women 649882 554850 95032 146
URBAN 688440 654211 34229 50
Men 328818 313385 15433 47
Women 359622 340826 18796 52
RURAL 624502 471597 152905 245
Men 334242 257573 76669 229
Women 290260 214024 76236 263
Source Tabulations of the National Population and Housing Census 20 Samplshy
ing Statistics and Census Bureau Controller General of the Republic
Participation in Enrollment
Table 13 (which refers to enrollment in the Republic in July 1980)
shows that in Panama there is a tendency which is becoming more common in
many Latin American countries towards an increase in the participation of
women at all levels of education
At the secondary school level (first and second cycles the latter
including high-school and normal training) female enrollment represents 521
of the total At the professional and technical level it is 544 while at the
higher level (university and non-university) it is 548
The above reveals that the Panamanian woman is increasingly aware
that educational advancement acts as a very positive instrument towards her
ILLITERACY IN
Percentage of
ILliteracy
I00 1
91 shy
80-
70-TOTALt
60
50
40
30
20
I0 475250
URBAN
-39-
FIGURE 9
THE 10-AND-OLDER POPULATION BY AREA
AND SEX - 1980
Total Illiteracy 187134 Total Urban Illiteracy 34239 Total Fural Illiteracy 152905
MEN j W 0 M E N
263 245 229 21__
139 46 142
RURAL TOTAL
-40-
Table 13 ENROLLMENT IN THE REPUBLIC BY SEX LEVEL AND SOURCE OF EDUCATION
AT JULY 31 1980
Enrollment Level of Education Total Men Women
TOTAL 582263 291639 290984 Pre-Primary 18136 9073 9063 Primary 337522 175012 162510
Intermediate 171273 81945 89238
Secondary 00-0 131480 63780 67700
First Cycle 97682 47714 49968 Second Cycle 33798 16066 17732
Senior High School 32814 15745 17069
Teacher Training 984 321 663 Professional and Technical 39793 18165 21628
Basic First Cycle 105 60 45
First Cycle- 9268 4532 4736 Agriculture 115 93 22
Cosmetology 737 1 730
Commercial 3084 594 2490
Industrial 3665 3646 19 Home Economics and Tailoring 1597 169 1428
Telegraphy 50 15 35
Theology 20 14 6
Second Cycle 30420 13573 16847
Agriculture 1374 1091 283
Commercial 20035 4552 15483
Industrial 8577 7930 647 Home Economics and Tailoring 434 - 434
Higher Education 41234 18621 22613
University2 40369 18215 22154
Non-University 865 406 459 Special 4435 2562 1873
Supplementary 10023 4426 5597
l Refers to professional and technical courses for which First Cycle is not a pre-requisite
2 Refers to the first semester of the academic yea includes Regional Centers
Source Department of Statistics Ministry of Education
-41shy
incorporation into the countrys economic activity which doubtless improves
her chances for social mobility in general
Looking at the distribution of women across educational levels
(Figure 10) the data show that women are distributed nearly the same as men
27 of all women age six and over have some secondary education compared with
25 of men At the university level 55 of women and 56 of men have
reached this level
In referring to womans participation at the various educational
levels the active role that the Panamanian woman has assumed in recent
decades in the higher education process should be underlined since this situshy
ation affords women increasing access to high technical political and adminshy
istrative positions in the countrys public life which in turn will allow
them to obtain greater benefits for the female population as a whole
It is evident that with the opening of Panama University in 1935
ample opportunities became available for women to reach professional levels
However during the early years the participation of women in the careers
offered at our first institute of higher learning was very modest
It is only in the 1960s that a greater interest is shown by Panamashy
nian women in entering the university a situation highlighted by university
statistics Throughout most of the 1970s the annual percentage increase in
enrollment was greater for female students In 1960 they represented 38 of
enrollment in the University of Panama while in 1980 they represented 54
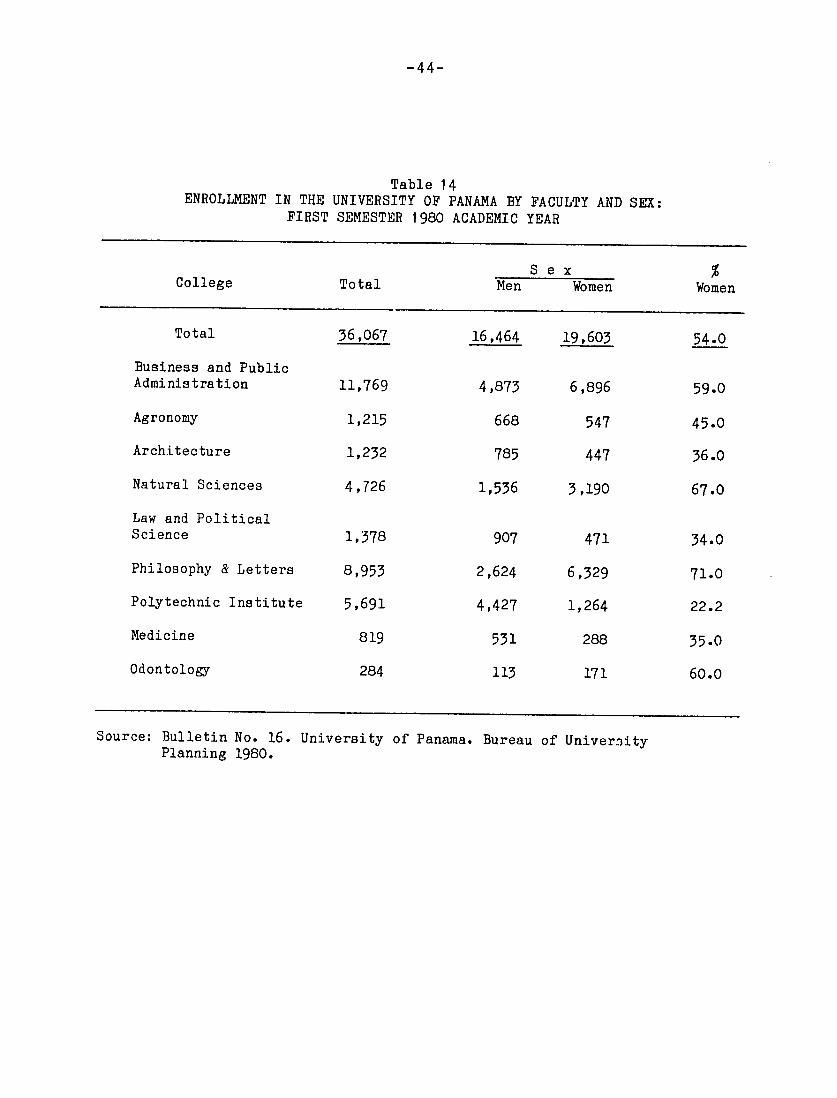
In reviewing university statistics in Table 14 and Figure 11 it can
be seen thit the female student body shows an inclination towards certain
careers mainly in the fields of Philosophy Letters and Education the Natushy
ral Science Odontology and Public Administration (in all these colleges they
represented more than half the enrollment as shown graphically in Figure 12)
-42-
It is important to note that in the last decade a growing interest in
entering other careers that had been previously considered for men only such
as engineering and architecture is observed The creation of the Polytechnic
Institute at the university level offers a variety of fields of specialization
in technical areas which have been well received by the female student body
In 1975 only one out of every 10 students enrolled in the Polytechnic
Institute was a woman while five years later women represented 222
Level of Instruction
In making an overall assessment of the countrys educational situashy
tion and of women in general we confirm the almost equal status of both
sexes with a slightly more favorable situation for women As the following
table shows the average number of years completed by the general population 6
years or older was 56 while that of the female population was 57 If we
examine the detail by level of instruction as well as by age group (See Table
2 in the Statistical Annex) no noticeable difference can be identified so we
can expect a situation of equality in the future which will greatly enhance
the increasingly effective incorporation of women into the national developshy
ment process
FIGURE 10
PERCENTAGE
60NO60shy
50
LEVEL OF INSTRUCTION OF THE POPULATION 6 YEARS OLD AND OVER BY SEX 1980 CENSUS
NE P R IMA RY SE CO N DA
M E N W543 OE 517I0 III
RY I
III
N
-
3
ee
MEN WOMEN
I I IIIIIIO
10
142
oC-
149 I
e bull
MEN
WOMEN
Source Division of Social PLanning -Dept of Human Resources and Employment -MIPPE
-44-
Table 14 ENROLLMENT IN THE UNIVERSITY OF PANAMA BY FACULTY AND SEX
FIRST SEMESTER 1980 ACADEMIC YEAR
Sex College Total Men Women Women
Total 36067 16464 19603 540
Business and Public
Administration 11769 4873 6896 590
Agronomy 1215 668 547 450
Architecture 1232 785 447 360
Natural Sciences 4726 1536 3190 670
Law and Political Science 1378 907 471 340
Philosophy amp Letters 8953 2624 6329 710
Polytechnic Institute 5691 4427 1264 222
Medicine 819 531 288 350
Odontology 284 113 171 600
Source Bulletin No 16 University of Panama Bureau of UniversityPlanning 1980
FIGURE 11 -
UNIVERSITY ENROLLMENT BY FACULTY AND SEX - 1980
ENROLLMENT M E N
710-0 W 0 M E N l iiiii
6000- ME
4i75000- 4873
Il
4000 - xo
3QOO 3990 624 deg933
00
14
1000 - 6
4T
Business amp Agronomy Architecture Natural Law amp Poll- Philosophy Polytechnic Medicine Public Sciences Politicalamp Institute Odcntology
Administration Science Letters SOURCE UNIVERSITY STATISTICS - National University of Panama - Planning Bureau 1980
Prepared by TechnicaL-Support Unit - Population Dept- Division of Social Planning - MIPPE
-46-
F I G U R E 12
DISTRIBUTION OF THE FEMALE UNIVERSITY POPULATION BY
1980
FACULTY
Percentage
100
90
80
706 770 670
0 50 60-0
50 -450
40X
30
x360 340 35
20
10
timesCftimes L 4o
0 xxD XXmu mu ra22a
- X -D Ca U)Cf 0 0 ~ 4 a) 0
V) E E a 4)a 0a (cA U C -j0 40M cLA 44-0(uC -L C oa-c0 a J r- U4-l 0 3 v a -XJ4 X 4 CfLn L 4- r 3 r- -t- 4- -- p1 -0 0
xxxl MJCX) 0 0) MXX
Source STATISTICS University of Panama Planning Bureau 1980 Pren~ar-et-b TechnicaL SUDDort Unit- Pntilatinn nnrfnf MTPPP
-47-
Based on the previous analysis and as a conclusion to this chapter it can
be noted that during the present decade and based on the current situation
the education sector will remain among the higher priorities in terms of
resources with a continuation of the approach set forth in the 1976-80
Development Plan of considering all efforts in education ss investments in
human capital This is based on the fact that the most productive sectors of
the economy are those that demand a greater number of professionals technishy
cians and skilled workers and also that the more qualified persons will have
greater possibilities of obtaining better-paid jobs and fewer riskszof losing
the jobs they have
Therefore by providing better training to the population it will be
possible to reduce disparities in income and wealth distribution in Panamanian
society which will make possible even greater economic growth within a frameshy
work of equity and social justice
TAME 15 POFUJATION 6 YEARS AND OLDER IN THE REPJBLJC Hf LBEL OF INSTRUCTION
SEX AND AGE 490 CESUS
Population 6 Years of age and OlderSex and Age Group Level of Instruction (Completed Years of Study)
Total None Primary Secondary University Not De- Average Years Total Complete Total Complete clared Declared
Total 1507523 219195 798687 304047 390234 56100742 83729 15678
Percentage 1000 145 530 202 259 67 56 10
Men 761]28 107917 412934 156021 18936 46238 42137 8614 56
Percentage 1000 142 543 205 248 61 56 11
Wmen 746335 11 278 385753 148026 201295 54504 40942 7064 57
Percentage 1000 149 517 198 270 73 55 09
Source Tabulations of the National Population and Housing Census 20 Sampling Burean of Statistics and Census - Controller General of the Republic
0
-49-
III THE PARTICIPATION OF W0MEN IN ECONOMIC LIFE
-50-
III THE PARTICIPATION OF WOMEN IN ECONOMIC LIFE
A General Aspects
The degree of participation of men and women in economic life has hisshy
torically been different and determined basically by the role that society
traditionally imposed on persons of each sex There are few labor-related
realities that more closely link the world of labor with the structure of
society than do womens employment and work situations In effect it is
impossible to explain the factors that influence womens participation the
socio-econornic characteristics of working women and the conditions under whicn
they work without referring back to cultural values the organization of the
economy and of society and the general functions of the sexes in everyday
life 1
In analyzing womens participation in the countrys economic life there
is recognition of its close relationship to a series of global situations that
affect it among them the very organization of the national economy and the
value systems that prevail in society
Profound changes have taken place in Latin American societies over the
last three decades which have affected the nature as well as the intershy
relationships of the classes and groups that compose them Among the factors
that have contributed to these changes are the accelerated urbanization
process the integration of a value system common to the population the
creation of conditions for social interaction participation and mobility the
exposure of various layers of society to consumer patterns and the demand for
goods and services
I Female Labor Participation and Differences in Remuneration by sex in Latin America PREAL ILO
-51-
Furthermore the role of the State by expanding the services offered to
the population has had favorable consequences on the redistribution of beneshy
fits through social policies thus permitting greater access to educational
sanitary and social welfare services
As of the 1950s we observe the most rapid transformation of the populashy
tions educational and cultural conditions ever known while centuries-old
barriers such as illiteracy and elitist groupings such as the university were
being torn down I
Given the social sructire that has traditionally prevailed in Latin
America we can state that women who generally lagged behind men in the slow
process of change that had taken place until that time were able to benefit
in large measure from the changes noted
In todays world with slight variations by country women play a vital
role in agricultural as well as non-agricultural activities There is virtual
international acceptance of the principle that an integral development based
on egalitarian growth requires the effective integration of women it requires
their having access to land water and natural resources as well as to equal
opportunities for developing and employing their full capacity
Just like women thioughout the world Panamanian women have gradually
changed their way of thinking as to what their level of participation should
be in the various activites of everyday life within and outside the home
There is still a long way to go however before we can affirm that in the
home life of their communities men and women play similar roles and share
responsibilities fairly and in a real and effective manner
1 See- Three Decades of Social Change in Latin America ECLA 1963
-52-
It is somewhat difficult to assess the role that women play in developshy
ment at all levels because of the different concepts that men and women have
concerning the role that women must fulfil There is still a widespread notion
in many societies including Panamanian society that when a woman reaches
adulthood she should become a housewife and devote herself particularly to
the care of her children
B The Panamanian Woman in the Economically Active Population
During the first decades of this century the activity of the Panamanian
woman as that of women in most of Latin America was limited by cultural
traditional educational and religious factors to household chores her work
was restricted almost exclusively to being companion to the man of the house
and to taking care of the children born in the home
After the 1930s however women began to be trained in certain professhy
sions such as lawyers and nurses which tended to ease their incorporation into
the labor market
Later with the demand for services generated by the Second World War
new opportunities arose for incorporation into the economically active populashy
tion (cooks washerwomen waitresses salesgirls etc) More recently with
the expansion of the tertiary sector particularly in the Metropolitan Region
greater options have opened up to the female population for remunerative
activities outside the home
It is evident that a multitude of reasons explain the progressive incorshy
poration of women into the various fields of economic activity While it is
true that an increasingly important group enters the labor force because of a
desire to advance technically or professionally or to acquire economic indeshy
pendence another very significant portion of women who enter the job market
does so in response to economic pressures either because their husbands
-53shy
income is insufficient or because they are the head of the household (in 21
of Panamanian homes the woman is the main source of support for the family as
a single mother abandoned separated divorced or widowed) In the 1975
Opinion Survey on Women of the total number of working women interviewed
47 were married of this group 80 said they worked for economic reasons
(including financial need economic independence and responsibility)
Furthermore it should also be recognized that there was a change in
attitude towards women working outside the home The above survey shows that
23 of the men interviewed and almost 45 of the women reported that they
thought it was proper for women to work outside the home And most of the pershy
sons interviewed of both sexes agreed that the need to share economic resshy
ponsibility wa the most important reason
Three out of every five men and women also accepted the concept that men
as well as women should work and jointly satisfy the demands of the home
Another factor that may have bearing on the incorporation of the Panamanian
woman into the labor force is the legal protection offered to the working
woman The Third Chapter of Panamas 1972 Political Constitution refers to
work and contains various articles that directly prohibit wage discrimination
for reasons of sex and also protect the working womans right to bear childshy
ren 1 The Labor Code further contains a series of provisions that stipulate
that such protection is a responsibility of the State 3
Panamas Social Welfare Program offers ample guarantees to the insured
woman She has a series of rights under the maternity provisionsThe rights
1 Statistics and Census Bureau 1975 Performed as part of the International Year of the Woman
2 See Annex 1 Legal Dispositions that favor women in part 1a 3 See Annex b Articles 105 to 116 of the Labor Code
-54shy
of women insured against this risk come into force at the beginning of pregshy
nancy and continue through birth and the post-natal period The insured woman
also has the right to 14 weeks of paid leave by Social Welfare which means
that she receives payments in lieu of her monthly salary payments to which
she has a right because of her maternity leave and because of previous contrishy
butions to the system
The above helps to explain the increase seen in the number of women in
the countrys economically active population particularly in the last two
decades The overall participation rates for Panamanian women - 246 - are
among the highest in Latin America and the Caribbean (see disaggregation by
age groups in Table No 3 of Statistical Annex) surpassed only by Jamaica and
Trinidad and Tobago Y According to the 1980 population census (see Table
16) 152145 women were economically active making the total labor force 28
female and 72 male
It is important to note the marked difference between areas of the
total women incorporated into the economically active population almost 4 out
of every 5 were concentrated in the urban area This situation is partly
explained by the fact that educational and skill levels are generally higher
for women in urban areas (see details in Table No 4 of the Statistical
Annex) Also the most important factor is precisely the countrys economic
structure and development with a marked concentration of principal activities
in urban areas where the greatest employment opportunities appear
1 Labor Market in Figures 1950-1980 PREALC 1982
-55-
TABLE 16 ECONOMICALLY ACTIVE POPULATION 10 YEARS OR OLDER BY AREA AND SEX
1980 POPULATION AND HOUSING CENSUS
AREA Sex Total Urban Rural
Number Number Number
Total Economicshy
ally Active 548460 1000 314905 1000 233555 1000
1000 574 426
Men 396315 723 194885 619 201430 862
1000 492 508
Women 152145 277 120020 381 32125 138
1000 789 211
Source Tabulations of the National Population and Housing Census 20 Sampling
Note Figures subject to change
Opportunities for rural women are essentially limited to farming and
livestock activities which in countries like ours are still characterized by
conditions which range from having limited access to property (a high percentshy
age of farms are smallholdings) to employing various levels of technology The
experience of many countries with characteristics similar to those of Panama
shows that the mechanization of agricultural tasks has negatively affected the
size of the female population however in general terms modernization tends
to put both sexes out of work
Other activities that could use female labor are commerce and handicraft
activities but these have not evolved very much in rural areas It must be
noted that most farming and livestock activities produce only for the familys
own consumption
-56-
The Farming and Livestock Census of May 1981 showed that most cultivated
areas are very small in size (about 75 were less than 05 hectares) which
would explain why production is mostly for self-supply There is a close
relationship between farm size and landholding patterns and the generation of
employment in rural areas As can be seen the rural population generally
lives under certain constraints and women are at a disadvantage compared to
men as far as access to land production resources income etc
As in most countries the growth of urbanization in Panama tends to
reduce the number who are economically active in rural areas while there is
growth of this group in urban areas particularly in services commerce and
to a lesser degree industry During the last thirty years a growing portion
of the economically active population in the urban sector concentrated on lowshy
production activities a situation which is closely related to the flow of
people from the rural area towards the cities these people generally have low
levels of education and economic means
1 The Employed Woman
The May 1980 census showed 503540 employed people in Panama of which
134080 were women representing 266 of all employed persons (see Table 17)
Observe the differences in levels of employment by area as shown in Figure
13 about 4 of every 5 employed women work in the urban area
As to age women enter the labor force somewhat earlier than men While
41 of men under 30 were reported to be working this ratio is 50 for women
(see Table No 3 in the Annex)
-57-
TABLE 17 EMPLOYED POPULATION 10 YEARS OR OLDER BY AREA AND SEX
1980 POPULATION AND HOUSING CENSUS
Total Urban Rural Number Number Number
Employed Populashy
tion 503540 1000 284020 1000 219520 1000
1000 564 436
Men 369460 734 177925 626 191535 872
1000 482 518
Women 134080 266 106095 374 27985 128
1000 791 209
Source Tabulations of the National Population and Housing Census 20 Sample Note Figures subject to change
On the other hand when we examine total female employment by age group we
conclude that it begins to rise as of the 15-19 group Its peak is reached
between 20 and 24 (20 of employed women are in this bracket) The next range
from 25 to 29 takes up 18 of all employed women Thereafter the level of
participation in employment progressively declines and then drops sharply at
the 55-and-over group which coincides with the retirement age for women (age
55 although in accordance with Panamas Social Security legislation they can
take early retirement at 50)
There are no significant variations in employed female participation at
the urban and rural levels In both regions the age groups that show the
highest percentage of employment are the 20-24 and 25-29 brackets
The higher participation of women in the employed population for the
groups noted is partly explained by the fact that when women reach these ages
4
FIGURE 13
EMPLOYED POPULATION BY SEX AND AREA - 1980 CENSUS
EmDloved Population
200000shy19|535
3oo d eOgooee
1 1I1-TOTAL 503540 150000 MenM EW 0 36904601o4
I OOOOee e OOeO
ee g
eoee~e 150 00000 Se
oeeeoeel oeeoe
e Ce1 g- oeoeo4 eoo so
1779254
oeeoe OeOeee5ge 00000 oeoog geeo
cbull S bull egO c OOOeso s 1 10-- -6-0--9 5 bull o TOTA 50054 bull bull ge
100000 bull1 [1 e g_ 1 1S 2 oeoeo
e1g bullcent-ebullg
bulle gebull com~ eoeeol
oe oes eooebull ibull bullbullbulleo
ooo~o~e egoooo
meo seoeo ---- e eeoooee
emceee U Re6Ae oR RA c- -shymeeo
eeee ee ee bullbullee 11
oeebullegeoe
eeeeo mOg
ee OmObull
sc es - me c |-0oe bull-
URBAN RURAL
SOURCE 20 Sampling Tabulations of 1980 Census - Population Dept MIPPE
-59shy
they have left the formal educational system on the other hand it is at
these ages that men as well as women need a fixed income to meet the needs of
families just being formed
A factor that greatly influences employment opportunities for men and
women is the level of instruction If we examine statistics for the population
10 years or older by type of activity and level of instruction (see Table No
4 of the Annex) and take as a reference point the total number of employed
women we see that employment rises in direct proportion to the level of edushy
cation Women with no education represent only 3 of total women employed and
there is a great difference as to the participation of women having partial or
complete primary education (12 and 23 respectively) The women who particishy
patp most in employment are those having partial or complete secondary educashy
tion Women at these level- of education represent 42 of total women emshy
ployed Furthermore women with university training hold nearly 20 of all
jobs for women To understand this situation it must be appreciated that the
average level of education for both men and women in the country is about 56
years of primary school This means that most of the jobs for women are going
to those who have education levels well above the national average
2 Unemployment and Women
Unemployment is one of the social problems that most affects the populashy
tion due to its close linkage with family income and consequently its impact
on limiting the populationss ability to satisfy its basic needs
Traditionally unemployment rates in Panama have been much higher among
women than among men During the 1970s a series of fluctuations occurred with
respect to employment generation a situation intimately tied to the countrys
economic outlook During this period some 13000 jobs were created each year
wilich was not enough to absorb unemployment nor to meet the job demand caused
-60shy
by those people entering the economically active population for the first
time Thus there was an increase in unemployment from about 7 when the decade
began to 9 at its end
The most serious rates of unemployment were towards the end of 1977 and
early 1978 In response to the problem especially in the countrys
Metropolitan Region the National Government created the Emergency Plan which
offered employment at a monthly wage of 100 balboas to some 25000 people of
which 70 were women Of every 10 persons hired under this Plan 9 lived in
the cities of Panama and Colon (the countrys major urban areas)
Given the situation that arose when the Emergency Plan was created it
must be noted that the large number of persons that took advantage of the Plan
and the high percentage of housewives revealed the existence not only of an
unemployment problem but also of a large contingent of people who while
having some family income had to seek additional work through the program
because their income was so minimal
An analysis of the work or tasks performed before entering the plan
shows the low level of education of those benefiting from the Plan It was
also seen that a high proportion of women had only performed work related to
services including domestic service (49) before entering the Plan and 28
had not worked at all and considered themselves housewives I_
Unemployment in Panama primarily affects men and young women while it
is comparatively low among older people who constitute the main labor force
and are for the most part heads of households This confirms the theory that
heads of households tend to remain unemployed for less time than other
segments of the work force as the main providers of income in the home they
I A Policy of Employment through the Emergency Plan MIPPEMITRAB 1978
-61shy
must find work of some kind since they cannot afford the luxury of having no
income for daily sustenance
As seen in Table 18 the May 1980 Census showed 44920 unemployed people
which translates into 82 open unemployment The problem shows differences by
area (see Figure 14) also affects men very differently from women who are in
a much worse situation Table No 4 of the Annex shows male unemployment at
68 while female unemployment was 119
Unemployment is concentrated in the countrys urban areas where 7 out of
every 10 unemployed persons live If we disaggregate female unemployment by
area we note that more than 75 of unemployed women lived in urban areas exshy
plained by the slow growth of the economy particularly in the last decade
which prevented the creation of sufficient jobs to meet the growing demand for
employment in urban areas
TABLE 18 UNEMPLOYMENT BY SEX AND AREA
1980 POPULATION AND HOUSING CENSUS
Total Urban Rural Number Number Number
Total Unemployed
Population 44920 1000 30885 1000 14035 1000
1000 688 312
Men 26855 598 16960 549 9895 705
1000 632 368
Women 18065 402 13925 451 4140 295
1000 771 229
Source Tabulations of the National Population and Housing Census 20 Sampling
Note Figureu subject to change
-62-
FIGURE 14
UNEMPLOYMENT RATES BY SEX AND AREA - 1980 CENSUS
RATERATE UNEMPLOYED
129 POPULATION 44920130
TOTAL120 oo-M E N -shy
110 W 0 M EN ijI10O0 9-8 i
90 87
80
700
50
40
20 f
20~
0
U R BAN RU R AL
SOURCE 20 SampLing 1980 Census TabuLations SCB and Population Dept
MIPPE
-63-
Unemployment also varies by age As noted young people of both sexes
are the most affected by unemployment in our society At the time of the
census just over half of the unemployed - 53 - were under 25 (see Annex
Table No 3) There is also an important group of new workers among the
unemployed who could not find jobs due to the limited opportunities in the
Panamanian labor market
C Female Participation by Field of Activity
In explaining the distribution of employment by fields of economic
activity the countrys economic structure must be taken into account For
statistical purposes census information classifies the employed population
into ten fields of economic activity As an underdeveloped country Panama
still maintains a high percentage of its total employed population in agrishy
culture hunting fishing and forestry although the labor force in these
activities has gradually declined In the early 1970s about 37 of employed
persons were in this sector dropping to 29 in the 1980 census Towards the
end of the 1970s and early 1980s the farming and livestock sector contracted
showing negative growth rates Contributing to this were a reduction in the
harvested area for some traditional crops without concurrent increases in proshy
ductivity as well as a deterioration of production in traditional areas -
Furthermore the problem of seasonality in the agricultural sector is also
related to under-development and to the economic insecurity of people who work
in the basic production activity of the rural sector
The fields of activity which occupy second and third place in conshy
centration of the employed population are Communal Services (social and
personal services) and Retail and Wholesale Trade including restaurants and
1 Bases for Panamas Economic and Social Development Working Document MIPPE December 1980
-64shy
hotels The grow4alg importance of these activities is closely linked to the
countrys historical economic development in turn related to the traditional
role of the Interocean Transit Zone which has favored the development of
services and commercial activities
Marked differences can be discerned in the distribution by sex of the
employed population (See Table 19) while 376 of employed males were in
agriculture hunting forestry and fishing only 43 of females were involved
in this field Certain reservations must be applied to this indicator since
there generally is under-reportin_ of female participation ia these activishy
ties
For the most part the situation arises for people who receive no remuneshy
ration and only devote part of their time to a given economic activity and
those not covered by a legal or at least a formal relationship with other
members of the economic enterprise This usually occurs in the categories of
household workers (tbose who do not receive a salary for their work in the
usual sense) and self-employed workers It is more frequent in the case of
women who often devote only part of their time to economic activities and who
perhaps consider other activities as more important The most common example
are precisely women in traditional agriculture where there is no distinction
between household chores and those on the farm
As in many other societies women in Panama play a fundamental role in
all activities related to family production and domestic work in general The
rural Panamanian woman works hard from sunrise to sunset She starts early to
collect water cook food wash tend the children and the farm animals and
help the man of the house with sowing and harvesting activities If we were to
ask a farmer if his wife works a frequent answer would surely be that she
Type of Activity
T 0 T A L
Farming hunting forestry andfishing
Exploitation of mines and quarries
Manufacturing Industries
Electricity gas and water
Construction
holesale and retail trade andrestaurants and hotels
Transport storage andcamnications
Financial establishments insurancereal estate and support services
Ccmnal social and personalservices
Canal operation and defense
Unknown
TABLE 19EMLYED POULATIC 10 YEARS AND OLDER EL TE OF ALTIVITY
ACCORDING TO SX 1990 CENSUS
Total MenNumber Percentage Number Percentage
503540 1000 369460 I100
144590 287 133870 376
965 02 80 02
52720 105 41235 112
7965 16 6645 18
29825 59 28430 77
67920 135 44130 119
28840 57 23695 64
19290 38 11695 32
128815 256 55700 151
16390 33 13330 36
6230 12 4840 13
Wn Number
134C8)
5720
75
11485
1320
1395
23790
5145
7595
73115
3050
1390
Percentage
1000
43
01
86
10 a
10
177
38
57
545
23
10
Source Tabulations of the National Population and Housing Census - 20 Sampling available at the Population Department MPPE
Note Figures subject to change
-66shy
doesnt since she receives no pay for the myriad of chores she performs From
this we can surmise that in Panama as in many other countries there is a
tendency to assign a marginal function to womens contribution to agricultural
production and not recognize it thus explaining the limited number of women
classified as employed in various tasks pertaining to the agricultural sector
Among the ten fields of economic activity both sexes participate
least in the exploitation of mines and quarries - only 02 of the total
employed population and 01 of female employment which is explained by the
scant mineral activity at present Furthermore if it were to be increased
the participation of women would be limited by legal dispositions (See Annex
1 Article 104 of the 1972 Labor Code)
Specifically analyzing the total employed female population we
conclude that constrained by the countrys economic structure which in turn
dictates the demand for labor and the orientation of training most employed
women - 545 - are in communal social and personal services With respect to
the high percentage of women in services it must be noted that although women
in our society are slowly changing their thinking as to job choice a prefershy
ence for certain occupations still prevails mostly services of all types
such as secretaries teachers professors nurses It can also be observed
that for cultural reasons or due to the direction of their training all
these occupations are intimately associated with the role of the mother (carshy
ing for guiding and tending to others) This field also includes a considershy
able number of people employed in services requiring very low levels of trainshy
ing and who perform tasks similar to domestic chores but who if taken as part
of the labor force represent extremely low incomes (cleaning women messenshy
gers guards manual laborers etc)
-67-
The second important field of activity for Panamanian women though
far removed from the first is that of retail and wholesale commerce and
restaurants and hotels Commercial activity has been rather important throughshy
out the countrys historical and economic development but has always been
concentrated in what is today the Metropolitan region of the country particushy
larly in the cities of Panama and Colon where more than 60 of all commercial
establishments are located This concentration is more evident for wholesale
establishments 75 of which are in one of the two provinces of the Metroposhy
litan Region the province of Panama From this we can clearly conclude that
trade basically offers a training opportunity particularly to urban women and
especially in one region of the country
The third important occupational field for female employment is the
manufacturing industry where 86 of employed women can be found Panama has a
very incipient industrial sector which faces many problems and limitations
such as the scant integration of industrial activities amongst themselves and
with the other productive sectors In general the industrial sector is inshy
complete with very little development in the production of intermediate goods
Furthermore with the exception of the Construction Sector the dynamism of
industry does not meet the demand generated by the other productive sectors
nor does it produce a demand for these sectors Another limitation of the
industrial sector which in turn restricts the employment opportunities it can
offer is the reduced internal market and the inaccessability of the external
market given the fact that with few exceptions industrial productivity is
low and there has been no effective policy for promotion of exports I
1 See Bases for Panamas Economic and Social Development MIPPE December 1980
FIGURE 15
WholesaLe amp retail tradee Transportatio storage rstaurents- d hIote1s 171
communications 38 0 e Constructioni 10 amp-communicatons38 e- Electricity gas amp water 10
bull ~ =o
Financial establishments real estate insurance and support 4- o o services 57 o 1 - - Manufacturing industries 86i~~ii
e 0D tlll ~-
SSdeg o) t deg eo 0 g degbull v
S Exploitation of mines and bull t I t shy
14 quarries- 01 bull hunting forestry -AgricuLtureiiiand fishing 43
Unknown 10
4 wOperation and defense of the Cann4
Communal social and personal services 545
EMPLOYED FEMALE POPULATION BY FIELD OF ACTIVITY - 1980 CENSUS
SOURCE 1980 Censils Tabulations - 20 Sampling SCB amp Population Deot MIPPE
-69-
The fourth important field of activity for female employment is that
of financial establishments insurance real estate and commercial services
This field employs 57 of working women and acquired significance only reshy
cently particularly during the 1970s when the International Banking Center
expanded rapidly with favorable repercussions on employment generation
As can be appreciated almost 87 of employed women are in the above
four fields of activity with the other relatively minimal percentages distrishy
buted among the remaining seven fields of activity The fields of employment
activity for women are summarized in Figure 15
D Occupations of Women in Panama
For statistical and census purposes the employed population is also
classified into ten occupational groups
At the national level and irrespective of sex the three most imshy
portant groups as to number of people employed are farmers cattlemen fishshy
ermen hunters followed in importance by workers in personal and related sershy
vices in third place artisans and workmen This ranking shows variations by
sex
Table 5 of the Annex which provides details of the employed populashy
tion 10 years or older by occupation and sex shows that approximately three
of every 10 working women are employed in the so-called personal and related
services From this we can conclude that women are engaged in occupations that
usually pay low wages This is particularly true for women without the educashy
tion which would allow them to aspire to occupations requiring a certain de
gree of specialization Following in importance with 26 are office workers
and women in related occupations This is partly due to the fact that many
women still follow courses of study which traditionally have been considered
feminine such as secretarial accounting and other courses related to general
-70shy
office work In the 1975 Opinion Survey I mothers ranked the professions
they would like their daughters to pursue as follows medicine nursing
secretarial work office work accounting or auditing
In third place 21 of women rre in technical professions or related
activities For this percentage the educational characteristics of the female
population described in Chaper II must be taken into account Reference is
made there to the gradual improvement of womens levels of education includshy
ing higher education As concerns the incorporation of women into the counshy
trys economic and social development it is significant that one out of every
5 emplcyed women is in this occupational group
The three occupational groups mentioned host the large majority of
the female population shown as employed in the last census - 766 - with
approximately one out of every four employed women in the seven remaining
occupational groups These data on the occupational distribution for women are
summarized in Figure 16
Although the three major occupational groups are the same in both
urban and rural areas there are variations in their order of importance In
urban areas 292 of employed women are office workers or hold related jobs
followed by 284 in personal and related services and by 219 in professhy
sionaL technical and related occupations In rural areas female participation
by occupation is as follows 357 (more than 13 of rural women) in personal
and related services followed by 169 in professional technical and related
occupations and thirdly 130 in office work and related occupations
_ Opinion Survey on the Panamanian Woman Statistics and Census Bureau Controller General of the Republic 1975
FIGURE 16
PERCENTAGE DISTRIBUTION OF FEMALE POPULATION BY OCCUPATION
1980 CENSUS
Office workers and related occupations
Managers administrators and
Director-Level Officials 36
i Professionals technical amp related occupations
li-l or non-declared occupationsIM and other workers
4 0 f
Saleswomen amp re- Lated occupations 0o t
- C Farming cattle- -- 4 299 Workers in personal and raising fishing I o related servicesh u n t i n g 2 T - -
Conductors of means of Workwomen amp day-laborers 13 transport amp related bull02
Artisans amp craftsmen Other artisans 47 amp craftsmen
12
SOURCE 1980 Census Tabulations - 20 Sampling BSC Z Population Dept - MIPPE
-72-
E Occupation Level of Instruction and Income
The 1980 Census statistics reveal that employed women on the averge
have a higher level of education than employed men since 198 of them have
some university training as compared to only 89 of men (See Table 20)
It is worth noting that 111 of employed men have no education while
urban areas where 228 of employed women have a university education as
against 167 of men The difference is even more pronounced in rural areas
w1ere 84 of employed women have university training as opposed to only 1 7
of employed men
It is interesting to note that 186 of employed men in rural areas
have no educational background while only 84 of employed women present this
characteristic This is partly explained by the fact that there are more men
than women agricultural workers and that the performance of this type of actishy
vity does not require a knowledge of reading and writing Figure 17 illusshy
trates the important relationship between education and womens employment
303 of employed ren and women declared a monthly income of less
than B125 (see Table 21) and 269 receive between B125 and B249 men
and women alike However for those earning between B250 and B599 or
232 of the total employed population there is a larger representation of
women (293) than men (211) At the highest income level (B600 or more)
men are more likely than women to be in this group
An analysis shows that in the urban area there is a larger proportion
of women than men earning less than B125 per month (281 and 156 respectshy
ively) while more men than women earn B600 or more (143 and 72 respectshy
ively) In rural areas the most notable differences are in the B250-B599
group - 130 of men and 192 of women are in this group (See Annex Table
No 6)
-73-
Table 20 E KDYED POPUIMCV 10 YEARS OLD AND OVER EY LFWEL
OF INSCRUIION AREA AND SMX 1960
Sex Level of Instruction Total Men Women
andSex No No NO
Total 503540 100 369460 1000 134C820 1000
No education 44920 89 40925 111 3995 30 Unfinished primary 109230 217 93510 253 15720 117 Completed primary 132650 263 102295 277 30355 226 Unfinished secondary 93770 186 64335 174 29435 220 Completed secondary 59945 119 32855 89 27090 2D2 1 to 3 yrs college 4 or more yrs college
27520 32030
55 64
14000 18995
38 51
13520 13035
101 97
Unknown 3475 07 2545 07 930 07
Urban 234020 1000 177925 1000 106095 1000
No education Unfinished primary
6950 33850
25 119
5305 23995
30 135
1645 9855
16 93
Completed priary 64915 229 43115 242 21800 205 Unfinished secondary 73285 258 47840 269 25445 240 Completed secondary 1 to 3 yrs college
48675 24295
171 86
26280 12270
148 69
22395 12025
21 1 113
4 or more yrs college 29670 104 17520 98 12150 115 Unknown 2380 08 1600 09 780 07
Rural 219520 1000 191535 1000 27985 1030
No education 37970 173 35620 186 23-50 84 Unfinished primary 75380 343 69515 363 5865 210 Completed primary 67735 309 59180 309 8555 306 Unfinished secondary 20485 93 16495 86 3990 143 Completed secondary 11270 5-i 6575 34 4695 168 1 to 3 yrs college 3225 15 1730 09 1495 53 4 or more yrs college 2360 11 1475 08 885 31 Unknown 1095 05 945 O5 150 05
20 SmplnSource 19890 Population and Housing Census Tabulations Statistics and Census
Bureau Controller General of tle Republic
-74-
FIGURE 17
EMPLOYED FEMALE POPULATION BY LEVEL OF INSTRUCTION1980 CENSUS
Employed FemaLe PopuLation UNKNOWN 930 TOTAL 134080
321000
0355
30000- 2-01435
3o 25000shy
2opooshy
15720 580 00-
3
3 035
X10900shy --
i~
5i000]- I]3995
8000 2pooshy
0- -- _L L~~~~~ _
00 0 gtshy
wHiz- LUI gt- I- I-gt- n gt- - H
Ei _Jlt- x z - J Z L L - ALL - oz o ZL U ZZ U
S T u iw 20 S pl n C amp 0 a De shy -IPPE
SOURCE 1980 Census TabuLations -20 SampLing BSC amp PopuLation Dept -MIPPE
-75-
TABLE 21 EIPLOYEr POPULATION 10 YEARS OR OLDER BY MONTHLY INCOME AND SEX
1980 CENSUS
Monthly Income
Total
Men Sex
Women Number Number Number
Total 503540 1000 369460 1000 134080 1000
Less than 125 152465 303 110605 299 41860 312
125 - 249 135545 269 97765 265 37780 282
250 - 599 117075 232 21177805 39270 293 600 or more 353)5 70 27680 75 7715 58
Not declared 63060 125 55605 150 7455 55
Source 1980 Population and Housing Census Controller General of the
Republic
Observing average monthly income by category of employment (see Annex
Table No 7) the most representative category for income groups above B125
is that of permanent workers For those earning less than B125 per month
the women are mostly permanent employees while the men are mostly selfshy
employed
Educational level is a determining factor in obtaining higher incomes
and in Panama there is a close correlation between these variables As shown
in Table 22 for the country as a whole the average monthly income for emshy
ployed persons is slightly higher for women (B19370) than for men
(B18100) It should be noted that although the situation for women would
appear to be better than that of men overall if we examine in detail the
difference in income by sex for the various educational groups men show an
average monthly income higher than women with the same educational level The
high overall average income for women is due to the fact that more than 50 of
-76shy
working women have secondary education or better while more than 60 of workshy
ing men have primary education or less With an economic participation rate of
only 25 (compared with mens 63) women who are not well-educated tend to
remain outside the paid labor force This situation is not true for men makshy
ing the average earnings seem high for the smaller but better educated
female labor force
In general terms as men and women attain a greater degree of educaL
tion their opportunities for higher incomes increase For men the average
monthly income goes from B7860 among groups having no education to
B16080 for those having finished primary school B31990 for those having
finished secondary school and B73760 for those having 4 or more years of
university education
For women this behavior is similar As an exanDple the incomes of
women with 4 or more years of college are nine times greater than those of
women having no education Working women with no education have an average
income of B5300 while those having finished primary school earn B10300
those having finished secondary school B28010 and those having 4 or more
years of college B46700
It has been observed that there is a disparity in incomes between men
and women having the same degree of education at lower levels of instruction
(from no education to primary education) the difference varies between 48 and
56 in favor of men for the intermediate levels (secondary education to 3
years of college) there are differences between 14 and 27 also in favor of
men and at higher levels (4 or more years of college) the gap widens with a
difference of 58 in favor of men
This situation expressed in figures reveals that women with no
education receive an average monthly income of B5300 while men at the same
-77shy
level receive B7860
Men who have completed primary school earn B16080 while women only
earn B10300 Upon completion of secondary school men receive B31990
while women receive B28010 and after 4 or more years of college men earn
an average monthly income of B73760 while women earn B46700 which is
only 63 of what men earn
The income difference between the sexes is more acute in urban areas
for the lowest educational levels it varies between 89 and 123 in favor of
men at the intermediate levels between 16 and 28 which maintains the
overall trend and for the highest educational level the difference is 59
that is women earn 63 of what men earn showing that in urban areas the
trend is the same as it is nationally
The situation is more or less the same in rural areas although
slightly improved for women having higher levels of education since here they
earn 68 rather than 63 of what men earn More detailled information appears
in Table 6 of the Statistical Annex
-78-
Table 22 AVERAGE MHT2( INCME MOR B4PIYED POULMATN 10 YEJA1 OLD AND OVER EY
AGE
Level of Instruction and Area
Total
No education Unfinished primary Completed primary Unfinished secondary Completed secondary 1 to 3 yrs college 4 or more yrs college Unknown
Url-en
No education Unfinished primary Completed primary Unfinished secondary Completed secondary 1 to 3 yrs college 4 or more yrs college Unknown
Rural
No education Unfinished primary Completed primary Unfinished secondary Completed secondary 1 to 3 yrs college 4 or more yro college Unknown
20 Sampling
LEVEL OF INSTWCTION AREA AND SEK 980 (InBalboas)
Total n Women
Incae Income Popl~ation Inomw PF2ilaticn
1846 1810 369460 1937 134080
743 786 530 1047 1102 731 1434 1608 1030 2106 2256 1778 2985 3199 2901 3412 3685 3203 5912 7376 4670 1707 1915 153o6
2357 2471 177925 2132 106095
12D0 1363 611 1477 1731 871 1711 2056 1085 2208 2387 1868 3089 3360 2363 3464 3755 3245 5876 7504 4716 2215 2500 1623
1069 1055 191535 1160 27985
675 695 47-4 822 E54 587
1117 1159 833 1656 1781 1247 2581 2628 2533 383 3275 291-3 5081 5959 4048 1006 936 1125
Source 1980 Population and Housing Census Tabulations Statistics and Census Bureau Controller General of the Republic
-79-
The above analysis shows that women must work harder than men to obtain
higher incomes since to compete in the labor market they must possess a higher
level of education than men and still receive a lower income Therefore much
care must be taken in using information on the monthly average income of emshy
ployed persons since the figure is subject to the factors noted above minoshy
rity participation of women in employment and a greater level of instruction
for employed women compared to employed men
F Women and Categories of ERployment
The analysis of employed women by category of employment presents varshy
ious interesting aspects (See Table 23) Natiorlly 69 of employed persons
belong to the category of salaried workers 24 are self-employed 4 are
family workers and 2 are landowners or proprietors
For employed women this structure changes somewhat since 89 of them
are salaried 7 are self-employed 1 are family workers and 1 are landshy
owners or proprietresses However employed men have the following distrishy
bution 62 are salaried 29 are self-employed 5 are family workers and 2
are landowners or proprietors
The case is the same for urban and rural areas since in Loth there is a
greater proportion (by sex) of women that are salaried and a smaller
proportion of women that are self-employed family workers or landowners
Of every 10 working women 8 are in the urban areas where 93 of them
are salaried while only 5 are self-employed In rral areas 75 of women are
salaried while self-employed workers represent 16 and about 5 are family
workers
As derived from Annex Table No 7 34 of salaried workers are in the
public sector 61 are employed in private businesses 4 work for the Panama
Canal Agency and 1 work in cooperatives or communal organizations
-80shy
57 of salaried women like most of the salaried population work in
private enterprise while 40 are in the public sector and 2 work for the
Panama Canal Arency
Of all salaried persons 76 work as permanent employees whilc 24 are
part-time workers Among all salaried women 82 are permanent labol while 18
are part-time workers This ratio is about the same for women in urban areas
while in rural areas 71 work as permanent employees and 29 are part-time
workers
Analyzing employment categories by average monthly income of all
employed persons those working for the Panama Canal Agency have the highest
levels of income permanent staff receive an average monthly income of about
B534 while part-time workers receive B341
TABLE 23 EMPLOYED POPULATION 10 YEARS OR OLDER BY CATEGORY OF
EMPLOYMENT AND SEX1980 CENSUS
Category of Employment
Total
Employed
Part-time
Permanent
Self-Employed
Proprietors (owner)
Cooperative
Family Worker
Not Declared
Total
Number
503540
347245
82260
264985
118220
9085
2020
19720
7250
1000
69o
153
527
235
18
04
39
14
Men Number
369460
227805
60850
166955
108795
7795
1915
18035
5115
Sex
1000
617
165
452
294
21
05
49
14
Women Number
134080 1000
119440 891
21410 160
98030 731
9425 70
1290 10
105 01
1685 12
2135 16
Source Tabulations of the 1980 National Population and Housing Censuses Statistics and Census Bureau Controller General of the Republic
-81-
This category is followed in order by permanent government workers with
B294 proprietors with B262 and permanent workers in private enterprise
with B202
The remaining employment categories present average monthly incomes
below B200 Among those between B100 and B200 are permanent employees of
cooperatives (B157) part-time workers Jn the public sector (B152) and
part-time workers in private enterprise (B103)
The least privileged employment categories in terms of monthly income
(below B100) are part-time cooperative workers (B94) workers in producshy
tion cooperatives or communal organizations (B74) self-employed workers
(B73) and family workers (B46) 1
The pattern for men is similar to that of all employed workers that is
they follow practically the same order of importance for average monthly inshy
come by category of employment For women however there are certaiL variashy
tions in the weight these employment categories have with regard to income
As in the case of all workers the highest average income is for women
who are permanent staff of the Panama Canal Agency (B522) although they
receive about B14 less than men These are followed in order by permanent
government workers (B293) where there is barely a B200 difference in
favor of men Then employers or landowners with B210 (B67 less than men)
and part-time workers at the Panama Canal Agency with B202 (B79 less than
men)
_ By definition family workers are persons who receive no salary for their work but who receive other types of income
-82-
Among employed women with an average monthly income between 100 and 200
balboas are permanent workers in the private sector with B170 permanent
employees of cooperatives with B145 part-time government workers with
Br132 and workers in production cooperatives or communal organizations with
B100 It must be stressed that this last group is the only one outside of
family workers where women have an average monthly income higher than men
(B100 for women as against B73 for men)
In the other employment categories women earn a monthly income below
B100 These include part-time workers in private cooperatives (B72)
self-employed workers (B68) part-time workers in private enterprise (B67)
and family workers (B51)
As can be appreciated self-employed women earn almost the same as women
who are temporarily employed in private enterprise It is also iateresting to
point out that urban women irrespective of occupational category earn higher
incomes than women in rural areas The differences in income vary between
categories from 20 to 150 Aj an example there is a differenc-1 of almost
100 for self-employed women that is the urban woman receives twice iiat the
rural woman earns a situation similar to that of permanent government workers
and those in productive cooperatives or communal organizations
For part-time workers of the Panama Canal Agency part-time workers in
private enterprise permanent staff in private enterprise and permanent
workers in production cooperatives these differences range from 1 to 100
In the remaining categories the differences in income by area are
smaller part-time workers in cooperatives 37 part-time government workers
26 and owners 20 always in favor of the urban area
-83-
G The Economically Inactive Woman
Although the incorporation of the Panamanian woman into the countrys
economic activity has gradually increased there is still a large percentage
of women who are outside the paid labor force (723 of women 15 years of age
or older)
Various reasons explain this situation a considerable group of women
have not entered the economically active population because they see little
chance of finding a job If the job market were less restricted a greater
number of women could be expected to participate in some economic activity
Furthermore the level of training of many women is so low that their opporshy
tunities are limited for finding a job with sufficient remuneration to justify
leaving their homes and the care of their children
To a large degree the high percentage of women that do not participate
in the labor market is due to the structure of the division of labor by sex
Although it 49 recognized that there have been changes in the conception of
roles in society in many cases secondary importance is given to the tasks
that women must perform while the work of men is given greater value
Furthermore there are functions which are intrinsic to the condition of
women which lead them to permanently perform their basic social role in the
context of the family Their biological function is to reproduce which is
closely linked to the care and up-bringing of children and also the job of
running the household in general This explains why many women do not stay at
their jobs long but enter and exit the labor market at various times in their
lives Table 24 shows that slightly more than 460000 women were registered as
economically inactive in the 1980 census with most of them falling into two
groups housewives and students
Table 24 ECONOMICALLY INACIVE POLATIM 10 YEARS OF AGE AND OVER
BY TYPE OF INACTIVE FNSOT AND ME 190 CENSUS
InType of Inactivity WomenTotal Percentage Number Percentage Number Percentage
Tc2067 1000 231650 1000 460417 1000 Housewife 265990 384 2140 09 263850 574
Student 302095 437 151555 655 150540 327
Invalid 6545 09 3855 17 2690 06 Retired with pension 25970 38 16790 72 91W3 20
Pensionees and private income recishypients 9160 13 5320 23 3840 08
Retirees 6360 09 4470 19 1890 04 People in institutions 5997 09 4460 19 1527 03
Other situations 69969 101 43060 186 26900 58
Source Tabulations of the National Population and Housing Census - 20 Sampling
Statistics and Census Rteau Controller General of the Republic
Note Figures subject to change
-85-
The first group in importance within the non-active group is that of
housewives (574) who perform chores traditionally assigned to women and
which have unjustly been treated as activities lacking any economic value In
Panama as in most countries thetie activities are not considerd work since
they fall outside the realm of exchange and the market Their invisible nature
is clearly evidenced by the fact that housewives are classified as economicshy
ally inactive population I1On the other hand there is a high percentage of
women ten years of age or older that remain in the educational system (327)
which is a very positive factor in the improvement of womans condition in
society and in the countrys economic development in general
TABLE 25 POPULATION 10 YEARS OF AGE OR OLDER ECONOMICALLY INACTIVE
BY RURAL AND URBAN AREAS 1980 CENSUS
Total Urban Rural
Economically Inshyactive Population 692067 1000 365790 1000 326277 1000
1000 529 471 MEN 231650 335 129963 355 101687 312 1000 561 439
WOMEN 460417 665 235827 645 224590 688 1000 512 488
Source Tabulations of the National Population and Housing Census 20 Samplshying Statistics and Census Bureau Controller General of the Republic
As illustrated in the chapter on education there are practically no
differences in levels of instruction between the sexes At certain levels of
the system there is even a higher ratio of women than men
1 For census purposes the Census-Takers Manual defines the housewife as a person who is solely and exclusively devoted to domestic tasks or chores in her own home and who is not seeking employment is not retired not on a pension does not earn rental income nor goes to school There can be more than one housewife in a housing unit
-86-
The two groups described (housewives and students) include nine out of
every ten non-active women while the balance - 10 - is distributed among
retired pensioned or income-earning women invalids retired women or women
otherwise institutionalized
As to the distribution by area of economically non-active women
although most of them are in urban communities the difference is not signifishy
cant (See Table 25)
-87-
FINAL COMMENTS
-88-
FINAL COMMENTS
The status of women in Panampia is closely linked to economic social
cultural and politicallfactors In order to promote overall development inshy
cluding enhancing the status of women it is imperative to promote measures
that will allow the effective participation of the population without any type
of discrimination Women themselves must seek the means whereby they will be
taken more and more into account in the activities of the social group to
which they belong
he world is evolving in an accelerated fashion aad th3 role that women
must play in a society underg)ing rapid change is becoming increasingly
evident In recent years significant progress has been noted in the role of
wome3n since they now have greater ana broader possibilities to participate in
various economic social and political activities The scale of opportunities
has greatly increased and women constitute an important segment of the work
force becoming more and more an integral part of the labor market working
alongside men in response to the demands of the economy and their individual
skills
Finally many opportunities for participation exist today for women with
good training and they will have many more in the future given the
innovations and technological advances that occur in response to the economic
and social development process taking place in the country
Fortunately for the Panamanian woman there are no openly discriminatory
attitudes generally speaking which can be blamed for the disadvantageous
position of women The clearest demonstration of this appears in the
educational sector indicators where women are relativoly well placed and from
which it must be recognized that educational training in our society has been
an importaLt factor in uocial and economic advancement
-89-
This does not mean however that there is no cause for concern Quite
the contrary emphasis must continue being placed on the need to find all the
means available so that women like men can achieve economic social and
political success in Panama without distinction of sex
-90-
ANNEX 1
CERTAIN LEGAL PROVISOS THAT AFFECT FEMALE LABOR
A ARTICLES FROM THE 1972 POLITICAL CONSTITUTION OF THE REPUBLIC OF PANAMA
CHAPTER 3
LABOR
B LABOR CODE
ChtPTER II
FEMALE AND CHILD LABOR
-91-
ANNEX 1
CERTAIN LEGAL PROVISOS THAT BENEFIT WOMEN
A - ARTICLES FROM THE 1972 POLITICAL CONSTITUTION OF THE REPUBLIC OF PANAMA
CHAPTER 3
LABOR
ARTICLE 59 -Work is a right and an obligation of the individual and thereshyfore it is the obligation of the State to establish economic
policies aimed at promoting full employment and assuring for all workers the necessary conditions for a decent existence
ARTICLE 62 - Equal salary or wages must be paid for equal work under identishycal conditions whoever performs it without distinctiorn as to sex
nationality race age social class or political or religious beliefs
ARTICLE 65 -The maximum work day shall be eight hours and the maxiLmum work week shall be forty-eight hcurs the maximum night shift shall not
be greater than seven and overtime hours shall be paid over and above the normal wage
The maximum work day will be lowered to six hours per day for people over fourteen and under eighteen Children under fourteen shall not work nor shall children under sixteen work night shifts unless excepted byLaw The employment of minors under fourteen as domestic servants is also prohiaited as is the employment of minors and women in unhealthy occupations
Aside from weekly leave all workers shall have the right to paid vacation
The Law may establish paid weekly leave in accordance with the countrys economic and social coniditions and for the benefit of its workers
ARTICLE 67 - The right of the working woman to bear children shall be proshytected A pregnant woman shall not be severed from public or
private employment because of pregnancy For a minimum of six we3ks prior to childbirth and for eight weeks afterwards a woman shall take obligatorymaternity leave with full pay and will keep her job and all contractual rights When the working mother returns to her job she cannot be fired for a period of one year except in special cases foreseen by Law which will also regulate the special working conditions of pregnant women
B - THE LABOR CODE
CHAPTER II
FEMALE AND CHILD LABOR
ARTICLE 104 - Women are prohibited from working in I- Underground areas mines open pits quarries and in construction activities and 2- Dangerous or unhealthy activities as determined by the Ministry of Labor and Social Welfare
-92-
ARTICLE 105 - The protection of the working womans right to bear children is an obligation of the State
ARTICLE 106 - A pregnant woman can be fired from her job only for just cause and only after prior judicial authorization When an employer wishes to fire a pregnant woman who has given
just cause for dismissal he shall first request authorization from the approshypriate labor jurisdiction to whom he shall prove without doubt that there is justified cause for dismissal
Such authorization shall be handed down as a labor-related summary proceeding
In qny event where a pregnant worker is notified of dismissal or termination with respect to her employment without the prior authorization of the appropriate judicial authority the worker shall present to her employer or to any labor authority a medical certificate as to her pregnancy within twenty days following the notification If she does so the worker has the right to full employment reinstatement and payment of wages from the date of dismissal After the twenty-day period and for the next three months the worker can require her reinstatement but only claim wages from the date the medical certficate is presented In the event the employer refuses the worker can request her reinstatement through legal means
The 20-day period for presenting the medical certificate cannot be interrupted Once it has expired the worker has a three-month prescribed period which begins when the 20 days expire to request reinstatememt and which can be interrupted in any of the forms stipulated in item seven or article 12
This norm objectively establishes the legal framework of maternal labor so that a female employee may not be dismissed during pregnancy unless the following events occur 1 Just cause for dismissal and 2 Prior authorization for dismissal by the labor authorities having
jurisdiction in each case The pregnancy protoction extends from the time of childbirth until three months following the date when the worker returns to her job after childbirth (article 113)
ARTICLE 107 All pregnant workers shall enjoy mandatory leave remunershyated in the same manner as their employment during the six weeks preceding childbirth and the eight weeks following In no event shall the total leave period be less than fourteen weeks however if there is a delay in childshybirth the worker will have the right to be given as mandatory leave the eight weeks following the delivery
Employers shall make uo the difference between the maternity subsidyprovided by the Social Security Board and the wage to which the worker is entitled in accordance with this article
When the Social Security Board is not obligated to cover the maternity subsidy the obligation contained in this article will be entirely the responsilibity of the employer
The Executive Organ is empowered to issue provisions in respect of this article establishing greater leave periods than those stipulated for activities or professions that by their nature require such In these cases the provisions of the two foregoing paragraphs will also apply
Article 93 of the 1947 Code
-93-
If the worker did not report her pregnancy upon beginning her work assignment the employer is responsible in accordance with social security regulations and in conformity with Article 107 of our Labor Statute
ARTICLE 108- To determine the date when paid mandatory leave begins the worker shall present to her employer a medical certificate showing the probable date of childbirth Any phyician employed by the State or any of its institutions shall issue this certificate free of charge If for any reason the pregnant worker is on the job during the leave period prior to delivery the employer is obligated to pay her the corresponding wage plus an equal amount as indemnity without prLdice of the legal sanctions which he may incur
ARTICLE 109- Women on maternity leave may not work on their own
ARTICLE 110- If during the leave periods referred to above illness should occur as a result of the pregnancy or delivery the worker shall
have the right to extended leave for whatever time is prescribed under medical certification
The period resulting from the extension of paid leave shall be covered completely through a subsidy from the Social Security Board if the worker is affiliated If the Social Security Board is not obligated the provisions of Article 107 shall apply
ARTICLE 111- Payment for mandatory leave shall be on the basis of the last salary received or the average salary for the latest one hundred
and eighty days whichever is greater
ARTICLE 112- In the event of abortion stillbirth or any other abnormal birth paid mandatory leave shall be paid in accordance with the demands
of the workers health as shown by a medical certificate and the preshyscriptions of the attending physician
ARTICLE 113- From the time the worker returns to her job after childshybirth and up to three months the employer shall be able to dismiss her
only for just cause and after prior authorization in accordance with the provisions of Article 106
Declared unconstitutional by the Social Security Board (November 16 1973) in violation of Article 67 of the Constitution which establishes a legal framework of one year
ARTICLE 114- When breast-feeding all working mothers shall be given a fifteen-minute interval every three hours or if she prefers half an
hour twice a day during her working hours for the purpose of feeding her child The employer shall provide some means of rest within the possibilities of her work and will maintain a sufficient number of chairs available to all workers The time required for this purpose shall be computed for purposes of the workers salary as real work time like the intervals described above
All employers who hire more than twenty women shall be required to provide a locale where women can breast-feed without endangering their children This shall be done taking into account the employers economic possibilities at the discretion of the General or Regional Labor Bureau
-94-
Articles 95 and 98 of the 1947 Code This precept constitutes a furthering of the right of protection that the employer must provide in his work relations
ARTICLE 115- The Executive Organ and the Social Security Board within a year of the force of this Code shall establish child-care centers and
child centers in industrial or commercial sectors where there is a large number of workers The working mother shall be able to leave her pre-school children at these centers where they will receive necessary medical nutrishytional and recreational attention
ARTICLE 116- The pregnant woman shall not work overtime If the worker is subject to rotating shifts at various intervals the employer is
required to make the necessary arrangements so that the worker will not have to work the night or split shifts The shift stipulated for these purposes wil be fixed and not subject to rotations
The employer shall also make the necessary arrangements so that pregnant workers will not perform tasks inappropriate or harmful to their condition
-95-
Annex No 2
Statistical Annex
Table No I Literacy and Illiteracy in the Republic for the Population 10 Years of Age and Older by Area and Sex 1980 Census
Table No 2 Population in the Republic 6 Years Old and Over by Level of Instruction Sex and Age 1980 Census
Table No 3 Population 10 Years Old and Over by Status of Economic Activity Se- Age and Area 1980 Census
Table No 4 Population 10 Years Old and Over bT Status of ActivitySex Level of Instruction and Area 980 Census
Table No 5 Employed Population 10 Years Old and Over by Occupation Sex and Area 1980 Census
Table No 6 Employed Population 10 Years Old and Over by Income Earned Sex Level of Instruction and Area 1980 Census
Table 11o 7 Average Monthly Income for Employed Population 10 Years of Age and Older by Sex Category of Employment and Area 1980 Census
Table No 8 Estimated Population 60 Years and Older by Sex and Age Group in the Republic for Years 1970 1980 1990 and 2000
-96-
TABLE NO LITERACY AND ILLITERACY IN THE REPUBLIC FOR THE POPULATION 10 YEARS OF AGE AND OLDER BY AREA AND SEX 1980 CENSUS
Population 10 Years of age and older Area sex and age Illiterate
Total Literate Number Percent
TOTAL 1312942 1125808 187134 142
10 - 14 228640 208175 20465 90
15 - 19 199829 188350 11479 57 20 - 24 161522 149480 12042 75 25 - 29 134548 121297 13251 98
30 - 34 118342 103338 15004 127
35 - 39 95216 80127 15089 158
40 - 44 79146 64111 15035 190
45 - 49 66314 50942 15372 232
50 - 54 57544 43146 14398 250
55 - 59 46894 35116 11778 251
60 and over 120378 79170 41208 342
Unknown 4569 2556 2013 441
M E N 663060 570958 92102 139
10 - 14 118016 106157 11859 100
15 - 19 99718 94423 5295 53 20 - 24 79212 74045 5167 65
25 - 29 66996 61227 5769 86
30 - 34 59483 52351 7132 120
35 - 39 47658 40419 7239 152 40 - 44 40491 33196 7295 180
45 - 49 34134 26487 7647 224
50 - 54 29230 22034 7196 246
55 - 59 24211 18360 5851 242
60 and over 61590 40940 20650 335 Unknown 2321 1319 1002 432
-97-
TABLE NO (Page 2)
LITERACY AND ILLITERACY IN THE REPUBLIC FOR THE POPULATION 10 YEARS OF AGE AND OLDER BY AREA AND SEX 1980 CENSUS
Population 10 Years of age and older Area sex and age Illiterate
Total Literate Number Percent
W 0 M E N 649882 554850 95032 146
10 - 14 110624 102018 8606 78
15 - 19 100111 93927 6184 62
20 - 24 82310 75435 6875 84
25 - 29 67552 60070 7482 111
30 - 34 58859 50987 7872 134
35 - 39 47558 39708 7850 165
40 - 44 38655 30915 7740 200
45 - 49 32180 24455 7725 240
50 - 54 28314 21112 7202 254
55 - 59 22683 16756 5927 261
60 and over 58788 38230 20558 350
Unknown 2248 1237 1011 450
URBAN 688440 654211 34229 50
10 - 14 106425 102500 3925 37
15 - 19 106174 103727 2447 23
20 - 24 90779 88516 2263 25
25 - 29 75079 73021 2058 27
30 - 34 65246 63133 2113 32
35 - 39 50757 48684 2073 41
40 - 44 40410 38485 1925 48
45 - 49 33297 31053 2244 67
50 - 54 30225 27865 2360 78
55 - 59 24771 22599 2172 88
60 and over 62549 52746 9803 157
Unknown 2728 1882 846 310
-98-
TABLE NO I (Page 3)
LITERACY AND ILLITERACY IN THE REPUBLIC FOR THE POPULATION 10 YEARS OF AGE AND OLDER BY AREA AND SEX 1980 CENSUS
Population 10 Years of age and older Area sex and age Illiterate
Total Literate Number Percent
M E N 328818 313385 15433 47
10 shy 14 53612 51345 2267 42
15 - 19 49802 48567 1235 25
20 - 24 42250 41176 1074 25
25 - 29 36120 35032 1088 30
30 - 34 31248 30218 1030 33
35 - 39 24026 23178 848 35
40 - 44 11552 18693 859 44
45 - 49 16048 15060 988 62
50 shy 54 14245 13232 1013 71
55 - 59 11960 11085 875 73
60 and over 28628 24912 3716 130
Unknown 1327 887 440 332
W 0 M E N 359622 340826 18796 52
10 - 14 52813 51155 1658 31
15 - 19 56372 55160 1212 22
20 - 24 48529 47340 1189 25
25 - 29 38959 37989 970 25
30 - 34 33998 32915 1083 32
35 - 39 26731 25506 1225 46
40 - 44 20858 19792 1066 51
45 - 49 17249 15993 1256 73
50 - 54 15980 14633 1347 84
55 - 59 12811 11514 1297 101
60 and over 33921 27834 6087 179
Unknown 1401 995 406 290
-99-
TABLE NO 1 (Page 4)
LITERACY AND ILLITERACY IN THE REPUBLIC FOP THE POPULATION 10 YEARS OF AGE AND OLDER BY AREA AND SEX 1980 CENSUS
Area sex and age Population 10 Years of age and older
Illiterate Total Literate Number Percent
RURAL 624502 471597 152905 245
10 - 14 122215 105675 16540 135 15 - 19 93655 84623 9032 96 20 - 24 70743 60964 9779 138
25 - 29 59469 48276 11193 188
30 - 34 53096 40205 12891 243
35 - 39 44459 31443 13016 293 40 shy 44 38736 25c626 13110 338
45 - 49 33017 19889 13128 398
50 - 54 27319 15281 12038 441
55 - 59 22123 12517 9606 434
60 and over 57829 26424 31405 543
Unknown 1841 674 1167 634
M E N 334242 257573 76669 229
10 - 14 64404 54812 9592 149
15 - 19 49916 45856 4060 81
20 - 24 36962 32869 4093 111
25 - 29 30876 26195 4681 152
30 - 34 28235 22133 6102 216
35 - 39 23632 17241 6391 270
40 - 44 20939 14503 6436 307
45 - 49 18086 11427 6659 368
50 - 54 14985 8802 6183 413
55 - 59 12251 7275 4976 406
60 and over 32962 16028 16934 514
Unknown 994 432 562 565
-100-
TABLE NO 1 (Page 5)
LITERACY AND ILLITERACY IN THE REPUBLIC FOR THE POPULATION 10 YEARS OF AGE AND OLDER BY AREA AND SEX 1980 CENSUS
Population 10 Years of age and older Area sex and age Illiterate
Total Literate Number Percent
W 0 M E N 290260 214024 76236 263
10 shy 14 57811 50863 6948 120
15 - 19 43739 38767 4972 114
20 shy 24 33781 28095 5686 168
25 - 29 28593 22081 6512 228
30 shy 34 24861 18072 6789 273
35 - 39 20827 14202 6625 318
40 - 44 17797 11123 6674 375
45 - 49 14931 8462 6469 433
50 - 54 12334 6479 5855 475
55 - 59 9872 5242 463o 469
60 and over 24867 10396 14471 582
Unknown 847 242 605 714
Source Tabulations of the National Population and Housing Census 20
Sampling Available at the Population Department of the MIPPE
Note Figures subject to change
-101-
TABLE NO 2 IMULATION IN THE RMJBHIC 6 YEARS OLD ANDOVER BY IMME OF U JMCII
SEX ANDAGE 190 CE JS
Population 6 Years old and over
Sex and Level of Instruction (years of study completed) Average Age Group Total None Primary
Total Coplete Secondary
Total Complete University Not
Declared Years
Declared
Total 15O7523 219193 799687 304047 390234 103742 83729 678 56
6 - 9 194581 66363 126007 2211 13
10 - 14 15 - 19 20 shy24
228640 199829 161522
9777 7769 9066
176495 73595 60640
48779 48680 39460
40438 i13840 68290
-
12525 29216
2746 22025
1930 1879 1501
47 75 83
25 - 29 154548 10497 58979 36117 45016 16938 1876 1 I) 78 30- 34 11342 12296 5827 33064 33172 11671 13365 1222 71 35 - 39 40 shy 44 45 shy 49 50 - 54
95216 79146 66314 57544
1282 13201 13781 12910
48756 41933 33796 30663
25257 19046 1258 11021
24098 173 14058 10409
8451 5829 4692 3423
8828 5918 4171 2927
7C6 712 508 615
65 59 54 49
55 - 59 46894 10449 26467 924 7789 2536 1747 442 47 60 shy 64 65 - 69 70 and over
41290 30836 48252
10325 8264
20557
23383 17116 21026
7430 5726 6963
5862 4239 4715
1944 1427 185
1205 860 855
515 357
1099
43 42 32
Not declared 4569 1112 1524 612 926 205 206 801 47
01 76128B 107917 412954 156021 1E8936 46238 42797 8614 56
6 - 9 96i2 3970 62024 1134 13 10 - 14 15 - 19
11016 99718
5297 3317
9873 39631
239)1 26C56
28770 54851 548O
1X1 13
913 46 74
20 shy 24 79212 3529 3193 21350 32935 13135 9876 8 82 25 - 29 66996 4358 30547 19255 21 21 7796 931 69 79 30 shy 34 5943 5729 299rjX 17052 16035 534 7049 717 71 35 - 39 47658 6161 246C6 12354 1163t 4069 4991 364 66 40 shy 44 40491 6M2 21835 9755 860B 2916 3302 404 59 45 shy 49 34134 6709 17542 6290 7105 2220 2469 309 55 50 shy 54 55 shy 9
29230 24211
6449 5127
15530 13866
5264 4801
5221 3999
1537 1ll
1702 941
325 278
50 47
60 shy64 21110 5323 12251 3829 3C64 997 775 297 44 65 - 69 70 and over
16231 23649
4202 996
9204 10222
2910 31M
2074 2370
622 8E6
565 520
186 551
43 32
Not declared 2321 485 803 312 446 95 110 477 50
746335 11278 35753 148026 201299 _ 40942 7064 57
6 - 9 96453 31393 63933 1077 14
10 - 14 110624 4487 83622 24 78 21666 847 49
15 - 19 ID111 4452 33964 22624 58989 7045 1740 966 76 20 shy 24 82310 5537 2B652 18110 35355 16031 12149 617 84 25 - 29 67552 6139 2B432 17062 23195 9142 9295 491 78 30 shy 34 35 - 39
58859 47558
6567 6667
23337 24148
16012 12903
17134 12464
6337 4382
6316 3937
505 342
70 64
40 - 44 38655 6919 20038 9291 8774 2913 2616 308 58 45 shy 49 32180 772 16254 63o3 6953 2472 1702 199 52 50 shy 54 28314 6461 15153 5757 518) 18E6 1225 237 49 55 - 59 22683 5322 12601 4483 3790 1425 806 164 46 60 shy 64 195 0 5002 11132 3601 2793 957 430 218 42 65 shy 69 70 and over Not declared
14605 24603 2248
4062 10571
627
7912 10804
721
2816 38E1 3CO
2165 2345
48)
805 999 li
295 335 96
171 548 324
42 31 47
Sorce Taulations of the National Popalation Housing Census 2C Sazpling available at the
Population Deparbnent of the Division of Social Plannig YPPE
Note Figures subject to change Not applicable
-102-
JIMATI0N 10 YEA1 TABTE NOo3
OD AND GER [ STUS OF EO0ONrC ACT=VITY AGE AND AREA 1980 CENSUS
SEX
Area sex age
and Total
Total
Population 10 Years Old and Over Econcmically Active Poulation
nan- Unemploy-Eiployed ployed ment Rate
Activity Rate
IgnAL 1252587 584460 503540 44920 82 438
10 - 14 15 - 19 20 - 24 25 - 29 30 - 34 35 - 39 40 - 44 45 - 49 50 - 54 55 - 59 60 and over Unknown
216445 190249 154467 12503 1-13157 90931 75256 62949 54884 45414
L16103 4229
9440 52950 90730 85725 76195 60140 48970 39015 30530 21295 32181 1490
8605 43515 77330 78690 71485 57140 47070 37605 29225 20610 3D965 3500
835 9435
13400 7035 4710 3000 1900 1410 1105
685 1215
190
88 178 148 82 62 50 39 36 36 32 38
12 8
44 278 587 667 673 661 651 620 553 469 277 352
ME N 634335 396315 369460 26855 68 625
10 - 14 15 - 19 20 - 24 25 - 29 30 - 34 35 - 39 40-44 45 - 49 50 - 54 55 - 59 60 and over Unknown
111416 95463 76322 64571 57243 45643 38581 32404 27855 23401 59275 2161
6850 37210 60545 58795 53680 42740 35900 29610 24180 17810 25050
945
6375 31115 53155 54990 51035 40955 34670 28655 23335 17270 27070
835
475 6095 7390 3805 2645 1785 1233
955 845 540 980
10
69 164 122 65 49 42 34 32 35 30 35
116
61 390 793 911 938 936 931 914 868 761 473 437
W0 ME N 618252 152145 13408 1065 119 246
10- 14 15 - 19 20 - 24 25 - 29 30 - 34 35 - 39 40 - 44 45 - 49 50- 54 55 - 59 60 and over Unknown
105029 94786 78145 63932 55914 4528 36675 30545 27029 22013 56828 2068
2590 15740 30185 26930 22515 17400 1300 9405 6150 3485 4130
545
2230 12400 24175 23700 20450 16185 12400 8950 5890 3340 3895
465
360 3340 6010 3230 2065 1215
670 455 260 145 235
82
139 212 199 120 92 70 51 48 42 42 57
147
25 166 386 421 403 384 356 308 228 153 73
264
-105-
TABLE NO3 (Page 2)
F0MMAG 10 YEARS OLD AND OVFR IY STAT OF ECONOMIC ACTIVIY AGE AND AREA 1980 CEMUS
SEX
Area sex age
and Total
Total
Popilation 10 Years Old and Over Econiically Active Population
UnEa- Unmploy-Dnployed ployed ment Rate
Activity Rate
URBAN 6a40 314905 24020 30885 98 457
10 - 14 15 - 19 20 - 24 25 - 29 30 - 34 35 - 39 40 - 44 45 - 49 50- 54 55 shy 59 60 and over Unknmm
106425 106174 90779 75079 65246 50757 40410 33297 30225 24M71 62549 272B
2260 23680 55455 54575 48110 37005 29145 22270 171160 11165 13070 1010
1990 18075 45585 49505 4465 348M0 27830 21300 16415 10735 12265
855
270 5605 9870 5070 3455 2205 1315
970 745 430 805 145
1-19 237 178 93 72 60 45 44 43 38 62
144
21 223 611 727 737 729 721 669 568 451 209 370
ME N 52B88 194885 177925 16960 87 593
10 - 14 15 - 19 20 - 24 25 - 29 30 - 34 35 - 39 40 - 44 45 shy 49 50- 54 55 - 59 60 and over Unkncwn
53612 49802 42250 36120 31248 24026 19552 16048 14245 llq60 2862 1327
970 12565 31955 32935 29505 22720 18430 14670 12160 8405
10005 565
820 9135
26885 30455 27740 21575 17665 14065 11630 8C80 9395
480
150 3430 5C70 2480 1765 1145
765 605 530 325 610 85
155 273 159 75 60 50 42 41 44 39 61
850
18 252 756 912 944 946 943 914 854 703 349 426
W0 ME N 359622 120020 106095 13925 116 334
10- 14 15 - 19 20- 24 25 shy 29 30 - 34 35 shy 39 40 - 44 45 shy 49 50 - 54 55 shy 59 60 and over Unkmown
52813 56372 48529 38959 33998 26731 2)858 17249 159ED 12811 33921 1401
1290 11115 23500 21640 18605 14285 10715 7600 5000 2760 3065 445
1170 8940
18700 19050 16915 13225 10165 7235 4785 2655 2870 385
220 2175 4800 2590 1690 1060
550 365 215 105 195 60
93 196 204 120 91 74 51 48 43 38 64
135
24 197 484 555 547 534 514 441 313 215 90
318
-104-
TAME NO3
P01 IK( 10 YEARS (Page No 3)
01D AND OVER EY _1US OF EOONOMIC ACTIVIT AGE AND AREA 1980 CENSUS
SEX
Area sex age
and Total
Total
Population 10 Years Old and Over Economically Active Population
Unan- Unanploy-Enployed ployed ment Rate
Activity Rate
JURAL 564147 233555 219520 14035 60 414
10- 14 15- 19 20 - 24 25 - 29 3 - 34 35 - 39 40 - 44 45 shy 49 50- 54 55 - 59 60 and over Unknomn
12002) 84075 63688 53424 47911 40174 34846 29652 24659 20643 53554 1501
7180) 29270 35275 31150 23C85 23135 19825 16745 13170 10170 19110
48
6615 25440 31745 29185 26650 22340 19240 16305 12810 9875
18700 435
565 3850 3550 1965 1255
795 585 440 360 255 410 45
79 131 100 63 45 34 30 26 27 25 21 94
65 348 554 583 586 576 59 565 534 491 357 320
ME N 305517 201430 191535 9895 49 659
10 - 14 15 - 19 20 - 24 23 - 29 30 - 34 35 shy39 40- 44 45 shy49 50 shy 54 55 shy 59 60 and over Unknown
57804 45661 34072 28451 25995 21617 19029 16356 13610 11441 30647
834
5890 24-645 28590 25860 24175 20020 17470 14940 12020 9405
18045 380
5555 21980 26270 24535 23295 19390 17005 14590 11705 9190
17675 355
325 2665 2320 1325
880 640 465 350 315 215 370
25
55 108 81 51 36 32 27 23 26 23 20 66
102 540 839 909 930 926 918 913 8B3 822 589 456
W0 ME N 258630 32125 27985 4140 129 124
10 shy 14 15 - 19 20 - 24 25 shy 29 30 - 34 35 shy 39 40 - 44 45 shy 49 50- 54 55 - 59 60 and over Unknown
52216 38414 29616 24973 21916 18557 15817 13296 11049 9202
22907 667
1300 4625 6685 5290 3910 3115 2355 1805 1150 725
1065 10O
1060 3460 5475 4650 3535 2960 2235 1715 1105 685
1025 80
240 1165 1210
640 375 155 120 90 45 40 40 20
185 252 181 121 96 50 51 50 39 55 38
200
25 120 226 212 178 168 149 136 104 7 9 46
150
Source Tabulations of the National Population and Housing Census 20 Sampling available at the Population Departnent MIPPE
Table No 4
POFULATI(X 10 YEARS OLD AND OVER Bf STATUS OF ACTIVTY SEK LEVEL OF IN-SICTION AND AREA 190 CENSS
Population 20 Years Old and Over Area Sex and Level of Instruction Economically Active
Unem- Economic- Not
Total Total Employed Unen-
ployed ployment
Rate all
Inactive Speci-fled
Activity Rate
TOAL 1252587 548460 503540 44920 82 692067 12060 438 No education Incomplete Primary Completed Primary Incomplete Secondary Completed Secondary I to 3 years University 4 or more years University Unknown
117047 352613 299472 286136 100432 44017 39733 13137
46480 115895 144605 105630 68620 29890 33715 3635
44920 109230 132650 93770 59945 27520 32030 3475
1560 6665
11955 11860 8675 2360 1685
160
34 58 83
112 126 79 50 44
692s2 234093 153712 179366 31557 14(2 5988 3987
1285 2625 1155 1140
255 55 30
5515
397 329 483 369 683 679 849 27-7
ME N 634335 396315 369460 26855 68 231650 6370 625
No education Incomplete Primary Completed Primary Incomplete Secondary Capleted Secondary 1 to 3 years University 4 or more years University Unknown
5907 385599 153151 140447 45993 20453 22300 7305
42170 96560
110385 71050 36650 15065 19785 2650
40925 93510
102295 64335 32855 14000 18995 2545
1245 5050 8090 6715 3795 1065
790 105
30 51 7-3 94 104 71 40 40
16212 85624 42076 68802 9253 5343 2505 1855
705 1415
690 595 110 45 10
2800
714 531 721 506 797 737 887 363
W 0 M E N 628252 152145 134c0pound 28065 119 460417 5690 246
No education Incomplete Primary Completed Primary Incomplete Secondary Caupleted Secondary 1 to 3 years University 4 or more years University Unknown
57960 167014 146321 145689 54439 23564 17433 5832
4310 17335 34220 34580 31970 14815 1393
985
3995 15720 30355 29435 27090 13520 13035
930
315 1615 3865 5145 4880 1295
895 55
73 93 113 149 353 87 64 56
53070 148469 111636 110564 22324 8739 3483 2132
580 1210 465 545 145 20 20
2715
74 104 23-4 237 537 629 799 169
Table No 4
POJLAT (Page 2)
10 YEARS OLD AND OVER HI SMAMJS OF ACT MLEV OF INSTRUCTION AND AREA 1980 CENSUS
SEX
Populatian 10 Years Old and Over
Area Sec and Level of Thstmction EconomicaLly Active Unsm- Economio- Not
Total Total Employ5ed Unan-
plyed ployment
Rate ally
Inactive Speci-fied
Activity Rate
URBAN 688440 314905 254020 308 98 365790 7745 45-7 No education Incomplete Primary Completed Primary Incomplete Secondary Completed Secondary 1 to 3 years University 4 or more years University Unknown
25688 131471 152934 212748 81439 38406 36602 9152
7555 37350 71990 82745 55330 26300 31115 248
6950 33850 64915 73285 48675 24295 29670 2380
605 3500 7075 9460 6655 2005 1485
100
C0 9-4 98
11 4 120 76 48 40
17413 92746 80274
129033 25884 12056 5432 2952
720 1375
670 970 225 50 15
3720
294 264 471 389 679 685 851 271
ME N 32E818 194885 177925 16960 87 129963 3970 593 No education Incmplete Primary Ccmpleted Primary Incomplete Secondary Completed Secondary 1 to 3 years University 4 or more years University Unknown
10922 64029 71394
102438 36875 17796 20432 4932
5755 26415 47530 52975 29150 13195 18210 1655
5305 23995 43115 47840 2620 12270 17520 1600
450 2420 4415 5135 2870
925 690
55
78 92 9-3 97 98 70 38 3-3
4767 36894 23529 48983 7630 4561 2222 1377
400 720 335 480
95 40 0
1900
527 413 666 517 791 741 891 336
W0 ME N 359622 120020 16095 13925 116 235827 3775 334 No education Incomplete Primry Completed Primary Incomplete Secondary Cmpleted Secondary 1 to 3 years University4 or more years UniversityUnknown
14766 67442 81540
110310 44564 20610 16170 4220
1800 10935 24460 29770 26180 13105 12945
825
1645 9855
21800 25445 22395 12025 12150
780-
155 1080 2660 4325 3785 1CB0
795 45
86 99
109 14-5 144 82 61 54
12F46 55852 56745 80050 18254 7495 3210 1575
320 655 335 490 130
10 15
1820
122 162 300 270 587 636 801 195
Table No 4 POFULATICN 10 YEARS OLD AND OVER H1 STATUS OF ACTIVITY SM
LEVEL OF INSTUCTION AM AREA 1980 CENSUS (Page 3)
Population 20 Years Old and Over
Area Sex and Level of Instruction Economically Active Unem- Econamio- Not
Total Total plWed UnEM-
ploed ployment
Rate ally
Inactive Speci-fied
Activity Rate
JRAL 564147 233555 219520 14035 60 326277 4315 414 No education Incomplete Primary Completed Primary Incomplete Secondary Ccpleted Secondary 1 to 3 years University 4 or more years University Unknown
91359 221142 146538 73388 18993 5611 3131 3985
38925 78545 72615 228B5 13290 3590 2560 1155
37970 75390 67735 20485 11270 3225 2360 1095
955 3165 4890 24WX 2020
355 200 60
24 40 67
105 152 99 78 52
51869 141347 73438 50333 5673 2026
556 1035
565 1250
485 170 30
5 15
1795
426 355 496 312 700 638 818 290
M E N 305517 201430 191535 9895 49 101687 2400 659
No education Incomplete Primary Completed Primary Incomplete Secondary Completed Secondary 1 to 3 years University 4 or more years University Unknown
48165 121570 81757 38009 9128 2657 1868 2373
36415 72145 62855 18075 7500 1870 1575
995
35620 69515 5918M 16495 6575 1730 1475
945
795 2630 3675 1580
925 140 10D 50
22 36 58 87
123 75 63 50
11445 48750 18547 19819 1603
782 293 478
305 695 355 115
15 5
10 900
756 593 769 476 823 704 843 419
W 0 ME N 258630 32125 27965 4140 129 224590 1915 124 No education Incomplete Primary Completed Primary Incomplete Secondary Completed Secondary 1 to 3 years University 4 or more years University UnkMown
43194 99572 64781 35379 9875 2954 1263 1612
2510 6400 9760 4810 5790 1710
9E5 160
2350 5865 8555 3990 4695 1495 8B5 150
160 535
1205 820
1095 215 200 20
64 84 12-3 170 189 26 102 62
40424 92617 54891 30514 4070 1244 273 557
260 555 130
55 15 0 5
895
58 64 151 136 586 579 780 99
Roa-e gust- ons edegopueaticrof Mle wationab anti Housng CUensus - 20Sm pling available at the Population Dept MIUE
Table No- 5 EMMED POIATION 10 YEARS OF AGE AND OLDER 21 OCCUPATIC
SEX AND AREA 1990 CENSS
Occupation
TOTAL
Total
503540
Percentage
100
Number
369460
Men Percentage
1000
Women NTunber Percentage
134080 i000
Professionals technicians andrelated occupations 55095 109 27150 74 27945 208
Managers administrators and director-level officials 24245 48 19570 52 4875 36
Office workers and related occupations
Salesmen and related occupations
51495
33825
102
67
16780
22330
45
60
34715
11495
25-9
86 0o
Farming cattle-raising fishingand hunting
Conductors of means of transport and related occupations
Artisans and craftsmen
Other artisans and craftsmen
Workers and day-laborers
139400
24185
63605
2350
17570
278
48
126
25
35
135775
23930
57305
10790
15825
368
65
155
29
43
3625
255
630X
1560
1745
2-7
02
47
12
13
Workers in personal and relatedservices 73520 146 33430 91 40090 299
Workers in non-identifiable or undeclared occupations and otherworkers 8250 16 6775 18 1475 11
Occupation
URBAN
Professionals technicians andrelated occupations
Managers administrators anddirector-level officials
Office workers and related occupations
Salesmen and related occupations
Fanming cattle-raising fishingand hunting
Conductors of means of transport
and related occupations
Artisans and craftsmen
Other artisans and craftsmen
Workers and day-laborers
Workers in personal and related services
Workers in non-identifiable or undeclared occupations and otherworkers
WI
Total
254020
45925
20525
45265
24745
9710
168a5
42970
8330
10575
53275
5815
Table No 5 (Page 2)
PORIJLTI 10 YEARS AND OIDEROF AGE BY OCCUPATIC SEX AND AREA 1980 CENSJS
Men Percentage Niruber Percentage
10)O 177 925 1m00
162 22715 128
72 16080 90
15-9 14200 80
87 16070 90
34 9420 53
5-9 16670 94
151 38310 216
29 7150 40
37 9465 53
190 23175 130
20 467o 26
Women Nunber Percentg
106095 10X0
23210 219
4445 42
31065 292
8675 82
290 03
215 02
4660 44
1180 11
l1lO 10
3D100 234
1145 11
Table THo 5 E2PIYED POP LATK 10 YEARS OF AGE AND OLDER B OCCUPATION
SEX AND AREA 190 CENSUS
Occupation WomenTotal Percentage Nunber Men
Percentage Number Percetage
RURAL 219520 10O 191535 l0O 27985 100O
Professionals technicians andrelated occupations 9170 42 4435 23 4735 169
Managers administrators anddirector-level officials 3720 17 3290 17 430 15 Office workers and related
occupations 6230 28 2580 13 3650 130
Salesmen and related occupations 900 41 6260 3-3 2820 301
Faning cattle-raising fisdigand hunting 129690 592 226355 660 3335 119 Conductors of means of transport and related occupations 730 33 7260 38 40 01
Artisans and craftsmn 20635 94 18995 99 1640 59
Other artisans and craftsmen 4020 18 3640 19 380 14
Workers and da-laborers 6995 32 6360 33 635 23
Workers in personal and relatedservices 20245 92 10255 5-4 9990 357
Workers in non- identifiable or umdeclared occupaticns and otherworkers 2435 11 2105 11 330 12
Source Tabulations of the National Population mad I1sing Census - 20 Sampling available at the Population Dept MIPPENote Figures subject to change
TNbl Po b 11410712|IIMIrIO)N 10 14A4d011 1OWV 3 LIY UorE SJXW (k)
(EVIL OkIOF rIDION ANDWAl 191) CRJW3
PoplAtIo 10 O1 ami OvurI Yo
ArSampa no v(tywj ofj n
Total bbIo 125
125 to
249
2--24 to
M
620
over Nlhot
Sfwtldr
Avn~pio in D
Total 503540 15246 ly4 117011 2i 63A11 1146
I IzoMp1OW Primrn Copleted P ritmr Icplt Seonary Copleted alaxy 1 to 3 ya University 4 or morsyvas Universlty U n
443) 109230 13650 93770 59945 2153 32030 3475
25711 51645 50370 2110 4320
923 315
1015
643Y 25410 41325 35035 18210 65 IT11
BID
1 tt 8161
2075I 2255 20 140 142
675
Yj) 1150 2410 4M5 7090 4535
14725 30
lJtl 221165 17915 5515 2235
75 1015
56
743 1047 1434 2106 2985 3412 5911 1707
S 1065 9765 77 7 _ 1810
Noadwton Inmplta Priary Coptet Pay Inooaplet S cdry CoimletedSocaary I to 3 yemruUnlve oai n
402 93510
11295 64Yy V55 4000
21015 41405 3319) 11255 2365
50
6080 22315 32265 23505 9160 29L
1515 8A5
18615 213M 14565 7020
3)5 10Ij 2235 3970 53= 3105
11W a2530 15970 4225 135
410
786 12 1608 2256 3199 3685
4 or -ore YnaruIUoiveralty 1899 M2 79) 600 11345 660 7316 Ua M 2545 675 645 525 265 435 1915
V 0 M EV 13408) 416l 377B 39270 1715 745 1937
NOtuat m bn1late Prmry Cwplated Prim ry Inmxplt Seondary CroPleta 2acmary I to 3 years Unlversity 4 or mors yes University Urown
3995 1572)
055 2435
27C90 13X 130Y)
9
2750 10240
7180 8A5 1955
425 U5 340
30)3 8920 -550 9050 3590
95 245
70 655
2135 67AM
13435 770 82)
150
15 75
175
1710 1450 3380
65
85 1615 1945 122
M2) 5 5
130
530 71
1030 1778 M1O1 3203 4670 1536
S 0 5045 211 93535 12675 2357
No duaton Inzi letu IrPry Cjr1td Pn-ri
650 300 E4915
3360 132795 W In
2220 127a)
615 51)
14C)
120 60
I h
635 2105 315
100 1477 1711
r3nla 1-ra vnrS
S - i-Ij 4 r ro yet r-4
24
21 7
4
14 5C
1 0r502 _4c9
42tZ6 42j
1390
3YC
j7 925
Me
5U76 et2 2U27 1W ) 15 Z5 Z15
M E shy Q X16) 7 Z 40 135Y 2471
or
UccP irr Incplata 5c Capleta zaxiary 1 to 3 ywim Unlversiy 4 or more yrwra Unhaity Ur mc
526
43115 85J) 47t5 641 6an 1515 1270 35 5 1700
1600 240
25
111474 3110 7125 257 705 470
0 46)
1275 176K) 150 6 105 55O
450
565(
15t5 345 4O) 28 5
10640
5701575 2145 2250
M
10 610 f0)0
1 173 a56 1337
330 M5
7504 240
W0 XE 110 W65 31405 34450 7335 4140 2132
NO ad 1645nOplat Pr999b
CompletedPriry 21820 InLazplets iroxy 25445Copleted SexAax 22395 I to 3 dUniver ty 1254 or me yea University 12150
tlso v 7a)
1375 6335
1165 6965 147
37O 105 7
240 2410 6940
1023 7340 315 925 210
55 50
1745 6360
1292A 6460 7545
M
15 40
110 5
16) 11 391
65
130 53)
1010 100
660 360153 315 95jm9
611 811
1135 1868 113 3245 4T16 163
rraAME 219520 4 44M 23540 3U 5005 169
lNo ttO) Incnplcte Priary Ca etadPrimary Inomplete Samdrj Cpleted eom ry
Sto3 years University 4 or mrs yoors Ivdwrnty Urkn
37970 75= 6735 2485 1270 3225 260
39
24053 3841 29815 6740 133)
w1O 40
500
4215 1269) 1575 670 3745 875 145 210
970 3670 660 4225 410 1735 1260
9
25)530 7b 45 592 332 825
5
12150 200) 146 2215
695 10 90 290
675 E22
1117 1656 l51
M51 1006
ME 91535 84245 30) 150) 25 47070 1055
Noeucaation cnomplt Prmay
CompletedPr1izry InoocrpletaSeoonrky Cae1tad Secondary I to) yearmUnivrsity 4 or mrs yosrs University Ur n
563 69515 5912 16493 6575
175) 475
945
18860 34505 24600
4T50 450 115 5)
435
410 l7 13795 539)5 20O
410 0
M
955 3555 62T) 3710 2715
895 605 75
M 45 670 545 510 20 705
5
145 189513EZ 197
465 50 50
255
695 854
1159 171 2628 375 5959 936
VOMEN 79 13175 637 4740 31 1160
No education Inrarplot PrLary Ca~pletad Prtomry Inila0te Sooondary Cotplae Searcniary I to 3yrsUivrsity 4 or imm yearn University trkr3 I
2350 5965 8555 399 4695 1495 85 150
1545 3905 5215 1690 480)
65 10 6j
115 (65
1920 1325 1710
465 60 51
15-115 390 515
2195 WO0 655
Y5 Y5 40 8) 70 120
-
675 1124
935 220 Z50 55 40 35
474 937 833
1247 M3
2913 4048 1125
- N141ble or zero 33AM Tallatircm of U Natlcal Pomoittra M tHard- r- 16 -i
TAELE NO 7 AVERAGE WY INCOME FOR E TWYED POPJLATION TEN YEARS OF AGE
AND OLDER 1Y SEX CATEDORY OF EXPIYDM AND AREA 1960 CENSU (In Balboas)
SEX Field of Occupation Total MM Wanenand Area Ni~nber Average Number Average Number Average
TO AL 503540 1000 1846 369460 1000 1810 134080 1000 1937
Employees 347245 690 227805 617 1194AO 890
Part-time 82260 163 60850 165 21410 159
Government Workers 15210 30 1518 10990 30 1572 4220 31Private Enterprise 63035 1323125 1032 46495 126 1137 16540 123 673 Cooperatives or Camshymunal Organizations 1195 02 938 1075 03 956 120 01Canal Agency 2820 C6 3412 2290
719 06 3813 530 04 2015
Permanent 264985 527 166955 452 9B030 731
Government Workers 103555 206 2940 59520 161 2948 44035 328 2932Private Enterprise 1476o5 293 201 96145 260 2180 51460 384 1696 Cooperatives or Ccashymnal Organizations 1355 03 1573 1040 03 1619 315 02 1450Canal Agency 12470 25 5343 10250 28 5361 2220 17 5222
Self-Enployed L13220 235 732 1Mf795 294 738 9425 70 676
Employers or Proprietors 9085 18 2625 7795 21 276-8 1290 10 2102 Production Cooperatives orCammnnl Organizations 2020 04 735 1915 05 730 105 01 I00O
Fand-l Workers 19720 3-9 457 38035 49 453 1685 13 507 Unmnown 7250 14 741 5115 14 776 2135 16 870
TABLE NO 7AVERAGE MXff INCOME FOR EMPLOYED P0FLATION TEN YEARS OF AGE
AND QMDD BY SEX CATEDORY OF EIUPDINT AND AREA 19e0 CENSUS
(In Balboas)Page 2
Field of Occupation and Area Number
Total Average Number
Men SEX
Average Number Women
Average
Urban 284020 100O 2357 177925 1000 2471 106095 irnO 2132 Employees 245160 146705 96455
Part-time 42860 27510 15350
Government Workers Private Enterprise
8590 31700
30 112
1791 1288
5350 20110
30 113
1982 1544
3240 11590
31 109
1461 747
Cooperatives or CamshymInal Organizations Canal Agency
320 2250
01 08
1214 3672
270 1780
02 10
1250 4CS3
50 470
00 04
1MO3 2125
Permanent 2023 ) 119195 83105
Government Workers Private Enterprise
79520 111175
280 391
3113 2223
42930 66940
241 376
3207 2442
36590 44235
345 417
3018 1766
Cooperatives or Cmshymunal Organizations Canal Agency
695 10910
03 38
2055 5428
500 8825
03 50
2200 5447
195 2Ce5
02 20
1667 5317
Self-Bnployed 2B845 102 1430 23895 134 1573 4950 47 921
Employers or Proprietors
Production Cooperatives orCamunal Organizations
4845
400
17
01
4068
1583
3900
360
22
02
4580
1611
945
40
09
00
2406
1188
Family Workers 895 03 764 5835 03 685 300 03 950
Unknown 3885 14 1359 2480 14 1444 1405 13 1250
TABLE NO 7 AVERA MOTHL INCOME FOR DT-TOYED POPULATION TEN YEARS OF AGE
AND OLDER E SEX CATErOfI OF E1TLOYMT AND AREA 199 CEJS
(In Balboas)P8ae 3 SEX Field of Occupation
and Area Number Total
Average uimber Men
Average Number Women
Average
Rural 219520 1O00 1069 191535 1000 1056 27985 1000 1160
Employees 102C65 81100 20965
Part-time 39400 33340 6060
Government Workers Private Enterprise
6620 31335
30 143
1206 863
5640 26385
29 138
1220 917
930 4950
35 177
1158 546
Cooperatives or Ccmshymnal Organizations Canal Agency
875 570
04 03
817 2362
805 510
04 03
844 2500
70 60
03 02
542 1063
Penanent 62685 47760 14925
Government Woikers Private Enterprise
24035 36430
110 166
2400 1533
16590 29205
87 153
2359 1625
7445 7225
266 258
2509 1064
Cooperatives or Comshymunal Organizations Canal Agency
660 1560
03 07
1244 4813
540 1425
03 07
1170 4889
120 135
04 05
1M83 2125
Self-Employed 89375 407 601 84900 443 606 4475 160 535
Emloyers or Proprietors 4240 19 1392 3895 20 1408 345 12 1318 Productimn Cooperatives orCcmmual Organizations 1620 07 641 1555 08 644 65 02 559
Family Workers 18835 86 443 17450 91 445 1385 50 407
Unknown 3365 15 520 2635 14 538 730 26 45-4
Source Tabulations of the National Population and Housing Census - 2 SamplingStatistics and Census Breau Controller General of the RepubLic
-115-
ANNEX NO 3
FAMILY FORM FOR EIGHTH NATIONAL POPULATION
AND FOURTH HOUSING CENSUS
-116-Republic of Panama Controller General Bureau of Statistics
and Census
THE INFORMATION REQUESTED IS CONFIDENTIAL
Decree-Law No 7 of February 251960
iorm No
EIGHTH NATIONAL POPULATION AND FOURTH DOUSING CENSUSES
May i 1980
FAMILY F-ORM
FOR OFFICE USE
Region Segment Form Populated Block No No No Area No
I LOCATION OF HOUSING
i Segment No FOR CITIES OF PANAMA AND 2 Province -------- COLON ALSO INDICATE 3 District 4 Office 9 Block No-------shy5 Populated Area 6 Street or Avenue (number or name) 7 Number or name of building or dwelling 8 Room or Apartment No
II HOUSING INFORMATION
1 Type of Housing
Individual Home
Permanent 1 Sepi-Permanent 2 Makeshift 3
Apartment 4 Room in Home 5 Space rot intended for housing but used as such 6 Collective Housing 7
-117-
CONDITION O- DOUSING 7 BASIC FLOOR COVERING IN TIE HOUSE
Presently occupied 1 Occupants absent (closed) 2 Paved (concrete tiles
Unoccupied brick etc)
Rented 3 Wood
For Sale 4 Earth
Under Repair 5 Other
Summer Home 6
Other reason 7
------------------------------- 8 DRINKING WATER SUPPLY Public or private Water-Supply
ANSWER QUESTIONS 3 THROUGH 14 ONLY FOR Inside connection
OCCUPIED HOUSING CLASSIFIED AS 1 2 3 Public IDAAN Watershy
4 OR 5 IN QUESTION 1 TYPE OF HOUSING supply line ---------------------------------- -Public community line
Private supply line
3 ROOMS IN THIS HOUSE Outside connection
Public IDAAN supply line
How many rooms does it have Public community line Private supply line
Of these how many are bedrooms Septic Tank
Is there an area specifically for Public cooking Private
Yes 1 No 2 Open well C
Rain water i(
4 OWNERSIP Natural well 13 River or creek
Clear Title 1 Mortgage 2 B
Monthly Mortgage 9 SANITARY FACILITIES
Rented 3 BI
Monthly Rent Private
Transferred 4 Connected to sewerage 3
Condemned 5 Connected to septic tank
Hole or latrine
5 PRINCIPAL MATERIAL OF OUTSIDE WALLS OF BUILDING OR HOME Communal
Connected to sewerage d
Block brick stone concrete 1 Connected to septic tank
Fiber-cement wood (panels logs Hole or latrine
etc) 2 No sanitary facilities
Clay-cane adobe 3 Straw plant-leaf cane sticks 4
Other materials or no walls 5 10 BATHROOMS
Private
6 BASIC MATERIAL OF ROOM OF With water from supply
BUILDING OR TOIEE line
Cement 1 With water from other
Tile 2 sources
Fiber-cement 3 Communal
Metal (zinc aluminum etc) 4 With water from supply
Covered wood 5 line
Straw or plant-leaf 6 With water from other
Other 7 sources No bathroom
-118shy
-3-
II LIGHTING
Electric lighting From IRIIE 1 From private source 2
C iec type lighting Gas 3 Kerosene 4 Other 5
12 COOKING FUEL
Electricity 1 Gas 2 Kerosene 3 Carbon 4 Wood 5 No Kitchen pound
13 APPLIA NCES
Television Yes 1 No 2 Radio Yes 1 No 2 Telephone Yes 1 No 2 Refrigerator Yes I No 2 Washing achineYes 1 No 2 Sewing Machine Yes 1 No 2
14-WAS THIS 11OUSE BUILT BETWEEN 1970 AND 1980
Yes No Dont Know
If yes indicate the year
FOR OFFICE USEOBSERVATIONS ON THE HOUSING
Total lien
Women
III POPULATION DATA (IF MORE TH1AN 7 PERSONS IN HOUSE CONTINUE ON ANOTHER FORM)
A GENERAL CHARACTERISTICS PERSON 1 PERSON 2 PERSON 3
L NAME (FIRST amp LAST) Start with head of household Do not forget to include newborn children and elderly persons
2 RELATIONSHIP WITH HEAD OF HOUSEHOLD Spouse of Head t Son Mark the appropriate box Head 1 (Daughter)
Son (Daughter) 3
Other relation Specify
No Relation Specify
3 SEX Mark the appropriate box Male 1
Female 2
L hOW OLD For children under one year mark the appropriate Years box If age is unknown ask the person to estimate it Years Less than 1 year
5 WHAT IS YOUR PRESENT ARITAL STATUS Mark the appropriate box For persons United 1 under 15 uze box 8 CO1lON LAW (UNITED) For those living Single 2 in marital union without being married SINGLE Never married or living together Married 3 MARRIED Those having entered into the state of legal matrimony and living in Divorced 4 such civil status DIVORCED Persons legally separated and not remarried Widowed 5 nor living in marital union WIDOWTED Person whose spouse is deceased and Separated has not remarried nor is united SEPARATED A person separated from Marriage 6 his (her) spouse Union 7
6 IIHERE BORN Here Mark here if you were born in the same populated area or settlement of the census If born in another populated area or settle- (populated area) ment indicate the nare of the place the Office and District to which it belongs (office) (corrcgimiento) If born abroad indicate the country
(district)
(other country)
-120shy
-4shy
7 WOW LONG HLVE YOU LIVED Always ) G IN TilS POPULATED AREA OR
SETTLEMENT This refers to Visiting ) the populated area or settle- )t ment of the census Mark the In Iransit)
appropriate box Note the
month and year when no boxes 9
are marked
Since 19
(month) (year)
8 WHERE DID YOU LIVE BEFORE COMING
TO THIS POPULATED AREA OR SETTLEMENT (populated area)
Put the informants reply in the (office)corresponding space
(district)
(other country)
9 IS YOUR MOTHER LIVING Yes I No 2
Mark the appropriate box Dont know 3
B - EDUCATIONAL-tACKGROUND
10 WHAT WAS THE HIGHEST GRADE-OR SCHOOL YEAR Primary 1
COMPLETED DURING REGULAR SCHOOLING Secondary 2 University 3
Indicate the number in the corresponding No grade 04
box or mark an X in the box No Grade
11 CAN YOU READ AND WARITE Yes 1 No 2
Do not answer this question if you have
finished at least the third grade and
mark the Yes box
12 WHAT DIPLOMA CERTIFICATE OR TITLE DO
YOU HAVE (title) (degree)
Answer as appropriate If you have various
degrees (titles) indicate the highest (school)ranking one
None _
-5shy
13 ARE YOU IN SCHOOL NOW Primary 1
Indicate the grade or year in the appropriate box If you are in a non-regular type of school or are not in school mark an X in the appropriate box
Secundary
University
Pre-School or Kindergarten
2
3
4
Other 5
Not in school 6
14
C ECONOMIC CHARACTERISTICS
14 DID YOU WORK OR WERE EHFPLOYED LAST WEEK Mark the appropriate
YOU GAINFULLY
box Go
Yes 1 to 17
No Go to
2 15
15 WERE
Mark
YOU
the
LOOKING FOR
appropriate
WORK
box
LAST WEEK Yes Go to
1 17
No Go to
2 16
16 WHY WERE YOU NOT LOOKING FOR WORK LAST WEEK
Mark the corresponding box
Do occasional odd-jobs 1 Have been looking for
3 months 2
Have looked before and awaiting news 3
Impossible to find work 4
) ) )
)
)
G o
t
o
17
Housewife Student Invalid Retired Run boarding house
rent rooms Pensionee
5 6 7 8
9 10
) t
25
Other condition X
17 WHAT OCCUPATION TRADE OR TYPE OF WORK DID YOU DO LAST WEEK OR THE LAST TIME YOU WORKED Example auto mechanic furniture carpenter dentist For those who have never worked mark the box new
worker and go to question 25 -New
-(occupation)
Worker
I
-6- -122shy
18 PRESENT OR LAST EMPLOYMENT
Example Sun Supeumarket Rita
Industries The Grange Ranch (Name of Firm or Company)
for a family on the street etc
19 WHAT IS THE NATURE OF THIS BUSINESS OR FIRMESTABLISMENT
Example food sales haberdashery For those who work on a farm on the
(Principal Activity)street for a family draw a line I I I II
20 PRESENTLY WORK OR WORKED IN LAST EmployeePOSITION AS
Government 1
box Private Firm 2Mark appropriate Canal Zone Agency 3 Cooperative or 4
communal organization Self-employed 5 Proprietor (owner) 6
Partner in a production cooperative or communal organization 7
Domestic 8
21 ARE YOU PRESENTLY EMPLOYED FUIL Full 1 Part-timeOR PART TIKE
22 IN WHAT POPULATED AREA OR SETTLEMENT Here IS YOUR WORK LOCATED Other
(For all employed persons)
Place Office District
Other country
23 HOW MANY HOURS DID YOU WORK LAST IEEK _ (For all employed persons) Hlours worked _
Note the informants reply
B24 WHAT IS YOUR PRESENT SALARY OR WAGE 1 Per hIur 2 Per day B(Only for employed persons) 3 Per week B
4 Per Month BNote the informants reply 9 Commission B
YOUR TOTAL CASH INCO1ME LAST MONTH Bl---------shy25 WHAT WAS Include Salary or wage income from your
business or enterprises sale of farming
and livestock products lottery winnings
betting pensions retirement scholarships No incomerental income etc
2
-7-
D FERTILITY AND MORTALITY (FOR WOE1N 15 AND OLDER)
26 HOW HAD
MANY THAT
CHILDREN HAVE YOU WERE BORN ALIVE
Total Sons (Daughters)
I I__
For women who have not had children mark the box None and go to question 30
None
27 OF THESEHOW MANY ARE LIVING PRESENTLY Indicate the informants reply
Total Sons
(Daughters)
I
28 1WHAT WAS THE BIRTH DATE OF YOUR LAST CHILD BORN ALIVE Indicate the informants reply (day) (month) (year)
29 IS YOUR LAST SON OR DAUGHTER PRESENTLY LIVING Check the appropriate box
Yes l No 2
E PHYSICAL OR MENTAL DISABILITY (FOR PERSONS UP TO 40 YEARS OF AGE)
30 DO YOU HAVE ANY PHYSICAL MENTAL DISABILITY RESULTING
FROM BIRTH OR OTHER CAUSES
From Birth
Blind
Deaf amp Dumb 1 Mentally Retarded
Invalid No Disability
3 5 7
I__ 9
Other Causes
7--T-1 -shy
2
4 6 8
Indicate your name and the date when the interview is over
(Name of Census Taker) Date
-124-
IMPORTANT
No Person Should Fail to Be Counted
No Person Should Be Counted Twice
To achieve this objective it is important that the Census Taker follow the instruc-tions below
FIRST Write the name of each person that should be registered in the housing unit starting with the Head of the Family in accordance with the following rules COUNT every person whether or not they are family members that slept in the house on the night of May 10-11 Always begin with the name of the Head of the Family and continue in the following order The Head of the Familys spouse children in order of age from eldest to youngest other relatives and finally other persons not related to the Head of the Family If a name has not yet been given to a recently born child write newly-born in the space that corresponds to his first and last names COUNT all persons living in the house even if they did not sleepthere if they spent the night elsewhere for work-related reasons for example the night porter who was guarding the building project the driver who spent the night transporting passengers cattle or merchandise the druggist who worked the night shift etc COUNT all persons living in the house even if they did not spend the night there if they were at a dance a wake or if they were out hunting fishing or attending to other special occasions DOT NOT COUNT people living in the house if they spent the night of May 10-11 in another home a hotel or boarding house nor sick members of the house in hospital in jail etc since such persons will be counted by another census taker wherever they are VERIFY that all infants under one-year of age and all elderly persons have been counted since there is a tendency to omit them particushylarly newly-born children
THEN Obtain the remaining information in columnar form that is first obtain data from the Head of the Family then the second person and so on
POPULATION OBSERVATIONS
-125-
ANNEX NO 4
COMMENTS ON 1980 CENSUS PROCEDURES AND EVALUATIONS
The VIII National Population and IV Housing Census was a de facto
Census and as such in practically one day May 11 1980 counted all those
people present in the national territorial and maritime jurisdictions dependshy
ing on where they were at the time of the census Theoretically such time
was midnight May 10-11 This type of counting is similar to the last four
censuses taken but unlike those of 1911 1920 and 1930 which were de jure
censuses
In order to have advance knowledge of the census results a 20
sampling was taken of the population counted The 1980 census data in the
present report is taken from this sampling
A standard error table for the selected sampling provides an estimate
of 5000 housing units with a standard error of 140 and 280000 units with a
standard error of 511
In order to appraise the scope of the census in early 1983 a team of
technicians from various government offices worked for several months in
applying new methodologies to project the population to a provincial level by
sex and fi--year age groups
In Panama as in most Latin American countries this appraisal has
been performed at various historical census times through post-census surveys
or indirect methods only at the national level
At the provincial level the following indicators were used to build
the census omission index by province for the 1970 and 1980 censuses
-126-
TABLE NO 1
STANDARD ERRORS FOR ALL OCUPIED HOUSING UNITS ESTIMATES BASED ON THE 1980 POPULATION AND
HOUSING CENSUS SAMPLING
Estimated Total of Standard Estimated Total of Standard Occupied Housing Error Occupied Housing Error
Units Units
400 40 55000 432 500 45 60000 448
1000 63 80000 500 5000 140 10O00 0 539 1000 197 120000 568
15000 240 140000 - 587 20000 275 160000 599 25000 305 200000 601 30000 332 220000 591 35000o 356 240000 573 40000 377 260000 547 45000 397 280000 511 50000 415
Source Statistics and Census Bureau - Controller General of the Republic
1 Percentage of Indian population by province
2 Dispersion of the population
3 Degree of urbanization
4 Estimated omission for the 0-4 year population in the 1980 Census
5 Difference in enrollment coverage in basic education according to
the population counted and the estimated coverage (6 to 12 years)
The following table provides the 1980 census omission for the country
and by province
Table No 2
ESMAT OF CaJS OMISSIS Bf PROWINCE 19 O
Omision Estimated PopulationPopulation Estimate Estimated Population Omission and Reconciled with theCounted at according to reconciled with the according to Estimate at theProvince 1-7-80 Index national level Index National Level
TOTAL 1794358 i917020 1920406 6-4 66 Bocas del Toro 52550 59150 61694 111 148 Cocl1 240860 149990 147220 61 43 Colon 157970 168210 170943 61 76 Chiriqui 287170 308820 310755 70 76 Darien 26300 30C80 31220 J26 158
Herrera 8200 87310 9290290 61 Los Santos 70239 75540 79144 70 112 Panama 804099 847930 840632 52 44 Veraguas 173170 189990 1-88508 89 81
Source Popilation Department of Social Planning Division of IPE
1
bull-128-
BIBLIOGRAPHY
Documents that were consulted in the preparation of the study Socio-Economic Survey of Women in Panama 1980
Coitroller Ganeral of the Republic
Ministry of Plamning and Economic Policy (MIPPE)
Ministry of Health
- Panama in Figures Years 1970 to 1980
- Opirion Survey on the Panamanian Woman 1975
- National Demographic Survey for Panama Years 1975-1976
- National Population and Housing Censuses 1980
- Strategy for National Developshyment 1970-1980
- National Development Plan 1976-1980
- An Employment Policy throughA Plan of Urgency MIPPEMITRAB (Ministry of Labor) 1980
- The Reduction of Fertility in Panama Hildebrando Araica Working Document 1980
- Bases for Panamas Economic and SocialDevelopment Working Document 1981
- Situation and Perspectives of Elderly Population in Panama 1981
- Socio-Economic Survey of the Metzopolitan Region 1981
- Demographic Aspects of Populashytion and the Family 1982
-A Decade of Social Developmentin Panama 1983
Survey on the Prevalence and Use of Contraceptives 1980
-129-
United Nations World Action Plan United Nations Decade of the Woman 1975
- Female Labor Participation and Differences in Remuneration by Sex in Latin America PREALC ILO 1981
- Labor Market in Figures 1950shy1980 PREALCILO 1982
- Three Decades of Social Change in Latin America Bulletin 374 February-March 1983 ECLA
Inter-American Old-Age Federation
- Ageing International Vol IX No 3 1982 Information Bulletin
Agency for International Development (AID) and Data Use and Access Laboratories
- Guidelines for the Preparation of Census Reports on the Status of Women and their Role in National Development 1980
-- - - - - - - - - -- - - - -----------------------------
Broadcast Premiere WETA-26 PBS Washington DC September 1983
LIBERATION THEOLOGY ITS IMPACT is an in-depth look at theorigins development context and oethical deliberations theproponents and critics of liberation theology Although focused on Latin America the program also explores a parallel traditionin the Afro-American religious experience This hr color program i s ideal for 5eminar classroom community discussionand broadcast It is a lively mix of interviews news footagesl ides photos and musi Among those interviewed are RevErnesto Cardenal Nicaraguan Minister of Culture Dr RenaKarefa-Smart Howard University Professor of Ethics Dr RobertMcAfce Brown author and Dean of Pacific School of ReligionFunded by DC Commonity Humanities Council New York Conci Ifor the Humanities and Intermedia--National Council of Churches
-------To order fill out the following and mail to Tresamericas Productions 3206 Wisconsin Ave NW29 Washington DC 20016 Make checks payable to Tresamericas Prepaid orders onlyPlease call or write concerning previews (202) 36-3041
NAME ORGANIZATION
STREET PHONE
CITYSTATEZIP $ AMOUNT ENCLOSED
Please indicate format desired Beta Max VIIS
Rental $80 Purchase $320 (video)
34 inch_ 16mm (available after Oct 84)
$460 (film) Rental by Non-Profit Group
$35 + postage

REPUBLIC OF PANA1MA
SOCIOECONOMIC SURVEY OF WOMEN IN PANAMA
1980
ANA HERNANDEZ DE PITTI
PANAMA JULY 1983
I wish to express my gratitude to the Statistics and Census Bureau of the Comptroller General of the Republic for providing access to the statisshytical information of the 1980 Census (20 sampling) Special thanks to my colleagues in the Division of Social Planning of the Ministry of Planning and Economic Policy who offered their support in the various phases of this report
The Author
Index
Page No COUNTRY PRESENTATION
INTRODUCTION i - iii
CHAPTER
I DEMOGRAPHIC CHARACTERISTICS 1
A General Aspects
B The Female Population 16
II EDUCATIONe 30
A General Aspects 30
B Education in Panama and the Female Population 36
Literacy and Illiteracy 37
Participation in Enrollment 38
Level of Instruction 42
III THE PARTICIPATION OF WOMEN IN ECONOMIC LIFE 50
A General Aspects 50
B The Panamanian Woman in the Economically
52Active Population
1 Employed Women 56
2 Unemployment and Women 59
C Female Participation by Field of Activity 63
D Occupations of Women in Panama 69
E Occupation Level of Instruction and Income 72
F Women and Categories of Employment 79
G The Economically Inactive Woman 83
87FINAL COMMENTS
ANNEXES
I Certain Legal Provisos that affect Female Labor 0 91
2 Statistical Annex 0 95
3 Family Form from the Eighth National Population Census and Fourth Housing Census 115
4 Some Notes on 1980 Census Procedures andEvaluations 125
BIBLIOGRAPHY o 128
MAP
PANAMA PLANNING REGIONS
bull -
9 -
-
BAHIA D ~ M
0 ~ ~ ~~d8 --
Prepared by PopuLation Dept - MIPPE
-~~~ CNE~ T R AL
M E T R 0 P 0 L I T AN
WE S T ER N
INTRODUCTION
In Panamanian society as in most countries important transformations
have occurred which have placed growing responsibilities on its members
Women who traditionally had many obligations intrinsic to their role as
mothers and providers of care in the home have seen this role evolve in resshy
ponse to changes in the countrys social political and economic orders
It is recognized that the situation of women has progressively improved
education and access to various levels of training have been decisive elements
in this change We cannot yet affirm however in view of certain persistent
situations that Panamanian women enjoy equality of conditions with men We
also accept that this reality is not exclusive to Panama but that it also
occurs in most countries throughout the world This recognition led the United
Nations to proclaim 1975 as The International Year of the Woman with the aim
of defining a society in which women participate truly and fully in economic
social and political life and preparing strategies for this society to
evolve
Since 1975 a series of international fora and statements have reaffirmed
womens right to work to receive equal remuneration as men for the same jobs
to benefit from equal conditions and opportunities for career advancement as
well as all other rights necessary for fulfilment in every walk of life in
their countries
That same year at the conference held in Mexico and which was the years
major event it was declared that discrimination against women is incompashy
tible with human ignity and with the well-being of the family and society and
prevents the participation of women in the political social economic and
cultural life of their countries under conditions of equality with men
-ii-
One of the most important legacies of The International Year of the Woman
was the approval of the World Action Plan which set forth a series of importshy
ant objectives and minimum targets to guide countries in planning actions and
designing programs for the benefit of their peoples This document which
directs the actions of countries throughout the decade states that adequate
information and data are indispensable to formulate policies modify attitudes
and introduce basic economic and social changes
In effect national planning activities continually require accurate and
timely statistics and at different levels of disaggregation in order to preshy
pare reports and diagnostics organize projects and take decisions leading to
transformations needed to achieve the well-being of the people
New orientations in the field of development at the international
regional and national levels give priority attention to those groups that have
been on the fringes of socio-economic change Based on the above it is impershy
ative that information gathered and processed in the different countries be
disaggregated by geographic area economic region age group sex and so
forth
Although considerable advances have been made in many countries includshy
ing Panama in gathering and processing census data this information is still
limited as concerns a precise knowledge of certain characteristics chiefly
related to the female population Among the most common are those that refer
to their participation in economic activity and which contain different
levels of sub-indicators This can be explained among other things by the
very patterns of female work and the design gathering and processing of
information activities where sexual prejudices occur A rather generalized
situation seems to be the inadequate classification of women as housewives
excluding them from statistics on labor force participation when they work in
-iiishy
traditional sectors of the economy which are considered extensions of the
home particularly in the case of rural workers
The present report Socio-Economic Survey of Women in Panama - 1980 is
the contribution of the Census Data on Women project an effort in which
various countries participated and which has been supported by Data Use and
Access Laboratories the US Agency for International Development and Data
for Development the latter an international association of volunteers which
promotes the use of data in the development process The objectives of the
project are to offer information on women based on censuses taken in various
countries at the beginning of the 1980s This research work has been based
primprily on data from the latest Population and Housing Census taken in
Panama in May 1980
Despite its limitations we consider this work of great utility since in
a very general manner it examines certain data available at the time of the
last census (20 sampling) in order to provide an overview of the socioshy
economic situation of Panamanian women
We hope that this modest effort will be useful to persons interested in
knowing the situation of women in Panama and also serve to motivate other reshy
searchers so that they will further analyze situations which are treated here
in summary fashion
COUNTRY PRESENTATION
Panama is one of the six republics that make up the isthmus of Central
America and territorially one of the smallest countries in the Americas It
has an area of 77082 km2 and according to the latest Census (May 11 1980)
a population of 1824796 with a density of 237 inhabitants per square kiloshy
meter To the North it borders on the Caribbean to the South the Pacific
Ocean to the East the Republic of Colombia and to the West the Republic of
Costa Rica Its political-administrative structure identifies nine provinces
65 districts or municipalities one Indian Reserve and 505 elector-l wards
The capital of the country is Panama located on the Pacific which at
the time of the latest census registration had about 600000 inhabitants
Other important urban centers in the country are the cities of Colon David
Chitr and Santiago
Panama began its life as an independent Republic on November 3 1903 For
eight decades the country has endeavored to gradually improve the well-being
of its citizens however like its other Latin American neighbors it contishy
nues to face the many problems inherent to its status as a developing country
MA P Nl
Boo FLORIDA (EUA)
GuLf of Mexico
AtLantic Ocean
HAITIA PUERTOEXIO EMJCO R
GUATEMALA HONDU RAS
EL SALVADOR NICARAGUA
CO TA770 0924 0pound511TDOST
PANAM303o0H oI CS( L O C
8deg PA tl of
0n
_M70 12 04 VENEZUELA ~ LATfTUD NORTE[ -
Pacific Ocean
C O0MBI
SECUADOR
P AN A MA I N T HE AME RI C AS (LOC A T 10N
I DEMOGRAPHIC CHARACTERISTICS
A General Aspects
Demographic data have a basic importance in the overall planning of a
countrys development particularly when oriented towards improving the
quality of life of its inhabitants through the provision of basic services to
the population especially in the fields of health employment housing and
education
While numerical indexes do not allow precise answers to the crucial
question of how a nations needs and aspirations are being satisfied they do
however provide some criteria for appreciation which are useful in estimating
the magnitude of certain problems and in guiding policy design
Panama has an excellent census tradition during its years as an
independent republic various censuses have been taken of which eight were
National Population Censuses The first was in 1911 while the others were in
years ending in zero the latest was taken on May 11 1980
The Republic of Panama had a total population of 1824796 inhabishy
tants according to the 20 sampling of the May 1980 Population Census This is
a 4435 increase over the figure for the first census taken in the country in
1911 (336742 inhabitants) that is in seven decades the population of the
national territory has more than quadrupled From Table 1 it can be seen that
the growth rate has varied throughout Panamas demographic evolution Between
1911 and 1950 a period of four decades the population doubled then doubled
again in less than three decades Figure 1 illustrates this growth
1 General Direction of Planning and Administration Office of the President Strategy for National Development 1970-80
-2-
TABLE 1 POPULATION OF THE REPUBLIC OF PANAMA
1911 TO 1980 CENSUSES
Annual Growth Year Total Rate (per 100 inshy
habitants) I
Population
1911 336742
317 1920 446098
047 1930 467459
276 1940 622576
256 1950 805285
2-94 1960 1075541
3o6 1970 1428082
18247961980 a 248
1 The exponential growth formula was used i Figures derived from a Sampling of the National Population Census
Source Statistics and Census Bureau Comptroller General of the Republic of Panama Panama in Figures Years 1976 to 1980
On the other hand there is no homogeneity in the growth rates of the
various political-administrative divisions that make up the Republic (see
Table 2) while some provinces particulprly the province of Panama have
shown relatively high rates others register the opposite case as clearly
illustrated by the province of Los Santos which presents very low and even
negative growth rates (see period 1970-1980) In this unequal distribution of
the population a very important role is played by the rural-urban migratory
flow which caused a rapid process of urbanization Three decades ago 64 of
the total population lived in rural areas while in 1980 this figure had
declined to51
FIGURE 1
POPULATION GROWTH IN THE REPUBLIC OF PANAMA Thousand Inhabitants 1911 TO 1980 CENSUSES AND
3000- PPnjFfTIONS TO YEAR 2000
28932812700
2180898 shy210 0 - ID
9e
800 - 1824796 V
1500shy
1428082
1200
1075541
00 - 467454
X 1911 1920 1930 1940 l9 -o1960 1970 1980 1985 1990 2000
CesC BEaCENS USES PreliSnr P R 0 J E C T 1 0 N SP O E TOSource Statistics and Census Bureau X-PreliminaryPrepared by MIPPE -Division of Social Planning Figures
POUFJI-TICn GROWIH TABLE 2
IN PANAMA B PVNCE 1911 - 1 W8
Year Total del
Toro Cocle Colon Chiriui Irien Herrera Loa Sartcle Panama Voraguas
Population 1911 -336742 1920 1099 1930 467459 1940 622578 1950 805285 1960 1075541 1970 I A1308 1983 a I 24796
AnqIal Groth Rate I per 100 inhabitantashy
22732 27239 15851 15523 22392 32600 43531 52416
35011 45151 48244 55737 73103 93156
118003 140524
32092 53250 57161 78119 90144
105416 134286 165622
63364 76470 76918
111206 138136 188350 236154 286418
8992 10728 13391 14930 14660 19715 22685 26247
23007 28984 31030 38118 50095 61672 72549 81 76
30075 3463B 41218 49621 61422 715-4 7238D 70272
61855 99035
114103 17332B 248335 372393 579 65 828553
59614 66603 69543 84994
106998 131695 151849 17286
1911 i92
1930 1940 o
i950
1970
199 )
317
047
276
256
294
306
248
203
-557
039
302
383
312
187
286
066
138
269
245
254
176
685
-019
301
141
15S
260
222
211
006
356
215
315
243
195
199
225
104
-018
30i
150
147
260
06B
19771 271
210
174
122
1581 5
176
1787 23
140
07
-029
52551
163
4051-519 3591
414
476
369
1242
043
22
210
152
130
I Me ezportial aroth formula wa enployeFiguw taken frcn a sampling of the National Census PoplationLxludes the Canal Area (Cristobal and Anm dd)
FIGURE 2
GENERAL MORTALITY RATE PER 1000 INHABITANTS IN THE REPUBLIC 1970 AND 1980
RATE
7
6
5 41
3
2shy
1970 1980
BIRTH RATE PER 1000 INHABITANTS IN THE REPUBLIC 1970 AND 1980
40 374
35
30-271
25shy
20shy
15shy
i0shy
5-
U A 1970 1980
SOURCE Panama in Figures Nov 1982 Prepared by MIPPE Population Dept
Division of Social PLanning
-6-
Panama can be classified as a country in full demographic transition
it has registered a gradual reduction in fertility along with a decline in
mortalityDuring the period 1970-80 the birth rate declined from 374 to 271
per thousand inhabitants while the mortality rate declined from 71 to 4-1 per
thousand (see Figure 2) Table 3 presents fertility and mortality indicators
for each year from 1970 to 1980
We can surmise that the improvement in these indicators is due to
various factors such as advances in health and environmental sanitation exshy
tension of coverage of educational services evolution of urbanization processhy
ses etc It is important to mention the increase in life expectancy at birth
which occured in recent years In the period 1970-75 it was 68 years of age
while it is expected to rise to 71 years of age for the period 1980-85
This index places Panama among the countries with the highest life
expectancy in the Americas This situation becomes apparent in the last decade
if we compare the mortality rate estimated for the Republic of Panama in the
years 1975-76 with that of other countries in the Americas Life expectancy at
birth as well as the annual mortality rate placed Panama among the most
favored countries as concerns this index Only Uruguay and Cuba among the
Latin American countries and Canada and the United States in North America
had lower mortality rates than Panama -
Furthermore it must be recognized that the extended coverage of
educational activities has led to positive changes in habits attitudes and
behavior while the extension of contraceptive practices has limited procreshy
ation and led to a reduction in the number of children per woman
1 National Demographic Survey of Panama Years 1975-1976 Chapter on Mortality - Statistics and Census Bureau Comptroller General of the Republic 1979
SOME DFX4GRAIRXC
TAKE 3
INDICATORS MR THE REIHJEITC
YEARS 1970-198O
1970 1971 1972 1973 1974 1975 1976 1977 1978 1979 1980 (P)
Live births I
Deaths
Deaths of infants lessthan one year old
Birth rate_ (per
thousand)
Mortality rate 1 (per
thousand)
Natural growth rate
(per thousand)
53287
10225
2156
371
71
300
54948
9857
2064
372
67
305
54910
9076
1848
360
60
300
52091
9161
1737
332
58
274
52772
9001
1663
326
56
270
53790
8683
1669
323
52
271
53002
8564
1951
308
50
258
52722
8036
1470
298
45
253
53040
7555
1294
291
41
250
52919
8192
1308
281
44
237
52611
7959
1144
271
41
230
1 From 1970 data calculated on the basis of revised population estimates at July 1
(P) Prelimrnny data
Source Statistics and Census Bureau Controller General of the Republic Panan in Figures Years 1976 to 198D
-8-
As a developing country Panama presents a series of distortions in
the economic and social realm which give rise to differences by area region
and political-administrative divisions the largest of which are the proshy
vinces
Demographic indicators show marked differences at both the regional
and provincial levels birth rates mortality rates and consequently natural
growth rates reveal contrasting situations (See Table 4)
Note that the Provinne of Bocas del Toro showed the highest birth
rate in 1980 - 41 births pef thousand inhabitants - followed in order by
Veraguas and Cocl with 309 and 285 respectively Los Santos and Panama
however show rates of only 20 and 25 births per thousand As for mortality
the Province of Panama has the lowest rate while Colon has the highest Bocas
del Toro and Veraguas also have high rates (they are provinces with important
percentages of Indian populations) These differences can be explained by the
level of access that the population has to health and education services and
by the general living conditions which result from the level of economic
development of each province It should be noted that the reliability of the
above rates is affected by population estimates age structures and by
incomplete vital statistics records For example in Darien Province the
records show a mortality rate of 14 per thousand which is considered unacshy
ceptable data given the provincess socio-economic conditions (it is the
easternmost province in the country with a high percentage of Indians in its
population and still suffers from difficult land communications with the
other provinces)
Infant mortality rates registered significant decreases over the
period 1970-80 at the national level they dropped from 405 to 217 per
thousand live births However this decrease varies in intensity by province
TABLE 4
NATALITY GENERAL AND INFANT MORTALITY AND NATURAL GROWTH IN THE REPUBLIC AND IN THE CITIES OF PANAMA AND COLON BY PROVINCE OF RESIDENCE 1980 1
City Area and Province Natality Mortality Natural
General Infant Growth
Total
Number
52625
Rate 3
271
Number
7959
RateL 3
41
Number
1144
Rate
217
4 Number
44667
Rate
230
3
Panama City Colon
Urban Rurtl
gocas del Toro Coc A Col6n
Chiriqu8 Darin
Los t Panam Veraguas
101B2 1968
25551 27075
2437 4337 4877
8553 647
2227 1483
22465 5540
219 253 255 289
410 285 280
284 245
265 199 254 309
1858 440
4055 3904
294 608 896
1281 38
347 347
3285 863
40 203 57 43 41 496 42 648
49 91 40 114 51 100 43 222 14 8
46 53 47 21 37---- 442 48 93
199 218 194 239
373 263 205 260 124 232 142 197 188
8324 1528
21496 23171
2143 3729 3981 7272
609
1940 1136
19180 4677
179 196 214 247
361 245 229 241 231
225 152 217 261
0
1 2 3
4
Figures subject to revision Excludes stillbirths Rate per thousand inhabitants based on the population estimate at July 1 of the respective year subject to revision Rate per thousand live births
5 Reliable mortality data for Darien Province are not available
Source Statistics and Census Bureau of the Controller General of the Republic - Vital Statistics
FIGURE 3
PERCENTAGE DISTRIBUTION OF THE POPULATION I N T H E R E P U B L I C B Y S E X A N D A G E 1980
AGE
030 80 amp up 034
038 75- 79 040
0-55 TO7- 75 052 65- 69 079
14 E N 113 60-64 4 W 0 M E N
434 55 - 59 124
L 50 - 54 149 S 45-49 176
216 40-44 -4
tx6r 35- 39 t 0 --- 5- 57i33ii
227 30- 3431
3825-29 __
482
20 - 24 15 19
_ _ 4 ~ 632
r~~
-9 8 7 6 5 4 3 2 I 0 0 I 2 3 4 5 6 78 9
SOURCE Statistics and Census tsureau IntergoernmentaL Team DEC-MIPPE-IFARHU-HEALTH 1983
-11-
Demographically Panama is an eminently young country since the
average age of the population is 20 (See the population pyramid in Figure 3)
Variations in demographic indicators have led to slight changes in population
distribution by functional age groups This can be seen in a reduction of the
base of the population pyramid (under 15 years of age) which was 435 in 1960
and 407 in 1980 (See Table 5) Consequently there is a broadening at the
center which corresponds to groups in the productive age bracket A gradual
aging process has also been noted the group comprising people 65 and over has
slowly risen
TABLE 5 FUNCTIONAL AGE GROUPS 1960 1970 AND 1980
Age (in Years) 1960 1970 1980
Under 15 435 430 407 15 - 64 525 539 551 65 and over 40 41 42
Source Population and Housing Censuses
The distribution of the population by age group has greatly influshy
enced development planning and the design of programs aimed at the various
brackets of the population pyramid In Panama the relative decline in the
under-15 age group can lead to relieved pressure on the demand for services
required by this age group primarily health and education for example -
Furthermore the increase in the productive-age bracket (15 to 64) implies
I Political Constitution of the Republic of Panama (1972) Article 51 The State shall protect the physical mental and moral
health of minors and guarantee their right to nutrition health education social security and welfare
Article 89 Official education is free at all pre-university levels It is compulsory at the first level of educaticn
-12shy
more intensive population pressure on the job market and the need to promote a
greater productivity in order to ensure the right to work
Panama cannot escape a demographic phenomenon common to many counshy
tries particularly underdeveloped ones which is the unequal distribution of
the population nationwide the large concentrations of population in small
areas and a great dispersion throughout the territory
In effect there is a marked concentration of economic activity and
population in the Metropolitan Region (Provinces of Panama and Colon) in conshy
trast with the rest of the country (See Map No 3) In 1980 slightly less than
half the population of the Republic of Panama lived in this region and contrishy
buted about three-fourths of the Gross Domestic Product
This phenomenon which affects Panamas overall development was
clearly recognized by the National Government through its policy of National
Integration for the countrys regions and included among its priorities the
most effective exploitation of natural resources the expansion of the natioshy
nal market the integration of the entire territory through the creation of
basic physical infrastructure (such as highways airports ports and electrishy
fication) the strengthening of the countrys main urban centers with emphashy
sis on the cities of the interior and the expansion of the agricultural and
industrial base of production - This approach also considered the need to
seek alternatives to rural-urban migration given the abundant resources not
only of the populated Pacific coastal area but also of the lesser known
frontiers as yet unincorporated into the national development effort (Darien
and the Atlantic Coast) as well as the need to provide basic services gti the
rural population
1 National Development Strategy 1970-80 and National Development Plan 1976-80
-13-
Table 6 illustrates the contrast between the volume of production
concentrated in the Metropolitan Region and the other regions Note the
situation of the Metropolitan Region with 529 of the population while the
Eastern Region despite its size contains only 3 of the total population
One province alone Panama represented 454 of the 1980 census population
This situation is due primarily to the continual absorption by the
Metropolitan Region of the migratory flows from the other regions a pattern
which has persisted throughout the countrys history since this part of the
territory has been the political-administrative axis and the hub of the
principal income-generating activities
Earlier studies show that the deterioration of rural living standards
is closely linked to the migratory phenomenon Contributing factors are the
low income levels the gradual decline in property size the concentration of
the population on farms smaller than five hectares and the seasonality of
employment which typifies Panamanian agriculture
The wigratory phenomenon has important implications on various
aspects of the socio-economic reality among which is a rapid increase in the
supply of female labor that cannot find job opportunities thus generating high
unemployment rates particularly in the Metropolitan Region
The above situation requires special attention with urgent measures
needed to halt this permanent mobilization of the population which not only
causes serious disequilibria as to its geographic distribution but also leads
to serious maladjustments in society
MAP N3
02
S5
URBAN CENTERS
393633 inhab PAMAMAJ
i Q 157063 (SAN IUELIT I
DISTRIBUTION OF THE POPULATION IN THE VARIOUS UPRAW CFNTF - 198n CENSUS
Prepared by the Teenical Support Unit of the Populatioi Dept of the MIPPE Based on preliminary figures of
the 1980 National Census
59832
0 50621
O 30971
0 21809 I0OOQ-999
bull oo0-0 l el-w 15 q I ] below I+
(COLdN 1 3
(DAYID) 4
(CHORRERA) 5
SANTIAGO)(nAJANi
-15-
TALE 6 POPJLATI(C DISRIFJTICN AND DENSIT= BY
PROVINCE AND PLANNING IMlIONS
Population Area in Km2 DensityRegion and Province Inhabm
Number Percentage Number Percentage
Total 1830175 1000 770S20 1090 237
Eastern 55064 30 200090 260 28 Darien 26497 14 168030 218 16 San Blas 28567 16 32060 42 89
Metropolitan 968150 529 169830 220 570
Panama 830278 454 12022O 156 691 ColonI- 137872 75 49610 64 278
Central 465581 253 224150 290 208
Coc1e 140320 77 50350 65 279 Herrera 81866 45 24270 31 337 Los Santos 70200 38 38670 50 182
Veraguas 173195 95 110660 144 156 Western 3413890 186 17675o 230 193
Bocas del Toro 53579 29 89170 116 60 Chiriqui 257801 157 87580 114 329
1 Excludes San Blas
Sources Preliminary Figures from 19e0 Population Census Bireau of Statistics and Census Prepared by Population Department of MIPPE
-16-
B The Female Population
In reviewing distribution by sex in the census results we note that
there has always been a slightly lower ratio of women compared to men 49 and
51 respectively
As concerns distribution by age groups (see Table 7) the most signishy
ficant group (564) is that in the productive ages This indicates that of
the countrys human resources women have a great potental contribution to
development if adequate mechanisms can be found to incorporate an evershy
growing number of them into the various activities which foster national
development
With regard to the geographic distribution of the female population
by age groups an important difference is seen by area as illustrated in
Table 7 The relative proportion of girls 15 and under in the female populashy
tion is fairly low in urban areas as compared with rural areas (34 and 45
respectively)
The opposite occurs in the productive ape group (15 to 64 years of
age) which within the total female population represents 611 in urban
areas and 512 in rural areas Among the reasons which explain this is the
considerable rural-urban migratory movement which occurs in the country
The unequal proportion of men and women in the older age groups is
clearly explained by the role of life expectancy at birth by sex During the
period 1975-1980 while life expectancy at birth for men was estimated to be
67 years on the average for women it was 71 years For the period 1980-1985
this indicator is estimated at 69 years for men and 73 years for women (see
Figure 4)
Information concerning the role of life expectancy and distribution
by age group is very useful for designing policies on which to execute pro
-17-
Table 7
POPUJATIC IN THE REPUBLIC BY SEX AND AGE GROUP
1980 CENSUS
NUMBER PERCENTAGE Age Groups (Years) Total Men Women Total Men Women
Total 1824796 925916 89890 1000 l000 1000
Under 15 years of age 713428 363279 350149 390 392 390
15 - 64 1O26865 520120 506745 563 562 564
65 and older 79927 40190 39757 44 43 44
Not declared 4576 2327 2249 03 03 02
Urban 899093 435241 463852 1000 i000 1CO0
Under 15 years of age 31426 158739 155647 350 365 336
15 - 64 540434 256694 283740 601 590 611
65 and older 41540 1B476 23064 46 42 50
Not delcared 2733 1332 1401 03 03 03
Rural 925703 490675 435028 1000 100 100O
Under 15 years of age 399042 204540 194502 431 417 448
15 - 64 486431 263426 223005 526 537 512
65 and older 38387 21714 16673 41 44 38
Not delcared 1843 995 848 02 02 02
Source Projections of Population for the Republic of Panama by sex and age group Bureau of Statistics and Census Controller General of the Republic
FIGURE 4
LIFE EXPECTANCY FOR THE PERIODS 1975-80 AND 1980-85 IN THE REPUBLIC
YEARS LIFE
EXPECTANCY
80
78
76 PROJECTION
74
72 7MEN
71
73
M
00
70 69
68 -
66- I 67
64shy
62- iid 60 LJ-- I -
Source 1975 i G80
Statistics and Census Bureau Interoovernmental Team DEC-MIPPE-IFARHU-Health
1985 YEARS - PERIOD
-19shy
grams geared to benefit the population in various areas An increase in life
expectancy will require a revision of the ages for retirement from economic
activity and for pension and retirement benefits Consideration should also be
given to programming geriatric and gerontological services and an answer must
be found to the housing problem which often afflicts this group
Given the demographic reality which Panama and other countries will have
to face in the medium and long terms the words of the Secretary General of
the World Aging Assembly Mr Williams K Kerrigon must be taken very much
into account There is no time to lose By the year 2000 people in the
over-60 age Froup will show the highest growth rate in most developed or
developing countries The economic well-being of society could be endangered
if the growing needs of this group and the potential human resources that
older people can offer to society are not taken into account
At the end of the 1970s clrse t) half of the population in the 60-andshy
over age group (54000 people) was not in the labor force was not retired
and was not receiving a pen3ion or prirate income This leads us to suppose
that they were dependent on other people for their economic subsistence This
situation affects women more than men in a ratio of 4 to 1 If to this we add
that most women in the age group have lost their husbands or companions it
seems logical to assume that they will have greater difficulties in obtaining
support According to the 1980 Census 70 of all women who stated they were
widows were over 60 Table 8 shows the ratio of men to women in the 60 and
over population with projections to the year 2000 It is claar that women
survive longer than men and in future years will make up an even larger share
of the aged dependent population
In effect the number of men and women in our society that reach the
age of 60 with pension rights is relatively low particularly women who have
-20shy
been less involved in remunerative employment where social security is proshy
vided Of every ten retired persons only three are women and only 14 of women
60 or older are retired pensioned or receiving private income
Based on the foregoing the guidelines emanating from the World
Assembly on Aging (August 1982) must be considered and some of the measures
contained in the International Action Plan approved at this Conference put
into practice The Plan notes that particular attention is given to the
special needs of this group for which looms the likelihood of an old age
aggravated by economic want loneliness and little or no probability of
remunerative employment
Table 8 MEN PER THOUSAND WOMEN IN THE 60 AND OVER POPULATION IN
THE REPUBLIC BY AGE GROUP
YEARS 1970 1980 1990 AND 200G1
Age (in years) 1970 1980 1990 2000
TOTAL 1025 1039 1004 955
60 - 64 1137 1092 1026 994
65 - 69 lO1l3 1086 1025 980
70 - 74 960 1061 1024 952
75 - 79 972 930 991 920
80 and older 924 869 870 856
l As of 1980 the population living in th3 Panama Canal Area is included
Source Population Projections by sex and age group Years 19qO-2025
Bureau of Statistics and Census Panamanian Statistic No 903 April 1983 Prepared by the Population Department of the Social Planning Division of the Ministry of Economic Planning and P-licy (MIPPE)
-21-
Although the latest census does not present information concerning
migration previous studies based on the 1970 census affirm that rural-urban
migrations are massive Most of them involve women Furthermore rural migrashy
tions towards urban centers aside from being primarily female are concenshy
trated in the 15-34 age group 604 and 614 of men and women migrate to the
city of Panama Also in the rural groups that migrate towards the smaller
cities of the country there is a higher proportion of women than men in the
15-34 age group 53 of all women who leave the countryside for these small
urban centers fall in this age range Among men only 42 are in the group
However among people over 35 female rural migrations abruptly decline while
those for the male sex show only a slight decline _ More recent information
on migratory movements towards the Metropolitan Region contained in a 1981
Socio-Econoinic Survey Z reveals that the predominantly female migratory trend
is carried over into the early part of the 1980s
Table 9 shows that the rate of emigration towards the principal
recipient region (the provinces of Panama and Colon which comprise the
Metropolitan Region) is greater for women than for men at the national level
as well as for all the other provinces in the country It can also be seen
that migrants are primarily young (10 to 19 years of age) and that the level
of migration declines with age
In general the mobility of the population in these age groups is
closely linked to the search for employment an objective which is not always
satisfied given the restrictions of the tight labor market in the recipient
region Furthermore women migrants for the most part are poorly qualified
1 Internal Migrations in Panama - Marco A Gandasegui Ministry of Health 1978
21Socio-Economic Survey of the Metropolitan Region MIPPE 1981
TABLE 9
RATE OF EMIGRATION (PER THOUSAND) TOWARDS THE METROPOLITAN REGION BY PROVINCE AND AGE GROUP
1976 - 1981
Sex and Age Total =sror iriqu Darien Herera Los Santos Veraguas
TOTAL 099 052 157 043 312 110 134 108
10 - 19 20 shy 29
30 -40 - 49 50 - 59 60 - +
193 074
053 030 056 015
149 -
----shy
170 106
073 010 043
070 048 024 018 015 019
470 -152 237 383 089 282
202 128 064 016 046 020
292 059 031
043
166 -
203 090 054 026 089
ME 080 050 110 030 253 090 142 087
10 - 19 20 29 30 39 40 - 49 50 - 59 60 shy +
146 062 052 039 046 012
153 --
-
- -
237 054 073 020 027 -
042 044 007 035
-
013
331 170 329 217 147 155
110 128 076 031 087 037
313 026 120 038 042
-
161 085 038 047 026
-
WOMEN 121 054 210 050 384 132 125 134
10 20 30 40 50 63
-19 - 29 - 39- - 49 fe- - 59 - + i
244 0879-054 021-067 018
146
-
-
-
461 162 072
-
62 -
100 052 041 -
033 027
618 130 113 609 -480
299 129 051
-
268 094 060 048 115
-
249 095 072
156
SOURCE Socio-Economic Survey of the Metropolitan Region MIPPEPopulation Department 1981
-23shy
which leads them by and large into the personal and domestic service sectors
Women in rural areas from time immemorial have performed double duty
as housewives and family farmworkers The attention that the rural woman gives
to this dual role implies devoting time and expending energy which in most
cases are not registered in the productive process By not assigning a value
to these activities womens opportunities for full participation (labor
social economic etc) are limited which encourages them to leave their
place of origin
In referring to the characteristics of the female population a
fundamental subject is the role of fertility a decisive component in the
dynamics of demography Earlier in this chapter it is mentioned that Panama is
in a process of demographic transition where a basic role is played by the
decline in fertility particularly as of the mid-1960s This phenomenon can be
attributed to various factors such as higher educational levels increased
participation in the labor market development of the urbanization process
and knowledge of and access to contraception
A document concerning recent fertility trends in Panama lists a series
of events mostly occuring in the second half of the 1960s which coincided
with the beginning of the decline in fertility in our society 1 Among them
was an expansion of and an emphasis on capital investment which require a
more sophisticated labor force Therefore efforts were made towards
professional training to develop skills and capabilities demanded by the new
production processes Efforts in the field of education particularly the
private sectors participation in these efforts also apparently contributed
1 See The Reduction of Fertility in Panama Hildebrando Araica Working Document MIPPE Panama February 1980
-24shy
to the decline Furthermore reference is made to the improvement of Social
Security and health recovery services in order to maximize the workers time
and improve hisher productivity and the profitability of investments The
same author adds that together with all the above conditions also favor
decision-making to adjust reproductive behavior particularly in urban popushy
lations and those more privileged as to education and income therefore the
objective of smaller families becomes widespread in these so7ial strata
It is worth noting that in Panama knowledge and use of contraceptive
methods has been greatly increasing The 1976 Fertility Survey showed that the
knowledge of these methods has apparently penetrated all layers of Panamanian
society The Survey revealed that 986 of all married women or women living
in consensual union know of the existence of some efficient contraceptive
method regardless of age or whether or not they had few children
Panamanian women at all social levels have access to the Ministry of
Healths Family Planning services through its Maternal Sub-Program which aims
to offer the couple the opportunity to have the number of children it desires
and diagnose and treat those infertile couples who want children
A recent document prepared on the basis of information Lontained in
the Maternal-Infant Health Program 1 shows that 146018 women entered the
program between 1970 and 1980 or 33 of all women in the fertile age group
(15-49) It also points out that a growing percentage of these entrants are
under 25
In 1979 a Survey on the Prevalence of Contraceptives was performed It
showed that two-thirds of all married women or women living in consensual
1 Demographic Aspects of the Population and the Family Department of Population - Division of Social Planning MIPPE March 1982
-25shy
union reported uAng some type of contraceptive In the urban area this ratio
was 71 while in the rural area it was 57
Among Panamanian women the generalized practice of sterilization as a
contraceptive method is noteworthy According to the above-mentioned survey
one out of every three women that accepted the use of some contraceptive
method stated that she had been sterilized with a strong increase noted in
recent years In 1970 sterilizations represented 14 of the methods employed
and 31 in 1980 1
Aside fom the Ministry of Health other agencies that offer family
planning services to the female population are the Social Security Board
(governmental) and the Panamanian Association for Family Planning (APLAFA)
which is a private scientific and social group that began its activities in
1965 and that has among its objectives the promotion of education and
reseirch on human reproduction of a psycho-medical-social nature
There can be no doubt as to the close correlation between the average
number of children per woman and a series of variables such as the conjugal
state the place of residence and the level of education
1 Survey on the Prevalence of Contraceptives Ministry of Health 1980
- 26 -
FIGURE 5
AVERAGE NUMBER OF CHILDREN PER WOMAN BY AREA OF RESIDENCE 1980
AVERAGE CHILDREN PER WOMAN
RURAL4_
NATIONAL 2
25 URBAN
2shy
_ _ _ _ _ _ _ _ _ deg _ _ _ I _ _
SOURCE Statistics and Census Bureau Intergovernmental Team - DECMIPPEIFARHUHEALTH - 1983
-27-
As seen in Figure 5 there is a marked influence of the urbanization
process with its characteristics inherent to modernization greater access to
different levels of education particuarly secondary and university level (see
Table 10 and Figure 6) more opportunities for incorporation into productive
activities and a larger social influence of communications on the
reproductive behavior of the population
Table 10 AVERAGE NUMBER OF CHILDREN PER WOMAN BY LEVEL OF EDUCATION
1980 CENSUS (1)
Level of Education Women 15 Years or Total Live Average Older Births Children Per
Woman
Total 495419 1581720 32
None 70808 386179 54
Some Primary 224403 870499 39
Some Secondary 160157 268458 17
Some University 37336 49101 13
Unknown 2755 7483 27
(1) 20 Sampling 1980 Population Census
Source Statisics and Census Bureau Prepared in the Population Department of the MIPPE
It is easier for a woman at a higher education level to have access to
knowledge concerning the various contraceptive methods It has also been
clearly proven that better training and education allow women to compete and
enter the labor market with greater advantages It is also a well-known fact
that there is a close connection between the length of stay in the educational
system and the delay in the age of matrimony particularly in the more
privileged social strata
FIGURE 6
AVERAGE NUMBER OF CHILDREN PER WOMAN BY LEVEL OF INSTRUCTION - 1980
AVERAGE NUMBEROF CHILDREN
6-Total Women 15 years of age and over 495419
54 Total live births 1581720
1581
4 39
AVERAGE TOTAL 32
2- 17
O- ~ 1 3 _ Ii
V LEVEL OFNO GRADE SOME PRIMARY SOME SECONDARY SOME UNIVERSITY INSTRUCTION
Source 20 Sampling of 1980 Population Census -SCB
Prepared by Population Dept Division of Social-PLanning - MIPPE
-29-
II EDUCATION
II
-30-
EDUCATION
A General Aspects
At the international level access to education is a basic right as
well as a fundamental factor which enhances social progress and reduces inshy
equalities between socio-economic groups and the sexes
Traditionally the Government of Panama has given particular priority
to education which has led to a continuous expansion of the system and conseshy
quently a yearly increment in educational facilities throughout the country
The Political Constitution of the Republic of Panama devotes an entire
chapter to Education Article 86 of the 1972 Political Constitution of the
Republic (revised) states that All citizens have the right to education and
the responsibility of being educated
During the 1970s the National Government channelled large amounts of
resources to the education sector which resulted in an increase in budgetary
allocations of 216 In 1970 the sectors allocation was 55 million and rose
to almost 175 million at the end of the period While the average cost per
student was B173 in 1970 it reached B326 in 1980 1
Also during the last decade efforts in the sector were aimed at proshy
viding education particularly to geographic areas and social strata previously
deprived of this attention This led to the expansion of the infrastructure
available to the education sector particularly in rural areas which pershy
mitted a massive incorporation of the rural population into the educational
process and which is demonstrated by a more rapid growth of enrollments in
the rural than in the urban area 2
1 A Decade of Social Development in Panama Social Planning MIPPE 1983 Bases for Panamas Economic and Social Development MIPPE (Working Document)
-31-
FIGURE 7
INCREASE OF SCHOOLS CLASSROOMS ENROLLMENT AND TEACHERS IN THE REPUBLIC SCHOOL YEARS 1970 AND 1980
AMOUNT PERSONNEL
17000 16523 680000
161000
6064
605673
6008000
121000 -44010
0
10000-520000
I1000 - m-- m 440000
- 00
9000- mmm -20
3 i 2800U
8 o7 i i
--
---- iii - m
mm~~m bull=degmm~~~~~ bull m degdego
24 97200005000 - C14-41000 810000 240000
000 24800010 0
- -- 1 9 8 0 t--d
SCHOOLS CLASSROOMS ENROLLMENT TEACHING STAFF
Source Statistics Department MINEDUC and Dept of Human Resources and Employment1970 EIIYof MIPFE190
19 oo8 0
-32-
An overview of the education sector at the beginning of the 1980s
shows considerable change over the previous decade During the period 1970-80
1185 new schools came into existence which represents a 50 increase as did
4635 new classrooms which represents a 40 growth and 10538 new teachers
were appointed which equals a 74 increase (see Figure 7)
The effort to provide a physical and human infrastructure at the
service of education allowed for a considerable increase in the number of pershy
sons benefiting from the educational system st itz various levels This can be
seen in the incorporation of 238430 new students which equals a 65 increase
in enrollments that is in 1980 the total number of students reached 605873
of which 89 were in the official educational system (see Table 11)
The increases noted for this period thus represent an important change
in enrollment rates particularly at the primary school level In 1970 789
of the population in the 6-11 age range attended primary school while in 1980
this figure had risen to 948 The percentage of 12-14 year olds who norshy
mally attend the first cycle of intermediate education rose from 751 to
800 while 15 to 17 year ols who attend secondary school or take teacher
training and professional and technical courses had an enrollment of 578 as
opposed to 433 at the beginning of the period - (see Figure 8)
Special relevance must be given to the accelerated growth in univershy
sity enrollments The University of Panama created in 1935 showed a modest
growth during its first three decades As of the mid-1960s and particularly
during the 1970s the first institute of higher learning in the country undershy
went a significant expansion at zhe Panama City campus as well as in the
University Centers created in other urban areas in the countrys interior
1 A Decade of Social Development Social Planning Division MIPPE 1983
-33-
TAEU I flIOEA IN St23LS cLAS2OaM EWi8LL)QMAND0A=G1 SEA IN Wl I8H IC
EY ISAL KID WMMt 0 W ATIGN3211 YEW 1970 AND1W52
Type Eofdcation level and Source Sdools
Claas-1
1970
Du -mmt
Teach-Ing
Staff Schcola Clae-
room
1980
Enroll-mt
Tea-ing
Staff Schowol
No
1ncroaae
Clasaomo No
Enrolwnt No
TeoddMn Staff
No
I=TA 23 It AM 367443 14159 3567 1652 605873 247 j83 4IA 4635 4E0 23B430 649 1053 74-4
Public Private
2064 318
10217 1671
320046 47397
12093 2066
3Z31 336
14712 1811
538424 67449
2189 208
1167 8
565 57
4495 X40
440 84
218378 20052
682 423
9736 82
805 388
C6tAIEIATION 1978 U517 342493 32960 2621 15 550M 643 325 3903 M9 2)756 606 96 743
Public Prit to
1775 10026 203 1491
30f6 41627
1113 1547
2429 iW
1395 1515
495230 54799
20035 2554
654 -1
368 -54
3879 24
387 16
194364 13172
646 316
8922 7
803 383
w1i1rd 1784 8916 255237 8714 22 U 9 337522 12261 29 3 2364 265 82235 _V 3647 418
Public Private
1719 65
8374 542
241616 13671
8322 392
2231 75
10592 688
316231 21291
U1700 661
512 10
298 154
2218 146
265 269
74615 7620
309 557
3o78 269
19 686
W192 242 7B259 3751 n6 3763 171M3 8138 11 5)j 1341 54 9304 118 4331 1166
PublIc Private
55 137
1487 935
5D909 27YO
23 1375
194 112
33) 763
142652 28621
6682 1456
139 2527 -25 -182
1513 -172
1017 -184
91743 1X2
1832 46
4=22 81
1805 59
HIM01UN ly~ 2 179 89$7 489 2 34 e 40369 1959 0 00 169 94A4 314M 3512 IM~ 750
Public Private
1 1
165 14
8341 606
409 a)
1 1
302 46
36C67 4302
1590 369
0 0
00 00
137 32
830 2286
27726 36
3324 6099
1181 289
743 3612
I41M 1141-0 - - _- - 7 29 835 131
Public Private
-
-
-
-
-- -
3 4
11 18
230 5D 58
63
M14POMAM1WI8i 4N 371 24950 1192 W1 11M 5584 2 1M 542 1342 32 1973 303 953 M278
Public Private
283 115
191 107
1910 5773
9303n[M 219 144
807 296
43194 12650
1794 314
513 29
1775 252
616 116
3225 644
24014 6AM
1252 1192
814 95
831 434
PR-P R 130 99 6921 218 3G5 6 19136 645 235 188 503 513-1 11215 1620 In IE2
Public Private
45 85
6 93
2933 38
84 14
234 131
78 229
11934 6W2
419 226
189 46
4320 541
372 136
62000 1462
91001 2214
369 555
335 92
3988 66
3ItIAL 12 129 1395 13 24 335 44N 362 12 1fl0 206 1597 2273 M2 1f81
Public Private
10 2
112 17
1234 151
123 12
23 1
331 4
4405 30
360 2 -1
13 0 -500
219 -13
1955 -765
3201 -121
2659 -80
257 -10
I7 -33
StU2-0f21 30 lfl 2754 117 22 132 10023 19B -8 -267 21 1__9 7269 2639 81 692
Public Private
5 25
41 70
1212 1542
49 68
11 11
69 63
3635 6 8
115 83
6 12 0 -14 -560
Z9 -7
683 -100
2423 4846
1999 3143
66 15
1347 181
L17AL) AUIZ~ 4111AT32 231 (a) IlmB7 -6BS 534 (a) M2918 f38 303 M12 89W 751 149 217
Public Private
2_9 3
(a)
11849 89
681 5
533 1
(a)
288 30
832 3
3D5 1338 -2 -667
9129 - 9
762 -663
151 -2
222 -400
IM2EM3ONAL Mlr 1 32 1982 43 1 29 22 pound0 - -3 -94 182 551_
Public 1 32 192 43 1 29 2342 6pound - -3 -94 360 182 25 581
(a)
UsedPrimry LAl Clzurozai Informtio rot anilable Not applicable I cluda Regiomal Univemrity Cmters Sairc Statistic lepar ment of MnLtty of F-hWcation ad D1poromno of Haran Reaaurces
and CaneA BurMu of the tinisty of PbAnnir and Exoaoic PoUc and opoycat of the Stntiatics
FIGURE 8
SCHOOL ATTENDANCE RATES FOR THE POPULATION BY AGE GROUPS - 1 9 8 0
RATE
100
90shy
80
70 60
oW
50-40
30shy
Klt808
00
20-I0 V
10 - X
6 fill 14 15 17
Source Department of Human Resources and Employment MIPPE Preoared by Technical Support Unit - Ponulation Department
-35shy
with the aim of offering opportunities for higher education to students intershy
ested in g~ing beyond the intermediate level
One of the National Governments objectives in strengthening the unishy
versity centers not just the one in Panama City is to contribute to preventshy
ing the transfer or migration of young people from other urban centers toward
the capital in the hope of expanding their horizons in higher education The
establishment and strengthening of other university centers also responds to a
desire to offer short or medium- erm careers that will allow the training of
technical-level professionals as demanded by the various development-related
activities throughout the country
Aside from the Central Governments efforts through substantial
allocations to the sector in the national budget another factor in thl
expansion of education in Panama has been Educational Security created by
Government Decree No 168 of July 27 1971 with the aim of promoting and
developing education at all levels to benefit all Panamanians particularly
the masses on the fringes of economic and social progress
Despite the efforts channelled towards the education sector and the
progress made illiteracy persists as a problem requiring special attention
Illiteracy and the lack of education and training in general are among the
negative elements that help maintain the vicious circle cf under-development
low levels of productivity and unfavorable health and welfare conditions
The 1970 Census showed that one-fifth of the population 10 years or
older was illiterate with the problem being more acute in rural areas 6 to 1
compared with urban areas The latest census shows that the problem affects
about 187134 persons which translates into 142 also concentrated in rural
areas
-36-
B Education in Panama and the Female Population
Transformations that occur throughout the world and at all levels
require the training of skilled people to respond to demands in the economic
political and social fields
As shown by the magnitude of government expenditures in the education
sector a primary objective of development in Panama has been to train the
population as an effective means of achieving the real participation of men
and women in development plans and projects
A very positive situation is the marked effort on the part of women
to succeed at the various educational levels and at the higher levels (technishy
cal and professional) in the last two decades
A highly favorable factor in Panamas social development is that
there is no discrimination against the integration of women into the various
education levels This har permitted the Panamanian woman to represent half
the total national student enrollment in 1980 including all levels of
education These indicators are most encouraging as to the perspectives for
women and their incorporation into the many activities related to national
development
In referring to the progress and achievements of the Panamanian woman
in recent years therefore access to education must be stressed as one of the
most positive aspects In effect educational facilities have been a determinshy
ing factor in the promotion and participation of women in an increasingly
dynamic way in the various activities that foster national development
Furthermore a very positive attitude is noted in both the female and
male population with regard to the value given to education as an instrument
of self-fulfillment
-37-
In an Opinion Survey performed in Panama during the International
Year of the Woman -L close to 80 of men and women agreed that women should
have the same education as men Wnen asked if women were interested in professhy
sional advancement 91 answered in the affirmative
Literacy and Illiteracy
The priority that the Government of Panama has given to education has
had positive effects on the increase of literacy in Panama However according
to the latest census 14 out of every 100 Panamanians 10 years or older were
classified as illiterate
Table 12 shows that at the national level there are practically no
differences between men and women in illiteracy (139 and 146 respectiveshy
ly) If the situation is compared at the urban and rural levels the differshy
ences are also minor However illiteracy is considerably higher for both men
and women in rural areas than in urban areas as illustrated in Figure 9
One aspect that must be underlined as positive is that based or the
information contained in the 1980 Census there is a better outlook for reducshy
ing illiteracy in the future since an analysis of rates by age group shows
that illiteracy is celatively low in the younger population while the rates
are higher in the older groups This shows the effort that has been made to
extend educational services throughout the country in the last few decades
1 Opinion Survey on the Panamanian Woman Statistics and Census Bureau Controller General of the Republic 1975
2 See Statistical Annex Table No 1
-38-
Table 12
LITERACY AND ILLITERACY IN THE POPULATION 10 YEARS AND OLDER IN THE REPUBLIC BY AREA AND SEX 1980 CENSUS
Population 10 years old and older Area Sex Illiterate and Age Total Literate No
Total 1312942 1125808 187134 142
Men 663060 570958 92102 139
Women 649882 554850 95032 146
URBAN 688440 654211 34229 50
Men 328818 313385 15433 47
Women 359622 340826 18796 52
RURAL 624502 471597 152905 245
Men 334242 257573 76669 229
Women 290260 214024 76236 263
Source Tabulations of the National Population and Housing Census 20 Samplshy
ing Statistics and Census Bureau Controller General of the Republic
Participation in Enrollment
Table 13 (which refers to enrollment in the Republic in July 1980)
shows that in Panama there is a tendency which is becoming more common in
many Latin American countries towards an increase in the participation of
women at all levels of education
At the secondary school level (first and second cycles the latter
including high-school and normal training) female enrollment represents 521
of the total At the professional and technical level it is 544 while at the
higher level (university and non-university) it is 548
The above reveals that the Panamanian woman is increasingly aware
that educational advancement acts as a very positive instrument towards her
ILLITERACY IN
Percentage of
ILliteracy
I00 1
91 shy
80-
70-TOTALt
60
50
40
30
20
I0 475250
URBAN
-39-
FIGURE 9
THE 10-AND-OLDER POPULATION BY AREA
AND SEX - 1980
Total Illiteracy 187134 Total Urban Illiteracy 34239 Total Fural Illiteracy 152905
MEN j W 0 M E N
263 245 229 21__
139 46 142
RURAL TOTAL
-40-
Table 13 ENROLLMENT IN THE REPUBLIC BY SEX LEVEL AND SOURCE OF EDUCATION
AT JULY 31 1980
Enrollment Level of Education Total Men Women
TOTAL 582263 291639 290984 Pre-Primary 18136 9073 9063 Primary 337522 175012 162510
Intermediate 171273 81945 89238
Secondary 00-0 131480 63780 67700
First Cycle 97682 47714 49968 Second Cycle 33798 16066 17732
Senior High School 32814 15745 17069
Teacher Training 984 321 663 Professional and Technical 39793 18165 21628
Basic First Cycle 105 60 45
First Cycle- 9268 4532 4736 Agriculture 115 93 22
Cosmetology 737 1 730
Commercial 3084 594 2490
Industrial 3665 3646 19 Home Economics and Tailoring 1597 169 1428
Telegraphy 50 15 35
Theology 20 14 6
Second Cycle 30420 13573 16847
Agriculture 1374 1091 283
Commercial 20035 4552 15483
Industrial 8577 7930 647 Home Economics and Tailoring 434 - 434
Higher Education 41234 18621 22613
University2 40369 18215 22154
Non-University 865 406 459 Special 4435 2562 1873
Supplementary 10023 4426 5597
l Refers to professional and technical courses for which First Cycle is not a pre-requisite
2 Refers to the first semester of the academic yea includes Regional Centers
Source Department of Statistics Ministry of Education
-41shy
incorporation into the countrys economic activity which doubtless improves
her chances for social mobility in general
Looking at the distribution of women across educational levels
(Figure 10) the data show that women are distributed nearly the same as men
27 of all women age six and over have some secondary education compared with
25 of men At the university level 55 of women and 56 of men have
reached this level
In referring to womans participation at the various educational
levels the active role that the Panamanian woman has assumed in recent
decades in the higher education process should be underlined since this situshy
ation affords women increasing access to high technical political and adminshy
istrative positions in the countrys public life which in turn will allow
them to obtain greater benefits for the female population as a whole
It is evident that with the opening of Panama University in 1935
ample opportunities became available for women to reach professional levels
However during the early years the participation of women in the careers
offered at our first institute of higher learning was very modest
It is only in the 1960s that a greater interest is shown by Panamashy
nian women in entering the university a situation highlighted by university
statistics Throughout most of the 1970s the annual percentage increase in
enrollment was greater for female students In 1960 they represented 38 of
enrollment in the University of Panama while in 1980 they represented 54
In reviewing university statistics in Table 14 and Figure 11 it can
be seen thit the female student body shows an inclination towards certain
careers mainly in the fields of Philosophy Letters and Education the Natushy
ral Science Odontology and Public Administration (in all these colleges they
represented more than half the enrollment as shown graphically in Figure 12)
-42-
It is important to note that in the last decade a growing interest in
entering other careers that had been previously considered for men only such
as engineering and architecture is observed The creation of the Polytechnic
Institute at the university level offers a variety of fields of specialization
in technical areas which have been well received by the female student body
In 1975 only one out of every 10 students enrolled in the Polytechnic
Institute was a woman while five years later women represented 222
Level of Instruction
In making an overall assessment of the countrys educational situashy
tion and of women in general we confirm the almost equal status of both
sexes with a slightly more favorable situation for women As the following
table shows the average number of years completed by the general population 6
years or older was 56 while that of the female population was 57 If we
examine the detail by level of instruction as well as by age group (See Table
2 in the Statistical Annex) no noticeable difference can be identified so we
can expect a situation of equality in the future which will greatly enhance
the increasingly effective incorporation of women into the national developshy
ment process
FIGURE 10
PERCENTAGE
60NO60shy
50
LEVEL OF INSTRUCTION OF THE POPULATION 6 YEARS OLD AND OVER BY SEX 1980 CENSUS
NE P R IMA RY SE CO N DA
M E N W543 OE 517I0 III
RY I
III
N
-
3
ee
MEN WOMEN
I I IIIIIIO
10
142
oC-
149 I
e bull
MEN
WOMEN
Source Division of Social PLanning -Dept of Human Resources and Employment -MIPPE
-44-
Table 14 ENROLLMENT IN THE UNIVERSITY OF PANAMA BY FACULTY AND SEX
FIRST SEMESTER 1980 ACADEMIC YEAR
Sex College Total Men Women Women
Total 36067 16464 19603 540
Business and Public
Administration 11769 4873 6896 590
Agronomy 1215 668 547 450
Architecture 1232 785 447 360
Natural Sciences 4726 1536 3190 670
Law and Political Science 1378 907 471 340
Philosophy amp Letters 8953 2624 6329 710
Polytechnic Institute 5691 4427 1264 222
Medicine 819 531 288 350
Odontology 284 113 171 600
Source Bulletin No 16 University of Panama Bureau of UniversityPlanning 1980
FIGURE 11 -
UNIVERSITY ENROLLMENT BY FACULTY AND SEX - 1980
ENROLLMENT M E N
710-0 W 0 M E N l iiiii
6000- ME
4i75000- 4873
Il
4000 - xo
3QOO 3990 624 deg933
00
14
1000 - 6
4T
Business amp Agronomy Architecture Natural Law amp Poll- Philosophy Polytechnic Medicine Public Sciences Politicalamp Institute Odcntology
Administration Science Letters SOURCE UNIVERSITY STATISTICS - National University of Panama - Planning Bureau 1980
Prepared by TechnicaL-Support Unit - Population Dept- Division of Social Planning - MIPPE
-46-
F I G U R E 12
DISTRIBUTION OF THE FEMALE UNIVERSITY POPULATION BY
1980
FACULTY
Percentage
100
90
80
706 770 670
0 50 60-0
50 -450
40X
30
x360 340 35
20
10
timesCftimes L 4o
0 xxD XXmu mu ra22a
- X -D Ca U)Cf 0 0 ~ 4 a) 0
V) E E a 4)a 0a (cA U C -j0 40M cLA 44-0(uC -L C oa-c0 a J r- U4-l 0 3 v a -XJ4 X 4 CfLn L 4- r 3 r- -t- 4- -- p1 -0 0
xxxl MJCX) 0 0) MXX
Source STATISTICS University of Panama Planning Bureau 1980 Pren~ar-et-b TechnicaL SUDDort Unit- Pntilatinn nnrfnf MTPPP
-47-
Based on the previous analysis and as a conclusion to this chapter it can
be noted that during the present decade and based on the current situation
the education sector will remain among the higher priorities in terms of
resources with a continuation of the approach set forth in the 1976-80
Development Plan of considering all efforts in education ss investments in
human capital This is based on the fact that the most productive sectors of
the economy are those that demand a greater number of professionals technishy
cians and skilled workers and also that the more qualified persons will have
greater possibilities of obtaining better-paid jobs and fewer riskszof losing
the jobs they have
Therefore by providing better training to the population it will be
possible to reduce disparities in income and wealth distribution in Panamanian
society which will make possible even greater economic growth within a frameshy
work of equity and social justice
TAME 15 POFUJATION 6 YEARS AND OLDER IN THE REPJBLJC Hf LBEL OF INSTRUCTION
SEX AND AGE 490 CESUS
Population 6 Years of age and OlderSex and Age Group Level of Instruction (Completed Years of Study)
Total None Primary Secondary University Not De- Average Years Total Complete Total Complete clared Declared
Total 1507523 219195 798687 304047 390234 56100742 83729 15678
Percentage 1000 145 530 202 259 67 56 10
Men 761]28 107917 412934 156021 18936 46238 42137 8614 56
Percentage 1000 142 543 205 248 61 56 11
Wmen 746335 11 278 385753 148026 201295 54504 40942 7064 57
Percentage 1000 149 517 198 270 73 55 09
Source Tabulations of the National Population and Housing Census 20 Sampling Burean of Statistics and Census - Controller General of the Republic
0
-49-
III THE PARTICIPATION OF W0MEN IN ECONOMIC LIFE
-50-
III THE PARTICIPATION OF WOMEN IN ECONOMIC LIFE
A General Aspects
The degree of participation of men and women in economic life has hisshy
torically been different and determined basically by the role that society
traditionally imposed on persons of each sex There are few labor-related
realities that more closely link the world of labor with the structure of
society than do womens employment and work situations In effect it is
impossible to explain the factors that influence womens participation the
socio-econornic characteristics of working women and the conditions under whicn
they work without referring back to cultural values the organization of the
economy and of society and the general functions of the sexes in everyday
life 1
In analyzing womens participation in the countrys economic life there
is recognition of its close relationship to a series of global situations that
affect it among them the very organization of the national economy and the
value systems that prevail in society
Profound changes have taken place in Latin American societies over the
last three decades which have affected the nature as well as the intershy
relationships of the classes and groups that compose them Among the factors
that have contributed to these changes are the accelerated urbanization
process the integration of a value system common to the population the
creation of conditions for social interaction participation and mobility the
exposure of various layers of society to consumer patterns and the demand for
goods and services
I Female Labor Participation and Differences in Remuneration by sex in Latin America PREAL ILO
-51-
Furthermore the role of the State by expanding the services offered to
the population has had favorable consequences on the redistribution of beneshy
fits through social policies thus permitting greater access to educational
sanitary and social welfare services
As of the 1950s we observe the most rapid transformation of the populashy
tions educational and cultural conditions ever known while centuries-old
barriers such as illiteracy and elitist groupings such as the university were
being torn down I
Given the social sructire that has traditionally prevailed in Latin
America we can state that women who generally lagged behind men in the slow
process of change that had taken place until that time were able to benefit
in large measure from the changes noted
In todays world with slight variations by country women play a vital
role in agricultural as well as non-agricultural activities There is virtual
international acceptance of the principle that an integral development based
on egalitarian growth requires the effective integration of women it requires
their having access to land water and natural resources as well as to equal
opportunities for developing and employing their full capacity
Just like women thioughout the world Panamanian women have gradually
changed their way of thinking as to what their level of participation should
be in the various activites of everyday life within and outside the home
There is still a long way to go however before we can affirm that in the
home life of their communities men and women play similar roles and share
responsibilities fairly and in a real and effective manner
1 See- Three Decades of Social Change in Latin America ECLA 1963
-52-
It is somewhat difficult to assess the role that women play in developshy
ment at all levels because of the different concepts that men and women have
concerning the role that women must fulfil There is still a widespread notion
in many societies including Panamanian society that when a woman reaches
adulthood she should become a housewife and devote herself particularly to
the care of her children
B The Panamanian Woman in the Economically Active Population
During the first decades of this century the activity of the Panamanian
woman as that of women in most of Latin America was limited by cultural
traditional educational and religious factors to household chores her work
was restricted almost exclusively to being companion to the man of the house
and to taking care of the children born in the home
After the 1930s however women began to be trained in certain professhy
sions such as lawyers and nurses which tended to ease their incorporation into
the labor market
Later with the demand for services generated by the Second World War
new opportunities arose for incorporation into the economically active populashy
tion (cooks washerwomen waitresses salesgirls etc) More recently with
the expansion of the tertiary sector particularly in the Metropolitan Region
greater options have opened up to the female population for remunerative
activities outside the home
It is evident that a multitude of reasons explain the progressive incorshy
poration of women into the various fields of economic activity While it is
true that an increasingly important group enters the labor force because of a
desire to advance technically or professionally or to acquire economic indeshy
pendence another very significant portion of women who enter the job market
does so in response to economic pressures either because their husbands
-53shy
income is insufficient or because they are the head of the household (in 21
of Panamanian homes the woman is the main source of support for the family as
a single mother abandoned separated divorced or widowed) In the 1975
Opinion Survey on Women of the total number of working women interviewed
47 were married of this group 80 said they worked for economic reasons
(including financial need economic independence and responsibility)
Furthermore it should also be recognized that there was a change in
attitude towards women working outside the home The above survey shows that
23 of the men interviewed and almost 45 of the women reported that they
thought it was proper for women to work outside the home And most of the pershy
sons interviewed of both sexes agreed that the need to share economic resshy
ponsibility wa the most important reason
Three out of every five men and women also accepted the concept that men
as well as women should work and jointly satisfy the demands of the home
Another factor that may have bearing on the incorporation of the Panamanian
woman into the labor force is the legal protection offered to the working
woman The Third Chapter of Panamas 1972 Political Constitution refers to
work and contains various articles that directly prohibit wage discrimination
for reasons of sex and also protect the working womans right to bear childshy
ren 1 The Labor Code further contains a series of provisions that stipulate
that such protection is a responsibility of the State 3
Panamas Social Welfare Program offers ample guarantees to the insured
woman She has a series of rights under the maternity provisionsThe rights
1 Statistics and Census Bureau 1975 Performed as part of the International Year of the Woman
2 See Annex 1 Legal Dispositions that favor women in part 1a 3 See Annex b Articles 105 to 116 of the Labor Code
-54shy
of women insured against this risk come into force at the beginning of pregshy
nancy and continue through birth and the post-natal period The insured woman
also has the right to 14 weeks of paid leave by Social Welfare which means
that she receives payments in lieu of her monthly salary payments to which
she has a right because of her maternity leave and because of previous contrishy
butions to the system
The above helps to explain the increase seen in the number of women in
the countrys economically active population particularly in the last two
decades The overall participation rates for Panamanian women - 246 - are
among the highest in Latin America and the Caribbean (see disaggregation by
age groups in Table No 3 of Statistical Annex) surpassed only by Jamaica and
Trinidad and Tobago Y According to the 1980 population census (see Table
16) 152145 women were economically active making the total labor force 28
female and 72 male
It is important to note the marked difference between areas of the
total women incorporated into the economically active population almost 4 out
of every 5 were concentrated in the urban area This situation is partly
explained by the fact that educational and skill levels are generally higher
for women in urban areas (see details in Table No 4 of the Statistical
Annex) Also the most important factor is precisely the countrys economic
structure and development with a marked concentration of principal activities
in urban areas where the greatest employment opportunities appear
1 Labor Market in Figures 1950-1980 PREALC 1982
-55-
TABLE 16 ECONOMICALLY ACTIVE POPULATION 10 YEARS OR OLDER BY AREA AND SEX
1980 POPULATION AND HOUSING CENSUS
AREA Sex Total Urban Rural
Number Number Number
Total Economicshy
ally Active 548460 1000 314905 1000 233555 1000
1000 574 426
Men 396315 723 194885 619 201430 862
1000 492 508
Women 152145 277 120020 381 32125 138
1000 789 211
Source Tabulations of the National Population and Housing Census 20 Sampling
Note Figures subject to change
Opportunities for rural women are essentially limited to farming and
livestock activities which in countries like ours are still characterized by
conditions which range from having limited access to property (a high percentshy
age of farms are smallholdings) to employing various levels of technology The
experience of many countries with characteristics similar to those of Panama
shows that the mechanization of agricultural tasks has negatively affected the
size of the female population however in general terms modernization tends
to put both sexes out of work
Other activities that could use female labor are commerce and handicraft
activities but these have not evolved very much in rural areas It must be
noted that most farming and livestock activities produce only for the familys
own consumption
-56-
The Farming and Livestock Census of May 1981 showed that most cultivated
areas are very small in size (about 75 were less than 05 hectares) which
would explain why production is mostly for self-supply There is a close
relationship between farm size and landholding patterns and the generation of
employment in rural areas As can be seen the rural population generally
lives under certain constraints and women are at a disadvantage compared to
men as far as access to land production resources income etc
As in most countries the growth of urbanization in Panama tends to
reduce the number who are economically active in rural areas while there is
growth of this group in urban areas particularly in services commerce and
to a lesser degree industry During the last thirty years a growing portion
of the economically active population in the urban sector concentrated on lowshy
production activities a situation which is closely related to the flow of
people from the rural area towards the cities these people generally have low
levels of education and economic means
1 The Employed Woman
The May 1980 census showed 503540 employed people in Panama of which
134080 were women representing 266 of all employed persons (see Table 17)
Observe the differences in levels of employment by area as shown in Figure
13 about 4 of every 5 employed women work in the urban area
As to age women enter the labor force somewhat earlier than men While
41 of men under 30 were reported to be working this ratio is 50 for women
(see Table No 3 in the Annex)
-57-
TABLE 17 EMPLOYED POPULATION 10 YEARS OR OLDER BY AREA AND SEX
1980 POPULATION AND HOUSING CENSUS
Total Urban Rural Number Number Number
Employed Populashy
tion 503540 1000 284020 1000 219520 1000
1000 564 436
Men 369460 734 177925 626 191535 872
1000 482 518
Women 134080 266 106095 374 27985 128
1000 791 209
Source Tabulations of the National Population and Housing Census 20 Sample Note Figures subject to change
On the other hand when we examine total female employment by age group we
conclude that it begins to rise as of the 15-19 group Its peak is reached
between 20 and 24 (20 of employed women are in this bracket) The next range
from 25 to 29 takes up 18 of all employed women Thereafter the level of
participation in employment progressively declines and then drops sharply at
the 55-and-over group which coincides with the retirement age for women (age
55 although in accordance with Panamas Social Security legislation they can
take early retirement at 50)
There are no significant variations in employed female participation at
the urban and rural levels In both regions the age groups that show the
highest percentage of employment are the 20-24 and 25-29 brackets
The higher participation of women in the employed population for the
groups noted is partly explained by the fact that when women reach these ages
4
FIGURE 13
EMPLOYED POPULATION BY SEX AND AREA - 1980 CENSUS
EmDloved Population
200000shy19|535
3oo d eOgooee
1 1I1-TOTAL 503540 150000 MenM EW 0 36904601o4
I OOOOee e OOeO
ee g
eoee~e 150 00000 Se
oeeeoeel oeeoe
e Ce1 g- oeoeo4 eoo so
1779254
oeeoe OeOeee5ge 00000 oeoog geeo
cbull S bull egO c OOOeso s 1 10-- -6-0--9 5 bull o TOTA 50054 bull bull ge
100000 bull1 [1 e g_ 1 1S 2 oeoeo
e1g bullcent-ebullg
bulle gebull com~ eoeeol
oe oes eooebull ibull bullbullbulleo
ooo~o~e egoooo
meo seoeo ---- e eeoooee
emceee U Re6Ae oR RA c- -shymeeo
eeee ee ee bullbullee 11
oeebullegeoe
eeeeo mOg
ee OmObull
sc es - me c |-0oe bull-
URBAN RURAL
SOURCE 20 Sampling Tabulations of 1980 Census - Population Dept MIPPE
-59shy
they have left the formal educational system on the other hand it is at
these ages that men as well as women need a fixed income to meet the needs of
families just being formed
A factor that greatly influences employment opportunities for men and
women is the level of instruction If we examine statistics for the population
10 years or older by type of activity and level of instruction (see Table No
4 of the Annex) and take as a reference point the total number of employed
women we see that employment rises in direct proportion to the level of edushy
cation Women with no education represent only 3 of total women employed and
there is a great difference as to the participation of women having partial or
complete primary education (12 and 23 respectively) The women who particishy
patp most in employment are those having partial or complete secondary educashy
tion Women at these level- of education represent 42 of total women emshy
ployed Furthermore women with university training hold nearly 20 of all
jobs for women To understand this situation it must be appreciated that the
average level of education for both men and women in the country is about 56
years of primary school This means that most of the jobs for women are going
to those who have education levels well above the national average
2 Unemployment and Women
Unemployment is one of the social problems that most affects the populashy
tion due to its close linkage with family income and consequently its impact
on limiting the populationss ability to satisfy its basic needs
Traditionally unemployment rates in Panama have been much higher among
women than among men During the 1970s a series of fluctuations occurred with
respect to employment generation a situation intimately tied to the countrys
economic outlook During this period some 13000 jobs were created each year
wilich was not enough to absorb unemployment nor to meet the job demand caused
-60shy
by those people entering the economically active population for the first
time Thus there was an increase in unemployment from about 7 when the decade
began to 9 at its end
The most serious rates of unemployment were towards the end of 1977 and
early 1978 In response to the problem especially in the countrys
Metropolitan Region the National Government created the Emergency Plan which
offered employment at a monthly wage of 100 balboas to some 25000 people of
which 70 were women Of every 10 persons hired under this Plan 9 lived in
the cities of Panama and Colon (the countrys major urban areas)
Given the situation that arose when the Emergency Plan was created it
must be noted that the large number of persons that took advantage of the Plan
and the high percentage of housewives revealed the existence not only of an
unemployment problem but also of a large contingent of people who while
having some family income had to seek additional work through the program
because their income was so minimal
An analysis of the work or tasks performed before entering the plan
shows the low level of education of those benefiting from the Plan It was
also seen that a high proportion of women had only performed work related to
services including domestic service (49) before entering the Plan and 28
had not worked at all and considered themselves housewives I_
Unemployment in Panama primarily affects men and young women while it
is comparatively low among older people who constitute the main labor force
and are for the most part heads of households This confirms the theory that
heads of households tend to remain unemployed for less time than other
segments of the work force as the main providers of income in the home they
I A Policy of Employment through the Emergency Plan MIPPEMITRAB 1978
-61shy
must find work of some kind since they cannot afford the luxury of having no
income for daily sustenance
As seen in Table 18 the May 1980 Census showed 44920 unemployed people
which translates into 82 open unemployment The problem shows differences by
area (see Figure 14) also affects men very differently from women who are in
a much worse situation Table No 4 of the Annex shows male unemployment at
68 while female unemployment was 119
Unemployment is concentrated in the countrys urban areas where 7 out of
every 10 unemployed persons live If we disaggregate female unemployment by
area we note that more than 75 of unemployed women lived in urban areas exshy
plained by the slow growth of the economy particularly in the last decade
which prevented the creation of sufficient jobs to meet the growing demand for
employment in urban areas
TABLE 18 UNEMPLOYMENT BY SEX AND AREA
1980 POPULATION AND HOUSING CENSUS
Total Urban Rural Number Number Number
Total Unemployed
Population 44920 1000 30885 1000 14035 1000
1000 688 312
Men 26855 598 16960 549 9895 705
1000 632 368
Women 18065 402 13925 451 4140 295
1000 771 229
Source Tabulations of the National Population and Housing Census 20 Sampling
Note Figureu subject to change
-62-
FIGURE 14
UNEMPLOYMENT RATES BY SEX AND AREA - 1980 CENSUS
RATERATE UNEMPLOYED
129 POPULATION 44920130
TOTAL120 oo-M E N -shy
110 W 0 M EN ijI10O0 9-8 i
90 87
80
700
50
40
20 f
20~
0
U R BAN RU R AL
SOURCE 20 SampLing 1980 Census TabuLations SCB and Population Dept
MIPPE
-63-
Unemployment also varies by age As noted young people of both sexes
are the most affected by unemployment in our society At the time of the
census just over half of the unemployed - 53 - were under 25 (see Annex
Table No 3) There is also an important group of new workers among the
unemployed who could not find jobs due to the limited opportunities in the
Panamanian labor market
C Female Participation by Field of Activity
In explaining the distribution of employment by fields of economic
activity the countrys economic structure must be taken into account For
statistical purposes census information classifies the employed population
into ten fields of economic activity As an underdeveloped country Panama
still maintains a high percentage of its total employed population in agrishy
culture hunting fishing and forestry although the labor force in these
activities has gradually declined In the early 1970s about 37 of employed
persons were in this sector dropping to 29 in the 1980 census Towards the
end of the 1970s and early 1980s the farming and livestock sector contracted
showing negative growth rates Contributing to this were a reduction in the
harvested area for some traditional crops without concurrent increases in proshy
ductivity as well as a deterioration of production in traditional areas -
Furthermore the problem of seasonality in the agricultural sector is also
related to under-development and to the economic insecurity of people who work
in the basic production activity of the rural sector
The fields of activity which occupy second and third place in conshy
centration of the employed population are Communal Services (social and
personal services) and Retail and Wholesale Trade including restaurants and
1 Bases for Panamas Economic and Social Development Working Document MIPPE December 1980
-64shy
hotels The grow4alg importance of these activities is closely linked to the
countrys historical economic development in turn related to the traditional
role of the Interocean Transit Zone which has favored the development of
services and commercial activities
Marked differences can be discerned in the distribution by sex of the
employed population (See Table 19) while 376 of employed males were in
agriculture hunting forestry and fishing only 43 of females were involved
in this field Certain reservations must be applied to this indicator since
there generally is under-reportin_ of female participation ia these activishy
ties
For the most part the situation arises for people who receive no remuneshy
ration and only devote part of their time to a given economic activity and
those not covered by a legal or at least a formal relationship with other
members of the economic enterprise This usually occurs in the categories of
household workers (tbose who do not receive a salary for their work in the
usual sense) and self-employed workers It is more frequent in the case of
women who often devote only part of their time to economic activities and who
perhaps consider other activities as more important The most common example
are precisely women in traditional agriculture where there is no distinction
between household chores and those on the farm
As in many other societies women in Panama play a fundamental role in
all activities related to family production and domestic work in general The
rural Panamanian woman works hard from sunrise to sunset She starts early to
collect water cook food wash tend the children and the farm animals and
help the man of the house with sowing and harvesting activities If we were to
ask a farmer if his wife works a frequent answer would surely be that she
Type of Activity
T 0 T A L
Farming hunting forestry andfishing
Exploitation of mines and quarries
Manufacturing Industries
Electricity gas and water
Construction
holesale and retail trade andrestaurants and hotels
Transport storage andcamnications
Financial establishments insurancereal estate and support services
Ccmnal social and personalservices
Canal operation and defense
Unknown
TABLE 19EMLYED POULATIC 10 YEARS AND OLDER EL TE OF ALTIVITY
ACCORDING TO SX 1990 CENSUS
Total MenNumber Percentage Number Percentage
503540 1000 369460 I100
144590 287 133870 376
965 02 80 02
52720 105 41235 112
7965 16 6645 18
29825 59 28430 77
67920 135 44130 119
28840 57 23695 64
19290 38 11695 32
128815 256 55700 151
16390 33 13330 36
6230 12 4840 13
Wn Number
134C8)
5720
75
11485
1320
1395
23790
5145
7595
73115
3050
1390
Percentage
1000
43
01
86
10 a
10
177
38
57
545
23
10
Source Tabulations of the National Population and Housing Census - 20 Sampling available at the Population Department MPPE
Note Figures subject to change
-66shy
doesnt since she receives no pay for the myriad of chores she performs From
this we can surmise that in Panama as in many other countries there is a
tendency to assign a marginal function to womens contribution to agricultural
production and not recognize it thus explaining the limited number of women
classified as employed in various tasks pertaining to the agricultural sector
Among the ten fields of economic activity both sexes participate
least in the exploitation of mines and quarries - only 02 of the total
employed population and 01 of female employment which is explained by the
scant mineral activity at present Furthermore if it were to be increased
the participation of women would be limited by legal dispositions (See Annex
1 Article 104 of the 1972 Labor Code)
Specifically analyzing the total employed female population we
conclude that constrained by the countrys economic structure which in turn
dictates the demand for labor and the orientation of training most employed
women - 545 - are in communal social and personal services With respect to
the high percentage of women in services it must be noted that although women
in our society are slowly changing their thinking as to job choice a prefershy
ence for certain occupations still prevails mostly services of all types
such as secretaries teachers professors nurses It can also be observed
that for cultural reasons or due to the direction of their training all
these occupations are intimately associated with the role of the mother (carshy
ing for guiding and tending to others) This field also includes a considershy
able number of people employed in services requiring very low levels of trainshy
ing and who perform tasks similar to domestic chores but who if taken as part
of the labor force represent extremely low incomes (cleaning women messenshy
gers guards manual laborers etc)
-67-
The second important field of activity for Panamanian women though
far removed from the first is that of retail and wholesale commerce and
restaurants and hotels Commercial activity has been rather important throughshy
out the countrys historical and economic development but has always been
concentrated in what is today the Metropolitan region of the country particushy
larly in the cities of Panama and Colon where more than 60 of all commercial
establishments are located This concentration is more evident for wholesale
establishments 75 of which are in one of the two provinces of the Metroposhy
litan Region the province of Panama From this we can clearly conclude that
trade basically offers a training opportunity particularly to urban women and
especially in one region of the country
The third important occupational field for female employment is the
manufacturing industry where 86 of employed women can be found Panama has a
very incipient industrial sector which faces many problems and limitations
such as the scant integration of industrial activities amongst themselves and
with the other productive sectors In general the industrial sector is inshy
complete with very little development in the production of intermediate goods
Furthermore with the exception of the Construction Sector the dynamism of
industry does not meet the demand generated by the other productive sectors
nor does it produce a demand for these sectors Another limitation of the
industrial sector which in turn restricts the employment opportunities it can
offer is the reduced internal market and the inaccessability of the external
market given the fact that with few exceptions industrial productivity is
low and there has been no effective policy for promotion of exports I
1 See Bases for Panamas Economic and Social Development MIPPE December 1980
FIGURE 15
WholesaLe amp retail tradee Transportatio storage rstaurents- d hIote1s 171
communications 38 0 e Constructioni 10 amp-communicatons38 e- Electricity gas amp water 10
bull ~ =o
Financial establishments real estate insurance and support 4- o o services 57 o 1 - - Manufacturing industries 86i~~ii
e 0D tlll ~-
SSdeg o) t deg eo 0 g degbull v
S Exploitation of mines and bull t I t shy
14 quarries- 01 bull hunting forestry -AgricuLtureiiiand fishing 43
Unknown 10
4 wOperation and defense of the Cann4
Communal social and personal services 545
EMPLOYED FEMALE POPULATION BY FIELD OF ACTIVITY - 1980 CENSUS
SOURCE 1980 Censils Tabulations - 20 Sampling SCB amp Population Deot MIPPE
-69-
The fourth important field of activity for female employment is that
of financial establishments insurance real estate and commercial services
This field employs 57 of working women and acquired significance only reshy
cently particularly during the 1970s when the International Banking Center
expanded rapidly with favorable repercussions on employment generation
As can be appreciated almost 87 of employed women are in the above
four fields of activity with the other relatively minimal percentages distrishy
buted among the remaining seven fields of activity The fields of employment
activity for women are summarized in Figure 15
D Occupations of Women in Panama
For statistical and census purposes the employed population is also
classified into ten occupational groups
At the national level and irrespective of sex the three most imshy
portant groups as to number of people employed are farmers cattlemen fishshy
ermen hunters followed in importance by workers in personal and related sershy
vices in third place artisans and workmen This ranking shows variations by
sex
Table 5 of the Annex which provides details of the employed populashy
tion 10 years or older by occupation and sex shows that approximately three
of every 10 working women are employed in the so-called personal and related
services From this we can conclude that women are engaged in occupations that
usually pay low wages This is particularly true for women without the educashy
tion which would allow them to aspire to occupations requiring a certain de
gree of specialization Following in importance with 26 are office workers
and women in related occupations This is partly due to the fact that many
women still follow courses of study which traditionally have been considered
feminine such as secretarial accounting and other courses related to general
-70shy
office work In the 1975 Opinion Survey I mothers ranked the professions
they would like their daughters to pursue as follows medicine nursing
secretarial work office work accounting or auditing
In third place 21 of women rre in technical professions or related
activities For this percentage the educational characteristics of the female
population described in Chaper II must be taken into account Reference is
made there to the gradual improvement of womens levels of education includshy
ing higher education As concerns the incorporation of women into the counshy
trys economic and social development it is significant that one out of every
5 emplcyed women is in this occupational group
The three occupational groups mentioned host the large majority of
the female population shown as employed in the last census - 766 - with
approximately one out of every four employed women in the seven remaining
occupational groups These data on the occupational distribution for women are
summarized in Figure 16
Although the three major occupational groups are the same in both
urban and rural areas there are variations in their order of importance In
urban areas 292 of employed women are office workers or hold related jobs
followed by 284 in personal and related services and by 219 in professhy
sionaL technical and related occupations In rural areas female participation
by occupation is as follows 357 (more than 13 of rural women) in personal
and related services followed by 169 in professional technical and related
occupations and thirdly 130 in office work and related occupations
_ Opinion Survey on the Panamanian Woman Statistics and Census Bureau Controller General of the Republic 1975
FIGURE 16
PERCENTAGE DISTRIBUTION OF FEMALE POPULATION BY OCCUPATION
1980 CENSUS
Office workers and related occupations
Managers administrators and
Director-Level Officials 36
i Professionals technical amp related occupations
li-l or non-declared occupationsIM and other workers
4 0 f
Saleswomen amp re- Lated occupations 0o t
- C Farming cattle- -- 4 299 Workers in personal and raising fishing I o related servicesh u n t i n g 2 T - -
Conductors of means of Workwomen amp day-laborers 13 transport amp related bull02
Artisans amp craftsmen Other artisans 47 amp craftsmen
12
SOURCE 1980 Census Tabulations - 20 Sampling BSC Z Population Dept - MIPPE
-72-
E Occupation Level of Instruction and Income
The 1980 Census statistics reveal that employed women on the averge
have a higher level of education than employed men since 198 of them have
some university training as compared to only 89 of men (See Table 20)
It is worth noting that 111 of employed men have no education while
urban areas where 228 of employed women have a university education as
against 167 of men The difference is even more pronounced in rural areas
w1ere 84 of employed women have university training as opposed to only 1 7
of employed men
It is interesting to note that 186 of employed men in rural areas
have no educational background while only 84 of employed women present this
characteristic This is partly explained by the fact that there are more men
than women agricultural workers and that the performance of this type of actishy
vity does not require a knowledge of reading and writing Figure 17 illusshy
trates the important relationship between education and womens employment
303 of employed ren and women declared a monthly income of less
than B125 (see Table 21) and 269 receive between B125 and B249 men
and women alike However for those earning between B250 and B599 or
232 of the total employed population there is a larger representation of
women (293) than men (211) At the highest income level (B600 or more)
men are more likely than women to be in this group
An analysis shows that in the urban area there is a larger proportion
of women than men earning less than B125 per month (281 and 156 respectshy
ively) while more men than women earn B600 or more (143 and 72 respectshy
ively) In rural areas the most notable differences are in the B250-B599
group - 130 of men and 192 of women are in this group (See Annex Table
No 6)
-73-
Table 20 E KDYED POPUIMCV 10 YEARS OLD AND OVER EY LFWEL
OF INSCRUIION AREA AND SMX 1960
Sex Level of Instruction Total Men Women
andSex No No NO
Total 503540 100 369460 1000 134C820 1000
No education 44920 89 40925 111 3995 30 Unfinished primary 109230 217 93510 253 15720 117 Completed primary 132650 263 102295 277 30355 226 Unfinished secondary 93770 186 64335 174 29435 220 Completed secondary 59945 119 32855 89 27090 2D2 1 to 3 yrs college 4 or more yrs college
27520 32030
55 64
14000 18995
38 51
13520 13035
101 97
Unknown 3475 07 2545 07 930 07
Urban 234020 1000 177925 1000 106095 1000
No education Unfinished primary
6950 33850
25 119
5305 23995
30 135
1645 9855
16 93
Completed priary 64915 229 43115 242 21800 205 Unfinished secondary 73285 258 47840 269 25445 240 Completed secondary 1 to 3 yrs college
48675 24295
171 86
26280 12270
148 69
22395 12025
21 1 113
4 or more yrs college 29670 104 17520 98 12150 115 Unknown 2380 08 1600 09 780 07
Rural 219520 1000 191535 1000 27985 1030
No education 37970 173 35620 186 23-50 84 Unfinished primary 75380 343 69515 363 5865 210 Completed primary 67735 309 59180 309 8555 306 Unfinished secondary 20485 93 16495 86 3990 143 Completed secondary 11270 5-i 6575 34 4695 168 1 to 3 yrs college 3225 15 1730 09 1495 53 4 or more yrs college 2360 11 1475 08 885 31 Unknown 1095 05 945 O5 150 05
20 SmplnSource 19890 Population and Housing Census Tabulations Statistics and Census
Bureau Controller General of tle Republic
-74-
FIGURE 17
EMPLOYED FEMALE POPULATION BY LEVEL OF INSTRUCTION1980 CENSUS
Employed FemaLe PopuLation UNKNOWN 930 TOTAL 134080
321000
0355
30000- 2-01435
3o 25000shy
2opooshy
15720 580 00-
3
3 035
X10900shy --
i~
5i000]- I]3995
8000 2pooshy
0- -- _L L~~~~~ _
00 0 gtshy
wHiz- LUI gt- I- I-gt- n gt- - H
Ei _Jlt- x z - J Z L L - ALL - oz o ZL U ZZ U
S T u iw 20 S pl n C amp 0 a De shy -IPPE
SOURCE 1980 Census TabuLations -20 SampLing BSC amp PopuLation Dept -MIPPE
-75-
TABLE 21 EIPLOYEr POPULATION 10 YEARS OR OLDER BY MONTHLY INCOME AND SEX
1980 CENSUS
Monthly Income
Total
Men Sex
Women Number Number Number
Total 503540 1000 369460 1000 134080 1000
Less than 125 152465 303 110605 299 41860 312
125 - 249 135545 269 97765 265 37780 282
250 - 599 117075 232 21177805 39270 293 600 or more 353)5 70 27680 75 7715 58
Not declared 63060 125 55605 150 7455 55
Source 1980 Population and Housing Census Controller General of the
Republic
Observing average monthly income by category of employment (see Annex
Table No 7) the most representative category for income groups above B125
is that of permanent workers For those earning less than B125 per month
the women are mostly permanent employees while the men are mostly selfshy
employed
Educational level is a determining factor in obtaining higher incomes
and in Panama there is a close correlation between these variables As shown
in Table 22 for the country as a whole the average monthly income for emshy
ployed persons is slightly higher for women (B19370) than for men
(B18100) It should be noted that although the situation for women would
appear to be better than that of men overall if we examine in detail the
difference in income by sex for the various educational groups men show an
average monthly income higher than women with the same educational level The
high overall average income for women is due to the fact that more than 50 of
-76shy
working women have secondary education or better while more than 60 of workshy
ing men have primary education or less With an economic participation rate of
only 25 (compared with mens 63) women who are not well-educated tend to
remain outside the paid labor force This situation is not true for men makshy
ing the average earnings seem high for the smaller but better educated
female labor force
In general terms as men and women attain a greater degree of educaL
tion their opportunities for higher incomes increase For men the average
monthly income goes from B7860 among groups having no education to
B16080 for those having finished primary school B31990 for those having
finished secondary school and B73760 for those having 4 or more years of
university education
For women this behavior is similar As an exanDple the incomes of
women with 4 or more years of college are nine times greater than those of
women having no education Working women with no education have an average
income of B5300 while those having finished primary school earn B10300
those having finished secondary school B28010 and those having 4 or more
years of college B46700
It has been observed that there is a disparity in incomes between men
and women having the same degree of education at lower levels of instruction
(from no education to primary education) the difference varies between 48 and
56 in favor of men for the intermediate levels (secondary education to 3
years of college) there are differences between 14 and 27 also in favor of
men and at higher levels (4 or more years of college) the gap widens with a
difference of 58 in favor of men
This situation expressed in figures reveals that women with no
education receive an average monthly income of B5300 while men at the same
-77shy
level receive B7860
Men who have completed primary school earn B16080 while women only
earn B10300 Upon completion of secondary school men receive B31990
while women receive B28010 and after 4 or more years of college men earn
an average monthly income of B73760 while women earn B46700 which is
only 63 of what men earn
The income difference between the sexes is more acute in urban areas
for the lowest educational levels it varies between 89 and 123 in favor of
men at the intermediate levels between 16 and 28 which maintains the
overall trend and for the highest educational level the difference is 59
that is women earn 63 of what men earn showing that in urban areas the
trend is the same as it is nationally
The situation is more or less the same in rural areas although
slightly improved for women having higher levels of education since here they
earn 68 rather than 63 of what men earn More detailled information appears
in Table 6 of the Statistical Annex
-78-
Table 22 AVERAGE MHT2( INCME MOR B4PIYED POULMATN 10 YEJA1 OLD AND OVER EY
AGE
Level of Instruction and Area
Total
No education Unfinished primary Completed primary Unfinished secondary Completed secondary 1 to 3 yrs college 4 or more yrs college Unknown
Url-en
No education Unfinished primary Completed primary Unfinished secondary Completed secondary 1 to 3 yrs college 4 or more yrs college Unknown
Rural
No education Unfinished primary Completed primary Unfinished secondary Completed secondary 1 to 3 yrs college 4 or more yro college Unknown
20 Sampling
LEVEL OF INSTWCTION AREA AND SEK 980 (InBalboas)
Total n Women
Incae Income Popl~ation Inomw PF2ilaticn
1846 1810 369460 1937 134080
743 786 530 1047 1102 731 1434 1608 1030 2106 2256 1778 2985 3199 2901 3412 3685 3203 5912 7376 4670 1707 1915 153o6
2357 2471 177925 2132 106095
12D0 1363 611 1477 1731 871 1711 2056 1085 2208 2387 1868 3089 3360 2363 3464 3755 3245 5876 7504 4716 2215 2500 1623
1069 1055 191535 1160 27985
675 695 47-4 822 E54 587
1117 1159 833 1656 1781 1247 2581 2628 2533 383 3275 291-3 5081 5959 4048 1006 936 1125
Source 1980 Population and Housing Census Tabulations Statistics and Census Bureau Controller General of the Republic
-79-
The above analysis shows that women must work harder than men to obtain
higher incomes since to compete in the labor market they must possess a higher
level of education than men and still receive a lower income Therefore much
care must be taken in using information on the monthly average income of emshy
ployed persons since the figure is subject to the factors noted above minoshy
rity participation of women in employment and a greater level of instruction
for employed women compared to employed men
F Women and Categories of ERployment
The analysis of employed women by category of employment presents varshy
ious interesting aspects (See Table 23) Natiorlly 69 of employed persons
belong to the category of salaried workers 24 are self-employed 4 are
family workers and 2 are landowners or proprietors
For employed women this structure changes somewhat since 89 of them
are salaried 7 are self-employed 1 are family workers and 1 are landshy
owners or proprietresses However employed men have the following distrishy
bution 62 are salaried 29 are self-employed 5 are family workers and 2
are landowners or proprietors
The case is the same for urban and rural areas since in Loth there is a
greater proportion (by sex) of women that are salaried and a smaller
proportion of women that are self-employed family workers or landowners
Of every 10 working women 8 are in the urban areas where 93 of them
are salaried while only 5 are self-employed In rral areas 75 of women are
salaried while self-employed workers represent 16 and about 5 are family
workers
As derived from Annex Table No 7 34 of salaried workers are in the
public sector 61 are employed in private businesses 4 work for the Panama
Canal Agency and 1 work in cooperatives or communal organizations
-80shy
57 of salaried women like most of the salaried population work in
private enterprise while 40 are in the public sector and 2 work for the
Panama Canal Arency
Of all salaried persons 76 work as permanent employees whilc 24 are
part-time workers Among all salaried women 82 are permanent labol while 18
are part-time workers This ratio is about the same for women in urban areas
while in rural areas 71 work as permanent employees and 29 are part-time
workers
Analyzing employment categories by average monthly income of all
employed persons those working for the Panama Canal Agency have the highest
levels of income permanent staff receive an average monthly income of about
B534 while part-time workers receive B341
TABLE 23 EMPLOYED POPULATION 10 YEARS OR OLDER BY CATEGORY OF
EMPLOYMENT AND SEX1980 CENSUS
Category of Employment
Total
Employed
Part-time
Permanent
Self-Employed
Proprietors (owner)
Cooperative
Family Worker
Not Declared
Total
Number
503540
347245
82260
264985
118220
9085
2020
19720
7250
1000
69o
153
527
235
18
04
39
14
Men Number
369460
227805
60850
166955
108795
7795
1915
18035
5115
Sex
1000
617
165
452
294
21
05
49
14
Women Number
134080 1000
119440 891
21410 160
98030 731
9425 70
1290 10
105 01
1685 12
2135 16
Source Tabulations of the 1980 National Population and Housing Censuses Statistics and Census Bureau Controller General of the Republic
-81-
This category is followed in order by permanent government workers with
B294 proprietors with B262 and permanent workers in private enterprise
with B202
The remaining employment categories present average monthly incomes
below B200 Among those between B100 and B200 are permanent employees of
cooperatives (B157) part-time workers Jn the public sector (B152) and
part-time workers in private enterprise (B103)
The least privileged employment categories in terms of monthly income
(below B100) are part-time cooperative workers (B94) workers in producshy
tion cooperatives or communal organizations (B74) self-employed workers
(B73) and family workers (B46) 1
The pattern for men is similar to that of all employed workers that is
they follow practically the same order of importance for average monthly inshy
come by category of employment For women however there are certaiL variashy
tions in the weight these employment categories have with regard to income
As in the case of all workers the highest average income is for women
who are permanent staff of the Panama Canal Agency (B522) although they
receive about B14 less than men These are followed in order by permanent
government workers (B293) where there is barely a B200 difference in
favor of men Then employers or landowners with B210 (B67 less than men)
and part-time workers at the Panama Canal Agency with B202 (B79 less than
men)
_ By definition family workers are persons who receive no salary for their work but who receive other types of income
-82-
Among employed women with an average monthly income between 100 and 200
balboas are permanent workers in the private sector with B170 permanent
employees of cooperatives with B145 part-time government workers with
Br132 and workers in production cooperatives or communal organizations with
B100 It must be stressed that this last group is the only one outside of
family workers where women have an average monthly income higher than men
(B100 for women as against B73 for men)
In the other employment categories women earn a monthly income below
B100 These include part-time workers in private cooperatives (B72)
self-employed workers (B68) part-time workers in private enterprise (B67)
and family workers (B51)
As can be appreciated self-employed women earn almost the same as women
who are temporarily employed in private enterprise It is also iateresting to
point out that urban women irrespective of occupational category earn higher
incomes than women in rural areas The differences in income vary between
categories from 20 to 150 Aj an example there is a differenc-1 of almost
100 for self-employed women that is the urban woman receives twice iiat the
rural woman earns a situation similar to that of permanent government workers
and those in productive cooperatives or communal organizations
For part-time workers of the Panama Canal Agency part-time workers in
private enterprise permanent staff in private enterprise and permanent
workers in production cooperatives these differences range from 1 to 100
In the remaining categories the differences in income by area are
smaller part-time workers in cooperatives 37 part-time government workers
26 and owners 20 always in favor of the urban area
-83-
G The Economically Inactive Woman
Although the incorporation of the Panamanian woman into the countrys
economic activity has gradually increased there is still a large percentage
of women who are outside the paid labor force (723 of women 15 years of age
or older)
Various reasons explain this situation a considerable group of women
have not entered the economically active population because they see little
chance of finding a job If the job market were less restricted a greater
number of women could be expected to participate in some economic activity
Furthermore the level of training of many women is so low that their opporshy
tunities are limited for finding a job with sufficient remuneration to justify
leaving their homes and the care of their children
To a large degree the high percentage of women that do not participate
in the labor market is due to the structure of the division of labor by sex
Although it 49 recognized that there have been changes in the conception of
roles in society in many cases secondary importance is given to the tasks
that women must perform while the work of men is given greater value
Furthermore there are functions which are intrinsic to the condition of
women which lead them to permanently perform their basic social role in the
context of the family Their biological function is to reproduce which is
closely linked to the care and up-bringing of children and also the job of
running the household in general This explains why many women do not stay at
their jobs long but enter and exit the labor market at various times in their
lives Table 24 shows that slightly more than 460000 women were registered as
economically inactive in the 1980 census with most of them falling into two
groups housewives and students
Table 24 ECONOMICALLY INACIVE POLATIM 10 YEARS OF AGE AND OVER
BY TYPE OF INACTIVE FNSOT AND ME 190 CENSUS
InType of Inactivity WomenTotal Percentage Number Percentage Number Percentage
Tc2067 1000 231650 1000 460417 1000 Housewife 265990 384 2140 09 263850 574
Student 302095 437 151555 655 150540 327
Invalid 6545 09 3855 17 2690 06 Retired with pension 25970 38 16790 72 91W3 20
Pensionees and private income recishypients 9160 13 5320 23 3840 08
Retirees 6360 09 4470 19 1890 04 People in institutions 5997 09 4460 19 1527 03
Other situations 69969 101 43060 186 26900 58
Source Tabulations of the National Population and Housing Census - 20 Sampling
Statistics and Census Rteau Controller General of the Republic
Note Figures subject to change
-85-
The first group in importance within the non-active group is that of
housewives (574) who perform chores traditionally assigned to women and
which have unjustly been treated as activities lacking any economic value In
Panama as in most countries thetie activities are not considerd work since
they fall outside the realm of exchange and the market Their invisible nature
is clearly evidenced by the fact that housewives are classified as economicshy
ally inactive population I1On the other hand there is a high percentage of
women ten years of age or older that remain in the educational system (327)
which is a very positive factor in the improvement of womans condition in
society and in the countrys economic development in general
TABLE 25 POPULATION 10 YEARS OF AGE OR OLDER ECONOMICALLY INACTIVE
BY RURAL AND URBAN AREAS 1980 CENSUS
Total Urban Rural
Economically Inshyactive Population 692067 1000 365790 1000 326277 1000
1000 529 471 MEN 231650 335 129963 355 101687 312 1000 561 439
WOMEN 460417 665 235827 645 224590 688 1000 512 488
Source Tabulations of the National Population and Housing Census 20 Samplshying Statistics and Census Bureau Controller General of the Republic
As illustrated in the chapter on education there are practically no
differences in levels of instruction between the sexes At certain levels of
the system there is even a higher ratio of women than men
1 For census purposes the Census-Takers Manual defines the housewife as a person who is solely and exclusively devoted to domestic tasks or chores in her own home and who is not seeking employment is not retired not on a pension does not earn rental income nor goes to school There can be more than one housewife in a housing unit
-86-
The two groups described (housewives and students) include nine out of
every ten non-active women while the balance - 10 - is distributed among
retired pensioned or income-earning women invalids retired women or women
otherwise institutionalized
As to the distribution by area of economically non-active women
although most of them are in urban communities the difference is not signifishy
cant (See Table 25)
-87-
FINAL COMMENTS
-88-
FINAL COMMENTS
The status of women in Panampia is closely linked to economic social
cultural and politicallfactors In order to promote overall development inshy
cluding enhancing the status of women it is imperative to promote measures
that will allow the effective participation of the population without any type
of discrimination Women themselves must seek the means whereby they will be
taken more and more into account in the activities of the social group to
which they belong
he world is evolving in an accelerated fashion aad th3 role that women
must play in a society underg)ing rapid change is becoming increasingly
evident In recent years significant progress has been noted in the role of
wome3n since they now have greater ana broader possibilities to participate in
various economic social and political activities The scale of opportunities
has greatly increased and women constitute an important segment of the work
force becoming more and more an integral part of the labor market working
alongside men in response to the demands of the economy and their individual
skills
Finally many opportunities for participation exist today for women with
good training and they will have many more in the future given the
innovations and technological advances that occur in response to the economic
and social development process taking place in the country
Fortunately for the Panamanian woman there are no openly discriminatory
attitudes generally speaking which can be blamed for the disadvantageous
position of women The clearest demonstration of this appears in the
educational sector indicators where women are relativoly well placed and from
which it must be recognized that educational training in our society has been
an importaLt factor in uocial and economic advancement
-89-
This does not mean however that there is no cause for concern Quite
the contrary emphasis must continue being placed on the need to find all the
means available so that women like men can achieve economic social and
political success in Panama without distinction of sex
-90-
ANNEX 1
CERTAIN LEGAL PROVISOS THAT AFFECT FEMALE LABOR
A ARTICLES FROM THE 1972 POLITICAL CONSTITUTION OF THE REPUBLIC OF PANAMA
CHAPTER 3
LABOR
B LABOR CODE
ChtPTER II
FEMALE AND CHILD LABOR
-91-
ANNEX 1
CERTAIN LEGAL PROVISOS THAT BENEFIT WOMEN
A - ARTICLES FROM THE 1972 POLITICAL CONSTITUTION OF THE REPUBLIC OF PANAMA
CHAPTER 3
LABOR
ARTICLE 59 -Work is a right and an obligation of the individual and thereshyfore it is the obligation of the State to establish economic
policies aimed at promoting full employment and assuring for all workers the necessary conditions for a decent existence
ARTICLE 62 - Equal salary or wages must be paid for equal work under identishycal conditions whoever performs it without distinctiorn as to sex
nationality race age social class or political or religious beliefs
ARTICLE 65 -The maximum work day shall be eight hours and the maxiLmum work week shall be forty-eight hcurs the maximum night shift shall not
be greater than seven and overtime hours shall be paid over and above the normal wage
The maximum work day will be lowered to six hours per day for people over fourteen and under eighteen Children under fourteen shall not work nor shall children under sixteen work night shifts unless excepted byLaw The employment of minors under fourteen as domestic servants is also prohiaited as is the employment of minors and women in unhealthy occupations
Aside from weekly leave all workers shall have the right to paid vacation
The Law may establish paid weekly leave in accordance with the countrys economic and social coniditions and for the benefit of its workers
ARTICLE 67 - The right of the working woman to bear children shall be proshytected A pregnant woman shall not be severed from public or
private employment because of pregnancy For a minimum of six we3ks prior to childbirth and for eight weeks afterwards a woman shall take obligatorymaternity leave with full pay and will keep her job and all contractual rights When the working mother returns to her job she cannot be fired for a period of one year except in special cases foreseen by Law which will also regulate the special working conditions of pregnant women
B - THE LABOR CODE
CHAPTER II
FEMALE AND CHILD LABOR
ARTICLE 104 - Women are prohibited from working in I- Underground areas mines open pits quarries and in construction activities and 2- Dangerous or unhealthy activities as determined by the Ministry of Labor and Social Welfare
-92-
ARTICLE 105 - The protection of the working womans right to bear children is an obligation of the State
ARTICLE 106 - A pregnant woman can be fired from her job only for just cause and only after prior judicial authorization When an employer wishes to fire a pregnant woman who has given
just cause for dismissal he shall first request authorization from the approshypriate labor jurisdiction to whom he shall prove without doubt that there is justified cause for dismissal
Such authorization shall be handed down as a labor-related summary proceeding
In qny event where a pregnant worker is notified of dismissal or termination with respect to her employment without the prior authorization of the appropriate judicial authority the worker shall present to her employer or to any labor authority a medical certificate as to her pregnancy within twenty days following the notification If she does so the worker has the right to full employment reinstatement and payment of wages from the date of dismissal After the twenty-day period and for the next three months the worker can require her reinstatement but only claim wages from the date the medical certficate is presented In the event the employer refuses the worker can request her reinstatement through legal means
The 20-day period for presenting the medical certificate cannot be interrupted Once it has expired the worker has a three-month prescribed period which begins when the 20 days expire to request reinstatememt and which can be interrupted in any of the forms stipulated in item seven or article 12
This norm objectively establishes the legal framework of maternal labor so that a female employee may not be dismissed during pregnancy unless the following events occur 1 Just cause for dismissal and 2 Prior authorization for dismissal by the labor authorities having
jurisdiction in each case The pregnancy protoction extends from the time of childbirth until three months following the date when the worker returns to her job after childbirth (article 113)
ARTICLE 107 All pregnant workers shall enjoy mandatory leave remunershyated in the same manner as their employment during the six weeks preceding childbirth and the eight weeks following In no event shall the total leave period be less than fourteen weeks however if there is a delay in childshybirth the worker will have the right to be given as mandatory leave the eight weeks following the delivery
Employers shall make uo the difference between the maternity subsidyprovided by the Social Security Board and the wage to which the worker is entitled in accordance with this article
When the Social Security Board is not obligated to cover the maternity subsidy the obligation contained in this article will be entirely the responsilibity of the employer
The Executive Organ is empowered to issue provisions in respect of this article establishing greater leave periods than those stipulated for activities or professions that by their nature require such In these cases the provisions of the two foregoing paragraphs will also apply
Article 93 of the 1947 Code
-93-
If the worker did not report her pregnancy upon beginning her work assignment the employer is responsible in accordance with social security regulations and in conformity with Article 107 of our Labor Statute
ARTICLE 108- To determine the date when paid mandatory leave begins the worker shall present to her employer a medical certificate showing the probable date of childbirth Any phyician employed by the State or any of its institutions shall issue this certificate free of charge If for any reason the pregnant worker is on the job during the leave period prior to delivery the employer is obligated to pay her the corresponding wage plus an equal amount as indemnity without prLdice of the legal sanctions which he may incur
ARTICLE 109- Women on maternity leave may not work on their own
ARTICLE 110- If during the leave periods referred to above illness should occur as a result of the pregnancy or delivery the worker shall
have the right to extended leave for whatever time is prescribed under medical certification
The period resulting from the extension of paid leave shall be covered completely through a subsidy from the Social Security Board if the worker is affiliated If the Social Security Board is not obligated the provisions of Article 107 shall apply
ARTICLE 111- Payment for mandatory leave shall be on the basis of the last salary received or the average salary for the latest one hundred
and eighty days whichever is greater
ARTICLE 112- In the event of abortion stillbirth or any other abnormal birth paid mandatory leave shall be paid in accordance with the demands
of the workers health as shown by a medical certificate and the preshyscriptions of the attending physician
ARTICLE 113- From the time the worker returns to her job after childshybirth and up to three months the employer shall be able to dismiss her
only for just cause and after prior authorization in accordance with the provisions of Article 106
Declared unconstitutional by the Social Security Board (November 16 1973) in violation of Article 67 of the Constitution which establishes a legal framework of one year
ARTICLE 114- When breast-feeding all working mothers shall be given a fifteen-minute interval every three hours or if she prefers half an
hour twice a day during her working hours for the purpose of feeding her child The employer shall provide some means of rest within the possibilities of her work and will maintain a sufficient number of chairs available to all workers The time required for this purpose shall be computed for purposes of the workers salary as real work time like the intervals described above
All employers who hire more than twenty women shall be required to provide a locale where women can breast-feed without endangering their children This shall be done taking into account the employers economic possibilities at the discretion of the General or Regional Labor Bureau
-94-
Articles 95 and 98 of the 1947 Code This precept constitutes a furthering of the right of protection that the employer must provide in his work relations
ARTICLE 115- The Executive Organ and the Social Security Board within a year of the force of this Code shall establish child-care centers and
child centers in industrial or commercial sectors where there is a large number of workers The working mother shall be able to leave her pre-school children at these centers where they will receive necessary medical nutrishytional and recreational attention
ARTICLE 116- The pregnant woman shall not work overtime If the worker is subject to rotating shifts at various intervals the employer is
required to make the necessary arrangements so that the worker will not have to work the night or split shifts The shift stipulated for these purposes wil be fixed and not subject to rotations
The employer shall also make the necessary arrangements so that pregnant workers will not perform tasks inappropriate or harmful to their condition
-95-
Annex No 2
Statistical Annex
Table No I Literacy and Illiteracy in the Republic for the Population 10 Years of Age and Older by Area and Sex 1980 Census
Table No 2 Population in the Republic 6 Years Old and Over by Level of Instruction Sex and Age 1980 Census
Table No 3 Population 10 Years Old and Over by Status of Economic Activity Se- Age and Area 1980 Census
Table No 4 Population 10 Years Old and Over bT Status of ActivitySex Level of Instruction and Area 980 Census
Table No 5 Employed Population 10 Years Old and Over by Occupation Sex and Area 1980 Census
Table No 6 Employed Population 10 Years Old and Over by Income Earned Sex Level of Instruction and Area 1980 Census
Table 11o 7 Average Monthly Income for Employed Population 10 Years of Age and Older by Sex Category of Employment and Area 1980 Census
Table No 8 Estimated Population 60 Years and Older by Sex and Age Group in the Republic for Years 1970 1980 1990 and 2000
-96-
TABLE NO LITERACY AND ILLITERACY IN THE REPUBLIC FOR THE POPULATION 10 YEARS OF AGE AND OLDER BY AREA AND SEX 1980 CENSUS
Population 10 Years of age and older Area sex and age Illiterate
Total Literate Number Percent
TOTAL 1312942 1125808 187134 142
10 - 14 228640 208175 20465 90
15 - 19 199829 188350 11479 57 20 - 24 161522 149480 12042 75 25 - 29 134548 121297 13251 98
30 - 34 118342 103338 15004 127
35 - 39 95216 80127 15089 158
40 - 44 79146 64111 15035 190
45 - 49 66314 50942 15372 232
50 - 54 57544 43146 14398 250
55 - 59 46894 35116 11778 251
60 and over 120378 79170 41208 342
Unknown 4569 2556 2013 441
M E N 663060 570958 92102 139
10 - 14 118016 106157 11859 100
15 - 19 99718 94423 5295 53 20 - 24 79212 74045 5167 65
25 - 29 66996 61227 5769 86
30 - 34 59483 52351 7132 120
35 - 39 47658 40419 7239 152 40 - 44 40491 33196 7295 180
45 - 49 34134 26487 7647 224
50 - 54 29230 22034 7196 246
55 - 59 24211 18360 5851 242
60 and over 61590 40940 20650 335 Unknown 2321 1319 1002 432
-97-
TABLE NO (Page 2)
LITERACY AND ILLITERACY IN THE REPUBLIC FOR THE POPULATION 10 YEARS OF AGE AND OLDER BY AREA AND SEX 1980 CENSUS
Population 10 Years of age and older Area sex and age Illiterate
Total Literate Number Percent
W 0 M E N 649882 554850 95032 146
10 - 14 110624 102018 8606 78
15 - 19 100111 93927 6184 62
20 - 24 82310 75435 6875 84
25 - 29 67552 60070 7482 111
30 - 34 58859 50987 7872 134
35 - 39 47558 39708 7850 165
40 - 44 38655 30915 7740 200
45 - 49 32180 24455 7725 240
50 - 54 28314 21112 7202 254
55 - 59 22683 16756 5927 261
60 and over 58788 38230 20558 350
Unknown 2248 1237 1011 450
URBAN 688440 654211 34229 50
10 - 14 106425 102500 3925 37
15 - 19 106174 103727 2447 23
20 - 24 90779 88516 2263 25
25 - 29 75079 73021 2058 27
30 - 34 65246 63133 2113 32
35 - 39 50757 48684 2073 41
40 - 44 40410 38485 1925 48
45 - 49 33297 31053 2244 67
50 - 54 30225 27865 2360 78
55 - 59 24771 22599 2172 88
60 and over 62549 52746 9803 157
Unknown 2728 1882 846 310
-98-
TABLE NO I (Page 3)
LITERACY AND ILLITERACY IN THE REPUBLIC FOR THE POPULATION 10 YEARS OF AGE AND OLDER BY AREA AND SEX 1980 CENSUS
Population 10 Years of age and older Area sex and age Illiterate
Total Literate Number Percent
M E N 328818 313385 15433 47
10 shy 14 53612 51345 2267 42
15 - 19 49802 48567 1235 25
20 - 24 42250 41176 1074 25
25 - 29 36120 35032 1088 30
30 - 34 31248 30218 1030 33
35 - 39 24026 23178 848 35
40 - 44 11552 18693 859 44
45 - 49 16048 15060 988 62
50 shy 54 14245 13232 1013 71
55 - 59 11960 11085 875 73
60 and over 28628 24912 3716 130
Unknown 1327 887 440 332
W 0 M E N 359622 340826 18796 52
10 - 14 52813 51155 1658 31
15 - 19 56372 55160 1212 22
20 - 24 48529 47340 1189 25
25 - 29 38959 37989 970 25
30 - 34 33998 32915 1083 32
35 - 39 26731 25506 1225 46
40 - 44 20858 19792 1066 51
45 - 49 17249 15993 1256 73
50 - 54 15980 14633 1347 84
55 - 59 12811 11514 1297 101
60 and over 33921 27834 6087 179
Unknown 1401 995 406 290
-99-
TABLE NO 1 (Page 4)
LITERACY AND ILLITERACY IN THE REPUBLIC FOP THE POPULATION 10 YEARS OF AGE AND OLDER BY AREA AND SEX 1980 CENSUS
Area sex and age Population 10 Years of age and older
Illiterate Total Literate Number Percent
RURAL 624502 471597 152905 245
10 - 14 122215 105675 16540 135 15 - 19 93655 84623 9032 96 20 - 24 70743 60964 9779 138
25 - 29 59469 48276 11193 188
30 - 34 53096 40205 12891 243
35 - 39 44459 31443 13016 293 40 shy 44 38736 25c626 13110 338
45 - 49 33017 19889 13128 398
50 - 54 27319 15281 12038 441
55 - 59 22123 12517 9606 434
60 and over 57829 26424 31405 543
Unknown 1841 674 1167 634
M E N 334242 257573 76669 229
10 - 14 64404 54812 9592 149
15 - 19 49916 45856 4060 81
20 - 24 36962 32869 4093 111
25 - 29 30876 26195 4681 152
30 - 34 28235 22133 6102 216
35 - 39 23632 17241 6391 270
40 - 44 20939 14503 6436 307
45 - 49 18086 11427 6659 368
50 - 54 14985 8802 6183 413
55 - 59 12251 7275 4976 406
60 and over 32962 16028 16934 514
Unknown 994 432 562 565
-100-
TABLE NO 1 (Page 5)
LITERACY AND ILLITERACY IN THE REPUBLIC FOR THE POPULATION 10 YEARS OF AGE AND OLDER BY AREA AND SEX 1980 CENSUS
Population 10 Years of age and older Area sex and age Illiterate
Total Literate Number Percent
W 0 M E N 290260 214024 76236 263
10 shy 14 57811 50863 6948 120
15 - 19 43739 38767 4972 114
20 shy 24 33781 28095 5686 168
25 - 29 28593 22081 6512 228
30 shy 34 24861 18072 6789 273
35 - 39 20827 14202 6625 318
40 - 44 17797 11123 6674 375
45 - 49 14931 8462 6469 433
50 - 54 12334 6479 5855 475
55 - 59 9872 5242 463o 469
60 and over 24867 10396 14471 582
Unknown 847 242 605 714
Source Tabulations of the National Population and Housing Census 20
Sampling Available at the Population Department of the MIPPE
Note Figures subject to change
-101-
TABLE NO 2 IMULATION IN THE RMJBHIC 6 YEARS OLD ANDOVER BY IMME OF U JMCII
SEX ANDAGE 190 CE JS
Population 6 Years old and over
Sex and Level of Instruction (years of study completed) Average Age Group Total None Primary
Total Coplete Secondary
Total Complete University Not
Declared Years
Declared
Total 15O7523 219193 799687 304047 390234 103742 83729 678 56
6 - 9 194581 66363 126007 2211 13
10 - 14 15 - 19 20 shy24
228640 199829 161522
9777 7769 9066
176495 73595 60640
48779 48680 39460
40438 i13840 68290
-
12525 29216
2746 22025
1930 1879 1501
47 75 83
25 - 29 154548 10497 58979 36117 45016 16938 1876 1 I) 78 30- 34 11342 12296 5827 33064 33172 11671 13365 1222 71 35 - 39 40 shy 44 45 shy 49 50 - 54
95216 79146 66314 57544
1282 13201 13781 12910
48756 41933 33796 30663
25257 19046 1258 11021
24098 173 14058 10409
8451 5829 4692 3423
8828 5918 4171 2927
7C6 712 508 615
65 59 54 49
55 - 59 46894 10449 26467 924 7789 2536 1747 442 47 60 shy 64 65 - 69 70 and over
41290 30836 48252
10325 8264
20557
23383 17116 21026
7430 5726 6963
5862 4239 4715
1944 1427 185
1205 860 855
515 357
1099
43 42 32
Not declared 4569 1112 1524 612 926 205 206 801 47
01 76128B 107917 412954 156021 1E8936 46238 42797 8614 56
6 - 9 96i2 3970 62024 1134 13 10 - 14 15 - 19
11016 99718
5297 3317
9873 39631
239)1 26C56
28770 54851 548O
1X1 13
913 46 74
20 shy 24 79212 3529 3193 21350 32935 13135 9876 8 82 25 - 29 66996 4358 30547 19255 21 21 7796 931 69 79 30 shy 34 5943 5729 299rjX 17052 16035 534 7049 717 71 35 - 39 47658 6161 246C6 12354 1163t 4069 4991 364 66 40 shy 44 40491 6M2 21835 9755 860B 2916 3302 404 59 45 shy 49 34134 6709 17542 6290 7105 2220 2469 309 55 50 shy 54 55 shy 9
29230 24211
6449 5127
15530 13866
5264 4801
5221 3999
1537 1ll
1702 941
325 278
50 47
60 shy64 21110 5323 12251 3829 3C64 997 775 297 44 65 - 69 70 and over
16231 23649
4202 996
9204 10222
2910 31M
2074 2370
622 8E6
565 520
186 551
43 32
Not declared 2321 485 803 312 446 95 110 477 50
746335 11278 35753 148026 201299 _ 40942 7064 57
6 - 9 96453 31393 63933 1077 14
10 - 14 110624 4487 83622 24 78 21666 847 49
15 - 19 ID111 4452 33964 22624 58989 7045 1740 966 76 20 shy 24 82310 5537 2B652 18110 35355 16031 12149 617 84 25 - 29 67552 6139 2B432 17062 23195 9142 9295 491 78 30 shy 34 35 - 39
58859 47558
6567 6667
23337 24148
16012 12903
17134 12464
6337 4382
6316 3937
505 342
70 64
40 - 44 38655 6919 20038 9291 8774 2913 2616 308 58 45 shy 49 32180 772 16254 63o3 6953 2472 1702 199 52 50 shy 54 28314 6461 15153 5757 518) 18E6 1225 237 49 55 - 59 22683 5322 12601 4483 3790 1425 806 164 46 60 shy 64 195 0 5002 11132 3601 2793 957 430 218 42 65 shy 69 70 and over Not declared
14605 24603 2248
4062 10571
627
7912 10804
721
2816 38E1 3CO
2165 2345
48)
805 999 li
295 335 96
171 548 324
42 31 47
Sorce Taulations of the National Popalation Housing Census 2C Sazpling available at the
Population Deparbnent of the Division of Social Plannig YPPE
Note Figures subject to change Not applicable
-102-
JIMATI0N 10 YEA1 TABTE NOo3
OD AND GER [ STUS OF EO0ONrC ACT=VITY AGE AND AREA 1980 CENSUS
SEX
Area sex age
and Total
Total
Population 10 Years Old and Over Econcmically Active Poulation
nan- Unemploy-Eiployed ployed ment Rate
Activity Rate
IgnAL 1252587 584460 503540 44920 82 438
10 - 14 15 - 19 20 - 24 25 - 29 30 - 34 35 - 39 40 - 44 45 - 49 50 - 54 55 - 59 60 and over Unknown
216445 190249 154467 12503 1-13157 90931 75256 62949 54884 45414
L16103 4229
9440 52950 90730 85725 76195 60140 48970 39015 30530 21295 32181 1490
8605 43515 77330 78690 71485 57140 47070 37605 29225 20610 3D965 3500
835 9435
13400 7035 4710 3000 1900 1410 1105
685 1215
190
88 178 148 82 62 50 39 36 36 32 38
12 8
44 278 587 667 673 661 651 620 553 469 277 352
ME N 634335 396315 369460 26855 68 625
10 - 14 15 - 19 20 - 24 25 - 29 30 - 34 35 - 39 40-44 45 - 49 50 - 54 55 - 59 60 and over Unknown
111416 95463 76322 64571 57243 45643 38581 32404 27855 23401 59275 2161
6850 37210 60545 58795 53680 42740 35900 29610 24180 17810 25050
945
6375 31115 53155 54990 51035 40955 34670 28655 23335 17270 27070
835
475 6095 7390 3805 2645 1785 1233
955 845 540 980
10
69 164 122 65 49 42 34 32 35 30 35
116
61 390 793 911 938 936 931 914 868 761 473 437
W0 ME N 618252 152145 13408 1065 119 246
10- 14 15 - 19 20 - 24 25 - 29 30 - 34 35 - 39 40 - 44 45 - 49 50- 54 55 - 59 60 and over Unknown
105029 94786 78145 63932 55914 4528 36675 30545 27029 22013 56828 2068
2590 15740 30185 26930 22515 17400 1300 9405 6150 3485 4130
545
2230 12400 24175 23700 20450 16185 12400 8950 5890 3340 3895
465
360 3340 6010 3230 2065 1215
670 455 260 145 235
82
139 212 199 120 92 70 51 48 42 42 57
147
25 166 386 421 403 384 356 308 228 153 73
264
-105-
TABLE NO3 (Page 2)
F0MMAG 10 YEARS OLD AND OVFR IY STAT OF ECONOMIC ACTIVIY AGE AND AREA 1980 CEMUS
SEX
Area sex age
and Total
Total
Popilation 10 Years Old and Over Econiically Active Population
UnEa- Unmploy-Dnployed ployed ment Rate
Activity Rate
URBAN 6a40 314905 24020 30885 98 457
10 - 14 15 - 19 20 - 24 25 - 29 30 - 34 35 - 39 40 - 44 45 - 49 50- 54 55 shy 59 60 and over Unknmm
106425 106174 90779 75079 65246 50757 40410 33297 30225 24M71 62549 272B
2260 23680 55455 54575 48110 37005 29145 22270 171160 11165 13070 1010
1990 18075 45585 49505 4465 348M0 27830 21300 16415 10735 12265
855
270 5605 9870 5070 3455 2205 1315
970 745 430 805 145
1-19 237 178 93 72 60 45 44 43 38 62
144
21 223 611 727 737 729 721 669 568 451 209 370
ME N 52B88 194885 177925 16960 87 593
10 - 14 15 - 19 20 - 24 25 - 29 30 - 34 35 - 39 40 - 44 45 shy 49 50- 54 55 - 59 60 and over Unkncwn
53612 49802 42250 36120 31248 24026 19552 16048 14245 llq60 2862 1327
970 12565 31955 32935 29505 22720 18430 14670 12160 8405
10005 565
820 9135
26885 30455 27740 21575 17665 14065 11630 8C80 9395
480
150 3430 5C70 2480 1765 1145
765 605 530 325 610 85
155 273 159 75 60 50 42 41 44 39 61
850
18 252 756 912 944 946 943 914 854 703 349 426
W0 ME N 359622 120020 106095 13925 116 334
10- 14 15 - 19 20- 24 25 shy 29 30 - 34 35 shy 39 40 - 44 45 shy 49 50 - 54 55 shy 59 60 and over Unkmown
52813 56372 48529 38959 33998 26731 2)858 17249 159ED 12811 33921 1401
1290 11115 23500 21640 18605 14285 10715 7600 5000 2760 3065 445
1170 8940
18700 19050 16915 13225 10165 7235 4785 2655 2870 385
220 2175 4800 2590 1690 1060
550 365 215 105 195 60
93 196 204 120 91 74 51 48 43 38 64
135
24 197 484 555 547 534 514 441 313 215 90
318
-104-
TAME NO3
P01 IK( 10 YEARS (Page No 3)
01D AND OVER EY _1US OF EOONOMIC ACTIVIT AGE AND AREA 1980 CENSUS
SEX
Area sex age
and Total
Total
Population 10 Years Old and Over Economically Active Population
Unan- Unanploy-Enployed ployed ment Rate
Activity Rate
JURAL 564147 233555 219520 14035 60 414
10- 14 15- 19 20 - 24 25 - 29 3 - 34 35 - 39 40 - 44 45 shy 49 50- 54 55 - 59 60 and over Unknomn
12002) 84075 63688 53424 47911 40174 34846 29652 24659 20643 53554 1501
7180) 29270 35275 31150 23C85 23135 19825 16745 13170 10170 19110
48
6615 25440 31745 29185 26650 22340 19240 16305 12810 9875
18700 435
565 3850 3550 1965 1255
795 585 440 360 255 410 45
79 131 100 63 45 34 30 26 27 25 21 94
65 348 554 583 586 576 59 565 534 491 357 320
ME N 305517 201430 191535 9895 49 659
10 - 14 15 - 19 20 - 24 23 - 29 30 - 34 35 shy39 40- 44 45 shy49 50 shy 54 55 shy 59 60 and over Unknown
57804 45661 34072 28451 25995 21617 19029 16356 13610 11441 30647
834
5890 24-645 28590 25860 24175 20020 17470 14940 12020 9405
18045 380
5555 21980 26270 24535 23295 19390 17005 14590 11705 9190
17675 355
325 2665 2320 1325
880 640 465 350 315 215 370
25
55 108 81 51 36 32 27 23 26 23 20 66
102 540 839 909 930 926 918 913 8B3 822 589 456
W0 ME N 258630 32125 27985 4140 129 124
10 shy 14 15 - 19 20 - 24 25 shy 29 30 - 34 35 shy 39 40 - 44 45 shy 49 50- 54 55 - 59 60 and over Unknown
52216 38414 29616 24973 21916 18557 15817 13296 11049 9202
22907 667
1300 4625 6685 5290 3910 3115 2355 1805 1150 725
1065 10O
1060 3460 5475 4650 3535 2960 2235 1715 1105 685
1025 80
240 1165 1210
640 375 155 120 90 45 40 40 20
185 252 181 121 96 50 51 50 39 55 38
200
25 120 226 212 178 168 149 136 104 7 9 46
150
Source Tabulations of the National Population and Housing Census 20 Sampling available at the Population Departnent MIPPE
Table No 4
POFULATI(X 10 YEARS OLD AND OVER Bf STATUS OF ACTIVTY SEK LEVEL OF IN-SICTION AND AREA 190 CENSS
Population 20 Years Old and Over Area Sex and Level of Instruction Economically Active
Unem- Economic- Not
Total Total Employed Unen-
ployed ployment
Rate all
Inactive Speci-fled
Activity Rate
TOAL 1252587 548460 503540 44920 82 692067 12060 438 No education Incomplete Primary Completed Primary Incomplete Secondary Completed Secondary I to 3 years University 4 or more years University Unknown
117047 352613 299472 286136 100432 44017 39733 13137
46480 115895 144605 105630 68620 29890 33715 3635
44920 109230 132650 93770 59945 27520 32030 3475
1560 6665
11955 11860 8675 2360 1685
160
34 58 83
112 126 79 50 44
692s2 234093 153712 179366 31557 14(2 5988 3987
1285 2625 1155 1140
255 55 30
5515
397 329 483 369 683 679 849 27-7
ME N 634335 396315 369460 26855 68 231650 6370 625
No education Incomplete Primary Completed Primary Incomplete Secondary Capleted Secondary 1 to 3 years University 4 or more years University Unknown
5907 385599 153151 140447 45993 20453 22300 7305
42170 96560
110385 71050 36650 15065 19785 2650
40925 93510
102295 64335 32855 14000 18995 2545
1245 5050 8090 6715 3795 1065
790 105
30 51 7-3 94 104 71 40 40
16212 85624 42076 68802 9253 5343 2505 1855
705 1415
690 595 110 45 10
2800
714 531 721 506 797 737 887 363
W 0 M E N 628252 152145 134c0pound 28065 119 460417 5690 246
No education Incomplete Primary Completed Primary Incomplete Secondary Caupleted Secondary 1 to 3 years University 4 or more years University Unknown
57960 167014 146321 145689 54439 23564 17433 5832
4310 17335 34220 34580 31970 14815 1393
985
3995 15720 30355 29435 27090 13520 13035
930
315 1615 3865 5145 4880 1295
895 55
73 93 113 149 353 87 64 56
53070 148469 111636 110564 22324 8739 3483 2132
580 1210 465 545 145 20 20
2715
74 104 23-4 237 537 629 799 169
Table No 4
POJLAT (Page 2)
10 YEARS OLD AND OVER HI SMAMJS OF ACT MLEV OF INSTRUCTION AND AREA 1980 CENSUS
SEX
Populatian 10 Years Old and Over
Area Sec and Level of Thstmction EconomicaLly Active Unsm- Economio- Not
Total Total Employ5ed Unan-
plyed ployment
Rate ally
Inactive Speci-fied
Activity Rate
URBAN 688440 314905 254020 308 98 365790 7745 45-7 No education Incomplete Primary Completed Primary Incomplete Secondary Completed Secondary 1 to 3 years University 4 or more years University Unknown
25688 131471 152934 212748 81439 38406 36602 9152
7555 37350 71990 82745 55330 26300 31115 248
6950 33850 64915 73285 48675 24295 29670 2380
605 3500 7075 9460 6655 2005 1485
100
C0 9-4 98
11 4 120 76 48 40
17413 92746 80274
129033 25884 12056 5432 2952
720 1375
670 970 225 50 15
3720
294 264 471 389 679 685 851 271
ME N 32E818 194885 177925 16960 87 129963 3970 593 No education Incmplete Primary Ccmpleted Primary Incomplete Secondary Completed Secondary 1 to 3 years University 4 or more years University Unknown
10922 64029 71394
102438 36875 17796 20432 4932
5755 26415 47530 52975 29150 13195 18210 1655
5305 23995 43115 47840 2620 12270 17520 1600
450 2420 4415 5135 2870
925 690
55
78 92 9-3 97 98 70 38 3-3
4767 36894 23529 48983 7630 4561 2222 1377
400 720 335 480
95 40 0
1900
527 413 666 517 791 741 891 336
W0 ME N 359622 120020 16095 13925 116 235827 3775 334 No education Incomplete Primry Completed Primary Incomplete Secondary Cmpleted Secondary 1 to 3 years University4 or more years UniversityUnknown
14766 67442 81540
110310 44564 20610 16170 4220
1800 10935 24460 29770 26180 13105 12945
825
1645 9855
21800 25445 22395 12025 12150
780-
155 1080 2660 4325 3785 1CB0
795 45
86 99
109 14-5 144 82 61 54
12F46 55852 56745 80050 18254 7495 3210 1575
320 655 335 490 130
10 15
1820
122 162 300 270 587 636 801 195
Table No 4 POFULATICN 10 YEARS OLD AND OVER H1 STATUS OF ACTIVITY SM
LEVEL OF INSTUCTION AM AREA 1980 CENSUS (Page 3)
Population 20 Years Old and Over
Area Sex and Level of Instruction Economically Active Unem- Econamio- Not
Total Total plWed UnEM-
ploed ployment
Rate ally
Inactive Speci-fied
Activity Rate
JRAL 564147 233555 219520 14035 60 326277 4315 414 No education Incomplete Primary Completed Primary Incomplete Secondary Ccpleted Secondary 1 to 3 years University 4 or more years University Unknown
91359 221142 146538 73388 18993 5611 3131 3985
38925 78545 72615 228B5 13290 3590 2560 1155
37970 75390 67735 20485 11270 3225 2360 1095
955 3165 4890 24WX 2020
355 200 60
24 40 67
105 152 99 78 52
51869 141347 73438 50333 5673 2026
556 1035
565 1250
485 170 30
5 15
1795
426 355 496 312 700 638 818 290
M E N 305517 201430 191535 9895 49 101687 2400 659
No education Incomplete Primary Completed Primary Incomplete Secondary Completed Secondary 1 to 3 years University 4 or more years University Unknown
48165 121570 81757 38009 9128 2657 1868 2373
36415 72145 62855 18075 7500 1870 1575
995
35620 69515 5918M 16495 6575 1730 1475
945
795 2630 3675 1580
925 140 10D 50
22 36 58 87
123 75 63 50
11445 48750 18547 19819 1603
782 293 478
305 695 355 115
15 5
10 900
756 593 769 476 823 704 843 419
W 0 ME N 258630 32125 27965 4140 129 224590 1915 124 No education Incomplete Primary Completed Primary Incomplete Secondary Completed Secondary 1 to 3 years University 4 or more years University UnkMown
43194 99572 64781 35379 9875 2954 1263 1612
2510 6400 9760 4810 5790 1710
9E5 160
2350 5865 8555 3990 4695 1495 8B5 150
160 535
1205 820
1095 215 200 20
64 84 12-3 170 189 26 102 62
40424 92617 54891 30514 4070 1244 273 557
260 555 130
55 15 0 5
895
58 64 151 136 586 579 780 99
Roa-e gust- ons edegopueaticrof Mle wationab anti Housng CUensus - 20Sm pling available at the Population Dept MIUE
Table No- 5 EMMED POIATION 10 YEARS OF AGE AND OLDER 21 OCCUPATIC
SEX AND AREA 1990 CENSS
Occupation
TOTAL
Total
503540
Percentage
100
Number
369460
Men Percentage
1000
Women NTunber Percentage
134080 i000
Professionals technicians andrelated occupations 55095 109 27150 74 27945 208
Managers administrators and director-level officials 24245 48 19570 52 4875 36
Office workers and related occupations
Salesmen and related occupations
51495
33825
102
67
16780
22330
45
60
34715
11495
25-9
86 0o
Farming cattle-raising fishingand hunting
Conductors of means of transport and related occupations
Artisans and craftsmen
Other artisans and craftsmen
Workers and day-laborers
139400
24185
63605
2350
17570
278
48
126
25
35
135775
23930
57305
10790
15825
368
65
155
29
43
3625
255
630X
1560
1745
2-7
02
47
12
13
Workers in personal and relatedservices 73520 146 33430 91 40090 299
Workers in non-identifiable or undeclared occupations and otherworkers 8250 16 6775 18 1475 11
Occupation
URBAN
Professionals technicians andrelated occupations
Managers administrators anddirector-level officials
Office workers and related occupations
Salesmen and related occupations
Fanming cattle-raising fishingand hunting
Conductors of means of transport
and related occupations
Artisans and craftsmen
Other artisans and craftsmen
Workers and day-laborers
Workers in personal and related services
Workers in non-identifiable or undeclared occupations and otherworkers
WI
Total
254020
45925
20525
45265
24745
9710
168a5
42970
8330
10575
53275
5815
Table No 5 (Page 2)
PORIJLTI 10 YEARS AND OIDEROF AGE BY OCCUPATIC SEX AND AREA 1980 CENSJS
Men Percentage Niruber Percentage
10)O 177 925 1m00
162 22715 128
72 16080 90
15-9 14200 80
87 16070 90
34 9420 53
5-9 16670 94
151 38310 216
29 7150 40
37 9465 53
190 23175 130
20 467o 26
Women Nunber Percentg
106095 10X0
23210 219
4445 42
31065 292
8675 82
290 03
215 02
4660 44
1180 11
l1lO 10
3D100 234
1145 11
Table THo 5 E2PIYED POP LATK 10 YEARS OF AGE AND OLDER B OCCUPATION
SEX AND AREA 190 CENSUS
Occupation WomenTotal Percentage Nunber Men
Percentage Number Percetage
RURAL 219520 10O 191535 l0O 27985 100O
Professionals technicians andrelated occupations 9170 42 4435 23 4735 169
Managers administrators anddirector-level officials 3720 17 3290 17 430 15 Office workers and related
occupations 6230 28 2580 13 3650 130
Salesmen and related occupations 900 41 6260 3-3 2820 301
Faning cattle-raising fisdigand hunting 129690 592 226355 660 3335 119 Conductors of means of transport and related occupations 730 33 7260 38 40 01
Artisans and craftsmn 20635 94 18995 99 1640 59
Other artisans and craftsmen 4020 18 3640 19 380 14
Workers and da-laborers 6995 32 6360 33 635 23
Workers in personal and relatedservices 20245 92 10255 5-4 9990 357
Workers in non- identifiable or umdeclared occupaticns and otherworkers 2435 11 2105 11 330 12
Source Tabulations of the National Population mad I1sing Census - 20 Sampling available at the Population Dept MIPPENote Figures subject to change
TNbl Po b 11410712|IIMIrIO)N 10 14A4d011 1OWV 3 LIY UorE SJXW (k)
(EVIL OkIOF rIDION ANDWAl 191) CRJW3
PoplAtIo 10 O1 ami OvurI Yo
ArSampa no v(tywj ofj n
Total bbIo 125
125 to
249
2--24 to
M
620
over Nlhot
Sfwtldr
Avn~pio in D
Total 503540 15246 ly4 117011 2i 63A11 1146
I IzoMp1OW Primrn Copleted P ritmr Icplt Seonary Copleted alaxy 1 to 3 ya University 4 or morsyvas Universlty U n
443) 109230 13650 93770 59945 2153 32030 3475
25711 51645 50370 2110 4320
923 315
1015
643Y 25410 41325 35035 18210 65 IT11
BID
1 tt 8161
2075I 2255 20 140 142
675
Yj) 1150 2410 4M5 7090 4535
14725 30
lJtl 221165 17915 5515 2235
75 1015
56
743 1047 1434 2106 2985 3412 5911 1707
S 1065 9765 77 7 _ 1810
Noadwton Inmplta Priary Coptet Pay Inooaplet S cdry CoimletedSocaary I to 3 yemruUnlve oai n
402 93510
11295 64Yy V55 4000
21015 41405 3319) 11255 2365
50
6080 22315 32265 23505 9160 29L
1515 8A5
18615 213M 14565 7020
3)5 10Ij 2235 3970 53= 3105
11W a2530 15970 4225 135
410
786 12 1608 2256 3199 3685
4 or -ore YnaruIUoiveralty 1899 M2 79) 600 11345 660 7316 Ua M 2545 675 645 525 265 435 1915
V 0 M EV 13408) 416l 377B 39270 1715 745 1937
NOtuat m bn1late Prmry Cwplated Prim ry Inmxplt Seondary CroPleta 2acmary I to 3 years Unlversity 4 or mors yes University Urown
3995 1572)
055 2435
27C90 13X 130Y)
9
2750 10240
7180 8A5 1955
425 U5 340
30)3 8920 -550 9050 3590
95 245
70 655
2135 67AM
13435 770 82)
150
15 75
175
1710 1450 3380
65
85 1615 1945 122
M2) 5 5
130
530 71
1030 1778 M1O1 3203 4670 1536
S 0 5045 211 93535 12675 2357
No duaton Inzi letu IrPry Cjr1td Pn-ri
650 300 E4915
3360 132795 W In
2220 127a)
615 51)
14C)
120 60
I h
635 2105 315
100 1477 1711
r3nla 1-ra vnrS
S - i-Ij 4 r ro yet r-4
24
21 7
4
14 5C
1 0r502 _4c9
42tZ6 42j
1390
3YC
j7 925
Me
5U76 et2 2U27 1W ) 15 Z5 Z15
M E shy Q X16) 7 Z 40 135Y 2471
or
UccP irr Incplata 5c Capleta zaxiary 1 to 3 ywim Unlversiy 4 or more yrwra Unhaity Ur mc
526
43115 85J) 47t5 641 6an 1515 1270 35 5 1700
1600 240
25
111474 3110 7125 257 705 470
0 46)
1275 176K) 150 6 105 55O
450
565(
15t5 345 4O) 28 5
10640
5701575 2145 2250
M
10 610 f0)0
1 173 a56 1337
330 M5
7504 240
W0 XE 110 W65 31405 34450 7335 4140 2132
NO ad 1645nOplat Pr999b
CompletedPriry 21820 InLazplets iroxy 25445Copleted SexAax 22395 I to 3 dUniver ty 1254 or me yea University 12150
tlso v 7a)
1375 6335
1165 6965 147
37O 105 7
240 2410 6940
1023 7340 315 925 210
55 50
1745 6360
1292A 6460 7545
M
15 40
110 5
16) 11 391
65
130 53)
1010 100
660 360153 315 95jm9
611 811
1135 1868 113 3245 4T16 163
rraAME 219520 4 44M 23540 3U 5005 169
lNo ttO) Incnplcte Priary Ca etadPrimary Inomplete Samdrj Cpleted eom ry
Sto3 years University 4 or mrs yoors Ivdwrnty Urkn
37970 75= 6735 2485 1270 3225 260
39
24053 3841 29815 6740 133)
w1O 40
500
4215 1269) 1575 670 3745 875 145 210
970 3670 660 4225 410 1735 1260
9
25)530 7b 45 592 332 825
5
12150 200) 146 2215
695 10 90 290
675 E22
1117 1656 l51
M51 1006
ME 91535 84245 30) 150) 25 47070 1055
Noeucaation cnomplt Prmay
CompletedPr1izry InoocrpletaSeoonrky Cae1tad Secondary I to) yearmUnivrsity 4 or mrs yosrs University Ur n
563 69515 5912 16493 6575
175) 475
945
18860 34505 24600
4T50 450 115 5)
435
410 l7 13795 539)5 20O
410 0
M
955 3555 62T) 3710 2715
895 605 75
M 45 670 545 510 20 705
5
145 189513EZ 197
465 50 50
255
695 854
1159 171 2628 375 5959 936
VOMEN 79 13175 637 4740 31 1160
No education Inrarplot PrLary Ca~pletad Prtomry Inila0te Sooondary Cotplae Searcniary I to 3yrsUivrsity 4 or imm yearn University trkr3 I
2350 5965 8555 399 4695 1495 85 150
1545 3905 5215 1690 480)
65 10 6j
115 (65
1920 1325 1710
465 60 51
15-115 390 515
2195 WO0 655
Y5 Y5 40 8) 70 120
-
675 1124
935 220 Z50 55 40 35
474 937 833
1247 M3
2913 4048 1125
- N141ble or zero 33AM Tallatircm of U Natlcal Pomoittra M tHard- r- 16 -i
TAELE NO 7 AVERAGE WY INCOME FOR E TWYED POPJLATION TEN YEARS OF AGE
AND OLDER 1Y SEX CATEDORY OF EXPIYDM AND AREA 1960 CENSU (In Balboas)
SEX Field of Occupation Total MM Wanenand Area Ni~nber Average Number Average Number Average
TO AL 503540 1000 1846 369460 1000 1810 134080 1000 1937
Employees 347245 690 227805 617 1194AO 890
Part-time 82260 163 60850 165 21410 159
Government Workers 15210 30 1518 10990 30 1572 4220 31Private Enterprise 63035 1323125 1032 46495 126 1137 16540 123 673 Cooperatives or Camshymunal Organizations 1195 02 938 1075 03 956 120 01Canal Agency 2820 C6 3412 2290
719 06 3813 530 04 2015
Permanent 264985 527 166955 452 9B030 731
Government Workers 103555 206 2940 59520 161 2948 44035 328 2932Private Enterprise 1476o5 293 201 96145 260 2180 51460 384 1696 Cooperatives or Ccashymnal Organizations 1355 03 1573 1040 03 1619 315 02 1450Canal Agency 12470 25 5343 10250 28 5361 2220 17 5222
Self-Enployed L13220 235 732 1Mf795 294 738 9425 70 676
Employers or Proprietors 9085 18 2625 7795 21 276-8 1290 10 2102 Production Cooperatives orCammnnl Organizations 2020 04 735 1915 05 730 105 01 I00O
Fand-l Workers 19720 3-9 457 38035 49 453 1685 13 507 Unmnown 7250 14 741 5115 14 776 2135 16 870
TABLE NO 7AVERAGE MXff INCOME FOR EMPLOYED P0FLATION TEN YEARS OF AGE
AND QMDD BY SEX CATEDORY OF EIUPDINT AND AREA 19e0 CENSUS
(In Balboas)Page 2
Field of Occupation and Area Number
Total Average Number
Men SEX
Average Number Women
Average
Urban 284020 100O 2357 177925 1000 2471 106095 irnO 2132 Employees 245160 146705 96455
Part-time 42860 27510 15350
Government Workers Private Enterprise
8590 31700
30 112
1791 1288
5350 20110
30 113
1982 1544
3240 11590
31 109
1461 747
Cooperatives or CamshymInal Organizations Canal Agency
320 2250
01 08
1214 3672
270 1780
02 10
1250 4CS3
50 470
00 04
1MO3 2125
Permanent 2023 ) 119195 83105
Government Workers Private Enterprise
79520 111175
280 391
3113 2223
42930 66940
241 376
3207 2442
36590 44235
345 417
3018 1766
Cooperatives or Cmshymunal Organizations Canal Agency
695 10910
03 38
2055 5428
500 8825
03 50
2200 5447
195 2Ce5
02 20
1667 5317
Self-Bnployed 2B845 102 1430 23895 134 1573 4950 47 921
Employers or Proprietors
Production Cooperatives orCamunal Organizations
4845
400
17
01
4068
1583
3900
360
22
02
4580
1611
945
40
09
00
2406
1188
Family Workers 895 03 764 5835 03 685 300 03 950
Unknown 3885 14 1359 2480 14 1444 1405 13 1250
TABLE NO 7 AVERA MOTHL INCOME FOR DT-TOYED POPULATION TEN YEARS OF AGE
AND OLDER E SEX CATErOfI OF E1TLOYMT AND AREA 199 CEJS
(In Balboas)P8ae 3 SEX Field of Occupation
and Area Number Total
Average uimber Men
Average Number Women
Average
Rural 219520 1O00 1069 191535 1000 1056 27985 1000 1160
Employees 102C65 81100 20965
Part-time 39400 33340 6060
Government Workers Private Enterprise
6620 31335
30 143
1206 863
5640 26385
29 138
1220 917
930 4950
35 177
1158 546
Cooperatives or Ccmshymnal Organizations Canal Agency
875 570
04 03
817 2362
805 510
04 03
844 2500
70 60
03 02
542 1063
Penanent 62685 47760 14925
Government Woikers Private Enterprise
24035 36430
110 166
2400 1533
16590 29205
87 153
2359 1625
7445 7225
266 258
2509 1064
Cooperatives or Comshymunal Organizations Canal Agency
660 1560
03 07
1244 4813
540 1425
03 07
1170 4889
120 135
04 05
1M83 2125
Self-Employed 89375 407 601 84900 443 606 4475 160 535
Emloyers or Proprietors 4240 19 1392 3895 20 1408 345 12 1318 Productimn Cooperatives orCcmmual Organizations 1620 07 641 1555 08 644 65 02 559
Family Workers 18835 86 443 17450 91 445 1385 50 407
Unknown 3365 15 520 2635 14 538 730 26 45-4
Source Tabulations of the National Population and Housing Census - 2 SamplingStatistics and Census Breau Controller General of the RepubLic
-115-
ANNEX NO 3
FAMILY FORM FOR EIGHTH NATIONAL POPULATION
AND FOURTH HOUSING CENSUS
-116-Republic of Panama Controller General Bureau of Statistics
and Census
THE INFORMATION REQUESTED IS CONFIDENTIAL
Decree-Law No 7 of February 251960
iorm No
EIGHTH NATIONAL POPULATION AND FOURTH DOUSING CENSUSES
May i 1980
FAMILY F-ORM
FOR OFFICE USE
Region Segment Form Populated Block No No No Area No
I LOCATION OF HOUSING
i Segment No FOR CITIES OF PANAMA AND 2 Province -------- COLON ALSO INDICATE 3 District 4 Office 9 Block No-------shy5 Populated Area 6 Street or Avenue (number or name) 7 Number or name of building or dwelling 8 Room or Apartment No
II HOUSING INFORMATION
1 Type of Housing
Individual Home
Permanent 1 Sepi-Permanent 2 Makeshift 3
Apartment 4 Room in Home 5 Space rot intended for housing but used as such 6 Collective Housing 7
-117-
CONDITION O- DOUSING 7 BASIC FLOOR COVERING IN TIE HOUSE
Presently occupied 1 Occupants absent (closed) 2 Paved (concrete tiles
Unoccupied brick etc)
Rented 3 Wood
For Sale 4 Earth
Under Repair 5 Other
Summer Home 6
Other reason 7
------------------------------- 8 DRINKING WATER SUPPLY Public or private Water-Supply
ANSWER QUESTIONS 3 THROUGH 14 ONLY FOR Inside connection
OCCUPIED HOUSING CLASSIFIED AS 1 2 3 Public IDAAN Watershy
4 OR 5 IN QUESTION 1 TYPE OF HOUSING supply line ---------------------------------- -Public community line
Private supply line
3 ROOMS IN THIS HOUSE Outside connection
Public IDAAN supply line
How many rooms does it have Public community line Private supply line
Of these how many are bedrooms Septic Tank
Is there an area specifically for Public cooking Private
Yes 1 No 2 Open well C
Rain water i(
4 OWNERSIP Natural well 13 River or creek
Clear Title 1 Mortgage 2 B
Monthly Mortgage 9 SANITARY FACILITIES
Rented 3 BI
Monthly Rent Private
Transferred 4 Connected to sewerage 3
Condemned 5 Connected to septic tank
Hole or latrine
5 PRINCIPAL MATERIAL OF OUTSIDE WALLS OF BUILDING OR HOME Communal
Connected to sewerage d
Block brick stone concrete 1 Connected to septic tank
Fiber-cement wood (panels logs Hole or latrine
etc) 2 No sanitary facilities
Clay-cane adobe 3 Straw plant-leaf cane sticks 4
Other materials or no walls 5 10 BATHROOMS
Private
6 BASIC MATERIAL OF ROOM OF With water from supply
BUILDING OR TOIEE line
Cement 1 With water from other
Tile 2 sources
Fiber-cement 3 Communal
Metal (zinc aluminum etc) 4 With water from supply
Covered wood 5 line
Straw or plant-leaf 6 With water from other
Other 7 sources No bathroom
-118shy
-3-
II LIGHTING
Electric lighting From IRIIE 1 From private source 2
C iec type lighting Gas 3 Kerosene 4 Other 5
12 COOKING FUEL
Electricity 1 Gas 2 Kerosene 3 Carbon 4 Wood 5 No Kitchen pound
13 APPLIA NCES
Television Yes 1 No 2 Radio Yes 1 No 2 Telephone Yes 1 No 2 Refrigerator Yes I No 2 Washing achineYes 1 No 2 Sewing Machine Yes 1 No 2
14-WAS THIS 11OUSE BUILT BETWEEN 1970 AND 1980
Yes No Dont Know
If yes indicate the year
FOR OFFICE USEOBSERVATIONS ON THE HOUSING
Total lien
Women
III POPULATION DATA (IF MORE TH1AN 7 PERSONS IN HOUSE CONTINUE ON ANOTHER FORM)
A GENERAL CHARACTERISTICS PERSON 1 PERSON 2 PERSON 3
L NAME (FIRST amp LAST) Start with head of household Do not forget to include newborn children and elderly persons
2 RELATIONSHIP WITH HEAD OF HOUSEHOLD Spouse of Head t Son Mark the appropriate box Head 1 (Daughter)
Son (Daughter) 3
Other relation Specify
No Relation Specify
3 SEX Mark the appropriate box Male 1
Female 2
L hOW OLD For children under one year mark the appropriate Years box If age is unknown ask the person to estimate it Years Less than 1 year
5 WHAT IS YOUR PRESENT ARITAL STATUS Mark the appropriate box For persons United 1 under 15 uze box 8 CO1lON LAW (UNITED) For those living Single 2 in marital union without being married SINGLE Never married or living together Married 3 MARRIED Those having entered into the state of legal matrimony and living in Divorced 4 such civil status DIVORCED Persons legally separated and not remarried Widowed 5 nor living in marital union WIDOWTED Person whose spouse is deceased and Separated has not remarried nor is united SEPARATED A person separated from Marriage 6 his (her) spouse Union 7
6 IIHERE BORN Here Mark here if you were born in the same populated area or settlement of the census If born in another populated area or settle- (populated area) ment indicate the nare of the place the Office and District to which it belongs (office) (corrcgimiento) If born abroad indicate the country
(district)
(other country)
-120shy
-4shy
7 WOW LONG HLVE YOU LIVED Always ) G IN TilS POPULATED AREA OR
SETTLEMENT This refers to Visiting ) the populated area or settle- )t ment of the census Mark the In Iransit)
appropriate box Note the
month and year when no boxes 9
are marked
Since 19
(month) (year)
8 WHERE DID YOU LIVE BEFORE COMING
TO THIS POPULATED AREA OR SETTLEMENT (populated area)
Put the informants reply in the (office)corresponding space
(district)
(other country)
9 IS YOUR MOTHER LIVING Yes I No 2
Mark the appropriate box Dont know 3
B - EDUCATIONAL-tACKGROUND
10 WHAT WAS THE HIGHEST GRADE-OR SCHOOL YEAR Primary 1
COMPLETED DURING REGULAR SCHOOLING Secondary 2 University 3
Indicate the number in the corresponding No grade 04
box or mark an X in the box No Grade
11 CAN YOU READ AND WARITE Yes 1 No 2
Do not answer this question if you have
finished at least the third grade and
mark the Yes box
12 WHAT DIPLOMA CERTIFICATE OR TITLE DO
YOU HAVE (title) (degree)
Answer as appropriate If you have various
degrees (titles) indicate the highest (school)ranking one
None _
-5shy
13 ARE YOU IN SCHOOL NOW Primary 1
Indicate the grade or year in the appropriate box If you are in a non-regular type of school or are not in school mark an X in the appropriate box
Secundary
University
Pre-School or Kindergarten
2
3
4
Other 5
Not in school 6
14
C ECONOMIC CHARACTERISTICS
14 DID YOU WORK OR WERE EHFPLOYED LAST WEEK Mark the appropriate
YOU GAINFULLY
box Go
Yes 1 to 17
No Go to
2 15
15 WERE
Mark
YOU
the
LOOKING FOR
appropriate
WORK
box
LAST WEEK Yes Go to
1 17
No Go to
2 16
16 WHY WERE YOU NOT LOOKING FOR WORK LAST WEEK
Mark the corresponding box
Do occasional odd-jobs 1 Have been looking for
3 months 2
Have looked before and awaiting news 3
Impossible to find work 4
) ) )
)
)
G o
t
o
17
Housewife Student Invalid Retired Run boarding house
rent rooms Pensionee
5 6 7 8
9 10
) t
25
Other condition X
17 WHAT OCCUPATION TRADE OR TYPE OF WORK DID YOU DO LAST WEEK OR THE LAST TIME YOU WORKED Example auto mechanic furniture carpenter dentist For those who have never worked mark the box new
worker and go to question 25 -New
-(occupation)
Worker
I
-6- -122shy
18 PRESENT OR LAST EMPLOYMENT
Example Sun Supeumarket Rita
Industries The Grange Ranch (Name of Firm or Company)
for a family on the street etc
19 WHAT IS THE NATURE OF THIS BUSINESS OR FIRMESTABLISMENT
Example food sales haberdashery For those who work on a farm on the
(Principal Activity)street for a family draw a line I I I II
20 PRESENTLY WORK OR WORKED IN LAST EmployeePOSITION AS
Government 1
box Private Firm 2Mark appropriate Canal Zone Agency 3 Cooperative or 4
communal organization Self-employed 5 Proprietor (owner) 6
Partner in a production cooperative or communal organization 7
Domestic 8
21 ARE YOU PRESENTLY EMPLOYED FUIL Full 1 Part-timeOR PART TIKE
22 IN WHAT POPULATED AREA OR SETTLEMENT Here IS YOUR WORK LOCATED Other
(For all employed persons)
Place Office District
Other country
23 HOW MANY HOURS DID YOU WORK LAST IEEK _ (For all employed persons) Hlours worked _
Note the informants reply
B24 WHAT IS YOUR PRESENT SALARY OR WAGE 1 Per hIur 2 Per day B(Only for employed persons) 3 Per week B
4 Per Month BNote the informants reply 9 Commission B
YOUR TOTAL CASH INCO1ME LAST MONTH Bl---------shy25 WHAT WAS Include Salary or wage income from your
business or enterprises sale of farming
and livestock products lottery winnings
betting pensions retirement scholarships No incomerental income etc
2
-7-
D FERTILITY AND MORTALITY (FOR WOE1N 15 AND OLDER)
26 HOW HAD
MANY THAT
CHILDREN HAVE YOU WERE BORN ALIVE
Total Sons (Daughters)
I I__
For women who have not had children mark the box None and go to question 30
None
27 OF THESEHOW MANY ARE LIVING PRESENTLY Indicate the informants reply
Total Sons
(Daughters)
I
28 1WHAT WAS THE BIRTH DATE OF YOUR LAST CHILD BORN ALIVE Indicate the informants reply (day) (month) (year)
29 IS YOUR LAST SON OR DAUGHTER PRESENTLY LIVING Check the appropriate box
Yes l No 2
E PHYSICAL OR MENTAL DISABILITY (FOR PERSONS UP TO 40 YEARS OF AGE)
30 DO YOU HAVE ANY PHYSICAL MENTAL DISABILITY RESULTING
FROM BIRTH OR OTHER CAUSES
From Birth
Blind
Deaf amp Dumb 1 Mentally Retarded
Invalid No Disability
3 5 7
I__ 9
Other Causes
7--T-1 -shy
2
4 6 8
Indicate your name and the date when the interview is over
(Name of Census Taker) Date
-124-
IMPORTANT
No Person Should Fail to Be Counted
No Person Should Be Counted Twice
To achieve this objective it is important that the Census Taker follow the instruc-tions below
FIRST Write the name of each person that should be registered in the housing unit starting with the Head of the Family in accordance with the following rules COUNT every person whether or not they are family members that slept in the house on the night of May 10-11 Always begin with the name of the Head of the Family and continue in the following order The Head of the Familys spouse children in order of age from eldest to youngest other relatives and finally other persons not related to the Head of the Family If a name has not yet been given to a recently born child write newly-born in the space that corresponds to his first and last names COUNT all persons living in the house even if they did not sleepthere if they spent the night elsewhere for work-related reasons for example the night porter who was guarding the building project the driver who spent the night transporting passengers cattle or merchandise the druggist who worked the night shift etc COUNT all persons living in the house even if they did not spend the night there if they were at a dance a wake or if they were out hunting fishing or attending to other special occasions DOT NOT COUNT people living in the house if they spent the night of May 10-11 in another home a hotel or boarding house nor sick members of the house in hospital in jail etc since such persons will be counted by another census taker wherever they are VERIFY that all infants under one-year of age and all elderly persons have been counted since there is a tendency to omit them particushylarly newly-born children
THEN Obtain the remaining information in columnar form that is first obtain data from the Head of the Family then the second person and so on
POPULATION OBSERVATIONS
-125-
ANNEX NO 4
COMMENTS ON 1980 CENSUS PROCEDURES AND EVALUATIONS
The VIII National Population and IV Housing Census was a de facto
Census and as such in practically one day May 11 1980 counted all those
people present in the national territorial and maritime jurisdictions dependshy
ing on where they were at the time of the census Theoretically such time
was midnight May 10-11 This type of counting is similar to the last four
censuses taken but unlike those of 1911 1920 and 1930 which were de jure
censuses
In order to have advance knowledge of the census results a 20
sampling was taken of the population counted The 1980 census data in the
present report is taken from this sampling
A standard error table for the selected sampling provides an estimate
of 5000 housing units with a standard error of 140 and 280000 units with a
standard error of 511
In order to appraise the scope of the census in early 1983 a team of
technicians from various government offices worked for several months in
applying new methodologies to project the population to a provincial level by
sex and fi--year age groups
In Panama as in most Latin American countries this appraisal has
been performed at various historical census times through post-census surveys
or indirect methods only at the national level
At the provincial level the following indicators were used to build
the census omission index by province for the 1970 and 1980 censuses
-126-
TABLE NO 1
STANDARD ERRORS FOR ALL OCUPIED HOUSING UNITS ESTIMATES BASED ON THE 1980 POPULATION AND
HOUSING CENSUS SAMPLING
Estimated Total of Standard Estimated Total of Standard Occupied Housing Error Occupied Housing Error
Units Units
400 40 55000 432 500 45 60000 448
1000 63 80000 500 5000 140 10O00 0 539 1000 197 120000 568
15000 240 140000 - 587 20000 275 160000 599 25000 305 200000 601 30000 332 220000 591 35000o 356 240000 573 40000 377 260000 547 45000 397 280000 511 50000 415
Source Statistics and Census Bureau - Controller General of the Republic
1 Percentage of Indian population by province
2 Dispersion of the population
3 Degree of urbanization
4 Estimated omission for the 0-4 year population in the 1980 Census
5 Difference in enrollment coverage in basic education according to
the population counted and the estimated coverage (6 to 12 years)
The following table provides the 1980 census omission for the country
and by province
Table No 2
ESMAT OF CaJS OMISSIS Bf PROWINCE 19 O
Omision Estimated PopulationPopulation Estimate Estimated Population Omission and Reconciled with theCounted at according to reconciled with the according to Estimate at theProvince 1-7-80 Index national level Index National Level
TOTAL 1794358 i917020 1920406 6-4 66 Bocas del Toro 52550 59150 61694 111 148 Cocl1 240860 149990 147220 61 43 Colon 157970 168210 170943 61 76 Chiriqui 287170 308820 310755 70 76 Darien 26300 30C80 31220 J26 158
Herrera 8200 87310 9290290 61 Los Santos 70239 75540 79144 70 112 Panama 804099 847930 840632 52 44 Veraguas 173170 189990 1-88508 89 81
Source Popilation Department of Social Planning Division of IPE
1
bull-128-
BIBLIOGRAPHY
Documents that were consulted in the preparation of the study Socio-Economic Survey of Women in Panama 1980
Coitroller Ganeral of the Republic
Ministry of Plamning and Economic Policy (MIPPE)
Ministry of Health
- Panama in Figures Years 1970 to 1980
- Opirion Survey on the Panamanian Woman 1975
- National Demographic Survey for Panama Years 1975-1976
- National Population and Housing Censuses 1980
- Strategy for National Developshyment 1970-1980
- National Development Plan 1976-1980
- An Employment Policy throughA Plan of Urgency MIPPEMITRAB (Ministry of Labor) 1980
- The Reduction of Fertility in Panama Hildebrando Araica Working Document 1980
- Bases for Panamas Economic and SocialDevelopment Working Document 1981
- Situation and Perspectives of Elderly Population in Panama 1981
- Socio-Economic Survey of the Metzopolitan Region 1981
- Demographic Aspects of Populashytion and the Family 1982
-A Decade of Social Developmentin Panama 1983
Survey on the Prevalence and Use of Contraceptives 1980
-129-
United Nations World Action Plan United Nations Decade of the Woman 1975
- Female Labor Participation and Differences in Remuneration by Sex in Latin America PREALC ILO 1981
- Labor Market in Figures 1950shy1980 PREALCILO 1982
- Three Decades of Social Change in Latin America Bulletin 374 February-March 1983 ECLA
Inter-American Old-Age Federation
- Ageing International Vol IX No 3 1982 Information Bulletin
Agency for International Development (AID) and Data Use and Access Laboratories
- Guidelines for the Preparation of Census Reports on the Status of Women and their Role in National Development 1980
-- - - - - - - - - -- - - - -----------------------------
Broadcast Premiere WETA-26 PBS Washington DC September 1983
LIBERATION THEOLOGY ITS IMPACT is an in-depth look at theorigins development context and oethical deliberations theproponents and critics of liberation theology Although focused on Latin America the program also explores a parallel traditionin the Afro-American religious experience This hr color program i s ideal for 5eminar classroom community discussionand broadcast It is a lively mix of interviews news footagesl ides photos and musi Among those interviewed are RevErnesto Cardenal Nicaraguan Minister of Culture Dr RenaKarefa-Smart Howard University Professor of Ethics Dr RobertMcAfce Brown author and Dean of Pacific School of ReligionFunded by DC Commonity Humanities Council New York Conci Ifor the Humanities and Intermedia--National Council of Churches
-------To order fill out the following and mail to Tresamericas Productions 3206 Wisconsin Ave NW29 Washington DC 20016 Make checks payable to Tresamericas Prepaid orders onlyPlease call or write concerning previews (202) 36-3041
NAME ORGANIZATION
STREET PHONE
CITYSTATEZIP $ AMOUNT ENCLOSED
Please indicate format desired Beta Max VIIS
Rental $80 Purchase $320 (video)
34 inch_ 16mm (available after Oct 84)
$460 (film) Rental by Non-Profit Group
$35 + postage