memorandum - mammoth lakes, ca
TRANSCRIPT
Memorandum
To Jen Daugherty Page 1
CC
Subject Nexus and Fee Study
From AECOM
Date May 1, 2015 60341310 Introduction The Town of Mammoth Lakes (Town) has retained AECOM to prepare a nexus study that establishes a nexus methodology to determine the appropriate housing fees in conjunction with the Town’s Housing Ordinance Update. The purpose of this report is to provide the reasonable relationship (nexus) between future residential and non-residential development that occurs in the town and the need for additional housing that is affordable for the workforce as a result of new development. The fees presented herein represent the maximum fee as determined by the analysis. However, adjustments downward from the maximum fees may be warranted so the actual fees adopted encourage and do not prevent development activity in the town. The fees generated by the program can be used to provide assistance for production, acquisition, and/or rehabilitation of affordable housing, in addition to other housing activities consistent with the Housing Ordinance Update. Table 1 Summary of Maximum Allowable Fees (Residential)
Market-Rate Unit PriceMaximum Impact Fee
(Per Unit) 1
$600,000 Per Unit 35,060$ $800,000 Per Unit 40,578$ $1,000,000 Per Unit 43,565$
1 Please see Table 3, Table 4, and Table 5.
Source: AECOM
Page 2
Nexus and Fee Study
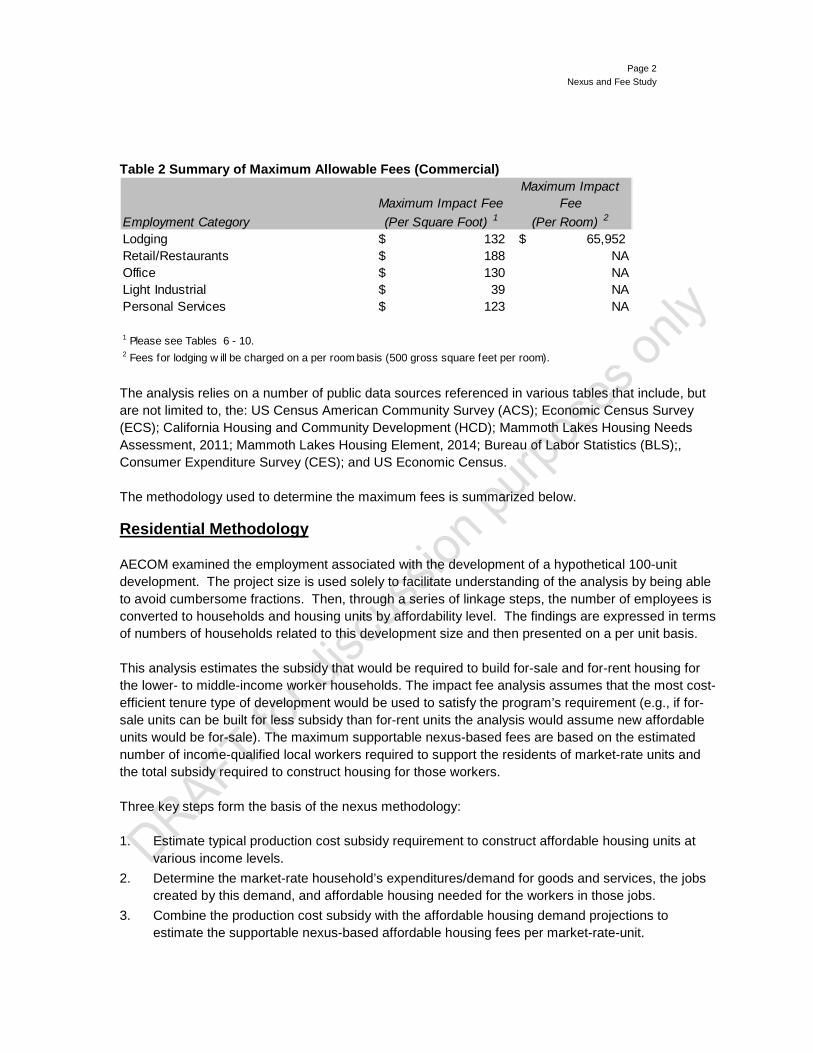
Table 2 Summary of Maximum Allowable Fees (Commercial)
The analysis relies on a number of public data sources referenced in various tables that include, but are not limited to, the: US Census American Community Survey (ACS); Economic Census Survey (ECS); California Housing and Community Development (HCD); Mammoth Lakes Housing Needs Assessment, 2011; Mammoth Lakes Housing Element, 2014; Bureau of Labor Statistics (BLS);, Consumer Expenditure Survey (CES); and US Economic Census. The methodology used to determine the maximum fees is summarized below. Residential Methodology AECOM examined the employment associated with the development of a hypothetical 100-unit development. The project size is used solely to facilitate understanding of the analysis by being able to avoid cumbersome fractions. Then, through a series of linkage steps, the number of employees is converted to households and housing units by affordability level. The findings are expressed in terms of numbers of households related to this development size and then presented on a per unit basis. This analysis estimates the subsidy that would be required to build for-sale and for-rent housing for the lower- to middle-income worker households. The impact fee analysis assumes that the most cost-efficient tenure type of development would be used to satisfy the program’s requirement (e.g., if for-sale units can be built for less subsidy than for-rent units the analysis would assume new affordable units would be for-sale). The maximum supportable nexus-based fees are based on the estimated number of income-qualified local workers required to support the residents of market-rate units and the total subsidy required to construct housing for those workers. Three key steps form the basis of the nexus methodology: 1. Estimate typical production cost subsidy requirement to construct affordable housing units at
various income levels. 2. Determine the market-rate household’s expenditures/demand for goods and services, the jobs
created by this demand, and affordable housing needed for the workers in those jobs. 3. Combine the production cost subsidy with the affordable housing demand projections to
estimate the supportable nexus-based affordable housing fees per market-rate-unit.
Employment CategoryMaximum Impact Fee (Per Square Foot) 1
Maximum Impact Fee
(Per Room) 2
Lodging 132$ 65,952$ Retail/Restaurants 188$ NAOffice 130$ NALight Industrial 39$ NAPersonal Services 123$ NA
1 Please see Tables 6 - 10.2 Fees for lodging w ill be charged on a per room basis (500 gross square feet per room).
Page 3
Nexus and Fee Study
The maximum fee may represent too high a cost burden to sustain development feasibility so adjustments downward from the maximum fees may be warranted.
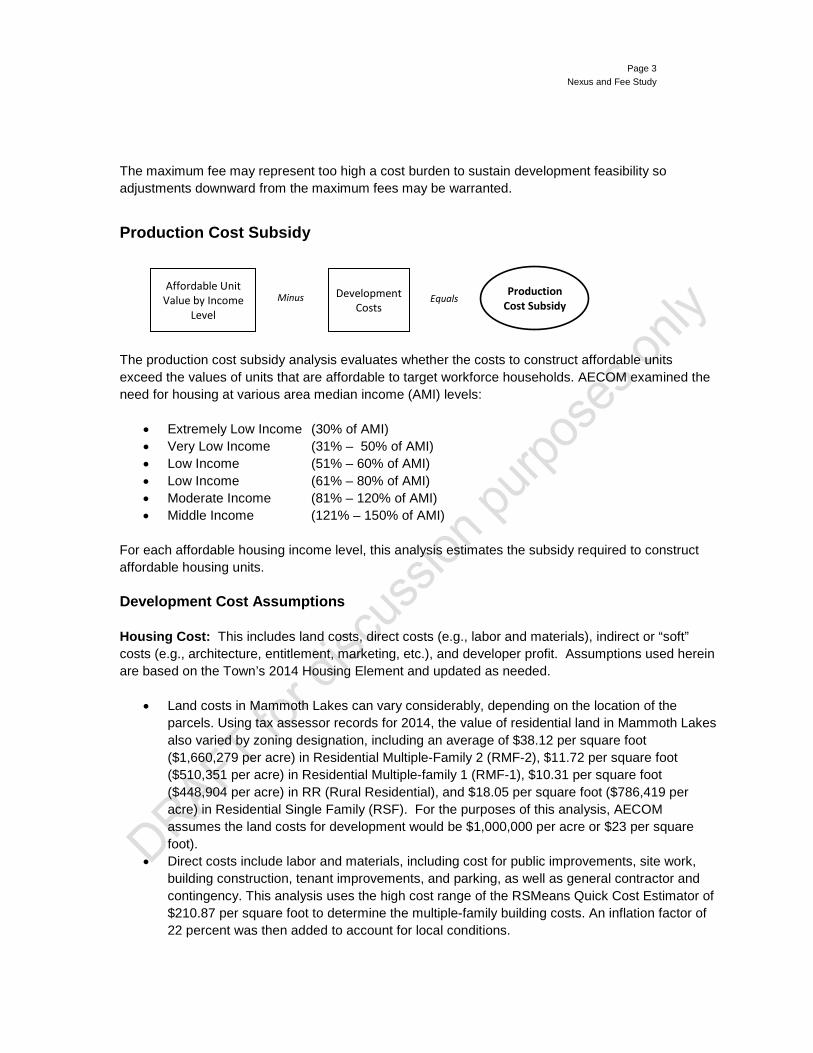
Production Cost Subsidy
The production cost subsidy analysis evaluates whether the costs to construct affordable units exceed the values of units that are affordable to target workforce households. AECOM examined the need for housing at various area median income (AMI) levels:
• Extremely Low Income (30% of AMI) • Very Low Income (31% – 50% of AMI) • Low Income (51% – 60% of AMI) • Low Income (61% – 80% of AMI) • Moderate Income (81% – 120% of AMI) • Middle Income (121% – 150% of AMI)
For each affordable housing income level, this analysis estimates the subsidy required to construct affordable housing units. Development Cost Assumptions Housing Cost: This includes land costs, direct costs (e.g., labor and materials), indirect or “soft” costs (e.g., architecture, entitlement, marketing, etc.), and developer profit. Assumptions used herein are based on the Town’s 2014 Housing Element and updated as needed.
• Land costs in Mammoth Lakes can vary considerably, depending on the location of the parcels. Using tax assessor records for 2014, the value of residential land in Mammoth Lakes also varied by zoning designation, including an average of $38.12 per square foot ($1,660,279 per acre) in Residential Multiple-Family 2 (RMF-2), $11.72 per square foot ($510,351 per acre) in Residential Multiple-family 1 (RMF-1), $10.31 per square foot ($448,904 per acre) in RR (Rural Residential), and $18.05 per square foot ($786,419 per acre) in Residential Single Family (RSF). For the purposes of this analysis, AECOM assumes the land costs for development would be $1,000,000 per acre or $23 per square foot).
• Direct costs include labor and materials, including cost for public improvements, site work, building construction, tenant improvements, and parking, as well as general contractor and contingency. This analysis uses the high cost range of the RSMeans Quick Cost Estimator of $210.87 per square foot to determine the multiple-family building costs. An inflation factor of 22 percent was then added to account for local conditions.
Affordable Unit Value by Income
Level
Development Costs
Minus Production Cost Subsidy Equals
Page 4
Nexus and Fee Study
• Indirect or “soft costs” include architecture and engineering costs, financing costs, developer overhead, legal and accounting, and contingencies. This analysis assumes softer costs are 30 percent of hard construction costs.
• Developers attempt to determine the potential profit that could be generated from a project before moving forward. In general, developers target projects that can earn a profit of 10 percent above total development costs, but can move forward with lower projected profit depending on the strength of the market, project financing, and developer’s willingness to take a higher risk. In this analysis, AECOM assumes a developer profit of 10 percent.
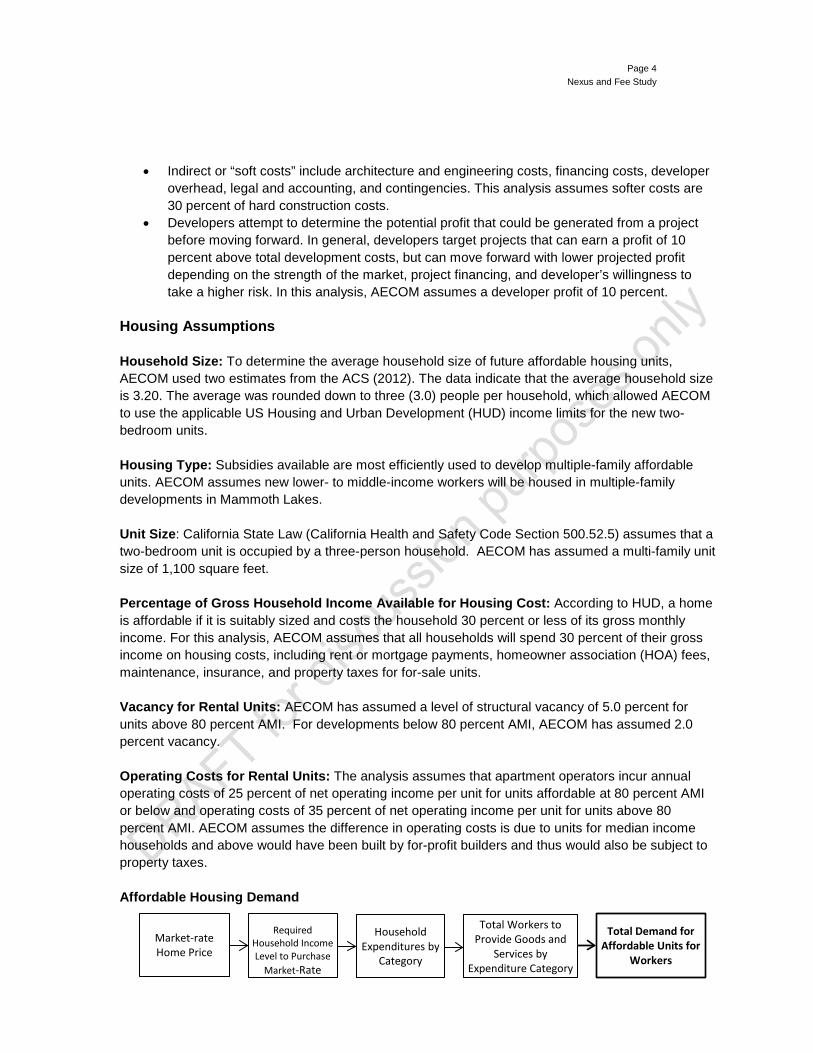
Housing Assumptions Household Size: To determine the average household size of future affordable housing units, AECOM used two estimates from the ACS (2012). The data indicate that the average household size is 3.20. The average was rounded down to three (3.0) people per household, which allowed AECOM to use the applicable US Housing and Urban Development (HUD) income limits for the new two-bedroom units. Housing Type: Subsidies available are most efficiently used to develop multiple-family affordable units. AECOM assumes new lower- to middle-income workers will be housed in multiple-family developments in Mammoth Lakes. Unit Size: California State Law (California Health and Safety Code Section 500.52.5) assumes that a two-bedroom unit is occupied by a three-person household. AECOM has assumed a multi-family unit size of 1,100 square feet. Percentage of Gross Household Income Available for Housing Cost: According to HUD, a home is affordable if it is suitably sized and costs the household 30 percent or less of its gross monthly income. For this analysis, AECOM assumes that all households will spend 30 percent of their gross income on housing costs, including rent or mortgage payments, homeowner association (HOA) fees, maintenance, insurance, and property taxes for for-sale units. Vacancy for Rental Units: AECOM has assumed a level of structural vacancy of 5.0 percent for units above 80 percent AMI. For developments below 80 percent AMI, AECOM has assumed 2.0 percent vacancy. Operating Costs for Rental Units: The analysis assumes that apartment operators incur annual operating costs of 25 percent of net operating income per unit for units affordable at 80 percent AMI or below and operating costs of 35 percent of net operating income per unit for units above 80 percent AMI. AECOM assumes the difference in operating costs is due to units for median income households and above would have been built by for-profit builders and thus would also be subject to property taxes. Affordable Housing Demand
Market-rate Home Price
Required Household Income Level to Purchase
Market-Rate
Household Expenditures by
Category
Total Workers to Provide Goods and
Services by Expenditure Category
Total Demand for Affordable Units for
Workers
Page 5
Nexus and Fee Study
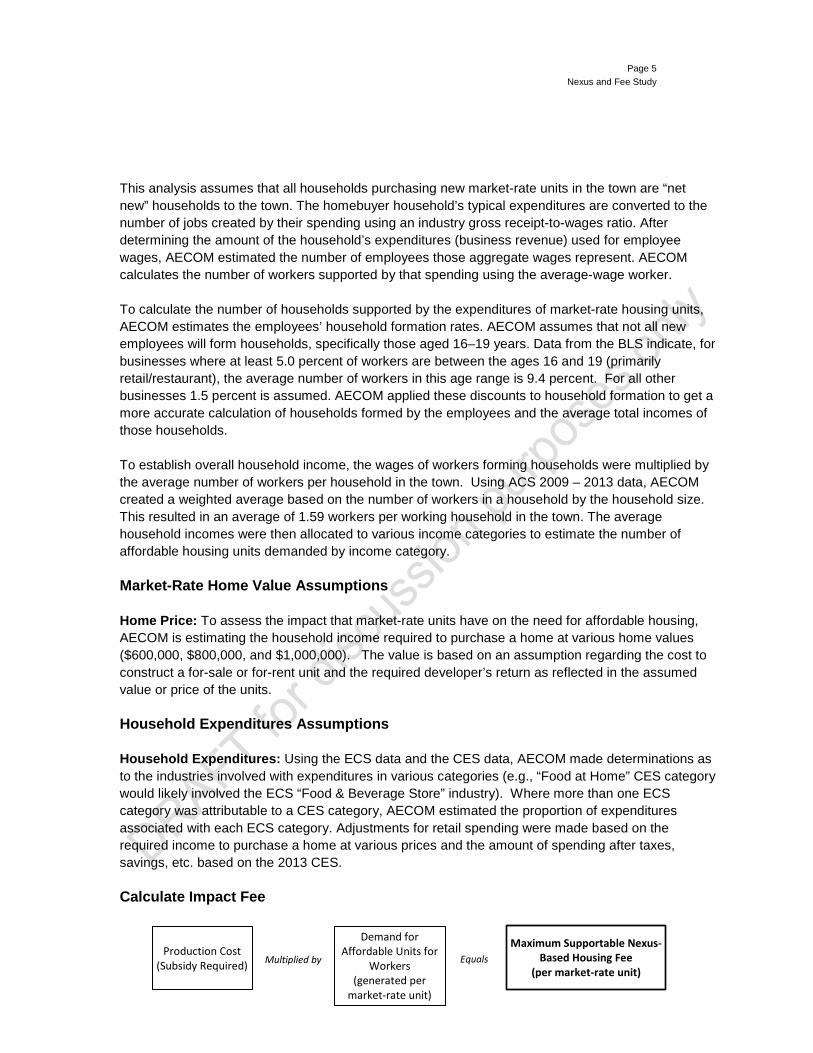
This analysis assumes that all households purchasing new market-rate units in the town are “net new” households to the town. The homebuyer household’s typical expenditures are converted to the number of jobs created by their spending using an industry gross receipt-to-wages ratio. After determining the amount of the household’s expenditures (business revenue) used for employee wages, AECOM estimated the number of employees those aggregate wages represent. AECOM calculates the number of workers supported by that spending using the average-wage worker. To calculate the number of households supported by the expenditures of market-rate housing units, AECOM estimates the employees’ household formation rates. AECOM assumes that not all new employees will form households, specifically those aged 16–19 years. Data from the BLS indicate, for businesses where at least 5.0 percent of workers are between the ages 16 and 19 (primarily retail/restaurant), the average number of workers in this age range is 9.4 percent. For all other businesses 1.5 percent is assumed. AECOM applied these discounts to household formation to get a more accurate calculation of households formed by the employees and the average total incomes of those households. To establish overall household income, the wages of workers forming households were multiplied by the average number of workers per household in the town. Using ACS 2009 – 2013 data, AECOM created a weighted average based on the number of workers in a household by the household size. This resulted in an average of 1.59 workers per working household in the town. The average household incomes were then allocated to various income categories to estimate the number of affordable housing units demanded by income category. Market-Rate Home Value Assumptions Home Price: To assess the impact that market-rate units have on the need for affordable housing, AECOM is estimating the household income required to purchase a home at various home values ($600,000, $800,000, and $1,000,000). The value is based on an assumption regarding the cost to construct a for-sale or for-rent unit and the required developer’s return as reflected in the assumed value or price of the units. Household Expenditures Assumptions Household Expenditures: Using the ECS data and the CES data, AECOM made determinations as to the industries involved with expenditures in various categories (e.g., “Food at Home” CES category would likely involved the ECS “Food & Beverage Store” industry). Where more than one ECS category was attributable to a CES category, AECOM estimated the proportion of expenditures associated with each ECS category. Adjustments for retail spending were made based on the required income to purchase a home at various prices and the amount of spending after taxes, savings, etc. based on the 2013 CES. Calculate Impact Fee
Production Cost (Subsidy Required)
Demand for Affordable Units for
Workers (generated per
market-rate unit)
Maximum Supportable Nexus-Based Housing Fee
(per market-rate unit) Multiplied by Equals
Page 6
Nexus and Fee Study
AECOM estimates the subsidy between the cost of developing new housing and the achievable values of the new units based on the financial resources available to households at different income levels created by the new market-rate housing units. To estimate the maximum fee, this subsidy is multiplied by the number of lower- to middle-income workers anticipated by the new development projects and the number of households at various income categories those workers are likely to form. The total number of income-qualified households required to support the expenditure needs of new market-rate units is determined based on the affordable housing income limits from HCD. A final adjustment was made to account for the seasonal nature of household occupancy in the Town. Since the nexus analysis is driven by the assumed level of purchases created by new households, an adjustment was necessary because a large portion of households are not spending money on an annual basis. AECOM relied on 2010 US Census data that suggest 51.7 percent of the entire housing stock is dedicated to seasonal, recreational, or occasional use, reflecting the popularity of the town as a location for second-home ownership. As such, 48.3 percent of households are year-round residents. For those seasonal units, AECOM have assumed that they are fully occupied on average for 3 months a year (25 percent occupied) suggesting that the total year-round household equivalency is 61.2 percent. Commercial Methodology AECOM has identified three building types or land use activities in the analysis:
• Lodging • Retail/restaurants • Office • Light Industrial • Personal Services
The proportion of lower- to middle-income workers generated by job creation from these land uses is based on assumptions regarding job density and the associated income levels of the new workers. As noted in the residential analysis, these workers are assumed to be “net new” to the town. Job Density Assumptions The first step in the analysis is to identify the total number of direct employees who will work at or in the building type being analyzed. Average employment density factors are used to make the conversion. The density factors used are described by building types or land use activities below. Lodging: One employee per room and 500 square feet per hotel room (inclusive of other non-room hotel space) or 500 square feet per employee. This density estimate is intended to cover range of hotel types from lower service hotels, where rooms may be smaller to higher service hotels, where average room size (inclusive of lobbies, restaurants, meeting space, etc.) is larger, but the number of employees per room is higher.
Page 7
Nexus and Fee Study
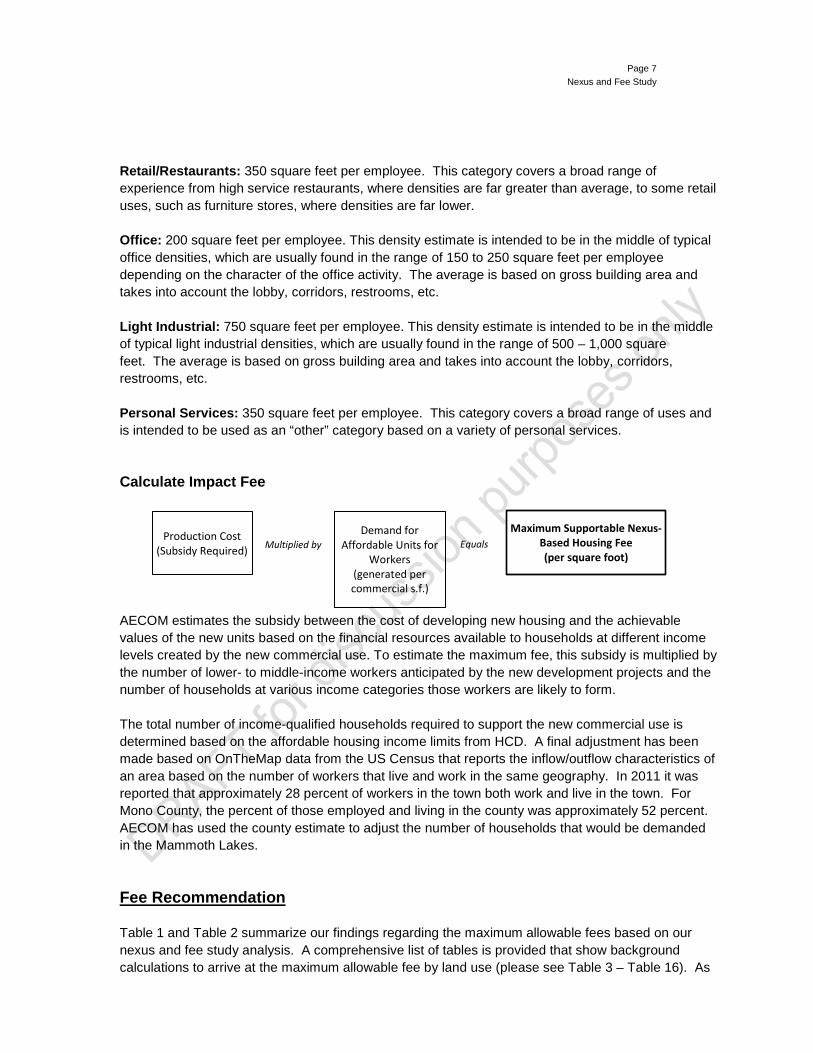
Retail/Restaurants: 350 square feet per employee. This category covers a broad range of experience from high service restaurants, where densities are far greater than average, to some retail uses, such as furniture stores, where densities are far lower. Office: 200 square feet per employee. This density estimate is intended to be in the middle of typical office densities, which are usually found in the range of 150 to 250 square feet per employee depending on the character of the office activity. The average is based on gross building area and takes into account the lobby, corridors, restrooms, etc. Light Industrial: 750 square feet per employee. This density estimate is intended to be in the middle of typical light industrial densities, which are usually found in the range of 500 – 1,000 square feet. The average is based on gross building area and takes into account the lobby, corridors, restrooms, etc. Personal Services: 350 square feet per employee. This category covers a broad range of uses and is intended to be used as an “other” category based on a variety of personal services. Calculate Impact Fee AECOM estimates the subsidy between the cost of developing new housing and the achievable values of the new units based on the financial resources available to households at different income levels created by the new commercial use. To estimate the maximum fee, this subsidy is multiplied by the number of lower- to middle-income workers anticipated by the new development projects and the number of households at various income categories those workers are likely to form. The total number of income-qualified households required to support the new commercial use is determined based on the affordable housing income limits from HCD. A final adjustment has been made based on OnTheMap data from the US Census that reports the inflow/outflow characteristics of an area based on the number of workers that live and work in the same geography. In 2011 it was reported that approximately 28 percent of workers in the town both work and live in the town. For Mono County, the percent of those employed and living in the county was approximately 52 percent. AECOM has used the county estimate to adjust the number of households that would be demanded in the Mammoth Lakes. Fee Recommendation Table 1 and Table 2 summarize our findings regarding the maximum allowable fees based on our nexus and fee study analysis. A comprehensive list of tables is provided that show background calculations to arrive at the maximum allowable fee by land use (please see Table 3 – Table 16). As
Production Cost (Subsidy Required)
Demand for Affordable Units for
Workers (generated per commercial s.f.)
Maximum Supportable Nexus-Based Housing Fee (per square foot)
Multiplied by Equals
Page 8
Nexus and Fee Study
noted, developers may target a 10 percent profit rate but may move forward with lower profit depending on the strength of market, project financing, and/or willingness to take on higher risk. The current maximum fee (as a percent of assumed value) is approximately 6 percent for a $600,000 unit. As such, if a fee was set at the maximum level, development would not likely be feasible at the price assumed in the analysis ($600,000) unless the developer was willing to take a lower rate of return. In other words, the price would have to be 6 percent higher (e.g., $636,000) for a developer to satisfy his or her theoretical rate of return with the inclusion of the fee.
[to come pending review of internal preliminary draft]
Examination of Current Inclusionary Requirement Based on AECOM’s nexus analysis, the range of inclusionary requirement is between 10.1 and 12.9 workforce housing units demanded per 100 market-rate units. In other words, based on our analysis range of units demand is approximately 10 percent to 13 percent of units. This range is generally consistent with the 10 percent currently being utilized in inclusionary housing provision.
[fee comparison to come pending review of internal preliminary draft]
Page 9
Nexus and Fee Study
Application of Fee to Housing Programs and Effectiveness To the extent that various other approaches (beyond using funds for new development) are available to retain and/or expand the supply of housing affordable to income-qualified households, the Town may elect to explore these options to invest the fee revenues created by new development. Examples of alternative programs may include, but are not limited to:
• Acquisition and rehabilitation of existing older market-rate housing units that would then be subject to income restrictions (e.g., convert to deed restricted workforce housing).
• Down payment assistance or other credit enhancements for income-qualified home buyers. • Changes in land use designations to accommodate future housing. • Explore viability of potential arrangements with second home owners who might consider
renting their units year-round.
[Additional information (prioritization/recommendations) to come pending review of internal preliminary draft]
Page 10 Nexus and Fee Study
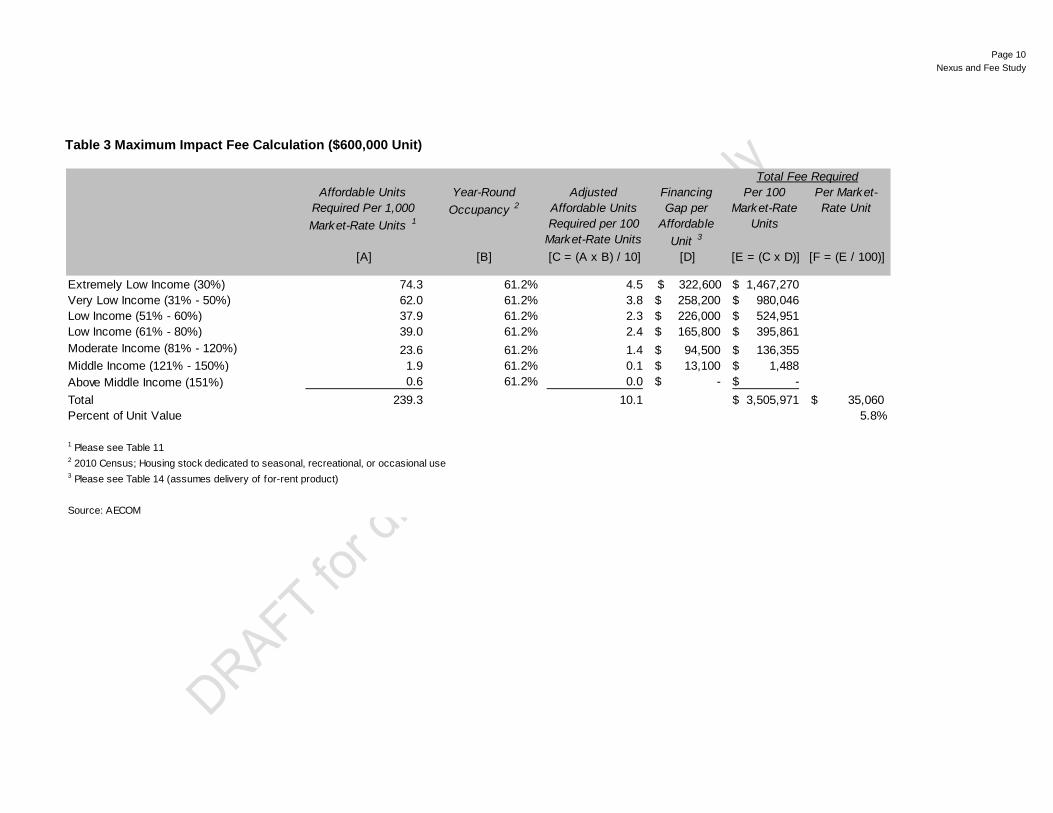
Table 3 Maximum Impact Fee Calculation ($600,000 Unit)
Affordable Units Required Per 1,000 Market-Rate Units 1
Year-Round Occupancy 2
Adjusted Affordable Units Required per 100
Market-Rate Units
Financing Gap per
Affordable Unit 3
Per 100 Market-Rate
Units
Per Market-Rate Unit
[A] [B] [C = (A x B) / 10] [D] [E = (C x D)] [F = (E / 100)]
Extremely Low Income (30%) 74.3 61.2% 4.5 $ 322,600 1,467,270$ Very Low Income (31% - 50%) 62.0 61.2% 3.8 258,200$ 980,046$ Low Income (51% - 60%) 37.9 61.2% 2.3 226,000$ 524,951$ Low Income (61% - 80%) 39.0 61.2% 2.4 165,800$ 395,861$ Moderate Income (81% - 120%) 23.6 61.2% 1.4 94,500$ 136,355$ Middle Income (121% - 150%) 1.9 61.2% 0.1 13,100$ 1,488$ Above Middle Income (151%) 0.6 61.2% 0.0 -$ -$ Total 239.3 10.1 3,505,971$ 35,060$ Percent of Unit Value 5.8%
1 Please see Table 112 2010 Census; Housing stock dedicated to seasonal, recreational, or occasional use3 Please see Table 14 (assumes delivery of for-rent product)
Source: AECOM
Total Fee Required
Page 11 Nexus and Fee Study
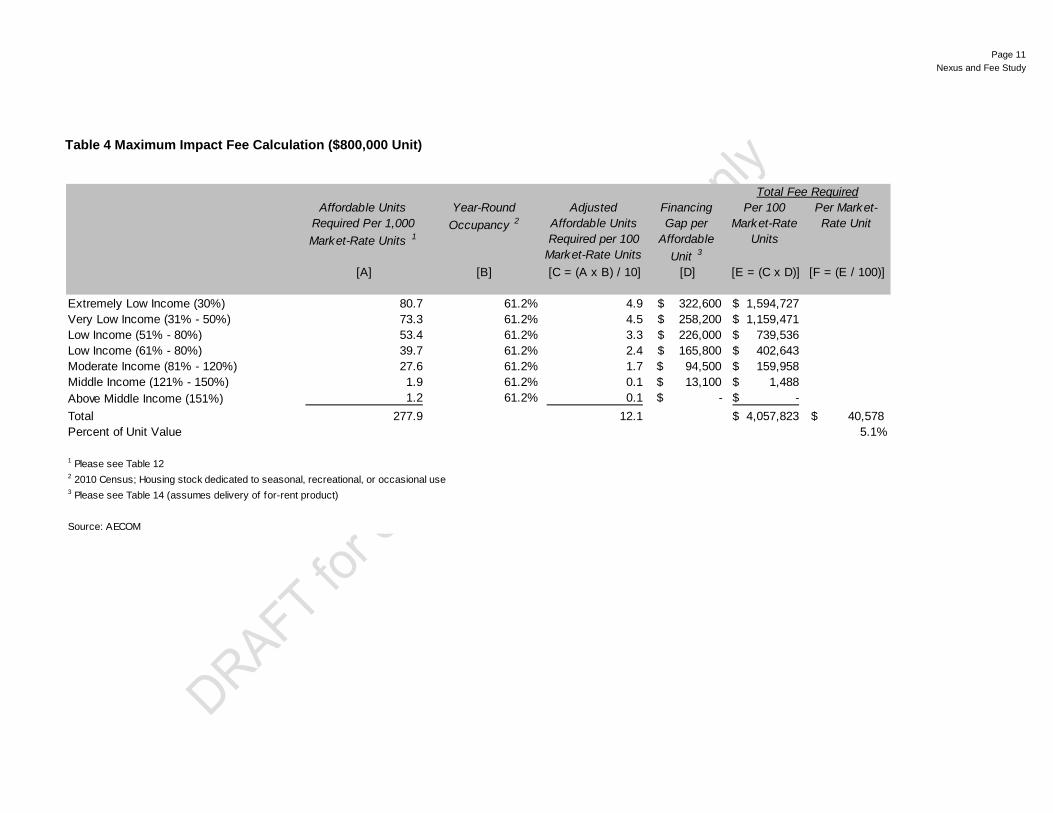
Table 4 Maximum Impact Fee Calculation ($800,000 Unit)
Affordable Units Required Per 1,000 Market-Rate Units 1
Year-Round Occupancy 2
Adjusted Affordable Units Required per 100
Market-Rate Units
Financing Gap per
Affordable Unit 3
Per 100 Market-Rate
Units
Per Market-Rate Unit
[A] [B] [C = (A x B) / 10] [D] [E = (C x D)] [F = (E / 100)]
Extremely Low Income (30%) 80.7 61.2% 4.9 $ 322,600 1,594,727$ Very Low Income (31% - 50%) 73.3 61.2% 4.5 $ 258,200 1,159,471$ Low Income (51% - 80%) 53.4 61.2% 3.3 $ 226,000 739,536$ Low Income (61% - 80%) 39.7 61.2% 2.4 $ 165,800 402,643$ Moderate Income (81% - 120%) 27.6 61.2% 1.7 $ 94,500 159,958$ Middle Income (121% - 150%) 1.9 61.2% 0.1 $ 13,100 1,488$ Above Middle Income (151%) 1.2 61.2% 0.1 $ - -$ Total 277.9 12.1 4,057,823$ 40,578$ Percent of Unit Value 5.1%
1 Please see Table 122 2010 Census; Housing stock dedicated to seasonal, recreational, or occasional use3 Please see Table 14 (assumes delivery of for-rent product)
Source: AECOM
Total Fee Required
Page 12 Nexus and Fee Study
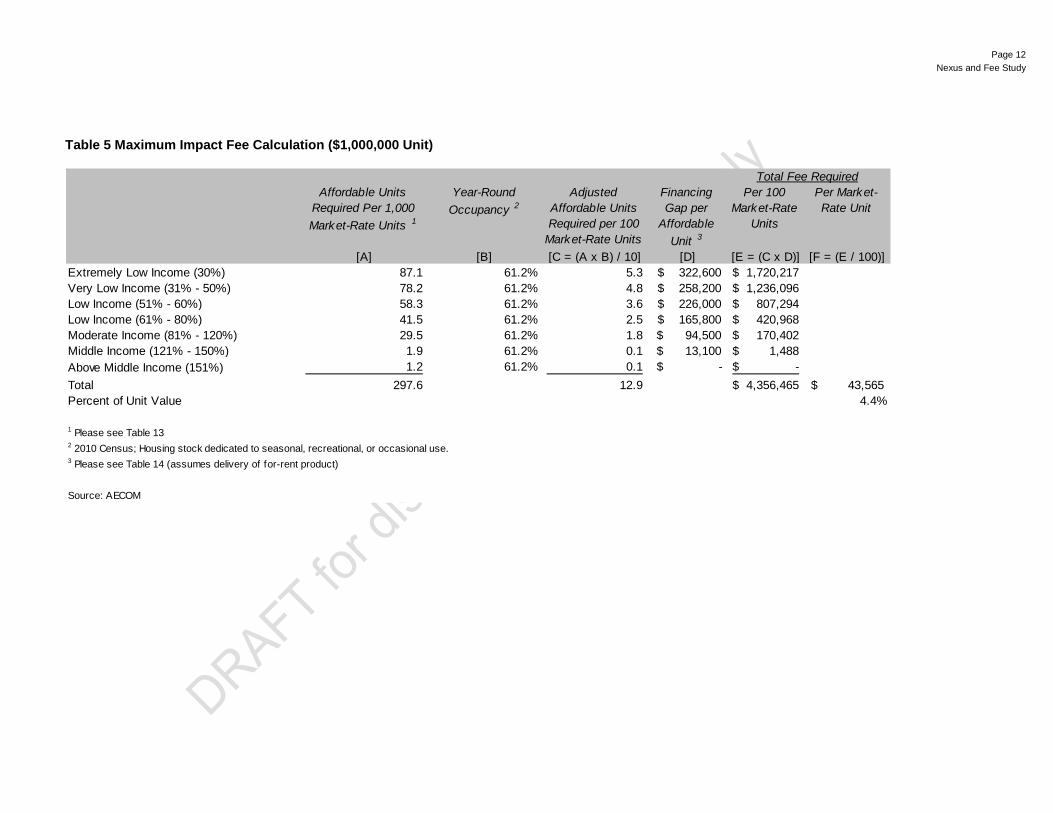
Table 5 Maximum Impact Fee Calculation ($1,000,000 Unit)
Affordable Units Required Per 1,000 Market-Rate Units 1
Year-Round Occupancy 2
Adjusted Affordable Units Required per 100
Market-Rate Units
Financing Gap per
Affordable Unit 3
Per 100 Market-Rate
Units
Per Market-Rate Unit
[A] [B] [C = (A x B) / 10] [D] [E = (C x D)] [F = (E / 100)]Extremely Low Income (30%) 87.1 61.2% 5.3 $ 322,600 1,720,217$ Very Low Income (31% - 50%) 78.2 61.2% 4.8 $ 258,200 1,236,096$ Low Income (51% - 60%) 58.3 61.2% 3.6 $ 226,000 807,294$ Low Income (61% - 80%) 41.5 61.2% 2.5 $ 165,800 420,968$ Moderate Income (81% - 120%) 29.5 61.2% 1.8 $ 94,500 170,402$ Middle Income (121% - 150%) 1.9 61.2% 0.1 $ 13,100 1,488$ Above Middle Income (151%) 1.2 61.2% 0.1 $ - -$ Total 297.6 12.9 4,356,465$ 43,565$ Percent of Unit Value 4.4%
1 Please see Table 132 2010 Census; Housing stock dedicated to seasonal, recreational, or occasional use.3 Please see Table 14 (assumes delivery of for-rent product)
Source: AECOM
Total Fee Required
Page 13 Nexus and Fee Study
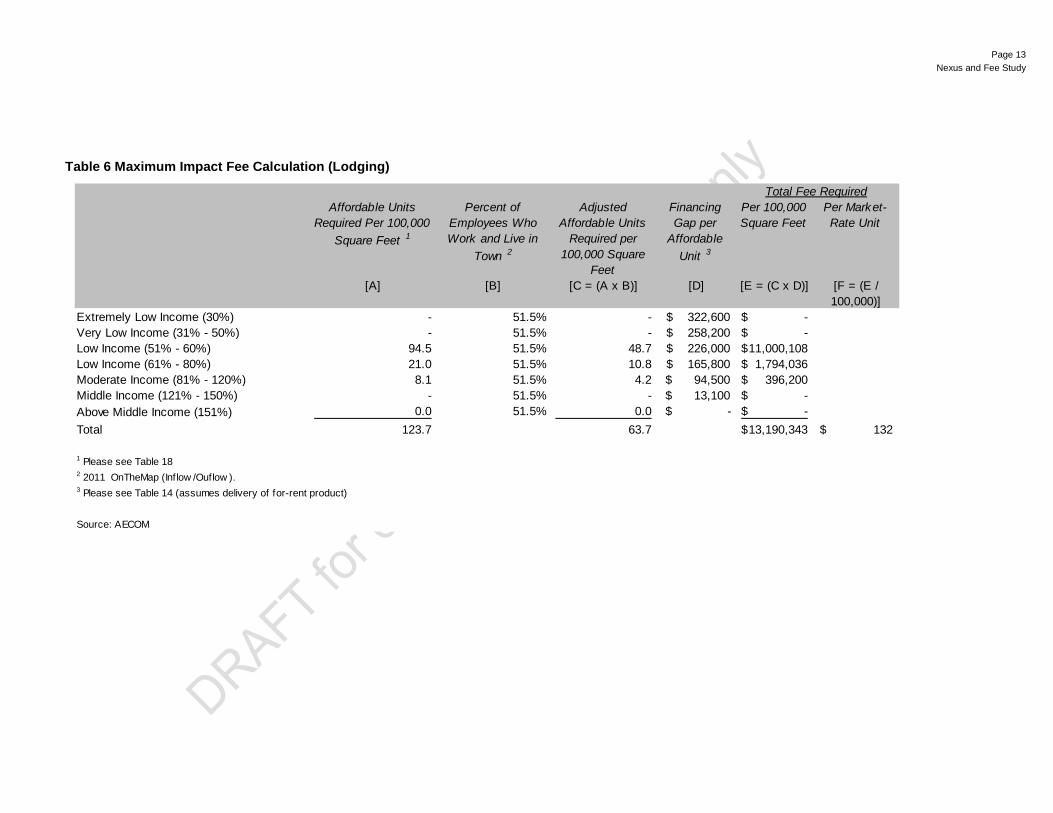
Table 6 Maximum Impact Fee Calculation (Lodging)
Affordable Units Required Per 100,000
Square Feet 1
Percent of Employees Who Work and Live in
Town 2
Adjusted Affordable Units
Required per 100,000 Square
Feet
Financing Gap per
Affordable Unit 3
Per 100,000 Square Feet
Per Market-Rate Unit
[A] [B] [C = (A x B)] [D] [E = (C x D)] [F = (E / 100,000)]
Extremely Low Income (30%) - 51.5% - $ 322,600 -$ Very Low Income (31% - 50%) - 51.5% - $ 258,200 -$ Low Income (51% - 60%) 94.5 51.5% 48.7 $ 226,000 11,000,108$ Low Income (61% - 80%) 21.0 51.5% 10.8 $ 165,800 1,794,036$ Moderate Income (81% - 120%) 8.1 51.5% 4.2 $ 94,500 396,200$ Middle Income (121% - 150%) - 51.5% - $ 13,100 -$ Above Middle Income (151%) 0.0 51.5% 0.0 $ - -$ Total 123.7 63.7 13,190,343$ 132$
1 Please see Table 182 2011 OnTheMap (Inflow /Ouflow ).3 Please see Table 14 (assumes delivery of for-rent product)
Source: AECOM
Total Fee Required

Page 14 Nexus and Fee Study
Table 7 Maximum Impact Fee Calculation (Retail/Restaurant)
Affordable Units Required Per 100,000
Square Feet 1
Percent of Employees Who Work and Live in
Town 2
Adjusted Affordable Units
Required per 100,000 Square
Feet
Financing Gap per
Affordable Unit 3
Per 100,000 Square Feet
Per Market-Rate Unit
[A] [B] [C = (A x B)] [D] [E = (C x D)] [F = (E / 100,000)]
Extremely Low Income (30%) - 51.5% - $ 322,600 -$ Very Low Income (31% - 50%) 63.7 51.5% 32.8 $ 258,200 8,466,077$ Low Income (51% - 60%) 81.6 51.5% 42.0 $ 226,000 9,500,596$ Low Income (61% - 80%) 8.2 51.5% 4.2 $ 165,800 699,572$ Moderate Income (81% - 120%) 1.5 51.5% 0.8 $ 94,500 73,382$ Middle Income (121% - 150%) 7.4 51.5% 3.8 $ 13,100 50,170$ Above Middle Income (151%) 0.0 51.5% 0.0 $ - -$ Total 162.4 83.7 18,789,797$ 188$
1 Please see Table 182 2011 OnTheMap (Inflow /Ouflow ).3 Please see Table 14 (assumes delivery of for-rent product)
Source: AECOM
Total Fee Required

Page 15 Nexus and Fee Study
Table 8 Maximum Impact Fee Calculations (Office)
Affordable Units Required Per 100,000
Square Feet 1
Percent of Employees Who Work and Live in
Town 2
Adjusted Affordable Units
Required per 100,000 Square
Feet
Financing Gap per
Affordable Unit 3
Per 100,000 Square Feet
Per Market-Rate Unit
[A] [B] [C = (A x B)] [D] [E = (C x D)] [F = (E / 100,000)]
Extremely Low Income (30%) - 51.5% - $ 322,600 -$ Very Low Income (31% - 50%) 0.1 51.5% 0.0 $ 258,200 9,298$ Low Income (51% - 60%) 23.3 51.5% 12.0 $ 226,000 2,715,287$ Low Income (61% - 80%) 96.0 51.5% 49.4 $ 165,800 8,195,928$ Moderate Income (81% - 120%) 41.6 51.5% 21.4 $ 94,500 2,024,052$ Middle Income (121% - 150%) 14.1 51.5% 7.2 $ 13,100 94,945$ Above Middle Income (151%) 134.1 51.5% 69.1 $ - -$ Total 309.2 159.2 13,039,510$ 130$
1 Please see Table 182 2011 OnTheMap (Inflow /Ouflow ).3 Please see Table 14 (assumes delivery of for-rent product)
Source: AECOM
Total Fee Required
Page 16 Nexus and Fee Study
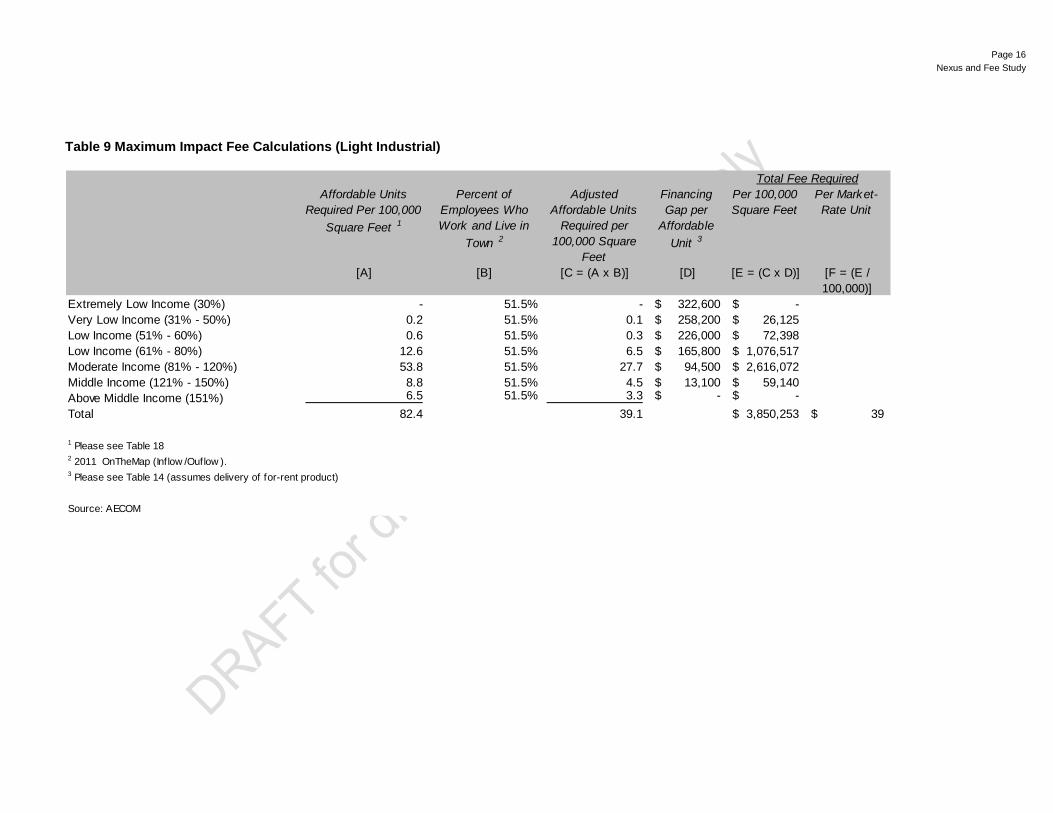
Table 9 Maximum Impact Fee Calculations (Light Industrial)
Affordable Units Required Per 100,000
Square Feet 1
Percent of Employees Who Work and Live in
Town 2
Adjusted Affordable Units
Required per 100,000 Square
Feet
Financing Gap per
Affordable Unit 3
Per 100,000 Square Feet
Per Market-Rate Unit
[A] [B] [C = (A x B)] [D] [E = (C x D)] [F = (E / 100,000)]
Extremely Low Income (30%) - 51.5% - 322,600$ -$ Very Low Income (31% - 50%) 0.2 51.5% 0.1 258,200$ 26,125$ Low Income (51% - 60%) 0.6 51.5% 0.3 226,000$ 72,398$ Low Income (61% - 80%) 12.6 51.5% 6.5 165,800$ 1,076,517$ Moderate Income (81% - 120%) 53.8 51.5% 27.7 94,500$ 2,616,072$ Middle Income (121% - 150%) 8.8 51.5% 4.5 13,100$ 59,140$ Above Middle Income (151%) 6.5 51.5% 3.3 -$ -$ Total 82.4 39.1 3,850,253$ 39$
1 Please see Table 182 2011 OnTheMap (Inflow /Ouflow ).3 Please see Table 14 (assumes delivery of for-rent product)
Source: AECOM
Total Fee Required

Page 17 Nexus and Fee Study
Table 10 Maximum Impact Fee Calculations (Personal Services)
Affordable Units Required Per 100,000
Square Feet 1
Percent of Employees Who Work and Live in
Town 2
Adjusted Affordable Units
Required per 100,000 Square
Feet
Financing Gap per
Affordable Unit 3
Per 100,000 Square Feet
Per Market-Rate Unit
[A] [B] [C = (A x B)] [D] [E = (C x D)] [F = (E / 100,000)]
Extremely Low Income (30%) - 51.5% - $ 322,600 -$ Very Low Income (31% - 50%) 3.5 51.5% 1.8 $ 258,200 464,394$ Low Income (51% - 60%) 0.4 51.5% 0.2 $ 226,000 52,198$ Low Income (61% - 80%) 100.4 51.5% 51.7 $ 165,800 8,569,151$ Moderate Income (81% - 120%) 64.0 51.5% 33.0 $ 94,500 3,115,206$ Middle Income (121% - 150%) 8.0 51.5% 4.1 $ 13,100 54,017$ Above Middle Income (151%) 0.4 51.5% 0.2 $ - -$ Total 176.7 90.8 12,254,966$ 123$
1 Please see Table 182 2011 OnTheMap (Inflow /Ouflow ).3 Please see Table 14 (assumes delivery of for-rent product)
Source: AECOM
Total Fee Required

Page 18 Nexus and Fee Study
Table 11 Household Employment Generation per 1,000 Market-Rate Units ($600,000)
IndustryHousehold
Income
Total Households
($400K Unit) 1
Extrememly Low-Income
(30% of AMI)
Very Low-Income (31% - 50% of
AMI)
Low-Income (51% - 60% of
AMI)
Low-Income (61% - 80% of
AMI)
Moderate-Income (81% - 120% of
AMI)
Middle-Income (121% - 150%
of AMI)Above-Middle (151% of AMI)
RetailFood & Beverage Stores $45,273 14.3 0 0 0 14 0 0 0Food Services and Drinking Places $21,695 69.3 69 0 0 0 0 0 0Health and Personal Care Stores $47,510 3.1 0 0 0 3 0 0 0General Merchandise $33,656 5.1 0 5 0 0 0 0 0Furniture and Home Furnishings Stores $33,128 4.9 0 5 0 0 0 0 0Building material and Garden Equipment and Suppliers $35,380 4.3 0 4 0 0 0 0 0Electronics and Appliance Stores $50,966 10.5 0 0 0 11 0 0 0Clothing and Clothing Accessories Stores $23,739 4.5 0 5 0 0 0 0 0Motor Vehicle and Parts Dealers $67,479 8.0 0 0 0 0 8 0 0Gasoline Stations $43,799 4.5 0 0 5 0 0 0 0Sporting Goods, Hobby, and Musical Instruments $24,043 9.7 0 10 0 0 0 0 0Miscellaneous Store Retailers $31,038 6.2 0 6 0 0 0 0 0Nonstore Retailers $47,526 0.6 0 0 0 1 0 0 0
Arts, Entertainment, & Recreation $62,590 6.3 0 0 0 0 6 0 0
Medical/HealthAmbulatory Health Care Services $82,644 2.5 0 0 0 0 2 0 0General Medical and Surgical Hospitals $92,462 1.9 0 0 0 0 0 2 0Nursing and Residential Care Facilities $40,816 8.0 0 0 8 0 0 0 0Social Assistance 4.9 5 0 0 0 0 0 0
ServicesPersonal and Household Goods Repair and Maintenance $42,657 8.0 0 0 8 0 0 0 0Services to Buildings and Dwellings $30,154 11.7 0 12 0 0 0 0 0Waste Management and Remediation Services $76,010 2.5 0 0 0 0 2 0 0Real Estate and Rental and Leasing $45,474 1.2 0 0 0 1 0 0 0Personal Care Services $26,255 14.2 0 14 0 0 0 0 0Dry Cleaning and Laundry Services $39,861 0.6 0 0 1 0 0 0 0Auto Repair and Maintenance $54,396 6.2 0 0 0 6 0 0 0Veterinary services $54,387 1.2 0 0 0 1 0 0 0Photographic Services $35,922 1.2 0 1 0 0 0 0 0Educations Services $40,145 16.7 0 0 17 0 0 0 0Accounting $46,287 1.9 0 0 0 2 0 0 0Architectural, Engineering, and Related $86,935 1.9 0 0 0 0 2 0 0Specialized Designed Services $85,826 1.2 0 0 0 0 1 0 0Death Care Services $58,902 1.2 0 0 0 0 1 0 0Legal Services $136,547 0.6 0 0 0 0 0 0 1
239.3 74 62 38 39 24 2 18 7 4 4 3 1 1
Source: AECOM
1 Assumes 1.59 w orkers per household based on the ACS, 2013. Includes a 9.4% average discount for business w ith more than 5% of w orkers betw een the ages of 16 and 19, and a 1.5% discount for businesses w ith less than 5% of w orkers betw een the ages of 16 and 19. 2 Excludes above middle-income households because these income are adequate to acquire market-rate housing. Please see Appendix Table 1 for additional details.
Household Generation 2
Total Households Generate Per 1,000 Market-Rate UnitsTotal Income-Qualified Households Generated Per 100 Market-Rate Units
Page 19 Nexus and Fee Study
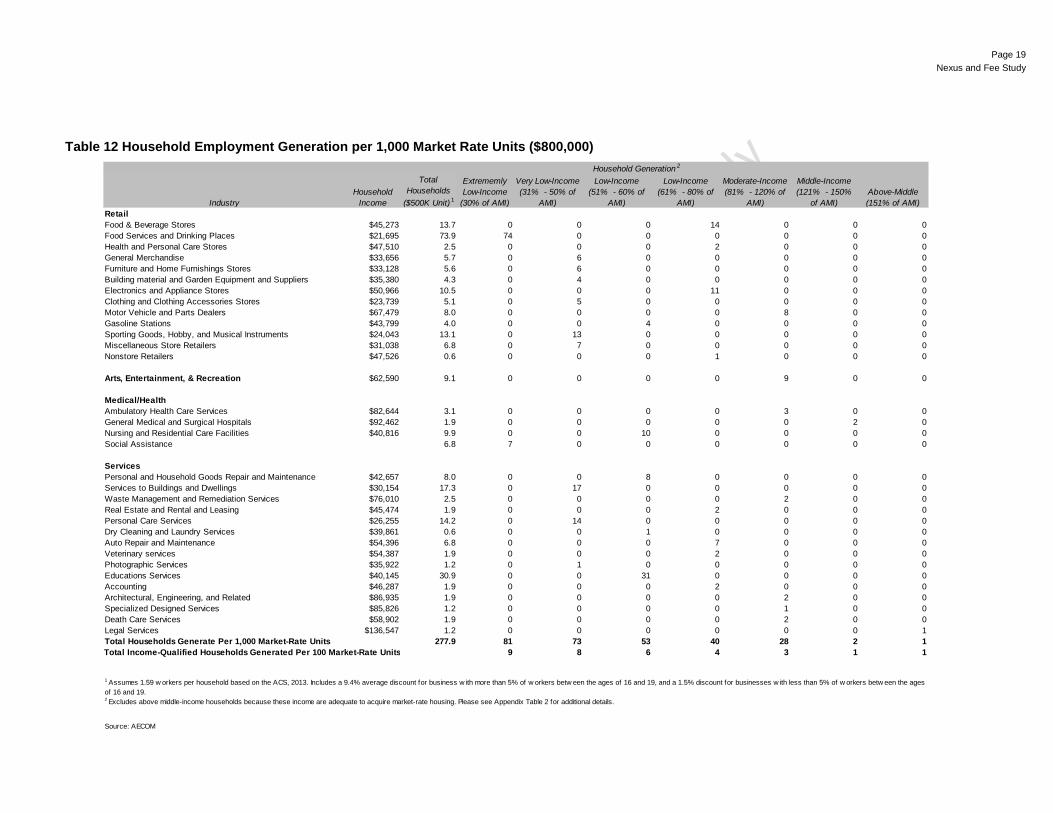
Table 12 Household Employment Generation per 1,000 Market Rate Units ($800,000)
IndustryHousehold
Income
Total Households
($500K Unit) 1
Extrememly Low-Income
(30% of AMI)
Very Low-Income (31% - 50% of
AMI)
Low-Income (51% - 60% of
AMI)
Low-Income (61% - 80% of
AMI)
Moderate-Income (81% - 120% of
AMI)
Middle-Income (121% - 150%
of AMI)Above-Middle (151% of AMI)
RetailFood & Beverage Stores $45,273 13.7 0 0 0 14 0 0 0Food Services and Drinking Places $21,695 73.9 74 0 0 0 0 0 0Health and Personal Care Stores $47,510 2.5 0 0 0 2 0 0 0General Merchandise $33,656 5.7 0 6 0 0 0 0 0Furniture and Home Furnishings Stores $33,128 5.6 0 6 0 0 0 0 0Building material and Garden Equipment and Suppliers $35,380 4.3 0 4 0 0 0 0 0Electronics and Appliance Stores $50,966 10.5 0 0 0 11 0 0 0Clothing and Clothing Accessories Stores $23,739 5.1 0 5 0 0 0 0 0Motor Vehicle and Parts Dealers $67,479 8.0 0 0 0 0 8 0 0Gasoline Stations $43,799 4.0 0 0 4 0 0 0 0Sporting Goods, Hobby, and Musical Instruments $24,043 13.1 0 13 0 0 0 0 0Miscellaneous Store Retailers $31,038 6.8 0 7 0 0 0 0 0Nonstore Retailers $47,526 0.6 0 0 0 1 0 0 0
Arts, Entertainment, & Recreation $62,590 9.1 0 0 0 0 9 0 0
Medical/HealthAmbulatory Health Care Services $82,644 3.1 0 0 0 0 3 0 0General Medical and Surgical Hospitals $92,462 1.9 0 0 0 0 0 2 0Nursing and Residential Care Facilities $40,816 9.9 0 0 10 0 0 0 0Social Assistance 6.8 7 0 0 0 0 0 0
ServicesPersonal and Household Goods Repair and Maintenance $42,657 8.0 0 0 8 0 0 0 0Services to Buildings and Dwellings $30,154 17.3 0 17 0 0 0 0 0Waste Management and Remediation Services $76,010 2.5 0 0 0 0 2 0 0Real Estate and Rental and Leasing $45,474 1.9 0 0 0 2 0 0 0Personal Care Services $26,255 14.2 0 14 0 0 0 0 0Dry Cleaning and Laundry Services $39,861 0.6 0 0 1 0 0 0 0Auto Repair and Maintenance $54,396 6.8 0 0 0 7 0 0 0Veterinary services $54,387 1.9 0 0 0 2 0 0 0Photographic Services $35,922 1.2 0 1 0 0 0 0 0Educations Services $40,145 30.9 0 0 31 0 0 0 0Accounting $46,287 1.9 0 0 0 2 0 0 0Architectural, Engineering, and Related $86,935 1.9 0 0 0 0 2 0 0Specialized Designed Services $85,826 1.2 0 0 0 0 1 0 0Death Care Services $58,902 1.9 0 0 0 0 2 0 0Legal Services $136,547 1.2 0 0 0 0 0 0 1
277.9 81 73 53 40 28 2 19 8 6 4 3 1 1
Source: AECOM
1 Assumes 1.59 w orkers per household based on the ACS, 2013. Includes a 9.4% average discount for business w ith more than 5% of w orkers betw een the ages of 16 and 19, and a 1.5% discount for businesses w ith less than 5% of w orkers betw een the ages of 16 and 19. 2 Excludes above middle-income households because these income are adequate to acquire market-rate housing. Please see Appendix Table 2 for additional details.
Household Generation 2
Total Households Generate Per 1,000 Market-Rate UnitsTotal Income-Qualified Households Generated Per 100 Market-Rate Units

Page 20 Nexus and Fee Study
Table 13 Household Employment Generation per 1,000 Market-rate Units ($1,000,000)
IndustryHousehold
Income
Total Households
($500K Unit) 1
Extrememly Low-Income
(30% of AMI)
Very Low-Income (31% - 50% of
AMI)
Low-Income (51% - 60% of
AMI)
Low-Income (61% - 80% of
AMI)
Moderate-Income (81% - 120% of
AMI)
Middle-Income (121% - 150%
of AMI)Above-Middle (151% of AMI)
RetailFood & Beverage Stores $45,273 14.3 0 0 0 14 0 0 0Food Services and Drinking Places $21,695 79.7 80 0 0 0 0 0 0Health and Personal Care Stores $47,510 2.5 0 0 0 2 0 0 0General Merchandise $33,656 5.7 0 6 0 0 0 0 0Furniture and Home Furnishings Stores $33,128 6.2 0 6 0 0 0 0 0Building material and Garden Equipment and Suppliers $35,380 4.9 0 5 0 0 0 0 0Electronics and Appliance Stores $50,966 11.1 0 0 0 11 0 0 0Clothing and Clothing Accessories Stores $23,739 5.7 0 6 0 0 0 0 0Motor Vehicle and Parts Dealers $67,479 8.7 0 0 0 0 9 0 0Gasoline Stations $43,799 4.5 0 0 5 0 0 0 0Sporting Goods, Hobby, and Musical Instruments $24,043 13.6 0 14 0 0 0 0 0Miscellaneous Store Retailers $31,038 7.4 0 7 0 0 0 0 0Nonstore Retailers $47,526 0.6 0 0 0 1 0 0 0
Arts, Entertainment, & Recreation $62,590 9.7 0 0 0 0 10 0 0
Medical/HealthAmbulatory Health Care Services $82,644 3.1 0 0 0 0 3 0 0General Medical and Surgical Hospitals $92,462 1.9 0 0 0 0 0 2 0Nursing and Residential Care Facilities $40,816 11.1 0 0 11 0 0 0 0Social Assistance 7.4 7 0 0 0 0 0 0
ServicesPersonal and Household Goods Repair and Maintenance $42,657 8.7 0 0 9 0 0 0 0Services to Buildings and Dwellings $30,154 18.6 0 19 0 0 0 0 0Waste Management and Remediation Services $76,010 3.1 0 0 0 0 3 0 0Real Estate and Rental and Leasing $45,474 1.9 0 0 0 2 0 0 0Personal Care Services $26,255 14.8 0 15 0 0 0 0 0Dry Cleaning and Laundry Services $39,861 0.6 0 0 1 0 0 0 0Auto Repair and Maintenance $54,396 7.4 0 0 0 7 0 0 0Veterinary services $54,387 1.9 0 0 0 2 0 0 0Photographic Services $35,922 1.2 0 1 0 0 0 0 0Educations Services $40,145 33.4 0 0 33 0 0 0 0Accounting $46,287 1.9 0 0 0 2 0 0 0Architectural, Engineering, and Related $86,935 1.9 0 0 0 0 2 0 0Specialized Designed Services $85,826 1.2 0 0 0 0 1 0 0Death Care Services $58,902 1.9 0 0 0 0 2 0 0Legal Services $136,547 1.2 0 0 0 0 0 0 1
297.6 87 78 58 41 29 2 19 8 6 5 3 1 1
Source: AECOM
Household Generation 2
Total Households Generate Per 1,000 Market-Rate UnitsTotal Income-Qualified Households Generated Per 100 Market-Rate Units
1 Assumes 1.59 w orkers per household based on the ACS, 2013. Includes a 9.4% average discount for business w ith more than 5% of w orkers betw een the ages of 16 and 19, and a 1.5% discount for businesses w ith less than 5% of w orkers betw een the ages of 16 and 19. 2 Excludes above middle-income households because these income are adequate to acquire market-rate housing. Please see Appendix Table 3 for additional details.
Page 21 Nexus and Fee Study
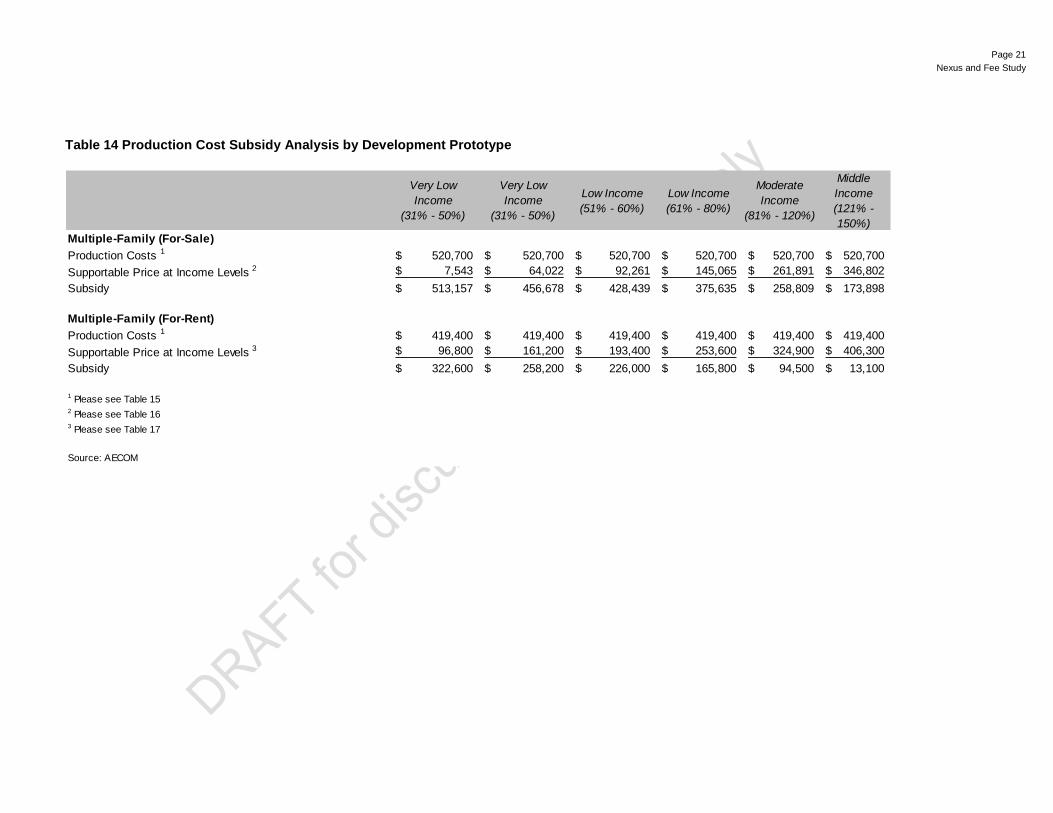
Table 14 Production Cost Subsidy Analysis by Development Prototype
Very Low Income
(31% - 50%)
Very Low Income
(31% - 50%)
Low Income (51% - 60%)
Low Income (61% - 80%)
Moderate Income
(81% - 120%)
MiddleIncome (121% - 150%)
Multiple-Family (For-Sale)Production Costs 1 520,700$ 520,700$ 520,700$ 520,700$ 520,700$ 520,700$ Supportable Price at Income Levels 2 7,543$ 64,022$ 92,261$ 145,065$ 261,891$ 346,802$ Subsidy 513,157$ 456,678$ 428,439$ 375,635$ 258,809$ 173,898$
Multiple-Family (For-Rent)Production Costs 1 419,400$ 419,400$ 419,400$ 419,400$ 419,400$ 419,400$ Supportable Price at Income Levels 3 96,800$ 161,200$ 193,400$ 253,600$ 324,900$ 406,300$ Subsidy 322,600$ 258,200$ 226,000$ 165,800$ 94,500$ 13,100$
1 Please see Table 152 Please see Table 163 Please see Table 17
Source: AECOM
Page 22 Nexus and Fee Study
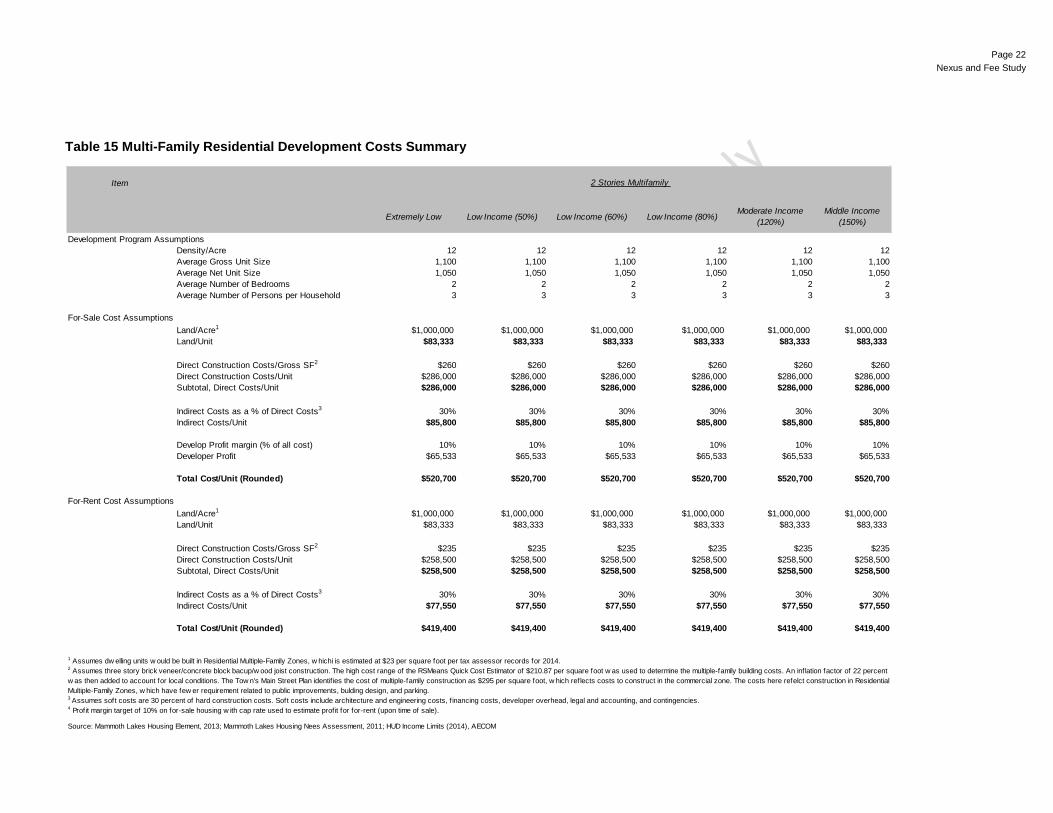
Table 15 Multi-Family Residential Development Costs Summary
Item
Extremely Low Low Income (50%) Low Income (60%) Low Income (80%)Moderate Income
(120%)Middle Income
(150%)
Development Program AssumptionsDensity/Acre 12 12 12 12 12 12Average Gross Unit Size 1,100 1,100 1,100 1,100 1,100 1,100Average Net Unit Size 1,050 1,050 1,050 1,050 1,050 1,050Average Number of Bedrooms 2 2 2 2 2 2Average Number of Persons per Household 3 3 3 3 3 3
For-Sale Cost AssumptionsLand/Acre1 $1,000,000 $1,000,000 $1,000,000 $1,000,000 $1,000,000 $1,000,000Land/Unit $83,333 $83,333 $83,333 $83,333 $83,333 $83,333
Direct Construction Costs/Gross SF2 $260 $260 $260 $260 $260 $260Direct Construction Costs/Unit $286,000 $286,000 $286,000 $286,000 $286,000 $286,000Subtotal, Direct Costs/Unit $286,000 $286,000 $286,000 $286,000 $286,000 $286,000
Indirect Costs as a % of Direct Costs3 30% 30% 30% 30% 30% 30%Indirect Costs/Unit $85,800 $85,800 $85,800 $85,800 $85,800 $85,800
Develop Profit margin (% of all cost) 10% 10% 10% 10% 10% 10%Developer Profit $65,533 $65,533 $65,533 $65,533 $65,533 $65,533
Total Cost/Unit (Rounded) $520,700 $520,700 $520,700 $520,700 $520,700 $520,700
For-Rent Cost AssumptionsLand/Acre1 $1,000,000 $1,000,000 $1,000,000 $1,000,000 $1,000,000 $1,000,000Land/Unit $83,333 $83,333 $83,333 $83,333 $83,333 $83,333
Direct Construction Costs/Gross SF2 $235 $235 $235 $235 $235 $235Direct Construction Costs/Unit $258,500 $258,500 $258,500 $258,500 $258,500 $258,500Subtotal, Direct Costs/Unit $258,500 $258,500 $258,500 $258,500 $258,500 $258,500
Indirect Costs as a % of Direct Costs3 30% 30% 30% 30% 30% 30%Indirect Costs/Unit $77,550 $77,550 $77,550 $77,550 $77,550 $77,550
Total Cost/Unit (Rounded) $419,400 $419,400 $419,400 $419,400 $419,400 $419,400
Source: Mammoth Lakes Housing Element, 2013; Mammoth Lakes Housing Nees Assessment, 2011; HUD Income Limits (2014), AECOM
1 Assumes dw elling units w ould be built in Residential Multiple-Family Zones, w hichi is estimated at $23 per square foot per tax assessor records for 2014.2 Assumes three story brick veneer/concrete block bacup/w ood joist construction. The high cost range of the RSMeans Quick Cost Estimator of $210.87 per square foot w as used to determine the multiple-family building costs. An inflation factor of 22 percent w as then added to account for local conditions. The Tow n's Main Street Plan identif ies the cost of multiple-family construction as $295 per square foot, w hich reflects costs to construct in the commercial zone. The costs here refelct construction in Residential Multiple-Family Zones, w hich have few er requirement related to public improvements, bulding design, and parking.3 Assumes soft costs are 30 percent of hard construction costs. Soft costs include architecture and engineering costs, f inancing costs, developer overhead, legal and accounting, and contingencies.4 Profit margin target of 10% on for-sale housing w ith cap rate used to estimate profit for for-rent (upon time of sale).
2 Stories Multifamily
Page 23 Nexus and Fee Study
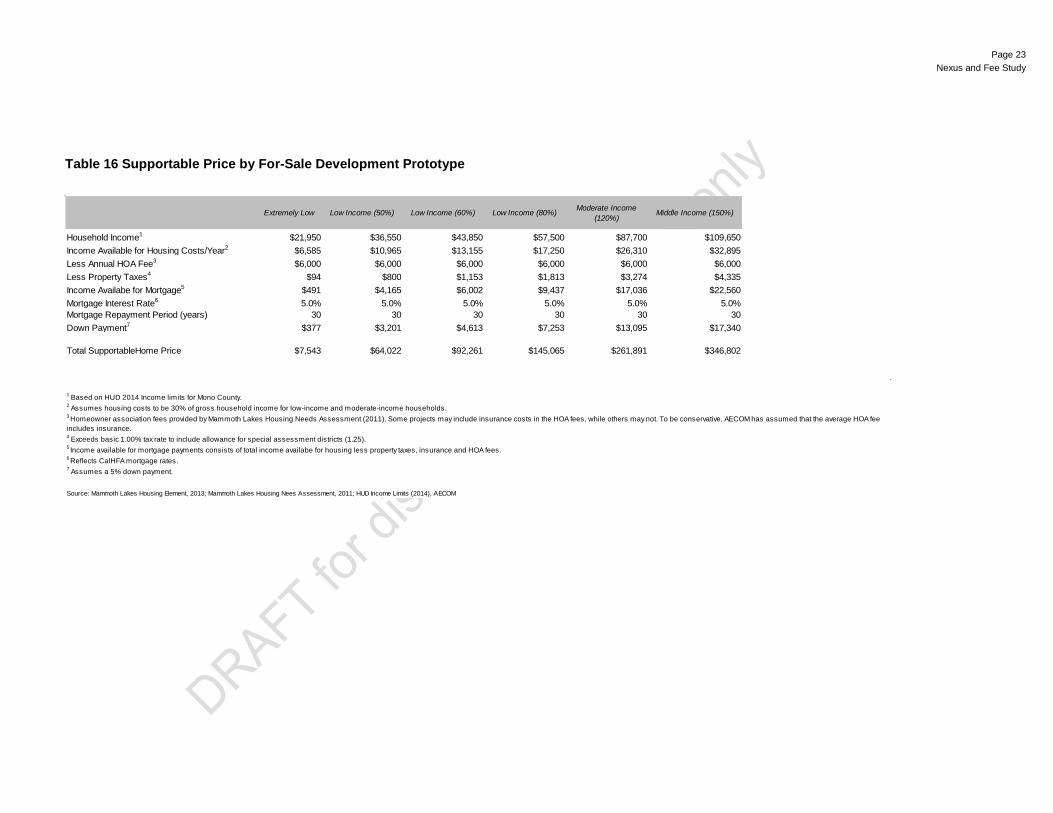
Table 16 Supportable Price by For-Sale Development Prototype
Extremely Low Low Income (50%) Low Income (60%) Low Income (80%) Moderate Income (120%)
Middle Income (150%)
Household Income1 $21,950 $36,550 $43,850 $57,500 $87,700 $109,650Income Available for Housing Costs/Year2 $6,585 $10,965 $13,155 $17,250 $26,310 $32,895Less Annual HOA Fee3 $6,000 $6,000 $6,000 $6,000 $6,000 $6,000Less Property Taxes4 $94 $800 $1,153 $1,813 $3,274 $4,335Income Availabe for Mortgage5 $491 $4,165 $6,002 $9,437 $17,036 $22,560Mortgage Interest Rate6 5.0% 5.0% 5.0% 5.0% 5.0% 5.0%Mortgage Repayment Period (years) 30 30 30 30 30 30Down Payment7 $377 $3,201 $4,613 $7,253 $13,095 $17,340
Total SupportableHome Price $7,543 $64,022 $92,261 $145,065 $261,891 $346,802
Source: Mammoth Lakes Housing Element, 2013; Mammoth Lakes Housing Nees Assessment, 2011; HUD Income Limits (2014), AECOM
1 Based on HUD 2014 Income limits for Mono County.2 Assumes housing costs to be 30% of gross household income for low-income and moderate-income households.3 Homeowner association fees provided by Mammoth Lakes Housing Needs Assessment (2011). Some projects may include insurance costs in the HOA fees, while others may not. To be conservative, AECOM has assumed that the average HOA fee includes insurance. 4 Exceeds basic 1.00% tax rate to include allowance for special assessment districts (1.25).5 Income available for mortgage payments consists of total income availabe for housing less property taxes, insurance and HOA fees.6 Reflects CalHFA mortgage rates.7 Assumes a 5% down payment.
Page 24 Nexus and Fee Study
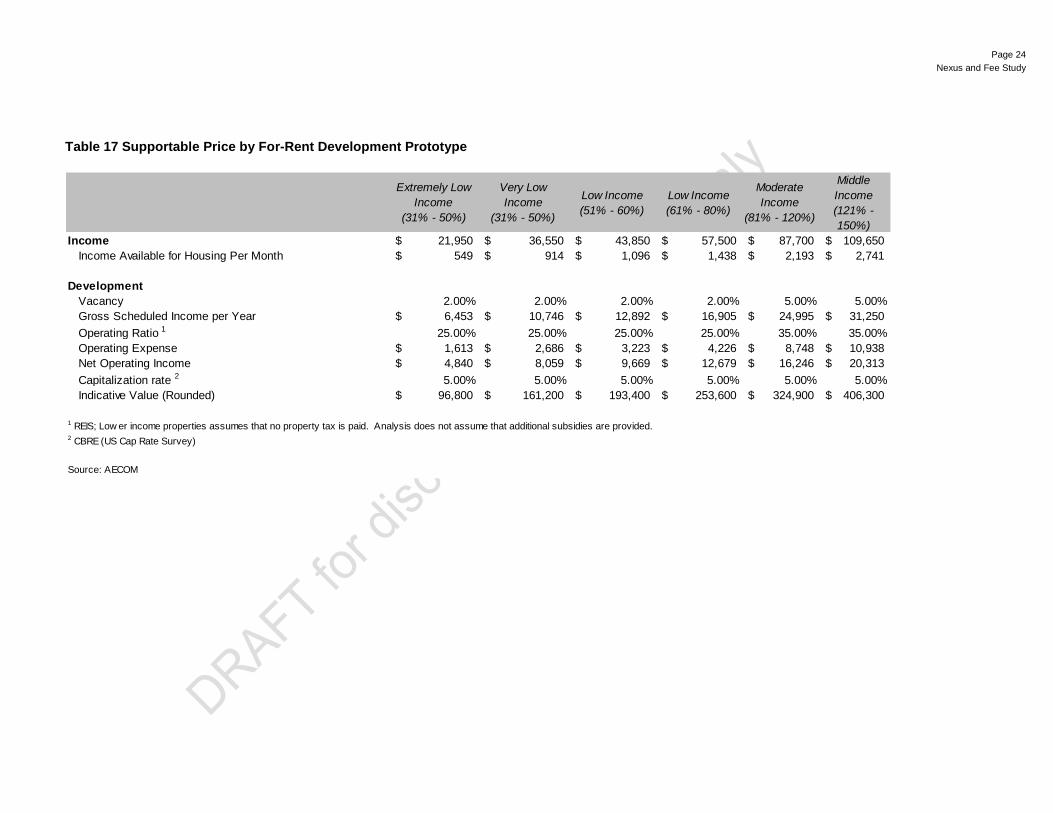
Table 17 Supportable Price by For-Rent Development Prototype
Extremely Low Income
(31% - 50%)
Very Low Income
(31% - 50%)
Low Income (51% - 60%)
Low Income (61% - 80%)
Moderate Income
(81% - 120%)
MiddleIncome (121% - 150%)
Income 21,950$ 36,550$ 43,850$ 57,500$ 87,700$ 109,650$ Income Available for Housing Per Month 549$ 914$ 1,096$ 1,438$ 2,193$ 2,741$
DevelopmentVacancy 2.00% 2.00% 2.00% 2.00% 5.00% 5.00%Gross Scheduled Income per Year 6,453$ 10,746$ 12,892$ 16,905$ 24,995$ 31,250$ Operating Ratio 1 25.00% 25.00% 25.00% 25.00% 35.00% 35.00%Operating Expense 1,613$ 2,686$ 3,223$ 4,226$ 8,748$ 10,938$ Net Operating Income 4,840$ 8,059$ 9,669$ 12,679$ 16,246$ 20,313$ Capitalization rate 2 5.00% 5.00% 5.00% 5.00% 5.00% 5.00%Indicative Value (Rounded) 96,800$ 161,200$ 193,400$ 253,600$ 324,900$ 406,300$
1 REIS; Low er income properties assumes that no property tax is paid. Analysis does not assume that additional subsidies are provided.2 CBRE (US Cap Rate Survey)
Source: AECOM
Page 25 Nexus and Fee Study
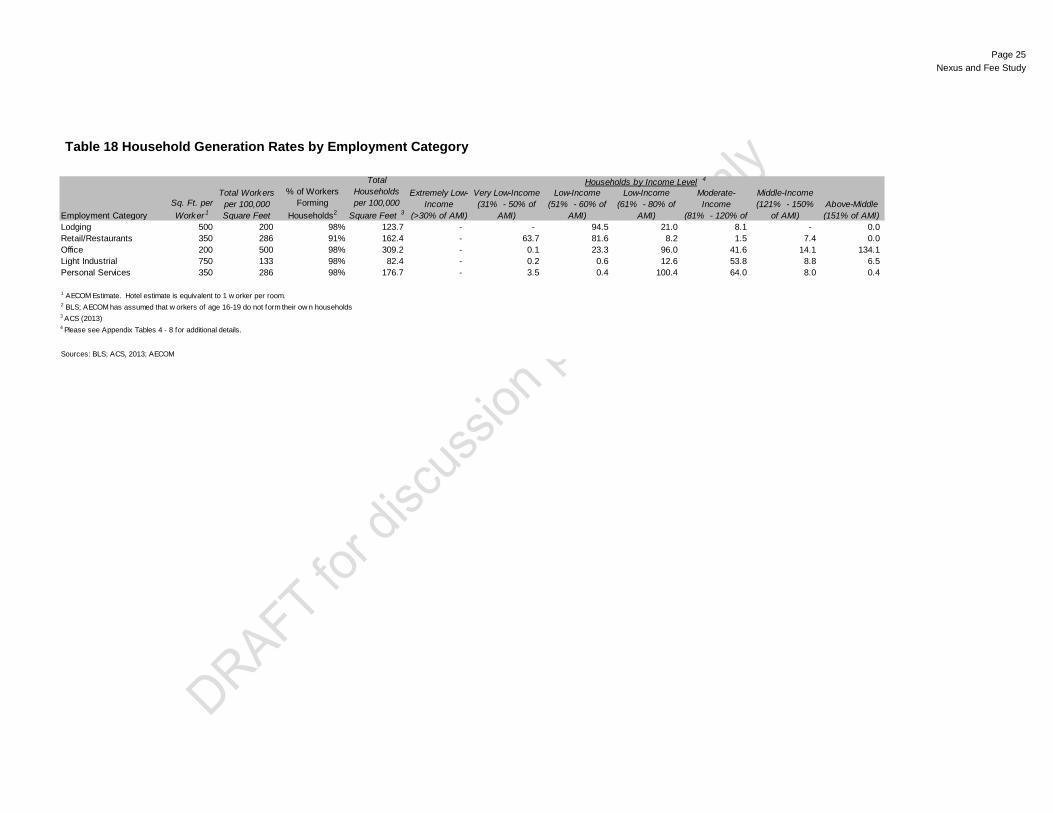
Table 18 Household Generation Rates by Employment Category
Extremely Low-Income
(>30% of AMI)
Very Low-Income (31% - 50% of
AMI)
Low-Income (51% - 60% of
AMI)
Low-Income (61% - 80% of
AMI)
Moderate-Income
(81% - 120% of
Middle-Income (121% - 150%
of AMI)Above-Middle (151% of AMI)
Lodging 500 200 98% 123.7 - - 94.5 21.0 8.1 - 0.0 Retail/Restaurants 350 286 91% 162.4 - 63.7 81.6 8.2 1.5 7.4 0.0 Office 200 500 98% 309.2 - 0.1 23.3 96.0 41.6 14.1 134.1 Light Industrial 750 133 98% 82.4 - 0.2 0.6 12.6 53.8 8.8 6.5 Personal Services 350 286 98% 176.7 - 3.5 0.4 100.4 64.0 8.0 0.4
1 AECOM Estimate. Hotel estimate is equivalent to 1 w orker per room.2 BLS; AECOM has assumed that w orkers of age 16-19 do not form their ow n households 3 ACS (2013)4 Please see Appendix Tables 4 - 8 for additional details.
Sources: BLS; ACS, 2013; AECOM
Employment Category
Households by Income Level 4
Sq. Ft. per Worker 1
Total Workers per 100,000 Square Feet
% of Workers Forming
Households2
Total Households per 100,000
Square Feet 3
Page 26 Nexus and Fee Study
General Limiting Conditions AECOM has endeavored to ensure that the reported data and information contained in this report are complete, accurate, and relevant. All estimates, assumptions, and extrapolations are based on methodological techniques employed by AECOM and believed to be reliable. These assumptions are outlined throughout this report. AECOM assumes no responsibility for inaccuracies in reporting by the client, its agencies, representatives, or any other third party data source used in the preparation of this report. Further, AECOM makes no warranty or representation concerning any of the estimated or projected values or results contained in this study materializing. Written consent from AECOM shall be sought in advance of publishing this report in any media. No abstracting, excerpting, or summarizing of this study may be made without first obtaining the prior written consent of AECOM. This report is not to be used in conjunction with any public or private offering of securities or other similar purpose where it may be relied upon to any degree by any person, other than the client, without first obtaining the prior written consent of AECOM. This study may not be used for purposes other than that for which it is prepared or for which prior written consent has first been obtained from AECOM. This study is qualified in its entirety by, and should be considered in light of the above limitations, conditions, and considerations.

Nexus and Fee Study Appendix Page 1
Appendix Table 1 Estimated Average Annual Household Expenditures by Sales Price
Assumed Base Price
Down Payment at 20%
Beginning Mortgage Principal
Monthly Mortgage Payment 1
Annual Taxes at 1.25% 2
Annual HOA + Insurance
Fees 3
Total Annual
Housing Costs
Required Household
Income 4
Percent of Spending
After Taxes and Savings 5
Spending Used to
Calculate Demand
$600,000 $120,000 $480,000 $2,577 $7,500 $6,000 $44,421 $148,070 65% 96,245$ $800,000 $160,000 $640,000 $3,436 $10,000 $6,000 $57,228 $190,760 58% 110,641$
$1,000,000 $200,000 $800,000 $4,295 $12,500 $6,000 $70,035 $233,450 51% 119,059$
1 Assumes 5% interest for 30 years, reflecting higher than current rates but well below historical averages.2 Tax rate allows for some specail assessments above 1.00% basic tax rate.3 Mammoth Lakes Housing Needs Assessement (2011) average for condominiums ($417/month), adjusted for inflation and rounded (2013). Some projects may include insurance costs in the HOA fees, while others may not. To be conservative, AECOM has assumed that the average HOA fee includes insurance.4 Assume housholds spend 30% of total household income on total annual housing costs.
Source: AECOM
Nexus and Fee Study Appendix Page 2
Appendix Table 1 Estimated Average Annual Household Expenditures and Associated Employment Generation $600,000 Per Unit
Expenditure Type/Industry
Percent of Income Spent per Category
(%) 1
Percent of Expenditure per
Type of Industry 2 2013 Expenditures 2007 Expenditures 3
2007 Expenditures
per 1,000 Households
Gross Receipts to Wages
2007 Total Wages
2007 Average Wages
Number of Workers
Percent Forming Households 4
Workers / Households 5
Total Worker Households
2007 Household Income
[a] [b] [c] = income x a x b [d] = c x CPI [e] = d x 1,000 [f] [g] = e/f [h] [i] =g/h [j] [k] [l] = i x (j/k) [m] = h x kFood at home 6.6 100% $6,352 $5,716
Food & Beverage Stores 100% $6,352 $5,716 $5,715,921 10.40 $549,857 $28,426 20.0 90.6% 1.59 11.4 $45,273
Food away from home 5.4 100% $5,197 $4,677 $4,676,663Food Services and Drinking Places 100% $5,197 $4,677 $4,676,663 3.13 $1,492,744 $13,621 110.0 90.6% 1.59 62.5 $21,695
Alcoholic beverages 1 100% $962 $866 $866,049Food & Beverage Stores 50% $481 $433 $433,024 10.40 $41,656 $28,426 2.0 90.6% 1.59 1.1 $45,273Food Services and Drinking Places 50% $481 $433 $433,024 3.13 $138,217 $13,621 11.0 98.5% 1.59 6.8 $21,695
Maintenance, repairs, insurance, other expenses 2.6 100% $2,502 $2,252 $2,251,727Personal and Household Goods Repair and Maintenance7 45% $1,126 $1,013 $1,013,277 3.72 $272,455 $26,783 11.0 98.5% 1.59 6.8 $42,657Building Material and Garden Equipment and Supplies Dealer 45% $1,126 $1,013 $1,013,277 8.09 $125,316 $22,214 6.0 98.5% 1.59 3.7 $35,380Real Estate and Rental and Leasing 10% $250 $225 $225,173 4.00 $56,337 $28,552 2.0 98.5% 1.59 1.2 $45,474
Fuel oil and other fuels 0.2 100% $192 $173 $173,210Nonstore Retailers 100% $192 $173 $173,210 13.72 $12,620 $29,840 1.0 98.5% 1.59 0.6 $47,526
Water and other public services6 0.8 100% $770 $693 $692,839Waste Management and Remediation Services7 100% $770 $693 $692,839 4.25 $162,875 $47,724 4.0 98.5% 1.59 2.5 $76,010
Household operations - Personal Services 1 100% $962 $866 $866,049Nursing and Residential Care Facilities7 40% $385 $346 $346,419 2.37 $146,320 $25,627 6.0 98.5% 1.59 3.7 $40,816Social Assistance7 60% $577 $520 $519,629 2.98 $174,168 $23,861 8.0 98.5% 1.59 4.9 $38,003
Household operations - Other Household Expenses 1.4 100% $1,347 $1,212 $1,212,468Services to Buildings and Dwellings 100% $1,347 $1,212 $1,212,468 3.43 $353,323 $18,933 19.0 98.5% 1.59 11.7 $30,154
Housekeeping supplies 1.1 100% $1,059 $953 $952,654Building Materials and Garden Equipment and Supplies Dealers 10% $106 $95 $95,265 8.09 $11,782 $22,214 1.0 98.5% 1.59 0.6 $35,380Food & Beverage Stores 35% $371 $333 $333,429 10.40 $32,075 $28,426 2.0 90.6% 1.59 1.1 $45,273General Merchandise7 35% $371 $333 $333,429 11.05 $30,181 $21,132 2.0 90.6% 1.59 1.1 $33,656Miscellaneous Store Retailers7 20% $212 $191 $190,531 7.16 $26,619 $19,488 2.0 98.5% 1.59 1.2 $31,038
Household furnishings and equipment 3.3 100% $3,176 $2,858 $2,857,961Furniture and Home Furnishings Stores 40% $1,270 $1,143 $1,143,184 7.33 $155,889 $20,800 8.0 98.5% 1.59 4.9 $33,128Electronics and Appliance Stores 40% $1,270 $1,143 $1,143,184 5.06 $225,930 $32,000 8.0 98.5% 1.59 4.9 $50,966General Merchandise Stores7 10% $318 $286 $285,796 11.05 $25,870 $21,132 2.0 90.6% 1.59 1.1 $33,656Miscellaneous Store Retailers7 10% $318 $286 $285,796 7.16 $39,928 $19,488 3.0 98.5% 1.59 1.9 $31,038
Apparel and services 3 100% $2,887 $2,598 $2,598,146Clothing and Clothing Accessories Stores 40% $1,155 $1,039 $1,039,258 9.13 $113,891 $14,905 8.0 90.6% 1.59 4.5 $23,739General Merchandise Stores7 40% $1,155 $1,039 $1,039,258 11.05 $94,071 $21,132 5.0 90.6% 1.59 2.8 $33,656Miscellaneous Store Retailers7 10% $289 $260 $259,815 7.16 $36,298 $19,488 2.0 98.5% 1.59 1.2 $31,038Personal and Household Goods Repair and Maintenance7 5% $144 $130 $129,907 3.72 $34,930 $26,783 2.0 98.5% 1.59 1.2 $42,657Dry Cleaning and Laundry Services7 5% $10 $9 $8,660 3.17 $2,736 $25,028 1.0 98.5% 1.59 0.6 $39,861
Vehicle purchases (net outlay) 7.2 100% $6,930 $6,236 $6,235,551Motor Vehicle and Parts Dealers7 100% $6,930 $6,236 $6,235,551 11.73 $531,381 $42,368 13.0 98.5% 1.59 8.0 $67,479
Gasoline and motor oil 4.5 100% $4,331 $3,897 $3,897,219Gasoline Stations 100% $4,331 $3,897 $3,897,219 18.78 $207,557 $27,500 8.0 90.6% 1.59 4.5 $43,799
Vehicle Maintenance and repairs 1.6 100% $1,540 $1,386 $1,385,678Repair and Maintenance 100% $1,540 $1,386 $1,385,678 4.07 $340,100 $34,154 10.0 98.5% 1.59 6.2 $54,396
Medical services 1.5 100% $1,444 $1,299 $1,299,073Ambulatory Health Care Services7 40% $577 $520 $519,629 2.67 $194,776 $51,890 4.0 98.5% 1.59 2.5 $82,644General Medical and Surgical Hospitals7 30% $433 $390 $389,722 2.63 $148,177 $58,054 3.0 98.5% 1.59 1.9 $92,462Nursing and Residential Care Facilities7 30% $433 $390 $389,722 2.37 $164,610 $25,627 7.0 98.5% 1.59 4.3 $40,816
Drugs 0.7 100% $674 $606 $606,234Health and Personal Care Stores7 100% $674 $606 $606,234 7.57 $80,057 $29,830 3.0 98.5% 1.59 1.9 $47,510
Medical supplies 0.3 100% $289 $260 $259,815Health and Personal Care Stores7 100% $289 $260 $259,815 7.57 $34,310 $29,830 2.0 98.5% 1.59 1.2 $47,510
Entertainment Fees and Admissions 1.5 100% $1,444 $1,299 $1,299,073Arts, Entertainment, & Recreation7 100% $1,444 $1,299 $1,299,073 3.07 $423,070 $39,299 11.0 90.6% 1.59 6.3 $62,590
Audio and Visual Equipment and Services 1.6 100% $1,540 $1,386 $1,385,678Electronics and Appliance Stores 100% $1,540 $1,386 $1,385,678 5.06 $273,855 $32,000 9.0 98.5% 1.59 5.6 $50,966
Pets, toys, hobbies, and playground equipment 0.9 100% $866 $779 $779,444
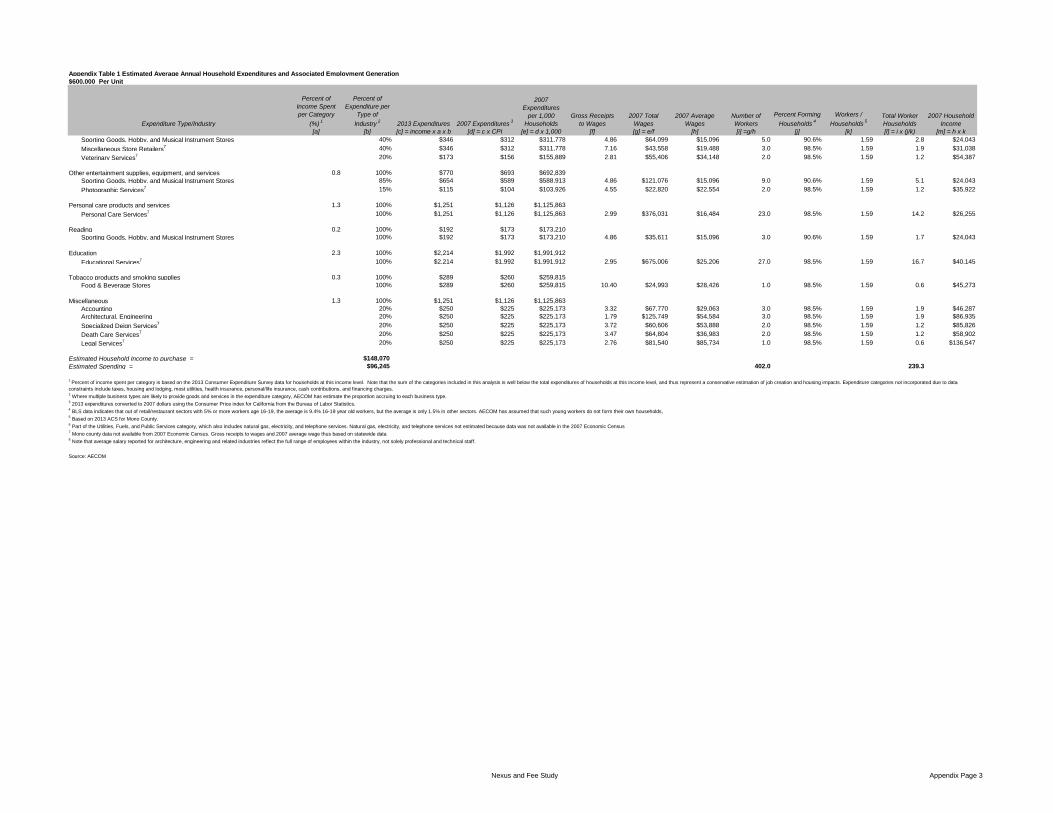
Nexus and Fee Study Appendix Page 3
Appendix Table 1 Estimated Average Annual Household Expenditures and Associated Employment Generation $600,000 Per Unit
Expenditure Type/Industry
Percent of Income Spent per Category
(%) 1
Percent of Expenditure per
Type of Industry 2 2013 Expenditures 2007 Expenditures 3
2007 Expenditures
per 1,000 Households
Gross Receipts to Wages
2007 Total Wages
2007 Average Wages
Number of Workers
Percent Forming Households 4
Workers / Households 5
Total Worker Households
2007 Household Income
[a] [b] [c] = income x a x b [d] = c x CPI [e] = d x 1,000 [f] [g] = e/f [h] [i] =g/h [j] [k] [l] = i x (j/k) [m] = h x kSporting Goods, Hobby, and Musical Instrument Stores 40% $346 $312 $311,778 4.86 $64,099 $15,096 5.0 90.6% 1.59 2.8 $24,043Miscellaneous Store Retailers7 40% $346 $312 $311,778 7.16 $43,558 $19,488 3.0 98.5% 1.59 1.9 $31,038Veterinary Services7 20% $173 $156 $155,889 2.81 $55,406 $34,148 2.0 98.5% 1.59 1.2 $54,387
Other entertainment supplies, equipment, and services 0.8 100% $770 $693 $692,839Sporting Goods, Hobby, and Musical Instrument Stores 85% $654 $589 $588,913 4.86 $121,076 $15,096 9.0 90.6% 1.59 5.1 $24,043Photographic Services7 15% $115 $104 $103,926 4.55 $22,820 $22,554 2.0 98.5% 1.59 1.2 $35,922
Personal care products and services 1.3 100% $1,251 $1,126 $1,125,863Personal Care Services7 100% $1,251 $1,126 $1,125,863 2.99 $376,031 $16,484 23.0 98.5% 1.59 14.2 $26,255
Reading 0.2 100% $192 $173 $173,210Sporting Goods, Hobby, and Musical Instrument Stores 100% $192 $173 $173,210 4.86 $35,611 $15,096 3.0 90.6% 1.59 1.7 $24,043
Education 2.3 100% $2,214 $1,992 $1,991,912Educational Services7 100% $2,214 $1,992 $1,991,912 2.95 $675,006 $25,206 27.0 98.5% 1.59 16.7 $40,145
Tobacco products and smoking supplies 0.3 100% $289 $260 $259,815Food & Beverage Stores 100% $289 $260 $259,815 10.40 $24,993 $28,426 1.0 98.5% 1.59 0.6 $45,273
Miscellaneous 1.3 100% $1,251 $1,126 $1,125,863Accounting 20% $250 $225 $225,173 3.32 $67,770 $29,063 3.0 98.5% 1.59 1.9 $46,287Architectural, Engineering 20% $250 $225 $225,173 1.79 $125,749 $54,584 3.0 98.5% 1.59 1.9 $86,935Specialized Deign Services7 20% $250 $225 $225,173 3.72 $60,606 $53,888 2.0 98.5% 1.59 1.2 $85,826Death Care Services7 20% $250 $225 $225,173 3.47 $64,804 $36,983 2.0 98.5% 1.59 1.2 $58,902Legal Services7 20% $250 $225 $225,173 2.76 $81,540 $85,734 1.0 98.5% 1.59 0.6 $136,547
Estimated Household Income to purchase = $148,070Estimated Spending = $96,245 402.0 239.3
Source: AECOM
1 Percent of income spent per category is based on the 2013 Consumer Expenditure Survey data for households at this income level. Note that the sum of the categories included in this analysis is well below the total expenditures of households at this income level, and thus represent a conservative estimation of job creation and housing impacts. Expenditure categories not incorporated due to data constraints include taxes, housing and lodging, most utilities, health insurance, personal/life insurance, cash contributions, and financing charges.2 Where multiple business types are likely to provide goods and services in the expenditure category, AECOM has estimate the proportion accruing to each business type.3 2013 expenditures converted to 2007 dollars using the Consumer Price index for California from the Bureau of Labor Statistics.4 BLS data indicates that out of retail/restaurant sectors with 5% or more workers age 16-19, the average is 9.4% 16-19 year old workers, but the average is only 1.5% in other sectors. AECOM has assumed that such young workers do not form their own households,5 Based on 2013 ACS for Mono County.6 Part of the Utilities, Fuels, and Public Services category, which also includes natural gas, electricity, and telephone services. Natural gas, electricity, and telephone services not estimated because data was not available in the 2007 Economic Census7 Mono county data not available from 2007 Economic Census. Gross receipts to wages and 2007 average wage thus based on statewide data8 Note that average salary reported for architecture, engineering and related industries reflect the full range of employees within the industry, not solely professional and technical staff.
Nexus and Fee Study Appendix Page 4
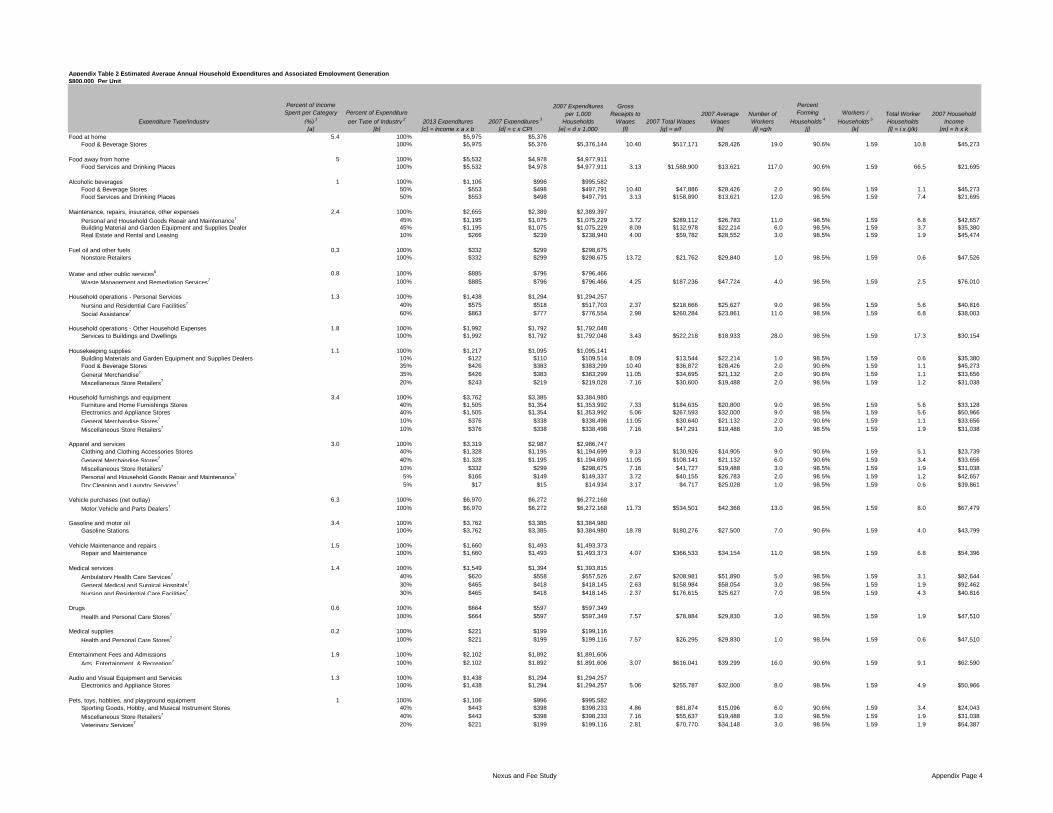
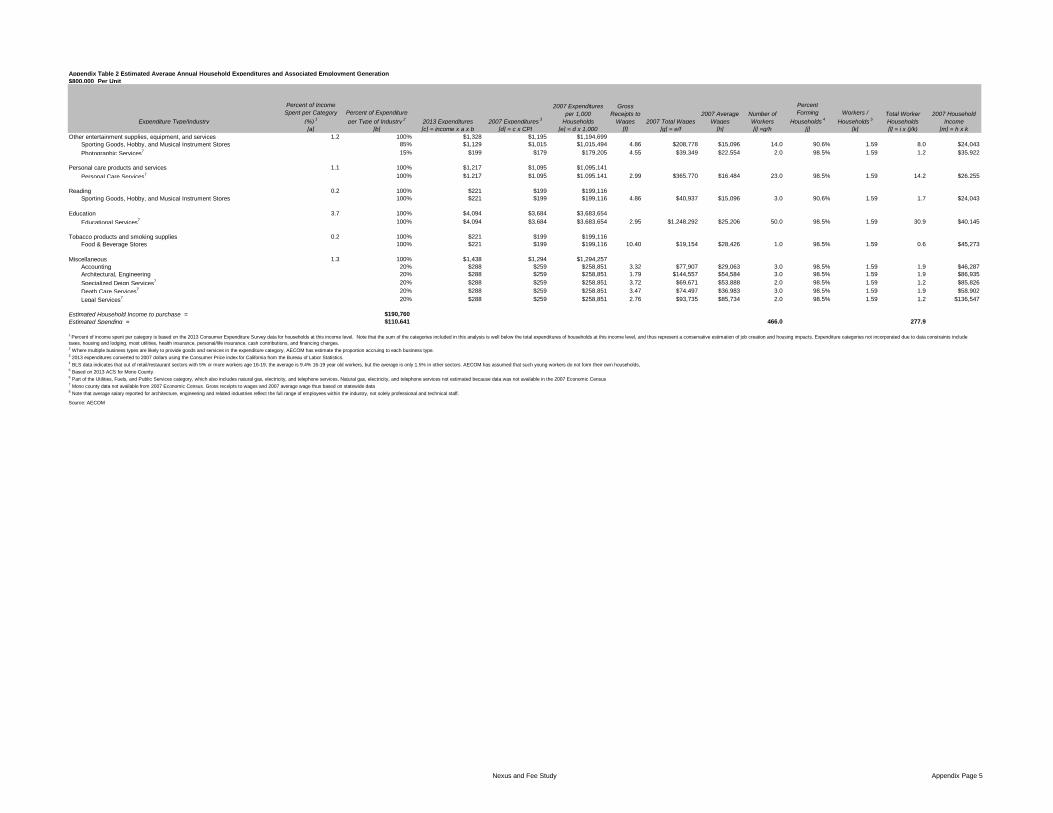
Appendix Table 2 Estimated Average Annual Household Expenditures and Associated Employment Generation $800,000 Per Unit
Expenditure Type/Industry
Percent of Income Spent per Category
(%) 1Percent of Expenditure per Type of Industry 2 2013 Expenditures 2007 Expenditures 3
2007 Expenditures per 1,000
Households
Gross Receipts to
Wages 2007 Total Wages2007 Average
WagesNumber of Workers
Percent Forming
Households 4Workers /
Households 5Total Worker Households
2007 Household Income
[a] [b] [c] = income x a x b [d] = c x CPI [e] = d x 1,000 [f] [g] = e/f [h] [i] =g/h [j] [k] [l] = i x (j/k) [m] = h x kFood at home 5.4 100% $5,975 $5,376
Food & Beverage Stores 100% $5,975 $5,376 $5,376,144 10.40 $517,171 $28,426 19.0 90.6% 1.59 10.8 $45,273
Food away from home 5 100% $5,532 $4,978 $4,977,911Food Services and Drinking Places 100% $5,532 $4,978 $4,977,911 3.13 $1,588,900 $13,621 117.0 90.6% 1.59 66.5 $21,695
Alcoholic beverages 1 100% $1,106 $996 $995,582Food & Beverage Stores 50% $553 $498 $497,791 10.40 $47,886 $28,426 2.0 90.6% 1.59 1.1 $45,273Food Services and Drinking Places 50% $553 $498 $497,791 3.13 $158,890 $13,621 12.0 98.5% 1.59 7.4 $21,695
Maintenance, repairs, insurance, other expenses 2.4 100% $2,655 $2,389 $2,389,397Personal and Household Goods Repair and Maintenance7 45% $1,195 $1,075 $1,075,229 3.72 $289,112 $26,783 11.0 98.5% 1.59 6.8 $42,657Building Material and Garden Equipment and Supplies Dealer 45% $1,195 $1,075 $1,075,229 8.09 $132,978 $22,214 6.0 98.5% 1.59 3.7 $35,380Real Estate and Rental and Leasing 10% $266 $239 $238,940 4.00 $59,782 $28,552 3.0 98.5% 1.59 1.9 $45,474
Fuel oil and other fuels 0.3 100% $332 $299 $298,675Nonstore Retailers 100% $332 $299 $298,675 13.72 $21,762 $29,840 1.0 98.5% 1.59 0.6 $47,526
Water and other public services6 0.8 100% $885 $796 $796,466Waste Management and Remediation Services7 100% $885 $796 $796,466 4.25 $187,236 $47,724 4.0 98.5% 1.59 2.5 $76,010
Household operations - Personal Services 1.3 100% $1,438 $1,294 $1,294,257Nursing and Residential Care Facilities7 40% $575 $518 $517,703 2.37 $218,666 $25,627 9.0 98.5% 1.59 5.6 $40,816Social Assistance7 60% $863 $777 $776,554 2.98 $260,284 $23,861 11.0 98.5% 1.59 6.8 $38,003
Household operations - Other Household Expenses 1.8 100% $1,992 $1,792 $1,792,048Services to Buildings and Dwellings 100% $1,992 $1,792 $1,792,048 3.43 $522,218 $18,933 28.0 98.5% 1.59 17.3 $30,154
Housekeeping supplies 1.1 100% $1,217 $1,095 $1,095,141Building Materials and Garden Equipment and Supplies Dealers 10% $122 $110 $109,514 8.09 $13,544 $22,214 1.0 98.5% 1.59 0.6 $35,380Food & Beverage Stores 35% $426 $383 $383,299 10.40 $36,872 $28,426 2.0 90.6% 1.59 1.1 $45,273General Merchandise7 35% $426 $383 $383,299 11.05 $34,695 $21,132 2.0 90.6% 1.59 1.1 $33,656Miscellaneous Store Retailers7 20% $243 $219 $219,028 7.16 $30,600 $19,488 2.0 98.5% 1.59 1.2 $31,038
Household furnishings and equipment 3.4 100% $3,762 $3,385 $3,384,980Furniture and Home Furnishings Stores 40% $1,505 $1,354 $1,353,992 7.33 $184,635 $20,800 9.0 98.5% 1.59 5.6 $33,128Electronics and Appliance Stores 40% $1,505 $1,354 $1,353,992 5.06 $267,593 $32,000 9.0 98.5% 1.59 5.6 $50,966General Merchandise Stores7 10% $376 $338 $338,498 11.05 $30,640 $21,132 2.0 90.6% 1.59 1.1 $33,656Miscellaneous Store Retailers7 10% $376 $338 $338,498 7.16 $47,291 $19,488 3.0 98.5% 1.59 1.9 $31,038
Apparel and services 3.0 100% $3,319 $2,987 $2,986,747Clothing and Clothing Accessories Stores 40% $1,328 $1,195 $1,194,699 9.13 $130,926 $14,905 9.0 90.6% 1.59 5.1 $23,739General Merchandise Stores7 40% $1,328 $1,195 $1,194,699 11.05 $108,141 $21,132 6.0 90.6% 1.59 3.4 $33,656Miscellaneous Store Retailers7 10% $332 $299 $298,675 7.16 $41,727 $19,488 3.0 98.5% 1.59 1.9 $31,038Personal and Household Goods Repair and Maintenance7 5% $166 $149 $149,337 3.72 $40,155 $26,783 2.0 98.5% 1.59 1.2 $42,657Dry Cleaning and Laundry Services7 5% $17 $15 $14,934 3.17 $4,717 $25,028 1.0 98.5% 1.59 0.6 $39,861
Vehicle purchases (net outlay) 6.3 100% $6,970 $6,272 $6,272,168Motor Vehicle and Parts Dealers7 100% $6,970 $6,272 $6,272,168 11.73 $534,501 $42,368 13.0 98.5% 1.59 8.0 $67,479
Gasoline and motor oil 3.4 100% $3,762 $3,385 $3,384,980Gasoline Stations 100% $3,762 $3,385 $3,384,980 18.78 $180,276 $27,500 7.0 90.6% 1.59 4.0 $43,799
Vehicle Maintenance and repairs 1.5 100% $1,660 $1,493 $1,493,373Repair and Maintenance 100% $1,660 $1,493 $1,493,373 4.07 $366,533 $34,154 11.0 98.5% 1.59 6.8 $54,396
Medical services 1.4 100% $1,549 $1,394 $1,393,815Ambulatory Health Care Services7 40% $620 $558 $557,526 2.67 $208,981 $51,890 5.0 98.5% 1.59 3.1 $82,644General Medical and Surgical Hospitals7 30% $465 $418 $418,145 2.63 $158,984 $58,054 3.0 98.5% 1.59 1.9 $92,462Nursing and Residential Care Facilities7 30% $465 $418 $418,145 2.37 $176,615 $25,627 7.0 98.5% 1.59 4.3 $40,816
Drugs 0.6 100% $664 $597 $597,349Health and Personal Care Stores7 100% $664 $597 $597,349 7.57 $78,884 $29,830 3.0 98.5% 1.59 1.9 $47,510
Medical supplies 0.2 100% $221 $199 $199,116Health and Personal Care Stores7 100% $221 $199 $199,116 7.57 $26,295 $29,830 1.0 98.5% 1.59 0.6 $47,510
Entertainment Fees and Admissions 1.9 100% $2,102 $1,892 $1,891,606Arts, Entertainment, & Recreation7 100% $2,102 $1,892 $1,891,606 3.07 $616,041 $39,299 16.0 90.6% 1.59 9.1 $62,590
Audio and Visual Equipment and Services 1.3 100% $1,438 $1,294 $1,294,257Electronics and Appliance Stores 100% $1,438 $1,294 $1,294,257 5.06 $255,787 $32,000 8.0 98.5% 1.59 4.9 $50,966
Pets, toys, hobbies, and playground equipment 1 100% $1,106 $996 $995,582Sporting Goods, Hobby, and Musical Instrument Stores 40% $443 $398 $398,233 4.86 $81,874 $15,096 6.0 90.6% 1.59 3.4 $24,043Miscellaneous Store Retailers7 40% $443 $398 $398,233 7.16 $55,637 $19,488 3.0 98.5% 1.59 1.9 $31,038Veterinary Services7 20% $221 $199 $199,116 2.81 $70,770 $34,148 3.0 98.5% 1.59 1.9 $54,387
Nexus and Fee Study Appendix Page 5
Appendix Table 2 Estimated Average Annual Household Expenditures and Associated Employment Generation $800,000 Per Unit
Expenditure Type/Industry
Percent of Income Spent per Category
(%) 1Percent of Expenditure per Type of Industry 2 2013 Expenditures 2007 Expenditures 3
2007 Expenditures per 1,000
Households
Gross Receipts to
Wages 2007 Total Wages2007 Average
WagesNumber of Workers
Percent Forming
Households 4Workers /
Households 5Total Worker Households
2007 Household Income
[a] [b] [c] = income x a x b [d] = c x CPI [e] = d x 1,000 [f] [g] = e/f [h] [i] =g/h [j] [k] [l] = i x (j/k) [m] = h x kOther entertainment supplies, equipment, and services 1.2 100% $1,328 $1,195 $1,194,699
Sporting Goods, Hobby, and Musical Instrument Stores 85% $1,129 $1,015 $1,015,494 4.86 $208,778 $15,096 14.0 90.6% 1.59 8.0 $24,043Photographic Services7 15% $199 $179 $179,205 4.55 $39,349 $22,554 2.0 98.5% 1.59 1.2 $35,922
Personal care products and services 1.1 100% $1,217 $1,095 $1,095,141Personal Care Services7 100% $1,217 $1,095 $1,095,141 2.99 $365,770 $16,484 23.0 98.5% 1.59 14.2 $26,255
Reading 0.2 100% $221 $199 $199,116Sporting Goods, Hobby, and Musical Instrument Stores 100% $221 $199 $199,116 4.86 $40,937 $15,096 3.0 90.6% 1.59 1.7 $24,043
Education 3.7 100% $4,094 $3,684 $3,683,654Educational Services7 100% $4,094 $3,684 $3,683,654 2.95 $1,248,292 $25,206 50.0 98.5% 1.59 30.9 $40,145
Tobacco products and smoking supplies 0.2 100% $221 $199 $199,116Food & Beverage Stores 100% $221 $199 $199,116 10.40 $19,154 $28,426 1.0 98.5% 1.59 0.6 $45,273
Miscellaneous 1.3 100% $1,438 $1,294 $1,294,257Accounting 20% $288 $259 $258,851 3.32 $77,907 $29,063 3.0 98.5% 1.59 1.9 $46,287Architectural, Engineering 20% $288 $259 $258,851 1.79 $144,557 $54,584 3.0 98.5% 1.59 1.9 $86,935Specialized Deign Services7 20% $288 $259 $258,851 3.72 $69,671 $53,888 2.0 98.5% 1.59 1.2 $85,826Death Care Services7 20% $288 $259 $258,851 3.47 $74,497 $36,983 3.0 98.5% 1.59 1.9 $58,902Legal Services7 20% $288 $259 $258,851 2.76 $93,735 $85,734 2.0 98.5% 1.59 1.2 $136,547
Estimated Household Income to purchase = $190,760Estimated Spending = $110,641 466.0 277.9
Source: AECOM
1 Percent of income spent per category is based on the 2013 Consumer Expenditure Survey data for households at this income level. Note that the sum of the categories included in this analysis is well below the total expenditures of households at this income level, and thus represent a conservative estimation of job creation and housing impacts. Expenditure categories not incorporated due to data constraints include taxes, housing and lodging, most utilities, health insurance, personal/life insurance, cash contributions, and financing charges.2 Where multiple business types are likely to provide goods and services in the expenditure category, AECOM has estimate the proportion accruing to each business type.3 2013 expenditures converted to 2007 dollars using the Consumer Price index for California from the Bureau of Labor Statistics.4 BLS data indicates that out of retail/restaurant sectors with 5% or more workers age 16-19, the average is 9.4% 16-19 year old workers, but the average is only 1.5% in other sectors. AECOM has assumed that such young workers do not form their own households,5 Based on 2013 ACS for Mono County.6 Part of the Utilities, Fuels, and Public Services category, which also includes natural gas, electricity, and telephone services. Natural gas, electricity, and telephone services not estimated because data was not available in the 2007 Economic Census7 Mono county data not available from 2007 Economic Census. Gross receipts to wages and 2007 average wage thus based on statewide data8 Note that average salary reported for architecture, engineering and related industries reflect the full range of employees within the industry, not solely professional and technical staff.
Nexus and Fee Study Appendix Page 6
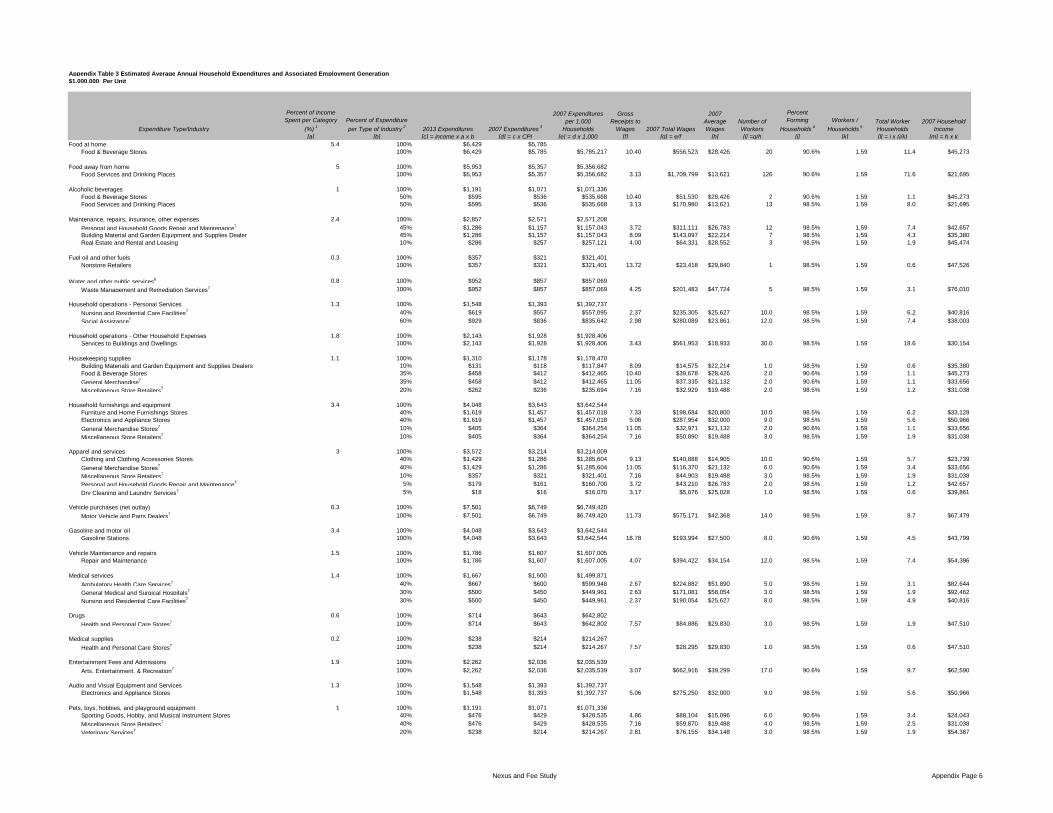
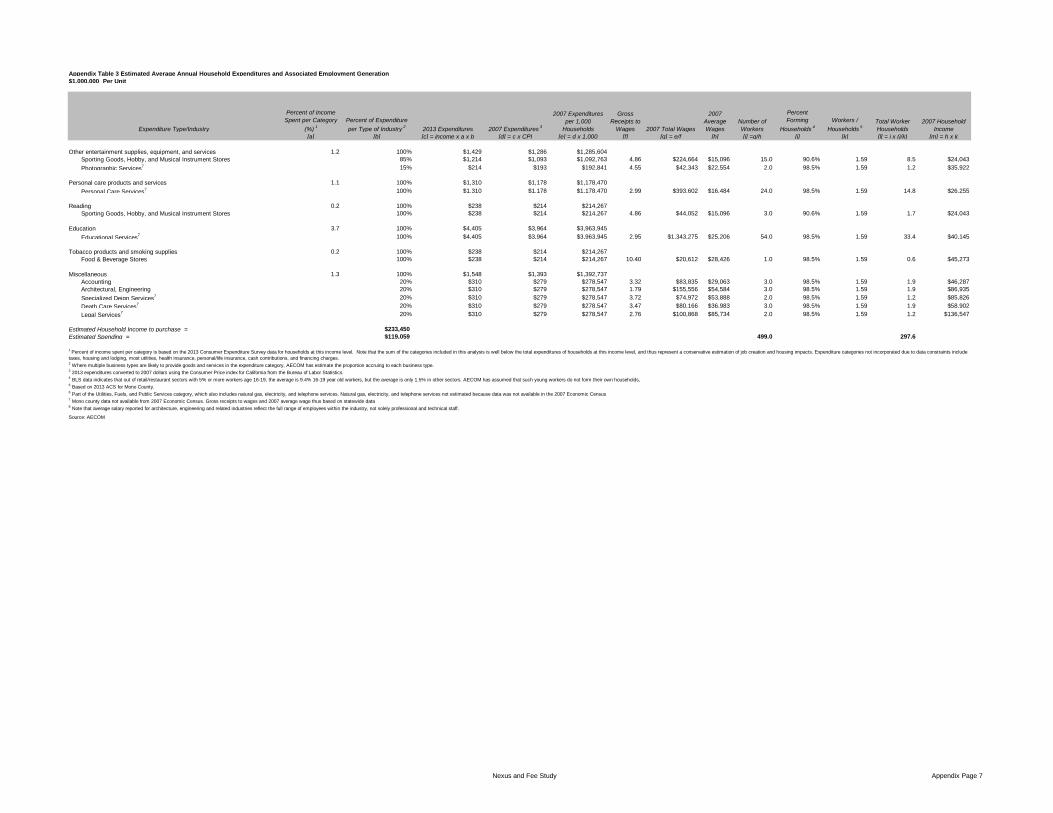
Appendix Table 3 Estimated Average Annual Household Expenditures and Associated Employment Generation $1,000,000 Per Unit
Expenditure Type/Industry
Percent of Income Spent per Category
(%) 1Percent of Expenditure per Type of Industry 2 2013 Expenditures 2007 Expenditures 3
2007 Expenditures per 1,000
Households
Gross Receipts to
Wages 2007 Total Wages
2007 Average Wages
Number of Workers
Percent Forming
Households 4Workers /
Households 5Total Worker Households
2007 Household Income
[a] [b] [c] = income x a x b [d] = c x CPI [e] = d x 1,000 [f] [g] = e/f [h] [i] =g/h [j] [k] [l] = i x (j/k) [m] = h x kFood at home 5.4 100% $6,429 $5,785
Food & Beverage Stores 100% $6,429 $5,785 $5,785,217 10.40 $556,523 $28,426 20 90.6% 1.59 11.4 $45,273
Food away from home 5 100% $5,953 $5,357 $5,356,682Food Services and Drinking Places 100% $5,953 $5,357 $5,356,682 3.13 $1,709,799 $13,621 126 90.6% 1.59 71.6 $21,695
Alcoholic beverages 1 100% $1,191 $1,071 $1,071,336Food & Beverage Stores 50% $595 $536 $535,668 10.40 $51,530 $28,426 2 90.6% 1.59 1.1 $45,273Food Services and Drinking Places 50% $595 $536 $535,668 3.13 $170,980 $13,621 13 98.5% 1.59 8.0 $21,695
Maintenance, repairs, insurance, other expenses 2.4 100% $2,857 $2,571 $2,571,208Personal and Household Goods Repair and Maintenance7 45% $1,286 $1,157 $1,157,043 3.72 $311,111 $26,783 12 98.5% 1.59 7.4 $42,657Building Material and Garden Equipment and Supplies Dealer 45% $1,286 $1,157 $1,157,043 8.09 $143,097 $22,214 7 98.5% 1.59 4.3 $35,380Real Estate and Rental and Leasing 10% $286 $257 $257,121 4.00 $64,331 $28,552 3 98.5% 1.59 1.9 $45,474
Fuel oil and other fuels 0.3 100% $357 $321 $321,401Nonstore Retailers 100% $357 $321 $321,401 13.72 $23,418 $29,840 1 98.5% 1.59 0.6 $47,526
Water and other public services6 0.8 100% $952 $857 $857,069Waste Management and Remediation Services7 100% $952 $857 $857,069 4.25 $201,483 $47,724 5 98.5% 1.59 3.1 $76,010
Household operations - Personal Services 1.3 100% $1,548 $1,393 $1,392,737Nursing and Residential Care Facilities7 40% $619 $557 $557,095 2.37 $235,305 $25,627 10.0 98.5% 1.59 6.2 $40,816Social Assistance7 60% $929 $836 $835,642 2.98 $280,089 $23,861 12.0 98.5% 1.59 7.4 $38,003
Household operations - Other Household Expenses 1.8 100% $2,143 $1,928 $1,928,406Services to Buildings and Dwellings 100% $2,143 $1,928 $1,928,406 3.43 $561,953 $18,933 30.0 98.5% 1.59 18.6 $30,154
Housekeeping supplies 1.1 100% $1,310 $1,178 $1,178,470Building Materials and Garden Equipment and Supplies Dealers 10% $131 $118 $117,847 8.09 $14,575 $22,214 1.0 98.5% 1.59 0.6 $35,380Food & Beverage Stores 35% $458 $412 $412,465 10.40 $39,678 $28,426 2.0 90.6% 1.59 1.1 $45,273General Merchandise7 35% $458 $412 $412,465 11.05 $37,335 $21,132 2.0 90.6% 1.59 1.1 $33,656Miscellaneous Store Retailers7 20% $262 $236 $235,694 7.16 $32,929 $19,488 2.0 98.5% 1.59 1.2 $31,038
Household furnishings and equipment 3.4 100% $4,048 $3,643 $3,642,544Furniture and Home Furnishings Stores 40% $1,619 $1,457 $1,457,018 7.33 $198,684 $20,800 10.0 98.5% 1.59 6.2 $33,128Electronics and Appliance Stores 40% $1,619 $1,457 $1,457,018 5.06 $287,954 $32,000 9.0 98.5% 1.59 5.6 $50,966General Merchandise Stores7 10% $405 $364 $364,254 11.05 $32,971 $21,132 2.0 90.6% 1.59 1.1 $33,656Miscellaneous Store Retailers7 10% $405 $364 $364,254 7.16 $50,890 $19,488 3.0 98.5% 1.59 1.9 $31,038
Apparel and services 3 100% $3,572 $3,214 $3,214,009Clothing and Clothing Accessories Stores 40% $1,429 $1,286 $1,285,604 9.13 $140,888 $14,905 10.0 90.6% 1.59 5.7 $23,739General Merchandise Stores7 40% $1,429 $1,286 $1,285,604 11.05 $116,370 $21,132 6.0 90.6% 1.59 3.4 $33,656Miscellaneous Store Retailers7 10% $357 $321 $321,401 7.16 $44,903 $19,488 3.0 98.5% 1.59 1.9 $31,038Personal and Household Goods Repair and Maintenance7 5% $179 $161 $160,700 3.72 $43,210 $26,783 2.0 98.5% 1.59 1.2 $42,657Dry Cleaning and Laundry Services7 5% $18 $16 $16,070 3.17 $5,076 $25,028 1.0 98.5% 1.59 0.6 $39,861
Vehicle purchases (net outlay) 6.3 100% $7,501 $6,749 $6,749,420Motor Vehicle and Parts Dealers7 100% $7,501 $6,749 $6,749,420 11.73 $575,171 $42,368 14.0 98.5% 1.59 8.7 $67,479
Gasoline and motor oil 3.4 100% $4,048 $3,643 $3,642,544Gasoline Stations 100% $4,048 $3,643 $3,642,544 18.78 $193,994 $27,500 8.0 90.6% 1.59 4.5 $43,799
Vehicle Maintenance and repairs 1.5 100% $1,786 $1,607 $1,607,005Repair and Maintenance 100% $1,786 $1,607 $1,607,005 4.07 $394,422 $34,154 12.0 98.5% 1.59 7.4 $54,396
Medical services 1.4 100% $1,667 $1,500 $1,499,871Ambulatory Health Care Services7 40% $667 $600 $599,948 2.67 $224,882 $51,890 5.0 98.5% 1.59 3.1 $82,644General Medical and Surgical Hospitals7 30% $500 $450 $449,961 2.63 $171,081 $58,054 3.0 98.5% 1.59 1.9 $92,462Nursing and Residential Care Facilities7 30% $500 $450 $449,961 2.37 $190,054 $25,627 8.0 98.5% 1.59 4.9 $40,816
Drugs 0.6 100% $714 $643 $642,802Health and Personal Care Stores7 100% $714 $643 $642,802 7.57 $84,886 $29,830 3.0 98.5% 1.59 1.9 $47,510
Medical supplies 0.2 100% $238 $214 $214,267Health and Personal Care Stores7 100% $238 $214 $214,267 7.57 $28,295 $29,830 1.0 98.5% 1.59 0.6 $47,510
Entertainment Fees and Admissions 1.9 100% $2,262 $2,036 $2,035,539Arts, Entertainment, & Recreation7 100% $2,262 $2,036 $2,035,539 3.07 $662,916 $39,299 17.0 90.6% 1.59 9.7 $62,590
Audio and Visual Equipment and Services 1.3 100% $1,548 $1,393 $1,392,737Electronics and Appliance Stores 100% $1,548 $1,393 $1,392,737 5.06 $275,250 $32,000 9.0 98.5% 1.59 5.6 $50,966
Pets, toys, hobbies, and playground equipment 1 100% $1,191 $1,071 $1,071,336Sporting Goods, Hobby, and Musical Instrument Stores 40% $476 $429 $428,535 4.86 $88,104 $15,096 6.0 90.6% 1.59 3.4 $24,043Miscellaneous Store Retailers7 40% $476 $429 $428,535 7.16 $59,870 $19,488 4.0 98.5% 1.59 2.5 $31,038Veterinary Services7 20% $238 $214 $214,267 2.81 $76,155 $34,148 3.0 98.5% 1.59 1.9 $54,387
Nexus and Fee Study Appendix Page 7
Appendix Table 3 Estimated Average Annual Household Expenditures and Associated Employment Generation $1,000,000 Per Unit
Expenditure Type/Industry
Percent of Income Spent per Category
(%) 1Percent of Expenditure per Type of Industry 2 2013 Expenditures 2007 Expenditures 3
2007 Expenditures per 1,000
Households
Gross Receipts to
Wages 2007 Total Wages
2007 Average Wages
Number of Workers
Percent Forming
Households 4Workers /
Households 5Total Worker Households
2007 Household Income
[a] [b] [c] = income x a x b [d] = c x CPI [e] = d x 1,000 [f] [g] = e/f [h] [i] =g/h [j] [k] [l] = i x (j/k) [m] = h x k
Other entertainment supplies, equipment, and services 1.2 100% $1,429 $1,286 $1,285,604Sporting Goods, Hobby, and Musical Instrument Stores 85% $1,214 $1,093 $1,092,763 4.86 $224,664 $15,096 15.0 90.6% 1.59 8.5 $24,043Photographic Services7 15% $214 $193 $192,841 4.55 $42,343 $22,554 2.0 98.5% 1.59 1.2 $35,922
Personal care products and services 1.1 100% $1,310 $1,178 $1,178,470Personal Care Services7 100% $1,310 $1,178 $1,178,470 2.99 $393,602 $16,484 24.0 98.5% 1.59 14.8 $26,255
Reading 0.2 100% $238 $214 $214,267Sporting Goods, Hobby, and Musical Instrument Stores 100% $238 $214 $214,267 4.86 $44,052 $15,096 3.0 90.6% 1.59 1.7 $24,043
Education 3.7 100% $4,405 $3,964 $3,963,945Educational Services7 100% $4,405 $3,964 $3,963,945 2.95 $1,343,275 $25,206 54.0 98.5% 1.59 33.4 $40,145
Tobacco products and smoking supplies 0.2 100% $238 $214 $214,267Food & Beverage Stores 100% $238 $214 $214,267 10.40 $20,612 $28,426 1.0 98.5% 1.59 0.6 $45,273
Miscellaneous 1.3 100% $1,548 $1,393 $1,392,737Accounting 20% $310 $279 $278,547 3.32 $83,835 $29,063 3.0 98.5% 1.59 1.9 $46,287Architectural, Engineering 20% $310 $279 $278,547 1.79 $155,556 $54,584 3.0 98.5% 1.59 1.9 $86,935Specialized Deign Services7 20% $310 $279 $278,547 3.72 $74,972 $53,888 2.0 98.5% 1.59 1.2 $85,826Death Care Services7 20% $310 $279 $278,547 3.47 $80,166 $36,983 3.0 98.5% 1.59 1.9 $58,902Legal Services7 20% $310 $279 $278,547 2.76 $100,868 $85,734 2.0 98.5% 1.59 1.2 $136,547
Estimated Household Income to purchase = $233,450Estimated Spending = $119,059 499.0 297.6
Source: AECOM
1 Percent of income spent per category is based on the 2013 Consumer Expenditure Survey data for households at this income level. Note that the sum of the categories included in this analysis is well below the total expenditures of households at this income level, and thus represent a conservative estimation of job creation and housing impacts. Expenditure categories not incorporated due to data constraints include taxes, housing and lodging, most utilities, health insurance, personal/life insurance, cash contributions, and financing charges.2 Where multiple business types are likely to provide goods and services in the expenditure category, AECOM has estimate the proportion accruing to each business type.3 2013 expenditures converted to 2007 dollars using the Consumer Price index for California from the Bureau of Labor Statistics.4 BLS data indicates that out of retail/restaurant sectors with 5% or more workers age 16-19, the average is 9.4% 16-19 year old workers, but the average is only 1.5% in other sectors. AECOM has assumed that such young workers do not form their own households,5 Based on 2013 ACS for Mono County.6 Part of the Utilities, Fuels, and Public Services category, which also includes natural gas, electricity, and telephone services. Natural gas, electricity, and telephone services not estimated because data was not available in the 2007 Economic Census7 Mono county data not available from 2007 Economic Census. Gross receipts to wages and 2007 average wage thus based on statewide data8 Note that average salary reported for architecture, engineering and related industries reflect the full range of employees within the industry, not solely professional and technical staff.
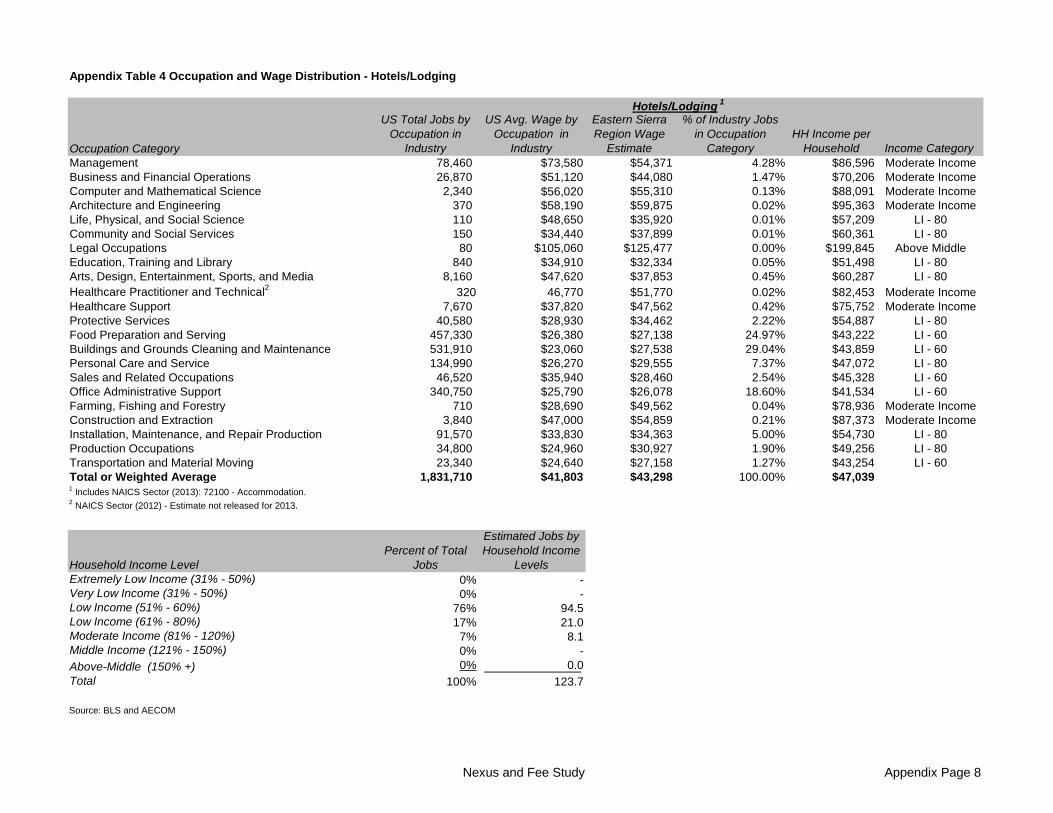
Nexus and Fee Study Appendix Page 8
US Total Jobs by Occupation in
Industry
US Avg. Wage by Occupation in
Industry
Eastern Sierra Region Wage
Estimate
% of Industry Jobs in Occupation
CategoryHH Income per
Household Income CategoryManagement 78,460 $73,580 $54,371 4.28% $86,596 Moderate IncomeBusiness and Financial Operations 26,870 $51,120 $44,080 1.47% $70,206 Moderate IncomeComputer and Mathematical Science 2,340 $56,020 $55,310 0.13% $88,091 Moderate IncomeArchitecture and Engineering 370 $58,190 $59,875 0.02% $95,363 Moderate IncomeLife, Physical, and Social Science 110 $48,650 $35,920 0.01% $57,209 LI - 80Community and Social Services 150 $34,440 $37,899 0.01% $60,361 LI - 80Legal Occupations 80 $105,060 $125,477 0.00% $199,845 Above MiddleEducation, Training and Library 840 $34,910 $32,334 0.05% $51,498 LI - 80Arts, Design, Entertainment, Sports, and Media 8,160 $47,620 $37,853 0.45% $60,287 LI - 80Healthcare Practitioner and Technical2 320 46,770 $51,770 0.02% $82,453 Moderate IncomeHealthcare Support 7,670 $37,820 $47,562 0.42% $75,752 Moderate IncomeProtective Services 40,580 $28,930 $34,462 2.22% $54,887 LI - 80Food Preparation and Serving 457,330 $26,380 $27,138 24.97% $43,222 LI - 60Buildings and Grounds Cleaning and Maintenance 531,910 $23,060 $27,538 29.04% $43,859 LI - 60Personal Care and Service 134,990 $26,270 $29,555 7.37% $47,072 LI - 80Sales and Related Occupations 46,520 $35,940 $28,460 2.54% $45,328 LI - 60Office Administrative Support 340,750 $25,790 $26,078 18.60% $41,534 LI - 60Farming, Fishing and Forestry 710 $28,690 $49,562 0.04% $78,936 Moderate IncomeConstruction and Extraction 3,840 $47,000 $54,859 0.21% $87,373 Moderate IncomeInstallation, Maintenance, and Repair Production 91,570 $33,830 $34,363 5.00% $54,730 LI - 80Production Occupations 34,800 $24,960 $30,927 1.90% $49,256 LI - 80Transportation and Material Moving 23,340 $24,640 $27,158 1.27% $43,254 LI - 60Total or Weighted Average 1,831,710 $41,803 $43,298 100.00% $47,039
Household Income LevelPercent of Total
Jobs
Estimated Jobs by Household Income
LevelsExtremely Low Income (31% - 50%) 0% - Very Low Income (31% - 50%) 0% - Low Income (51% - 60%) 76% 94.5 Low Income (61% - 80%) 17% 21.0 Moderate Income (81% - 120%) 7% 8.1 Middle Income (121% - 150%) 0% - Above-Middle (150% +) 0% 0.0 Total 100% 123.7
Source: BLS and AECOM
Hotels/Lodging 1
1 Includes NAICS Sector (2013): 72100 - Accommodation.2 NAICS Sector (2012) - Estimate not released for 2013.
Appendix Table 4 Occupation and Wage Distribution - Hotels/Lodging
Occupation Category
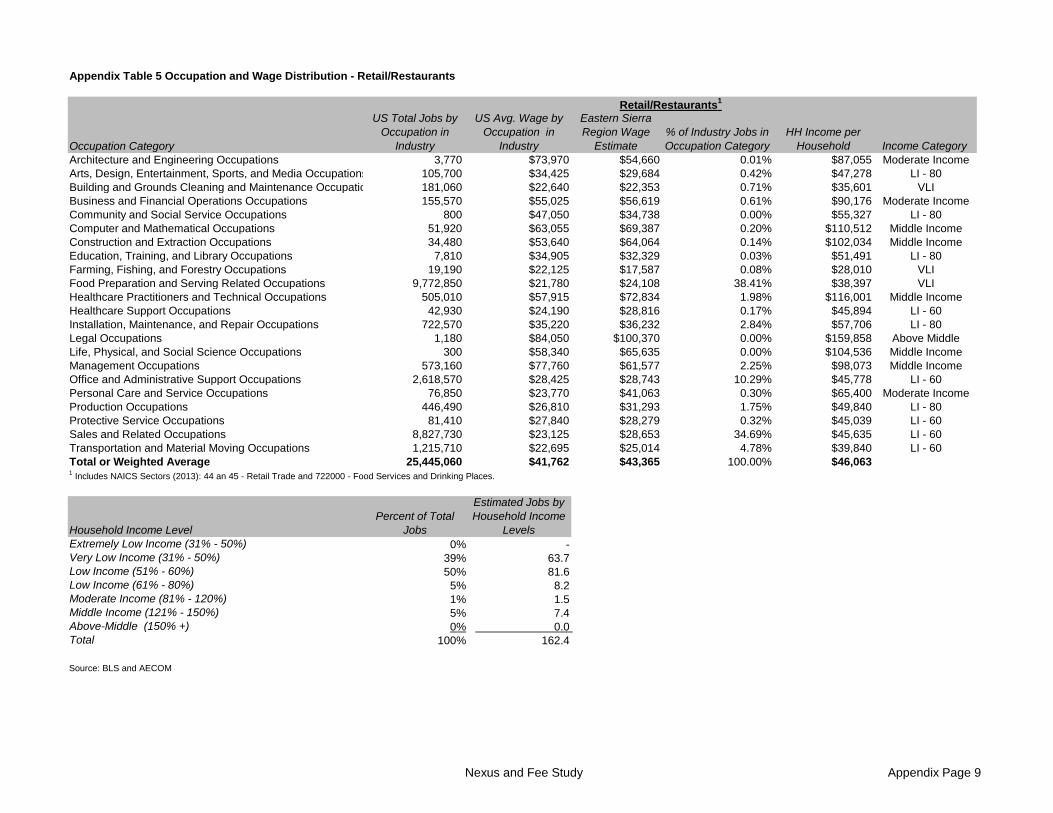
Nexus and Fee Study Appendix Page 9
US Total Jobs by Occupation in
Industry
US Avg. Wage by Occupation in
Industry
Eastern Sierra Region Wage
Estimate% of Industry Jobs in Occupation Category
HH Income per Household Income Category
Architecture and Engineering Occupations 3,770 $73,970 $54,660 0.01% $87,055 Moderate IncomeArts, Design, Entertainment, Sports, and Media Occupations 105,700 $34,425 $29,684 0.42% $47,278 LI - 80Building and Grounds Cleaning and Maintenance Occupatio 181,060 $22,640 $22,353 0.71% $35,601 VLIBusiness and Financial Operations Occupations 155,570 $55,025 $56,619 0.61% $90,176 Moderate IncomeCommunity and Social Service Occupations 800 $47,050 $34,738 0.00% $55,327 LI - 80Computer and Mathematical Occupations 51,920 $63,055 $69,387 0.20% $110,512 Middle IncomeConstruction and Extraction Occupations 34,480 $53,640 $64,064 0.14% $102,034 Middle IncomeEducation, Training, and Library Occupations 7,810 $34,905 $32,329 0.03% $51,491 LI - 80Farming, Fishing, and Forestry Occupations 19,190 $22,125 $17,587 0.08% $28,010 VLIFood Preparation and Serving Related Occupations 9,772,850 $21,780 $24,108 38.41% $38,397 VLIHealthcare Practitioners and Technical Occupations 505,010 $57,915 $72,834 1.98% $116,001 Middle IncomeHealthcare Support Occupations 42,930 $24,190 $28,816 0.17% $45,894 LI - 60Installation, Maintenance, and Repair Occupations 722,570 $35,220 $36,232 2.84% $57,706 LI - 80Legal Occupations 1,180 $84,050 $100,370 0.00% $159,858 Above MiddleLife, Physical, and Social Science Occupations 300 $58,340 $65,635 0.00% $104,536 Middle IncomeManagement Occupations 573,160 $77,760 $61,577 2.25% $98,073 Middle IncomeOffice and Administrative Support Occupations 2,618,570 $28,425 $28,743 10.29% $45,778 LI - 60Personal Care and Service Occupations 76,850 $23,770 $41,063 0.30% $65,400 Moderate IncomeProduction Occupations 446,490 $26,810 $31,293 1.75% $49,840 LI - 80Protective Service Occupations 81,410 $27,840 $28,279 0.32% $45,039 LI - 60Sales and Related Occupations 8,827,730 $23,125 $28,653 34.69% $45,635 LI - 60Transportation and Material Moving Occupations 1,215,710 $22,695 $25,014 4.78% $39,840 LI - 60Total or Weighted Average 25,445,060 $41,762 $43,365 100.00% $46,063
Household Income LevelPercent of Total
Jobs
Estimated Jobs by Household Income
LevelsExtremely Low Income (31% - 50%) 0% - Very Low Income (31% - 50%) 39% 63.7 Low Income (51% - 60%) 50% 81.6 Low Income (61% - 80%) 5% 8.2 Moderate Income (81% - 120%) 1% 1.5 Middle Income (121% - 150%) 5% 7.4 Above-Middle (150% +) 0% 0.0 Total 100% 162.4
Source: BLS and AECOM
Retail/Restaurants1
1 Includes NAICS Sectors (2013): 44 an 45 - Retail Trade and 722000 - Food Services and Drinking Places.
Occupation Category
Appendix Table 5 Occupation and Wage Distribution - Retail/Restaurants

Nexus and Fee Study Appendix Page 10
US Total Jobs by Occupation in
Industry
US Avg. Wage by Occupation in
Industry
Eastern Sierra Region Wage
Estimate% of Industry Jobs in Occupation Category
HH Income per Household Income Category
Architecture and Engineering Occupations 1,020,420 82,421 $60,904 3.68% $97,001 Middle IncomeArts, Design, Entertainment, Sports, and Media Occupations 861,790 63,093 $54,404 3.11% $86,649 Moderate IncomeBuilding and Grounds Cleaning and Maintenance Occupatio 1,931,880 27,249 $26,904 6.97% $42,849 LI - 60Business and Financial Operations Occupations 3,555,680 73,817 $75,955 12.83% $120,972 Above MiddleCommunity and Social Service Occupations 47,450 45,337 $33,473 0.17% $53,312 LI - 80Computer and Mathematical Occupations 2,517,140 79,731 $87,738 9.08% $139,739 Above MiddleConstruction and Extraction Occupations 241,560 51,858 $61,936 0.87% $98,644 Middle IncomeEducation, Training, and Library Occupations 38,920 51,736 $47,919 0.14% $76,320 Moderate IncomeFarming, Fishing, and Forestry Occupations 6,270 30,706 $24,408 0.02% $38,873 VLIFood Preparation and Serving Related Occupations 160,100 26,638 $29,486 0.58% $46,962 LI - 60Healthcare Practitioners and Technical Occupations 393,590 62,686 $78,834 1.42% $125,557 Above MiddleHealthcare Support Occupations 172,440 32,165 $38,316 0.62% $61,025 LI - 80Installation, Maintenance, and Repair Occupations 862,910 44,695 $45,979 3.11% $73,230 Moderate IncomeLegal Occupations 743,310 113,363 $135,375 2.68% $215,609 Above MiddleLife, Physical, and Social Science Occupations 377,630 73,825 $83,057 1.36% $132,284 Above MiddleManagement Occupations 2,091,790 133,915 $106,046 7.55% $168,897 Above MiddleOffice and Administrative Support Occupations 7,413,560 37,663 $38,084 26.74% $60,655 LI - 80Personal Care and Service Occupations 201,590 27,645 $47,757 0.73% $76,062 Moderate IncomeProduction Occupations 938,900 39,451 $46,048 3.39% $73,340 Moderate IncomeProtective Service Occupations 825,300 40,366 $41,002 2.98% $65,304 Moderate IncomeSales and Related Occupations 2,347,860 64,361 $79,747 8.47% $127,011 Above MiddleTransportation and Material Moving Occupations 973,790 34,288 $37,792 3.51% $60,190 LI - 80Total or Weighted Average 27,723,880 $56,228 $58,235 100.00% $97,628
Household Income LevelPercent of Total
Jobs
Estimated Jobs by Household Income
LevelsExtremely Low Income (31% - 50%) 0% - Very Low Income (31% - 50%) 0% 0.1 Low Income (51% - 60%) 8% 23.3 Low Income (61% - 80%) 31% 96.0 Moderate Income (81% - 120%) 13% 41.6 Middle Income (121% - 150%) 5% 14.1 Above-Middle (150% +) 43% 134.1 Total 100% 309.2
Source: BLS and AECOM
Office1
1 Includes NAICS Sectors (2013): 51-Information; 52 - Finance and Insurance; 53 - Real Estate and Rental and Leasing (excluding 532000 - Rental and Leasing Services); 54- Professional, Scientific, and Technical Services; 55- Management of Companies and Enterprises; 561000 - Admin. and Support Services.
Appendix Table 6 Occupation and Wage Distribution - Office
Occupation Category
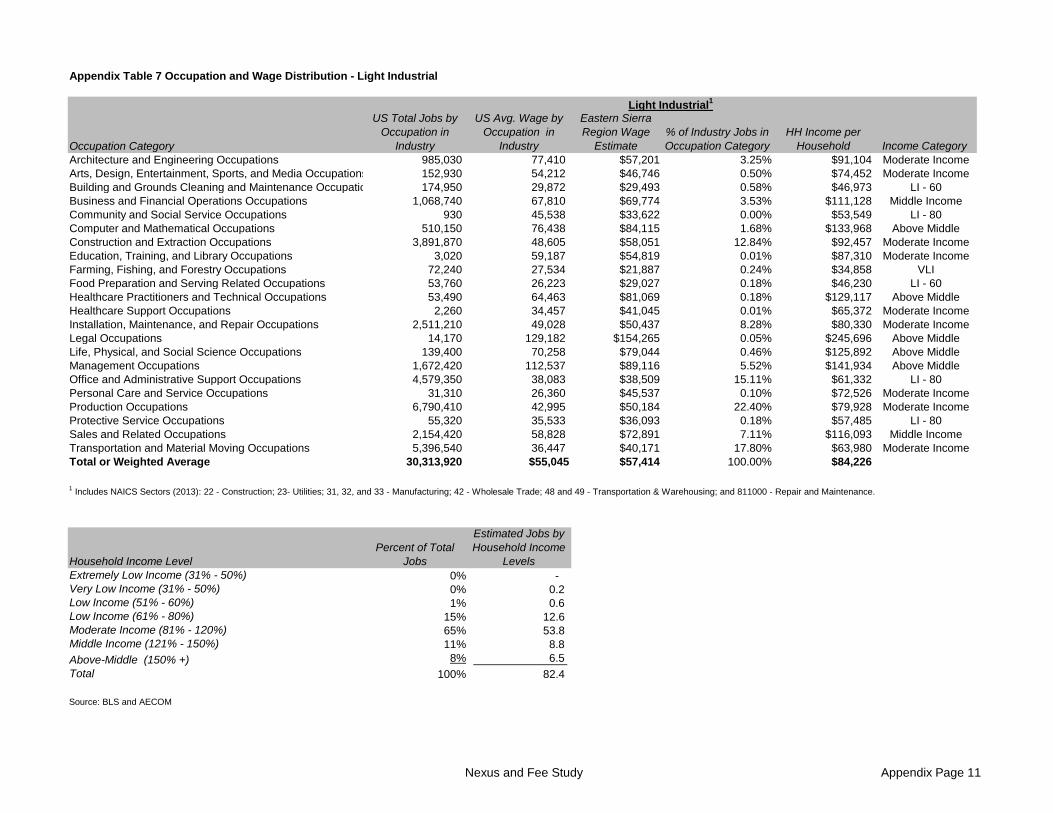
Nexus and Fee Study Appendix Page 11
US Total Jobs by Occupation in
Industry
US Avg. Wage by Occupation in
Industry
Eastern Sierra Region Wage
Estimate% of Industry Jobs in Occupation Category
HH Income per Household Income Category
Architecture and Engineering Occupations 985,030 77,410 $57,201 3.25% $91,104 Moderate IncomeArts, Design, Entertainment, Sports, and Media Occupations 152,930 54,212 $46,746 0.50% $74,452 Moderate IncomeBuilding and Grounds Cleaning and Maintenance Occupatio 174,950 29,872 $29,493 0.58% $46,973 LI - 60Business and Financial Operations Occupations 1,068,740 67,810 $69,774 3.53% $111,128 Middle IncomeCommunity and Social Service Occupations 930 45,538 $33,622 0.00% $53,549 LI - 80Computer and Mathematical Occupations 510,150 76,438 $84,115 1.68% $133,968 Above MiddleConstruction and Extraction Occupations 3,891,870 48,605 $58,051 12.84% $92,457 Moderate IncomeEducation, Training, and Library Occupations 3,020 59,187 $54,819 0.01% $87,310 Moderate IncomeFarming, Fishing, and Forestry Occupations 72,240 27,534 $21,887 0.24% $34,858 VLIFood Preparation and Serving Related Occupations 53,760 26,223 $29,027 0.18% $46,230 LI - 60Healthcare Practitioners and Technical Occupations 53,490 64,463 $81,069 0.18% $129,117 Above MiddleHealthcare Support Occupations 2,260 34,457 $41,045 0.01% $65,372 Moderate IncomeInstallation, Maintenance, and Repair Occupations 2,511,210 49,028 $50,437 8.28% $80,330 Moderate IncomeLegal Occupations 14,170 129,182 $154,265 0.05% $245,696 Above MiddleLife, Physical, and Social Science Occupations 139,400 70,258 $79,044 0.46% $125,892 Above MiddleManagement Occupations 1,672,420 112,537 $89,116 5.52% $141,934 Above MiddleOffice and Administrative Support Occupations 4,579,350 38,083 $38,509 15.11% $61,332 LI - 80Personal Care and Service Occupations 31,310 26,360 $45,537 0.10% $72,526 Moderate IncomeProduction Occupations 6,790,410 42,995 $50,184 22.40% $79,928 Moderate IncomeProtective Service Occupations 55,320 35,533 $36,093 0.18% $57,485 LI - 80Sales and Related Occupations 2,154,420 58,828 $72,891 7.11% $116,093 Middle IncomeTransportation and Material Moving Occupations 5,396,540 36,447 $40,171 17.80% $63,980 Moderate IncomeTotal or Weighted Average 30,313,920 $55,045 $57,414 100.00% $84,226
Household Income LevelPercent of Total
Jobs
Estimated Jobs by Household Income
LevelsExtremely Low Income (31% - 50%) 0% - Very Low Income (31% - 50%) 0% 0.2 Low Income (51% - 60%) 1% 0.6 Low Income (61% - 80%) 15% 12.6 Moderate Income (81% - 120%) 65% 53.8 Middle Income (121% - 150%) 11% 8.8 Above-Middle (150% +) 8% 6.5 Total 100% 82.4
Source: BLS and AECOM
Appendix Table 7 Occupation and Wage Distribution - Light Industrial
Occupation Category
Light Industrial1
1 Includes NAICS Sectors (2013): 22 - Construction; 23- Utilities; 31, 32, and 33 - Manufacturing; 42 - Wholesale Trade; 48 and 49 - Transportation & Warehousing; and 811000 - Repair and Maintenance.

Nexus and Fee Study Appendix Page 12
US Total Jobs by Occupation in
Industry
US Avg. Wage by Occupation in
Industry
Eastern Sierra Region Wage
Estimate% of Industry Jobs in Occupation Category
HH Income per Household Income Category
Architecture and Engineering Occupations 720 $61,550 $45,482 0.04% $72,438 Moderate IncomeArts, Design, Entertainment, Sports, and Media Occupations 14,910 $41,455 $35,746 0.81% $56,933 LI - 80Building and Grounds Cleaning and Maintenance Occupatio 36,600 $24,640 $24,328 1.98% $38,746 VLIBusiness and Financial Operations Occupations 19,580 $59,605 $61,331 1.06% $97,681 Middle IncomeCommunity and Social Service Occupations 1,060 $40,415 $29,840 0.06% $47,525 LI - 80Computer and Mathematical Occupations 3,580 $72,910 $80,232 0.19% $127,784 Above MiddleConstruction and Extraction Occupations 6,400 $45,230 $54,020 0.35% $86,037 Moderate IncomeEducation, Training, and Library Occupations 1,160 $31,010 $28,722 0.06% $45,745 LI - 60Farming, Fishing, and Forestry Occupations - $25,520 $20,286 0.00% $32,309 VLIFood Preparation and Serving Related Occupations 3,540 $22,855 $25,298 0.19% $40,292 LI - 60Healthcare Practitioners and Technical Occupations 8,810 $55,445 $69,727 0.48% $111,054 Middle IncomeHealthcare Support Occupations 40,020 $35,400 $42,169 2.16% $67,162 Moderate IncomeInstallation, Maintenance, and Repair Occupations 77,930 $38,155 $39,251 4.21% $62,515 LI - 80Legal Occupations 130 $96,120 $114,784 0.01% $182,814 Above MiddleLife, Physical, and Social Science Occupations - $69,250 $77,910 0.00% $124,086 Above MiddleManagement Occupations 55,520 $93,510 $74,049 3.00% $117,937 Middle IncomeOffice and Administrative Support Occupations 210,230 $29,705 $30,037 11.35% $47,839 LI - 80Personal Care and Service Occupations 623,680 $24,840 $42,911 33.69% $68,344 Moderate IncomeProduction Occupations 187,560 $27,945 $32,618 10.13% $51,950 LI - 80Protective Service Occupations 3,200 $29,735 $30,204 0.17% $48,105 LI - 80Sales and Related Occupations 303,840 $30,205 $37,425 16.41% $59,607 LI - 80Transportation and Material Moving Occupations 253,000 $27,280 $30,068 13.66% $47,888 LI - 80Total or Weighted Average 1,851,470 $44,672 $46,656 100.00% $61,250
Household Income LevelPercent of Total
Jobs
Estimated Jobs by Household Income
LevelsExtremely Low Income (31% - 50%) 0% - Very Low Income (31% - 50%) 2% 3.5 Low Income (51% - 60%) 0% 0.4 Low Income (61% - 80%) 57% 100.4 Moderate Income (81% - 120%) 36% 64.0 Middle Income (121% - 150%) 5% 8.0 Above-Middle (150% +) 0% 0.4 Total 100% 176.7
Source: BLS and AECOM
Appendix Table 8 Occupation and Wage Distribution - Personal Services
Occupation Category
Personal Services1
1 Includes NAICS Sectors (2013): 532000 - Rental and Leasing Services and 812000 - Personal and Laundry Services.