memorandum - regionfwater.org demand package.pdfmemorandum draft at our next rwpg meeting on july...
TRANSCRIPT
MEMORANDUM
At our next RWPG meeting on July 18, 2013, we will be requesting approval of the draft water demand revisions for all water demand categories, including non-municipal water demands. We recognize that non-municipal water demands have been presented and discussed at previous RWPG meetings. A brief recap of the previous discussion and submittals is summarized below:
The Region F Water Planning Group (RWPG) previously reviewed and approved irrigation, manufacturing, and steam-electric power water demands on May 17, 2012.
At a subsequent RWPG meeting on August 16, 2012, demand revisions to livestock water use were accepted. The Region F non-municipal demands, excluding mining, were submitted to the Texas Water Development Board (TWDB) on September 5, 2012.
TWDB approved the proposed irrigation, manufacturing, and steam electric power demands. However, the increase to county livestock demands for exotics and wildlife was not accepted by TWDB.
Mining demands for Region F were discussed at the August 16, 2012 RWPG meeting but no action was taken. It was the consensus of the RWPG to wait until the updated Bureau of Economic Geology (BEG) report was available. The updated BEG report was released in September of 2012 and a detailed breakdown of the projections was sent to the planning group members in April of 2013 for consideration. The updated BEG report was also posted on the website in March of 2013. To date, one comment has been received on the updated BEG mining projections for Region F.
In preparation for the July 18, 2013 RWPG meeting, the non-municipal demands (irrigation, livestock, manufacturing, steam-electric power, and mining) will be re-considered by the RWPG as a complete package. To aid in your review the following supporting documents are enclosed:
1. Non-Municipal Demands Submittal to TWDB September 5, 2012 2. Rejection of Livestock Demand Documentation 3. Approved Demands Summary Tables 4. Demands for Consideration Summary Tables 5. BEG Updated Mining Demands Detailed Breakdown
TO: Region F Water Planning Group
FROM: Simone Kiel, Lissa Petry
SUBJECT: DRAFT Region F Non-Municipal Demands
DATE: 7/2/13
PROJECT: SAN11472 – 2016 Update to the Region F Water Plan
DRAFT
THIS DOCUMENT IS RELEASED FOR THE PURPOSE OF INTERIM REVIEW UNDER THE AUTHORITY OF ENGINEER, P.E., TEXAS NO. 12345 ON DATE. IT IS NOT TO BE USED FOR CONSTRUCTION, BIDDING OR PERMIT PURPOSES. FREESE AND NICHOLS, INC. TEXAS REGISTERED ENGINEERING FIRM F- 2144
DRAFT
THIS DOCUMENT IS RELEASED FOR THE PURPOSE OF INTERIM REVIEW UNDER THE AUTHORITY OF ENGINEER, P.E., TEXAS NO. 12345 ON DATE. IT IS NOT TO BE USED FOR CONSTRUCTION, BIDDING OR PERMIT PURPOSES. FREESE AND NICHOLS, INC. TEXAS REGISTERED ENGINEERING FIRM F- 2144
Texas Water Development Board Regional Water Planning
Region F Regional Water Planning Group
Voting Members: Len Wilson, Public, Andrews Wendell Moody, Secretary Public, Concho Jerry Bearden, Counties, Mason Robert Moore, Counties, Runnels Will Wilde, Vice Chair Municipalities, Tom Green Merle Taylor, Municipalities, Scurry John Shepard, Municipalities, Winkler Ben Shepperd, Industrial, Midland Kenneth Dierschke, Agricultural, Tom Green Woody Anderson, Agricultural, Mitchell Terry Scott, Agricultural, Coleman Caroline Runge, Environmental, Menard Gilbert Van Deventer Environmental, Odessa Charles Haygood, Small Business Tim Warren, Elect. Gen. Utilities, Mitchell Stephen Brown, At– Large, River Authority, Tom Green Scott Holland, GMA 7, Irion Paul Weatherby, GMA 3, Pecos Raymond Straub GMA 2, Martin Larry Turnbough, Water District, Reeves John Grant, Chair, Water District, Howard
c/o City of San Angelo - P.O. Box 1751, San Angelo, Texas 76902 Phone: 325-657-4241 - Fax: 325-657-4335
ANDREWS • BORDEN • BROWN • COKE • COLEMAN • CONCHO • CRANE • CROCKETT • ECTOR • GLASSCOCK • HOWARD • IRION KIMBLE • LOVING • MARTIN • MASON • McCULLOCH • MENARD • MIDLAND • MITCHELL • PECOS • REGAN • REEVES • RUNNELS
SCHLEICHER • SCURRY • STERLING • SUTTON • TOM GREEN • UPTON • WARD • WINKLER
September 5, 2012
Doug Shaw
Project Manager
Texas Water Development Board
P.O. Box 13231
Austin, TX 78711-3231
Re: Non-Municipal Demands for Region F
Doug,
At the Region F planning group meeting on May 17, 2012, the RWPG approved revisions to the draft de-
mand projections for irrigated agriculture, manufacturing and steam electric power. At a subsequent Region F
meeting on August 16, 2012, the RWPG approved the demand revisions to livestock water use. Technical
memoranda describing the requested changes to these draft non-municipal demands are included in Attach-
ment 1.
Region F decided not to take action on the mining demands at this time. There is considerable variability in
the mining water use throughout the Permian Basin. It was the consensus of the RWPG to delay commenting
on mining water demands until the updated Bureau of Economic Geology study is released in the next couple
of months. It is anticipated that this study will provide a more accurate assessment of the current water use
for mining in Region F.
As requested by the TWDB, an electronic copy of the projected non-municipal water demands and the re-
quested revisions will be emailed to Thomas Barnett at the TWDB with a copy to you.
If you have any questions or need additional information related to the non-municipal demands, please con-
tact Simone Kiel at 817-735-7446.
Sincerely,
John Grant, Region F Chairman
cc: Will Wilde, City of San Angelo

ATTACHMENT 1

MEMORANDUM
1. Introduction As part of Task 2 efforts for the 2016 regional plans, the Texas Water Development Board (TWDB) developed draft non‐municipal water demand projections which were provided to each planning group in October 2011. These draft demand projections were reviewed by the consultant team in conjunction with the Region F Regional Water Planning Group (RWPG). This memorandum discusses the development of recommended revisions to the irrigation and livestock projections. These revisions were approved by the RWPG. 2. Irrigation
a. TWDB Methodology – TWDB estimates irrigation demands by applying an evapotranspiration‐based estimated crop water need to Farm Service Agency (FSA) acreage to generate water need estimates by county, crop, and year. The TWDB also reviews surface water diversions for agricultural purpose. The irrigation estimates are provided each year to agricultural representatives and local groundwater conservation districts for review and input. The adjusted values are then reported as historical irrigation use by county. Table 2‐1 shows the TWDB historic irrigation water use estimates for the counties in Region F.
One concern expressed by the Region F RWPG is that some crops are not tracked by FSA. Water used by these crops is not included in the water use estimates unless corrected by local groundwater districts or agricultural representatives. Counties that do not have such representation may not have accurate irrigation estimates.
The TWDB estimated the base 2010 draft irrigation demands by averaging the historical values for years 2005‐2009. Decadal rates of change from the 2011 Regional Water Plan were then applied to the base projection by county.
b. Assessment Approach – The TWDB draft projections were compared to the historic TWDB irrigation water use estimates (1974‐2010) and projections from the 2011 Region F Regional Water Plan (RWP) on a county‐by‐county basis. Graphical comparisons were presented to the Region F RWPG for input along with a request for additional data to support revisions. The consultants received input from the Middle Pecos Groundwater District and the Region F non‐voting representative from Upton County.
TO: Region F RWPG
CC: File
FROM: Simone Kiel, Jeremy Rice
SUBJECT: Recommended Revisions to TWDB Draft Agricultural Water Demand Projections for the 2016 Region F Regional Water Plan
DATE: Updated, August 29, 2012
August 29, 2012 Page 2 of 10 Recommended Revisions to TWDB Draft Agricultural Projections
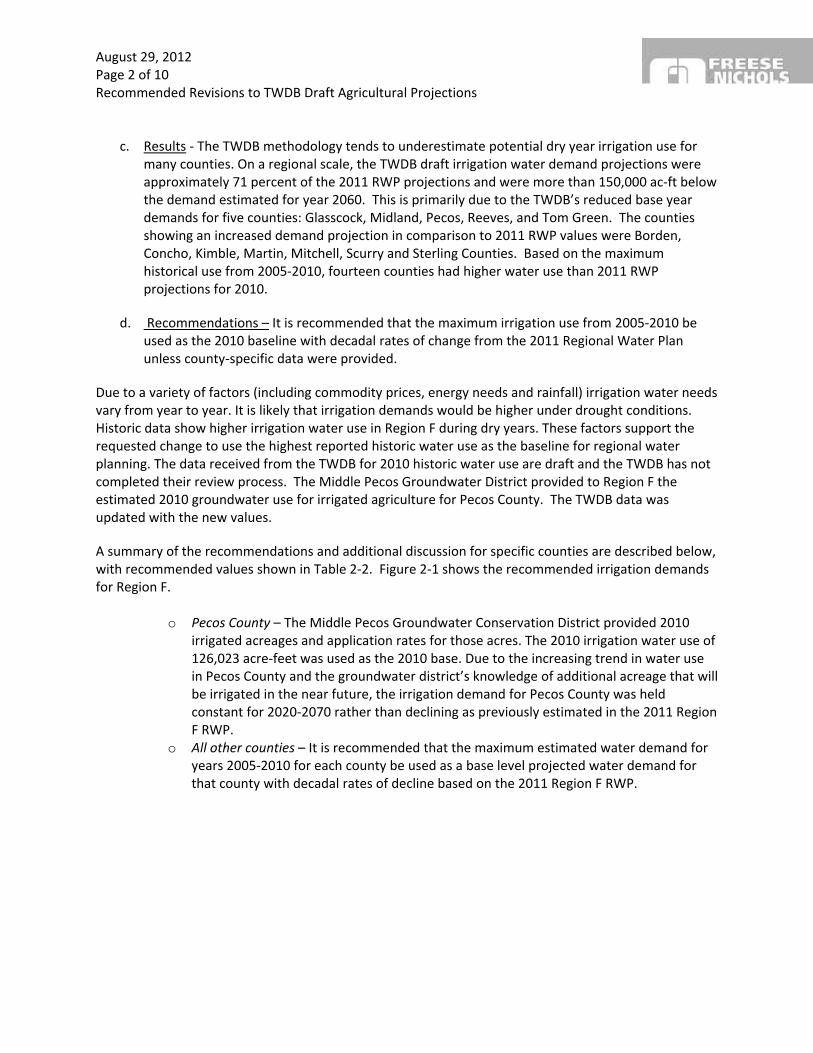
c. Results ‐ The TWDB methodology tends to underestimate potential dry year irrigation use for many counties. On a regional scale, the TWDB draft irrigation water demand projections were approximately 71 percent of the 2011 RWP projections and were more than 150,000 ac‐ft below the demand estimated for year 2060. This is primarily due to the TWDB’s reduced base year demands for five counties: Glasscock, Midland, Pecos, Reeves, and Tom Green. The counties showing an increased demand projection in comparison to 2011 RWP values were Borden, Concho, Kimble, Martin, Mitchell, Scurry and Sterling Counties. Based on the maximum historical use from 2005‐2010, fourteen counties had higher water use than 2011 RWP projections for 2010.
d. Recommendations – It is recommended that the maximum irrigation use from 2005‐2010 be used as the 2010 baseline with decadal rates of change from the 2011 Regional Water Plan unless county‐specific data were provided.
Due to a variety of factors (including commodity prices, energy needs and rainfall) irrigation water needs vary from year to year. It is likely that irrigation demands would be higher under drought conditions. Historic data show higher irrigation water use in Region F during dry years. These factors support the requested change to use the highest reported historic water use as the baseline for regional water planning. The data received from the TWDB for 2010 historic water use are draft and the TWDB has not completed their review process. The Middle Pecos Groundwater District provided to Region F the estimated 2010 groundwater use for irrigated agriculture for Pecos County. The TWDB data was updated with the new values.
A summary of the recommendations and additional discussion for specific counties are described below, with recommended values shown in Table 2‐2. Figure 2‐1 shows the recommended irrigation demands for Region F.
o Pecos County – The Middle Pecos Groundwater Conservation District provided 2010 irrigated acreages and application rates for those acres. The 2010 irrigation water use of 126,023 acre‐feet was used as the 2010 base. Due to the increasing trend in water use in Pecos County and the groundwater district’s knowledge of additional acreage that will be irrigated in the near future, the irrigation demand for Pecos County was held constant for 2020‐2070 rather than declining as previously estimated in the 2011 Region F RWP.
o All other counties – It is recommended that the maximum estimated water demand for years 2005‐2010 for each county be used as a base level projected water demand for that county with decadal rates of decline based on the 2011 Region F RWP.

August 29, 2012 Page 3 of 10 Recommended Revisions to TWDB Draft Agricultural Projections
Table2‐1:TWDBHistoricIrrigationWaterUseEstimates(Acre‐Feet/Year)
County Name 2005 2006 2007 2008 2009 2010* Maximum
Andrews 30,808 30,459 38,219 30,076 24,155 23,354 38,219
Borden 2,616 2,322 2,490 2,282 4,004 1,616 4,004
Brown 7,084 9,467 5,168 9,422 7,900 8,901 9,467
Coke 795 965 609 690 394 871 965
Coleman 770 742 343 624 509 470 770
Concho 3,556 7,727 5,235 9,773 2,603 7,167 9,773
Crane 0 0 0 0 0 0 0
Crockett 427 485 381 362 0 148 485
Ector 1,350 1,450 1,250 583 0 1,050 1,450
Glasscock 44,231 46,579 37,816 42,879 45,852 57,164 57,164
Howard 2,829 3,155 6,200 4,851 6,800 6,721 6,800
Irion 1,500 700 417 662 1,475 1,386 1,500
Kimble 2,525 3,054 1,557 2,914 3,019 2,975 3,054
Loving 0 0 0 0 0 0 0
McCulloch 3,629 3,477 1,878 768 3,584 2,558 3,629
Martin 16,152 15,626 25,872 28,582 36,970 36,160 36,970
Mason 8,413 6,830 3,311 5,519 6,794 3,922 8,413
Menard 1,625 2,538 2,106 1,059 1,596 2,074 2,538
Midland 18,861 20,687 15,545 24,125 20,993 33,537 33,537
Mitchell 5,931 7,306 9,870 8,092 11,575 10,014 11,575
Pecos 46,603 69,056 57,910 58,051 92,190 126,023 126,023
Reagan 12,257 18,741 16,992 19,453 16,704 19,385 19,453
Reeves 92,137 88,925 78,194 26,968 57,949 58,369 92,137
Runnels 2,466 3,534 2,169 4,022 3,057 3,053 4,022
Schleicher 762 1,005 500 1,095 1,432 1,442 1,442
Scurry 3,593 5,707 4,876 4,865 7,552 6,095 7,552
Sterling 450 600 477 795 1,026 688 1,026
Sutton 1,489 1,677 1,838 408 677 1,143 1,838
Tom Green 40,809 49,140 74,120 93,811 70,686 53,415 93,811
Upton 6,674 7,301 6,205 9,125 7,973 9,609 9,609
Ward 3,570 4,469 4,072 1,714 5,683 5,040 5,683
Winkler 3,770 4,912 3,268 2,223 3,005 3,208 4,912
Total 367,682 418,636 408,888 395,793 446,157 487,558 597,821
*2010 water use estimates were draft data provided by the TWDB

August 29, 2012 Page 4 of 10 Recommended Revisions to TWDB Draft Agricultural Projections
Table2‐2:RegionFRWPGRecommendedIrrigationDemands(Acre‐Feet/Year)
County Name
2011 RWP Base Recommended for 2016 RWP
2010 2010 2020 2030 2040 2050 2060 2070
Andrews 32,608 38,219 37,898 37,579 37,258 36,939 36,621 36,306
Borden 2,690 4,004 4,000 3,993 3,990 3,983 3,980 3,977
Brown 12,313 9,467 9,435 9,403 9,371 9,338 9,306 9,275
Coke 936 965 965 963 962 962 962 962
Coleman 1,379 770 770 770 770 770 770 770
Concho 4,297 9,773 9,734 9,693 9,654 9,618 9,582 9,546
Crane 337 0 0 0 0 0 0 0
Crockett 525 485 479 470 461 455 446 437
Ector 5,533 1,450 1,432 1,415 1,397 1,380 1,362 1,345
Glasscock 52,272 57,164 56,707 56,252 55,796 55,339 54,887 54,439
Howard 4,799 6,800 6,722 6,645 6,567 6,490 6,413 6,337
Irion 2,803 1,500 1,467 1,435 1,402 1,370 1,338 1,307
Kimble 985 3,054 2,939 2,830 2,718 2,606 2,501 2,400
Loving 581 0 0 0 0 0 0 0
McCulloch 2,824 3,629 3,584 3,539 3,493 3,448 3,404 3,361
Martin 14,324 36,970 36,322 35,674 35,026 34,381 33,746 33,123
Mason 10,079 8,413 8,294 8,174 8,054 7,935 7,816 7,699
Menard 6,061 2,538 2,530 2,522 2,514 2,505 2,497 2,489
Midland 41,493 33,537 33,276 33,016 32,756 32,495 32,237 31,981
Mitchell 5,534 11,575 11,519 11,460 11,404 11,348 11,292 11,236
Pecos 79,681 126,023 126,023 126,023 126,023 126,023 126,023 126,023
Reagan 36,597 19,453 19,130 18,808 18,486 18,164 17,848 17,537
Reeves 103,069 92,137 91,357 90,577 89,795 89,015 88,242 87,475
Runnels 4,331 4,022 4,009 3,991 3,973 3,955 3,937 3,919
Schleicher 2,108 1,442 1,414 1,385 1,356 1,327 1,298 1,270
Scurry 2,815 7,552 7,305 7,056 6,806 6,557 6,318 6,088
Sterling 648 1,026 983 942 901 860 820 782
Sutton 1,811 1,838 1,803 1,767 1,733 1,697 1,663 1,629
Tom Green 104,621 93,811 93,579 93,350 93,121 92,889 92,660 92,432
Upton 16,759 9,609 9,473 9,338 9,202 9,066 8,932 8,800
Ward 13,793 5,683 5,613 5,543 5,473 5,403 5,334 5,266
Winkler 10,000 4,912 4,912 4,912 4,912 4,912 4,912 4,912
Total 578,606 597,821 593,674 589,525 585,374 581,230 577,147 573,123

August 29, 2012 Page 5 of 10 Recommended Revisions to TWDB Draft Agricultural Projections
Figure 2‐1 Historical and Projected Irrigation Demands for Region F
3. Livestock
a. TWDB Methodology – Draft livestock water demands were developed by TWDB by applying per‐head water use estimates by species or category to livestock count estimates from the Texas Agricultural Statistics Service. Water demands were not estimated for wildlife or exotic species.
b. Assessment Approach – The Draft TWDB projections were compared to the historic TWDB livestock water use estimates (1974‐2009) and projections from the 2011 Region F RWP on a county‐by‐county basis. Graphical comparisons were presented to the Region F RWPG for input along with a request for additional data to support revisions. The Region F RWPG questioned the lack of water demand for wildlife and exotic species. In previous planning cycles, the region had included a 10 percent increase in livestock demands to account for wildlife and exotic species. To address wildlife demands for the 2016 Region F RWP, estimates of exotic species and wildlife use were calculated based on animal counts and water use per animal. Data for wildlife counts were obtained from TPWD and water use estimates were obtained from previous studies for Region J. TPWD only keeps animal counts for white‐tail deer and selected exotic species, so only these species were considered.
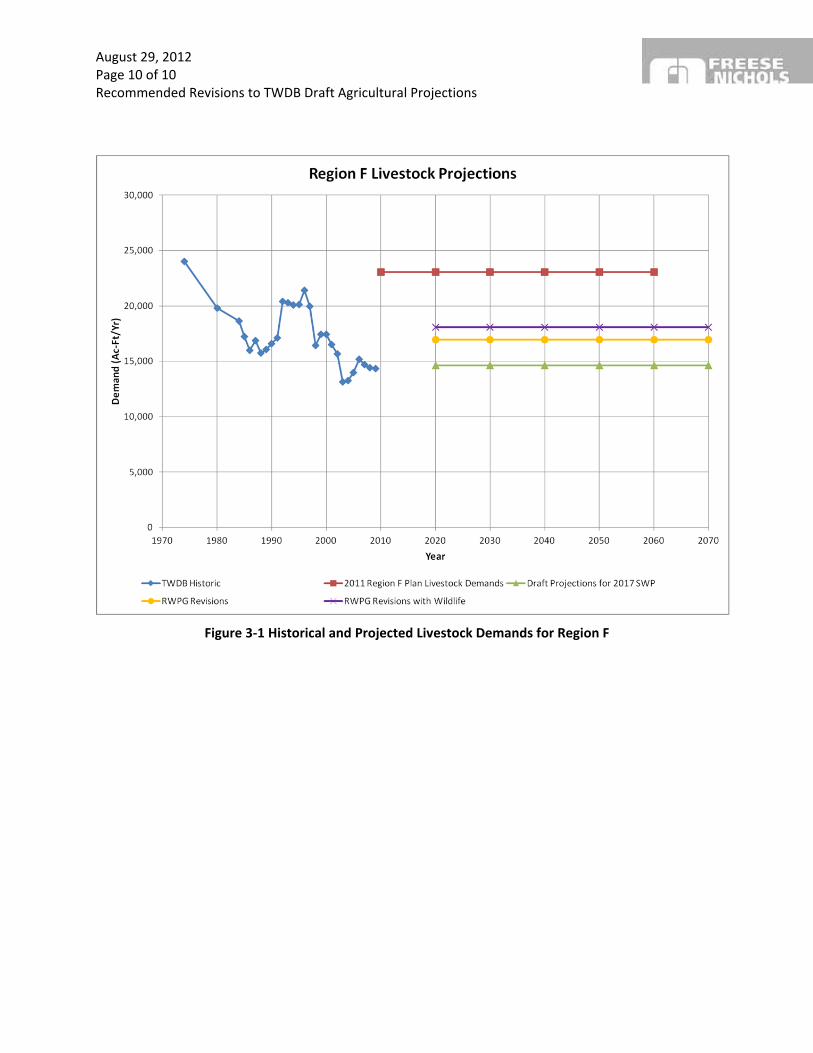
c. Results–On a regional scale, draft demand projections for livestock (14,622 ac‐ft/yr) are approximately 8,500 ac‐ft/yr lower than the estimates used in the 2011 RWP (23,060 ac‐ft/yr)
0
100,000
200,000
300,000
400,000
500,000
600,000
700,000
800,000
900,000
1970 1980 1990 2000 2010 2020 2030 2040 2050 2060 2070
Deman
d (Ac‐Ft/Yr)
Year
Region F Irrigation Projections
TWDB Historic 2011 Region F Plan Irrigation Water Demands Draft Projections for 2017 SWP RWPG Revisions

August 29, 2012 Page 6 of 10 Recommended Revisions to TWDB Draft Agricultural Projections
and approximately 2,300 ac‐ft/yr lower than the TWDB reported maximum historic livestock water use from 2005‐2009 (16,942 ac‐ft/yr). The difference between the TWDB draft projections and the maximum historic use is about 16% for the region. Exotic species and wildlife demand accounts for an additional 1,134 acre‐feet or 6% of demand for a total regional livestock demand of 18,076 ac‐ft/yr.
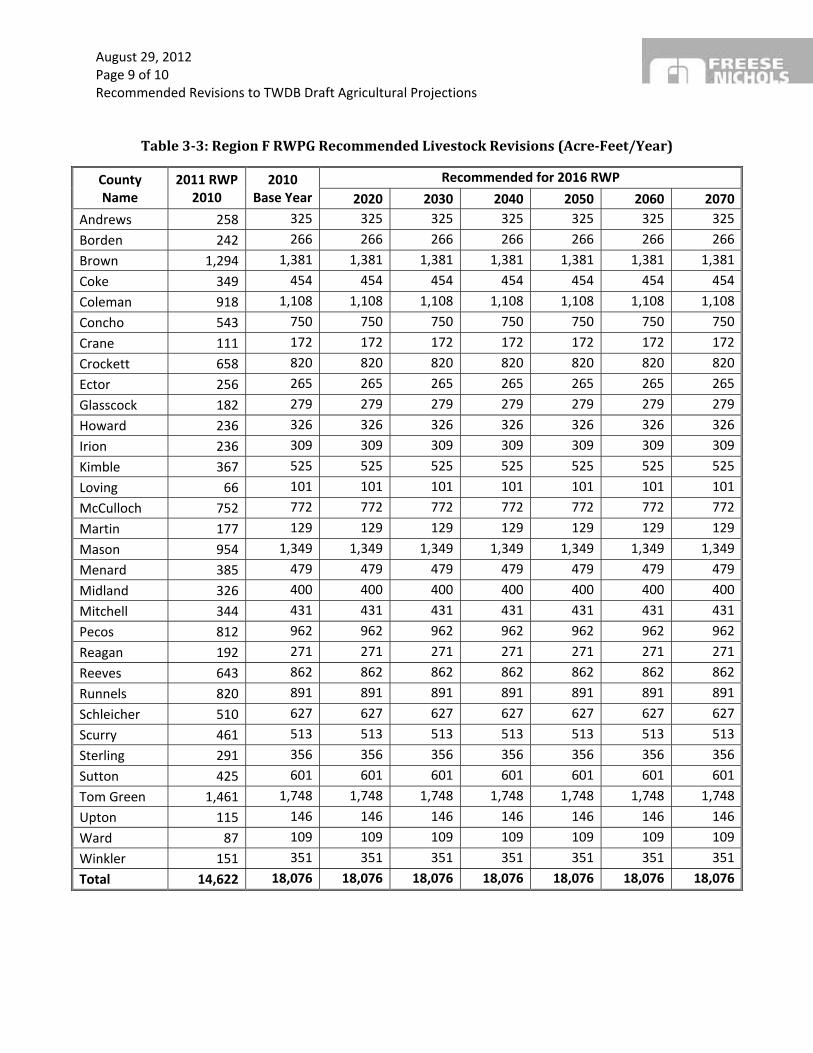
d. Recommendations – The TWDB historic water use is based on actual livestock counts, but do not include species that are not counted by the TASS. For some counties, such as Kimble and Crockett, wildlife water needs represent a significant portion of the total livestock demand. Including wildlife estimates, the revised livestock demand values are slightly less than projections used in the 2011 Region F RWP but seem reasonable considering the variability of livestock counts over time. It is recommended that the maximum water use for each county plus wildlife water needs be used as the baseline for livestock water demands for the 2016 Region F RWP. These values are held constant through the planning cycle, which is consistent with the previous RWP.
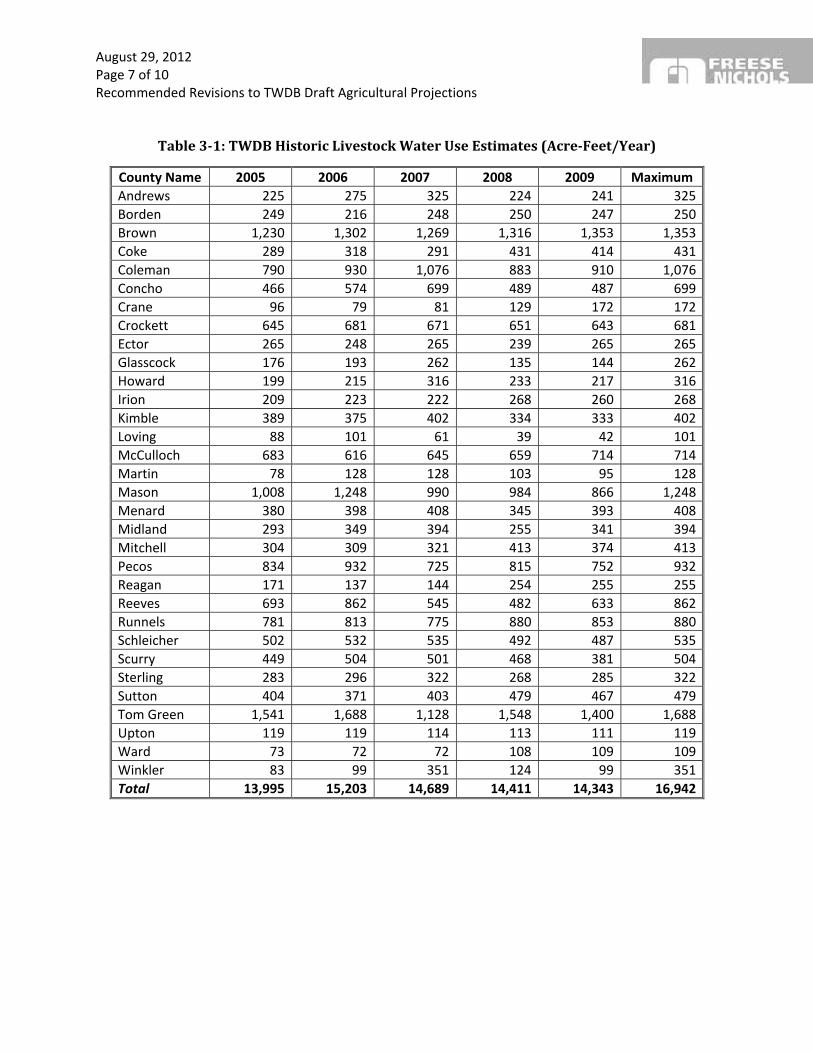
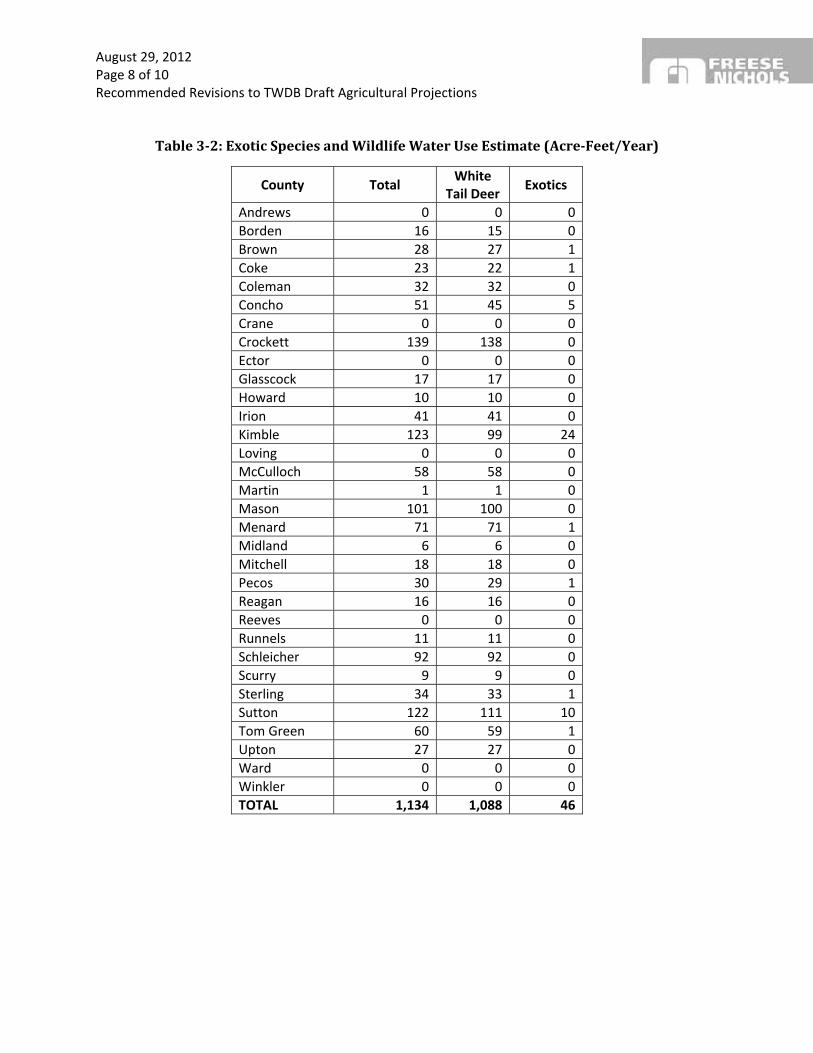
Table 3‐1 shows the TWDB historic livestock water use from 2005‐2009 for the counties in Region F. Table 3‐2 shows the estimated exotic species and wildlife demand by county. The recommended livestock water demands for the 2016 RWP and the 2010 livestock demand from the 2011 Region F RWP are shown in Table 3‐3. Figure 3‐1 shows the recommended livestock demands for Region F.
August 29, 2012 Page 7 of 10 Recommended Revisions to TWDB Draft Agricultural Projections
Table3‐1:TWDBHistoricLivestockWaterUseEstimates(Acre‐Feet/Year)
County Name 2005 2006 2007 2008 2009 Maximum
Andrews 225 275 325 224 241 325
Borden 249 216 248 250 247 250
Brown 1,230 1,302 1,269 1,316 1,353 1,353
Coke 289 318 291 431 414 431
Coleman 790 930 1,076 883 910 1,076
Concho 466 574 699 489 487 699
Crane 96 79 81 129 172 172
Crockett 645 681 671 651 643 681
Ector 265 248 265 239 265 265
Glasscock 176 193 262 135 144 262
Howard 199 215 316 233 217 316
Irion 209 223 222 268 260 268
Kimble 389 375 402 334 333 402
Loving 88 101 61 39 42 101
McCulloch 683 616 645 659 714 714
Martin 78 128 128 103 95 128
Mason 1,008 1,248 990 984 866 1,248
Menard 380 398 408 345 393 408
Midland 293 349 394 255 341 394
Mitchell 304 309 321 413 374 413
Pecos 834 932 725 815 752 932
Reagan 171 137 144 254 255 255
Reeves 693 862 545 482 633 862
Runnels 781 813 775 880 853 880
Schleicher 502 532 535 492 487 535
Scurry 449 504 501 468 381 504
Sterling 283 296 322 268 285 322
Sutton 404 371 403 479 467 479
Tom Green 1,541 1,688 1,128 1,548 1,400 1,688
Upton 119 119 114 113 111 119
Ward 73 72 72 108 109 109
Winkler 83 99 351 124 99 351
Total 13,995 15,203 14,689 14,411 14,343 16,942
August 29, 2012 Page 8 of 10 Recommended Revisions to TWDB Draft Agricultural Projections
Table3‐2:ExoticSpeciesandWildlifeWaterUseEstimate(Acre‐Feet/Year)
County Total White
Tail Deer Exotics
Andrews 0 0 0
Borden 16 15 0
Brown 28 27 1
Coke 23 22 1
Coleman 32 32 0
Concho 51 45 5
Crane 0 0 0
Crockett 139 138 0
Ector 0 0 0
Glasscock 17 17 0
Howard 10 10 0
Irion 41 41 0
Kimble 123 99 24
Loving 0 0 0
McCulloch 58 58 0
Martin 1 1 0
Mason 101 100 0
Menard 71 71 1
Midland 6 6 0
Mitchell 18 18 0
Pecos 30 29 1
Reagan 16 16 0
Reeves 0 0 0
Runnels 11 11 0
Schleicher 92 92 0
Scurry 9 9 0
Sterling 34 33 1
Sutton 122 111 10
Tom Green 60 59 1
Upton 27 27 0
Ward 0 0 0
Winkler 0 0 0
TOTAL 1,134 1,088 46
August 29, 2012 Page 9 of 10 Recommended Revisions to TWDB Draft Agricultural Projections
Table3‐3:RegionFRWPGRecommendedLivestockRevisions(Acre‐Feet/Year)
County Name
2011 RWP 2010
2010 Base Year
Recommended for 2016 RWP
2020 2030 2040 2050 2060 2070
Andrews 258 325 325 325 325 325 325 325
Borden 242 266 266 266 266 266 266 266
Brown 1,294 1,381 1,381 1,381 1,381 1,381 1,381 1,381
Coke 349 454 454 454 454 454 454 454
Coleman 918 1,108 1,108 1,108 1,108 1,108 1,108 1,108
Concho 543 750 750 750 750 750 750 750
Crane 111 172 172 172 172 172 172 172
Crockett 658 820 820 820 820 820 820 820
Ector 256 265 265 265 265 265 265 265
Glasscock 182 279 279 279 279 279 279 279
Howard 236 326 326 326 326 326 326 326
Irion 236 309 309 309 309 309 309 309
Kimble 367 525 525 525 525 525 525 525
Loving 66 101 101 101 101 101 101 101
McCulloch 752 772 772 772 772 772 772 772
Martin 177 129 129 129 129 129 129 129
Mason 954 1,349 1,349 1,349 1,349 1,349 1,349 1,349
Menard 385 479 479 479 479 479 479 479
Midland 326 400 400 400 400 400 400 400
Mitchell 344 431 431 431 431 431 431 431
Pecos 812 962 962 962 962 962 962 962
Reagan 192 271 271 271 271 271 271 271
Reeves 643 862 862 862 862 862 862 862
Runnels 820 891 891 891 891 891 891 891
Schleicher 510 627 627 627 627 627 627 627
Scurry 461 513 513 513 513 513 513 513
Sterling 291 356 356 356 356 356 356 356
Sutton 425 601 601 601 601 601 601 601
Tom Green 1,461 1,748 1,748 1,748 1,748 1,748 1,748 1,748
Upton 115 146 146 146 146 146 146 146
Ward 87 109 109 109 109 109 109 109
Winkler 151 351 351 351 351 351 351 351
Total 14,622 18,076 18,076 18,076 18,076 18,076 18,076 18,076
August 29, 2012 Page 10 of 10 Recommended Revisions to TWDB Draft Agricultural Projections
Figure 3‐1 Historical and Projected Livestock Demands for Region F

LBG‐GUYTON ASSOCIATES MEMORANDUM
TO: Region F RWPG
FROM: LBG‐GUYTON ASSOCIATES
SUBJECT: Recommended Revisions to TWDB Draft Water Demand Projections for Power and Manufacturing for the 2016 Region F Regional Water Plan
DATE: August 29, 2012
CC: Project File
1. Introduction
As part of Task 2 efforts for the 2016 regional plans, the Texas Water Development Board (TWDB) developed draft non‐municipal water demand projections which were provided to each planning group in October 2011. These draft demand projections were reviewed by the consultant team in conjunction with the Region F Regional Water Planning Group (RWPG). The RWPG approved these revisions at the May 17, 2012 meeting. This memorandum discusses the review process and recommended revisions to the power and manufacturing projections.
2. Manufacturing
a. TWDB Methodology – Draft manufacturing water demand projections utilized 2004‐2008 data from TWDB’s Water Use Survey (WUS). In counties where reported employment from the companies returning surveys was low compared to manufacturing employment data reported by the Bureau of Economic Analysis (BEA), surveyed water use was adjusted to account for non‐responses. The rate of change for projections from the 2011 Regional Water Plans was then applied to the new base year estimate.
b. Assessment Approach – The TWDB draft projections were compared to projections from the 2012 SWP on a regional and county‐by‐county basis. Graphical comparisons were presented to the Region F RWPG for input along with a request for additional data to support revisions.
c. Results – Manufacturing demand estimates are very similar to 2012 SWP projections and increase slightly over the planning period.
d. Recommendation – Use TWDB estimates.

Recommended Revisions to TWDB Projected Water Demands for
Mining, Manufacturing, and Steam Electric Power
LBG-Guyton Associates 2
3. Steam Electric Power
a. TWDB Methodology – Draft steam‐electric power generation water demand projections are based on projections from the 2011 Regional Water Plans and the 2008 TWDB report Water Demand Projections for Power Generation in Texas. Recent data from the Public Utilities Commission of Texas on plant announcements, retirements, and capacity changes were incorporated to adjust the base. The rate of change for projections from the 2011 Regional Water Plans was then applied to the new base.
b. Assessment Approach – The TWDB draft projections were compared to projections from the 2012 SWP on a regional and county‐by‐county basis. Graphical comparisons were presented to the Region F RWPG for input along with a request for additional data to support revisions. Will Wilde indicated that the steam electric power demand in Tom Green County was probably a holdover from previous years when a generation station actually used the water. He indicated that the generating station had been deactivated for some time with no plans to reactivate and recommended that the future demand be set to zero. RWPG members also indicated that the Summit Texas Clean Energy LLC's new 400MW power/poly‐gen coal‐fired plant to be constructed beginning in July 2012 in Ector County increase water demand by about 4 million gallons per day. It does appear that the TWDB demand projects do increase over time to account for that need and therefore, we are not recommending any changes for Ector County.
c. Results – Steam electric power demand estimates are very similar to 2012 SWP projections and increase slightly over the planning period.
d. Recommendation – Modify steam electric power demands and set Tom Green County power demand to zero for the future.

E-mail from the TWDB regarding requested changes to livestock demands From: Doug Shaw [mailto:[email protected]] Sent: Monday, February 11, 2013 1:32 PM To: [email protected] Cc: Simone Kiel Subject: Region F livestock I just wanted to let y’all know that I was just informed that the TWDB would not approve the 10% increase to county livestock demands for exotics/wildlife. I have mentioned that an increase for wildlife was factored into livestock demands for the last two rounds of planning, however the response I received was that the TWDB would be receptive to a more current count of “confined” animals and would be willing to consider approving demands related to those estimates (the current data used is from 1995 and I believe includes all animals in a county not just those behind a game fence). Doug (512) 463-1711

Region County 2020 2030 2040 2050 2060 2070 Region County 2020 2030 2040 2050 2060 2070 Region County 2020 2030 2040 2050 2060 2070F Andrews 30,485 30,229 29,971 29,715 29,459 29,213 F Andrews 37,898 37,579 37,258 36,939 36,621 36,306 F Andrews 37,898 37,579 37,258 36,939 36,621 36,306F Borden 2,740 2,735 2,733 2,728 2,726 2,723 F Borden 4,000 3,993 3,990 3,983 3,980 3,977 F Borden 4,000 3,993 3,990 3,983 3,980 3,977F Brown 7,782 7,755 7,729 7,702 7,676 7,650 F Brown 9,435 9,403 9,371 9,338 9,306 9,275 F Brown 9,435 9,403 9,371 9,338 9,306 9,275F Coke 691 690 689 689 689 689 F Coke 965 963 962 962 962 962 F Coke 965 963 962 962 962 962F Coleman 597 597 597 597 597 597 F Coleman 770 770 770 770 770 770 F Coleman 770 770 770 770 770 770F Concho 5,756 5,732 5,709 5,687 5,665 5,643 F Concho 9,734 9,693 9,654 9,618 9,582 9,546 F Concho 9,734 9,693 9,654 9,618 9,582 9,546F Crane 0 0 0 0 0 0 F Crane 0 0 0 0 0 0 F Crane 0 0 0 0 0 0F Crockett 327 321 315 311 305 0 F Crockett 479 470 461 455 446 437 F Crockett 479 470 461 455 446 437F Ector 1,015 1,003 991 979 967 956 F Ector 1,432 1,415 1,397 1,380 1,362 1,345 F Ector 1,432 1,415 1,397 1,380 1,362 1,345F Glasscock 43,123 42,777 42,430 42,082 41,739 41,406 F Glasscock 56,707 56,252 55,796 55,339 54,887 54,439 F Glasscock 56,707 56,252 55,796 55,339 54,887 54,439F Howard 4,712 4,658 4,603 4,549 4,495 4,444 F Howard 6,722 6,645 6,567 6,490 6,413 6,337 F Howard 6,722 6,645 6,567 6,490 6,413 6,337F Irion 930 910 889 869 849 831 F Irion 1,467 1,435 1,402 1,370 1,338 1,307 F Irion 1,467 1,435 1,402 1,370 1,338 1,307F Kimble 2,516 2,423 2,327 2,231 2,141 2,064 F Kimble 2,939 2,830 2,718 2,606 2,501 2,400 F Kimble 2,939 2,830 2,718 2,606 2,501 2,400F Loving 0 0 0 0 0 0 F Loving 0 0 0 0 0 0 F Loving 0 0 0 0 0 0F Martin 24,287 23,854 23,421 22,990 22,565 22,172 F Martin 36,322 35,674 35,026 34,381 33,746 33,123 F Martin 36,322 35,674 35,026 34,381 33,746 33,123F Mason 6,085 5,997 5,909 5,821 5,734 5,652 F Mason 8,294 8,174 8,054 7,935 7,816 7,699 F Mason 8,294 8,174 8,054 7,935 7,816 7,699F Mcculloch 2,634 2,601 2,567 2,534 2,502 2,471 F Mcculloch 3,584 3,539 3,493 3,448 3,404 3,361 F Mcculloch 3,584 3,539 3,493 3,448 3,404 3,361F Menard 1,810 1,804 1,798 1,791 1,785 1,779 F Menard 2,530 2,522 2,514 2,505 2,497 2,489 F Menard 2,530 2,522 2,514 2,505 2,497 2,489F Midland 24,681 24,488 24,295 24,101 23,910 23,724 F Midland 33,276 33,016 32,756 32,495 32,237 31,981 F Midland 33,276 33,016 32,756 32,495 32,237 31,981F Mitchell 8,513 8,470 8,428 8,386 8,344 8,303 F Mitchell 11,519 11,460 11,404 11,348 11,292 11,236 F Mitchell 11,519 11,460 11,404 11,348 11,292 11,236F Pecos 64,619 63,593 62,566 61,540 60,531 59,588 F Pecos 126,023 126,023 126,023 126,023 126,023 126,023 F Pecos 126,023 126,023 126,023 126,023 126,023 126,023F Reagan 16,550 16,272 15,993 15,715 15,441 15,186 F Reagan 19,130 18,808 18,486 18,164 17,848 17,537 F Reagan 19,130 18,808 18,486 18,164 17,848 17,537F Reeves 65,500 64,940 64,379 63,819 63,265 62,730 F Reeves 91,357 90,577 89,795 89,015 88,242 87,475 F Reeves 91,357 90,577 89,795 89,015 88,242 87,475F Runnels 3,259 3,245 3,231 3,217 3,203 3,190 F Runnels 4,009 3,991 3,973 3,955 3,937 3,919 F Runnels 4,009 3,991 3,973 3,955 3,937 3,919F Schleicher 940 920 901 881 862 845 F Schleicher 1,414 1,385 1,356 1,327 1,298 1,270 F Schleicher 1,414 1,385 1,356 1,327 1,298 1,270F Scurry 5,188 5,011 4,834 4,657 4,487 4,340 F Scurry 7,305 7,056 6,806 6,557 6,318 6,088 F Scurry 7,305 7,056 6,806 6,557 6,318 6,088F Sterling 683 654 625 596 569 546 F Sterling 983 942 901 860 820 782 F Sterling 983 942 901 860 820 782F Sutton 1,195 1,171 1,148 1,124 1,101 1,080 F Sutton 1,803 1,767 1,733 1,697 1,663 1,629 F Sutton 1,803 1,767 1,733 1,697 1,663 1,629F Tom Green 68,892 68,724 68,556 68,385 68,217 68,050 F Tom Green 93,579 93,350 93,121 92,889 92,660 92,432 F Tom Green 93,579 93,350 93,121 92,889 92,660 92,432F Upton 7,350 7,245 7,139 7,033 6,929 6,831 F Upton 9,473 9,338 9,202 9,066 8,932 8,800 F Upton 9,473 9,338 9,202 9,066 8,932 8,800F Ward 4,052 4,001 3,950 3,900 3,850 3,803 F Ward 5,613 5,543 5,473 5,403 5,334 5,266 F Ward 5,613 5,543 5,473 5,403 5,334 5,266F Winkler 3,435 3,435 3,435 3,435 3,435 3,435 F Winkler 4,912 4,912 4,912 4,912 4,912 4,912 F Winkler 4,912 4,912 4,912 4,912 4,912 4,912F TOTAL 410,347 406,255 402,158 398,064 394,038 389,941 F TOTAL 593,674 589,525 585,374 581,230 577,147 573,123 F TOTAL 593,674 589,525 585,374 581,230 577,147 573,123
TWDB Draft Irrigation Projections for 2017 SWP Accepted Revision Requests by RWPGs Finalized Projections for 2017 SWP

Region County 2020 2030 2040 2050 2060 2070 Region County 2020 2030 2040 2050 2060 2070 Region County 2020 2030 2040 2050 2060 2070F Andrews 49 52 55 58 62 66 F Andrews F Andrews 49 52 55 58 62 66F Borden 0 0 0 0 0 0 F Borden F Borden 0 0 0 0 0 0F Brown 673 726 777 820 886 957 F Brown F Brown 673 726 777 820 886 957F Coke 0 0 0 0 0 0 F Coke F Coke 0 0 0 0 0 0F Coleman 9 9 9 9 9 9 F Coleman F Coleman 9 9 9 9 9 9F Concho 0 0 0 0 0 0 F Concho F Concho 0 0 0 0 0 0F Crane 0 0 0 0 0 0 F Crane F Crane 0 0 0 0 0 0F Crockett 0 0 0 0 0 0 F Crockett F Crockett 0 0 0 0 0 0F Ector 3,454 3,643 3,809 3,936 4,070 4,209 F Ector F Ector 3,454 3,643 3,809 3,936 4,070 4,209F Glasscock 0 0 0 0 0 0 F Glasscock F Glasscock 0 0 0 0 0 0F Howard 2,748 2,872 2,994 3,097 3,290 3,495 F Howard F Howard 2,748 2,872 2,994 3,097 3,290 3,495F Irion 0 0 0 0 0 0 F Irion F Irion 0 0 0 0 0 0F Kimble 701 752 804 852 916 985 F Kimble F Kimble 701 752 804 852 916 985F Loving 0 0 0 0 0 0 F Loving F Loving 0 0 0 0 0 0F Martin 41 42 43 44 47 50 F Martin F Martin 41 42 43 44 47 50F Mason 0 0 0 0 0 0 F Mason F Mason 0 0 0 0 0 0F Mcculloch 500 540 578 611 663 719 F Mcculloch F Mcculloch 500 540 578 611 663 719F Menard 3 3 3 3 3 3 F Menard F Menard 3 3 3 3 3 3F Midland 230 250 269 285 309 335 F Midland F Midland 230 250 269 285 309 335F Mitchell 0 0 0 0 0 0 F Mitchell F Mitchell 0 0 0 0 0 0F Pecos 103 103 103 103 103 103 F Pecos F Pecos 103 103 103 103 103 103F Reagan 0 0 0 0 0 0 F Reagan F Reagan 0 0 0 0 0 0F Reeves 197 201 205 208 220 233 F Reeves F Reeves 197 201 205 208 220 233F Runnels 48 52 56 59 64 69 F Runnels F Runnels 48 52 56 59 64 69F Schleicher 0 0 0 0 0 0 F Schleicher F Schleicher 0 0 0 0 0 0F Scurry 3 3 3 3 3 3 F Scurry F Scurry 3 3 3 3 3 3F Sterling 0 0 0 0 0 0 F Sterling F Sterling 0 0 0 0 0 0F Sutton 0 0 0 0 0 0 F Sutton F Sutton 0 0 0 0 0 0F Tom Green 2,387 2,615 2,839 3,034 3,273 3,531 F Tom Green F Tom Green 2,387 2,615 2,839 3,034 3,273 3,531F Upton 0 0 0 0 0 0 F Upton F Upton 0 0 0 0 0 0F Ward 16 16 16 16 16 16 F Ward F Ward 16 16 16 16 16 16F Winkler 0 0 0 0 0 0 F Winkler F Winkler 0 0 0 0 0 0F TOTAL 11,162 11,879 12,563 13,138 13,934 14,783 F TOTAL F TOTAL 11,162 11,879 12,563 13,138 13,934 14,783
TWDB Draft Manufacturing Projections for 2017 SWP Accepted Revision Requests by RWPGs Finalized Projections for 2017 SWP
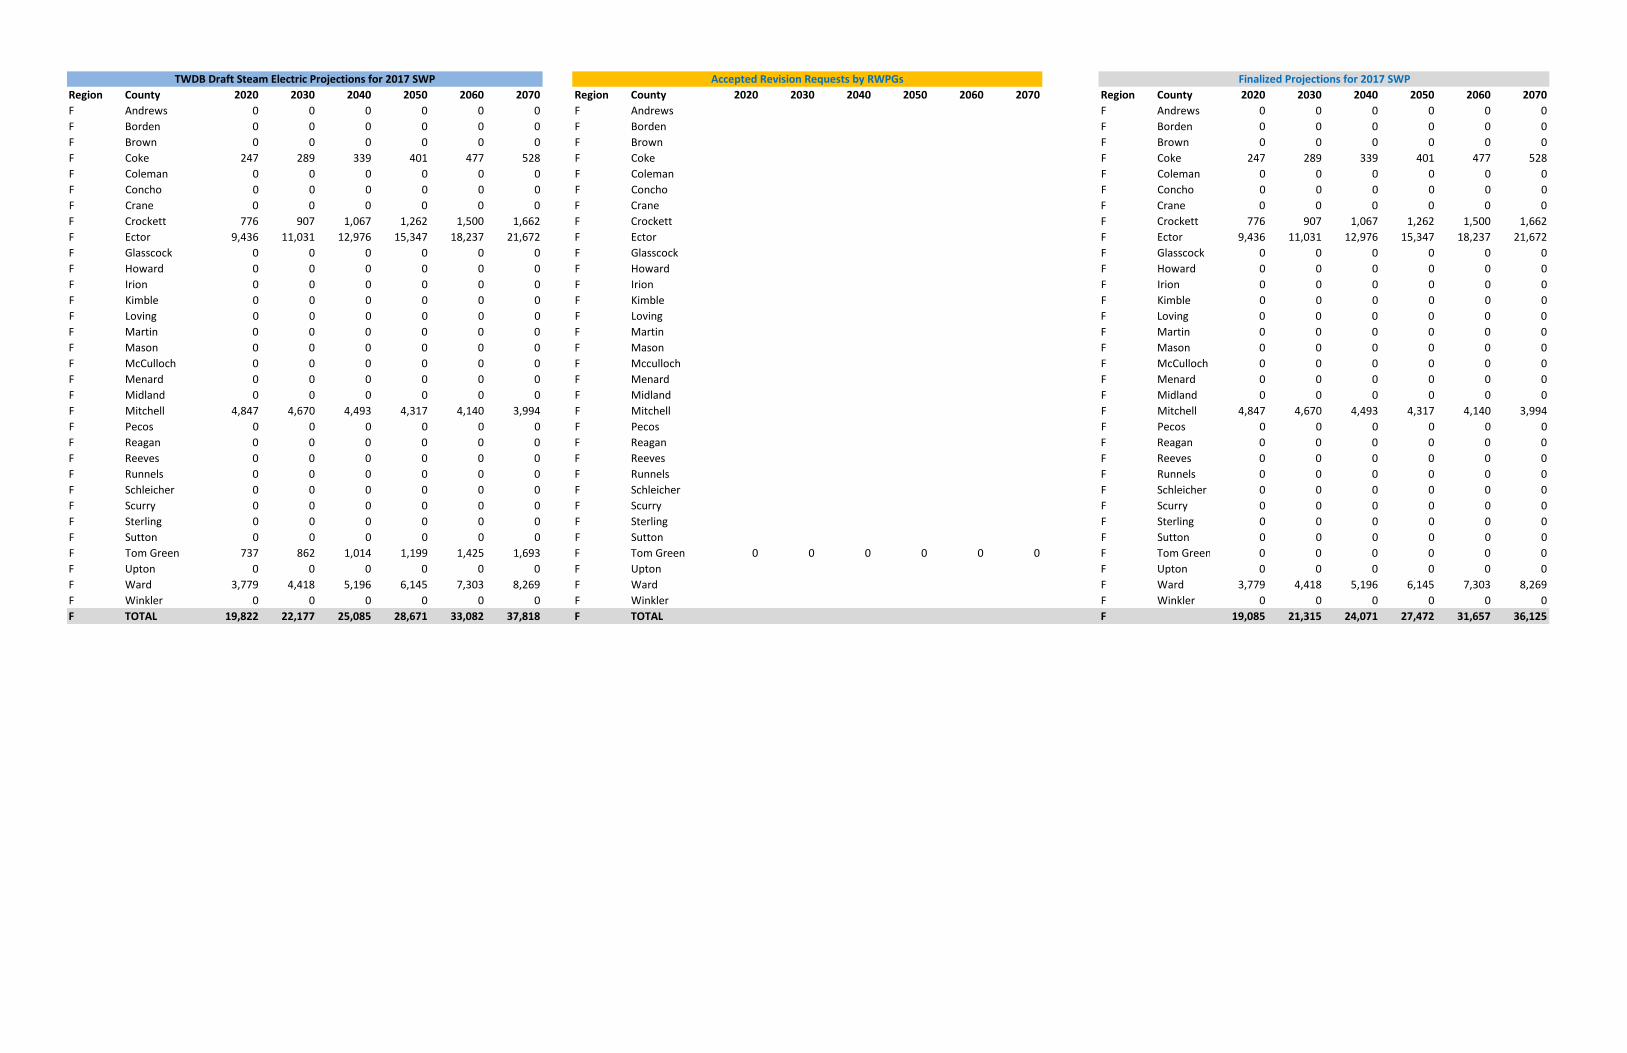
Region County 2020 2030 2040 2050 2060 2070 Region County 2020 2030 2040 2050 2060 2070 Region County 2020 2030 2040 2050 2060 2070F Andrews 0 0 0 0 0 0 F Andrews F Andrews 0 0 0 0 0 0F Borden 0 0 0 0 0 0 F Borden F Borden 0 0 0 0 0 0F Brown 0 0 0 0 0 0 F Brown F Brown 0 0 0 0 0 0F Coke 247 289 339 401 477 528 F Coke F Coke 247 289 339 401 477 528F Coleman 0 0 0 0 0 0 F Coleman F Coleman 0 0 0 0 0 0F Concho 0 0 0 0 0 0 F Concho F Concho 0 0 0 0 0 0F Crane 0 0 0 0 0 0 F Crane F Crane 0 0 0 0 0 0F Crockett 776 907 1,067 1,262 1,500 1,662 F Crockett F Crockett 776 907 1,067 1,262 1,500 1,662F Ector 9,436 11,031 12,976 15,347 18,237 21,672 F Ector F Ector 9,436 11,031 12,976 15,347 18,237 21,672F Glasscock 0 0 0 0 0 0 F Glasscock F Glasscock 0 0 0 0 0 0F Howard 0 0 0 0 0 0 F Howard F Howard 0 0 0 0 0 0F Irion 0 0 0 0 0 0 F Irion F Irion 0 0 0 0 0 0F Kimble 0 0 0 0 0 0 F Kimble F Kimble 0 0 0 0 0 0F Loving 0 0 0 0 0 0 F Loving F Loving 0 0 0 0 0 0F Martin 0 0 0 0 0 0 F Martin F Martin 0 0 0 0 0 0F Mason 0 0 0 0 0 0 F Mason F Mason 0 0 0 0 0 0F McCulloch 0 0 0 0 0 0 F Mcculloch F McCulloch 0 0 0 0 0 0F Menard 0 0 0 0 0 0 F Menard F Menard 0 0 0 0 0 0F Midland 0 0 0 0 0 0 F Midland F Midland 0 0 0 0 0 0F Mitchell 4,847 4,670 4,493 4,317 4,140 3,994 F Mitchell F Mitchell 4,847 4,670 4,493 4,317 4,140 3,994F Pecos 0 0 0 0 0 0 F Pecos F Pecos 0 0 0 0 0 0F Reagan 0 0 0 0 0 0 F Reagan F Reagan 0 0 0 0 0 0F Reeves 0 0 0 0 0 0 F Reeves F Reeves 0 0 0 0 0 0F Runnels 0 0 0 0 0 0 F Runnels F Runnels 0 0 0 0 0 0F Schleicher 0 0 0 0 0 0 F Schleicher F Schleicher 0 0 0 0 0 0F Scurry 0 0 0 0 0 0 F Scurry F Scurry 0 0 0 0 0 0F Sterling 0 0 0 0 0 0 F Sterling F Sterling 0 0 0 0 0 0F Sutton 0 0 0 0 0 0 F Sutton F Sutton 0 0 0 0 0 0F Tom Green 737 862 1,014 1,199 1,425 1,693 F Tom Green 0 0 0 0 0 0 F Tom Green 0 0 0 0 0 0F Upton 0 0 0 0 0 0 F Upton F Upton 0 0 0 0 0 0F Ward 3,779 4,418 5,196 6,145 7,303 8,269 F Ward F Ward 3,779 4,418 5,196 6,145 7,303 8,269F Winkler 0 0 0 0 0 0 F Winkler F Winkler 0 0 0 0 0 0F TOTAL 19,822 22,177 25,085 28,671 33,082 37,818 F TOTAL F 19,085 21,315 24,071 27,472 31,657 36,125
TWDB Draft Steam Electric Projections for 2017 SWP Accepted Revision Requests by RWPGs Finalized Projections for 2017 SWP

County 2020 2030 2040 2050 2060 2070 County 2020 2030 2040 2050 2060 2070 County All Decades County 2020 2030 2040 2050 2060 2070Andrews 258 258 258 258 258 258 Andrews 325 325 325 325 325 325 Andrews 0 Andrews 325 325 325 325 325 325 Borden 242 242 242 242 242 242 Borden 266 266 266 266 266 266 Borden 16 Borden 250 250 250 250 250 250 Brown 1,294 1,294 1,294 1,294 1,294 1,294 Brown 1,381 1,381 1,381 1,381 1,381 1,381 Brown 28 Brown 1,353 1,353 1,353 1,353 1,353 1,353 Coke 349 349 349 349 349 349 Coke 454 454 454 454 454 454 Coke 23 Coke 431 431 431 431 431 431 Coleman 918 918 918 918 918 918 Coleman 1,108 1,108 1,108 1,108 1,108 1,108 Coleman 32 Coleman 1,076 1,076 1,076 1,076 1,076 1,076 Concho 543 543 543 543 543 543 Concho 750 750 750 750 750 750 Concho 51 Concho 699 699 699 699 699 699 Crane 111 111 111 111 111 111 Crane 172 172 172 172 172 172 Crane 0 Crane 172 172 172 172 172 172 Crockett 658 658 658 658 658 658 Crockett 820 820 820 820 820 820 Crockett 139 Crockett 681 681 681 681 681 681 Ector 256 256 256 256 256 256 Ector 265 265 265 265 265 265 Ector 0 Ector 265 265 265 265 265 265 Glasscock 182 182 182 182 182 182 Glasscock 279 279 279 279 279 279 Glasscock 17 Glasscock 262 262 262 262 262 262 Howard 236 236 236 236 236 236 Howard 326 326 326 326 326 326 Howard 10 Howard 316 316 316 316 316 316 Irion 236 236 236 236 236 236 Irion 309 309 309 309 309 309 Irion 41 Irion 268 268 268 268 268 268 Kimble 367 367 367 367 367 367 Kimble 525 525 525 525 525 525 Kimble 123 Kimble 402 402 402 402 402 402 Loving 66 66 66 66 66 66 Loving 101 101 101 101 101 101 Loving 0 Loving 101 101 101 101 101 101 Mcculloch 177 177 177 177 177 177 Mcculloch 772 772 772 772 772 772 Mcculloch 58 Mcculloch 714 714 714 714 714 714 Martin 954 954 954 954 954 954 Martin 129 129 129 129 129 129 Martin 1 Martin 128 128 128 128 128 128 Mason 752 752 752 752 752 752 Mason 1,349 1,349 1,349 1,349 1,349 1,349 Mason 101 Mason 1,248 1,248 1,248 1,248 1,248 1,248 Menard 385 385 385 385 385 385 Menard 479 479 479 479 479 479 Menard 71 Menard 408 408 408 408 408 408 Midland 326 326 326 326 326 326 Midland 400 400 400 400 400 400 Midland 6 Midland 394 394 394 394 394 394 Mitchell 344 344 344 344 344 344 Mitchell 431 431 431 431 431 431 Mitchell 18 Mitchell 413 413 413 413 413 413 Pecos 812 812 812 812 812 812 Pecos 962 962 962 962 962 962 Pecos 30 Pecos 932 932 932 932 932 932 Reagan 192 192 192 192 192 192 Reagan 271 271 271 271 271 271 Reagan 16 Reagan 255 255 255 255 255 255 Reeves 643 643 643 643 643 643 Reeves 862 862 862 862 862 862 Reeves 0 Reeves 862 862 862 862 862 862 Runnels 820 820 820 820 820 820 Runnels 891 891 891 891 891 891 Runnels 11 Runnels 880 880 880 880 880 880 Schleicher 510 510 510 510 510 510 Schleicher 627 627 627 627 627 627 Schleicher 92 Schleicher 535 535 535 535 535 535 Scurry 461 461 461 461 461 461 Scurry 513 513 513 513 513 513 Scurry 9 Scurry 504 504 504 504 504 504 Sterling 291 291 291 291 291 291 Sterling 356 356 356 356 356 356 Sterling 34 Sterling 322 322 322 322 322 322 Sutton 425 425 425 425 425 425 Sutton 601 601 601 601 601 601 Sutton 122 Sutton 479 479 479 479 479 479 Tom Green 1,461 1,461 1,461 1,461 1,461 1,461 Tom Green 1,748 1,748 1,748 1,748 1,748 1,748 Tom Green 60 Tom Green 1,688 1,688 1,688 1,688 1,688 1,688 Upton 115 115 115 115 115 115 Upton 146 146 146 146 146 146 Upton 27 Upton 119 119 119 119 119 119 Ward 87 87 87 87 87 87 Ward 109 109 109 109 109 109 Ward 0 Ward 109 109 109 109 109 109 Winkler 151 151 151 151 151 151 Winkler 351 351 351 351 351 351 Winkler 0 Winkler 351 351 351 351 351 351 Total 14,622 14,622 14,622 14,622 14,622 14,622 Total 18,076 18,076 18,076 18,076 18,076 18,076 Total 1,136 Total 16,940 16,940 16,940 16,940 16,940 16,940
RWPG 9/5/12 Revision Requests (Includes Exotic/Wildlife Demand) RWPG New Revision Requests (No Exotic/Wildlife Demand)RWPG Exotic/Wildlife DemandsTWDB Draft Livestock for 2017 SWP Projections

Region County 2020 2030 2040 2050 2060 2070 Region County 2020 2030 2040 2050 2060 2070 Region County 2020 2030 2040 2050 2060 2070F Andrews 3,959 3,710 3,177 2,509 1,929 1,483F Borden 679 927 784 494 244 121F Brown 943 948 951 952 948 944F Coke 488 482 430 376 328 286F Coleman 108 107 97 86 77 69F Concho 480 474 422 367 320 279F Crane 617 840 861 692 531 407F Crockett 1,732 1,843 1,261 682 207 63F Ector 1,977 2,164 1,926 1,574 1,272 1,076F Glasscock 3,423 3,101 2,384 1,679 1,100 798F Howard 2,491 2,747 1,940 1,138 476 199F Irion 3,192 3,357 2,423 1,487 713 342F Kimble 19 19 19 19 19 19F Loving 792 1,058 934 762 601 474F Martin 3,527 2,998 2,251 1,441 771 413F Mason 1,023 941 708 568 460 372F McCulloch 8,927 8,347 6,641 5,627 4,836 4,201F Menard 1,086 1,071 952 827 717 622F Midland 3,893 3,418 2,630 1,774 1,056 743F Mitchell 593 738 632 493 375 290F Pecos 690 1,068 1,072 861 672 524F Reagan 4,211 3,395 2,457 1,406 529 199F Reeves 1,531 2,632 2,537 2,068 1,632 1,288F Runnels 272 269 240 210 184 161F Schleicher 621 732 562 392 241 148F Scurry 280 456 483 363 246 167F Sterling 780 953 812 522 270 140F Sutton 446 720 763 573 389 264F Tom Green 1,056 1,080 1,119 1,112 1,134 1,156F Upton 4,237 3,634 2,873 1,926 1,150 803F Ward 797 964 840 645 458 329F Winkler 787 1,169 991 756 531 373F TOTAL 55,657 56,362 46,172 34,381 24,416 18,753
TWDB Draft Mining Projections for 2017 SWP Revision Requests by RWPGs Finalized Projections for 2017 SWP

County WF‐fresh WF‐brackish HF‐both Drilling‐freshCrushed
Stone
Sand and
GravelInd. Sand
2020 2020 2020 2020 2020 2020 2020
Andrews 117 1534 2,140 164 3955
Borden 0 0 638 39 0 677
Brown 1 19 0 13 909 942
Coke 33 438 0 12 4 487
Coleman 6 84 0 17 107
Concho 33 434 0 13 480
Crane 8 106 438 63 615
Crockett 2 26 1,636 66 1730
Ector 6 75 1,340 113 440 1974
Glasscock 26 341 2,621 67 366 3421
Howard 4 56 2,360 68 2488
Irion 51 676 2,429 35 3191
Kimble 0 0 0 17 17
Loving 23 297 418 54 792
Martin 26 337 3,071 91 3525
Mason 0 0 0 1020 1020
McCulloch 3 35 0 1201 7690 8929
Menard 76 998 0 12 1086
Midland 11 141 3,265 102 371 3890
Mitchell 1 11 317 30 232 591
Pecos 20 262 173 233 688
Reagan 7 94 4,019 88 4208
Reeves 6 75 1,155 278 11 1525
Runnels 18 240 0 14 272
Schleicher 9 118 468 26 621
Scurry 0 0 249 31 280
Sterling 2 29 707 40 778
Sutton 0 6 390 48 444
Tom Green 3 45 0 21 987 1056
Upton 0 2 3,728 153 350 4233
Ward 1 12 683 77 22 795
Winkler 7 88 618 72 785
Data from BEG June 2011 report and Updated BEG September 2012 report.
Oil and Gas AggregateTotals
(ac‐ft)
Region F 2020 Mining Projections

County WF‐fresh WF‐brackish HF‐both Drilling‐freshCrushed
Stone
Sand and
GravelInd. Sand
Andrews 73 1556 1,965 113 3707
Borden 0 0 899 27 0 926
Brown 1 19 0 13 915 948
Coke 21 444 0 13 5 483
Coleman 4 85 0 18 107
Concho 21 440 0 13 474
Crane 5 108 681 45 839
Crockett 1 27 1,760 54 1842
Ector 4 77 1,529 79 474 2163
Glasscock 16 346 2,311 43 383 3099
Howard 3 57 2,642 43 2745
Irion 32 685 2,613 26 3356
Kimble 0 0 0 17 17
Loving 14 301 704 38 1057
Martin 16 342 2,577 61 2996
Mason 0 0 0 940 940
McCulloch 2 36 0 1237 7070 8345
Menard 47 1012 0 12 1071
Midland 7 143 2,803 70 393 3416
Mitchell 1 11 476 22 227 737
Pecos 12 266 601 185 1064
Reagan 4 96 3,236 56 3392
Reeves 4 76 2,333 200 13 2626
Runnels 11 243 0 14 268
Schleicher 6 120 584 22 732
Scurry 0 0 432 23 455
Sterling 1 29 893 28 951
Sutton 0 6 677 35 718
Tom Green 2 45 0 21 1012 1080
Upton 0 2 3,156 103 369 3630
Ward 1 12 871 55 23 962
Winkler 4 89 1,024 50 1167
Data from BEG June 2011 report and Updated BEG September 2012 report.
Totals (ac‐
ft)
Region F 2030 Mining Projections
Oil and Gas Aggregate

County WF‐fresh WF‐brackish HF‐both Drilling‐freshCrushed
Stone
Sand and
GravelInd. Sand
Andrews 63 1381 1,654 76 3174
Borden 0 0 764 19 0 783
Brown 1 17 0 13 920 951
Coke 18 394 0 13 5 430
Coleman 3 76 0 18 97
Concho 18 390 0 13 421
Crane 4 96 729 31 860
Crockett 1 24 1,190 46 1261
Ector 3 68 1,309 53 491 1924
Glasscock 14 307 1,646 26 390 2383
Howard 2 51 1,859 26 1938
Irion 28 609 1,766 20 2423
Kimble 0 0 0 17 17
Loving 12 267 627 26 932
Martin 14 303 1,892 40 2249
Mason 0 0 0 710 710
McCulloch 1 32 0 1285 5320 6638
Menard 41 899 0 12 952
Midland 6 127 2,045 47 403 2628
Mitchell 0 10 381 17 223 631
Pecos 11 236 674 148 1069
Reagan 4 85 2,332 34 2455
Reeves 3 68 2,304 142 15 2532
Runnels 10 216 0 14 240
Schleicher 5 106 430 20 561
Scurry 0 0 466 17 483
Sterling 1 26 765 20 812
Sutton 0 5 730 27 762
Tom Green 2 40 0 21 1056 1119
Upton 0 2 2,398 67 403 2870
Ward 0 11 764 38 25 838
Winkler 4 79 873 34 990
Data from BEG June 2011 report and updated BEG September 2012 report.
Oil and Gas AggregateTotals (ac‐
ft)
Region F 2040 Mining Projections

County WF‐fresh WF‐brackish HF‐both Drilling‐freshCrushed
Stone
Sand and
GravelInd. Sand
Andrews 55 1197 1,207 48 2507
Borden 0 0 480 14 0 494
Brown 1 15 0 13 923 952
Coke 16 342 0 13 6 377
Coleman 3 66 0 18 87
Concho 15 338 0 14 367
Crane 4 83 583 20 690
Crockett 1 21 620 40 682
Ector 3 59 959 33 518 1572
Glasscock 12 266 980 15 404 1677
Howard 2 44 1,076 15 1137
Irion 24 528 920 15 1487
Kimble 0 0 0 17 17
Loving 11 232 502 17 762
Martin 12 263 1,141 24 1440
Mason 0 0 0 570 570
McCulloch 1 28 0 1325 4270 5624
Menard 35 779 0 12 826
Midland 5 110 1,205 29 424 1773
Mitchell 0 9 286 13 184 492
Pecos 9 205 528 116 858
Reagan 3 74 1,308 20 1405
Reeves 3 59 1,893 94 16 2065
Runnels 9 187 0 14 210
Schleicher 4 92 277 19 392
Scurry 0 0 349 13 362
Sterling 1 22 484 14 521
Sutton 0 5 547 21 573
Tom Green 2 35 0 21 1054 1112
Upton 0 1 1,455 40 427 1923
Ward 0 9 581 26 28 644
Winkler 3 69 661 22 755
Data from BEG June 2011 report and updated BEG September 2012 report.
Oil and Gas AggregateTotals (ac‐
ft)
Region F 2050 Mining Projections

County WF‐fresh WF‐brackish HF‐both Drilling‐freshCrushed
Stone
Sand and
GravelInd. Sand
Andrews 47 1036 806 40 1929
Borden 0 0 230 13 0 243
Brown 1 13 0 13 921 948
Coke 13 296 0 13 6 328
Coleman 3 57 0 18 78
Concho 13 293 0 14 320
Crane 3 72 438 18 531
Crockett 1 18 149 40 208
Ector 2 51 644 28 547 1272
Glasscock 10 230 427 14 419 1100
Howard 2 38 422 14 476
Irion 21 456 221 15 713
Kimble 0 0 0 17 17
Loving 9 200 376 15 600
Martin 10 227 512 21 770
Mason 0 0 0 460 460
McCulloch 1 24 0 1352 3460 4837
Menard 31 674 0 12 717
Midland 4 95 488 24 444 1055
Mitchell 0 8 190 13 164 375
Pecos 8 177 383 103 671
Reagan 3 64 444 19 530
Reeves 2 51 1,481 79 18 1631
Runnels 7 162 0 15 184
Schleicher 4 80 140 18 242
Scurry 0 0 233 13 246
Sterling 1 19 236 14 270
Sutton 0 4 365 21 390
Tom Green 1 30 0 21 1081 1133
Upton 0 1 664 34 451 1150
Ward 0 8 398 22 29 457
Winkler 3 59 450 19 531
Data from BEG June 2011 report and updated BEG September 2012 report.
Oil and Gas AggregateTotals (ac‐
ft)
Region F 2060 Mining Projections