membrane protein - massachusetts institute of...
TRANSCRIPT

Membrane Protein • Expression • Purification• Reconstitution• Sample Preparation
• Preserving your sample
Sensitivity, Sensitivity, Sensitivity,
Tim Cross, Florida State University - if interested in help with any of the above contact us and arrange to spend a few days in my lab with people who have lots of first hand experience (i.e. not myself).
Tim Cross, National High Magnetic Field Lab - if interested in this technology - please contact myself of Bill Brey at the NHMFL.

Membrane Protein Expression and Purification Flow Chart
• Data above for Over-expression can besubstantially improved
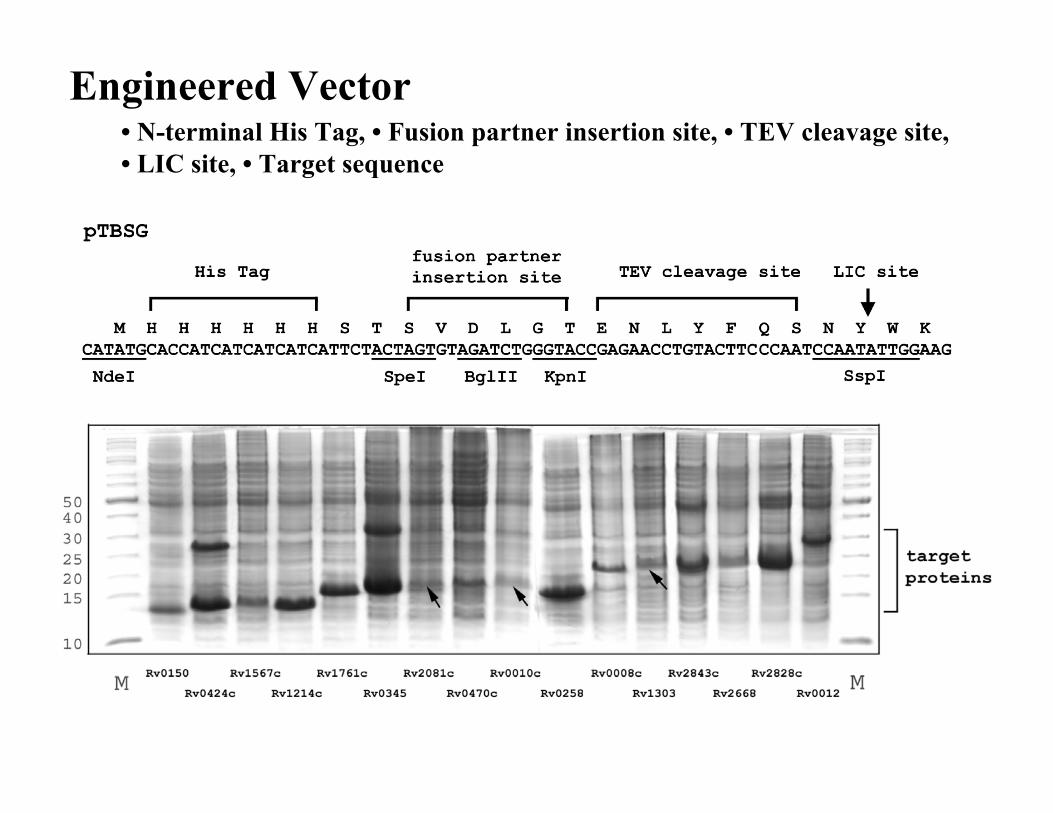
Engineered Vector• N-terminal His Tag, • Fusion partner insertion site, • TEV cleavage site,• LIC site, • Target sequence

Expression as a Function of Vector

To Illustrate Expression, Purification, and Reconstitution:Rv1861 from M. tuberculosis
11.4 kDa monomer - 101 aminoacid residues
3 putative transmembrane helicestherefore littleextramembranous protein
Forms a well defined oligomericstate on PFO gels
Has GTP binding ability andpotentially is a Molybdenumtransporter
This construct has an N-terminalHis6 tag and ampicillinresistance.

Membrane Protein Expression: I• 50 ml culture of E. coli in LB media initiated with transformed cells from a -
80°C stock (don’t let the stock thaw). Add ampicillin
• Allow the culture to grow for approximately16 hours at 37°C– Document - sample for SDS-PAGE, OD600
• Transfer 20 mL to each of two 1L of LBmedia, add ampicillin
• Grow at 37°C until an OD600 of 1.5– Document - sample for SDS-PAGE, OD600
• Harvest cells from LB media at 6000 g for 5 min, Decant supernantant andinvert centrifuge tubes on a paper towel for 2-3 min
• M9 media prepared with glucose (do not autoclave the glucose, filter thesolution)
• 30 min Prior to transfer to M9 media warm the media to 37°C
0 5 10 15 20
0
1
2
3
4
5
OD 6
00
Time (hours)

Membrane Protein Expression: II• Resuspend cells with 10 ml of M9 media. Transfer
to M9 flasks. Add ampicillin
• Grow cells at 37°C for 20-30 min– Document - sample for SDS-PAGE, OD600
• Add 0.4 mM IPTG and continue to grow at 37°C– (for some proteins need to grow cells to high OD prior to inducing)– (for some proteins growth at a lower temperature may induce proteins to
be expressed in the membrane and may result in a higher yield)
• Harvest cells when they reachmaximum OD600 (4-6) whichtakes 3-5 hours
- Document - sample for SDS-PAGE, OD600
• Collect cells as before. Scrapecells into freezer box. Cellscan be kept at -80°C for up toa month.
Lane 1: Ladder; Lane 2: Overnight Culture; Lane 3&4: LB Cultures atOD600 at 1.5; Lane 5 &6: M9 Before Induction; Lane 7&8: Harvest
0 5 10 15 200
1
2
3
4
5
Time (hours)
OD 6
00 IPTG

Membrane Protein Solubilization: I• Lysis can be done French Press or chemical means
• Calculate an appropriate Lysis Volume: LV(mL)= Culture Vol. {OD600/100}
• Thaw cells by adding buffer (20 mM TRIS pH 8.0 500mM NaCl) to the cells toa 80% of the total LV
• Homogenize the solution by passing the suspension through an 18 gaugeneedle.
• Add 10% LV in the form of a Lysis Buffer (20 mM TRIS, pH 8.0, 1% Triton,8M Urea
• Add 2 µL/L of culture volume benzonase. Add lysozyme to 0.25 mg/ml of LV
• Incubate suspension for 30 min at RT– Document - sample for SDS-PAGE
• Add Empigen 3% from 35% stock (approximately 10% of LV)– Other proteins may be better solubilized with different detergents - a detergent
screen at this point may be useful - the LV can be divided into many aliquots

Membrane Protein Purification: I
• Mix well on stir plate and incubate at 4°C for at least 12 hours– document with sample for SDS-PAGE
• Centrifuge at 12,000 g for 20 min, transfer supernatant– document supernatant with sample for SDS-PAGE
• Equilibrate AKTA column with buffer (20 mM TRIS, pH 8, 500 mM NaCl,0.7% empigen)
• Load supernatant and wash with equilibration buffer until the flow-throughhas a baseline OD280. Note the volume of flow-through
– document with sample for SDS-PAGE
• Wash column with 40mM imidazole added to the equilibration buffer untilOD280 returns to baseline
– document with sample for SDS-PAGE
• Exchange empigen for SDS.– Wash with two column volumes using 0.2% empigen in place of the 0.7% empigen
in 20 mM TRIS, pH 8.– Wash with two column volumes of 20mM TRIS, pH 8, 0.25% SDS– Document with sample for SDS-PAGE

Membrane Protein Purification: II• Elute with 20 mM TRIS, pH 8, 0.5% SDS, 500 mM imidazole. Capture the
OD280 peak in a single fraction– The amount of imidazole can vary from protein to protein– Document with sample for SDS-PAGE
Lane 1: LadderLane 2: LysateLane 3: Lysate + EmpigenLane 4: SupernatantLane 5: Flow-throughLane 6: WashLane 7 Elution
»» Note that the intensities are comparable

Membrane Protein Reconstitution: I• Transfer 8 mg Rv1861 in 0.5% SDS, 500 mM imidazole, 20 mM TRIS, pH 8 to
a tube– Document with sample for SDS-PAGE
• Add SDS to make the protein solution 2.3% (w/v) SDS. This concentration iscritical as discussed on the next slide
• Calculate the amount of lipid necessary for a 1:200 molar ratio of protein tolipid. Here we use 4:1 molar ratio of DMPC and DMPG to provide the bilayerswith significant negative charge.
• Vortex 95 mgs of lipid and 3 ml nanopure water. Bath sonicate at 35°C (abovethe gel to liquid crystalline phase transition) for 15-20 min. The solution shouldbe translucent, but not transparent.
• Add 20% SDS solution to the lipid preparation to a final concentration of2.3% (w/v). Mix the solution gently. A clear but very viscous solution results.
• Mix the Lipid and Protein solutions on a rocker at room temperature for 20min. The solution should become very fluid
– Document with sample for SDS-PAGE

Lipid Detergent Solution:
Paternostre et al., 1988Biochem. 27:2668-2677
• Lipid/Detergent solutions can be considered to have three stages- Detergent monomers are incorporated into the liposomes (extensive light
scattering)- When monomers saturate the liposomes lipids start to become integrated
into micelles (solid black arrows). Viscosity increases to this point.- When all of the lipid is integrated into micelles the light scattering plummets
(white arrows)
a. Triton X-100b. Octyl Glucosidec. Sodium Cholate
c.
b.
a.
»» In the process of mixing theLipid and Protein solutionsthe lipids becomemicellarized

Membrane Protein Reconstitution: II• Incubate the protein/lipid/SDS mixture at 37°C for 12-24 hours without
rocking or shaking
• Centrifuge 12000 g for 20 min to eliminate any precipitate. Decant supernatantimmediately
– Document with sample for SDS-PAGE
• Load sample into a 3.5 kDa dialysis bag. Dialyze at room temperature against2L of 20 mM TRIS pH 8. Change buffer twice/day and dialyze for 7-14 days.Sample should become translucent
– Amberlite or biobeads may enhance the rate of this step.
• After dialysis note the volume of the protein solution.– Document with sample for SDS-PAGE
• Centrifuge 12000 g for 20 min - there should be no precipitate. Decantsupernatant immediately
• Centrifuge 228000 g for 2 hours at 4°C to pellet the proteoliposomes. Decant.– Document that the supernatant has no protein with a sample for SDS-PAGE

Membrane Protein Reconstitution: III• Resuspend proteoliposomes in 20 mM TRIS pH 8 such that 40 µL of solution
contains 2.5 mg lipid (the amount used per glass slide)
• Centrifuge 10000 g for 20 min to eliminate any precipitate. If there is a pelletcheck via bath sonication if it goes into solution or if it is a precipitate. Do notuse proteoliposome samples containing a precipitate.
• Deposit 40 µL of proteoliposomes per slide spreading the sample out with apipet tip. Allow sample to dry overnight and then rehydrate in a humiditychamber at 98% relative humidity after stacking the slides.
The intensity of the Rv1861 bandremains constant except for the lastlane that indicates some proteinwas lost due to precipitation andconsequently the molar ratio ofprotein to lipid in greater than1:200.

Oriented Sample Preparation on Glass Substrate:General Strategy
• The basic idea for oriented sample preparation is to induce alignmentof bilayers with respect to the glass surface.– assembly of lipid molecules into a planar bilayer on the surface– annealing liposome preparations onto the surface.
• Bilayer assembly is typically not viable for proteins as opposed topeptides, so reconstitution of full length protein into liposomes isnecessary step.
• Hydrophobic peptides are usually soluble and stable in organicsolvents and relatively easily aligned in lipid bilayers by rehydrating apeptide/lipid film to induce bilayer assembly - I will not discuss thisfurther.
• Once fully hydrated the viscosity is such that alignment of the samplescan be enhanced by placing the sample in the magnetic field. It isassumed that this effect is small when very high ratios of lipid toprotein are required.

NewSampleSealingMechanism

• Glass slides ( ours are 5.7 x 11.5 mm) are washed with chloroform,methanol and water then dried in the oven.
MP Aligned Sample Preparation: I
• Measure the weight of dry stacked slides, place the sample cell in 98%humidity chamber ( saturated solution of K2SO4 ) at 37°C.
• Monitor the weight gain until it stabilizes, seal the sample cell with a glass slideand wax. Usually we hydrate our samples for 5-7 days for DMPC:DMPGmixtures.
• Well hydrated samples usually are somewhat transparent.
• Water droplets forming on the sample cell wall is an indication that there issevere sample heating taking place: The recycle delay and cooling air are notparticularly effective in controlling this problem.
• 31P is only partially effective for quality control - signals from the protein areneeded for assessing the quality of alignment.

The Precision of Time Averaged Orientational Restraints
»» 2H spectra of d5 Trp labeledgramicidin A in uniformly alignedlipid bilayer preparations.
»» The linewidths are consistentwith an orientational dispersion ofjust ±0.3° - consequently veryprecise indole orientations. This issimilar to the dispersion in proteincrystals

• Factors affecting choice of lipids:
- Lipid chain length : Hydrophobic thickness, tilt angle.
- Phase transition temperature: Protein exposure to high temperature may notbe desirable, but experiments need to be performed at temperaturehigher than Tm, adds to heat generated by high RF field.
- Ester linkages in lipids are prone to hydrolysis, for longer stability of oriented samples ether linked lipids can be used.
- Inter bilayer separation is dependent on bilayer charge and can be modulated by using ionic lipids. This inter bilayer separation plays animportant role if the protein has a large domains outside the membrane.PG appears to be helpful in a number of membrane protein preparations.
MP Aligned Sample Preparation: II

• Bilayers provide a heterogeneous environment typical of the nativemembrane.
• Bilayers provide a dielectric gradient from the lipid interfacial regionto the low dielectric at the center of the bilayer
• Bilayers provide a water concentration gradient typical of nativemembranes
• Bilayers provide a range of fluidity typical of native membranes,because sample temperatures will approximate native conditions.
• Bilayers provide a hydrophobic dimension that matches that of theprotein
Bilayers as Models of Native Membranes
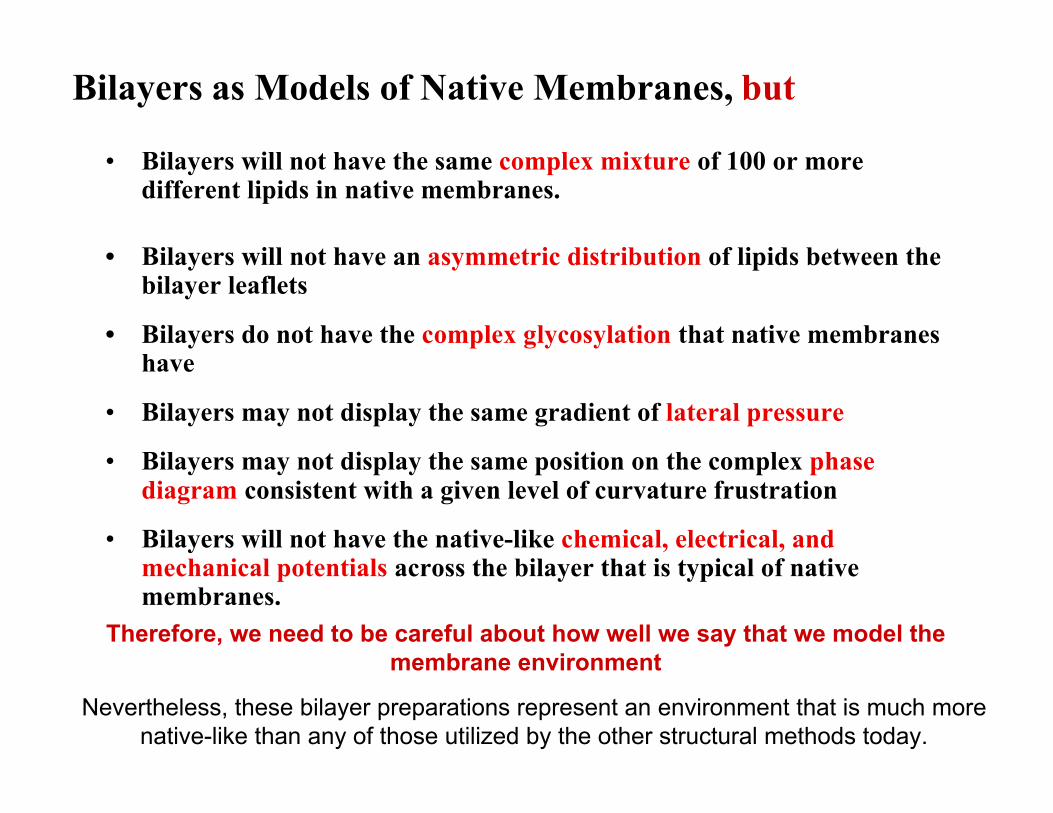
• Bilayers will not have the same complex mixture of 100 or moredifferent lipids in native membranes.
• Bilayers will not have an asymmetric distribution of lipids between thebilayer leaflets
• Bilayers do not have the complex glycosylation that native membraneshave
• Bilayers may not display the same gradient of lateral pressure
• Bilayers may not display the same position on the complex phasediagram consistent with a given level of curvature frustration
• Bilayers will not have the native-like chemical, electrical, andmechanical potentials across the bilayer that is typical of nativemembranes.
Bilayers as Models of Native Membranes, but
Therefore, we need to be careful about how well we say that we model themembrane environment
Nevertheless, these bilayer preparations represent an environment that is much morenative-like than any of those utilized by the other structural methods today.

FSU Chem & Biochem, Inst. of Mol. Biophys. Mukesh Sharma Milton Truong Dylan Murray Nabanita Das Thach Can Anna Kozlova Huajun Qin Dr. Sorin Luca Dr. Da Qun Ni Dr. Frantz Jean-FrancoisFSU Mathematics Prof. Jack Quine Prof. Richard BertramFSU Physics Myunggi Yi Prof. Huan-Xiang ZhouNHMFL Dr. Riqiang Fu Dr. William Brey Peter Gor’kovBrigham Young Univ. Prof. David BusathHamilton College Prof. Myriam Cotten
The NHMFL: A National User Facility

RF Heating of Lipid Bilayer Preparations is Particularly Significant
Dielectric Losses
Inductive Losses
• Heating is primarily from the 1H Channel• At modest ion concentrations the heating is independent of ion concentration• The heating is highly dependent on hydration• Dielectric Losses dominate Inductive Losses
Li et al., 2006 JMR 180:51; Gor’kov et al., 2007 JMR 185:77

Sample heating in solenoidsSample heating in solenoids
Temperature rise in mechanically aligned preparationTemperature rise in mechanically aligned preparation
after single after single 11H decoupling pulse: H decoupling pulse: 5050 kHz, kHz, 1010 ms longms long
∆∆T (°C)T (°C)
BB00 field (MHz) field (MHz)
S. McNeil et al., S. McNeil et al., Magn. Magn. ResonReson. Chem. . Chem. ((2007), in press2007), in press
flat coilflat coil
samplesample
»» measured usingthe indicatorTmDOTP

0
5
10
15
20
25
30
35
0 200 400 600 800 1000
Different buffer concentrationDifferent buffer concentration
NaCl NaCl concentration (mM)concentration (mM)
Sample heatSample heatabsorptionabsorption
((mW/kHzmW/kHz22))
Reduction of Reduction of 11H decoupler heatingH decoupler heating
Solenoid, 5tSolenoid, 5t
Low-E, 8tLow-E, 8t
typicaltypicalbufferbufferrangerange
Bicelle probes, 600 MHzBicelle probes, 600 MHz
Data by C. Data by C. QianQian