member of the canadian investor protection fund gold has
TRANSCRIPT

The Weekly Dig – November 17, 2017 Mick Carew, PhD [email protected]
Pierre Vaillancourt416-507-2309 [email protected] Emma Boggio, MSA, CPA, CA604-697-6166 [email protected]
Douglas Ibbitson, CFA| 416-507-2790 | [email protected] and the Haywood Mining Team
Member of the Canadian Investor Protection Fund
Please see page 43 for Analyst Certification, and pages 43 to 52 for Important Information and Legal Disclaimers, Rating Structure, and notes.
Gold Has Late Week Surge as it Nears the US$1,300 Mark
Precious Metals: Gold recorded over a US$12 gain during Friday’s trading, and encroached upon the US$1,300 mark for the first time in a month. As we head into the weekend, the precious metal is up 1.48% WoW as it finished at US$1,294 Friday afternoon, and reached its highest price since October 17th. Silver followed suit as it recorded a 1.35% increase during Friday’s trading to finish the week up 2.48% at US$17.31. Despite some midweek losses, platinum (up 2.28%) and palladium (up 0.02%) also had a positive week finishing at US$951 and US$997 per ounce, respectively.
Base Metals: The base metals were down modestly week over week, LME nickel fell the most, down 4.5% WoW, while copper and zinc were down 0.2% and 1.6% WoW, respectively. The decline in nickel marks the largest weekly loss in over two months. The decline in base metals prices was partially due to negative economic data out of China. Last week, China released industrial output, fixed asset investment and retail sales data that missed analyst expectations. According to the National Bureau of Statistics, industrial output was up 6.2% YoY in October. This was down from the 6.6% gain in September and just below analyst estimates of a 6.3% gain. The accumulated growth rate of investment in fixed assets was down to 7.3% YTD in October from the 7.5% YTD recorded in September. Among the base metals equities this week, Teck Resources was the top performer (up 2.6% WoW) following the announcement of a special $0.40/sh dividend and the announcement of a $230M share buyback. Most of the base metals equities were down this week with Imperial Metals lagging the pack down 8.2% WoW with the release of third quarter financials. Imperials results missed consensus estimates, reporting a EPS loss of $0.20 and a CFPS loss of $0.10 compared to consensus estimates of a loss of $0.12 and positive $0.07, respectively.
The Dig is intended to provide general information only and it is written for an institutional audience. It is not a solicitation for the purchase of securities, an offer of securities, or intended as investment research or advice. The information presented, while obtained from sources we believe reliable is not guaranteed against errors or omissions. For Canadian residents: Haywood Securities Inc. is a Canadian registered broker-dealer and a member of the Investment Industry Regulatory Organization of Canada, the Toronto Stock Exchange, the Toronto Venture Exchange and the Canadian Investor Protection Fund. Any Canadian client that wishes further information about anything contained herein should contact a qualified salesperson of Haywood Securities Inc. For U.S. residents: The Dig is distributed in the United States by Haywood Securities (USA) Inc.
Weekly Performance
11.4%
8.0%
7.6%
6.0%
5.9%
4.9%
4.8%
4.1%
4.1%
3.6%
TMAC Resources Inc.
Tahoe Resources Inc.
Torex Gold Resources Inc
Endeavour Mining…
Eldorado Gold Corporation
Northern Star Resources…
B2Gold Corp.
McEwen Mining Inc.
Guyana Goldfields Inc.
St Barbara Limited
Weekly Performance - Senior and Intermediate Gold Producers
15.4%
14.5%
14.3%
14.3%
14.1%
13.8%
11.5%
9.7%
9.4%
9.2%
Sihayo Gold Limited
Monarques Gold Corporation
Atacama Pacific Gold…
Atacama Pacific Gold…
Gabriel Resources Ltd.
Eastmain Resources Inc.
Sulliden Mining Capital Inc.
Dalradian Resources Inc.
Solitario Zinc Corp.
Rupert Resources Ltd.
Weekly Performance - Junior, Developer, and Exploration Gold
-0.7%-2.1%
-3.0%-3.4%-3.6%
-5.4%-6.8%
-7.5%-7.6%-7.6%
Nevsun Resources Ltd. Atalaya Mining p lc
Hudbay Minerals Inc. Capstone Mining Corp Taseko Mines Limited
Trevali Mining Corporation Imperial Metals Corporation
Copper Mountain Mining Corporation Sherritt International Corporation
First Quantum Minerals Ltd.
Weekly Performance - Base Metals Producers
Gold1.6%WoW$1,294/oz
Silver2.6%WoW$17.31/oz
$0.0
$2.0
$4.0
$6.0
$8.0
$10.0
$12.0
$14.0
$16.0
$18.0
$20.0
$1,000
$1,050
$1,100
$1,150
$1,200
$1,250
$1,300
$1,350
$1,400
17-Nov-16 17-Mar-1 7 17-Jul-17 17-Nov-17
Silv
er
Gold
Zinc-1.6%WoW$1.46/lb
Copper-0.2%WoW$3.06/lb
Nickel-4.5%WoW$5.22/lb
$3.00
$3.50
$4.00
$4.50
$5.00
$5.50
$6.00
$1.00
$1.50
$2.00
$2.50
$3.00
$3.50
17-Nov-16 17-Mar-17 17-Jul-17 17-Nov-17
Nic
kel $
/lb
Copp
er a
nd Z
inc
$/lb
S&P/TSX Diversified Metals & Mining Index
0.4%WoW
S&P/TSX Global Gold Index1.6%WoW
150
160
170
180
190
200
210
220
230
240
3,000
3,500
4,000
4,500
5,000
5,500
6,000
6,500
7,000
7,500
17-Nov-16 17-Mar-17 17-Jul-17 17-Nov-17
Glo
bal G
old
Inde
x
Div
ersi
fied
Met
als
& M
inin
g

The Weekly Dig 11/17/17
Haywood Mining [email protected] Page 2
Contents Haywood Research: The Week in Review ............................................................................................................. 3
Weekly Commodities ............................................................................................................................................ 8
Commodity Prices and Inventories ....................................................................................................................... 9
Commodity Futures and ETFs .............................................................................................................................11
Upcoming Macroeconomic News .......................................................................................................................13
Weekly Indices .....................................................................................................................................................14
Weekly Equities ....................................................................................................................................................15
Precious Metals Companies ...............................................................................................................................15
Base Metals Companies ......................................................................................................................................17
Major International Miners ................................................................................................................................18
Tables Comparables Tables: Consensus and Haywood Forecasts and Multiples, Plus Market Valuations for In Situ Resources .............................................................................................................................................................19
Precious Metals Companies ...............................................................................................................................19
Base Metals Companies ......................................................................................................................................29
Other Companies (Uranium, Diamond, Cobalt, Uranium, Coal, Iron) ................................................................35
Junior Exploration Companies Review: Performance of Companies Included in Junior X and Upcoming Catalysts ..............................................................................................................................................................................40
Haywood Metals and Currencies Forecasts .......................................................................................................42

The Weekly Dig 11/17/17
Haywood Mining [email protected] Page 3
Haywood Research: The Week in Review – Covered Companies Publications from the Haywood Research team for the week included the following for covered companies:
• Osisko Mining Inc. (OSK-T, $3.61): Drilling results
• Trek Mining Inc. (TREK-V, $1.02): Expansion permit received
• Mountain Province Diamonds Inc. (MPVD-T, $3.64): Q3/17 financials and operating summary
• RNC Minerals (RNX-T, C$0.18): Q3/17 financial results
• Trevali Mining Corporation (TV-T, C$1.43): Q3/17 financial results
• Roxgold Inc. (ROXG-T, $1.22): Q3/17 financial results
• Trevali Mining Corporation (TV-T, C$1.41): African assets show potential
• RNC Minerals (RNX-T, C$0.17): Estimate reduction
• Pure Gold Mining Inc. (PGM-V, $0.49): Drilling results
• Liberty Gold Corp. (LGD-T, $0.45): Drilling results
• Alamos Gold Inc. (AGI-T, $7.89): Acquisition approved
Osisko Mining Inc. (OSK-T, $3.61 [Buy Rating, $6.50 Target Price]) – Further Infill and Expansion Drilling at Lynx Mick Carew, PhD [email protected]; Emma Boggio, MSA, CPA, CA, [email protected]
Osisko Mining announced additional drill results from its ongoing 800,000-metre drill program at its 100% owned Windfall Lake gold project located in Urban Township, Québec. The latest drill results consist of 44 intercepts in 30 drill holes focused on infill and expansion drilling in the Lynx deposit. Currently, the Company has 24 drills active on the Windfall project.
See Haywood Securities for the full report
Trek Mining Inc. (TREK-V, $1.02 [Buy Rating, $2.80 Target Price]) – Trek Receives Expansion Permit for Aurizona and Anfield Announces Agreement to Sell Coringa Gold for US$22 Million Kerry Smith, MBA, PEng, [email protected]; Danny Ochoa, PEng, CFA, [email protected]
Trek Receives Expansion Permit for Aurizona – Trek announced receipt of the final key “Licence to Install” permit for construction of Aurizona, essentially the permit to expand the plant from 5,500 tonnes per day (tpd) to 8,000 tpd and complete construction based on the feasibility study design.
See Haywood Securities for the full report
Mountain Province Diamonds Inc. (MPVD-T, $3.64 [Buy Rating, $6.30 Target Price]) – Q3/17 Financials in Line, Debt Negotiations Remain Primary Focus Geordie Mark, PhD, FAusIMM, [email protected]; Alvin Islam, GIT, [email protected]
Q3/17 Financials and Operating Summary – Q3/17 financials seem to have bettered expectations on operating margin, but debt remains an overhang, with further updates on a resolution anticipated to be provided in coming weeks.
See Haywood Securities for the full report

The Weekly Dig 11/17/17
Haywood Mining [email protected] Page 4
RNC Minerals (RNX-T, C$0.18 [Hold Rating, $0.25 Target Price]) – First Look: Despite Production Improvement, High Costs Lead to Another Loss Pierre Vaillancourt, [email protected]; Douglas Ibbitson, CFA, [email protected]
RNC Minerals Reported Q3/17 Financial Results – Financial results disappointed once again, but production provides encouragement.
See Haywood Securities for the full report
Trevali Mining Corporation (TV-T, C$1.43 [Buy Rating, $2.30 Target Price]) – First Look: African Assets Contribute to Record Results in Q3/17 Pierre Vaillancourt, [email protected]; Douglas Ibbitson, CFA, [email protected]
Trevali Mining reported Q3/17 financial results incorporating African mines acquired on August 31, 2017. Results reflected well the contribution from African mines.
See Haywood Securities for the full report
Roxgold Inc. (ROXG-T, $1.22 [Buy Rating, $1.70 Target Price]) – Q3/17 Financials in Line on Steady Operational Performance at Yaramoko Geordie Mark, PhD, FAusIMM, [email protected]; Alvin Islam, GIT, [email protected]
Q3/17 Financials and Operations Summary – Production of 28,410 ounces of gold drove financials to remain in line with our estimates.
See Haywood Securities for the full report
Trevali Mining Corporation (TV-T, C$1.41 [Buy Rating, $2.30 Target Price]) – African Assets Show Potential Pierre Vaillancourt, [email protected]; Douglas Ibbitson, CFA, [email protected]
Trevali Mining Reported Q3/17 Financial Results – Results reflected the partial contribution from African mines, acquired on August 31.
See Haywood Securities for the full report
RNC Minerals (RNX-T, C$0.17 [Hold Rating, $0.25 Target Price]) – Reducing Estimates; Q4/17 Will Be Critical Pierre Vaillancourt, [email protected]; Douglas Ibbitson, CFA, [email protected]
RNC Minerals Reported Q3/17 Financial Results – Financial results disappointed once again, but production provides encouragement. Following Q3/17 results, we have reduced our 2017 earnings per share to a loss of $0.03 (from $0.01) and our 2017 cash flow per share to a loss of $0.02 (from $0.04).
See Haywood Securities for the full report
Pure Gold Mining Inc. (PGM-V, $0.49 [Buy Rating, $1.00 Target Price]) – Pure Gold Further Confirms and Expands Gold Mineralization at Madsen Mick Carew, PhD [email protected]; Emma Boggio, MSA, CPA, CA, [email protected]
Pure Gold released further results from its ongoing exploration program at its 100% owned Madsen gold project in the Red Lake District, Ontario. The recent results consist of underground drilling from the McVeigh and South Austin deposits.
See Haywood Securities for the full report

The Weekly Dig 11/17/17
Haywood Mining [email protected] Page 5
Liberty Gold Corp. (LGD-T, $0.45 [Buy Rating, $1.00 Target Price]) – Further Encouraging Results from the Western and Dip Slope Zones Mick Carew, PhD [email protected], Emma Boggio, MSA, CPA, CA, [email protected]
Liberty Gold announced drilling results from its 100% controlled Goldstrike oxide gold project in southwestern Utah, with the current results targeting both the Western and the Dip Slope Zone. Goldstrike is a Carlin-style, sediment-hosted gold property and was host to a past-producing mine. The historical Goldstrike mine operated from 1988 to 1994, with 209,000 ounces of gold produced from 12 shallow pits, at an average grade of 1.2 g/t gold. The newly defined Western Zone considers five targets as potentially a single linear gold zone up to 3 kilometres long. The objective of the current drill program in this area is to drill under and adjacent to four historical open pits (Covington, Moosehead, Caribou, and Beavertail) to demonstrate continuity of gold mineralization over the entire zone. The current drill results from the Western Zone are from holes drilled along the north margin of the Moosehead-Caribou pit.
See Haywood Securities for the full report
Alamos Gold Inc. (AGI-T, $7.89 [Buy Rating, $10.00 Target Price]) – Richmont Acquisition Approved Kerry Smith, MBA, PEng, [email protected]; Danny Ochoa, PEng, CFA, [email protected]
Shareholder Vote Overwhelmingly Approves Transaction…Richmont Mines Inc. (RIC-T, TENDER Rating) held a shareholder vote on the proposed acquisition by Alamos with 92.6% of the votes cast in favour of the deal. The transaction required approval by 2/3 of the votes cast by Richmont shareholders. Alamos also held a shareholder vote on the transaction, with votes cast in favour of the deal coming in at 98.5%, well above the simple majority required (50%+ 1 vote). The transaction is expected to close on November 23, 2017, subject to applicable regulatory approvals and the satisfaction of other customary conditions.
See Haywood Securities for the full report

The Weekly Dig 11/17/17
Haywood Mining [email protected] Page 6
Haywood Research: The Week in Review – Uncovered Companies News from the Junior sector this week included the following for uncovered companies:
• Plateau Uranium Inc. (PLU-V, $0.435): Drilling results • Novo Resources Corp. (NVO-V, $7.05): Site visit • K92 Mining Inc. (KNT-V): Concentrate Shipment and drill results
Mining Flashes:
Plateau Uranium Inc. (PLU-V, $0.435 [Not Rated]) – Plateau Intersects Strong Lithium and Uranium Grades in First Hole at Falchani Colin Healey, MBA, [email protected]; Aazan Habib, [email protected]
Plateau Uranium has reported promising results from the first drill hole at the Falchani target within the Chaccaconiza area, part of its Macusani Plateau uranium/lithium project, Peru, which hosts an all-categories National Instrument 43-101 uranium resource of 124 million pounds of U3O8 (225 million tonnes grading 250 parts per million U3O8), and a lithium resource of 175,740 tonnes of Li2O equivalent (140 million tonnes grading 0.126% Li2O equivalent, indicated and inferred).
See Haywood Securities for the full report
Novo Resources Corp. (NVO-V, $7.05, [Not Rated]) – Site Visit: Karratha: An Exciting and Unique Gold Discovery Mick Carew, PhD [email protected], Emma Boggio, MSA, CPA, CA, [email protected]
We recently visited Novo Resources’ (NVO-V) Karratha Gold Project in the Karratha region of Western Australia. The Novo story began on in July 2017, when Novo announced the discovery of gold nuggets from trenching at Purdy’s Reward. Since then the Company’s share price has surged from $0.96 to $7.05 today. These gold nuggets are hosted in shallow-dipping (3 to 4 degrees) conglomerate horizons at the base of the Archean Fortescue Group; importantly, these conglomerate units were previously unrecognised in the area. Following the discovery, Novo embarked on an extensive land acquisition program that has resulted in the Company holding ~10,000 km2 including several joint venture agreements.
See Haywood Securities for the full report
Other News:
K92 Mining Inc. (KNT-V, Not Rated]) – Commences Drilling at Committee Bay
Share Price: $0.52 52-week high/low: $1.17/$0.41 Average Daily Volume for the Week: 388,080 shares Market Capitalization: $82.03 million Shares Outstanding: 157.75 million Cash: $3.0 million (Oct. 2017) Date of Release: Nov. 14 & 15, 2017 On Tuesday, K92 Mining announced that the first concentrate from Kora production has been shipped to the Port of Lae, pursuant to a new offtake agreement, with the provisional payment (90% of total value of shipment) received by the Company. In the new agreement there includes a provision for the funding of US$15 million in non-dilutive financing from one of the world’s largest commodity trading groups in order to secure the long term offtake for production from the Kora Deposit. This financing is subject to a number of closing conditions, which the two parties have commenced pursuing. However,

The Weekly Dig 11/17/17
Haywood Mining [email protected] Page 7
prior to the removing of these conditions, K92 has announced that it will ship Kora concentrate under an agreement with interim provisions facilitating the same. The Company anticipates utilizing the US$15 million to target an expansion of the mining and processing rate to a level envisioned in its PEA release earlier this year. Additionally, following Tuesday’s announcement, on Wednesday the Company release drilling results from drill hole KMDD0024 which extended the known Kora mineralization in this Northern Extension over a strike length of approximately 150 metres and a dip extent of approximately 100 metres. Please see Table 1 for full results. The current Kora/Eutompi inferred resource, as defined by previous drilling to date, is 4.36 million tonnes at a grade of 7.3 g/t gold, 35 g/t silver and 2.23% Copper, or 11.2 g/t gold equivalent and is open for expansion at depth and in both directions along strike.
Table 1: Kainantu Gold Mine – Significant Intercepts from Kora Underground Diamond Drilling
Source: K92 Mining
Table 2: Kainantu Gold Mine – Collar Locations for Kora Underground Diamond Drilling
Source: K92 Mining

The Weekly Dig 11/17/17
Haywood Mining [email protected] Page 8
Weekly Commodities
PRECIOUS METALS
BASE METALS
ENERGY
Source: Haywood Securities and Bloomberg
Name Close 1Wk Δ 1 week % 1 Month % 3 Month % 6 Month % 12 Month % 5 Day Trend 52W H/L 1W H/LGold Spot 1,294 19.12 1.48% 0.7% 0.5% 2.6% 6.4% 1,358 1,294 US$/oz 1,123 1,275 Silver Spot 17.31 0.43 2.48% 1.6% 1.6% 2.4% 3.8% 18.65 17.31 US$/oz 15.19 16.88 Platinum Spot 951 21.66 2.28% 1.8% (2.4)% 0.5% 1.8% 1,045 951 US$/oz 890 927 Palladium Spot 997 0.18 0.02% 1.4% 8.0% 27.0% 36.9% 1,027 997 US$/oz 652 986
Copper Future 3.06 (0.00) (0.15)% (3.6)% 4.4% 20.6% 22.9% 3.23 3.11 US$/lb 2.45 3.04 Nickel Spot 5.22 (0.24) (4.66)% (1.6)% 7.9% 25.7% 2.8% 5.82 5.64 US$/lb 3.95 5.12 Lead Spot 1.10 (0.04) (3.72)% (2.1)% 1.4% 15.7% 12.5% 1.17 1.14 US$/lb 0.90 1.09 Zinc Spot 1.46 (0.02) (1.61)% 3.4% 5.3% 26.3% 27.8% 1.53 1.48 US$/lb 0.95 1.44 Aluminum Spot 0.95 0.00 0.10% (1.4)% 0.2% 8.6% 23.1% 0.99 0.95 US$/lb 0.77 0.93 Iron Ore Spot 62 (0.49) (0.80)% (0.0)% (17.0)% (0.9)% (12.4)% 140 79 US$/t 78 78
Newcastle Coal 90 (5.20) (5.78)% (6.8)% (4.8)% 21.4% 9.0% 99 96 US$/t 73 90 Uranium Spot 24.40 1.50 6.15% 20.2% 16.7% 12.2% 27.1% 27 24 US$/lb 18 23 WTI 57 (0.15) (0.27)% 8.6% 19.1% 12.0% 12.5% 58 57 US$/bbl 43 55 Brent 63 (0.82) (1.31)% 9.0% 23.9% 18.2% 20.6% 65 64 US$/bbl 46 61 Henry Hub 3.13 (0.08) (2.62)% 0.1% (1.7)% (10.6)% (2.3)% 3.75 3.21 US$/MMBtu 2.85 3.05

The Weekly Dig 11/17/17
Haywood Mining [email protected] Page 9
Commodities Prices and Inventories Precious Metals
Source: Haywood Securities and Bloomberg
Base Metals
Source: Haywood Securities and Bloomberg
Source: Haywood Securities
Commodities Spot Price $/oz Weekly % YTD % 1 Year %Gold $1,294.23 1.5% 12.3% 6.4%Silver $17.31 2.5% 8.7% 3.8%
Platinum $951.30 2.4% 5.3% 1.9%
Gold Spot
Si lver Spot
Platinum Spot
-5.00%
-4.00%
-3.00%
-2.00%
-1.00%
0.00%
1.00%
2.00%
3.00%
4.00%
5.00%Precious Metals Weekly Change (12 weeks)
Gold Spot Silver Spot Platinum Spot
3
Commodities LME Spot Price US$/lb Weekly % YTD % 1 Year % LME Inventory Weekly % Total (t)2 YTD %2 1 Year %2 Days of Consumption
Copper $3.06 -0.2% 22.1% 22.9% 247,700 -4.8% 620,938 11% 32% 12.7 Zinc $1.46 -1.6% 25.7% 27.8% 226,775 -3.6% 311,285 -46% -48% 10.6
Nickel $5.22 -4.5% 15.6% 2.8% 381,258 -0.3% 422,866 -9% -10% 113.7
Spot Price LME Inventory Total Inventory Excluding Bonded Warehouse Inventory
LME Copper Spot
LME Zinc Spot
LME Nickel Spot
-8.00%
-6.00%
-4.00%
-2.00%
0.00%
2.00%
4.00%
6.00%
8.00%
10.00%
12.00%Base Metals Weekly Change (12 weeks)
LME Copper Spot LME Zinc Spot LME Nickel Spot

The Weekly Dig 11/17/17
Haywood Mining [email protected] Page 10
Source: Haywood Securities and Bloomberg
0.00
0.50
1.00
1.50
2.00
2.50
3.00
3.50
0
100,000
200,000
300,000
400,000
500,000
600,000
700,000
800,000
US
$/lb
tonn
e
Note: total inventories exclude the bonded warehouse inventorySource: Bloomberg and Haywood Securities
Copper spot price and inventories
SHFE LME Inventories COMEX Copper Price
0.00
0.20
0.40
0.60
0.80
1.00
1.20
1.40
1.60
1.80
0
100,000
200,000
300,000
400,000
500,000
600,000
700,000
800,000
900,000
Note: total inventories exclude the bonded warehouse inventorySource: Bloomberg and Haywood Securities
US$
/lb
tonn
e
Zinc spot price and inventories
LME Inventory SHFE Zinc Price
0.00
1.00
2.00
3.00
4.00
5.00
6.00
7.00
8.00
0
100,000
200,000
300,000
400,000
500,000
600,000
US$
/lb
Tonn
e
Note: total inventories exclude the bonded warehouse inventorySource: Bloomberg and Haywood Securities
Nickel spot prices and inventories
LME SHFE Nickel price
0.00
0.20
0.40
0.60
0.80
1.00
1.20
1.40
0
50,000
100,000
150,000
200,000
250,000
300,000
350,000
US
$/lb
tonn
e
Note: total inventories exclude the bonded warehouse inventorySource: Bloomberg and Haywood Securities
Lead spot price and inventories
SHFE LME Inventories Lead price

The Weekly Dig 11/17/17
Haywood Mining [email protected] Page 11
Commodities and ETFs: A Week in Action Gold – 1-Year US$/oz (left) and Total ETF Holdings (right)
Spot: Gain (+1.5%) for the week
ETF Holdings: 69,420,328 ounces, up 277,748 ounces for the week
Silver – 1-Year US$/oz (left) and Total ETF Holdings (right)
Spot: Gain (+2.5%) for the week
ETF Holdings: 645,417,755 ounces, down 3,693,834 ounces for the week
Platinum – 1-Year US$/oz (left) and Total ETF Holdings (right)
Spot: Gain (+2.3%) for the week
ETF Holdings: 2,452,543 ounces, down 8,625 ounces for the week
Palladium – 1-Year US$/oz (left) and Total ETF Holdings (right)
Spot: Gain (+0.0%) for the week
ETF Holdings: 1,505,730 ounces, down 424 ounces for the week
Copper – 1-Year US$/lb (left) and LME Inventory (right)
Futures: Loss (-0.2%) for the week
LME Copper: 247,700 tonnes, down 12,450 tonnes for the week
$1,000
$1,100
$1,200
$1,300
$1,400
Nov-16 Nov-17Gold ($/oz)
Price100D MA
58
63
68
73
Nov-16 Nov-17Gold ETF Holdings (Moz)
$13.00
$16.00
$19.00
$22.00
Nov-16 Nov-17Silver ($/oz)
Price
100D MA
630
650
670
690
Nov-16 Nov-17Silver ETF Holdings (Moz)
$800
$1,000
$1,200
Nov-16 Nov-17Platinum ($/oz)
Price
100D MA
2.2
2.4
2.6
Nov-16 Nov-17Platinum ETF Holdings (Moz)
$460
$660
$860
$1,060
Nov-16 Nov-17Palladium ($/oz)
Price
100D MA
1.3
1.5
1.7
1.9
2.1
Nov-16 Nov-17Palladium ETF Holdings (Moz)
$2.00
$2.50
$3.00
$3.50
Nov-16 Nov-17Copper ($/lb)
Price
100D MA
130,000
230,000
330,000
Nov-16 Nov-17LME Copper Inventories (t)

The Weekly Dig 11/17/17
Haywood Mining [email protected] Page 12
Nickel – 1-Year US$/lb (left) and LME Inventory (right)
Spot: Loss (-4.5%) for the week
LME Nickel: 381,258 tonnes, down 1,266 tonnes for the week
Lead – 1-Year US$/lb (left) and LME Inventory (right)
Spot: Loss (-3.6%) for the week
LME Lead: 145,875 tonnes, down 825 tonnes for the week
Zinc – 1-Year US$/lb (left) and LME Inventory (right)
Spot: Loss (-1.6%) for the week
LME Zinc: 226,775 tonnes, down 8,450 tonnes for the week
Iron – 1-Year US$/t 62% Fe (left) and 1-Year US$/t Newcastle (right)
Newcastle Thermal Futures: Loss (-1.1%) for the week
62% Fe Iron Ore: Loss (-0.8%) for the week
Uranium – 1-Year US$/lb Short Term (left) and Long-term (right)
Uranium Spot: Loss (-1.2%) for the week
Uranium Long-Term: Unchanged
Source: Bloomberg, UxC Consulting, and Haywood Securities
$3.70
$4.70
$5.70
Nov-16 Nov-17Nickel ($/lb)
Price
100D MA
350,000
375,000
400,000
Nov-16 Nov-17LME Nickel Inventories (t)
$0.70
$0.90
$1.10
$1.30
Nov-16 Nov-1Lead ($/lb)
Price
100D MA
140,000
160,000
180,000
200,000
Nov-16 Nov-17LME Lead Inventories (t)
$0.90
$1.40
Nov-16 Nov-17Zinc ($/lb)
Price
100D MA
210,000
310,000
410,000
510,000
Nov-16 Nov-17LME Zinc Inventories (t)
$35
$55
$75
$95
Nov-16 Nov-1762% Iron Ore ($/t)
Price
100D MA
$50
$100
Nov-16 Nov-17Newcastle Therma Coal (USD/t)
Price
100D MA
$18
$23
$28
$33
$38
Nov-16 Uranium Spot ($/lb)
Price
100D MA
$30
$35
$40
Nov-16 Uranium Long-Term ($/lb)
Price
100D MA

The Weekly Dig 11/17/17
Haywood Mining [email protected] Page 13
Upcoming Macroeconomic News and Events
Source: Bloomberg
Date Event Period Survey Prior Relevance
United States11/20/2017 Leading Index Oct 0.60% -0.20% 8411/21/2017 Chicago Fed Nat Activity Index Oct 0.2 0.17 6511/21/2017 Existing Home Sales Oct 5.40m 5.39m 8911/22/2017 MBA Mortgage Applications 17-Nov -- 3.10% 9211/22/2017 Initial Jobless Claims 18-Nov 240k 249k 9811/22/2017 Continuing Claims 11-Nov -- 1860k 6911/22/2017 Durable Goods Orders Oct P 0.30% 2.00% 9311/22/2017 Durables Ex Transportation Oct P 0.40% 0.70% 7511/22/2017 Cap Goods Orders Nondef Ex Air Oct P 0.50% 1.70% 6111/22/2017 Cap Goods Ship Nondef Ex Air Oct P 0.30% 0.90% 6111/22/2017 Bloomberg Consumer Comfort 19-Nov -- 52.1 6911/22/2017 U. of Mich. Sentiment Nov F 98 97.8 9411/24/2017 Markit US Manufacturing PMI Nov P 55 54.6 9011/24/2017 Markit US Services PMI Nov P 55.4 55.3 7011/24/2017 Markit US Composite PMI Nov P -- 55.2 70
Date Event Period Survey Prior Relevance
Canada11/21/2017 Wholesale Trade Sales MoM Sep 0.40% 0.50% 6011/23/2017 Retail Sales MoM Sep 1.00% -0.30% 8011/23/2017 Retail Sales Ex Auto MoM Sep 1.10% -0.70% 71

The Weekly Dig 11/17/17
Haywood Mining [email protected] Page 14
Weekly Indices
Source: Bloomberg and Haywood Securities
S&P/TSX Composite Index-
0.3%WoW
S&P/TSX Global Gold Index1.6%WoW
190
191
192
193
194
195
196
197
15,700
15,750
15,800
15,850
15,900
15,950
16,000
16,050
16,100
11/13 11/17
Gol
d In
dex
Com
posi
te In
dex
S&P/TSX Composite Index-
0.3%WoW
S&P/TSX Global Base Metals Index-2.6%WoW
112
114
116
118
120
122
124
126
15,700
15,750
15,800
15,850
15,900
15,950
16,000
16,050
16,100
11/13 11/17
Base
Met
als
Inde
x
Com
posi
te In
dex
Russell 2000 Index1.2%WoW
S&P/TSX Venture Comp Index0.8%WoW
775
780
785
790
795
800
805
1,440
1,450
1,460
1,470
1,480
1,490
1,500
11/13 11/17
Russ
ell 2
000
Inde
x
Com
posi
te In
dex
2,540
2,550
2,560
2,570
2,580
2,590
2,600
11/13 11/17
S&P 500 Index-0.1%WoW
182
184
186
188
190
11/13 11/17
NYSE ARCA Exchange Gold BUGS Index0.5%WoW
610
620
630
640
11/13 11/17
NYSE Arca Gold Miners Index0.9%WoW

The Weekly Dig 11/17/17
Haywood Mining [email protected] Page 15
Weekly Equities Equity Weekly Performance – Precious Metals Companies (S&P/TSX Global Mining Index and Haywood Covered Companies)
Source: Capital IQ and Haywood Securities
14%
11%
8%
8%
6%
6%
6%
6%
5%
5%
Golden Star Resources Ltd.
TMAC Resources Inc.
Tahoe Resources Inc.
Torex Gold Resources Inc
Argonaut Gold Inc.
Endeavour Mining Corporation
Eldorado Gold Corporation
Alacer Gold Corp.
Fortuna Silver Mines Inc.
B2Gold Corp.
Top Companies
(18)%
(10)%
(9)%
(7)%
(6)%
(5)%
(5)%
(4)%
(4)%
(4)%
Asanko Gold Inc.
Seabridge Gold Inc.
Osisko Mining Inc.
Midas Gold Corp.
NovaGold Resources Inc.
Arizona Mining Inc.
Ivanhoe Mines Ltd.
Sibanye Gold Limited
Hecla Mining Company
Trek Mining Inc.
Bottom Companies
1Wk 52Wk 1Wk 52WkTicker Company Close $∆ %∆ High Low Ticker Company Close $∆ %∆ High LowTSX:AEM Agnico Eagle Mines Limited 56.92 (0.13) (0)% 68.76 46.91 TSX:LGD Liberty Gold Corp. 0.45 (0.02) (3)% 0.68 0.35 TSX:ASR Alacer Gold Corp. 2.23 0.12 6% 3.11 1.75 TSX:LUG Lundin Gold Inc. 4.85 (0.08) (2)% 6.50 4.59 TSX:AGI Alamos Gold Inc. 8.15 0.22 3% 11.83 7.79 TSX:MAG MAG Silver Corp. 14.05 0.14 1% 21.99 12.75 NYSE:AU AngloGold Ashanti Limited 9.99 0.32 3% 13.68 8.89 TSX:MOZ Marathon Gold Corporation 1.05 - - 1.36 0.45 TSX:AR Argonaut Gold Inc. 2.56 0.15 6% 2.98 1.48 NYSE:MUX McEwen Mining Inc. 2.03 0.08 4% 4.43 1.88 TSX:AZ Arizona Mining Inc. 3.10 (0.18) (5)% 3.68 1.70 TSX:MAX Midas Gold Corp. 0.70 (0.05) (7)% 0.99 0.62 TSX:AKG Asanko Gold Inc. 1.02 (0.22) (18)% 5.07 0.99 TSX:NCA NewCastle Gold Ltd. 0.77 (0.02) (3)% 1.12 0.52 TSXV:AGB Atlantic Gold Corporation 1.44 0.03 2% 1.87 0.76 TSX:NGD New Gold Inc. 4.13 (0.14) (3)% 5.79 3.11 TSX:BTO B2Gold Corp. 3.51 0.16 5% 4.64 2.69 NYSE:NEM Newmont Mining Corporation 36.21 0.69 2% 39.63 30.40 TSXV:BGM Barkerville Gold Mines Ltd. 0.69 (0.02) (3)% 1.39 0.41 TSX:NG NovaGold Resources Inc. 4.96 (0.32) (6)% 8.15 4.88 TSX:ABX Barrick Gold Corporation 17.96 0.25 1% 27.19 17.61 TSX:OGC OceanaGold Corporation 3.50 0.07 2% 5.00 3.24 TSX:CG Centerra Gold Inc. 7.58 (0.05) (1)% 9.35 5.56 TSX:OR Osisko Gold Royalties Ltd. 15.57 0.21 1% 17.58 11.90 TSX:CGG China Gold International Resources C 2.08 0.06 3% 3.40 1.82 TSX:OSK Osisko Mining Inc. 3.45 (0.34) (9)% 5.65 2.08 NYSE:CDE Coeur Mining, Inc. 7.37 0.20 3% 12.30 6.98 TSX:PAAS Pan American Silver Corp. 19.40 0.84 5% 27.99 18.31 NYSE:BVN Compañía de Minas Buenaventura S. 13.77 (0.07) (1)% 14.96 9.87 TSX:PG Premier Gold Mines Limited 3.71 0.07 2% 4.13 1.87 TSX:CNL Continental Gold Inc. 3.12 (0.11) (3)% 5.75 2.62 TSX:PVG Pretium Resources Inc. 14.06 (0.40) (3)% 16.48 9.17 TSX:DGC Detour Gold Corporation 13.91 0.44 3% 21.48 13.01 TSXV:PGM Pure Gold Mining Inc. 0.50 - - 0.72 0.40 TSX:ELD Eldorado Gold Corporation 1.61 0.09 6% 5.13 1.44 NasdaqGS:GOLD Randgold Resources Limited 93.62 3.07 3% 108.29 67.54 TSX:EDV Endeavour Mining Corporation 22.43 1.27 6% 28.81 17.37 TSX:RIC Richmont Mines Inc. 11.25 0.33 3% 13.19 7.36 TSX:EDR Endeavour Silver Corp. 2.72 (0.01) (0)% 6.44 2.50 TSX:ROXG Roxgold Inc. 1.13 (0.03) (3)% 1.67 1.03 TSXV:FPC Falco Resources Ltd. 0.99 (0.02) (2)% 1.65 0.77 NasdaqGS:RGLD Royal Gold, Inc. 85.38 (0.23) (0)% 94.39 60.21 TSX:FR First Majestic Silver Corp. 8.65 0.23 3% 14.36 7.51 TSX:SBB Sabina Gold & Silver Corp. 2.25 (0.07) (3)% 2.70 0.84 TSX:FVI Fortuna Silver Mines Inc. 5.45 0.28 5% 9.18 5.13 TSX:SSL Sandstorm Gold Ltd. 5.77 0.22 4% 6.81 4.29 TSX:FNV Franco-Nevada Corporation 107.71 1.21 1% 109.25 71.44 NYSE:SA Seabridge Gold Inc. 11.20 (1.25) (10)% 13.70 7.35 NYSE:GFI Gold Fields Limited 4.05 0.09 2% 4.70 2.60 TSX:SMF SEMAFO Inc. 3.36 - - 5.24 2.68 TSX:G Goldcorp Inc. 17.10 0.29 2% 23.35 15.56 NYSE:SBGL Sibanye Gold Limited 5.33 (0.25) (4)% 10.59 4.27 TSX:GSC Golden Star Resources Ltd. 1.12 0.14 14% 1.33 0.76 TSX:SVM Silvercorp Metals Inc. 3.11 (0.02) (1)% 5.90 2.82 TSX:GUY Guyana Goldfields Inc. 4.61 0.18 4% 8.11 3.96 TSX:SSRM SSR Mining Inc. 11.15 0.15 1% 16.11 10.32 NYSE:HMY Harmony Gold Mining Company Limi 1.83 - - 2.99 1.56 TSX:THO Tahoe Resources Inc. 5.97 0.44 8% 15.11 5.31 TSX:HRT Harte Gold Corp. 0.45 - - 0.87 0.25 TSX:TMR TMAC Resources Inc. 8.57 0.88 11% 19.00 6.90 NYSE:HL Hecla Mining Company 3.88 (0.16) (4)% 6.78 3.63 TSX:TXG Torex Gold Resources Inc 14.37 1.01 8% 33.85 12.42 TSX:IMG IAMGOLD Corporation 7.34 (0.15) (2)% 8.87 4.24 TSX:TML Treasury Metals Inc. 0.60 (0.02) (3)% 0.90 0.51 TSX:IVN Ivanhoe Mines Ltd. 4.56 (0.25) (5)% 5.47 2.25 TSXV:TREK Trek Mining Inc. 0.99 (0.04) (4)% 2.02 0.96 TSX:K Kinross Gold Corporation 5.53 0.08 1% 6.29 3.87 TSX:WDO Wesdome Gold Mines Ltd. 1.84 0.03 2% 4.40 1.74 TSX:KL Kirkland Lake Gold Ltd. 17.97 (0.22) (1)% 19.06 6.33 TSX:WPM Wheaton Precious Metals Corp. 26.72 1.19 5% 30.32 22.63 TSX:KDX Klondex Mines Ltd. 3.26 0.10 3% 7.73 2.75 TSX:YRI Yamana Gold Inc. 3.51 0.12 4% 4.80 2.84
The Weekly Dig 11/17/17
Haywood Mining [email protected] Page 16
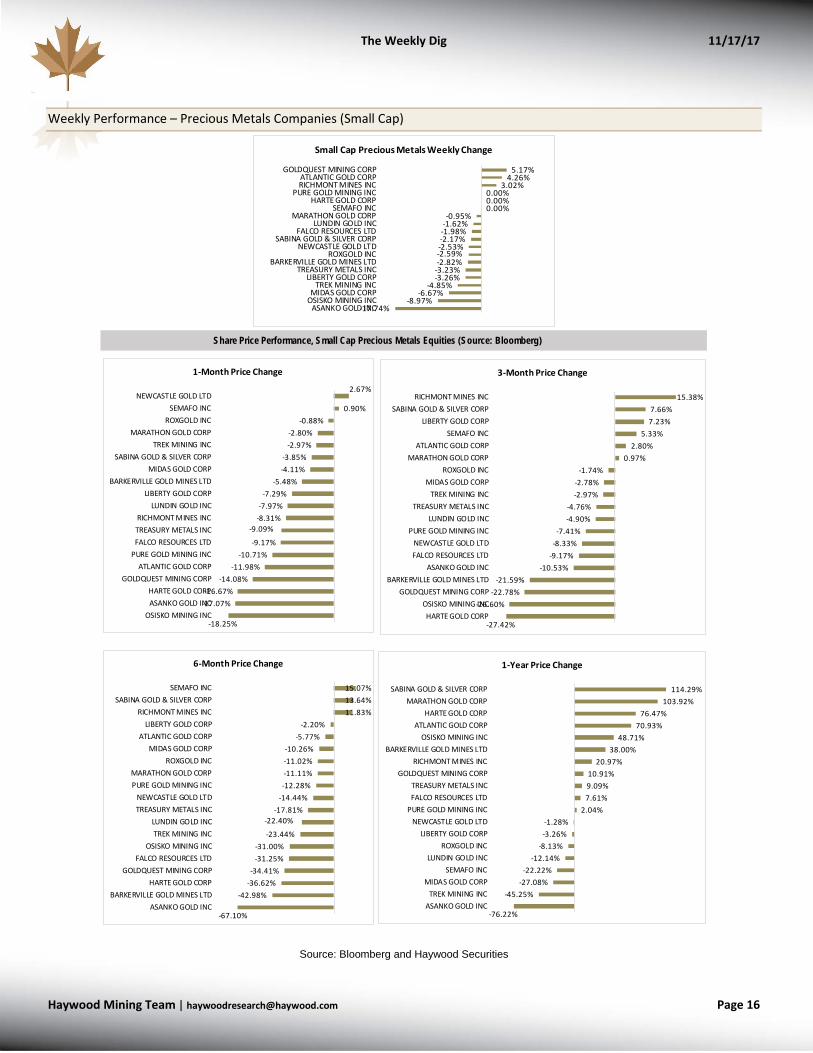
Weekly Performance – Precious Metals Companies (Small Cap)
Source: Bloomberg and Haywood Securities
5.17%4.26%
3.02%0.00%0.00%0.00%
-0.95%-1.62%-1.98%-2.17%-2.53%-2.59%-2.82%
-3.23%-3.26%
-4.85%-6.67%
-8.97%-17.74%
GOLDQUEST MINING CORPATLANTIC GOLD CORPRICHMONT MINES INC
PURE GOLD MINING INCHARTE GOLD CORP
SEMAFO INCMARATHON GOLD CORP
LUNDIN GOLD INCFALCO RESOURCES LTD
SABINA GOLD & SILVER CORPNEWCASTLE GOLD LTD
ROXGOLD INCBARKERVILLE GOLD MINES LTD
TREASURY METALS INCLIBERTY GOLD CORP
TREK MINING INCMIDAS GOLD CORP
OSISKO MINING INCASANKO GOLD INC
Small Cap Precious Metals Weekly Change
Share Price Performance, Small Cap Precious Metals Equities (Source: Bloomberg)
2.67%
0.90%-0.88%
-2.80%-2.97%
-3.85%-4.11%
-5.48%-7.29%
-7.97%-8.31%
-9.09%
-9.17%-10.71%
-11.98%-14.08%
-16.67%-17.07%
-18.25%
NEWCASTLE GOLD LTDSEMAFO INC
ROXGOLD INCMARATHON GOLD CORP
TREK MINING INCSABINA GOLD & SILVER CORP
MIDAS GOLD CORPBARKERVILLE GOLD MINES LTD
LIBERTY GOLD CORPLUNDIN GOLD INC
RICHMONT MINES INCTREASURY METALS INCFALCO RESOURCES LTD
PURE GOLD MINING INCATLANTIC GOLD CORP
GOLDQUEST MINING CORPHARTE GOLD CORPASANKO GOLD INC
OSISKO MINING INC
1-Month Price Change
15.07%13.64%11.83%
-2.20%-5.77%
-10.26%-11.02%-11.11%-12.28%
-14.44%-17.81%
-22.40%
-23.44%-31.00%-31.25%
-34.41%-36.62%
-42.98%
-67.10%
SEMAFO INCSABINA GOLD & SILVER CORP
RICHMONT MINES INCLIBERTY GOLD CORP
ATLANTIC GOLD CORPMIDAS GOLD CORP
ROXGOLD INCMARATHON GOLD CORPPURE GOLD MINING INC
NEWCASTLE GOLD LTDTREASURY METALS INC
LUNDIN GOLD INCTREK MINING INC
OSISKO MINING INCFALCO RESOURCES LTD
GOLDQUEST MINING CORPHARTE GOLD CORP
BARKERVILLE GOLD MINES LTDASANKO GOLD INC
6-Month Price Change
15.38%7.66%7.23%
5.33%2.80%
0.97%-1.74%
-2.78%-2.97%
-4.76%-4.90%
-7.41%-8.33%
-9.17%-10.53%
-21.59%-22.78%
-26.60%
-27.42%
RICHMONT MINES INCSABINA GOLD & SILVER CORP
LIBERTY GOLD CORPSEMAFO INC
ATLANTIC GOLD CORPMARATHON GOLD CORP
ROXGOLD INCMIDAS GOLD CORP
TREK MINING INCTREASURY METALS INC
LUNDIN GOLD INCPURE GOLD MINING INC
NEWCASTLE GOLD LTDFALCO RESOURCES LTD
ASANKO GOLD INCBARKERVILLE GOLD MINES LTD
GOLDQUEST MINING CORPOSISKO MINING INCHARTE GOLD CORP
3-Month Price Change
114.29%103.92%
76.47%70.93%
48.71%38.00%
20.97%10.91%9.09%7.61%
2.04%-1.28%-3.26%
-8.13%-12.14%
-22.22%-27.08%
-45.25%
-76.22%
SABINA GOLD & SILVER CORPMARATHON GOLD CORP
HARTE GOLD CORPATLANTIC GOLD CORP
OSISKO MINING INCBARKERVILLE GOLD MINES LTD
RICHMONT MINES INCGOLDQUEST MINING CORP
TREASURY METALS INCFALCO RESOURCES LTD
PURE GOLD MINING INCNEWCASTLE GOLD LTD
LIBERTY GOLD CORPROXGOLD INC
LUNDIN GOLD INCSEMAFO INC
MIDAS GOLD CORPTREK MINING INC
ASANKO GOLD INC
1-Year Price Change

The Weekly Dig 11/17/17
Haywood Mining [email protected] Page 17
Equity Weekly Performance – Base Metals Companies
Source: Bloomberg and Haywood Securities
2.57%
0.44%-0.15%-0.25%
-0.67%-1.58%
-2.14%-2.97%
-3.40%-3.97%
-4.45%-4.46%
-5.41%-6.80%-6.94%
-7.64%-7.64%
TECK RESOURCES LTD-CLS BS&P/TSX DIV MTLS&MIN IDX
LME COPPER SPOT ($)S&P/TSX COMPOSITE INDEX
NEVSUN RESOURCES LTDLME ZINC SPOT ($)
ATALAYA MINING PLCHUDBAY MINERALS INC
CAPSTONE MINING CORPTASEKO MINES LTD
LME NICKEL SPOT ($)LUNDIN MINING CORPTREVALI MINING CORP
IMPERIAL METALS CORPCOPPER MOUNTAIN MINING CORP
SHERRITT INTERNATIONAL CORPFIRST QUANTUM MINERALS LTD
Base Metal Weekly Change
Share Price Performance, Canadian Base Metals Equities (Source: Bloomberg)
7.33%
4.72%3.40%
1.15%0.68%
-1.03%-1.57%-1.63%-2.11%
-3.19%-3.61%
-4.20%-4.32%
-5.41%-7.19%
-8.67%-19.41%
COPPER MOUNTAIN MINING CORPSHERRITT INTERNATIONAL CORP
LME ZINC SPOT ($)S&P/TSX COMPOSITE INDEX
NEVSUN RESOURCES LTDTECK RESOURCES LTD-CLS B
LME NICKEL SPOT ($)S&P/TSX DIV MTLS&MIN IDX
FIRST QUANTUM MINERALS LTDLUNDIN MINING CORPLME COPPER SPOT ($)HUDBAY MINERALS INC
TASEKO MINES LTDTREVALI MINING CORP
CAPSTONE MINING CORPATALAYA MINING PLC
IMPERIAL METALS CORP
1-Month Price Change
106.41%
64.20%57.78%56.47%
35.50%27.47%27.27%26.28%25.67%25.27%24.55%
20.58%13.83%12.32%
4.75%-3.87%
-49.07%
COPPER MOUNTAIN MINING CORPSHERRITT INTERNATIONAL CORP
CAPSTONE MINING CORPTASEKO MINES LTD
HUDBAY MINERALS INCLUNDIN MINING CORPTREVALI MINING CORP
LME ZINC SPOT ($)LME NICKEL SPOT ($)
FIRST QUANTUM MINERALS LTDATALAYA MINING PLC
LME COPPER SPOT ($)TECK RESOURCES LTD-CLS B
S&P/TSX DIV MTLS&MIN IDXS&P/TSX COMPOSITE INDEX
NEVSUN RESOURCES LTDIMPERIAL METALS CORP
6-Month Price Change
62.20%
47.71%37.00%
32.34%22.41%
13.31%12.91%
7.95%6.42%5.34%4.45%4.09%
0.72%-0.20%
-1.85%
-4.34%
-12.46%
SHERRITT INTERNATIONAL CORPCOPPER MOUNTAIN MINING CORP
ATALAYA MINING PLCTASEKO MINES LTD
CAPSTONE MINING CORPNEVSUN RESOURCES LTD
FIRST QUANTUM MINERALS LTDLME NICKEL SPOT ($)
S&P/TSX COMPOSITE INDEXLME ZINC SPOT ($)
LME COPPER SPOT ($)LUNDIN MINING CORPTREVALI MINING CORP
HUDBAY MINERALS INCS&P/TSX DIV MTLS&MIN IDXTECK RESOURCES LTD-CLS B
IMPERIAL METALS CORP
3-Month Price Change
269.44%
140.30%48.11%43.46%42.00%38.54%
27.75%27.57%22.94%19.66%
7.91%3.48%2.84%
-2.45%
-11.03%
-24.94%-45.74%
TASEKO MINES LTDCOPPER MOUNTAIN MINING CORP
LUNDIN MINING CORPATALAYA MINING PLC
CAPSTONE MINING CORPSHERRITT INTERNATIONAL CORP
LME ZINC SPOT ($)HUDBAY MINERALS INCLME COPPER SPOT ($)TREVALI MINING CORP
S&P/TSX COMPOSITE INDEXFIRST QUANTUM MINERALS LTD
LME NICKEL SPOT ($)S&P/TSX DIV MTLS&MIN IDXTECK RESOURCES LTD-CLS B
NEVSUN RESOURCES LTDIMPERIAL METALS CORP
1-Year Price Change

The Weekly Dig 11/17/17
Haywood Mining [email protected] Page 18
Equity Weekly Performance – Major International Miners
Source: Bloomberg and Haywood Securities
2.57%
0.91%
0.40%
-1.94%
-2.19%
-3.27%
-3.82%
-3.88%
-8.40%
TECK RESOURCES LTD-CLS B
ALCOA CORP
VALE SA-SP ADR
GLENCORE PLC -UNSP ADR
SOUTHERN COPPER CORP
BHP BILLITON LTD-SPON ADR
FREEPORT-MCMORAN INC
RIO TINTO PLC-SPON ADR
ALUMINUM CORP OF CHINA-ADR
Major International Miner Weekly Change
Share Price Performance, Major International Miner Equities (Source: Bloomberg)
-1.03%
-1.22%
-1.46%
-2.45%
-4.42%
-5.70%
-7.17%
-9.15%
-23.66%
TECK RESOURCES LTD-CLS B
SOUTHERN COPPER CORP
VALE SA-SP ADR
BHP BILLITON LTD-SPON ADR
RIO TINTO PLC-SPON ADR
GLENCORE PLC -UNSP ADR
FREEPORT-MCMORAN INC
ALCOA CORP
ALUMINUM CORP OF CHINA-ADR
1-Month Price Change
51.86%
37.21%
27.60%
26.88%
21.26%
18.68%
18.38%
16.83%
13.83%
ALUMINUM CORP OF CHINA-ADR
ALCOA CORP
SOUTHERN COPPER CORP
GLENCORE PLC -UNSP ADR
FREEPORT-MCMORAN INC
RIO TINTO PLC-SPON ADR
VALE SA-SP ADR
BHP BILLITON LTD-SPON ADR
TECK RESOURCES LTD-CLS B
6-Month Price Change
14.81%
10.07%
7.38%
7.35%
4.01%
2.27%
-0.23%
-2.39%
-4.34%
ALCOA CORP
SOUTHERN COPPER CORP
RIO TINTO PLC-SPON ADR
GLENCORE PLC -UNSP ADR
VALE SA-SP ADR
BHP BILLITON LTD-SPON ADR
ALUMINUM CORP OF CHINA-ADR
FREEPORT-MCMORAN INC
TECK RESOURCES LTD-CLS B
3-Month Price Change
56.01%
45.10%
38.30%
36.26%
35.57%
26.70%
15.20%
0.43%
-11.03%
ALUMINUM CORP OF CHINA-ADR
GLENCORE PLC -UNSP ADR
VALE SA-SP ADR
ALCOA CORP
SOUTHERN COPPER CORP
RIO TINTO PLC-SPON ADR
BHP BILLITON LTD-SPON ADR
FREEPORT-MCMORAN INC
TECK RESOURCES LTD-CLS B
1-Year Price Change

The Weekly Dig 11/17/17
Haywood Mining [email protected] Page 19
Comparables Tables – Precious Metals
Precious Metals Companies – Market and Valuation Statistics (Consensus Estimates)
Source: Capital IQ and Haywood Securities
Shares Market Working EnterpriseCompany Symbol Price O/S Capitalization Cash Capital Debt Value 2017E 2018E
(millions) (millions) (millions) (millions) (millions) (millions) CFPS CFPS 2017E 2018E 2017E 2018E 2017E 2018E
Senior Precious Metals ProducersAgnico Eagle Mines Limited NYSE:AEM C$ 57.08 229.6 US$ 10,242 US$ 989 US$ 1,265 US$ 1,372 US$ 10,350 US$ 3.44 US$ 3.43 10 12.9x 13.0x 13.1x 13.1x 11.9x 10.9xAngloGold Ashanti Limited JSE:ANG C$ 12.61 409.9 US$ 4,037 US$ 171 US$ 422 US$ 2,312 US$ 5,927 US$ 2.13 US$ 2.83 6 4.6x 3.5x 6.8x 5.1x 3.9x 5.3xBarrick Gold Corporation TSX:ABX C$ 17.96 1166.0 US$ 16,364 US$ 2,025 US$ 3,004 US$ 6,346 US$ 19,706 US$ 1.96 US$ 2.33 6 7.1x 6.0x 8.6x 7.3x 4.9x 4.5xCompañía de Minas Buenaventura S.A.A. NYSE:BVN C$ 17.62 254.0 US$ 3,497 US$ 185 US$ 114 US$ 272 US$ 3,656 US$ 1.13 US$ 1.61 3 12.2x 8.6x 12.8x 9.0x 10.8x 9.9xEldorado Gold Corporation TSX:ELD C$ 1.61 792.3 US$ 997 US$ 551 US$ 700 US$ 593 US$ 890 US$ 0.11 US$ 0.21 11 11.4x 6.0x 10.2x 5.4x 4.5x 6.9xEvolution Mining Limited ASX:EVN C$ 2.41 1692.5 US$ 3,186 US$ 29 US$ 75 US$ 294 US$ 3,404 US$ 0.30 US$ 0.30 6 6.2x 6.3x 6.7x 6.7x 7.5x 6.5xFresnillo PLC LSE:FRES C$ 21.92 736.9 US$ 12,624 US$ 885 US$ 1,339 US$ 798 US$ 12,083 US$ 1.04 US$ 1.35 6 16.4x 12.7x 15.7x 12.2x 11.8x 11.2xGold Fields Limited JSE:GFI C$ 5.21 820.6 US$ 3,340 US$ 493 US$ 149 US$ 1,574 US$ 4,765 US$ 0.96 US$ 1.06 6 4.3x 3.8x 6.1x 5.5x 4.0x 4.3xGoldcorp Inc. TSX:G C$ 17.10 867.1 US$ 11,587 US$ 195 (US$ 3) US$ 2,083 US$ 13,673 US$ 1.39 US$ 1.64 17 9.6x 8.1x 11.4x 9.6x 9.5x 9.2xKinross Gold Corporation TSX:K C$ 5.53 1247.0 US$ 5,388 US$ 1,050 US$ 1,731 US$ 1,732 US$ 5,389 US$ 0.75 US$ 0.85 16 5.8x 5.1x 5.8x 5.1x 4.8x 4.4xNewcrest Mining Limited ASX:NCM C$ 22.90 766.1 US$ 13,708 US$ 493 US$ 585 US$ 1,991 US$ 15,114 US$ 1.51 US$ 1.63 7 11.9x 11.0x 13.1x 12.1x 11.5x 11.1xNewmont Mining Corporation NYSE:NEM C$ 46.34 533.3 US$ 19,312 US$ 3,045 US$ 3,658 US$ 4,035 US$ 19,689 US$ 4.12 US$ 4.17 7 8.8x 8.7x 9.0x 8.8x 6.8x 7.6xRandgold Resources Limited LSE:RRS C$ 119.68 94.1 US$ 8,803 US$ 622 US$ 813 US$ 3 US$ 7,992 US$ 5.45 US$ 5.97 7 17.2x 15.7x 15.6x 14.2x 14.6x 11.8xYamana Gold Inc. TSX:YRI C$ 3.51 948.5 US$ 2,601 US$ 248 (US$ 10) US$ 1,643 US$ 4,254 US$ 0.48 US$ 0.69 15 5.7x 4.0x 9.3x 6.5x 6.6x 6.7x
Group Average - Senior Producers 9.6x 8.0x 10.3x 8.6x 8.1x 7.9xGroup Average - Senior Producers (excluding high/low) 9.4x 7.8x 10.2x 8.4x 7.9x 7.8x
Intermediate Precious Metals ProducersAcacia Mining plc LSE:ACA C$ 2.98 410.1 US$ 955 US$ 176 US$ 390 - US$ 565 US$ 0.60 US$ 0.99 2 3.9x 2.4x 2.3x 1.4x 1.4x 2.0xAlamos Gold Inc. TSX:AGI C$ 8.15 300.7 US$ 1,915 US$ 167.7 US$ 274.4 US$ 1.7 US$ 1,642.0 US$ 0.56 US$ 0.65 9 11.3x 9.8x 9.7x 8.4x 11.4x 9.3xB2Gold Corp. TSX:BTO C$ 3.51 977.5 US$ 2,681 US$ 90 US$ 35 US$ 634 US$ 3,280 US$ 0.22 US$ 0.50 12 12.7x 5.4x 15.5x 6.7x 10.2x 13.3xCentamin Plc LSE:CEY C$ 2.34 1150.0 US$ 2,101 US$ 313.1 US$ 402.6 US$ 0.0 US$ 1,698.2 US$ 0.25 US$ 0.22 5 7.3x 8.5x 5.9x 6.9x 4.6x 5.1xCenterra Gold Inc. TSX:CG C$ 7.58 291.8 US$ 1,728 US$ 352 US$ 616 US$ 248 US$ 1,360 US$ 1.73 US$ 1.35 10 3.4x 4.4x 2.7x 3.4x 3.1x 2.4xDetour Gold Corporation TSX:DGC C$ 13.91 174.8 US$ 1,900 US$ 113.9 US$ 170.5 US$ 297.5 US$ 2,027.2 US$ 1.52 US$ 1.94 16 7.2x 5.6x 7.6x 6.0x 8.9x 7.7xEndeavour Mining Corporation TSX:EDV C$ 22.43 105.8 US$ 1,855 US$ 97 US$ 142 US$ 322 US$ 2,036 US$ 1.94 US$ 3.18 3 9.1x 5.5x 9.9x 6.0x 8.7x 10.4xGuyana Goldfields Inc. TSX:GUY C$ 4.61 173.0 US$ 623 US$ 110.5 US$ 127.9 US$ 44.5 US$ 539.9 US$ 0.44 US$ 0.63 6 8.2x 5.8x 7.1x 5.0x 6.3x 6.7xHarmony Gold Mining Company Limited NYSE:HMY C$ 2.28 440.6 US$ 784 US$ 95 US$ 83 US$ 23 US$ 723 US$ 0.67 US$ 0.57 5 2.6x 3.1x 2.4x 2.9x 2.3x 2.2xHecla Mining Company NYSE:HL C$ 4.97 399.0 US$ 1,548 US$ 205.9 US$ 195.5 US$ 501.9 US$ 1,854.6 US$ 0.36 US$ 0.55 6 10.9x 7.1x 13.1x 8.5x 7.8x 10.0xIAMGOLD Corporation TSX:IMG C$ 7.34 464.9 US$ 2,666 US$ 811 US$ 852 US$ 389 US$ 2,203 US$ 0.65 US$ 0.72 14 8.8x 7.9x 7.3x 6.6x 6.9x 6.5xKirkland Lake Gold Ltd. TSX:KL C$ 17.97 207.5 US$ 2,914 US$ 210.5 US$ 102.1 US$ 0.0 US$ 2,812.0 US$ 1.47 US$ 1.95 8 9.6x 7.2x 9.2x 7.0x 17.6x 8.1xKlondex Mines Ltd. TSX:KDX C$ 3.26 179.6 US$ 458 US$ 21 US$ 17 US$ 14 US$ 454 US$ 0.35 US$ 0.64 9 7.2x 4.0x 7.2x 3.9x 5.8x 5.4xNew Gold Inc. TSX:NGD C$ 4.13 577.8 US$ 1,865 US$ 207.1 US$ 304.5 US$ 977.0 US$ 2,537.2 US$ 0.50 US$ 0.74 12 6.5x 4.4x 8.9x 5.9x 8.5x 7.9xNorthern Star Resources Limited ASX:NST C$ 5.59 603.2 US$ 2,635 US$ 309 US$ 239 - US$ 2,397 US$ 0.45 US$ 0.45 6 9.8x 9.7x 8.9x 8.8x 8.0x 7.4xOceanaGold Corporation TSX:OGC C$ 3.50 615.1 US$ 1,682 US$ 61.2 US$ 19.7 US$ 200.0 US$ 1,862.6 US$ 0.53 US$ 0.55 13 5.1x 5.0x 5.7x 5.5x 6.6x 5.1xPretium Resources Inc. TSX:PVG C$ 14.06 182.0 US$ 1,999 US$ 54 US$ 7 US$ 715 US$ 2,707 US$ 0.53 US$ 1.73 7 20.8x 6.3x 28.1x 8.6x - 27.9xPremier Gold Mines Limited TSX:PG C$ 3.71 202.2 US$ 586 US$ 138.4 US$ 93.8 US$ 0.0 US$ 492.2 US$ 0.34 US$ 0.10 8 8.6x 27.9x 7.2x 23.5x 13.7x 6.1xRegis Resources Limited ASX:RRL C$ 3.99 504.0 US$ 1,570 US$ 92 US$ 108 - US$ 1,462 US$ 0.32 US$ 0.32 6 9.9x 9.7x 9.2x 9.0x 9.3x 7.9xResolute Mining Limited ASX:RSG C$ 0.99 741.5 US$ 572 US$ 219.2 US$ 288.5 US$ 0.0 US$ 283.2 US$ 0.19 US$ 0.12 4 4.0x 6.2x 2.0x 3.1x 1.9x 2.0xSEMAFO Inc. TSX:SMF C$ 3.36 324.9 US$ 853 US$ 257 US$ 254 US$ 115 US$ 714 US$ 0.32 US$ 0.47 7 8.2x 5.6x 6.8x 4.7x 4.8x 6.3xTahoe Resources Inc. TSX:THO C$ 5.97 312.8 US$ 1,459 US$ 182.4 US$ 178.1 US$ 0.0 US$ 1,281.0 US$ 0.78 US$ 0.99 14 6.0x 4.7x 5.3x 4.1x 3.3x 4.4xTMAC Resources Inc. TSX:TMR C$ 8.57 91.6 US$ 614 US$ 14 US$ 60 US$ 152 US$ 705 (US$ 0.11) US$ 1.05 3 - 6.4x - 7.3x - 399.0xTorex Gold Resources Inc TSX:TXG C$ 14.37 79.9 US$ 897 US$ 66.5 US$ 52.3 US$ 343.0 US$ 1,187.3 US$ 1.46 US$ 2.50 3 7.7x 4.5x 10.2x 5.9x 7.2x 9.8x
Group Average - Intermediate Producers 8.2x 7.0x 8.4x 6.6x 7.2x 23.9xGroup Average - Intermediate Producers (excluding high/low) 7.6x 6.2x 7.5x 6.1x 2.7x 7.8x
Junior Precious Metals ProducersAlacer Gold Corp. TSX:ASR C$ 2.23 293.1 US$ 511 US$ 132 US$ 143 US$ 126 US$ 494 US$ 0.32 US$ 0.25 7 5.5x 7.0x 5.3x 6.8x 13.6x 6.1xAlio Gold Inc. TSX:ALO C$ 4.33 44.7 US$ 151 US$ 68.5 US$ 73.0 US$ 0.0 US$ 78.2 US$ 0.68 US$ 0.76 11 5.0x 4.5x 2.6x 2.3x 1.8x 2.6xArgonaut Gold Inc. TSX:AR C$ 2.56 177.2 US$ 355 US$ 37 US$ 78 - US$ 276 US$ 0.28 US$ 0.45 7 7.3x 4.5x 5.7x 3.5x 6.8x 5.8xAsanko Gold Inc. TSX:AKG C$ 1.02 203.4 US$ 162 US$ 60.8 US$ 47.4 US$ 139.3 US$ 254.1 US$ 0.56 US$ 0.47 5 1.4x 1.7x 2.2x 2.7x 3.6x 2.3xBrio Gold Inc. TSX:BRIO C$ 2.00 117.6 US$ 184 US$ 10 US$ 30 US$ 60 US$ 213 US$ 0.36 US$ 0.85 3 4.3x 1.8x 5.0x 2.1x 2.9x 5.3xDundee Precious Metals Inc. TSX:DPM C$ 2.81 178.5 US$ 392 US$ 22.0 US$ 30.0 US$ 0.0 US$ 361.9 US$ 0.52 US$ 0.67 3 4.3x 3.3x 3.9x 3.0x 6.2x 3.9xGolden Star Resources Ltd. TSX:GSC C$ 1.12 380.6 US$ 333 US$ 30 (US$ 42) US$ 82 US$ 457 US$ 0.19 US$ 0.23 5 4.5x 3.9x 6.2x 5.3x 31.9x 5.3xHighland Gold Mining Limited AIM:HGM C$ 2.56 325.2 US$ 651 US$ 4.3 US$ 48.9 US$ 180.4 US$ 782.8 US$ 0.41 US$ 0.45 1 4.9x 4.4x 5.9x 5.3x 5.9x 4.9xLeagold Mining Corporation TSX:LMC C$ 2.94 151.3 US$ 348 US$ 53 US$ 94 US$ 143 US$ 397 US$ 0.31 US$ 0.50 2 7.5x 4.6x 8.6x 5.3x - 14.7xPrimero Mining Corp. TSX:P C$ 0.09 192.3 US$ 14 US$ 14.9 US$ 20.5 US$ 47.3 US$ 40.3 US$ 0.14 US$ 0.18 5 0.5x 0.4x 1.4x 1.2x 1.1x 7.6xRichmont Mines Inc. TSX:RIC C$ 11.25 63.8 US$ 561 US$ 72 US$ 66 US$ 3 US$ 498 US$ 0.79 US$ 0.83 2 11.1x 10.6x 9.9x 9.4x 13.5x 9.7xRoxgold Inc. TSX:ROXG C$ 1.13 371.8 US$ 328 US$ 56.3 US$ 44.9 US$ 37.7 US$ 321.1 US$ 0.18 US$ 0.22 7 5.0x 4.0x 4.9x 4.0x 16.5x 4.1xTeranga Gold Corporation TSX:TGZ C$ 2.68 107.3 US$ 225 US$ 77 US$ 61 US$ 14 US$ 178 US$ 0.62 US$ 0.64 4 3.4x 3.3x 2.7x 2.6x 1.7x 1.8xWesdome Gold Mines Ltd. TSX:WDO C$ 1.84 133.9 US$ 193 US$ 13.3 US$ 10.3 US$ 0.0 US$ 182.2 US$ 0.13 US$ 0.21 7 11.4x 6.9x 10.8x 6.5x 14.8x 9.6x
Group Average - Junior Producers 5.4x 4.4x 5.4x 4.3x 9.3x 6.0xGroup Average - Junior Producers (excluding high/low) 5.3x 4.2x 5.2x 4.1x 7.9x 5.6x
All data sourced from Capital IQ
Number of
Estimates
P/CF Ratio EV/CF Ratio EV/EBITDA Ratio

The Weekly Dig 11/17/17
Haywood Mining [email protected] Page 20
Other Precious Metals Companies – Market and Valuation Statistics (Consensus Estimates)
Source: Capital IQ and Haywood Securities
Shares Market Working EnterpriseCompany Symbol Price O/S Capitalization Cash Capital Debt Value 2017E 2018E Number of
(millions) (millions) (millions) (millions) (millions) (millions) CFPS CFPS Estimates 2017E 2018E 2017E 2018E 2017E 2018E
PGM ProducersImpala Platinum Holdings Limited JSE:IMP C$ 3.39 718.6 US$ 1,906 US$ 599 US$ 946 US$ 544 US$ 1,504 US$ 0.25 US$ 0.27 4 10.5x 9.8x 8.3x 7.7x 5.6x 5.8xLonmin plc LSE:LMI C$ 1.14 283.1 US$ 252 US$ 229 US$ 472 US$ 154 (US$ 66) US$ 0.04 US$ 0.19 6 22.4x 4.7x - - - -North American Palladium Ltd. TSX:PDL C$ 7.90 58.1 US$ 359 US$ 10 US$ 9 US$ 35 US$ 385 - - 0 - - - - - -
Group Average - PGM Producers 16.4x 7.2x 8.3x 7.7x 5.6x 5.8x
Silver ProducersAmericas Silver Corporation TSX:USA C$ 4.80 41.1 US$ 154 US$ 9 US$ 15 US$ 12 US$ 151 US$ 0.36 US$ 0.70 1 10.3x 5.3x 10.1x 5.2x 11.1x 14.4xAurcana Corporation TSXV:AUN C$ 0.22 84.7 US$ 15 US$ 2 US$ 2 - US$ 13 - - 0 - - - - - -Coeur Mining, Inc. NYSE:CDE C$ 9.43 185.6 US$ 1,368 US$ 236 US$ 345 US$ 245 US$ 1,268 US$ 0.88 US$ 1.39 4 8.4x 5.3x 7.8x 4.9x 5.5x 6.7xEndeavour Silver Corp. TSX:EDR C$ 2.72 127.5 US$ 271 US$ 44 US$ 70 - US$ 201 US$ 0.17 US$ 0.31 6 12.4x 6.9x 9.2x 5.1x 5.4x 7.3xFirst Majestic Silver Corp. TSX:FR C$ 8.65 165.7 US$ 1,120 US$ 133 US$ 126 US$ 26 US$ 1,020 US$ 0.47 US$ 0.73 6 14.5x 9.3x 13.2x 8.5x 9.2x 13.7xFortuna Silver Mines Inc. TSX:FVI C$ 5.45 159.6 US$ 680 US$ 197 US$ 198 US$ 40 US$ 522 US$ 0.50 US$ 0.60 6 8.5x 7.1x 6.5x 5.4x 6.1x 4.6xHecla Mining Company NYSE:HL C$ 4.97 399.0 US$ 1,548 US$ 206 US$ 196 US$ 502 US$ 1,855 US$ 0.36 US$ 0.55 6 10.9x 7.1x 13.1x 8.5x 7.8x 10.0xMandalay Resources Corporation TSX:MND C$ 0.30 451.3 US$ 104 US$ 25 US$ 35 US$ 16 US$ 85 US$ 0.07 US$ 0.07 2 3.3x 3.3x 2.7x 2.7x 1.7x 2.6xPan American Silver Corp. TSX:PAAS C$ 19.40 153.2 US$ 2,322 US$ 186 US$ 410 US$ 21 US$ 1,933 US$ 1.41 US$ 1.91 8 10.8x 7.9x 9.0x 6.6x 6.9x 7.7xSSR Mining Inc. TSX:SSRM C$ 11.15 119.7 US$ 1,043 US$ 534 US$ 684 US$ 230 US$ 589 US$ 1.11 US$ 1.02 7 7.8x 8.5x 4.4x 4.8x 2.8x 3.5xSilvercorp Metals Inc. TSX:SVM C$ 3.11 168.2 US$ 409 US$ 99 US$ 78 - US$ 331 US$ 0.42 US$ 0.45 1 5.8x 5.4x 4.7x 4.4x 8.1x -
Group Average - Silver Producers 9.1x 6.8x 8.1x 5.6x 6.4x 7.8xGroup Average - Silver Producers (excluding high/low) 9.4x 6.7x 8.1x 5.6x 6.5x 7.6x
Diamond ProducersLucara Diamond Corp. TSX:LUC C$ 2.45 382.6 US$ 733 US$ 91 US$ 93 - US$ 640 US$ 0.25 US$ 0.24 4 7.8x 8.1x 6.8x 7.1x 3.4x 5.5xMountain Province Diamonds Inc. TSX:MPVD C$ 3.56 160.2 US$ 446 US$ 12 (US$ 78) US$ 246 US$ 770 US$ 0.37 US$ 0.87 2 7.5x 3.2x 12.9x 5.5x 89.5x 10.4xPetra Diamonds Limited LSE:PDL C$ 1.18 521.1 US$ 479 US$ 190 US$ 60 US$ 698 US$ 1,117 US$ 0.27 US$ 0.33 4 3.5x 2.8x 8.1x 6.5x 6.9x 6.3xStornoway Diamond Corporation TSX:SWY C$ 0.66 830.2 US$ 428 US$ 42 US$ 33 US$ 154 US$ 550 US$ 0.04 US$ 0.06 4 11.5x 8.5x 14.7x 10.9x - 9.2x
Group Average - Diamond Producers 7.6x 5.7x 10.6x 7.5x 33.3x 7.8x
Royalty CompaniesAnglo Pacific Group plc LSE:APF C$ 2.39 180.0 US$ 337 US$ 7 US$ 8 US$ 8 US$ 336 US$ 0.25 US$ 0.20 2 7.5x 9.1x 7.4x 9.1x 14.6x 7.9xAltius Minerals Corporation TSX:ALS C$ 11.97 43.2 US$ 404 US$ 16 US$ 8 US$ 47 US$ 443 US$ 0.44 US$ 0.61 2 21.1x 15.2x 23.2x 16.7x 23.4x 16.2xFranco-Nevada Corporation TSX:FNV C$ 107.71 185.7 US$ 15,632 US$ 546 US$ 632 - US$ 15,000 US$ 2.66 US$ 2.75 14 31.6x 30.6x 30.4x 29.4x 31.0x 29.1xMaverix Metals Inc. TSXV:MMX C$ 1.77 153.6 US$ 212 US$ 7 US$ 8 - US$ 204 US$ 0.07 US$ 0.10 3 20.4x 13.6x 19.6x 13.1x - 19.0xOsisko Gold Royalties Ltd. TSX:OR C$ 15.57 157.0 US$ 1,910 US$ 88 US$ 91 US$ 155 US$ 1,974 US$ 0.32 US$ 0.48 9 38.3x 25.3x 39.6x 26.1x 57.0x 42.8xRoyal Gold, Inc. US:RGLD C$ 109.27 65.5 US$ 5,588 US$ 89 US$ 116 US$ 540 US$ 6,012 US$ 4.14 US$ 4.59 9 20.6x 18.6x 22.2x 20.0x 22.7x 19.2xSandstorm Gold Ltd. TSX:SSL C$ 5.77 182.4 US$ 822 US$ 18 US$ 20 - US$ 802 US$ 0.27 US$ 0.25 9 16.9x 18.0x 16.4x 17.6x 19.7x 17.2xWheaton Precious Metals Corp. TSX:WPM C$ 26.72 442.4 US$ 9,236 US$ 70 US$ 65 US$ 854 US$ 10,025 US$ 1.21 US$ 1.30 13 17.3x 16.1x 18.8x 17.4x 17.2x 18.1x
Group Average - Royalty Companies 22.4x 18.6x 22.7x 18.9x 28.1x 21.6xGroup Average - Royalty Companies (excluding high/low) 22.1x 18.2x 22.4x 18.7x 24.2x 20.1x
All data sourced from Capital IQ
P/CF Ratio EV/CF Ratio EV/EBITDA Ratio

The Weekly Dig 11/17/17
Haywood Mining [email protected] Page 21
Senior Gold Producers – Production Statistics
Symbol Reserves
Agnico Eagle Mines Limited NYSE:AEM US $10,242 US $1,265 US $10,353 53.8 1.95 59.8 2.17 90% 19.9 2.31 21.4 2.49 93% US $519 33.9 1.79 38.4 2.02 88% 51% 54% US $192 US $173AngloGold Ashanti Limited JSE:ANG US $4,037 US $422 US $5,927 214.7 1.34 240.8 1.50 89% 50.1 0.91 52.2 0.95 96% US $118 164.7 1.57 188.5 1.79 87% 31% 35% US $28 US $25B2Gold Corp. TSX:BTO US $2,681 US $35 US $3,280 22.5 0.74 28.7 0.95 78% 6.9 1.34 6.9 1.34 100% US $474 15.6 0.62 21.8 0.87 71% 46% 58% US $146 US $114Barrick Gold Corporation TSX:ABX US $16,364 US $3,004 US $19,775 187.2 0.79 309.1 1.30 61% 89.9 1.22 122.8 1.67 73% US $220 97.4 0.60 186.3 1.14 52% 35% 34% US $106 US $64Compañía de Minas Buenaventura S.A.A. NYSE:BVN US $3,497 US $114 US $4,081 22.1 0.21 109.4 1.03 20% 3.6 0.11 26.6 0.83 13% US $1,141 15.7 0.26 73.8 1.20 21% 30% 24% US $185 US $37Detour Gold Corporation TSX:DGC US $1,900 US $170 US $2,027 21.5 0.96 21.5 0.96 100% 16.5 0.97 16.5 0.97 100% US $123 5.1 0.96 5.1 0.96 100% 23% 23% US $94 US $94Eldorado Gold Corporation TSX:ELD US $997 US $700 US $890 42.4 0.91 58.8 1.26 72% 18.4 1.23 26.8 1.78 69% US $48 24.0 0.76 32.0 1.02 75% 54% 54% US $21 US $15Evolution Mining Limited ASX:EVN US $3,186 US $74 US $3,412 18.3 0.95 23.6 1.22 78% 7.9 1.24 8.1 1.28 97% US $433 10.5 0.83 15.5 1.22 68% 34% 32% US $186 US $145Fresnillo PLC LSE:FRES US $12,624 US $1,339 US $12,083 37.9 0.79 84.1 1.75 45% 9.6 0.76 21.9 1.75 44% US $1,265 28.0 0.79 61.9 1.75 45% 34% 51% US $319 US $144Gold Fields Limited JSE:GFI US $3,340 US $149 US $4,765 105.7 2.01 126.6 2.40 84% 47.6 2.81 48.7 2.87 98% US $100 58.1 1.63 77.9 2.18 75% 48% 56% US $45 US $38Goldcorp Inc. TSX:G US $11,587 US ($3) US $13,917 136.7 0.64 240.9 1.13 57% 52.0 0.67 103.4 1.33 50% US $268 90.9 0.67 143.7 1.06 63% 28% 30% US $102 US $58IAMGOLD Corporation TSX:IMG US $2,666 US $852 US $2,203 35.2 1.22 35.5 1.23 99% 14.3 1.22 14.3 1.22 100% US $154 20.8 1.21 21.2 1.23 98% 45% 46% US $63 US $62Kinross Gold Corporation TSX:K US $5,388 US $1,731 US $5,389 59.0 0.71 60.4 0.73 98% 25.2 0.73 25.5 0.74 99% US $214 34.6 0.71 35.6 0.73 97% 16% 15% US $91 US $89Newcrest Mining Limited ASX:NCM US $13,708 US $585 US $15,114 129.5 0.60 232.5 1.07 56% 65.0 0.60 121.3 1.13 54% US $232 64.5 0.59 110.3 1.01 58% 22% 22% US $117 US $65Newmont Mining Corporation NYSE:NEM US $19,312 US $3,658 US $19,701 124.0 0.79 163.7 1.05 76% 68.6 0.96 75.7 1.06 91% US $287 55.3 0.65 87.8 1.04 63% 29% 21% US $159 US $120Randgold Resources Limited LSE:RRS US $8,803 US $813 US $7,992 25.6 3.35 25.6 3.35 100% 14.5 3.85 14.5 3.85 100% US $552 11.1 2.86 11.1 2.86 100% 53% 53% US $312 US $312Yamana Gold Inc. TSX:YRI US $2,601 US ($10) US $4,254 59.0 0.54 120.2 1.09 49% 20.6 0.39 56.9 1.07 36% US $207 40.5 0.71 65.4 1.15 62% 40% 51% US $72 US $35Group Average - Total # Companies: 17 US $374 US $132 US $94Equivalency assumptions (US$ / 11-17-17): $1,292/oz Au, $17.31/oz Ag, $952/oz Pt, $997/oz Pd, $3.06/lb Cu, $1.46/lb Zn, $1.10/lb Pb, $5.22/lb Ni, $8.55/lb Mo, $27.90/lb Co, $8,000/t Sb, $20.20/lb U3O8, $0.20/lb Sn, $93.00/t HCC, $61.49/t 62% FeSource: SNL Financial retrieved on November 17, 2017
EV/ozAu
Resources (M&I and Inferred) GlobalAu
(Moz)Au(g/t)
AuEq(Moz)
AuEq(g/t)
% Au % AuInferred
% AuEqInferred
EV/ozAu
EV/ozAuEq
ReservesAu
(Moz)Au(g/t)
AuEq(Moz)
AuEq(g/t)
% Au
MarketCapitalization
(millions)
WorkingCapital
(millions)
EnterpriseValue
(millions)
Global Reserves & ResourcesAu
(Moz)Au(g/t)
AuEq(Moz)
AuEq(g/t)
% Au

The Weekly Dig 11/17/17
Haywood Mining [email protected] Page 22
Intermediate Gold Producers – Production Statistics
Reserves
Acacia Mining plc LSE:ACA US $955 US $0 US $1,041 27.9 3.97 30.2 4.30 92% 7.6 3.91 8.2 4.21 93% US $137 20.2 4.00 22.0 4.34 92% 57% US $37 US $34Alamos Gold Inc. TSX:AGI US $1,915 US $274 US $1,642 21.6 1.21 22.3 1.25 97% 7.7 1.30 8.1 1.36 95% US $213 13.9 1.17 14.3 1.20 98% 33% US $76 US $74B2Gold Corp. TSX:BTO US $2,681 US $35 US $3,280 22.5 0.74 28.7 0.95 78% 6.9 1.34 6.9 1.34 100% US $474 15.6 0.62 21.8 0.87 71% 46% US $146 US $114Centamin Plc LSE:CEY US $2,101 US $403 US $1,698 11.4 1.19 11.4 1.19 100% 4.4 1.08 4.4 1.08 100% US $386 7.0 1.27 7.0 1.27 100% 40% US $149 US $149Centerra Gold Inc. TSX:CG US $1,728 US $616 US $1,392 29.4 0.51 51.7 0.89 57% 16.1 0.74 21.0 0.97 77% US $86 13.2 0.36 30.7 0.84 43% 44% US $47 US $27China Gold International Resources Corp. Ltd. TSX:CGG US $644 US $131 US $1,671 9.7 0.15 65.5 1.00 15% 5.0 0.28 24.9 1.41 20% US $335 4.7 0.10 40.6 0.85 12% 28% US $173 US $26Endeavour Mining Corporation TSX:EDV US $1,855 US $142 US $2,043 15.1 1.63 15.1 1.63 100% 6.1 1.65 6.1 1.65 100% US $338 9.1 1.61 9.1 1.61 100% 34% US $135 US $135Guyana Goldfields Inc. TSX:GUY US $623 US $128 US $540 8.6 2.94 8.6 2.94 100% 3.5 2.99 3.5 2.99 100% US $153 5.1 2.91 5.1 2.91 100% 41% US $63 US $63Harmony Gold Mining Company Limited JSE:HAR US $784 US $78 US $729 81.2 1.04 112.8 1.44 72% 23.7 0.66 36.6 1.02 65% US $31 57.5 1.35 75.4 1.77 76% 36% US $9 US $6Kirkland Lake Gold Ltd. TSX:KL US $2,914 US $102 US $2,846 17.9 4.36 17.9 4.36 100% 4.2 8.54 4.2 8.54 100% US $670 13.4 3.69 13.4 3.69 100% 42% US $159 US $159Klondex Mines Ltd. TSX:KDX US $458 US $17 US $456 4.1 1.95 4.3 2.03 96% 0.7 7.22 0.7 7.69 94% US $661 3.4 1.70 3.5 1.76 97% 56% US $111 US $107New Gold Inc. TSX:NGD US $1,865 US $305 US $2,537 23.3 0.75 32.0 1.02 73% 14.7 0.78 18.3 0.98 80% US $173 8.6 0.69 13.6 1.09 63% 24% US $109 US $79Northern Star Resources Limited ASX:NST US $2,635 US $235 US $2,409 11.2 3.37 23.5 7.07 48% 3.5 4.17 3.5 4.17 100% US $692 7.0 2.94 19.3 8.08 36% 61% US $215 US $103OceanaGold Corporation TSX:OGC US $1,682 US $20 US $1,906 14.9 1.58 16.3 1.73 91% 6.4 1.46 7.3 1.67 87% US $300 8.5 1.68 9.0 1.78 95% 46% US $128 US $117Premier Gold Mines Limited TSX:PG US $586 US $92 US $494 10.8 1.67 10.9 1.70 99% 2.8 1.17 2.9 1.19 98% US $176 8.0 1.97 8.0 2.00 99% 50% US $46 US $45Pretium Resources Inc. TSX:PVG US $1,999 US $7 US $2,707 22.9 0.83 27.9 1.01 82% 8.7 14.63 9.1 15.35 95% US $311 14.2 0.52 18.8 0.69 76% 91% US $118 US $97Regis Resources Limited ASX:RRL US $1,570 US $106 US $1,466 9.7 0.92 9.7 0.92 100% 2.5 1.14 2.5 1.14 100% US $588 7.2 0.86 7.2 0.86 100% 28% US $151 US $151Resolute Mining Limited ASX:RSG US $572 US $284 US $314 11.5 1.40 11.5 1.40 100% 5.2 1.50 5.2 1.50 100% US $61 6.4 1.32 6.4 1.32 100% 39% US $27 US $27SEMAFO Inc. TSX:SMF US $853 US $254 US $739 7.8 2.76 7.8 2.76 100% 2.7 3.31 2.7 3.31 100% US $273 5.1 2.54 5.1 2.54 100% 47% US $95 US $95Tahoe Resources Inc. TSX:THO US $1,459 US $178 US $1,291 18.2 0.68 30.8 1.15 59% 4.0 0.48 10.3 1.26 38% US $326 14.2 0.77 20.5 1.11 69% 55% US $71 US $42TMAC Resources Inc. TSX:TMR US $614 US $59 US $707 6.6 8.12 6.6 8.12 100% 3.6 7.72 3.6 7.72 100% US $196 3.0 8.66 3.0 8.66 100% 57% US $107 US $107Torex Gold Resources Inc TSX:TXG US $897 US $52 US $1,187 8.6 2.65 12.0 3.70 72% 3.3 2.57 3.4 2.62 98% US $360 5.3 2.69 8.6 4.40 61% 85% US $138 US $99Group Average - Total # Companies: 22 US $315 US $105 US $84Equivalency assumptions (US$ / 11-17-17): $1,292/oz Au, $17.31/oz Ag, $952/oz Pt, $997/oz Pd, $3.06/lb Cu, $1.46/lb Zn, $1.10/lb Pb, $5.22/lb Ni, $8.55/lb Mo, $27.90/lb Co, $8,000/t Sb, $20.20/lb U3O8, $0.20/lb Sn, $93.00/t HCC, $61.49/t 62% FeSource: SNL Financial retrieved on November 17, 2017
EnterpriseValue
(millions)Company Symbol
MarketCapitalization
(millions)
WorkingCapital
(millions)
Global Reserves & Resources Reserves Resources (M&I and Inferred)Au
(Moz)Au(g/t)
AuEq(Moz)
AuEq(g/t)
% Au
GlobalEV/oz
Au% Au Au
(Moz)Au(g/t)
AuEq(Moz)
AuEq(g/t)
EV/ozAu
EV/ozAuEq
Au(Moz)
Au(g/t)
AuEq(Moz)
AuEq(g/t)
% Au % AuInferred

The Weekly Dig 11/17/17
Haywood Mining [email protected] Page 23
Junior Gold Producers – Production Statistics
Reserves
Alacer Gold Corp. TSX:ASR US $511 US $143 US $494 7.6 0.39 18.5 0.96 41% 3.7 2.07 5.3 2.95 70% US $133 3.9 0.22 13.2 0.76 29% 52% US $65 US $27Alio Gold Inc. TSX:ALO US $151 US $73 US $78 3.1 0.91 3.1 0.93 99% 1.9 0.89 2.0 0.90 98% US $40 1.1 0.96 1.2 0.97 99% 8% US $25 US $25Argonaut Gold Inc. TSX:AR US $355 US $78 US $276 9.6 0.70 10.5 0.76 91% 3.3 0.81 3.3 0.81 100% US $83 6.3 0.65 7.2 0.75 87% 26% US $29 US $26Asanko Gold Inc. TSX:AKG US $162 US $47 US $254 7.3 1.45 7.3 1.45 100% 4.6 1.58 4.6 1.58 100% US $55 2.7 1.26 2.7 1.26 100% 22% US $35 US $35Azumah Resources Limited ASX:AZM US $11 US $0 US $11 1.9 1.55 1.9 1.55 100% 0.6 2.14 0.6 2.14 100% US $19 1.3 1.38 1.3 1.38 100% 47% US $6 US $6Banro Corporation TSX:BAA US $14 US ($12) US $223 12.1 1.60 12.1 1.60 100% 3.2 2.03 3.2 2.03 100% US $70 8.9 1.49 8.9 1.49 100% 57% US $18 US $18Beadell Resources Limited ASX:BDR US $172 US $1 US $186 4.0 0.44 13.9 1.55 29% 1.6 1.74 1.6 1.74 100% US $118 - - 9.9 1.48 - - US $47 US $13Brio Gold Inc. TSX:BRIO US $184 US $30 US $215 7.4 1.77 7.4 1.77 100% 3.0 1.33 3.0 1.33 100% US $72 4.5 2.25 4.5 2.25 100% 57% US $29 US $29Dundee Precious Metals Inc. TSX:DPM US $392 US $30 US $362 9.8 0.40 19.5 0.79 51% 2.8 3.35 3.8 4.55 74% US $129 7.0 0.29 15.7 0.65 45% 56% US $37 US $19Golden Star Resources Ltd. TSX:GSC US $333 US ($42) US $459 8.3 3.26 8.3 3.26 100% 1.7 3.05 1.7 3.05 100% US $267 6.5 3.32 6.5 3.32 100% 46% US $56 US $56Goldgroup Mining Inc. TSX:GGA US $9 US ($1) US $11 0.5 0.76 0.9 1.50 51% - - - - - - 0.5 0.76 0.9 1.50 51% 41% US $23 US $12Highland Gold Mining Limited AIM:HGM US $651 US $49 US $786 15.6 3.33 15.6 3.33 100% 3.7 7.53 3.7 7.53 100% US $212 11.8 2.83 11.8 2.83 100% 20% US $51 US $51Leagold Mining Corporation TSX:LMC US $348 US $94 US $397 15.7 0.84 17.9 0.95 88% 1.7 1.30 1.8 1.40 93% US $233 14.0 - 16.1 - 87% 29% US $25 US $22McEwen Mining Inc. NYSE:MUX US $676 US $83 US $593 9.5 0.16 58.1 0.95 16% 0.6 1.57 0.8 2.00 78% US $922 8.9 0.15 57.2 0.94 16% 47% US $62 US $10Medusa Mining Limited ASX:MML US $66 US $14 US $56 1.4 4.13 1.4 4.13 100% 0.4 7.00 0.4 7.00 100% US $148 0.4 1.74 0.4 1.74 100% 103% US $39 US $39Metanor Resources Inc. TSXV:MTO US $54 US $11 US $44 1.7 1.54 1.7 1.54 100% 0.2 7.38 0.2 7.38 100% US $220 1.5 1.40 1.5 1.40 100% 79% US $26 US $26Minera IRL Limited BVL:MIRL US $22 US ($75) US $98 2.6 2.62 2.6 2.63 100% 1.0 3.38 1.0 3.38 100% US $98 1.6 2.30 1.6 2.31 100% 73% US $38 US $38Orosur Mining Inc. TSX:OMI US $21 US $2 US $19 1.6 0.68 2.4 0.98 69% 0.1 1.43 0.1 1.43 100% US $149 1.5 0.65 2.2 0.96 68% 5% US $12 US $8Orvana Minerals Corp. TSX:ORV US $20 US $5 US $24 3.3 2.43 4.1 2.96 82% 0.4 3.03 0.5 4.15 73% US $67 3.1 2.38 3.7 2.87 83% 45% US $7 US $6Perseus Mining Limited ASX:PRU US $258 US $10 US $262 16.1 1.25 16.1 1.25 100% 6.3 1.46 6.3 1.46 100% US $41 9.8 1.15 9.8 1.15 100% 37% US $16 US $16Primero Mining Corp. TSX:P US $14 US $20 US $40 6.6 0.82 10.5 1.30 63% 1.3 1.12 2.2 1.87 60% US $30 5.2 0.76 8.3 1.20 63% 25% US $6 US $4Richmont Mines Inc. TSX:RIC US $561 US $65 US $500 5.0 3.81 5.0 3.83 100% 0.8 9.00 0.8 9.00 100% US $627 4.2 3.44 4.2 3.45 100% 62% US $100 US $100Roxgold Inc. TSX:ROXG US $328 US $45 US $326 1.2 16.71 1.2 16.71 100% 0.6 11.46 0.6 11.46 100% US $547 0.6 29.77 0.6 29.77 100% 60% US $267 US $267Shanta Gold Limited AIM:SHG US $34 US $30 US $53 3.2 2.90 3.2 2.90 100% 0.7 4.60 0.7 4.60 100% US $72 2.4 2.60 2.4 2.61 100% 56% US $17 US $17Teranga Gold Corporation TSX:TGZ US $225 US $61 US $178 8.6 1.51 8.6 1.51 100% 3.3 1.39 3.3 1.39 100% US $55 5.3 1.59 5.3 1.59 100% 30% US $21 US $21Torex Gold Resources Inc TSX:TXG US $897 US $52 US $1,187 8.6 2.65 12.0 3.70 72% 3.3 2.57 3.4 2.62 98% US $360 5.3 2.69 8.6 4.40 61% 85% US $138 US $99Wesdome Gold Mines Ltd. TSX:WDO US $193 US $10 US $188 6.3 1.42 6.3 1.42 100% 0.4 5.00 0.4 5.00 100% US $421 5.9 1.34 5.9 1.34 100% 58% US $30 US $30Group Average - Total # Companies: 27 US $200 US $45 US $38Equivalency assumptions (US$ / 11-17-17): $1,292/oz Au, $17.31/oz Ag, $952/oz Pt, $997/oz Pd, $3.06/lb Cu, $1.46/lb Zn, $1.10/lb Pb, $5.22/lb Ni, $8.55/lb Mo, $27.90/lb Co, $8,000/t Sb, $20.20/lb U3O8, $0.20/lb Sn, $93.00/t HCC, $61.49/t 62% FeSource: SNL Financial retrieved on November 17, 2017
EnterpriseValue
(millions)Company Symbol
MarketCapitalization
(millions)
WorkingCapital
(millions)
Global Reserves & Resources Reserves Resources (M&I and Inferred)Au
(Moz)Au(g/t)
AuEq(Moz)
AuEq(g/t)
% Au
Global
% Au Au(Moz)
Au(g/t)
AuEq(Moz)
AuEq(g/t)
EV/ozAu
EV/ozAuEq
Au(Moz)
Au(g/t)
AuEq(Moz)
AuEq(g/t)
% Au % AuInferred
EV/ozAu

The Weekly Dig 11/17/17
Haywood Mining [email protected] Page 24
Gold Development-Stage Companies (Engineering Study Complete) – Production Statistics
Company Reserves
African Gold Group, Inc. TSXV:AGG US $14 US $2 US $12 2.0 1.01 2.0 1.01 100% 0.5 1.25 0.5 1.25 100% US $27 1.5 0.96 1.5 0.96 100% 59% US $6 US $6Almaden Minerals Ltd. TSX:AMM US $92 US $13 US $79 2.4 0.42 5.0 0.87 49% 1.3 0.62 2.3 1.12 55% US $61 1.1 0.31 2.7 0.73 43% 40% US $32 US $16Amarillo Gold Corporation TSXV:AGC US $17 US ($1) US $25 2.1 1.22 2.1 1.22 100% 1.0 1.63 1.0 1.63 100% US $25 1.1 0.99 1.1 0.99 100% 57% US $12 US $12ATAC Resources Ltd. TSXV:ATC US $55 US $13 US $42 0.7 2.35 0.7 2.39 99% - - - - - - 0.7 2.35 0.7 2.39 99% 28% US $62 US $61Atlantic Gold Corporation TSXV:AGB US $214 US ($8) US $312 2.0 1.31 2.0 1.31 100% 0.6 1.43 0.6 1.43 100% US $517 1.4 1.26 1.4 1.26 100% 31% US $155 US $155Avesoro Resources Inc. TSX:ASO US $144 US $4 US $250 2.5 2.48 2.5 2.48 100% 0.8 3.38 0.8 3.38 100% US $300 1.7 2.19 1.7 2.19 100% 68% US $99 US $99Barkerville Gold Mines Ltd. TSXV:BGM US $226 US $29 US $198 3.9* 3.9 100% - 3.9* 3.9 100% US $51 US $51Belo Sun Mining Corp TSX:BSX US $169 US $45 US $123 6.8 1.04 6.8 1.04 100% 3.8 1.02 3.8 1.02 100% US $33 3.0 1.07 3.0 1.07 100% 52% US $18 US $18Chaarat Gold Holdings Limited AIM:CGH US $103 US $14 US $104 7.1 2.53 7.2 2.58 98% - - - - - - 7.1 2.53 7.2 2.58 98% 15% US $15 US $14Chalice Gold Mines Limited ASX:CHN US $38 US $39 US ($1) 0.2 4.10 0.2 4.10 100% - - - - - - 0.2 4.10 0.2 4.10 100% 83% - - Chesapeake Gold Corp. TSXV:CKG US $129 US $17 US $112 19.8 0.49 31.9 0.80 62% 18.3 0.52 29.5 0.83 62% US $6 1.5 0.33 2.4 0.52 64% 53% US $6 US $4Continental Gold Inc. TSX:CNL US $459 US $117 US $388 9.1 9.91 9.7 10.60 94% 3.7 8.41 3.9 8.74 96% US $105 5.4 11.31 5.9 12.33 92% 86% US $43 US $40Dacian Gold Limited ASX:DCN US $355 US $57 US $299 3.3 2.31 3.3 2.31 100% 1.2 2.01 1.2 2.01 100% US $249 2.1 2.52 2.1 2.52 100% 53% US $90 US $90Dalradian Resources Inc. TSX:DNA US $347 US $34 US $313 4.4 10.74 4.4 10.74 100% 1.4 8.54 1.4 8.54 100% US $218 3.0 12.28 3.0 12.28 100% 78% US $71 US $71Falco Resources Ltd. TSXV:FPC US $140 US $19 US $129 5.6 1.54 9.9 2.71 57% - - - - - - 5.6 1.54 9.9 2.71 57% 19% US $23 US $13First Mining Finance Corp. TSX:FF US $242 US $18 US $223 12.4 1.49 12.8 1.54 97% - - - - - - 12.4 1.49 12.8 1.54 97% 41% US $18 US $17Gabriel Resources Ltd. TSX:GBU US $110 US $36 US $123 16.4 1.05 17.4 1.12 94% 8.1 1.46 8.7 1.55 94% US $15 8.3 0.83 8.7 0.87 95% 27% US $7 US $7Gold Road Resources Limited ASX:GOR US $471 US $225 US $246 3.4 1.11 3.5 1.14 97% 1.8 1.20 1.8 1.20 100% US $140 1.6 1.03 1.7 1.09 95% 60% US $73 US $71Golden Queen Mining Co. Ltd. TSX:GQM US $20 US ($9) US $59 0.9 0.53 1.1 0.65 81% 0.5 0.66 0.6 0.81 82% US $120 0.4 0.43 0.5 0.53 81% 30% US $66 US $54Goldquest Mining Corp. TSXV:GQC US $61 US $20 US $41 2.2 2.60 3.4 4.06 64% 0.8 3.72 1.2 5.20 71% US $49 1.4 2.19 2.1 3.37 65% 16% US $19 US $12Hummingbird Resources PLC AIM:HUM US $177 US $67 US $184 6.3 1.63 6.3 1.63 100% 0.6 3.14 0.6 3.14 100% US $324 5.8 1.56 5.8 1.56 100% 53% US $29 US $29International Tower Hill Mines Ltd. TSX:ITH US $61 US $3 US $58 12.6 0.68 12.6 0.68 100% 9.0 0.71 9.0 0.71 100% US $6 3.6 0.60 3.6 0.60 100% 31% US $5 US $5INV Metals Inc. TSX:INV US $59 US $17 US $41 3.1 3.34 3.9 4.23 79% 1.9 4.98 2.2 5.82 86% US $22 1.2 2.23 1.7 3.16 71% 44% US $13 US $11K92 Mining Inc. TSXV:KNT US $62 US ($5) US $70 1.4 8.22 2.0 11.60 71% - - - - - - 1.4 8.22 2.0 11.60 71% 84% US $48 US $34KEFI Minerals Plc AIM:KEFI US $19 US $3 US $17 1.6 1.86 1.6 1.86 100% 0.8 2.12 0.8 2.12 100% US $21 0.8 1.65 0.8 1.65 100% 21% US $11 US $11Lundin Gold Inc. TSX:LUG US $454 US $66 US $551 9.5 8.33 9.7 8.49 98% 4.8 9.67 4.9 9.84 98% US $114 4.7 7.29 4.8 7.45 98% 46% US $58 US $57Lupaka Gold Corp. TSXV:LPK US $11 US ($1) US $13 2.8 1.17 3.2 1.36 86% - - - - - - 2.8 1.17 3.2 1.36 86% 42% US $5 US $4Lydian International Limited TSX:LYD US $195 US $43 US $300 4.8 0.69 5.1 0.74 93% 2.6 0.79 2.8 0.84 94% US $115 2.1 0.60 2.3 0.64 93% 60% US $63 US $59Metals Exploration Plc AIM:MTL US $92 US ($43) US $184 1.7 1.62 2.0 1.90 85% 0.9 1.86 1.0 2.11 88% US $205 0.8 1.43 1.0 1.73 82% 82% US $106 US $90Midas Gold Corp. TSX:MAX US $102 US $24 US $101 6.5 1.57 7.2 1.72 91% 4.6 1.60 5.1 1.77 91% US $22 2.0 1.49 2.1 1.62 92% 55% US $15 US $14Moneta Porcupine Mines Inc. TSX:ME US $34 US $5 US $29 0.8 3.46 0.8 3.63 95% - - - - - - 0.8 3.46 0.8 3.63 95% 47% US $36 US $34NewCastle Gold Ltd. TSX:NCA US $123 US $5 US $118 5.4 0.24 14.9 0.65 36% - - - - - - 5.4 0.24 14.9 0.65 36% 17% US $22 US $8NovaGold Resources Inc. TSX:NG US $1,247 US $87 US $1,248 28.7 0.96 45.4 1.51 63% 19.6 1.18 28.4 1.71 69% US $64 9.1 0.67 17.0 1.27 53% 58% US $43 US $27Orca Gold Inc. TSXV:ORG US $75 US $5 US $70 1.6 1.80 1.6 1.80 100% - - - - - - 1.6 1.80 1.6 1.80 100% 23% US $43 US $43Orezone Gold Corporation TSXV:ORE US $88 US $14 US $74 5.6 0.71 5.6 0.71 100% - - - - - - 5.6 0.71 5.6 0.71 100% 18% US $13 US $13Red Eagle Mining Corporation TSX:R US $79 US ($83) US $163 0.6 3.35 0.6 3.35 100% 0.4 5.19 0.4 5.19 100% US $402 0.2 1.98 0.2 1.98 100% 64% US $266 US $266RTG Mining Inc. TSX:RTG US $17 US $6 US $11 0.4 1.64 0.9 3.82 43% 0.2 2.04 0.5 5.32 38% US $53 0.2 1.34 0.3 2.65 50% 84% US $29 US $12Rubicon Minerals Corporation TSX:RMX US $64 US $20 US $54 0.4 6.39 0.4 6.39 100% - - - - - - 0.4 6.39 0.4 6.39 100% 74% US $130 US $130Sabina Gold & Silver Corp. TSX:SBB US $398 US $28 US $371 7.2 6.21 7.2 6.21 100% 2.5 6.30 2.5 6.30 100% US $148 4.7 6.16 4.7 6.16 100% 40% US $52 US $52Sandspring Resources Ltd. TSXV:SSP US $31 US ($0) US $31 10.4 0.85 11.8 0.96 88% 4.1 1.00 4.6 1.13 89% US $8 6.3 0.77 7.1 0.87 88% 53% US $3 US $3Seabridge Gold Inc. TSX:SEA US $643 US $16 US $627 98.2 0.49 191.8 0.95 51% 45.3 0.61 73.1 0.99 62% US $14 53.0 0.41 118.7 0.92 45% 71% US $6 US $3Sihayo Gold Limited ASX:SIH US $20 US ($0) US $20 1.1 2.60 1.1 2.60 100% 0.4 2.41 0.4 2.41 100% US $48 0.7 2.73 0.7 2.73 100% 43% US $18 US $18Solitario Zinc Corp. AMEX:XPL US $36 US $15 US $21 - - 6.2 8.68 - - - - - - - - - 6.2 8.68 - - - US $3Sulliden Mining Capital Inc. TSX:SMC US $11 US $11 US ($0) 1.4 1.20 1.7 1.37 87% - - - - - - 1.4 1.20 1.7 1.37 87% 26% - - Terraco Gold Corp. TSXV:TEN US $10 US $1 US $16 1.0 0.70 1.0 0.70 100% - - - - - - 1.0 0.70 1.0 0.70 100% 8% US $16 US $16Trek Mining Inc. TSXV:TREK US $138 US $51 US $101 2.5 0.23 11.1 1.02 23% 1.0 1.52 1.0 1.52 100% US $104 1.6 0.15 10.2 0.98 15% 51% US $40 US $9Vast Resources plc AIM:VAST US $37 US ($1) US $44 2.4 1.31 3.2 1.72 76% 0.6 1.83 1.0 3.33 55% US $76 1.8 1.27 2.1 1.44 88% 55% US $18 US $14Victoria Gold Corp. TSXV:VIT US $190 US $27 US $162 4.5 0.65 4.6 0.66 99% 2.7 0.67 2.7 0.67 100% US $61 1.9 0.61 1.9 0.63 97% 30% US $36 US $35Group Average - Total # Companies: 47 US $115 US $42 US $38Group Average - 0 - 20 million ounces # Companies: 45 US $43 US $39Group Average - 20 - 50 million ounces # Companies: 1 US $43 US $16Group Average - +50 million ounces # Companies: 1 US $6 US $3Equivalency assumptions (US$ / 11-17-17): $1,292/oz Au, $17.31/oz Ag, $952/oz Pt, $997/oz Pd, $3.06/lb Cu, $1.46/lb Zn, $1.10/lb Pb, $5.22/lb Ni, $8.55/lb Mo, $27.90/lb Co, $8,000/t Sb, $20.20/lb U3O8, $0.20/lb Sn, $93.00/t HCC, $61.49/t 62% FeSource: SNL Financial retrieved on November 17, 2017
SymbolMarket
Capitalization(millions)
WorkingCapital
(millions)
EnterpriseValue
(millions)
Global Reserves & ResourcesAu
(Moz)Au
(g/t)AuEq(Moz)
AuEq(g/t) % Au
GlobalEV/oz
AuEV/ozAuEq
Resources (M&I and Inferred)Au
(Moz)Au
(g/t)AuEq(Moz) % AuAuEq
(g/t)% Au
InferredEV/oz
Au
ReservesAu
(Moz)Au
(g/t)AuEq(Moz) % AuAuEq
(g/t)

The Weekly Dig 11/17/17
Haywood Mining [email protected] Page 25
Gold Exploration-Stage Companies (Resource Only) – Production Statistics
Alexandria Minerals Corporation TSXV:AZX US $22 US $4 US $18 1.6 1.82 2.2 2.48 73% - - - - - 1.6 1.82 2.2 2.48 73% 41% US $11 US $8Antler Gold Inc. TSXV:ANTL US $8 US $1 US $5 - - - - - - - - - - - - - - - - - - Atacama Pacific Gold Corporation TSXV:ATM US $52 US $3 US $50 5.9 0.37 5.9 0.37 100% 3.7 0.40 3.7 0.40 100% 2.1 0.33 2.1 0.33 100% 29% US $8 US $8Aurion Resources Ltd. TSXV:AU US $130 US $6 US $124 0.8 0.70 0.8 0.70 100% - - - - - 0.8 0.70 0.8 0.70 100% - US $151 US $151Auris Minerals Limited ASX:AUR US $20 US $2 US $17 - - 0.2 1.48 - - - - - - - - 0.2 1.48 - - - US $106Auryn Resources Inc. TSX:AUG US $129 US $6 US $117 2.3 5.73 2.6 6.56 87% - - - - - 2.3 5.73 2.6 6.56 87% 72% US $51 US $45Balmoral Resources Ltd TSX:BAR US $49 US $7 US $41 0.6 0.76 1.1 1.54 49% - - - - - 0.6 0.76 1.1 1.54 49% 68% US $73 US $36Bellhaven Copper & Gold Inc. TSXV:BHV US $9 US ($0) US $9 - - - - - - - - - - - - - - - - - - Calibre Mining Corp. TSXV:CXB US $29 US $3 US $26 1.9 0.99 2.7 1.39 71% - - - - - 1.9 0.99 2.7 1.39 71% 98% US $13 US $10Cardinal Resources Limited ASX:CDV US $165 US $11 US $150 4.6 1.14 4.6 1.14 100% - - - - - 4.6 1.14 4.6 1.14 100% 80% US $33 US $33Columbus Gold Corp. TSX:CGT US $87 US ($4) US $84 3.4 0.78 4.1 0.94 83% 1.2 1.58 1.2 1.58 100% 2.2 0.61 2.9 0.80 76% 55% US $25 US $20Condor Gold PLC AIM:CNR US $32 US $5 US $28 3.7 3.08 4.1 3.35 92% 0.7 3.04 0.7 3.11 98% 3.1 3.09 3.4 3.40 91% 65% US $7 US $7Coral Gold Resources Ltd. TSXV:CLH US $13 US $15 US ($1) - - - - - - - - - - - - - - - - - - Corvus Gold Inc. TSX:KOR US $100 US $4 US $97 1.8 0.26 1.9 0.28 95% - - - - - 1.8 0.26 1.9 0.28 95% 64% US $55 US $52Eastmain Resources Inc. TSX:ER US $50 US $6 US $41 1.8 4.37 1.8 4.37 100% - - - - - 1.8 4.37 1.8 4.37 100% 34% US $23 US $23Ho Chi Minh City Investment Fund 0 US $0 US $0 US $0 3.5 4.38 3.7 4.62 95% - - - - - 3.5 4.38 3.7 4.62 95% 37% - - GobiMin Inc. TSXV:GMN US $16 US $28 US ($10) 2.9 1.49 2.9 1.50 99% - - - - - 2.9 1.49 2.9 1.50 99% 63% - - Gold Standard Ventures Corp TSX:GSV US $347 US $23 US $322 2.7 0.67 2.9 0.71 94% - - - - - 2.7 0.67 2.9 0.71 94% 67% US $120 US $113Golden Reign Resources Ltd. TSXV:GRR US $40 US $2 US $37 0.9 7.81 1.0 7.98 98% - - - - - 0.9 7.81 1.0 7.98 98% 84% US $39 US $38Granada Gold Mine Inc. TSXV:GGM US $12 US ($4) US $13 5.0 1.23 5.1 1.24 99% - - - - - 5.0 1.23 5.1 1.24 99% 69% US $3 US $3Harte Gold Corp. TSX:HRT US $175 US $5 US $162 0.5 9.47 0.5 9.47 100% - - - - - 0.5 9.47 0.5 9.47 100% 33% US $341 US $341IDM Mining Ltd. TSXV:IDM US $34 US $6 US $26 0.6 8.41 0.7 8.71 96% 0.5 7.53 0.5 7.83 96% 0.2 12.23 0.2 12.59 97% 37% US $40 US $39Jaxon Mining Inc. TSXV:JAX US $15 US $0 US $15 - - - - - - - - - - - - - - - - - - Kasbah Resources Limited ASX:KAS US $12 US ($1) US $11 0.2 0.55 0.3 0.63 88% - - 0.0 0.09 - 0.2 0.90 0.2 0.97 93% - US $48 US $42Kenadyr Mining (Holdings) Corp. TSXV:KEN US $9 US $9 US $4 - - - - - - - - - - - - - - - - - - Liberty Gold Corp. TSX:LGD US $52 US $4 US $57 2.0 0.36 4.5 0.80 45% - - - - - 2.0 0.36 4.5 0.80 45% 35% US $28 US $13Lincoln Mining Corporation TSXV:LMG US $1 US ($2) US $1 0.2 2.14 0.2 2.14 100% - - - - - 0.2 2.14 0.2 2.14 100% 54% US $8 US $8Lion One Metals Limited TSXV:LIO US $40 US $20 US $20 0.7 0.09 12.1 1.56 6% - - - - - 0.7 0.09 12.1 1.56 6% 60% US $26 US $2Marathon Gold Corporation TSX:MOZ US $116 US $12 US $102 2.2 2.06 2.2 2.06 100% - - - - - 2.2 2.06 2.2 2.06 100% 35% US $46 US $46Monarques Gold Corporation TSXV:MQR US $50 US $5 US $45 0.5 7.73 0.5 7.73 100% 0.1 6.77 0.1 6.77 100% 0.3 8.13 0.3 8.13 100% 50% US $96 US $96New Pacific Metals Corp. TSXV:NUAG US $133 US $16 US $121 0.5 6.12 0.6 7.34 83% - - - - - 0.5 6.12 0.6 7.34 83% 45% US $239 US $199Nighthawk Gold Corp. TSX:NHK US $91 US $22 US $70 2.4 1.74 2.4 1.74 100% - - - - - 2.4 1.74 2.4 1.74 100% 88% US $29 US $29Novo Resources Corp. OTCPK:NSRP.F US $813 US $10 US $802 0.8 3.46 0.8 3.63 95% - - - - - 0.8 3.46 0.8 3.63 95% 47% US $996 US $950Orex Minerals Inc. TSXV:REX US $11 US $4 US $8 0.1 0.32 0.3 1.55 21% - - - - - 0.1 0.32 0.3 1.55 21% 47% US $117 US $24Osisko Mining Inc. TSX:OSK US $558 US $66 US $480 7.4 2.21 7.4 2.21 100% - - - - - 7.4 2.21 7.4 2.21 100% 42% US $65 US $65Osprey Gold Development Ltd. TSXV:OS US $2 US $1 US $1 0.4 3.81 0.4 3.81 100% - - - - - 0.4 3.81 0.4 3.81 100% 92% US $3 US $3Puma Exploration Inc. TSXV:PUM US $14 US ($0) US $14 0.1 0.44 1.9 6.51 7% - - - - - 0.1 0.44 1.9 6.36 7% 5% US $106 US $7Pure Gold Mining Inc. TSXV:PGM US $87 US ($1) US $85 1.8 8.91 1.8 8.91 100% - - - - - 1.8 8.91 1.8 8.91 100% 10% US $46 US $46Red Eagle Exploration Limited TSXV:XR US $25 US ($0) US $24 - - - - - - - - - - - - - - - - - - Red Pine Exploration Inc. TSXV:RPX US $26 US $3 US $22 0.7 1.75 0.7 1.75 100% - - - - - 0.7 1.75 0.7 1.75 100% 96% US $32 US $32Redstar Gold Corp. TSXV:RGC US $21 US $3 US $18 0.5 2.94 0.7 3.85 76% - - - - - 0.5 2.94 0.7 3.85 76% 7% US $33 US $25Regulus Resources Inc. TSXV:REG US $113 US $6 US $106 5.7 0.37 19.6 1.26 29% - - - - - 5.7 0.37 19.6 1.26 29% 89% US $18 US $5Reunion Gold Corporation TSXV:RGD US $25 US $9 US $16 0.7 2.10 0.7 2.10 100% - - - - - 0.7 2.10 0.7 2.10 100% - US $23 US $23Rupert Resources Ltd. TSXV:RUP US $75 US $5 US $74 0.2 1.74 0.2 1.74 100% 0.1 1.70 0.1 1.70 100% 0.1 1.77 0.1 1.77 100% 100% US $461 US $461Rye Patch Gold Corp. TSXV:RPM US $78 US ($6) US $84 4.4 0.42 4.9 0.47 88% - - - - - 4.4 0.42 4.9 0.47 88% 29% US $19 US $17Sarama Resources Ltd TSXV:SWA US $10 US ($1) US $10 0.7 1.67 0.7 1.67 100% - - - - - 0.7 1.67 0.7 1.67 100% 100% US $14 US $14Spanish Mountain Gold Ltd. TSXV:SPA US $19 US $1 US $17 8.0 0.33 8.2 0.34 98% - - - - - 8.0 0.33 8.2 0.34 98% 51% US $2 US $2Teras Resources Inc. TSXV:TRA US $16 US $1 US $16 1.1 0.48 1.3 0.56 87% - - - - - 1.1 0.48 1.3 0.56 87% 10% US $14 US $12Treasury Metals Inc. TSX:TML US $55 US ($0) US $56 1.6 1.88 1.9 2.27 82% - - - - - 1.6 1.88 1.9 2.27 82% 24% US $36 US $30TriMetals Mining Inc. TSX:TMI US $26 US $2 US $26 1.9 0.07 16.2 0.63 12% - - - - - 1.9 0.07 16.2 0.63 12% 40% US $14 US $2Vendetta Mining Corp. TSXV:VTT US $22 US $1 US $21 - - 1.4 5.50 - - - - - - - - 1.4 5.50 - - - US $15West Kirkland Mining Inc. TSXV:WKM US $18 US ($0) US $18 0.8 0.46 1.0 0.55 83% 0.6 0.58 0.7 0.69 84% 0.2 0.30 0.3 0.38 79% 45% US $22 US $19Group Average - Total # Companies: 44 US $80 US $70Equivalency assumptions (US$ / 11-17-17): $1,292/oz Au, $17.31/oz Ag, $952/oz Pt, $997/oz Pd, $3.06/lb Cu, $1.46/lb Zn, $1.10/lb Pb, $5.22/lb Ni, $8.55/lb Mo, $27.90/lb Co, $8,000/t Sb, $20.20/lb U3O8, $0.20/lb Sn, $93.00/t HCC, $61.49/t 6 Source: SNL Financial retrieved on November 17, 2017
EV/ozAu
EV/ozAuEq
Au(Moz)
Au(g/t)
AuEq(Moz)
AuEq(g/t) % Au
Global
% Au% Au Au(Moz)
Au(g/t)
AuEq(Moz)
Global Reserves & Resources Reserves Resources (M&I and Inferred)Au
(Moz)Au
(g/t)AuEq(Moz)
AuEq(g/t)
AuEq(g/t)
% AuInferred
Company SymbolMarket
Capitalization(millions)
WorkingCapital
(millions)
EnterpriseValue
(millions)
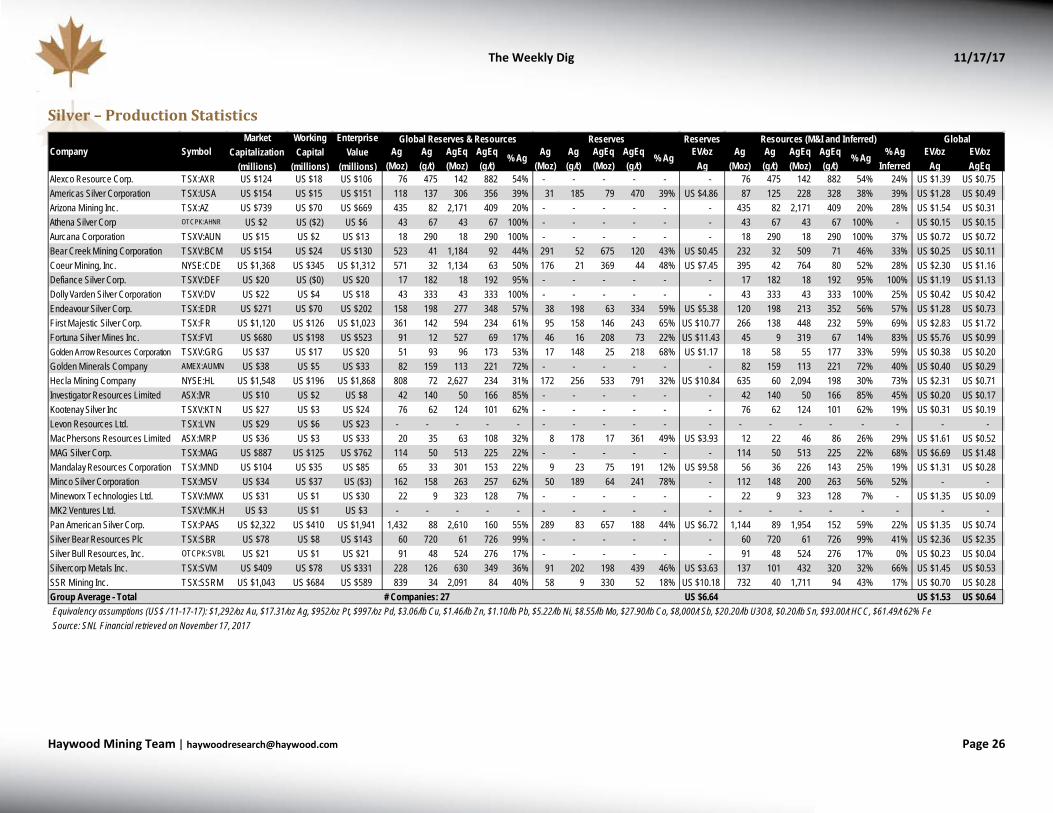
The Weekly Dig 11/17/17
Haywood Mining [email protected] Page 26
Silver – Production Statistics
Reserves
Alexco Resource Corp. TSX:AXR US $124 US $18 US $106 76 475 142 882 54% - - - - - - 76 475 142 882 54% 24% US $1.39 US $0.75Americas Silver Corporation TSX:USA US $154 US $15 US $151 118 137 306 356 39% 31 185 79 470 39% US $4.86 87 125 228 328 38% 39% US $1.28 US $0.49Arizona Mining Inc. TSX:AZ US $739 US $70 US $669 435 82 2,171 409 20% - - - - - - 435 82 2,171 409 20% 28% US $1.54 US $0.31Athena Silver Corp OTCPK:AHNR US $2 US ($2) US $6 43 67 43 67 100% - - - - - - 43 67 43 67 100% - US $0.15 US $0.15Aurcana Corporation TSXV:AUN US $15 US $2 US $13 18 290 18 290 100% - - - - - - 18 290 18 290 100% 37% US $0.72 US $0.72Bear Creek Mining Corporation TSXV:BCM US $154 US $24 US $130 523 41 1,184 92 44% 291 52 675 120 43% US $0.45 232 32 509 71 46% 33% US $0.25 US $0.11Coeur Mining, Inc. NYSE:CDE US $1,368 US $345 US $1,312 571 32 1,134 63 50% 176 21 369 44 48% US $7.45 395 42 764 80 52% 28% US $2.30 US $1.16Defiance Silver Corp. TSXV:DEF US $20 US ($0) US $20 17 182 18 192 95% - - - - - - 17 182 18 192 95% 100% US $1.19 US $1.13Dolly Varden Silver Corporation TSXV:DV US $22 US $4 US $18 43 333 43 333 100% - - - - - - 43 333 43 333 100% 25% US $0.42 US $0.42Endeavour Silver Corp. TSX:EDR US $271 US $70 US $202 158 198 277 348 57% 38 198 63 334 59% US $5.38 120 198 213 352 56% 57% US $1.28 US $0.73First Majestic Silver Corp. TSX:FR US $1,120 US $126 US $1,023 361 142 594 234 61% 95 158 146 243 65% US $10.77 266 138 448 232 59% 69% US $2.83 US $1.72Fortuna Silver Mines Inc. TSX:FVI US $680 US $198 US $523 91 12 527 69 17% 46 16 208 73 22% US $11.43 45 9 319 67 14% 83% US $5.76 US $0.99Golden Arrow Resources Corporation TSXV:GRG US $37 US $17 US $20 51 93 96 173 53% 17 148 25 218 68% US $1.17 18 58 55 177 33% 59% US $0.38 US $0.20Golden Minerals Company AMEX:AUMN US $38 US $5 US $33 82 159 113 221 72% - - - - - - 82 159 113 221 72% 40% US $0.40 US $0.29Hecla Mining Company NYSE:HL US $1,548 US $196 US $1,868 808 72 2,627 234 31% 172 256 533 791 32% US $10.84 635 60 2,094 198 30% 73% US $2.31 US $0.71Investigator Resources Limited ASX:IVR US $10 US $2 US $8 42 140 50 166 85% - - - - - - 42 140 50 166 85% 45% US $0.20 US $0.17Kootenay Silver Inc TSXV:KTN US $27 US $3 US $24 76 62 124 101 62% - - - - - - 76 62 124 101 62% 19% US $0.31 US $0.19Levon Resources Ltd. TSX:LVN US $29 US $6 US $23 - - - - - - - - - - - - - - - - - - - MacPhersons Resources Limited ASX:MRP US $36 US $3 US $33 20 35 63 108 32% 8 178 17 361 49% US $3.93 12 22 46 86 26% 29% US $1.61 US $0.52MAG Silver Corp. TSX:MAG US $887 US $125 US $762 114 50 513 225 22% - - - - - - 114 50 513 225 22% 68% US $6.69 US $1.48Mandalay Resources Corporation TSX:MND US $104 US $35 US $85 65 33 301 153 22% 9 23 75 191 12% US $9.58 56 36 226 143 25% 19% US $1.31 US $0.28Minco Silver Corporation TSX:MSV US $34 US $37 US ($3) 162 158 263 257 62% 50 189 64 241 78% - 112 148 200 263 56% 52% - - Mineworx Technologies Ltd. TSXV:MWX US $31 US $1 US $30 22 9 323 128 7% - - - - - - 22 9 323 128 7% - US $1.35 US $0.09MK2 Ventures Ltd. TSXV:MK.H US $3 US $1 US $3 - - - - - - - - - - - - - - - - - - - Pan American Silver Corp. TSX:PAAS US $2,322 US $410 US $1,941 1,432 88 2,610 160 55% 289 83 657 188 44% US $6.72 1,144 89 1,954 152 59% 22% US $1.35 US $0.74Silver Bear Resources Plc TSX:SBR US $78 US $8 US $143 60 720 61 726 99% - - - - - - 60 720 61 726 99% 41% US $2.36 US $2.35Silver Bull Resources, Inc. OTCPK:SVBL US $21 US $1 US $21 91 48 524 276 17% - - - - - - 91 48 524 276 17% 0% US $0.23 US $0.04Silvercorp Metals Inc. TSX:SVM US $409 US $78 US $331 228 126 630 349 36% 91 202 198 439 46% US $3.63 137 101 432 320 32% 66% US $1.45 US $0.53SSR Mining Inc. TSX:SSRM US $1,043 US $684 US $589 839 34 2,091 84 40% 58 9 330 52 18% US $10.18 732 40 1,711 94 43% 17% US $0.70 US $0.28Group Average - Total # Companies: 27 US $6.64 US $1.53 US $0.64Equivalency assumptions (US$ / 11-17-17): $1,292/oz Au, $17.31/oz Ag, $952/oz Pt, $997/oz Pd, $3.06/lb Cu, $1.46/lb Zn, $1.10/lb Pb, $5.22/lb Ni, $8.55/lb Mo, $27.90/lb Co, $8,000/t Sb, $20.20/lb U3O8, $0.20/lb Sn, $93.00/t HCC, $61.49/t 62% FeSource: SNL Financial retrieved on November 17, 2017
EV/ozAg
EV/ozAgEq
Ag(Moz)
Ag(g/t)
AgEq(Moz)
AgEq(g/t)
% Ag
Global
% Ag% Ag Ag(Moz)
Ag(g/t)
AgEq(Moz)
Global Reserves & Resources Reserves Resources (M&I and Inferred)Ag
(Moz)Ag(g/t)
AgEq(Moz)
AgEq(g/t)
AgEq(g/t)
% AgInferred
EV/ozAg
Company SymbolMarket
Capitalization(millions)
WorkingCapital
(millions)
EnterpriseValue
(millions)

The Weekly Dig 11/17/17
Haywood Mining [email protected] Page 27
Comparables Tables – Base Metals
Source: Bloomberg and Haywood Securities
As of November 17, 2017 Shares Market Working EnterpriseCompany Symbol Price 1-Day 7-Day YTD O/S Capitalization Cash Capital Debt Value 2016 2017E 2018 E
% % (%) (millions) (US$ millions) (US$ millions) (US$ millions) (US$millions)(US$millions) CFPS CFPS CFPS 2017E 2018E 2017E 2018E 2017E 2018E
Large-Cap Base Metals ProducersANGLO AMERICAN PLC LSE:AAL GBp1434 (0.3) (3.4) 23.6 1292 $24,475 $6,051 $5,924 $13,169 $35,506 $3.67 $4.60 $4.55 4.1x 4.2x 6.0x 6.0x 4.4x 4.7xANTOFAGASTA PLC LSE:ANTO GBp951 0.4 (1.7) 40.9 986 $12,382 $716 $1,881 $3,120 $15,006 $1.18 $1.64 $1.40 7.7x 9.0x 9.3x 10.9x 6.6x 6.6xBHP BILLITON LIMITED ASX:BHP AUD27.12 (0.6) (3.4) 8.2 3212 $103,960 $14,153 $9,690 $30,474 $125,725 $3.16 $2.89 $2.93 7.1x 7.0x 13.6x 13.4x 6.1x 5.9xFIRST QUANTUM MINERALS LTD TSX:FM CAD14.87 0.5 (7.6) 11.4 689 $8,026 $1,463 $849 $5,844 $14,230 $1.35 $1.53 $2.25 7.6x 5.2x 13.5x 9.2x 12.5x 7.7xFREEPORT-MCMORAN INC NYSE:FCX USD13.86 1.8 (3.8) 5.1 1448 $20,064 $4,245 $6,170 $16,027 $33,146 $2.83 $2.67 $3.35 5.2x 4.1x 8.6x 6.8x 6.1x 4.6xGLENCORE PLC LSE:GLEN GBp353.45 0.0 (2.5) 29.6 14395 $67,195 $2,508 $45 $33,218 $94,031 $0.40 $0.70 $0.80 6.7x 5.9x 9.3x 8.2x 6.5x 6.2xKGHM POLSKA MIEDZ SA WSE:KGH PLN112 1.2 (7.0) 21.1 200 $6,245 $206 $90 $1,939 $8,140 $5.16 $5.79 $7.55 5.4x 4.1x 7.0x 5.4x 5.2x 4.5xRIO TINTO PLC LSE:RIO GBp3546 (0.1) (4.0) 12.3 1349 $85,917 $8,201 $5,686 $17,630 $100,239 $4.71 $7.35 $7.03 6.4x 6.7x 10.1x 10.6x 5.4x 6.1xTECK RESOURCES LTD-CLS B TSX:TCK.B CAD27.98 3.4 2.6 4.1 571 $12,670 $1,046 $1,905 $6,203 $16,973 $3.26 $6.34 $5.24 3.5x 4.2x 4.7x 5.7x 3.8x 4.6xTURQUOISE HILL RESOURCES LT TSX:TRQ CAD3.91 2.4 (1.3) (9.3) 2012 $6,160 $1,418 $2,434 $4,139 $7,950 $0.11 $0.05 $0.09 61.2x 34.8x 79.0x 44.9x 38.4x 27.2xVALE SA-SP ADR NYSE:VALE USD10.11 1.4 0.4 32.7 4998 $53,418 $4,268 $11,349 $29,363 $75,995 - $2.02 $1.70 5.0x 5.9x 7.5x 9.0x 5.1x 5.9xBOLIDEN AB SSE:BOL SEK278.5 (0.5) (5.3) 17.1 274 $9,027 $165 $591 $1,112 $9,669 $2.99 $4.70 $4.96 7.0x 6.7x 7.5x 7.1x 6.4x 6.3xSOUTHERN COPPER CORP NYXE:SCCO USD42.95 1.2 (2.2) 34.5 773 $33,202 $546 $1,567 $5,954 $38,369 $1.19 $2.57 $2.92 16.7x 14.7x 19.3x 17.0x 12.2x 10.4x
Group Average - Large-Cap Producers 10.9x 8.3x 15.3x 11.8x 9.1x 7.6xGroup Average - Large-Cap Producers (excluding high/low) 6.1x 5.8x 9.4x 8.9x 6.4x 5.8x
Mid Tier Base Metals ProducersHUDBAY MINERALS INC TSX:HBM CAD9.81 3.5 (3.0) 27.7 261 $2,007 $147 $122 $1,232 $2,743 $1.48 $1.94 $1.97 4.0x 3.9x 5.4x 5.3x 4.7x 4.1xKAZ MINERALS PLC LSE:KAZ GBp779 (0.4) (4.1) 118.1 447 $4,597 $1,108 $866 $3,777 $7,044 ($0.20) $1.40 $1.59 7.4x 6.5x 11.3x 9.9x 7.6x 6.1xLUNDIN MINING CORP TSX: LUN CAD9.42 3.5 (4.5) 47.2 728 $5,366 $715 $2,052 $983 $4,610 $0.40 $1.10 $1.14 6.7x 6.5x 5.8x 5.6x 4.4x 4.6xMMG LTD SEHK:1208 HKD3.58 2.0 (6.8) 79.9 7958 $3,647 $553 $422 $10,253 $14,139 $0.05 $0.19 $0.19 2.5x 2.4x 9.5x 9.2x 7.4x 6.8xOZ MINERALS LTD ASX:OZL AUD8.36 1.1 (3.5) 6.0 299 $1,889 $473 $555 $0 $1,409 $0.80 $0.73 $0.69 8.7x 9.3x 6.4x 6.9x 3.8x 4.8xVEDANTA RESOURCES PLC LSE:VED GBp772 0.3 (8.1) (12.2) 270 $2,755 $2,565 ($1,588) $18,229 $18,601 $5.76 - $11.58 - 0.9x - 5.9x 5.8x 4.3x
Group Average - Mid Tier Producers 5.8x 4.9x 7.7x 7.1x 5.6x 5.1xGroup Average - Mid Tier Producers (excluding high/low) 6.0x 4.8x 7.2x 6.9x 5.6x 5.0x
Small Cap Base Metals ProducersAMERIGO RESOURCES LTD TSX:ARG CAD0.85 6.3 3.7 146.4 176 $117 $16 $1 $70 $161 $0.11 $0.11 $0.19 6.1x 3.6x 8.3x 4.9x - -ATALAYA MINING PLC TSX:AYM CAD2.74 (3.2) (2.1) 29.9 117 $250 $1 ($27) $0 $244 - $0.26 $0.31 8.2x 6.8x 8.1x 6.7x 4.7x 3.7xCAPSTONE MINING CORP TSX:CS CAD1.42 1.4 (3.4) 12.7 398 $443 $130 $171 $325 $734 $0.29 $0.29 $0.41 3.8x 2.7x 6.3x 4.6x 5.1x 4.0xCOPPER MOUNTAIN MINING COR TSX:CMMC CAD1.61 (1.8) (6.9) 71.3 132 $167 $23 ($1) $272 $443 $0.18 $0.45 $0.51 2.8x 2.5x 7.5x 6.6x 6.2x 5.3xIMPERIAL METALS CORP TSX:III CAD2.74 3.4 (6.8) (54.8) 95 $205 $11 ($66) $645 $913 $0.70 $0.45 $0.88 4.8x 2.4x 21.3x 10.9x 12.9x 6.1xWESTERN AREAS LTD AU:WSA AUD3.05 (2.2) (6.7) (0.7) 273 $629 $108 $116 $0 $522 $0.18 $0.21 $0.16 11.6x 14.5x 9.2x 12.0x 10.9x 9.7xSHERRITT INTERNATIONAL CORP TSX:S CAD1.33 (0.7) (7.6) 0.0 295 $307 $200 $368 $1,657 $1,799 ($0.01) ($0.14) $0.13 - 8.2x - 48.0x 14.5x 11.4xNEVSUN RESOURCES LTD TSX:NSU CAD2.98 (0.3) (0.7) (28.2) 302 $705 $199 $201 $0 $712 $0.18 $0.23 $0.42 10.1x 5.5x 10.2x 5.6x 11.4x 5.1xTASEKO MINES LTD TSX:TKO CAD2.66 5.6 (4.0) 129.3 227 $472 $66 $82 $289 $661 $0.12 $0.58 $0.37 3.6x 5.6x 5.1x 7.9x 4.8x 5.6xTREVALI MINING CORP TSX:TV CAD1.4 0.7 (5.4) 23.9 825 $904 $11 $8 $80 $1,053 $0.09 $0.19 $0.33 5.8x 3.4x 6.8x 3.9x 7.7x 3.2x
Group Average - Small Cap Producers 6.3x 5.5x 4.0x 11.1x 8.7x 6.0xGroup Average - Small Cap Producers (excluding high/low) 6.1x 4.8x 7.7x 7.4x 8.4x 5.7x
All data sourced from Bloomberg (compiled by Haywood Securities)
P/CF Ratio EV/CF Ratio EV/EBITDA Ratio

The Weekly Dig 11/17/17
Haywood Mining [email protected] Page 28
Copper Non-Producers – Resource and Market Statistics
Shares Market Working LTD Enterprise CopperCompany Symbol Price O/S Capitalization Capital Value Value Ratio*** Reserve (P&P) Resource (Total)
(million) (million) (million) (million) (million) (% Contained) (CuEq** Mlb) (CuEq** Mlb) Reserve TotalBellhaven Copper and Gold IncTSXV:BHV C$ 0.43 28.3 US$ 9 US$ (0.4) US$ 0.0 US$ 10 Au / Cu 40% - 1,036 - $0.009Candente Copper Corp. TSX:DNT C$ 0.14 177.7 US$ 19 US$ (1.1) US$ 0.0 US$ 21 Cu / Au 89% - 12,427 - $0.002Colorado Resources Ltd. TSXV:CXO C$ 0.25 121.2 US$ 24 US$ 4.3 US$ 0.0 US$ 19 Cu / Au 59% - 1,165 - $0.017Copper Fox Metals Inc TSXV:CUU C$ 0.13 437.0 US$ 44 US$ 0.5 US$ 0.0 US$ 44 Cu / Au 68% 2,375 5,648 $0.018 $0.008Coro Mining Corp. TSX:COP C$ 0.10 649.8 US$ 51 US$ (0.6) US$ 0.3 US$ 52 Cu / Au 84% 195 965 $0.265 $0.053Foran Mining Corporation TSXV:FOM C$ 0.33 99.0 US$ 26 US$ 0.6 US$ 0.0 US$ 25 Cu / Zn 46% - 1,756 - $0.014Getty Copper Inc. TSXV:GTC C$ 0.03 108.4 US$ 2 US$ (0.4) US$ 0.7 US$ 3 Cu / Mo 96% 620 969 $0.005 $0.003Gold Reach Resources Ltd. TSXV:GRV C$ 0.16 48.3 US$ 6 US$ 0.1 US$ 0.0 US$ 6 Cu / Mo 68% - 5,444 - $0.001Highland Copper Co Inc. TSXV:HI C$ 0.14 459.1 US$ 50 US$ 10.6 US$ 7.4 US$ 47 Cu / Ag 96% 871 6,019 $0.054 $0.008Indico Resources Ltd. TSXV:IDI C$ 0.02 147.0 US$ 2 US$ (4.0) US$ 0.0 US$ 6 Cu / - 100% - 410 - $0.014Los Andes Copper Limited TSXV:LA C$ 0.33 244.9 US$ 63 US$ 2.4 US$ 0.0 US$ 61 Cu / Mo 89% - 12,305 - $0.005Nevada Copper Corp. TSX:NCU C$ 0.64 93.2 US$ 47 US$ (2.7) US$ 162.7 US$ 212 Cu / Au 91% 5,791 7,917 $0.037 $0.027NGEx Resources Inc. TSX:NGQ C$ 1.04 213.5 US$ 174 US$ 3.6 US$ 0.0 US$ 170 Cu / Au 76% - 27,655 - $0.006Northern Dynasty Minerals Ltd. TSX:NDM C$ 2.80 303.9 US$ 665 US$ 20.3 US$ 0.0 US$ 645 Cu / Au 57% - 142,635 - $0.005Northisle Copper and Gold Inc. TSXV:NCX C$ 0.10 114.5 US$ 9 US$ 0.6 US$ 0.0 US$ 8 Cu / Au 51% - 4,358 - $0.002NovaCopper Inc. TSX:TMQ C$ 1.21 0.0 US$ 0 US$ 1.2 US$ 0.0 US$ (1) Cu / Zn 83% - 9,685 - -Panoro Minerals Ltd. TSXV:PML C$ 0.38 259.7 US$ 77 US$ 0.3 US$ 2.0 US$ 79 Cu / Au 77% - 10,114 - $0.008Polymet Mining Corp. TSX:POM C$ 0.77 319.2 US$ 192 US$ (116.2) US$ 0.0 US$ 308 Cu / Ni 49% 3,145 10,139 $0.098 $0.030Quaterra Resources Inc. TSXV:QTA C$ 0.07 201.0 US$ 10 US$ 2.0 US$ 0.0 US$ 8 Cu / Ag 96% - 8,247 - $0.001Redhawk Resources, Inc. TSX:RDK C$ 0.03 160.0 US$ 4 US$ (1.4) US$ 1.4 US$ 7 Cu / Mo 92% - 3,835 - $0.002Regulus Resources Inc TSXV:REG C$ 1.95 73.9 US$ 113 US$ 6.2 US$ 0.0 US$ 106 Cu / Au 0% - - - -Serengeti Resources Inc. TSXV:SIR C$ 0.19 86.4 US$ 13 US$ 0.9 US$ 0.0 US$ 12 Cu / Au 67% - 4,153 - $0.003St Augustine Gold and Copper TSX:SAU C$ 0.03 726.8 US$ 17 US$ (2.7) US$ 0.0 US$ 20 Cu / Au 58% 2,131 3,263 $0.009 $0.006Tintina Resources Inc. TSXV:TAU C$ 0.08 503.3 US$ 29 US$ 1.1 US$ 0.0 US$ 28 Cu / Co 86% - 1,538 - $0.018Western Copper and Gold Cor TSX:WRN C$ 1.15 96.7 US$ 87 US$ 3.9 US$ 0.0 US$ 83 Cu / Au 45% 10,033 22,599 $0.008 $0.004Group Average - Total $0.062 $0.011*All reserve and resource data sourced from IntierraRMG, additional data sourced from Capital IQ and Market Q.**CuEq = copper equivalent. Calculated based on Haywood's formal long-term metal price forecasts.***Copper Ratio = value of in situ copper / total value of in situ metals.
Primary / Secondary
Metal
Reserves & Resources* - AttributableEV/lb CuEq** (US$)

The Weekly Dig 11/17/17
Haywood Mining [email protected] Page 29
Nickel Non-Producers – Resource and Market Statistics
Zinc Non-Producers – Resource and Market Statistics
Shares Market Working LTD Enterprise NickelCompany Symbol Price O/S Capitalization Capital Value Value Ratio*** Reserve (P&P) Resource (Total)
(million) (million) (million) (million) (million) (% Contained) (NiEq** Mlb) (NiEq** Mlb) Reserve TotalAnfield Nickel Corp. TSXV:ANF C$ 0.38 119.2 US$ 35 US$ 20.1 US$ 0.0 US$ 15 Ni / Co 99% 2,169 3,616 $0.007 $0.004Asian Mineral Resources LimiteTSXV:ASN C$ 0.04 788.9 US$ 22 US$ (2.2) US$ 0.0 US$ 24 Ni / Cu 86% 85 146 $0.281 $0.163Canadian Arrow Mines Ltd. TSXV:CRO C$ 0.01 140.0 US$ 1 US$ (0.6) US$ 0.0 US$ 1 Ni / Cu 82% - 141 - $0.008FPX Nickel Corp. TSXV:FPX C$ 0.08 133.8 US$ 8 US$ 1.2 US$ 5.5 US$ 13 Ni / Fe 100% - 5,570 - $0.002Mustang Minerals Corp. TSXV:MUM C$ 0.36 34.1 US$ 10 US$ (0.6) US$ 0.0 US$ 10 Co / Ni 38% 2 1,176 $4.329 $0.009Noront Resources Ltd TSXV:NOT C$ 0.28 345.0 US$ 75 US$ (9.9) US$ 24.2 US$ 110 Ni / Cu 78% 498 851 $0.220 $0.129North American Nickel Inc. TSXV:NAN C$ 0.08 122.2 US$ 8 US$ 7.1 US$ 0.0 US$ 1 Ni / Cu 0% - - - -Northern Shield Resources Inc TSXV:NRN C$ 0.04 205.1 US$ 6 US$ 1.3 US$ 0.0 US$ 4 Ni / Cu 0% - - - -Poseidon Nickel Limited ASX:POS C$ 0.04 1055.1 US$ 35 US$ (2.0) US$ 14.8 US$ 52 Ni / Au 98% 171 1,284 $0.305 $0.041Royal Nickel Corporation TSX:RNX C$ 0.17 307.8 US$ 40 US$ (10.4) US$ 14.1 US$ 64 Ni / Cu 0% - - - -Sama Resources Inc. TSXV:SME C$ 0.31 138.3 US$ 33 US$ 3.3 US$ 0.0 US$ 30 Ni / Cu 71% - 195 - $0.152Strongbow Exploration Inc. TSXV:SBW C$ 0.19 77.9 US$ 12 US$ 0.4 US$ 1.0 US$ 12 Ni / Cu 86% - 417 - $0.029Talon Metals Corporation TSX:TLO C$ 0.08 129.6 US$ 8 US$ 0.7 US$ 19.6 US$ 27 Ni / Fe 56% - 125 - $0.216Group Average - Total $1.028 $0.075*All reserve and resource data sourced from IntierraRMG, additional data sourced from Capital IQ and Market Q.**NiEq = nickel equivalent. Calculated based on Haywood's formal long-term metal price forecasts.***Nickel Ratio = value of in situ nickel / total value of in situ metals.
Primary / Secondary
Metal
Reserves & Resources* - AttributableEV/lb NiEq** (US$)
Shares Market Working LTD Enterprise ZincCompany Symbol Price O/S Capitalization Capital Value Value Ratio*** Reserve (P&P) Resource (Total)
(million) (million) (million) (million) (million) (% Contained) (ZnEq** Mlb) (ZnEq** Mlb) Reserve TotalAquila Resources Inc. TSX:AQA C$ 0.28 281.3 US$ 60 US$ 0.6 US$ 0.0 US$ 60 Au / Zn 19% - 1,587 - $0.038Canada Zinc Metals Corp. TSXV:CZX C$ 0.28 167.2 US$ 36 US$ 6.1 US$ 0.0 US$ 30 Zn / Pb 82% - 6,096 - $0.005Canadian Zinc Corporation TSX:CZN C$ 0.16 266.1 US$ 33 US$ 1.6 US$ 0.0 US$ 32 Zn / Pb 40% 2,525 10,077 $0.013 $0.003El Nino Ventures Inc. TSXV:ELN C$ 0.04 61.6 US$ 2 US$ 0.2 US$ 0.0 US$ 2 Zn / Cu 45% - 1,357 - $0.001Firestone Ventures Inc. TSXV:FV C$ 0.09 46.1 US$ 3 US$ (0.7) US$ 0.0 US$ 4 Zn / Pb 73% - 454 - $0.009Foran Mining Corporation TSXV:FOM C$ 0.33 99.0 US$ 26 US$ 0.6 US$ 0.0 US$ 25 Cu / Zn 33% - 4,962 - $0.005InZinc Mining Ltd. TSXV:IZN C$ 0.13 73.7 US$ 7 US$ 0.2 US$ 0.0 US$ 7 Zn / Cu 77% - 3,873 - $0.002Rathdowney Resources Ltd. TSXV:RTH C$ 0.15 161.7 US$ 19 US$ 0.1 US$ 0.0 US$ 19 Zn / Pb 80% - 3,437 - $0.005Wolfden Resources Corp. TSXV:WLF C$ 0.49 86.2 US$ 33 US$ 1.4 US$ 0.0 US$ 32 Au / Zn 29% - 4,516 - $0.007Group Average - Total $0.013 $0.008*All reserve and resource data sourced from IntierraRMG, additional data sourced from Capital IQ and Market Q.**ZnEq = Zinc equivalent. Calculated based on Haywood's formal long-term metal price forecasts.***Zinc Ratio = value of in situ zinc / total value of in situ metals.
Primary / Secondary
Metal
Reserves & Resources* - AttributableEV/lb ZnEq** (US$)

The Weekly Dig 11/17/17
Haywood Mining [email protected] Page 30
Comparables Tables – Other (Uranium, Diamond, Cobalt, Uranium, Coal, Iron)
Uranium Comparables – Consensus Estimates
IBES Shares Market Enterprise Total Reserves IBESCompany (T icker)Haywood Covered Names bold
Share Price
Consensus Target
Implied Return
Outst. (millions)
Capitalization (millions)
Value (USD)(millions)
& Resources (M lb)
USD EV/lb Resource
Consensus NAV
Price / Nav 2016 2017 2018 2016 2017 2018 2016 2017 2018 2016 2017 2018
Cameco Corporation (CCO-T) $11.99 $13.93 16% 396 $4,746 $4,601 $14.15 0.85x $0.98 $1.23 $1.31 12.3x 9.7x 9.1x $0.44 $0.07 $0.39 27.3x 166.5x 31.0xUranium Energy (UEC-US) $1.49 $2.65 78% 156 $232.2 $228.9 $2.56 0.58x ($0.16) ($0.08) ($0.01) ($0.16) ($0.10) ($0.07)Energy Fuels (UUUU-US) $1.81 $4.10 127% 72 #VALUE! $142.2 $3.28 0.55x $0.05 ($0.10) ($0.16) 36.2x ($0.51) ($0.28) ($0.29)UR-Energy Inc. (URE-T) $0.82 $1.28 55% 146 $119.7 $111.6 $1.54 0.53x $0.03 $0.08 $0.08 31.1x 10.7x 10.6x ($0.03) $0.01 $0.00 126.2x 175.6xPeninsula Energy (PEN-AU) $0.36 $0.77 117% 232 $82.2 $75.2 $0.64 0.56x ($0.03) ($0.02) $0.02 20.5x ($0.07) ($0.03) ($0.01)Energy Resources (ERA-AU) $0.71 518 $367.6 ($34.0) $0.57 1.25x $0.02 ($0.02) ($0.04) 35.5x ($0.37) ($0.04) ($0.07)Group Average - Producers 0.72x 28.8x 10.2x 13.4x 27.3x 146.3x 103.3x
NexGen Energy (NXE-T) $2.99 $5.40 81% 339 $1,012 $775.0 $5.63 0.53x ($0.04) ($0.03) ($0.04) ($0.06) ($0.02) ($0.06)Denison Mines (DML-T) $0.70 $0.88 25% 559 $391.4 $270.1 $1.02 0.69x ($0.02) $0.02 ($0.02) 31.1x ($0.02) ($0.03) ($0.02)Fission Uranium (FCU-T) $0.70 $1.60 129% 485 $339.4 $231.5 $1.47 0.48x ($0.02) ($0.02) ($0.01) ($0.02) ($0.02) ($0.02)Berkeley Energia (BKY-AU) $0.85 $1.55 83% 255 $215.1 $136.3 ($0.03) ($0.06) ($0.05) ($0.03) ($0.05) $0.12 7.2xToro Energy (TOE-AU) $0.03 $0.04 25% 2,008 $64.3 $54.3 $0.07 0.46xGoviEx Uranium (GXU-V) $0.28 326 $89.8 $74.9UEX Corporation (UEX-T) $0.24 $0.40 70% 319 $75.0 $54.7 $0.49 0.48x ($0.03) ($0.03) ($0.02) ($0.02)Vimy Resources (VMY-AU) $0.14 $0.44 226% 360 $48.6 $32.9 $0.38 0.36x ($0.02) ($0.02) ($0.02) ($0.05) ($0.02) ($0.02)A-Cap Resources (ACB-AU) $0.05 872 $44.5 $30.5Deep Yellow (DYL-AU) $0.26 190 $48.5 $25.4Summit Resources (SMM-AU) $0.17 218 $36.0 $26.4Western Uranium (WUC-L) $0.99 20 $19.9 $15.6Energy Metals (EME-AU) $0.13 210 $27.3 $5.5Group Average - Developers 0.50x 31.1x 7.2x
Aurania Resources (ARU-V) $1.90 27 $51.9 $39.1Mega Uranium (MGA-T) $0.20 294 $58.9 $44.6Laramide Resources (LAM-T) $0.34 $0.60 79% 115 $38.6 $37.5 $0.72 0.47xBannerman Resources (BMN-AU) $0.05 851 $39.1 $26.8Globex Mining (GMX-T) $0.44 $1.00 127% 50 $22.1 $15.8IsoEnergy Ltd. (ISO-V) $0.30 46 $13.8 $7.5Kivalliq Energy (KIV-V) $0.09 247 $22.2 $15.4Skyharbour Resources (SYH-V) $0.46 $1.01 122% 54 $24.4 $16.1Forsys Metals (FSY-T) $0.16 148 $22.9 $17.7Plateau Uranium (PLU-V) $0.47 64 $30.2 $23.2Azimut Exploration (AZM-V) $0.34 45 $15.2 $10.3Aben Resources (ABN-V) $0.13 57 $7.1 $4.3Melkior Resources (MKR-V) $0.05 147 $6.6 $4.9Fission 3.0 (FUU-V) $0.06 220 $13.2 $8.7Purepoint Uranium (PTU-V) $0.09 189 $17.0 $12.0Blue Sky (BSK-V) $0.21 72 $15.1 $11.1CanAlaska Uranium (CVV-V) $0.34 27 $9.2 $6.0Zadar Ventures (ZAD-V) $0.08 90 $7.2 $4.9Anfield Resources (ARY-V) $0.04 202 $8.1 $5.8Avrupa Minerals (AVU-V) $0.07 87 $5.6 $4.2Cauldron Energy (CXU-AU) $0.04 329 $12.5 $5.892 Resources (NTY-V) $0.12 56 $6.4 $4.4Marenica Energy (MEY-AU) $0.14 44 $6.1 $5.5X-Terra Resources (XTT-V) $0.22 25 $5.4 $3.4U3O8 Corp. (UWE-T) $0.41 20 $8.0 $6.2Tajiri Resources (TAJ-V) $0.10 52 $5.2 $3.8Eros Resources (ERC-V) $0.16 48 $7.7 $2.7Pele Mountain (GEM-V) $0.02 21 $0.4 $3.1Montero Mining (MON-V) $0.15 18 $2.8 $2.2Uracan Resources (URC-V) $0.03 106 $2.6 $2.2Forum Uranium (FDC-V) $0.06 75 $4.1 $2.5enCore Energy (:EU-V) $0.06 111 $6.1 $3.5Uravan Minerals (UVN-V) $0.05 42 $2.1 $1.5Tarku Resources (TKU-V) $0.03 57 $1.7 $1.3Benton Resources (BEX-V) $0.05 79 $4.0 $1.5Roughrider Exploration (REL-V) $0.08 39 $2.9 $2.0Spruce Ridge (SHL-V) $0.02 73 $1.1 $1.0Aldever Resources (ALD-V) $0.05 42 $1.9 $1.3Elysee Development (ELC-V) $0.29 22 $6.2 ($3.9)Group Average - Explorers 0.47x
INVENTORY FUNDSUranium Participation (U-T) $4.23 $4.56 8% 132 $560.26 $435.5 $4.58 0.92x
All data sourced from S&P Capital IQ, SNL Financial, Bloomberg
Earnings CompsConsensus Targets In-Situ Comps - EV/lb U3O8 NAV Comps Cash Flow CompsEPS (LoC) P/EPS
DEVE
LOPE
RSEX
PLOR
ERS
CFPS (LoC) P/CFPS
PROD
UCER
S

The Weekly Dig 11/17/17
Haywood Mining [email protected] Page 31
Coal Comparables – Consensus Estimates
Large Cap USA Bloomberg Shares Market Daily Enterprise
Company (T icker) Share PriceConsensus
TargetImplied Return β
Outstanding (millions)
Capitalization (millions)
Volume (millions)
Weekly Liquidity WACC
Debt (millions)
Value (millions) 2015 2016 2017 2015 2016 2017 2015 2016 2017 2015 2016 2017
Large Cap USACONSOL ENERGY (CNX-US) US$ 16.80 US$ 19.42 15.6% 1.83 230 US$ 3,866 3.4 8.9% 9.8% US$ 2,774 US$ 6,263 2.77 3.75 4.41 6.1x 4.5x 3.8x 54.2x 23.8x 20.5x 7.7x 5.7x 5.3xFORESIGHT ENERGY (FELP-US) US$ 4.25 US$ 4.75 11.8% 1.59 78 US$ 606 0.0 0.1% 7.0% US$ 1,391 US$ 1,916 6.5x 6.2x 5.7xCORSA COAL (CSO-V) C$ 1.47 C$ 3.75 155.1% 2.69 95 C$ 139 0.0 0.1% 19.3% C$ 43 C$ 161 0.29 0.34 4.0x 3.4x 11.5x 8.9x 3.2x 2.9xWESTMORELAND COAL (WLB-US) C$ 1.77 C$ 4.00 126.0% 1.44 19 C$ 33 0.3 5.1% 4.6% C$ 1,109 C$ 1,057 4.1x 5.3x 5.3xWALTER ENERGY (WLT-US) US$ 0.01 2.19 81 US$ 1 0.1 0.4% 17.3% US$ 3,136 US$- 181CLOUD PEAK (CLD-US) US$ 4.30 US$ 4.33 0.7% 1.88 75 US$ 323 0.9 6.3% 8.1% US$ 483 US$ 615 0.92 0.76 0.58 4.7x 5.7x 7.4x 5.7x 6.4x 7.0xGroup Average - Large Cap USA Avg. -> 4.1x 4.1x 4.8x 23.7x 17.0x 25.6x 5.1x 5.2x 5.8x
Limitied PartnershipsALLIANCE RESOURCE (ARLP-US) US$ 18.85 US$ 25.00 32.6% 1.43 131 US$ 2,464 0.3 1.0% 10.6% US$ 662 US$ 3,029 6.3x 8.7x 9.2x 4.9x 5.0x 5.2xNATURAL RESOURCE (NRP-US) US$ 25.35 US$ 30.00 18.3% 1.75 12 US$ 310 0.0 0.7% 5.0% US$ 1,126 US$ 1,505 5.9x 4.9x 4.5x 6.7x 7.1x 7.4xGroup Average - Limited Partnerships Avg. -> 6.1x 6.8x 6.9x 5.8x 6.1x 6.3x
Large Cap Non-North AmericaNEW HOPE (NHC-AU) A$ 2.50 A$ 2.19 (12.3)% 0.79 831 A$ 2,078 0.2 0.3% 7.4% A$ 13 A$ 1,854 0.31 0.26 0.17 8.1x 9.6x 14.7x 10.8x 16.0x 18.4x 5.0x 6.9x 8.3xWHITEHAVEN COAL (WHC-AU) A$ 3.84 A$ 3.66 (4.6)% 1.89 1,026 A$ 3,940 7.0 2.4% 13.0% A$ 398 A$ 4,251 0.71 0.52 0.40 5.4x 7.4x 9.5x 9.3x 14.6x 17.1x 5.5x 7.5x 8.5xBANPU PUBLIC (BANPU-SET) ฿ 17.10 ฿ 22.73 32.9% 1.47 5,162 ฿ 88,269 53.7 3.0% 6.2% ฿ 114,111 ฿ 206,730 3.15 3.75 3.80 5.4x 4.6x 4.5x 8.6x 8.9x 8.9x 8.3x 8.4x 8.7xCHINA COAL (1898-HK) HK$ 3.49 HK$ 4.33 24.2% 1.34 4,107 HK$ 74,645 17.3 2.6% 7.0% HK$ 98,178 HK$ 157,079 1.03 1.08 1.15 2.9x 2.8x 2.6x 9.2x 10.5x 9.6x 8.4x 8.7x 8.6xCHINA SHENHUA (1088-HK) HK$ 19.08 HK$ 22.93 20.2% 1.30 3,399 HK$ 519,192 20.3 3.2% 9.5% HK$ 105,981 HK$ 539,937 3.82 3.64 3.61 4.2x 4.4x 4.5x 7.4x 8.2x 8.3x 5.7x 6.0x 6.1xCOAL OF (CZA-AU) A$ 0.04 2,818 A$ 101 0.0 0.0% 8.4% A$ 8 A$ 76 4.5x 1.8xNINE ENTERTAINMENT (NEC-AU) A$ 1.52 A$ 1.41 (7.3)% 1.14 871 A$ 1,324 4.7 2.1% 8.3% A$ 291 A$ 1,549 0.17 0.14 0.16 9.2x 10.8x 9.7x 10.8x 11.9x 12.7x 7.1x 7.7x 8.2xYANZHOU COAL (1171-HK) HK$ 7.10 HK$ 8.68 22.2% 1.32 1,952 HK$ 57,479 15.8 4.9% 6.6% HK$ 65,578 HK$ 111,049 2.09 2.28 2.03 2.9x 2.6x 3.0x 4.5x 5.5x 5.5x 7.3x 7.2x 7.7xGroup Average - Large Cap Non-North-America Avg. -> 5.4x 6.0x 6.9x 8.6x 10.8x 10.6x 6.3x 7.5x 7.2x
Developer/ExplorersFORTUNE MINERALS (FT -T) C$ 0.19 C$ 0.40 116.2% 1.65 302 C$ 55.9 0.7 1.0% 15.1% C$ 5 C$ 57JAMESON RESOURCES (JAL-AU) A$ 0.11 0.75 257 A$ 28.2 0.3 1.5% 7.3% A$ 0 A$ 24Group Average - Developers / Explorers Avg. ->
Sundry CompaniesADARO ENERGY (ADRO-JKSE) ¥ 1,770 ¥ 2,267 28.1% 1.27 31,986 ¥ 56,615,153 37.0 0.8% 10.1% ¥ 1,434 ¥ 4,640 0.02 0.02 0.02 5.5x 5.5x 5.5x 8.7x 8.7x 8.7x 3.6x 3.7x 3.8xNLC INDIA (NEYVELILIG-NSEI) रू 104.65 0.83 1,678 रू 175,572 1.0 0.6% 11.0% रू 86,674 रू 263,836SOUTHGOBI RESOURCES (SGQ-T) C$ 0.20 (0.75) 273 C$ 55 0.0 0.0% 4.6% C$ 118 C$ 154TAMBANG BATUBARA (PTBA-JKSE) ¥ 11,200 ¥ 14,563 30.0% 1.31 2,304 ¥ 25,806,277 5.0 1.0% 11.2% ¥ 2,368,524 ¥ 23,127,922 1540.78 1566.88 1533.40 7.3x 7.1x 7.3x 7.4x 7.7x 7.9x 4.8x 5.0x 5.0xGroup Average - Sundry Companies Avg. -> 6.4x 6.3x 6.4x 8.1x 8.2x 8.3x 18.6x 12.9x 4.4xAll data sourced from Bloomberg
EV/EBITDAP/EPSCFPS (LoC) P/CFPS

The Weekly Dig 11/17/17
Haywood Mining [email protected] Page 32
Iron Comparables – Consensus Estimates
Bloomberg Shares Market Daily Enterprise
Company (T icker) Share PriceConsensus
TargetImplied Return β
Outstanding (millions)
Capitalization (millions)
Volume (millions)
Weekly Liquidity WACC
Debt (millions)
Value (millions) 2017 2018 2019 2017 2018 2019 2017 2018 2019 2017 2018 2019
Diversified Mining HousesVALE SA (VALE3-BZ) R$ 32.92 R$ 40.32 22.5% 1.51 4,998 R$ 173,924 20.6 1.7% 12.6% R$ 95,563 R$ 245,349 6.61 5.57 5.84 5.0x 5.9x 5.6x 8.1x 10.1x 10.5x 5.1x 5.9x 5.9xBHP BILLITON (BHP-AU) A$ 27.12 A$ 28.23 4.1% 1.62 3,212 A$ 137,413 9.3 1.4% 10.2% A$ 30,474 A$ 125,731 3.64 3.83 3.81 7.5x 7.1x 7.1x 15.8x 14.8x 16.9x 6.1x 5.9x 6.3xRIO TINTO (RIO-AU) A$ 70.89 A$ 73.71 4.0% 1.25 424 A$ 113,648 2.4 3.0% 8.7% A$ 17,630 A$ 100,601 9.60 9.18 9.15 7.4x 7.7x 7.7x 11.4x 13.4x 14.0x 5.5x 6.2x 6.3xGroup Average - Diversifed Mining Avg. -> 6.6x 6.9x 6.8x 11.7x 12.7x 13.8x 5.6x 6.0x 6.2x
ProducersKUMBA IRON (KIO-SJE) ZAR 29,376 ZAR 17,980 (38.8)% 1.83 322 ZAR 94,616 0.8 1.4% 9.7% ZAR 4,500 ZAR 91,211 4578 3663 1779 6.4x 8.0x 16.5x 10.3x 16.1x 21.7x 5.0x 7.1x 9.3xFORTESCUE METALS (FMG-AU) A$ 4.71 A$ 5.44 15.6% 1.74 3,114 A$ 14,666 23.1 3.4% 10.6% A$ 4,471 A$ 13,741 1.53 0.89 1.04 3.1x 5.3x 4.5x 5.3x 8.2x 10.2x 2.8x 4.0x 4.4xCLEVELAND-CLIFFS INC (CLF-US) US$ 6.13 US$ 7.36 20.0% 2.35 297 US$ 1,818 10.5 18.1% 12.1% US$ 2,231 US$ 3,293 8.3x 7.2x 10.8x 6.5x 6.8x 8.3xMMX MINERACAO (MMXM3-BRZ) R$ 3.18 0.56 6 R$ 21 0.0 1.8% 11.4% R$ 134 R$ 158 FERREXPO PLC (FXPO-LSE) GBp 247 GBp 243.00 (1.7)% 1.49 589 GBp 1,456 2.8 1.8% 7.5% GBp 734 GBp 2,405 50.41 39.42 38.00 4.9x 6.3x 6.5x 5.3x 7.1x 10.7x 4.6x 5.6x 7.9xMOUNT GIBSON (MGX-AU) A$ 0.41 A$ 0.44 8.6% 1.06 1,097 A$ 444 1.6 0.9% 9.2% A$ 0 A$(3) 0.02 0.01 0.02 22.5x 31.2x 18.4x 18.4xGRANGE RESOURCES (GRR-AU) A$ 0.18 0.98 1,157 A$ 203 1.7 0.8% 8.5% A$ 9 A$ 54 BC IRON (BCI-AU) A$ 0.15 2.20 395 A$ 59 0.9 1.0% 16.3% A$ 0 A$ 23 Group Average - Producers Avg. -> 9.2x 12.7x 11.5x 9.5x 9.6x 13.3x 4.7x 5.9x 7.5x
Advanced Development / Exploration (Select Group)SUNDANCE RESOURCES (SDL-AU) A$ 0.01 1.13 7,626 A$ 38.1 11.9 0.7% 4.9% A$ 100 A$ 109 NEW MILLENNIUM (NML-T) C$ 0.09 1.49 181 C$ 16.3 0.1 0.7% 14.8% C$ 0 C$ 3 ZANAGA IRON (ZIOC-LSE) GBp 18 (0.16) 279 GBp 48.8 4.1 35.5% 3.9% GBp 0 GBp 60 CENTURY GLOBAL (CNT-T) C$ 0.20 98 C$ 19.2 0.0 0.0% 10.6% C$ 0 C$ 14 CHAMPION IRON (CIA-T) C$ 1.37 1.01 422 C$ 578.3 0.4 1.1% 11.6% C$ 44 C$ 635 BLACK IRON (BKI-T) C$ 0.11 0.31 160 C$ 17.6 0.2 0.8% 4.6% C$ 0 C$ 8 OCEANIC IRON (FEO-T) C$ 0.13 1.36 50 C$ 6.3 0.0 0.1% 13.7% C$ 2 C$ 6 MACARTHUR MINERALS (MMS-T) C$ 0.09 0.35 190 C$ 16.2 1.6 2.0% 9.3% C$ 0 C$ 18 Group Average - Developers / Explorers Avg. ->All data sourced from Bloomberg
EV/EBITDAP/EPSCFPS (LoC) P/CFPS

The Weekly Dig 11/17/17
Haywood Mining [email protected] Page 33
Performance of Companies Included in Junior X
Source: Haywood Securities
Close Price Market Capitalization
Cash at Quarter End Weekly Performance QTD Performance
Company Ticker (C$) (C$M) (C$M)Junior Exploration Names Algold Resources Ltd. TSXV:ALG 0.15 28.25 2.00 0.0% (3.3)% (2.8)%Ascot Resources Ltd. TSXV:AOT 1.37 202.29 28.00 1.5% (2.8)% (2.3)%Aurion Resources Ltd. TSXV:AU 2.42 166.78 23.00 7.6% 12.0% 12.6%Fireweed Zinc Ltd. TSXV:FWZ 0.69 12.25 1.50 3.0% 0.0% 0.5%GT Gold Corp. TSXV:GTT 0.81 64.26 4.50 3.8% (20.6)% (20.1)%Hannan Metals Ltd. TSXV:HAN 0.28 11.07 3.50 5.8% 5.8% 6.3%IDM Mining Ltd. TSXV:IDM 0.11 43.76 6.00 0.0% (4.3)% (3.8)%K92 Mining Inc. TSXV:KNT 0.50 78.87 3.00 0.0% 0.0% 0.5%Kootenay Silver Inc TSXV:KTN 0.20 34.94 4.40 8.1% 5.3% 5.8%Mawson Resources Limited TSX:MAW 0.37 38.96 3.50 (6.3)% (14.0)% (13.4)%Novo Resources Corp. TSXV:NVO 7.03 1039.80 72.00 (11.2)% (15.5)% (15.0)%Oklo Resources Limited ASX:OKU 0.33 94.02 13.00 13.8% 26.9% 27.5%Orford M ining Corporation TSXV:ORM 0.39 15.95 6.40 5.4% (13.3)% (12.8)%Probe Metals Inc. TSXV:PRB 1.56 146.41 30.00 9.1% 9.1% 9.6%QMX Gold Corporation TSXV:QMX 0.24 39.26 7.50 9.1% 2.1% 2.7%Regulus Resources Inc. TSXV:REG 1.95 144.19 7.00 (1.0)% (4.9)% (4.3)%Reunion Gold Corporation TSXV:RGD 0.12 32.63 12.00 (7.7)% 0.0% 0.5%Rupert Resources Ltd. TSXV:RUP 0.95 96.06 11.00 9.2% 5.6% 6.1%Xanadu Mines Limited ASX:XAM 0.27 153.76 11.20 (5.3)% (10.0)% (9.5)%Other Companies in the News No other news for the week
QTD Performance
vs. TSXV Index

The Weekly Dig 11/17/17
Haywood Mining [email protected] Page 34
Key Catalysts for Companies Featured in the Last Junior Exploration Report
Source: Haywood Securities
Company Ticker CatalystsJunior Exploration Names
Algold Resources Ltd. TSXV:ALG • Drilling results from Phase 4 defintion program
Ascot Resources Ltd. TSXV:AOT• Further results from 2017 120,000 metres of surface drilling (ongoing)• Results from additional 20,000 metres of exploration drilling (ongoing)
Aurion Resources Ltd. TSXV:AU• Results from the current drill program at the Aamurusko boulder field Q1 2018 • Drill results from Kutuvuoma (B2Gold JV) H2 2017• Prospecting and drilling results from other projects H1 2018
Fireweed Zinc Ltd. TSXV:FWZ• Drill program commencing (2,200 metres) Q3 2017• Resource update Q4 2017• PEA H1 2018
GT Gold Corp. TSXV:GTT • Drill assay results from recently completed 16,180 program at Saddle. 31 holes released so far and 33 still pending.
Hannan Metals Ltd. TSXV:HAN • 13 hole/8,500 metre drill program focussed on metallurgical sampling and expansion drilling - results ongoing
IDM Mining Ltd. TSXV:IDM
• Resource expansion and exploration drilling throughout 2017• Permitting: -Application of Environmental Assessment Certificate and Environmental Impact Statement under review -EA certificate expected Mid 2018, operating permits in H2 2018• Resource update expected Q1 2018• Construction H2 2018, H1 2019• Commencement of production H2 2019
K92 Mining Inc. TSXV:KNT• Continued development of Kora drive• Exploration and definition drilling at Kora• Continue regional exploration program
Kootenay Silver Inc TSXV:KTN
• Ongoing La Cigarra drill program focused on deposit expansion (up to 7,500 metres) - Results H2 2017• La Negra drill program (6,500 metres) by Pan American - Results H2 2017• Silver Fox Project drill program (3,000 metres) by Antofagasta - Results H2 2017• Resource update at La Cigarra Q1 2018• Set timeline for La Cigarra Preliminary Economic Assessment Q1 2018
Mawson Resources Limited TSX:MAW• Drilling at Rompas-Rajapalot set to commence this month• Magnetics survey• Follow-up drill program at Rajapalot set to commence early 2018
Novo Resources Corp. TSXV:NVO• Bulk sampling program using diamond and RC drilling results H1 2018• Economic study targeted for completion by Q4 2017• Updated resource estimate Q4 2017
Oklo Resources Limited ASX:OKU • Two-phase auger drill program at Oklo's other tenments in South Mali
Orford M ining Corporation TSXV:ORM• Qiqavik IP geophysics and drill results H2 2017• Carolina Gold Belt IP geophysics and drill results H2 2017
Probe Metals Inc. TSXV:PRB• 5-rig drill program underway at Val-d'Or (75,000 metres)• Updated resource estimate H2 2017
QMX Gold Corporation TSXV:QMX • Definition and expansion drilling at Bonnefond
Regulus Resources Inc. TSXV:REG• Results from 15-18,000 metres drilling program at AntaKori (ongoing)• Revise resource estimate by Q2 2018• Results from 10,000 ft drilling program at Golden Brew JV in Nevada (expected soon)
Reunion Gold Corporation TSXV:RGD• Arema and Haute Mana - geological mapping, trenching, augering and geotechnical sampling H2 2017• Dorlin - infill mapping and geotechnical sampling/trenching at Nivre Zone H2 2017• Drill program at Dorlin 2018
Rupert Resources Ltd. TSXV:RUP• Commence initial production of 35,000 ounces per year at Pahtavarra in H2 2017• Drilling of near mine exploration targets and definition drilling (ongoing)• New geological model to be tested with further drilling in Q4 2017
Xanadu Mines Limited ASX:XAM• Budget of A$11.2 million to fund 3-rig drill program through winter and into next year. Assay results expected to be released over this period

The Weekly Dig 11/17/17
Haywood Mining [email protected] Page 35
Dissemination of Research Research reports are disseminated either through electronic medium or in printed copy. Clients may access reports on our website, or receive publications directly via email. Haywood strives to ensure all clients receive research in a timely manner and at the same time. It is against our policy for analysts to discuss or circulate their recommendations internally prior to public distribution. This policy applies equally to recommendation changes, target changes and/or forecast revisions. For Canadian residents: Haywood Securities Inc. is a Canadian registered broker-dealer and a member of the Investment Industry Regulatory Organization of Canada, the Toronto Stock Exchange, the Toronto Venture Exchange and the Canadian Investor Protection Fund and accepts responsibility for the dissemination of this report. Any Canadian client that wishes further information on any securities discussed in this report should contact a qualified salesperson of Haywood Securities Inc. For U.S. residents: This investment research is distributed in the United States, as third party research by Haywood Securities (USA) Inc. Haywood Securities (USA) Inc. is a wholly owned subsidiary of Haywood Securities Inc., registered with the U.S. Securities and Exchange Commission, and is a member of FINRA and the Securities Investor Protection Corporation (SIPC). Haywood Securities (USA) Inc. as a U.S. registered broker-dealer accepts responsibility for this Research Report and its dissemination in the United States. Any U.S. client that wishes further information on any securities discussed in this report or wish to effect a transaction in these securities should contact a qualified salesperson of Haywood Securities (USA) Inc. Haywood Securities Inc. Research Analysts are considered Foreign Research Analysts to the USA and are not registered/qualified as Research Analysts with FINRA. As these analysts are considered Foreign Research Analysts they may not be specifically subject to FINRA (formerly NASD) Rule 2711 and FINRA (formerly NYSE) Rule 472 restrictions on communications with a Subject Company, Public Appearances and trading securities held by a Research Analyst Account. This report may be distributed in the following states: nil. Otherwise, this report may only be distributed into those states with an institutional buyer state securities registration exemption.
Analyst Certification We, Mick Carew, Geordie Mark, Colin Healey, Pierre Vaillancourt, and Kerry Smith, hereby certify that the views expressed in this report (which includes the rating assigned to the issuer’s shares as well as the analytical substance and tone of the report) accurately reflect my/our personal views about the subject securities and the issuer. No part of my/our compensation was, is, or will be directly or indirectly related to the specific recommendations.
Important Disclosures Of the companies included in the report the following Important Disclosures apply:
Ticker Company 1 2 3 4 5 6 7 8
TSX:AGI Alamos Gold Inc. X X X TSX:AKG Asanko Gold Inc. X X TSXV:AGB Atlantic Gold Corp. X X X X TSX:BTO B2Gold Corp. X X TSXV:BGM Barkerville Gold Mines Ltd. X X X TSX:ABX Barrick Gold Corporation X TSX:CS Capstone Mining Corp. X TSXV:KBLT Cobalt 27 Capital Corp. X X TSX:CMMC Copper Mountain Mining Corp. X TSX:DML Denison Mines Corp. X X TSX:DGC Detour Gold Corporation X X TSX:ELD Eldorado Gold Corporation X X TSX:EDV Endeavour Mining Corp. X X TSX:EFR Energy Fuels Inc. X X TSXV:FPC Falco Resources Ltd. X X TSXV:GQC GoldQuest Mining Corp. X

The Weekly Dig 11/17/17
Haywood Mining [email protected] Page 36
ASX:GOR Gold Road Resources Limited X TSX:HRT Harte Gold Corp. X X TSX:HBM Hudbay Minerals, Inc. X X TSXV:KNT K92 Mining Inc. X X X TSX:LGD Liberty Gold Corp. X X TSX:LUC Lucara Diamond Corp. X X TSX:LUG Lundin Gold Inc. X TSX:LUN Lundin Mining Corporation X TSX:MOZ Marathon Gold Corp. X X X X TSX:MAX Midas Gold Corp. X X X TSX:MPVD Mountain Province Diamonds Inc. X X X TSX:NXE NexGen Energy Ltd. X X X TSXV:NCA NewCastle Gold Ltd. X X X TSX:NSU Nevsun Resources Ltd. X X TSX:NHK Nighthawk Gold Corp. X X TSX:OGC OceanaGold Corporation X TSX:OR Osisko Gold Royalties Ltd. X X TSX:OSK Osisko Mining Corp. X X TSXV:PLU Plateau Uranium Inc. X X X TSXV:PGM Pure Gold Mining Inc. X X X X TSX:RIC Richmont Mines Inc. X TSXV:ROG Roxgold Inc. X X TSX:RNX RNC Minerals X X X TSX:SBB Sabina Gold and Silver Corp. X X TSX:SMF SEMAFO Inc. X TSX:THO Tahoe Resources Inc. X TSX:TML Treasury Metals Inc. X X TSXV:TREK Trek Mining Inc. X X X X X TSX:TV Trevali Mining Corp. X X X AMEX:UEC Uranium Energy Corp. X X X TSX:U Uranium Participation Corporation X X
1 The Analyst(s) preparing this report (or a member of the Analysts’ households) have a financial interest in this company.
2 As of the end of the month immediately preceding this publication either Haywood Securities, Inc., one of its subsidiaries, its officers or directors beneficially owned 1% or more of this company.
3 Haywood Securities, Inc. has reviewed lead projects of this company and a portion of the expenses for this travel have been reimbursed by the issuer.
4 Haywood Securities Inc. or one of its subsidiaries has managed or co-managed or participated as selling group in a public offering of securities for this company in the past 12 months.
5 Haywood Securities, Inc. or one of its subsidiaries has received compensation for investment banking services from this company in the past 12 months
6 Haywood Securities, Inc. or one of its subsidiaries has received compensation for investment banking services from this company in the past 24 months
7 Haywood Securities, Inc. or one of its subsidiaries is restricted on this company at the time of publication
8 Haywood Securities, Inc. or one of its subsidiaries expects to receive or intends to seek compensation for investment banking services from this company in the next three months
Other material conflict of interest of the research analyst of which the research analyst or Haywood Securities Inc. knows or has reason to know at the time of publication or at the time of public appearance: n/a

The Weekly Dig 11/17/17
Haywood Mining [email protected] Page 37
Rating Structure Each company within an analyst’s universe, or group of companies covered, is assigned: (i) a recommendation or rating, usually BUY, HOLD, or SELL; (ii) a 12 month target price, which represents an analyst’s current assessment of a company’s potential stock price over the next year; (iii) an overall risk rating which represents an analyst’s assessment of the company’s overall investment risk; and (iv) specific risk ratings or risk profile parameters which in their aggregate support an analyst’s overall risk rating. These ratings are more fully explained below. Before acting on our recommendation we caution you to confer with your Haywood investment advisor to determine the suitability of our recommendation for your specific investment objectives, risk tolerance and investment time horizon.
Recommendation Rating BUY –The analyst believes that the security will outperform other companies in their sector on a risk adjusted basis or for the reasons stated in the research report the analyst believes that the security is deserving of a (continued) BUY rating. HOLD – The analyst believes that the security is expected to perform in line with other companies in their sector on a risk adjusted basis or for the reasons stated in the research report the analyst believes that the security is deserving of a (continued) HOLD rating. SELL – Investors are advised to sell the security or hold alternative securities within the sector. Stocks in this category are expected to under-perform other companies on a risk adjusted basis or for the reasons stated in the research report the analyst believes that the security is deserving of a (continued) SELL rating. TENDER – The analyst is recommending that investors tender to a specific offering for the company’s stock. RESEARCH COMMENT – An analyst comment about an issuer event that does not include a rating or recommendation. UNDER REVIEW – Placing a stock Under Review does not revise the current rating or recommendation of the analyst. A stock will be placed Under Review when the relevant company has a significant material event with further information pending or to be announced. An analyst will place a stock Under Review while he/she awaits sufficient information to re-evaluate the company’s financial situation. COVERAGE DROPPED – Haywood Securities will no longer cover the issuer. Haywood will provide notice to clients whenever coverage of an issuer is discontinued. Haywood’s focus is to search for undervalued companies which analysts believe may achieve attractive risk-adjusted returns. This research coverage on potentially undervalued companies may result in an outweighed percentage of companies rated as BUY. Management regularly reviews rating and targets in all sectors to ensure fairness and accuracy. For further information on Haywood Securities’ research dissemination policies, please visit: http://haywood.com/what-we-offer/research/research-policy
Overall Risk Rating Very High Risk: Venture type companies or more established micro, small, mid or large cap companies whose risk profile parameters and/or lack of liquidity warrant such a designation. These companies are only appropriate for investors who have a very high tolerance for risk and volatility and who are capable of incurring temporary or permanent loss of a very significant portion of their investment capital. High Risk: Typically micro or small cap companies which have an above average investment risk relative to more established or mid to large cap companies. These companies will generally not form part of the broad senior stock market indices and often will have less liquidity than more established mid and large cap companies. These companies are only appropriate for investors who have a high tolerance for risk and volatility and who are capable of incurring a temporary or permanent loss of a significant loss of their investment capital. Medium-High Risk: Typically mid to large cap companies that have a medium to high investment risk. These companies will often form part of the broader senior stock market indices or sector specific indices. These companies are only appropriate for investors who have a medium to high tolerance for risk and volatility and who are prepared to accept general stock market risk including the risk of a temporary or permanent loss of some of their investment capital. Moderate Risk: Large to very large cap companies with established earnings who have a track record of lower volatility when compared against the broad senior stock market indices. These companies are only appropriate for investors who have a

The Weekly Dig 11/17/17
Haywood Mining [email protected] Page 38
medium tolerance for risk and volatility and who are prepared to accept general stock market risk including the risk of a temporary or permanent loss of some of their investment capital.
Distribution of Ratings (as of November 17, 2017) IB Clients
% # (TTM) Buy 76.3% 74 97.1% Hold 9.3% 9 2.9% Sell 0.0% 0 0.0% Tender 1.0% 1 0.0% UR (Buy) 0.0% 0 0.0% UR (Hold) 0.0% 0 0.0% UR (Sell) 0.0% 0 0.0% Dropped (TTM) 13.4% 13 0.0%
Price Chart, Rating and Target Price History (as of November 17, 2017) Alamos Gold Inc. (AGI-T) Date Target(C$) Rating
7/20/17 $10.00 Buy7/19/17 $11.50 Buy
11/11/16 $13.00 Buy7/7/16 $14.75 Buy
5/30/16 $10.25 Buy5/13/16 $9.50 Buy3/28/16 $7.75 Buy1/12/16 $7.00 Buy
11/13/15 $8.00 Buy7/15/15 $9.00 Buy1/27/15 $9.25 Buy
10/23/14 $11.25 Buy
02468
1012141618
Dec14
Mar15
Jun15
Sep15
Dec15
Mar16
Jun16
Sep16
Dec16
Mar17
Jun17
Sep17
Price History (C$) Target/Rating/Coverage Change
Atlantic Gold Corporation (AGB-V) Date Target(C$) Rating10/17/17 $1.90 Buy7/20/17 $1.80 Buy5/16/17 $1.75 Buy1/25/17 $1.30 Buy12/9/15 $1.35 Buy7/11/16 $1.25 Buy5/19/16 $1.10 Buy3/7/16 $1.00 Buy3/1/16 $0.85 Buy
1/12/16 $0.55 Buy12/10/15 $0.50 Buy
Initiated Coverage 12/9/15
00.20.40.60.8
11.21.41.61.8
2
Nov14
Feb15
May15
Aug15
Nov15
Feb16
May16
Aug16
Nov16
Feb17
May17
Aug17
Price History (C$) Target/Rating/Coverage Change
Asanko Gold Inc. (AKG-T) Date Target(C$) Rating8/4/17 $2.00 Hold
7/20/17 $4.50 Buy2/28/17 $5.20 Buy2/22/17 $5.50 Buy1/25/17 $5.50 Hold7/11/16 $6.50 Buy5/31/16 $5.25 Buy5/3/16 $5.00 Buy4/7/16 $3.50 Buy
3/24/16 $3.25 Hold1/12/16 $3.25 Buy7/15/15 $3.60 Buy1/21/15 $3.20 Buy
Initiated Coverage 12/11/13
0
1
2
3
4
5
6
7
Nov14
Feb15
May15
Aug15
Nov15
Feb16
May16
Aug16
Nov16
Feb17
May17
Aug17
Price History (C$) Target/Rating/Coverage Change
B2Gold Corp. (BTO-T) Date Target(C$) Rating7/20/17 $5.00 Buy1/25/17 $5.50 Buy8/5/16 $6.00 Buy8/3/16 $5.00 Buy
7/11/16 $4.50 Buy5/31/16 $2.80 Buy5/13/16 $2.75 Hold3/18/16 $2.10 Hold
11/16/15 $2.10 Buy3/17/15 $2.75 Buy1/27/15 $3.25 Buy
Transferred Coverage 09/12/12; Re-Initiated Coverage 02/05/14
0
1
2
3
4
5
6
7
Nov14
Feb15
May15
Aug15
Nov15
Feb16
May16
Aug16
Nov16
Feb17
May17
Aug17
Price History (C$) Target/Rating/Coverage Change
Barkerville Gold Mines Ltd. (BGM-V) Date Target(C$) Rating4/20/17 $1.60 Buy3/30/17 $1.00 Buy
Initiated Coverage: 3/30/2017
00.20.40.60.8
11.21.41.61.8
2
Nov14
Feb15
May15
Aug15
Nov15
Feb16
May16
Aug16
Nov16
Feb17
May17
Aug17
Price History (C$) Target/Rating/Coverage Change
Barrick Gold Corporation (ABX-T) Date Target(C$) Rating10/17/17 $28.00 Buy7/20/17 $30.50 Buy4/26/17 $37.00 Buy2/17/17 $38.50 Buy1/25/17 $33.00 Buy7/11/16 $37.50 Buy5/31/16 $25.25 Buy4/27/16 $25.00 Buy4/18/16 $20.50 Buy2/19/16 $19.50 Buy1/12/16 $14.50 Buy8/7/15 $11.00 Buy
7/15/15 $15.65 Hold4/29/15 $15.75 Hold2/20/15 $15.00 Hold1/27/15 $14.25 Hold0
51015202530354045
Nov14
Feb15
May15
Aug15
Nov15
Feb16
May16
Aug16
Nov16
Feb17
May17
Aug17
Price History (C$) Target/Rating/Coverage Change

The Weekly Dig 11/17/17
Haywood Mining [email protected] Page 39
Capstone Mining Corp (CS-T) Date Target(C$) Rating10/19/17 $1.75 Hold
8/1/17 $1.50 Buy7/20/17 $1.40 Buy6/20/17 $1.20 Buy
11/11/16 $1.00 Hold4/28/16 $1.00 Buy4/6/16 $0.80 Buy
2/18/16 $0.60 Buy1/12/16 $0.50 Buy7/9/15 $1.50 Buy
1/27/15 $2.00 Buy
Initiated Coverage 07/10/07; Name change Capstone Mining Corp. 11/25/08; Transferred Coverage 6/20/2017
0
0.5
1
1.5
2
2.5
3
Nov14
Feb15
May15
Aug15
Nov15
Feb16
May16
Aug16
Nov16
Feb17
May17
Aug17
Price History (C$) Target/Rating/Coverage Change
Cobalt 27 Capital Corp. (KBLT-V) Date Target(C$) Rating8/9/17 $11.50 Buy
Initiated Coverage: 8/9/2017
0
2
4
6
8
10
12
14
Dec14
Mar15
Jun15
Sep15
Dec15
Mar16
Jun16
Sep16
Dec16
Mar17
Jun17
Sep17
Price History (C$) Target/Rating/Coverage Change
Copper Mountain Mining Corporation (CMMC-T) Date Target(C$) Rating10/19/17 $2.00 Buy
8/8/17 $1.10 Hold7/20/17 $1.00 Hold6/20/17 $0.90 Hold11/8/16 $0.75 Buy10/7/16 $0.60 Buy5/3/16 $0.60 Hold
1/12/16 $0.60 Buy11/10/15 $1.00 Buy7/15/15 $1.85 Buy1/27/15 $2.00 Buy1/19/15 UR UR(Buy)
Initiated Coverage: 8/26/10; Transferred Coverage 6/20/2017
00.5
11.5
22.5
33.5
44.5
Nov14
Feb15
May15
Aug15
Nov15
Feb16
May16
Aug16
Nov16
Feb17
May17
Aug17
Price History (C$) Target/Rating/Coverage Change
Denison Mines Corp. (DML-T) Date Target(C$) Rating5/31/16 $1.80 Buy1/12/16 $1.90 Buy
Transferred & Re-initiated Coverage 08/20/12
00.20.40.60.8
11.21.41.61.8
2
Nov14
Feb15
May15
Aug15
Nov15
Feb16
May16
Aug16
Nov16
Feb17
May17
Aug17
Price History (C$) Target/Rating/Coverage Change
Detour Gold Corporation (DGC-T) Date Target(C$) Rating7/20/17 $28.00 Buy3/24/17 $27.50 Buy1/25/17 $32.00 Buy11/3/16 $38.00 Buy7/11/16 $49.00 Buy5/31/16 $32.00 Buy4/15/16 $28.00 Buy3/11/16 $24.00 Buy1/27/16 $19.50 Buy1/12/16 $18.75 Buy7/15/15 $18.50 Buy1/27/15 $14.00 Buy
0
10
20
30
40
50
60
Nov14
Feb15
May15
Aug15
Nov15
Feb16
May16
Aug16
Nov16
Feb17
May17
Aug17
Price History (C$) Target/Rating/Coverage Change
Eldorado Gold Corporation (ELD-T) Date Target(C$) Rating10/30/17 $2.50 Buy10/17/17 $5.00 Buy7/20/17 $5.50 Buy6/28/17 $6.50 Buy1/25/17 $8.25 Buy7/29/16 $8.75 Buy7/11/16 $9.25 Buy5/31/16 $7.50 Buy5/13/16 $6.75 Buy1/26/16 $4.50 Buy1/12/16 $6.50 Buy7/15/15 $6.75 Buy2/23/15 $7.75 Buy1/27/15 $9.00 Buy
0123456789
10
Nov14
Feb15
May15
Aug15
Nov15
Feb16
May16
Aug16
Nov16
Feb17
May17
Aug17
Price History (C$) Target/Rating/Coverage Change
Endeavour Mining Corporation (EDV-T) Date Target(C$) Rating10/17/17 $32.00 Buy7/20/17 $35.00 Buy1/25/17 $31.00 Buy
10/20/16 $33.00 Buy7/11/16 $33.00 Buy5/31/16 $22.00 Buy4/21/16 $19.75 Buy3/21/16 $14.50 Buy1/18/16 $12.00 Buy12/3/15 $11.00 Buy1/27/15 $13.00 Buy
Initiated Coverage 08/21/14; 10:1 Prices/Targets adjusted to reflect Stock Consolidation 12/02/15; Transfer of Coverage 10/20/16
0
5
10
15
20
25
30
35
40
Nov14
Feb15
May15
Aug15
Nov15
Feb16
May16
Aug16
Nov16
Feb17
May17
Aug17
Price History (C$) Target/Rating/Coverage Change
Energy Fuels Inc. (AMEX:UUUU) Date Target(US$) Rating1/25/17 $4.80 Buy11/4/16 $5.00 Buy5/31/16 $6.00 Buy1/12/16 $7.25 Buy9/30/15 $8.20 Buy7/15/15 $9.41 Buy
Targets and prices prior to 11/06/13 adjusted for share consolidation; Transferred & Re-initiated Coverage 08/20/12; Targets prior to 05/31/16 converted to US$ at spot
0123456789
10
Nov14
Feb15
May15
Aug15
Nov15
Feb16
May16
Aug16
Nov16
Feb17
May17
Aug17
Price History (US$) Target/Rating/Coverage Change

The Weekly Dig 11/17/17
Haywood Mining [email protected] Page 40
Falco Resources Ltd. (FPC-V) Date Target(C$) Rating5/11/17 $2.00 Buy
Initiated Coverage: 5/11/2017
0
0.5
1
1.5
2
2.5
Nov14
Feb15
May15
Aug15
Nov15
Feb16
May16
Aug16
Nov16
Feb17
May17
Aug17
Price History (C$) Target/Rating/Coverage Change
Gold Road Resources Limited (GOR-A) Date Target(C$) Rating10/17/17 $0.90 Buy10/20/16 $1.00 Buy9/13/16 $1.00 Buy
Initiated Coverage 9/13/2016; Transfer of Coverage 10/20/16
0
0.5
1
1.5
2
2.5
3
Nov14
Feb15
May15
Aug15
Nov15
Feb16
May16
Aug16
Nov16
Feb17
May17
Aug17
Price History (C$) Target/Rating/Coverage Change
Goldquest Mining Corp. (GQC-V) Date Target(C$) Rating10/11/17 $0.60 Buy
Initiated Coverage: 10/11/2017
00.10.20.30.40.50.60.70.80.9
Nov14
Feb15
May15
Aug15
Nov15
Feb16
May16
Aug16
Nov16
Feb17
May17
Aug17
Price History (C$) Target/Rating/Coverage Change
Harte Gold Corp. (HRT-T) Date Target(C$) Rating4/12/17 $1.00 Buy
Initiated Coverage: 4/12/2017
0
0.2
0.4
0.6
0.8
1
1.2
Nov14
Feb15
May15
Aug15
Nov15
Feb16
May16
Aug16
Nov16
Feb17
May17
Aug17
Price History (C$) Target/Rating/Coverage Change
Hudbay Minerals Inc. (HBM-T) Date Target(C$) Rating10/19/17 $12.50 Buy
8/4/17 $12.00 Buy7/20/17 $11.00 Buy6/20/17 $9.00 Buy
11/29/16 $10.00 Buy11/14/16 $8.25 Buy11/9/16 $7.25 Hold3/1/16 $7.25 Buy
1/18/16 $6.75 Buy1/12/16 $8.50 Buy7/15/15 $12.00 Buy5/11/15 $12.00 Hold2/23/15 $11.00 Hold
Initiated Coverage: 12/19/13; Transferred Coverage 6/20/2017
0
2
4
6
8
10
12
14
Nov14
Feb15
May15
Aug15
Nov15
Feb16
May16
Aug16
Nov16
Feb17
May17
Aug17
Price History (C$) Target/Rating/Coverage Change
Liberty Gold Corp. (LGD-T) Date Target(C$) Rating10/20/16 $1.00 Buy7/11/16 $1.20 Buy5/31/16 $1.00 Buy1/12/16 $0.70 Buy7/15/15 $1.50 Buy1/29/15 $1.90 Buy1/27/15 $1.60 Buy
Initiated Coverage 10/09/12; Transfer of Coverage 10/20/2016
00.20.40.60.8
11.21.41.61.8
2
Nov14
Feb15
May15
Aug15
Nov15
Feb16
May16
Aug16
Nov16
Feb17
May17
Aug17
Price History (C$) Target/Rating/Coverage Change
Lucara Diamond Corp. (LUC-T) Date Target(C$) Rating11/3/17 $3.20 Buy1/25/17 $3.50 Buy12/1/16 $3.00 Hold
11/10/16 $3.25 Hold8/8/16 $3.70 Hold8/2/16 $3.90 Hold
6/30/16 $3.90 Buy5/31/16 $4.40 Hold5/4/16 $4.10 Buy
3/15/16 $3.40 Buy1/12/16 $3.15 Buy12/3/15 $2.80 Buy8/13/15 $2.50 Buy4/28/15 $2.80 Buy
Initiated Coverage 04/28/15
00.5
11.5
22.5
33.5
44.5
5
Nov14
Feb15
May15
Aug15
Nov15
Feb16
May16
Aug16
Nov16
Feb17
May17
Aug17
Price History (C$) Target/Rating/Coverage Change
Lundin Gold Inc. (LUG-T) Date Target(C$) Rating10/17/17 $7.75 Buy1/25/17 $8.25 Buy7/11/16 $8.75 Buy5/31/16 $7.25 Buy12/8/15 $5.00 Buy
Initiated Coverage: 12/08/15
0123456789
10
Nov14
Feb15
May15
Aug15
Nov15
Feb16
May16
Aug16
Nov16
Feb17
May17
Aug17
Price History (C$) Target/Rating/Coverage Change

The Weekly Dig 11/17/17
Haywood Mining [email protected] Page 41
Lundin Mining Corporation (LUN-T) Date Target(C$) Rating10/19/17 $11.50 Buy7/27/17 $11.00 Buy6/20/17 $10.00 Buy12/1/16 $8.50 Buy
11/16/16 $7.50 Buy7/28/16 $6.00 Buy4/29/16 $5.50 Buy3/15/16 $5.00 Buy11/2/15 $7.75 UR (Buy)7/15/15 $7.75 Buy1/27/15 $6.75 Buy
Transferred Coverage: 11/02/15; Transferred Coverage 6/20/2017
0
2
4
6
8
10
12
Nov14
Feb15
May15
Aug15
Nov15
Feb16
May16
Aug16
Nov16
Feb17
May17
Aug17
Price History (C$) Target/Rating/Coverage Change
Marathon Gold Corporation (MOZ-T) Date Target(C$) Rating2/27/17 $1.50 Buy1/17/17 $1.10 Buy
Initiated Coverage: 1/17/2017
00.20.40.60.8
11.21.41.61.8
2
Nov14
Feb15
May15
Aug15
Nov15
Feb16
May16
Aug16
Nov16
Feb17
May17
Aug17
Price History (C$) Target/Rating/Coverage Change
Midas Gold Corp. (MAX-T) Date Target(C$) Rating7/20/17 $1.50 Buy1/25/17 $1.75 Buy7/11/16 $1.90 Buy5/31/16 $0.95 Buy4/21/16 $0.85 Buy3/11/16 $0.65 Buy1/12/16 $0.45 Hold7/15/15 $0.50 Hold1/27/15 $0.80 Buy1/9/15 $0.85 Buy
Transferred and Re-initiated Coverage 11/05/13
00.20.40.60.8
11.21.41.61.8
2
Nov14
Feb15
May15
Aug15
Nov15
Feb16
May16
Aug16
Nov16
Feb17
May17
Aug17
Price History (C$) Target/Rating/Coverage Change
Mountain Province Diamonds Inc. (MPVD-T) Date Target(C$) Rating4/26/17 $6.30 Buy3/30/17 $7.00 Buy
10/17/16 $10.00 Buy3/31/16 $7.60 Buy1/12/16 $8.00 Buy7/15/15 $8.50 Buy2/19/15 $7.40 Buy2/5/15 $7.70 Buy
Initiated Coverage 02/05/15
0
2
4
6
8
10
12
Nov14
Feb15
May15
Aug15
Nov15
Feb16
May16
Aug16
Nov16
Feb17
May17
Aug17
Price History (C$) Target/Rating/Coverage Change
NewCastle Gold Ltd. (NCA-T) Date Target(C$) Rating10/17/17 $1.50 Buy1/10/17 $1.60 Buy
10/31/16 UR UR7/11/16 $1.20 Buy5/31/16 $0.80 Buy1/12/16 $0.45 Buy9/3/15 $0.30 Buy
7/15/15 $0.60 Buy1/27/15 $0.70 Buy
12/12/14 $0.65 Buy
Initiated Coverage 11/28/13; Name changed to NewCastle Gold 06/30/15; Transfer of Coverage 10/20/2016
00.20.40.60.8
11.21.41.61.8
Nov14
Feb15
May15
Aug15
Nov15
Feb16
May16
Aug16
Nov16
Feb17
May17
Aug17
Price History (C$) Target/Rating/Coverage Change
Nevsun Resources Ltd. (NSU-T) Date Target(C$) Rating11/1/17 $4.00 Buy7/20/17 $3.70 Hold6/20/17 $3.50 Hold6/30/16 $6.00 Buy4/26/16 $5.00 Buy7/15/15 $5.00 Buy4/29/15 $5.50 Buy
Initiated Coverage: 08/27/04; Transferred Coverage 6/20/2017
0
1
2
3
4
5
6
7
8
Nov14
Feb15
May15
Aug15
Nov15
Feb16
May16
Aug16
Nov16
Feb17
May17
Aug17
Price History (C$) Target/Rating/Coverage Change
NexGen Energy Ltd. (NXE-T) Date Target(C$) Rating2/27/17 $6.00 Buy1/25/17 $4.50 Buy4/14/16 $4.00 Buy3/30/16 $3.20 Buy1/12/16 $2.00 Buy11/5/15 $2.10 Buy
Initiated Coverage 11/05/15
0
1
2
3
4
5
6
7
Nov14
Feb15
May15
Aug15
Nov15
Feb16
May16
Aug16
Nov16
Feb17
May17
Aug17
Price History (C$) Target/Rating/Coverage Change
Nighthawk Gold Corp. (NHK-T) Date Target(C$) Rating10/20/17 $1.30 Buy
Initiated Coverage: 10/20/2017
00.20.40.60.8
11.21.41.61.8
Nov14
Feb15
May15
Aug15
Nov15
Feb16
May16
Aug16
Nov16
Feb17
May17
Aug17
Price History (C$) Target/Rating/Coverage Change

The Weekly Dig 11/17/17
Haywood Mining [email protected] Page 42
OceanaGold Corporation (OGC-T) Date Target(C$) Rating10/17/17 $4.20 Hold7/20/17 $4.40 Hold6/28/17 $5.10 Buy1/25/17 $5.75 Buy7/11/16 $6.50 Buy5/31/16 $4.40 Hold4/29/16 $4.35 Hold3/1/16 $3.80 Hold
2/19/16 $4.00 Hold10/2/15 $4.00 Buy7/15/15 $4.10 Buy4/30/15 $3.80 Buy2/20/15 $3.60 Buy1/27/15 $3.20 Buy
Initiated Coverage 09/22/14
0
1
2
3
4
5
6
7
Nov14
Feb15
May15
Aug15
Nov15
Feb16
May16
Aug16
Nov16
Feb17
May17
Aug17
Price History (C$) Target/Rating/Coverage Change
Osisko Gold Royalties Ltd. (OR-T) Date Target(C$) Rating10/17/17 $19.00 Buy7/20/17 $19.50 Buy1/25/17 $18.25 Buy
10/20/16 $19.00 Buy7/11/16 $20.25 Buy3/2/16 $19.00 Buy
12/16/15 $18.75 Buy
Initiated Coverage 12/16/2015; Transfer of Coverage 10/20/2016
0
5
10
15
20
25
Nov14
Feb15
May15
Aug15
Nov15
Feb16
May16
Aug16
Nov16
Feb17
May17
Aug17
Price History (C$) Target/Rating/Coverage Change
Osisko Mining Inc. (OSK-T) Date Target(C$) Rating4/6/17 $6.50 Buy
3/17/17 $5.00 Buy10/20/16 $4.00 Buy7/11/16 $4.00 Buy5/31/16 $3.00 Buy2/4/16 $2.00 Buy
12/10/15 $2.50 Buy
Initiated Coverage 12/10/2016; Transfer of Coverage 10/20/2016
0
1
2
3
4
5
6
7
Nov14
Feb15
May15
Aug15
Nov15
Feb16
May16
Aug16
Nov16
Feb17
May17
Aug17
Price History (C$) Target/Rating/Coverage Change
Pure Gold Mining Inc. (PGM-V) Date Target(C$) Rating6/28/17 $1.00 Buy
Initiated Coverage: 6/28/2017
0
0.2
0.4
0.6
0.8
1
1.2
Nov14
Feb15
May15
Aug15
Nov15
Feb16
May16
Aug16
Nov16
Feb17
May17
Aug17
Price History (C$) Target/Rating/Coverage Change
Richmont Mines Inc. (RIC-T) Date Target(C$) Rating9/12/17 n/a Tender1/25/17 $14.00 Buy7/11/16 $20.00 Buy5/31/16 $15.75 Buy5/13/16 $12.25 Buy4/13/16 $10.00 Buy3/7/16 $8.00 Buy
Initiated Coverage: 3/7/16
0
5
10
15
20
25
Nov14
Feb15
May15
Aug15
Nov15
Feb16
May16
Aug16
Nov16
Feb17
May17
Aug17
Price History (C$) Target/Rating/Coverage Change
RNC Minerals (RNX-T) Date Target(C$) Rating9/26/17 $0.25 Hold
11/15/16 $0.65 Buy4/27/16 $0.75 Buy1/12/16 $0.35 Buy7/15/15 $0.50 Buy1/27/15 $0.60 Buy
Initiated Coverage: 07/05/11; Name Change to RNC Minerals 9/13/2016; Transferred Coverage 9/26/2017
0
0.1
0.2
0.3
0.4
0.5
0.6
0.7
0.8
Nov14
Feb15
May15
Aug15
Nov15
Feb16
May16
Aug16
Nov16
Feb17
May17
Aug17
Price History (C$) Target/Rating/Coverage Change
Roxgold Inc. (ROXG-T) Date Target(C$) Rating10/17/17 $1.70 Buy7/20/17 $1.80 Buy1/25/17 $2.00 Buy
10/20/16 $2.10 Buy7/11/16 $2.15 Buy5/31/16 $1.60 Buy4/28/16 $1.50 Buy7/15/15 $1.10 Buy11/5/14 $1.00 Buy
Initiated Coverage 01/27/14; Transfer of Coverage 10/20/2016
0
0.5
1
1.5
2
2.5
Nov14
Feb15
May15
Aug15
Nov15
Feb16
May16
Aug16
Nov16
Feb17
May17
Aug17
Price History (C$) Target/Rating/Coverage Change
Sabina Gold & Silver Corp. (SBB-T) Date Target(C$) Rating10/19/17 $2.50 Hold10/17/17 $2.70 Buy
9/5/17 $2.75 Buy7/19/17 $2.50 Buy1/25/17 $1.70 Buy6/16/16 $1.65 UR (Buy)5/31/16 $1.65 Buy1/12/16 $1.00 Buy
12/15/15 $0.90 Buy
Initiated Coverage 12-15-15
0
0.5
1
1.5
2
2.5
3
Nov14
Feb15
May15
Aug15
Nov15
Feb16
May16
Aug16
Nov16
Feb17
May17
Aug17
Price History (C$) Target/Rating/Coverage Change

The Weekly Dig 11/17/17
Haywood Mining [email protected] Page 43
B: Buy; H: Hold; S: Sell; T: Tender; UR: Under Review
Source: Capital IQ and Haywood Securities
SEMAFO Inc. (SMF-T) Date Target(C$) Rating4/25/17 $4.50 Buy3/9/17 $5.50 Buy
1/25/17 $7.00 Buy11/10/16 $7.50 Buy7/11/16 $8.25 Buy5/12/16 $6.50 Buy2/26/16 $6.00 Buy7/15/15 $5.00 Buy1/27/15 $5.75 Buy
0123456789
Nov14
Feb15
May15
Aug15
Nov15
Feb16
May16
Aug16
Nov16
Feb17
May17
Aug17
Price History (C$) Target/Rating/Coverage Change
Tahoe Resources Inc. (THO-T) Date Target(C$) Rating10/17/17 $7.25 Hold9/11/17 $7.75 Hold8/9/17 $6.75 Hold
7/19/17 $7.25 Hold7/6/17 $9.00 Sell5/3/17 $13.00 Hold
3/13/17 $12.00 Hold1/25/17 $14.00 Hold11/4/16 $25.00 Buy8/11/16 $28.00 Buy7/11/16 $25.00 Buy5/9/16 $20.00 Buy
7/15/15 $16.50 Buy4/29/15 $19.25 Buy4/2/15 $16.00 Hold
1/27/15 $14.50 Sell12/5/14 $12.75 Sell
Initiated Coverage 11/05/13
0
5
10
15
20
25
30
Nov14
Feb15
May15
Aug15
Nov15
Feb16
May16
Aug16
Nov16
Feb17
May17
Aug17
Price History (C$) Target/Rating/Coverage Change
Treasury Metals Inc. (TML-T) Date Target(C$) Rating7/20/17 $1.20 Buy2/23/17 $1.10 Buy
Initiated Coverage: 6/23/2017
0
0.2
0.4
0.6
0.8
1
1.2
1.4
Nov14
Feb15
May15
Aug15
Nov15
Feb16
May16
Aug16
Nov16
Feb17
May17
Aug17
Price History (C$) Target/Rating/Coverage Change
Trek Mining Inc. (TREK-V) Date Target(C$) Rating10/17/17 $2.80 Buy
4/4/17 $3.00 Buy
Initiated Coverage: 4/4/2017
0
1
2
3
4
5
6
Nov14
Feb15
May15
Aug15
Nov15
Feb16
May16
Aug16
Nov16
Feb17
May17
Aug17
Price History (C$) Target/Rating/Coverage Change
Trevali Mining Corporation (TV-T) Date Target(C$) Rating10/19/17 $2.30 Buy7/20/17 $2.00 Buy6/20/17 $1.75 Buy
11/17/16 $1.50 Buy8/15/16 $1.25 Buy7/20/16 $1.00 Buy
11/18/15 $0.75 Buy5/21/15 $1.25 Buy
Initiated Coverage: 02/11/13; Transferred Coverage 6/20/2017
0
0.5
1
1.5
2
2.5
Nov14
Feb15
May15
Aug15
Nov15
Feb16
May16
Aug16
Nov16
Feb17
May17
Aug17
Price History (C$) Target/Rating/Coverage Change
Uranium Participation Corporation (U-T) Date Target(C$) Rating1/25/17 $5.10 Buy
12/19/16 $5.80 Buy1/12/16 $6.80 Buy7/15/15 $6.50 Buy1/27/15 $6.20 Buy
Transferred & Re-initiated Coverage 08/20/12
0
1
2
3
4
5
6
7
8
Nov14
Feb15
May15
Aug15
Nov15
Feb16
May16
Aug16
Nov16
Feb17
May17
Aug17
Price History (C$) Target/Rating/Coverage Change
Uranium Energy Corp. (UEC-AMEX) Date Target(US$) Rating5/11/17 $2.90 Buy2/3/17 $2.40 Buy
1/25/17 $2.00 Buy5/31/16 $1.80 Buy7/15/15 $2.00 Buy6/24/15 $2.10 Hold
Transferred & Re-initiated Coverage 08/20/12
0
0.5
1
1.5
2
2.5
3
3.5
Nov14
Feb15
May15
Aug15
Nov15
Feb16
May16
Aug16
Nov16
Feb17
May17
Aug17
Price History (US$) Target/Rating/Coverage Change