melt-dose: redefiniendo el tratamiento con … redefiniendo el tratamiento con tacrolimus: josep m...
TRANSCRIPT

Melt-Dose:
Redefiniendo el tratamiento con tacrolimus:
Josep M Grinyó
Department of Nephrology
Bellvitge University Hospital
IDIBELL, University of Barcelona

Immunosuppressive drugs used during the first six weeks after transplantation.
Transplants 1995, 2004, and 2010
CsA CS AZA OKT3 GAL MMF TAC RAPA Basiliximab Others Daclizumab
RMRC 2012
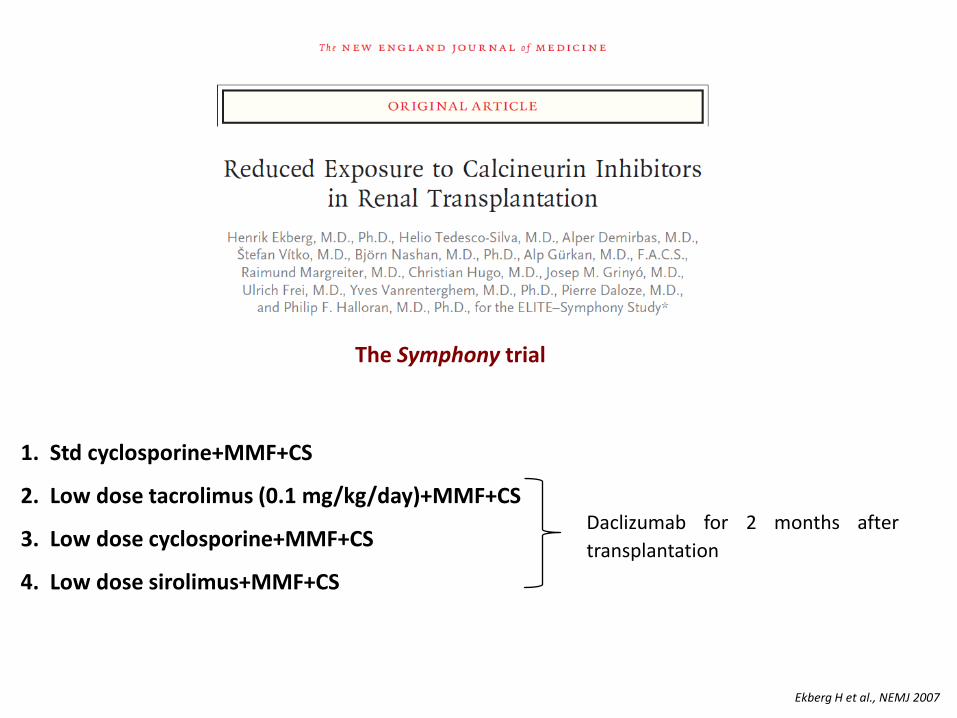
1. Std cyclosporine+MMF+CS
2. Low dose tacrolimus (0.1 mg/kg/day)+MMF+CS
3. Low dose cyclosporine+MMF+CS
4. Low dose sirolimus+MMF+CS
Daclizumab for 2 months after
transplantation
Ekberg H et al., NEMJ 2007
The Symphony trial

Outcomes of the SYMPHONY trial
26% 24%
12%
37%
p<0.0001
p<0.0001
0
10
20
30
40
12 months post-Tx
BPA
R (
% o
f p
atie
nts
)
Normal-dose CsA
Low-dose CsA
Low-dose TAC
Low-dose SRL
Low dose TAC (3-7 ng/mL) associated with
- Lower BPAR rates
- Higher eGFR function
- Higher graft and patients survival rates
Ekberg H et al., NEMJ 2007

Deceased SCD donor Living donor
Meier-Kriesche H-U et al. Am J Transplant 2011
…Yearly long-term kidney graft attrition has not decreased as expected

Why a Prolonged-release formulation of Tacrolimus (TAC QD)?
p<0.0001
Kuypers D et al., Transplantation 2013
• Compliance to treatment decreases over time
• Clinical trials show that reduced pill burden improve adherence to treatment

Caveats of currently available Tacrolimus
• large inter- and intra-individual variability • low bioavailability • wide peak-to-trough fluctuations (high peak Cmax after dosing)
Staatz CE, Tett SE. Clin Pharmacokinet 2004 Provenzani A. World J Gastroenterol 2013 Niioka, et al.. Transplantation Rath T. Expert Opin Pharmacother 2013
Narrow therapeutic index individual dose titration
Efficacy vs dose-related toxicity

Once daily MeltDose® LCP-Tacro
MeltDose drug delivery technology designed to improve the bioavailability of drugs with low water solubility Decreases a drug’s particle size to a molecular level (Solid solution) better dissolution and absortion
Broader absorption in the GI tract, sustaining consistent TAC concentrations
Nigro V et al ATC 2013

Melt-dose tacrolimus: Phase II trials
Study no. Study 2011 Study 2012 Study 2012E* Study 2017 Study 2018
Country US US US US US
Patient population
Stable
kidney transplant
Stable liver transplant
Stable liver (12-month
extension of Study 2012)
De novo
kidney transplant
De novo liver
transplant
Comparator Prograf®
Prograf®
None
Prograf®
Prograf®
Enrollment (patients)
51 57 43 63 58
Enrollment status
Closed Closed Closed Closed Closed
Evaluate the steady-state Pharmacokinetics in both conversion and de novo solid organ transplants
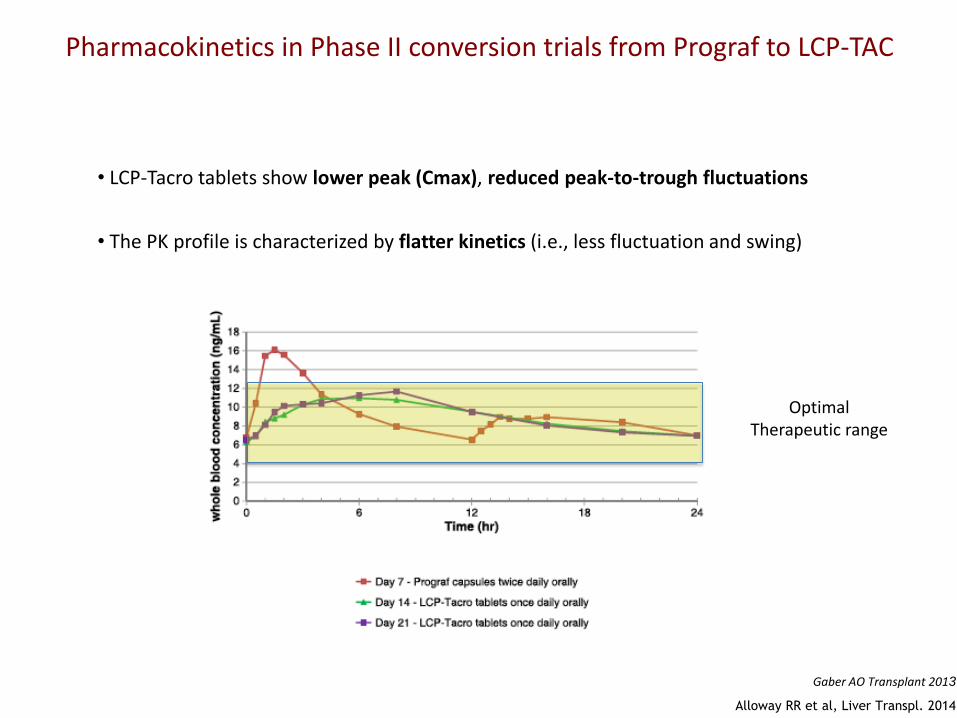
• LCP-Tacro tablets show lower peak (Cmax), reduced peak-to-trough fluctuations
Pharmacokinetics in Phase II conversion trials from Prograf to LCP-TAC
• The PK profile is characterized by flatter kinetics (i.e., less fluctuation and swing)
Gaber AO Transplant 2013
Alloway RR et al, Liver Transpl. 2014
Optimal Therapeutic range

Kidney TX: Phase III LCP-Tacro Conversion trial
• Open-label “switch” study on patients stable on Prograf®
• 326 KT were randomized and switched to receive either LCP-Tacro with a 1:0.7 conversion rate, or to be continued on Prograf® at the same dose
1:1 Randomization 6 mo
secondary
endpoints
Run in Period 7 days on Prograf
Week 1 2 4 6 8 End of Month 3 4 6 9 12
Prograf® Capsules Twice-Daily
3 mo
secondary
endpoints
Screening
Period
Week -5 to
-2
LCP-Tacro® Tablets Once-Daily (1:0.7)
390 D
ay E
xit
Inte
rvie
w
Prograf
Patient
At Least
48H
Apart
C2
4
C2
4
12 mo
primary
endpoints
Day 0 (start study drug)
Bunnapradist et al Am J Transplant. 2013 Non inferiority study
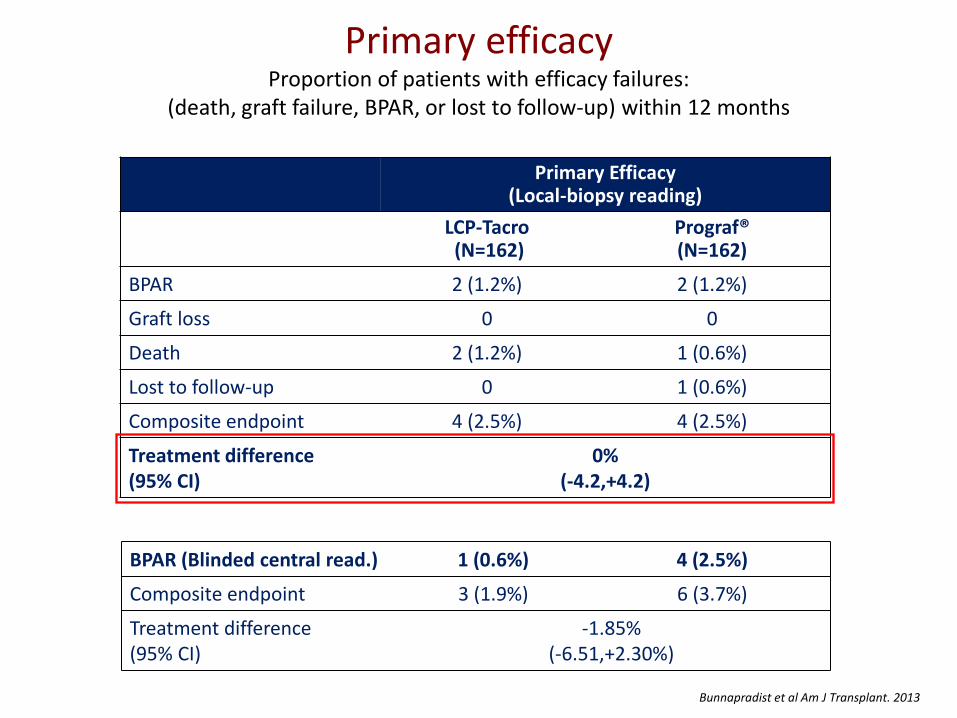
Primary efficacy Proportion of patients with efficacy failures:
(death, graft failure, BPAR, or lost to follow-up) within 12 months
Primary Efficacy (Local-biopsy reading)
LCP-Tacro (N=162)
Prograf® (N=162)
BPAR 2 (1.2%) 2 (1.2%)
Graft loss 0 0
Death 2 (1.2%) 1 (0.6%)
Lost to follow-up 0 1 (0.6%)
Composite endpoint 4 (2.5%) 4 (2.5%)
Treatment difference (95% CI)
0% (-4.2,+4.2)
BPAR (Blinded central read.) 1 (0.6%) 4 (2.5%)
Composite endpoint 3 (1.9%) 6 (3.7%)
Treatment difference (95% CI)
-1.85% (-6.51,+2.30%)
Bunnapradist et al Am J Transplant. 2013

Coverage after conversion
3
3,5
4
4,5
5
5,5
6
6,5
7
7,5
8
Baseline Wk 1 Month 3 Month 6 Month 9 Month 12
LCP-Tacro
Prograf bid
Trough levels (ng/ml)
0,0
1,0
2,0
3,0
4,0
5,0
6,0
7,0
* * * * * * * * * *
* * *
* p <0.0001 vs. pre-conversion
Tacrolimus dose (mg/day)
Bunnapradist et al Am J Transplant. 2013
• Mean trough levels between groups were similar •Mean daily dose of LCPT was significantly lower than preconversion tacrolimus dose (30% less)

Kidney TX: Phase III LCP-Tacro de novo
• Double-blind double-dummy efficacy and safety trial of LCP-Tacro vs. Prograf® in de novo kidney TX
• 543 KT randomized to receive standard triple therapy with either LCP-Tacro with a starting dose of 0.17 mg/kg/d, or Prograf® at 0.1 mg/kg/d
Budde K. et al. Am J Transplant 2014 Non inferiority study

Primary efficacy Incidence of treatment failures:
death, graft failure, BPAR, or lost to follow-up within 12 months after randomization
Budde K. et al. Am J Transplant 2014

Renal function
Budde K. et al. Am J Transplant 2014

Patients coverage in the first days post-Tx
Budde K. et al. Am J Transplant 2014
Tro
ugh
blo
od
leve
l +/-
SE
(ng/
mL)
Target trough levels:
• Days 1-30 = 6-11 ng/mL
• Days 31-365 = 4-11 ng/mL
Trough blood levels (ng/ml)
• Mean trough levels between groups were similar • Mean daily dose of LCPT significantly lower than Prograf® bid (30% less)
LCP-
Tacro
Prograf®
Total daily dose (mg/day)

Tacrolimus trough level (ng/mL) achieved per total daily dose (mg) (modified intent-to-treat set)
Budde K. et al. Am J Transplant 2014
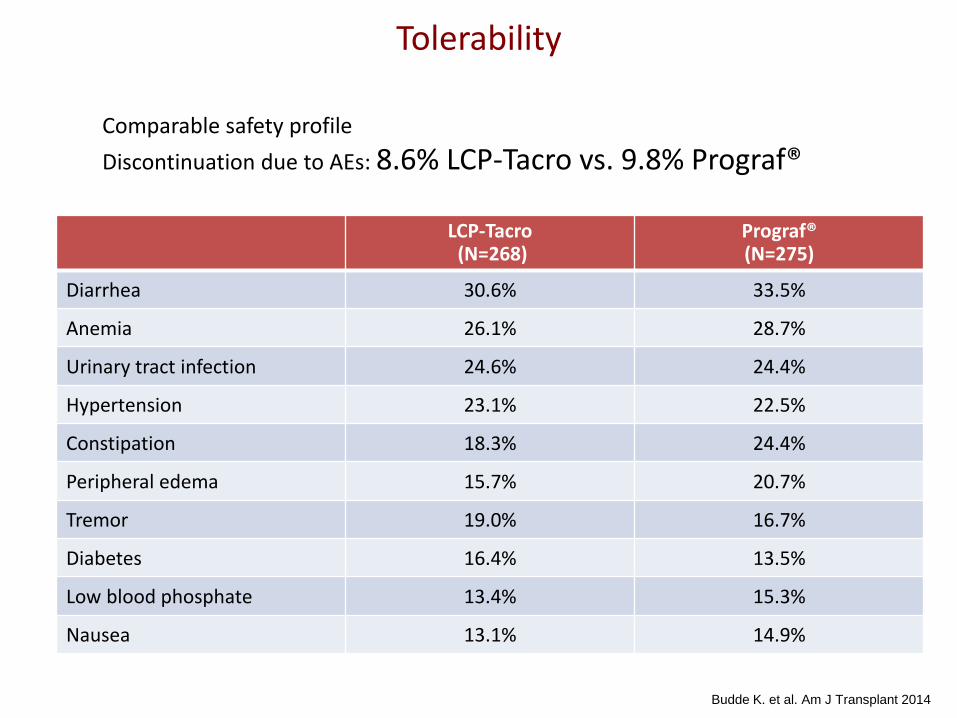
Tolerability
Comparable safety profile
Discontinuation due to AEs: 8.6% LCP-Tacro vs. 9.8% Prograf®
LCP-Tacro (N=268)
Prograf® (N=275)
Diarrhea 30.6% 33.5%
Anemia 26.1% 28.7%
Urinary tract infection 24.6% 24.4%
Hypertension 23.1% 22.5%
Constipation 18.3% 24.4%
Peripheral edema 15.7% 20.7%
Tremor 19.0% 16.7%
Diabetes 16.4% 13.5%
Low blood phosphate 13.4% 15.3%
Nausea 13.1% 14.9%
Budde K. et al. Am J Transplant 2014

Metabolic parameters
Budde K. et al. Am J Transplant 2014

• Phase II, three-sequence, open label, multicenter, prospective study of liver transplant recipients ≥ 6 months post-
transplant on stable (7 days) oral Prograf® therapy with tacrolimus trough levels 5-12 ng/mL for at least two weeks
• Patients were on Prograf twice-daily for seven days (days 1 to 7).
On day 8 each patient was converted to LCP-Tacro (dose conversion approx. 1: 0.70)
Full PK assessed 7 and 14 days post-conversion A follow-up safety visit was conducted on day 53. Dose adjustment (n=1) was allowed on Day 15
Period 1 Period 2 Period 3 Long term extension
Prograf x 7 days (Cmin 5-12 ng/mL)
PK Envarsus x 7 days PK Envarsus x 7 days PK
30 Days Safety
Day 0 7 8 10±1 11±1 14 15 17±1 18±1 21 30 …52… …360
1 year evaluation
Out to 2012(E)
Alloway RR et al, Liver Transpl. 2014
Liver TX: Phase II LCP-Tacro Conversion study

AUCs
• Full PK profiles were taken pre-conversion (Day 7), 7 (Day 14), 14 (Day 21) and 21 days (Day 26) post-conversion
Alloway RR et al, Liver Transpl. 2014
LCP-Tacro tablets are associated with a lower peak (Cmax) and reduced peak-to-trough fluctuations
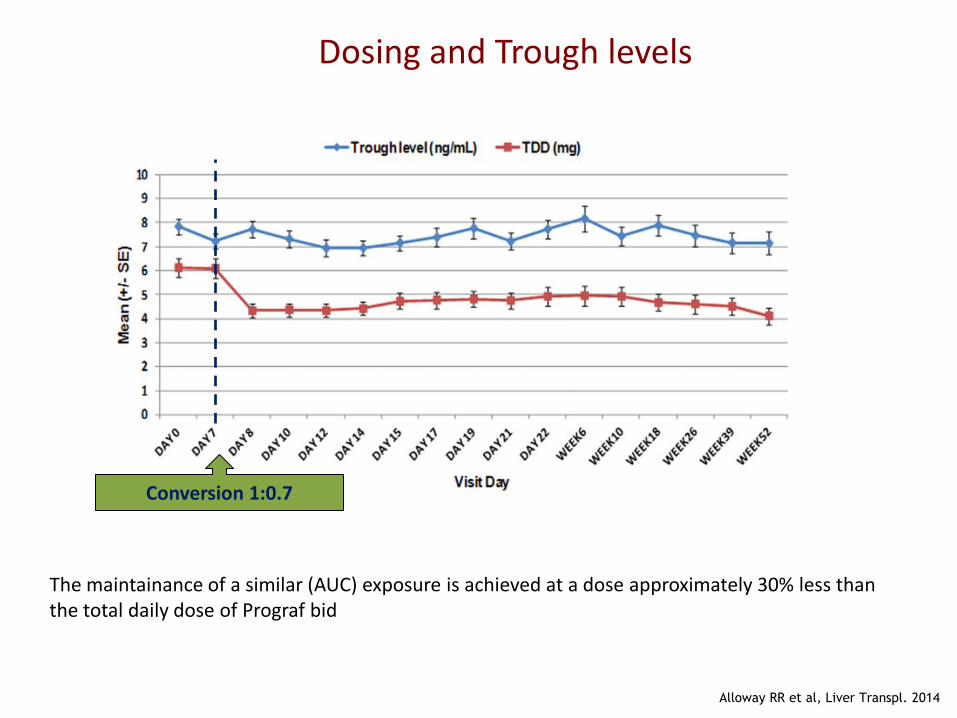
Dosing and Trough levels
Conversion 1:0.7
Alloway RR et al, Liver Transpl. 2014
The maintainance of a similar (AUC) exposure is achieved at a dose approximately 30% less than the total daily dose of Prograf bid

Stable Long term liver function
Alloway RR et al, Liver Transpl. 2014

Safety profile
• Overall, the incidence, type, and severity of AEs were in the range expected in this
patient population
• No unexpected AEs were reported
• There were no clinically significant changes in lab values, vital signs, or ECGs
• No unexpected issues in eGFR
Alloway RR et al, Liver Transpl. 2014
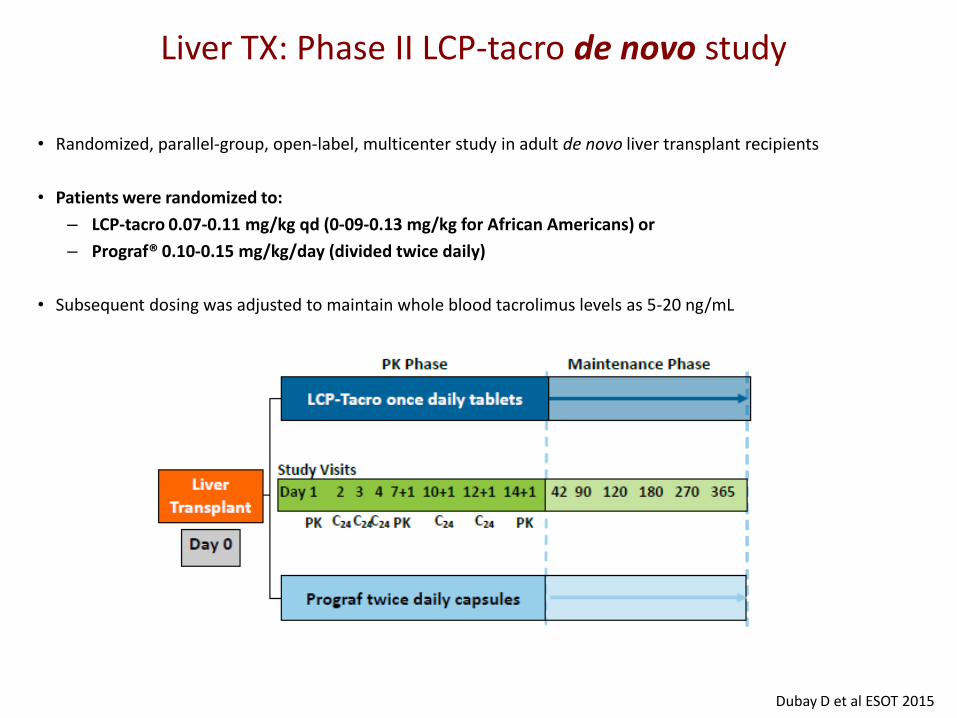
Liver TX: Phase II LCP-tacro de novo study
• Randomized, parallel-group, open-label, multicenter study in adult de novo liver transplant recipients
• Patients were randomized to:
– LCP-tacro 0.07-0.11 mg/kg qd (0-09-0.13 mg/kg for African Americans) or
– Prograf® 0.10-0.15 mg/kg/day (divided twice daily)
• Subsequent dosing was adjusted to maintain whole blood tacrolimus levels as 5-20 ng/mL
Dubay D et al ESOT 2015

Dosing and trough levels
Comparable trough levels
Lower TDD
Dubay D et al ESOT 2015
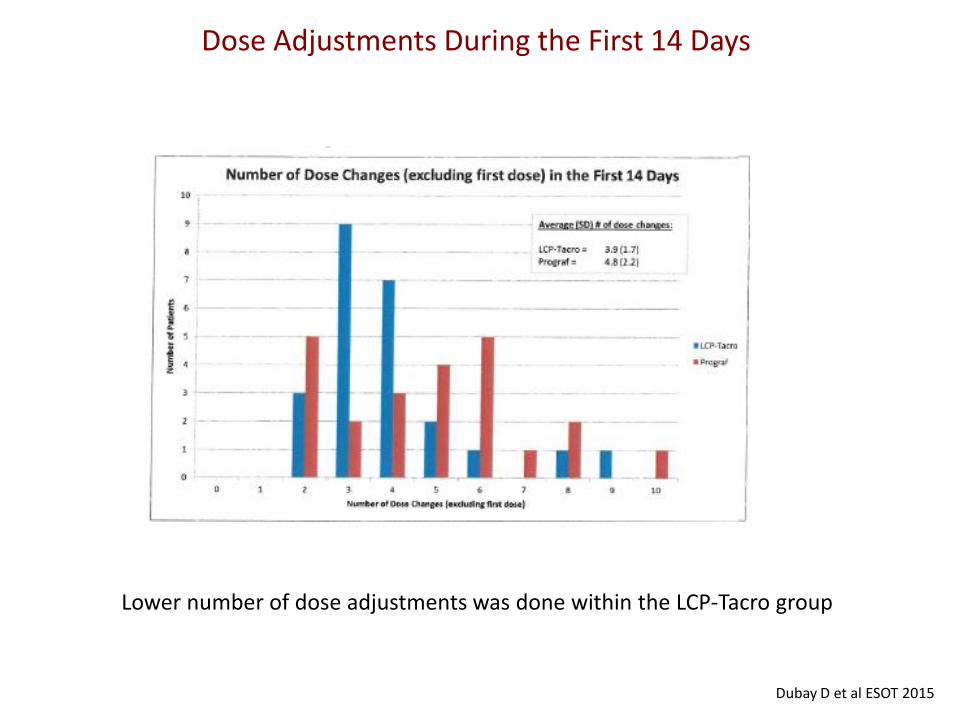
Dose Adjustments During the First 14 Days
Lower number of dose adjustments was done within the LCP-Tacro group
Dubay D et al ESOT 2015

Patients Free from BPAR
0
10
20
30
40
50
60
70
80
90
100
180 Days 260 Days
Envarsus
Prograf
p = n.s. for both time points %
of
pat
ien
ts
Dubay D et al ESOT 2015
LCP-Tacro

Adverse Events
LCP-Tacro (n=29)
Prograf® (n=29)
All AEs: n (%) 29 (100%) 29 (100%)
Mild 6 (20.7%) 8 (27.6%)
Moderate 14 (48.3%) 16 (55.2%)
Severe 9 (31.0%) 5 (17.2%)
LCP-Tacro (n=29)
Prograf® (n=29)
All AEs: n (%) 29 (100%) 29 (100%)
Not suspected to be related 8 (27.6%) 16 (55.2%)
Suspected to be related 21 (72.4%) 13 (44.8%)
Dubay D et al ESOT 2015
No differences regarding main AEs

LCP-tacro reduces neurotoxic manifestations
• Phase IIIb conversion study in stable kidney Tx with severe hand tremors and TAC trough levels 3-7 ng/mL Twice-daily Tacrolimus vs LCP-Tacro at day 7 after conversion
• FTM tremor score and QUEST questionnaire widely used to assess tremor in neurologic patients
Langone A, Clin Transplant 2015
Changes in FTM scores after 7 days of conversion
LCPT is associated with clinically meaningful improvement of hand tremor without dose reduction
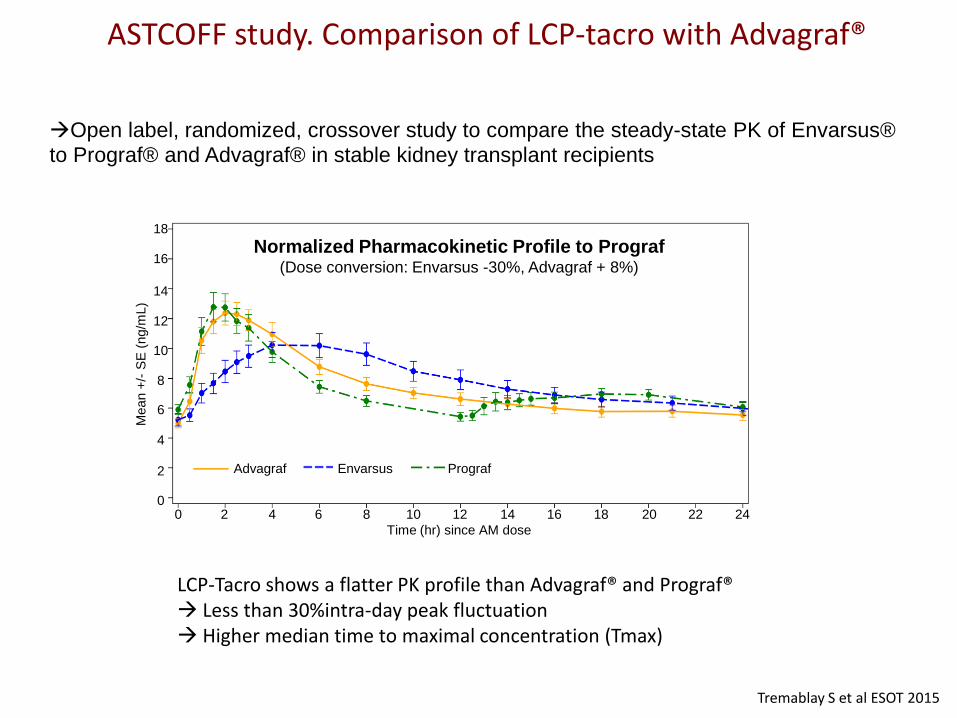
ASTCOFF study. Comparison of LCP-tacro with Advagraf®
Tremablay S et al ESOT 2015
Open label, randomized, crossover study to compare the steady-state PK of Envarsus®
to Prograf® and Advagraf® in stable kidney transplant recipients
LCP-Tacro shows a flatter PK profile than Advagraf® and Prograf® Less than 30%intra-day peak fluctuation Higher median time to maximal concentration (Tmax)
Time (hr) since AM dose
Advagraf Envarsus Prograf
Mean +
/- S
E (
ng/m
L)
18
16
12
6
4
2
0
8
10
14
18 16 12 6 4 2 0 8 10 14 20 22 24
Normalized Pharmacokinetic Profile to Prograf (Dose conversion: Envarsus -30%, Advagraf + 8%)

Conclusions: MeltDose® tacrolimus
• Similar efficacy and safety than Prograf® in de novo and
stable patients after conversion.
• Reduced doses to achieve similar target trough levels
• Patients show stable and consistent tacrolimus blood levels.
• May help to manage neurotoxic complications without need for levels reduction

Non-adherence as main cause of Chronic allograft rejection
Sellares J et al. Am J Transplant 2012 Bestard O & Sarwal M. Ped Nephrol 2015