melbourne analysis area - deloitte
TRANSCRIPT

Analysis areaDeloitte City Mobility Index 2020
MOBILITY ANALYSIS
FUTURE OF MOBILITY CAPABILITY
Service andinclusion
GLOBAL LEADER
TOP PERFORMER
CONTENDER
ASPIRING
EMERGING
Performanceand resilience
Vision andleadership
KEY MOBILITY STATISTICS
*Regulated, licensed, subsidised, and monitored by principal transport authorities.
Congestion
Public transport reliability
Transport safety
Integrated mobility
Modal diversity
Vision and strategy
Investment
Innovation
Regulatory environment
Environmental sustainabilityinitiatives
Public transport density
Transport affordability
Air quality
Customer satisfaction
Accessibility
Passive environment, a number of barriers
Proactive environment, few barriers
Proactive environment, some barriers
Significant work to do
FoM globalleader
Melbourne
Melbourne
STRENGTHS• Committed to invest heavily in expanding the transport network
to outer suburbs
• A number of open data portals and APIs on transport metrics are available
• Popular transport smart payments system expanding to include some mobile platforms
CHALLENGES• Melbourne has a relatively high rate of pedestrian accidents: a
lack of dedicated space for Melbourne’s extensive tram network means that 80 per cent of routes run in mixed traffic
• Few policies or incentives for switching away from fossil-fuelled vehicles
• The hub-and-spoke public transport network lacks orbital connections, resulting in a high proportion of private car use
Public transport options*Commuter rail, light rail including
tram, bus, ferry
Monthly public transport pass US$104
GDP per capitaUS$52,678 (A$77,392) (2018)
Principal transport authoritiesDepartment of Transport (as Public
Transport Victoria and VicRoads)
Analysis area: 2,704 km2 | Population: 4,677,157 (2018) | Population density: 1,730/km2
Definition of analysis area: Melbourne Urban Centre and Locality (as defined by the Australian Bureau of Statistics)
JOURNEY MODAL SPLITPRIVATE CAR
WALKING BICYCLE
PUBLIC TRANSPORT
16% 2%
72% 9%
OTHER: 1%
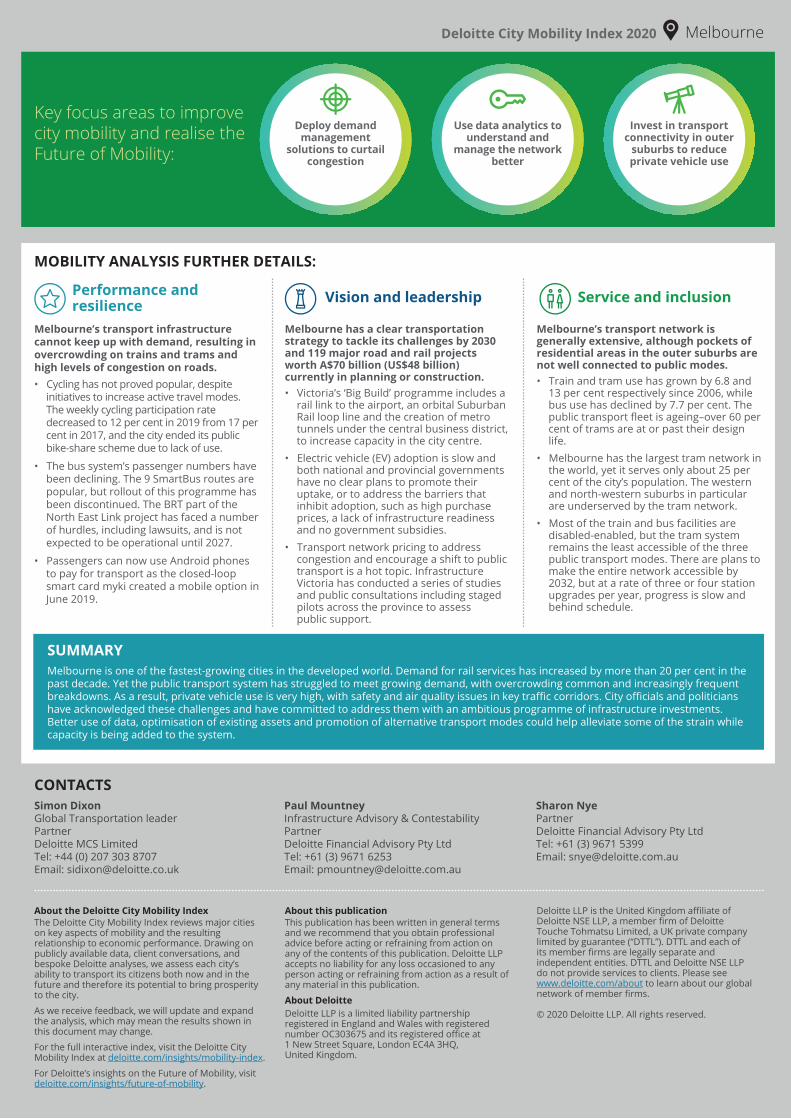
MOBILITY ANALYSIS FURTHER DETAILS:
Performance andresilience Vision and leadership Service and inclusion
Key focus areas to improve city mobility and realise the Future of Mobility:
http://www.deloitte.com/insights/future-of-mobility
http://www.http://www.deloitte.com/insights/city-mobility-index
http://www.deloitte.com/about
About the Deloitte City Mobility IndexThe Deloitte City Mobility Index reviews major cities on key aspects of mobility and the resulting relationship to economic performance. Drawing on publicly available data, client conversations, and bespoke Deloitte analyses, we assess each city’s ability to transport its citizens both now and in the future and therefore its potential to bring prosperity to the city.
As we receive feedback, we will update and expand the analysis, which may mean the results shown in this document may change.
For the full interactive index, visit the Deloitte City Mobility Index at deloitte.com/insights/mobility-index.
For Deloitte’s insights on the Future of Mobility, visit deloitte.com/insights/future-of-mobility.
About this publicationThis publication has been written in general terms and we recommend that you obtain professional advice before acting or refraining from action on any of the contents of this publication. Deloitte LLP accepts no liability for any loss occasioned to any person acting or refraining from action as a result of any material in this publication.
About DeloitteDeloitte LLP is a limited liability partnership registered in England and Wales with registered number OC303675 and its registered office at 1 New Street Square, London EC4A 3HQ, United Kingdom.
Deloitte LLP is the United Kingdom affiliate of Deloitte NSE LLP, a member firm of Deloitte Touche Tohmatsu Limited, a UK private company limited by guarantee (“DTTL”). DTTL and each of its member firms are legally separate and independent entities. DTTL and Deloitte NSE LLP do not provide services to clients. Please see www.deloitte.com/about to learn about our global network of member firms.
© 2020 Deloitte LLP. All rights reserved.
Melbourne’s transport infrastructure cannot keep up with demand, resulting in overcrowding on trains and trams and high levels of congestion on roads. • Cycling has not proved popular, despite
initiatives to increase active travel modes. The weekly cycling participation rate decreased to 12 per cent in 2019 from 17 per cent in 2017, and the city ended its public bike-share scheme due to lack of use.
• The bus system’s passenger numbers have been declining. The 9 SmartBus routes are popular, but rollout of this programme has been discontinued. The BRT part of the North East Link project has faced a number of hurdles, including lawsuits, and is not expected to be operational until 2027.
• Passengers can now use Android phones to pay for transport as the closed-loop smart card myki created a mobile option in June 2019.
Melbourne has a clear transportation strategy to tackle its challenges by 2030 and 119 major road and rail projects worth A$70 billion (US$48 billion) currently in planning or construction. • Victoria’s ‘Big Build’ programme includes a
rail link to the airport, an orbital Suburban Rail loop line and the creation of metro tunnels under the central business district, to increase capacity in the city centre.
• Electric vehicle (EV) adoption is slow and both national and provincial governments have no clear plans to promote their uptake, or to address the barriers that inhibit adoption, such as high purchase prices, a lack of infrastructure readiness and no government subsidies.
• Transport network pricing to address congestion and encourage a shift to public transport is a hot topic. Infrastructure Victoria has conducted a series of studies and public consultations including staged pilots across the province to assess public support.
Melbourne’s transport network is generally extensive, although pockets of residential areas in the outer suburbs are not well connected to public modes. • Train and tram use has grown by 6.8 and
13 per cent respectively since 2006, while bus use has declined by 7.7 per cent. The public transport fleet is ageing–over 60 per cent of trams are at or past their design life.
• Melbourne has the largest tram network in the world, yet it serves only about 25 per cent of the city’s population. The western and north-western suburbs in particular are underserved by the tram network.
• Most of the train and bus facilities are disabled-enabled, but the tram system remains the least accessible of the three public transport modes. There are plans to make the entire network accessible by 2032, but at a rate of three or four station upgrades per year, progress is slow and behind schedule.
SUMMARY
Use data analytics to understand and
manage the network better
Invest in transport connectivity in outer
suburbs to reduce private vehicle use
Deploy demand management
solutions to curtail congestion
Melbourne is one of the fastest-growing cities in the developed world. Demand for rail services has increased by more than 20 per cent in the past decade. Yet the public transport system has struggled to meet growing demand, with overcrowding common and increasingly frequent breakdowns. As a result, private vehicle use is very high, with safety and air quality issues in key traffic corridors. City officials and politicians have acknowledged these challenges and have committed to address them with an ambitious programme of infrastructure investments. Better use of data, optimisation of existing assets and promotion of alternative transport modes could help alleviate some of the strain while capacity is being added to the system.
CONTACTSSharon NyePartnerDeloitte Financial Advisory Pty LtdTel: +61 (3) 9671 5399Email: [email protected]
Deloitte City Mobility Index 2020 Melbourne
Simon Dixon Global Transportation leaderPartner Deloitte MCS LimitedTel: +44 (0) 207 303 8707 Email: [email protected]
Paul MountneyInfrastructure Advisory & ContestabilityPartnerDeloitte Financial Advisory Pty LtdTel: +61 (3) 9671 6253Email: [email protected]