medicare physician group practices: innovations in … a presentation on the key strategies and...
TRANSCRIPT

MEDICARE PHYSICIAN GROUP PRACTICES:
INNOVATIONS IN QUALITY AND EFFICIENCY
Michael Trisolini, Gregory Pope, John Kautter, and Jyoti Aggarwal
RTI International
December 2006
ABSTRACT: The Centers for Medicare and Medicaid Services initiated the Physician Group Practice (PGP) Demonstration to provide participating practices the opportunity to earn performance payments for improving the quality and cost-efficiency of health care delivered to Medicare fee-for-service (FFS) beneficiaries. This report discusses experiences of the participating practices, as well the implications for the Medicare program and the health care system overall. To date, the PGP demonstration experience has shown that it is possible for large, multi-specialty group practices to respond to a hybrid set of quality improvement and cost-containment incentives layered on top of an FFS payment system. PGPs have used the demonstration to expand data systems, care management programs, coordination-of-care efforts, and other interventions that are not directly reimbursed. At the same time, the PGP demonstration system retains many of the positive features of FFS reimbursement, such as the patient’s free choice of provider and reduced incentives for undertreatment.
Support for this research was provided by The Commonwealth Fund and by the Centers for Medicare and Medicaid Services (CMS) under Contract No. 500-00-0024, T.O. No. 13. The views presented here are those of the authors and do not necessarily reflect the views of The Commonwealth Fund or its directors, officers, or staff, or the views or policies of CMS. The authors assume responsibility for the accuracy and completeness of the information contained in this report. This report and other Fund publications are available online at www.cmwf.org. To learn more about new publications when they become available, visit the Fund’s Web site and register to receive e-mail alerts. Commonwealth Fund pub. no. 971.


iii
CONTENTS
List of Figures and Tables................................................................................................ iv
About the Authors ........................................................................................................... v
Executive Summary........................................................................................................ vi
Introduction ....................................................................................................................1
Rationale ...................................................................................................................2
Cost Performance Incentive Methodology .................................................................3
Quality Performance Incentive Methodology.............................................................3
For More Information................................................................................................4
Background on the Participating Sites ..............................................................................5
Participating PGPs .....................................................................................................5
Beneficiary Characteristics..........................................................................................7
Quality and Efficiency Innovations in the PGP Demonstration ........................................8
Improving Cost-Efficiency.........................................................................................8
Everett Clinic.......................................................................................................8
Middlesex Health System ................................................................................... 10
Marshfield Clinic................................................................................................ 12
Methods for Care Management and Disease Management ........................................ 14
University of Michigan ...................................................................................... 14
Forsyth Medical Group ...................................................................................... 16
Park Nicollet Health Services ............................................................................. 18
Dartmouth-Hitchcock Clinic ............................................................................. 20
Information Technology Applications for Improving Care ....................................... 22
Geisinger Health System..................................................................................... 22
Billings Clinic .................................................................................................... 24
St. John’s Health System..................................................................................... 25
Cross-Site Themes......................................................................................................... 27
Improving Care Management and Coordination of Care.......................................... 27
Expanding Palliative and Hospice Care .................................................................... 30
Modifying Physician Practice Patterns and Behavior................................................. 30
Enhancing Information Technology......................................................................... 31
Implications for Medicare and the U.S. Health Care System .......................................... 32
Appendix A. Contact Information for PGP Demonstration Participants ......................... 34
Appendix B. Summary of Demonstration Key Strategies and Interventions Highlighted in Conference Presentations by PGPs .................................... 36

iv
LIST OF FIGURES AND TABLES
Figure 1 Locations and Service Areas of PGP Demonstration Participants .....................6
Table 1 PGP Demonstration Participants: Organizational Characteristics .....................6
Table 2 Selected Characteristics of Beneficiaries Assigned to
Participating Physician Group Practices (PGPs), 2004 .....................................7
Figure 2 Optimal Timing for PCP Visit Post Hospital Stay, Everett Clinic ................. 10
Table 3 Transition Management Strategies, Middlesex Health System ....................... 11
Table 4 Goals of Workflow Efficiency Group, Marshfield Clinic ............................... 12
Table 5 “Medical Home” Interventions, University of Michigan............................... 15
Table 6 Preventive Care Pocket Card for Quality Measures,
Forsyth Medical Group................................................................................. 17
Figure 3 Averted Heart Failure Hospitalizations, Park Nicollet Health Services........... 19
Table 7 How Does Health Coaching Support Physician and Clinical Staff? ............... 21
Table 8 “All or None” Process Reliability, Diabetes “Bundle” .................................. 23
Figure 4 Foot Exam Documentation Rate, Billings Clinic .......................................... 25
Table 9 Electronic Interfaces for the Patient Registry, St. John’s Health System......... 26
v
ABOUT THE AUTHORS
Michael Trisolini, Ph.D., M.B.A., is deputy director of the Health Care Quality and
Outcomes Program at RTI International. He has more than 23 years of experience in
health services research and management. Trisolini’s research focuses on quality of care
and quality of life for people with chronic diseases, incentive systems to improve quality
of care, and the Medicare program. Formerly, he was associate director of the Center
for International Health at Boston University. He received his Ph.D. in health services
research from the Heller Graduate School for Social Policy and Management at Brandeis
University and an M.B.A. from Harvard University.
Gregory Pope, M.S., is director of the Health Care Financing and Payment Program at
RTI International. He has more than 22 years of experience in health economics and
health policy research. Pope’s specialties include Medicare policy analysis, risk adjustment,
provider payment design and incentives, program evaluation, and quality-of-care indicators.
He has led numerous Medicare research and demonstration projects. Formerly, he served as
vice president of Health Economics Research, Inc. Pope received his M.S. in economics
from the Massachusetts Institute of Technology.
John Kautter, Ph.D., is a senior economist in RTI’s Health Care Financing and
Payment Program. His research interests include fee-for-service and managed care service
delivery and payment models. Kautter has led several demonstration projects on Medicare
payment innovations and developed risk adjustment systems for Medicare and other health
care programs. He received his Ph.D. in economics from the University of Illinois at
Urbana-Champaign.
Jyoti Aggarwal, M.H.S., is a research associate in RTI’s Health Care Financing and
Payment Program. Her work focuses on program evaluation, health care payment systems,
health economics, pharmacoeconomics, and outcomes research. She received her M.H.S.
in health policy from the Johns Hopkins Bloomberg School of Public Health.

vi
EXECUTIVE SUMMARY
In April 2005, the Centers for Medicare and Medicaid Services (CMS) initiated
the Physician Group Practice (PGP) Demonstration, which offers participating practices
the opportunity to earn performance payments for improving the quality and cost-
efficiency of health care delivered to Medicare fee-for-service (FFS) beneficiaries. The
demonstration includes three performance years, for comparison with a base year (2004).
This report includes the proceedings of a site conference cosponsored by the
Commonwealth Fund and CMS at the conclusion of the first performance year. At this
meeting, held in Washington, D.C., on April 28, 2006, each of the 10 participating PGPs
made a presentation on the key strategies and innovations it is employing under the
demonstration.
Background on the PGP Demonstration
For each PGP, Medicare savings from the demonstration are calculated by comparing
actual spending to a target: the PGP’s own base-year per-capita expenditures trended
forward by a comparison group’s expenditure growth rate. Case-mix adjustments are
made to account for changes over time in the types of patients treated by the PGP and
changes in the types of patients included in the comparison group. Cost and quality
performance payments for the PGP are calculated if it achieves Medicare savings of more
than 2 percent.
To determine quality performance payments, the demonstration includes 32
quality measures drawn from CMS’s Doctor’s Office Quality (DOQ) Project. PGPs
become eligible for such payments by meeting threshold or improvement targets. (More
detailed information on the methods used for measuring quality and financial performance
under the demonstration can be found on the CMS Web site.)
Participating PGPs
The demonstration includes 10 large PGPs that span all four Census regions. They each
have at least 200 physicians, and together represent over 5,000 physicians. The PGPs
include freestanding group practices, components of integrated delivery systems, faculty
group practices, and a physician network organization made up of small and individual
physician practices. Together, they provide the largest portion of primary care services for
over 220,000 Medicare FFS beneficiaries.

vii
Quality and Efficiency Innovations in the PGP Demonstration
Four cross-site themes emerged from the PGPs’ conference presentations:
1. Improving care management and coordination of care. Improving care management
and coordination of care are common goals of the participating PGPs, as these
interventions are viewed as having the potential both to reduce costs and improve quality
simultaneously. Approaches include chronic disease management, high-cost/high-risk
patient management, and transition management.
Most of the participating PGPs have implemented chronic disease management
programs for diabetes and heart failure patients. These diseases are emphasized because
they have relatively high prevalence among Medicare beneficiaries, usually have room for
improvement on quality measures, and also have potential to reduce costs. High-
cost/high-risk patient management programs are usually more broadly defined than disease
management programs, as the former usually target patients who have multiple chronic
diseases while the latter tend to focus on single diseases. Transitional care interventions
include enhanced hospital and emergency room discharge planning to ensure that
appropriate follow-up care is received and readmissions are avoided.
2. Expanding palliative and hospice care. Several PGPs developed or explored
programs for expanding access to palliative, hospice, or end-of-life care. Everett Clinic’s
presentation on this topic prompted discussion at the conference regarding how best to
define and distinguish the roles of these different services. Though currently underutilized
for Medicare beneficiaries and other patients in the U.S. health care system, they are
viewed as having promise both for reducing utilization of high-cost hospital care and
improving patients’ quality of life.
3. Modifying physician practice patterns and behavior. Physician behavior is central to
reducing costs and improving quality of care, given that physicians have the largest
influence on patient treatment and resource utilization. As a result, all of the participating
PGPs have considered ways to influence or modify physicians’ practice patterns. They
include modifying physicians’ work processes, encouraging physicians to consider the
health of a panel of patients rather than individual patients, and feedback reports to
improve coordination and quality of care. A key challenge is in identifying the optimal
ways to modify clinical work processes, such as when physicians can delegate routine care
to nurses or medical assistants.
viii
4. Enhancing information technology. Most of the PGPs highlighted information
technology innovations as critical for their success under the demonstration. These include
applications that identify and track high-risk patients, develop chronic disease patient
registries, provide doctors with detailed reports on individual patients, prepare broader
feedback reports, and give automated reminders to physicians or support staff on needed
care. Some groups have made enhancements to their electronic medical records, while
others have focused on more limited and less expensive patient registries.
Implications for the Medicare Program and the U.S. Health Care System
The PGP demonstration experience to date has shown that it is possible for large multi-
specialty group practices to respond to a hybrid set of quality improvement and cost-
containment incentives layered on top of an FFS payment system. PGPs have used the
demonstration as a vehicle for expanding data systems, care management programs,
coordination-of-care efforts, and other interventions that are not directly reimbursed in
FFS payments. As Medicare’s first pay-for-performance initiative for physicians, the
demonstration enables doctors to provide the high-quality and appropriate services they
would like to give their patients but frequently feel they are penalized for under the
current health care financing system. The focus among participating PGPs is less on direct
financial rewards for individual providers and more on “getting the reimbursement system
out of the way” so that doctors can provide services they know that patients need.
A goal for the future is to develop ways to expand the PGP demonstration
approach to other practice formats. Middlesex Health System’s experience as a “network”
of small group practices, for example, was cited as one possible model.
A barrier to previous private sector attempts to establish direct financial incentives
for improving quality and efficiency for providers has been the inability of many provider
organizations to accept financial risk for patient care. The PGP demonstration addresses
this concern by eschewing a downside penalty for underperformance; it focuses instead on
the gains from better-than-expected performance. It tests whether a provider-based
approach emphasizing “the carrot” rather than “the stick” will prove effective in
enhancing the quality and efficiency of care received by Medicare beneficiaries.
1
MEDICARE PHYSICIAN GROUP PRACTICES:
INNOVATIONS IN QUALITY AND EFFICIENCY
INTRODUCTION
In April 2005, the Centers for Medicare & Medicaid Services (CMS) initiated the
Physician Group Practice (PGP) demonstration, which offers 10 large participating
practices the opportunity to earn performance payments for improving the quality and
cost-efficiency of health care delivered to Medicare fee-for-service (FFS) beneficiaries.
The demonstration includes a base year and three performance years covering the
following time periods:
• Base Year: January 1, 2004–December 31, 2004
• Performance Year One: April 1, 2005–March 31, 2006
• Performance Year Two: April 1, 2006–March 31, 2007
• Performance Year Three: April 1, 2007–March 31, 2008
An evaluation of the demonstration, to assess the interventions applied by the participating
PGPs and the quality and cost results, is also planned.
This report includes the proceedings of a site conference co-sponsored by the
Commonwealth Fund and CMS at the conclusion of the first performance year. At this
meeting, held in Washington, D.C., on April 28, 2006, each of the 10 participating PGPs
made a presentation on the key strategies and interventions it is employing in response to
the demonstration’s incentives. The conference also afforded the PGPs an opportunity to
compare experiences, exchange ideas about how to improve and expand their
interventions in the future, and discuss the broader implications for the Medicare program.
Specifically, the meeting provided a forum for PGPs to: (1) share information
about why and how they are participating in the demonstration; (2) discuss how the
demonstration incentives have changed their organizations and physician behavior; (3)
highlight best-practice care coordination, information technology (IT), and other
strategies for improving quality and cost efficiency; and (4) identify lessons learned about
how to provide Medicare beneficiaries with better care.
The meeting offered insight and real-time feedback to CMS and health care
policymakers on what works, and what doesn’t work, as Medicare considers various
national approaches for rewarding providers for improving health care quality and
2
efficiency. In addition, the meeting illuminated how physician behavior and health care
systems change in response to the PGP demonstration pay-for-performance incentives, the
factors that can enhance and inhibit those changes, and the types of interventions that have
proven effective.
The remainder of this section includes background information on the PGP
demonstration. Subsequent sections describe the participating PGPs, present summaries
of the PGPs’ presentations at the conference, review cross-site themes, and discuss the
broader implications of the PGP demonstration for Medicare and the U.S. health care
system.
Rationale
The PGP demonstration tests a unique reimbursement mechanism that rewards providers
for coordinating and managing the overall health care needs of a FFS Medicare patient
population. The demonstration offers CMS an opportunity to assess whether a new
financial incentive structure can enhance service delivery and quality for Medicare
beneficiaries and ultimately prove cost-effective.
A legislative mandate for the PGP demonstration was included in the Medicare,
Medicaid, and State Children’s Health Insurance Program Benefits Improvement and
Protection Act (BIPA) of 2000. There are three main goals for the PGP demonstration:
1. To encourage the coordination of health care furnished under Medicare.
2. To encourage investment in care management processes for efficient
service delivery.
3. To reward physicians for improving health care processes and outcomes.
The demonstration adds new incentives to traditional FFS reimbursement that are
more in line with capitation incentives. Participating PGPs are thereby motivated to
reduce unnecessary utilization and improve the quality of care for Medicare FFS patients.
Performance measures based both on quality indicators and cost-efficiency are used in the
calculation of performance payments.
In addition to encouraging physician groups to attract, retain, and coordinate care
for chronically ill beneficiaries, CMS aims to promote active use of clinical and utilization
data to improve efficiency and outcomes. Increased investments in IT and quality
improvement systems are anticipated effects of the demonstration.

3
Cost Performance Incentive Methodology
The PGP demonstration is being conducted in an FFS context, with beneficiaries assigned
to a participating PGP during a given year, based on provision of services. A beneficiary
who receives at least one evaluation and management (E&M) service from a participating
PGP during a given year is eligible for assignment. If the beneficiary received more of
those services from the participating PGP over the course of that year than from any other
physician practice, then the beneficiary is assigned to the PGP.
A comparison population is also defined for each PGP in order to provide a
benchmark for assessing cost-control performance. For this demonstration, comparison
beneficiaries are drawn from the counties where at least one percent of a PGP’s assigned
beneficiaries reside. Comparison beneficiaries are limited to those with similar
characteristics to assigned beneficiaries.
For each PGP, Medicare savings from the demonstration are calculated by
comparing actual spending to a target: the PGP’s own base-year per-capita expenditures
trended forward by a comparison group’s expenditure growth rate. Case-mix adjustments
are made to account for changes over time in the types of patients treated by the PGP and
changes in the types of patients included in the comparison group. Cost and quality
performance payments for the PGP are calculated if it achieves Medicare savings of more
than 2 percent.
The portion of savings greater than the 2 percent threshold is used to calculate the
performance payments. Medicare retains 20 percent of the savings beyond the 2 percent
threshold and the remaining 80 percent goes into the PGP’s bonus pool. For the first
performance year, each PGP receives 70 percent of the amount in its bonus pool directly
as a cost performance payment; this share falls to 60 percent in the second year and 50
percent in the third year. The other 30 percent becomes the PGP’s quality bonus pool for
that year; this share rises to 40 percent in the second year and 50 percent in the third year.
Quality Performance Incentive Methodology
Each PGP earns quality performance payments based on the size of its quality bonus pool
and the proportion of quality targets it has met. The demonstration encompasses 32
quality measures drawn from CMS’s Doctor’s Office Quality Project, including measures
from five different condition modules: diabetes, heart failure, coronary artery disease,
hypertension, and preventive care. For example, one of the diabetes measures is the
percentage of diabetics who received an HbA1c (blood sugar) test at least once per year.
The quality measures are phased in over the course of the demonstration, with the
4
diabetes module active in the first year, the heart failure and coronary artery disease
modules also active in the second year, and all five modules active in the third year. All of
the quality measures are weighted equally for calculating the quality bonus payment
earned. Two types of measurement processes are used to calculate quality performance:
one method uses Medicare claims (billing) data for seven of the quality measures; the other
method uses data abstracted from beneficiaries’ medical records for the other 25 quality
measures.
PGPs become eligible for quality performance payments by meeting threshold or
improvement-over-time targets. For each quality measure, PGPs may satisfy one of three
targets: 1) the higher of 75 percent compliance or, where comparable data are available,
the mean value of the measure from the Medicare Health Plan Employer Data and
Information Set (HEDIS); 2) the 70th percentile Medicare HEDIS level (again, where
comparable data are available); or 3) a 10 percent or greater reduction in the gap between
the level achieved by the PGP in the demonstration’s base year and 100 percent
compliance in the performance year. The first two targets are threshold targets, while the
third is an improvement-over-time target.
For More Information
Additional information regarding the methods used for measuring quality and financial
performance under the demonstration can be found on the CMS Web site. Reports on
the PGP Demonstration Bonus Methodology Specifications and the PGP Demonstration
Quality Measurement and Reporting Specifications can be found at the following URL:
http://www.cms.hhs.gov/DemoProjectsEvalRpts/. To access these reports on that
Web page:
1. Click on “Medicare Demonstrations” in the box on the upper left-hand side
of the screen.
2. Scroll down to and click on “Medicare Physician Group Practice Demonstration”
in Year 2000.
3. Scroll down to the downloads section. Select the following reports from the
available PDF files:
Performance Payment Methodology Specifications (54 pages)
Quality Specs Report (248 pages)

5
BACKGROUND ON THE PARTICIPATING SITES
This section includes a description of the participating PGPs and presents baseline
information on the Medicare beneficiaries assigned to the PGPs for the demonstration.
Participating PGPs
Ten large PGPs are participating in the demonstration, spanning all four census regions in
the country. Four PGPs are located in the Midwest region, three in the Northeast, two in
the West, and one in the South. They include:
• Billings Clinic in Montana
• Dartmouth-Hitchcock Clinic in New Hampshire
• Everett Clinic in Washington
• Forsyth Medical Group in North Carolina
• Geisinger Health System in Pennsylvania
• Marshfield Clinic in Wisconsin
• Middlesex Health System in Connecticut
• Park Nicollet Health Services in Minnesota
• St. John’s Health System in Missouri
• University of Michigan Faculty Group Practice in Michigan
Figure 1 shows the locations of the participating sites and the areas covered by the
counties that comprise their service areas. These PGPs are located mostly in rural areas or
small cities. Their contact information can be found in Appendix A.
The participating PGPs all have at least 200 physicians, and together represent over
5,000 physicians. They include freestanding group practices, components of integrated
delivery systems, faculty group practices, and physician network organizations. Eight of
the participating PGPs are part of an integrated delivery system and are thus affiliated with
a hospital. The remaining two groups are collaborating with hospitals in their service areas
to meet the goals of the demonstration. Characteristics of the participating PGPs are
summarized in Table 1.

6
Figure 1. Locations and Service Areas ofPGP Demonstration Participants
Source: RTI International.
Table 1. PGP Demonstration Participants: Organizational Characteristics
Participant Organizational
structure
Part of integrated delivery system?
Includes academic medical center?
Owns an
HMO?1
Not-for-
profit?
Numberof
providers
Dartmouth-Hitchcock Clinic
Faculty/community group practice
Yes Yes No Yes 907
Billings Clinic Group practice Yes No No Yes 232
Geisinger Clinic Group practice Yes No Yes Yes 833
Middlesex Health System Network model Yes No No No2 293
Marshfield Clinic Group practice No No Yes Yes 1,039
Forsyth Medical Group Group practice Yes No No Yes 250
Park Nicollet Clinic Group practice Yes No No Yes 648
St. John’s Clinic Group practice Yes No Yes Yes 522
Everett Clinic Group practice No No No No 250
University of Michigan Faculty Group Practice
Faculty practice Yes Yes Yes Yes 1,291
1 HMO may be owned by an associated health system. 2 For-profit subsidiary of a not-for-profit health system. Source: RTI International.

7
Beneficiary Characteristics
Table 2 presents selected characteristics of the beneficiaries assigned to the participating
PGPs in the demonstration’s base year, 2004. As noted, the assigned beneficiaries represent
a subset of all the Medicare beneficiaries who had at least one E&M visit at the PGP.
Assigned beneficiaries are those that received a plurality of their E&M services from the
participating PGP. These data indicate that the number of assigned beneficiaries per PGP
ranged from 8,383 to 44,609 in 2004. Over all 10 PGPs, the beneficiaries totaled 223,203.
Table 2. Selected Characteristics of Beneficiaries Assigned to Participating Physician Group Practices (PGPs), 2004
Range across the 10 PGP
demonstration participants
Minimum Maximum
Medicare patients
Total1 11,713 59,273
Assigned beneficiaries2 8,383 44,609
Evaluation and management (E&M) visit utilization of assigned beneficiaries
Mean number of E&M visits per beneficiary 4.80 6.59
Mean proportion of E&M services provided at the PGP 0.74 0.90
Percent of beneficiaries by Medicare eligibility
Aged 74.9% 88.8%
End-stage renal disease 0.2% 3.3%
Disabled 10.9% 21.8%
Percent of beneficiaries by Medicaid eligibility
Medicaid-eligible at least one month in 2004 10.3% 17.6%
Percent of beneficiaries by age
< 65 11.1% 24.7%
65–74 38.6% 46.8%
75–84 27.2% 36.7%
85+ 7.9% 13.7% 1 Beneficiaries made at least one office or other outpatient E&M visit at a participating PGP. 2 Beneficiaries who received a plurality of their office or other outpatient E&M services (measured by allowed charges) at a participating PGP. Source: RTI International.
Table 2 indicates that assigned beneficiaries made a mean number of E&M visits
ranging from 4.8 to 6.6 across the participating PGPs in 2004. Moreover, the PGPs
provided on average three-quarters or more of the total E&M services received by the
assigned beneficiaries. As a result, these data indicate that the PGPs have substantial
8
primary care contact with their assigned beneficiaries and multiple opportunities to
influence the quality and efficiency of the care they receive.
Eligibility data in Table 2 indicate that most of the assigned beneficiaries are
Medicare eligible because of their age, although the proportion eligible as a result of
disability ranges from 11 percent to 22 percent across the PGPs. Similarly, the proportion
eligible for Medicaid in addition to Medicare ranges from 10 percent to 18 percent.
Although most of the assigned beneficiaries are age 65 or over, there is some
variation across the PGPs in the proportion—ranging from 8 percent to 14 percent—who
are 85 or older.
QUALITY AND EFFICIENCY INNOVATIONS IN THE
PGP DEMONSTRATION
This section summarizes the presentations, made by the participating PGPs at the site
conference, that described key strategies and innovations they applied in order to respond
to the demonstration’s incentives. These summaries are grouped by topic, which include:
1) improving cost-efficiency; 2) methods for care management and disease management;
and 3) information technology applications for improving care.
While these topics illustrate areas of emphasis in the presentations, most groups also
discussed interventions they have applied across multiple topics. All of the PGPs
responded to the demonstration with a range of interventions, focusing both on patients
and providers. The specific activities emphasized in each presentation did not necessarily
encompass the entire range of responses to the demonstration, but rather were selected to
highlight noteworthy and innovative interventions. The statements and conclusions
presented were based on the PGPs’ internal results and not on CMS findings.
Improving Cost-Efficiency
Everett Clinic
The Everett Clinic’s primary goal under the PGP demonstration is to improve care
delivery for seniors. The clinic’s senior-care model is based on the stratification of patients
into three groups based on disease and functional status: 1) robust (more healthy) seniors;
2) pre-frail seniors; and 3) frail seniors. Robust seniors are thought to generally benefit
from enhanced access to care; appropriate enrollment in disease management services for
diabetes, congestive heart failure, coronary artery disease, and hypertension; and
appropriate delivery of preventive services. Pre-frail seniors generally do not utilize health
care resources in optimal ways, and it is believed they can benefit from improved

9
discharge planning to reduce emergency department (ED) and hospital use. Frail seniors
often utilize high-cost hospital care and skilled nursing facility care. It is believed they can
benefit from improved access to palliative care (to relieve suffering) and earlier hospice
facility utilization, when appropriate.
The Everett Clinic has been promoting palliative care through the presence of
hospice nurses in primary care offices. They have also been providing intensive case-
management and end-of-life planning education. The clinic has funded palliative care
programs and educational information through a partnership with a hospital-based hospice
program. The palliative care promotion program is currently available at two Everett
Clinic sites and is expected to expand to all four satellite sites in 2006.
Evidence has shown that proper use of palliative care programs can reduce hospital
admissions. After Everett Clinic staff studied 140 patients over age 65 who passed away
between August 2004 and January 2006, they found that patients who had received
palliative care were more likely to have zero hospital admissions prior to death than those
not receiving palliative care (53 percent versus 28 percent). In addition, the total number
of admissions per patient was lower for patients receiving palliative care (1.9 vs. 2.4).
Palliative care programs also increased use of hospice services. The Everett Clinic
found that the median hospice length of stay was 47 days for those receiving palliative care
versus just 6 days for others.
The second major strategy at the Everett Clinic is appropriate post-ED and
hospital discharge follow-up. In 2005 the clinic staff established a data agreement with its
affiliated hospital to capture data electronically on daily hospital and ED admissions and
discharges. They also set up an automatic encounter request to remind primary care
physicians and their nurses to contact discharged patients for follow-up within five days of
discharge. They believe that this has improved communication across the range of
doctor/patient/nurse relationships, which are all important for quality health care delivery
and efficiency.
The Everett Clinic established its five-day post-discharge follow-up period by
studying data on the relationship between 30-day readmission rates and the timing of the
first outpatient visit after discharge. This analysis indicated that readmission rates were
lowest when patients had their first follow-up visit within four-to-10 days after hospital
discharge (Figure 2).

10
Figure 2. Optimal Timing for PCP Visit Post Hospital Stay, Everett Clinic
Source: Everett Clinic presentation at the Medicare Physician Group Practice Site Meeting: Quality and Efficiency Innovations.
This innovation reinforced the importance of proper discharge follow-up to reduce
avoidable hospital admissions. Since the implementation of an automatic patient encounter
reminder system, Everett has observed an improvement in patient follow-up and a decrease
in the hospital readmission rate for its patients aged 65 and older. It has also observed a
downward trend in overall inpatient admissions for patient aged 65 and older. The Everett
Clinic’s staff believe that improved post-discharge follow-up, improved coordination of
care, and enhanced palliative care have all contributed to these positive results.
Middlesex Health System
Middlesex Health System (MHS) aims to generate cost savings under the PGP
demonstration through improved quality of care, enhanced patient safety, and appropriate
coordination of care. MHS emphasizes two major strategies for achieving these goals:
participation in national hospital-based quality and safety initiatives; and transition
management.
MHS is currently participating in several quality and safety initiatives, including the
Institute for Healthcare Improvement 100K Lives Campaign, the Surgical Care
Improvement Project, the National Surgery Quality Improvement Program, the Leapfrog
Group for Patient Safety, and the National Quality Form quality measures. MHS staff
believe that by leveraging the knowledge and techniques provided as part of these
initiatives, they will be better able to respond to the PGP demonstration incentives.
11
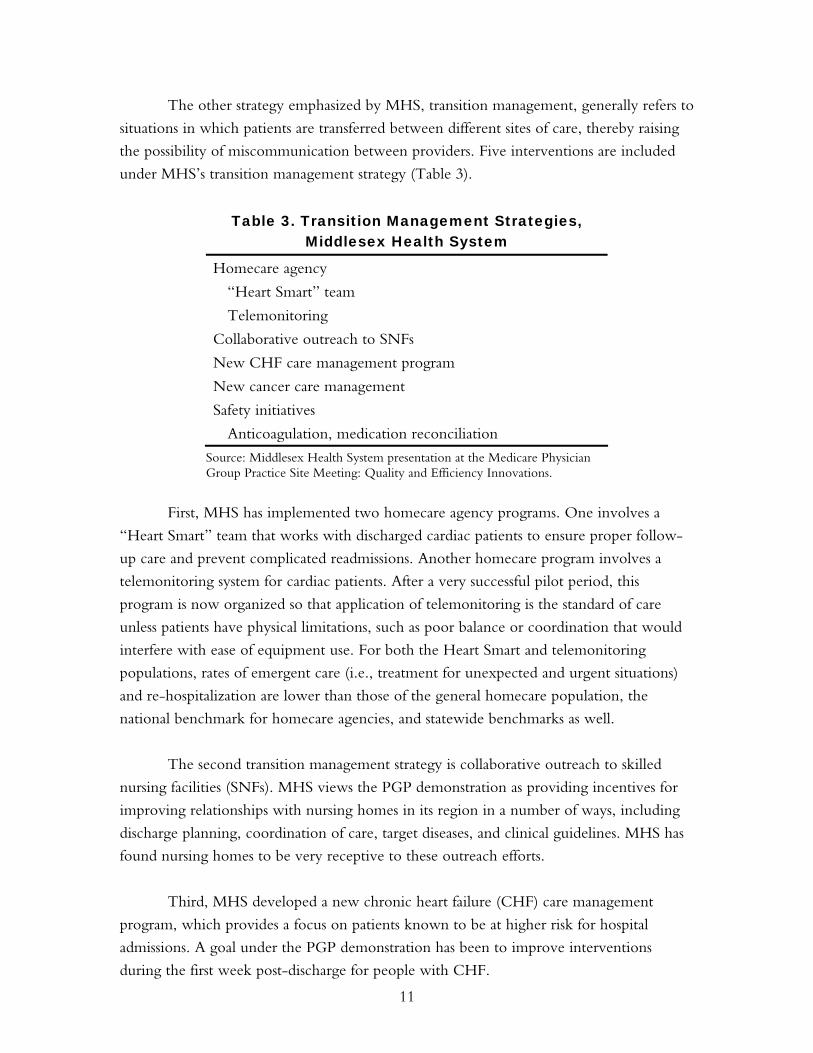
The other strategy emphasized by MHS, transition management, generally refers to
situations in which patients are transferred between different sites of care, thereby raising
the possibility of miscommunication between providers. Five interventions are included
under MHS’s transition management strategy (Table 3).
Table 3. Transition Management Strategies, Middlesex Health System
Homecare agency
“Heart Smart” team
Telemonitoring
Collaborative outreach to SNFs
New CHF care management program
New cancer care management
Safety initiatives
Anticoagulation, medication reconciliation
Source: Middlesex Health System presentation at the Medicare Physician Group Practice Site Meeting: Quality and Efficiency Innovations.
First, MHS has implemented two homecare agency programs. One involves a
“Heart Smart” team that works with discharged cardiac patients to ensure proper follow-
up care and prevent complicated readmissions. Another homecare program involves a
telemonitoring system for cardiac patients. After a very successful pilot period, this
program is now organized so that application of telemonitoring is the standard of care
unless patients have physical limitations, such as poor balance or coordination that would
interfere with ease of equipment use. For both the Heart Smart and telemonitoring
populations, rates of emergent care (i.e., treatment for unexpected and urgent situations)
and re-hospitalization are lower than those of the general homecare population, the
national benchmark for homecare agencies, and statewide benchmarks as well.
The second transition management strategy is collaborative outreach to skilled
nursing facilities (SNFs). MHS views the PGP demonstration as providing incentives for
improving relationships with nursing homes in its region in a number of ways, including
discharge planning, coordination of care, target diseases, and clinical guidelines. MHS has
found nursing homes to be very receptive to these outreach efforts.
Third, MHS developed a new chronic heart failure (CHF) care management
program, which provides a focus on patients known to be at higher risk for hospital
admissions. A goal under the PGP demonstration has been to improve interventions
during the first week post-discharge for people with CHF.
12
The fourth transition management strategy is a new cancer care management
program. Its goals are to reduce the time between identification and treatment of
suspicious nodules and help patients navigate through evidence-based clinical pathways.
The fifth strategy is patient safety initiatives, including improved anticoagulation
therapy and better medication reconciliation, which more or less involves comparing the
patient’s medications with physicians’ orders. But because MHS has found that the
definition of “medication reconciliation” varies among providers, it is seeking some
consensus. MHS has also found that a key area for intervention is during “hand-offs”
between providers, a time when patients may “fall through the cracks” and not receive the
ongoing attention they need to their overall set of medications.
Marshfield Clinic
Marshfield Clinic identified one of its challenges under the PGP demonstration to be
reducing costs. Because it does not have a hospital in its system, it is harder for the clinic
to reduce costs in comparison to other PGPs that either own hospitals or are part of
integrated delivery systems that include hospitals. As a result, Marshfield has focused on
increasing the efficiency of its workflows.
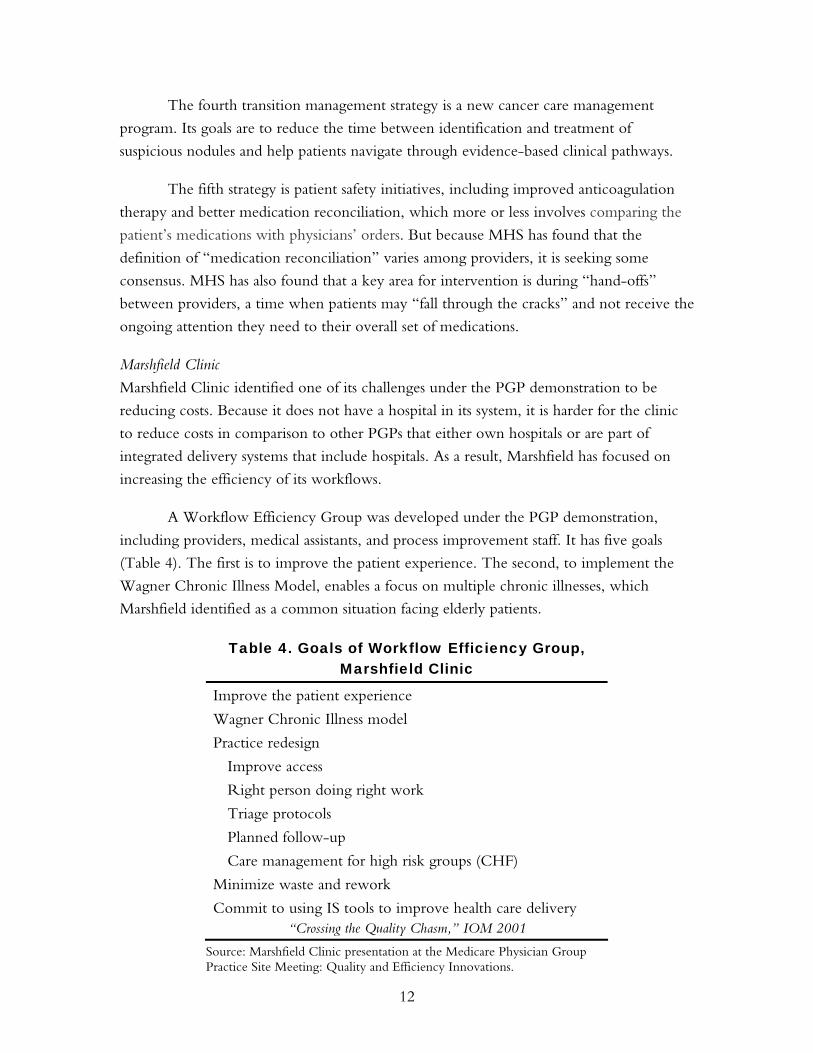
A Workflow Efficiency Group was developed under the PGP demonstration,
including providers, medical assistants, and process improvement staff. It has five goals
(Table 4). The first is to improve the patient experience. The second, to implement the
Wagner Chronic Illness Model, enables a focus on multiple chronic illnesses, which
Marshfield identified as a common situation facing elderly patients.
Table 4. Goals of Workflow Efficiency Group, Marshfield Clinic
Improve the patient experience
Wagner Chronic Illness model
Practice redesign
Improve access
Right person doing right work
Triage protocols
Planned follow-up
Care management for high risk groups (CHF)
Minimize waste and rework
Commit to using IS tools to improve health care delivery “Crossing the Quality Chasm,” IOM 2001
Source: Marshfield Clinic presentation at the Medicare Physician Group Practice Site Meeting: Quality and Efficiency Innovations.
13
The third goal is practice redesign, which includes: improving access by reducing
the time between appointments; ensuring that the right person does the right work (which
often involves pushing work down from physicians to nurses or physician assistants);
developing triage protocols; ensuring planned follow-up; and providing care management
to high-risk patient groups. The fourth goal is minimizing waste and rework. And the fifth
is making a commitment to using information technology to improve health care delivery,
especially through its proprietary electronic medical record (EMR) system.
Marshfield Clinic has identified six strategies for meeting these workflow efficiency
goals. First is leveraging informatics during the pre-appointment, appointment, and post-
appointment phases of treatment. This is complemented by an increased focus on
population-based information, with education of physicians as a key aspect. The goal is to
move physicians beyond their traditional focus on individual patients to also understand
the characteristics and needs of their entire patient complement.
The second strategy involves process improvement and redesign. Third is an
emphasis on care management programs, which include linkages to physicians through
methods such as adding telephonic notes from care management staff to the electronic
medical record for easier access by the physician. The fourth strategy is attempting to align
incentives. Fifth is a focus on value—for example, emphasizing clinical improvement and
cost efficiency for all patients, as physicians do not want to treat Medicare patients
differently. The sixth strategy is engaging in group practice so as to maximize the benefits
of clinical collaboration.
An Intervention List has been implemented under the PGP demonstration to
stratify patients by risk level. It focuses attention on patients ranked at the top of an
electronic list prepared for physicians, with rankings based on patients with multiple
conditions and those needing interventions to satisfy quality measures. It also enables
medical assistants to review high-risk patients and, based on written protocols, order
routine tests needed for some interventions without the need for physician involvement.
The EMR at Marshfield Clinic has been operational since 1985, and has become
increasingly sophisticated over the years. Accessible at all Marshfield Clinic sites, the EMR
enables physicians to generate graphs and other reports presenting a specific patient’s
health care improvement (or decline) over time. It includes a “dashboard” that presents a
patient’s active medications, problem list, laboratory test results, medications, previous
appointment dates, vital statistics, immunizations, and other data. The EMR also includes
a Medications Manager, Document Manager, and a physician reminder system.

14
In addition to improving patient care, Marshfield Clinic has utilized informatics to
provide feedback on quality metrics to individual providers. The EMR facilitates the
collection of quality data, and allows for timely distribution of feedback to physicians.
Individual doctors can then examine their quality performance and compare it to their
department overall.
Because workflows may vary depending on the size and type of department, efforts
to improve them need to be reflective of local needs. Thus, Marshfield’s Workflow
Efficiency Group is available to individual departments so that it can observe existing
processes and make recommendations to optimize workflows.
Methods for Care Management and Disease Management
University of Michigan
The University of Michigan Health System (UMHS) has identified the primary goal of its
care coordination interventions to be quality improvement. UHMS is working to enhance
communication among providers and to improve patient compliance, self-management, and
access to necessary services. Care coordination is viewed as having potential to affect a broad
range of quality of care issues, including overuse, underuse, and misuse of health care services.
UMHS has focused on two service delivery interventions to improve coordination
of care: transitional care; and the “medical home.” Transitional care is aimed at reducing
readmissions, while the medical home is aimed at reducing first admissions, such as for
ambulatory care sensitive conditions (for which hospitalization is thought to be avoidable).
UMHS has implemented a range of transition care interventions, and is working on
broader implementation of the medical home approach.
The strategies for transition management are to assist with timely appointment
scheduling, improve the availability of patient contact information, provide appropriate
patient discharge counseling, reduce social barriers to care (e.g., transportation to
appointments, affordability of medications), and provide home care. Transitional care
interventions include post-discharge calls to follow up with patients within 24 hours of
hospital discharge. The majority of these calls have been to medical patients, although
some have been made to surgical patients. UMHS has also piloted a pharmacy discharge
program to ensure that patients discharged with medication changes understand those
changes and receive the correct medications. This program is a response to a major issue
for many patients, who are often discharged with five or more complex medications that
may need ongoing monitoring. Moreover, increases in the number of medications
prescribed for chronic disease patients in recent years, and the increased complexity of

15
medication regimens, have made it more difficult for social workers or nurses to assist
patients with managing those issues.
Other transitional care interventions include coordination with hospitalists
(physicians who specialize in the management of hospitalized patients), a transitional clinic
for geriatrics, disease management, and palliative care teams. Disease management
programs are being tailored to the more complex needs of Medicare patients, who often
have multiple diseases and social problems. These programs are inspired by the observation
that telephone consultations with nurses, who are often the focus of disease management
for younger and commercially insured populations, do not work as well for Medicare
patients. Another goal is to utilize palliative care teams more in the future, so that patients
who could benefit from this type of care are identified earlier.
UMHS has also developed transitional care interventions with nursing homes and
its ED. The ED includes a CHOICES program for patients that provides follow-up after
discharge to help prevent revisits to the ED.
Medical home interventions have focused on patients needing complex care
coordination services (Table 5), These interventions are provided either at individual
clinic sites or another central location for particular patient groups. The patients targeted
for medical home services include the vulnerable elderly and “dual eligibles” with mental
health and social problems. A similar program is being considered for end-stage renal
disease patients.
Table 5. “Medical Home” Interventions, University of Michigan
Complex care coordination
Central vs. site-based
Special clinical groups:
Vulnerable elderly
Dual eligibles/mental health and social problems
ESRD/transplant
Geriatric ambulatory services
Disease management (part)
Visiting nurse—Housecalls program
Patient education and self-management support
Advanced-disease management
Source: University of Michigan Health System presentation at the Medicare Physician Group Practice Site Meeting: Quality and Efficiency Innovations.

16
Additional programs included under the medical home concept are geriatric
ambulatory services, advanced disease management (including palliative care), visiting
nurses for home care (Housecalls program), and patient education and self-management
support. These programs are currently under development, with appropriate patient
groups, and a range of services and techniques are being explored and tested.
Complex care coordination at UMHS involves nurses, health navigators, and social
workers in managing care. It has also involved efforts for improved patient identification
and monitoring to prioritize services for high-risk and high-cost patients. Data analysts and
care managers work to improve the identification process of such patients through review
of real-time admission, discharge, and ED visit data. Reporting results both for financial
and clinical outcomes is also emphasized, with the goal of identifying best practices.
Forsyth Medical Group
Forsyth Medical Group (FMG) introduced the Comprehensive Organized Medicine
Provided Across a Seamless System (COMPASS) disease management program under the
PGP demonstration. The goals of COMPASS are to provide practice-level tools for
meeting the PGP demonstration quality measure targets, educational packets to address
disease self-management with patients, disease-specific population-based interventions, and
case management for high-risk patients.
As part of COMPASS, FMG developed color-coded disease management
worksheets to help remind physicians and other clinical staff about patients needing
particular tests or interventions. They also serve to increase the available documentation
for services provided to FMG’s Medicare beneficiaries. Moreover, providers receive
pocket cards, which correlate with the disease management worksheets, that explain the
PGP demonstration quality measures and their components.
Table 6 exemplifies one of the pocket cards developed by FMG for its providers.
This card, oriented to preventive care, describes five quality measures for blood pressure
measurement, hypertension control, colorectal cancer screening, and mammogram
screening. As pocket cards also give providers additional recommendations for quality
care, this one suggests that they take weight measurement at each visit, review medication
lists, document smoking status, counsel patients on smoking, and provide cervical cancer
screening, prostate screening, and influenza and pneumonia vaccinations.

17
Table 6. Preventive Care Pocket Card for Quality Measures, Forsyth Medical Group
Quality measures
Blood pressure measurement recorded each visit
Hypertensive patient’s last blood pressure < 140/90 mmHg
Hypertensive patient with systolic BP > 140 mmHg or diastolic BP >90 mmHg has a documented plan of care for HTN
Annual screening for colorectal cancer patients > 50 years old
Annual mammogram screening in female > 40 years old who has not had a bilateral mastectomy (study measures > 50 and < 69 years old who has documentation of mammogram in last two years)
Additional recommendations
Weight measurement recorded each visit
Medication list reviewed
Smoking status and counseling documented
Cervical cancer screening in females who have a cervix as recommended by physician
Annual prostate screening using PSA or DRE in males > 50 years old or at risk for prostate cancer
Patient > 50 years old receives annual influenza vaccination during September to February*
Patient > 65 years old receives the pneumonia vaccine*
* Intolerance or contraindication noted. Source: Forsyth Medical Group presentation at the Medicare Physician Group Practice Site Meeting: Quality and Efficiency Innovations.
FMG has developed several case management tools to support COMPASS, which
in turn expanded and integrated several existing disease management programs at FMG.
The tools include a semi-annual patient report, disease-specific data collection procedures,
and provider feedback procedures. The semi-annual disease management report includes
information on a patient’s condition, medical history, and past laboratory test results.
It was implemented in 2006, and efforts are under way to expand its use by providers.
The disease-specific data collection procedures, intended to improve provider–patient
interaction, request information from patients regarding their chronic conditions. The
provider feedback procedures are a means for formal communication with providers
regarding their quality-of-care performance and areas for improvement.
Since its inception, COMPASS has used a range of techniques to gain name
recognition across the FMG system. Providers have received toolboxes with sections for
each quality measure. Patients and providers have received promotional items such as jar
openers, nightlights, pens, magnets, and tote bags. Educational packets and booklets have
18
been made available for patients with diabetes, congestive heart failure, chronic obstructive
pulmonary disease, and hypertension. COMPASS has also been publicized on the FMG
Web site.
Park Nicollet Health Services
Park Nicollet Health Services (PNHS) has implemented two major innovations under
the PGP demonstration: redesign of health care delivery for diabetes and heart failure
patients. PNHS plans similar innovations for coronary artery disease, hypertension, and
preventive care.
The diabetes program involves a disease registry, a nurse population manager,
point-of-care testing, and a certified diabetes educator (CDE). The disease registry identifies
patients with diabetes, their laboratory test dates, and the test results. The nurse population
manager performs the following functions: responsibility for reviewing the registry to
identify patients who may be overdue for tests or who have not yet met the standard of
care; providing lists of targeted patients to receptionists who call and schedule necessary
appointments; working with physicians to plan next steps in treatment for those patients;
and working directly with patients to enhance their disease self-management skills.
For point-of-care testing, patients requiring laboratory testing are asked to arrive for
their next appointment 30 minutes prior to the nominal time. They receive laboratory papers
for required tests at check-in and have the tests administered on-site; the test results are
then made available to physicians, prior to the patient’s appointment time, through the EMR.
This process allows physicians to treat patients based on that day’s laboratory test results.
The final component of the diabetes program involves a CDE who is located
within the department and available to patients and physicians through walk-in or by
paging. This is viewed as preferable to the prior system, which relied on the patient to
take the initiative by calling the CDE to make an appointment. The CDE starts patients
on insulin, provides education on the disease, and gives meter training. He or she also
makes follow-up calls to patients when they begin new medications and coordinates
follow-up visits. Each CDE is responsible for approximately 1,600 patients, although not
all are actively seen.
The second innovation at PNHS has been for heart failure care. It involves a
patient registry, case managers, and an interactive voice response (IVR) system. The heart
failure registry is similar to the diabetes registry. It identifies patients with heart failure and
provides data on medical histories and laboratory test results.
19
PNHS has four case managers, all located within the clinics, who stay in direct
contact (and aim to build close bonds with) physicians to ensure optimal patient care. Case
managers, each of whom is responsible for approximately 200 heart failure patients,
perform the following functions, among others: facilitation of enrollment into the program
at clinics and within the hospital; assisting patients with other medical conditions who also
have diabetes; providing diuretics for treatment of patients; and supporting an IVR system
that monitors patients 365 days a year via their telephone.
The IVR system asks patients a series of questions on a daily basis, and their
responses are then entered into a large database, with any variances from prior responses
highlighted. Case managers review online reports that show patients’ responses over time.
If anything out of the ordinary is seen in these reports, the case manager will follow up
with the patient and the primary care provider.
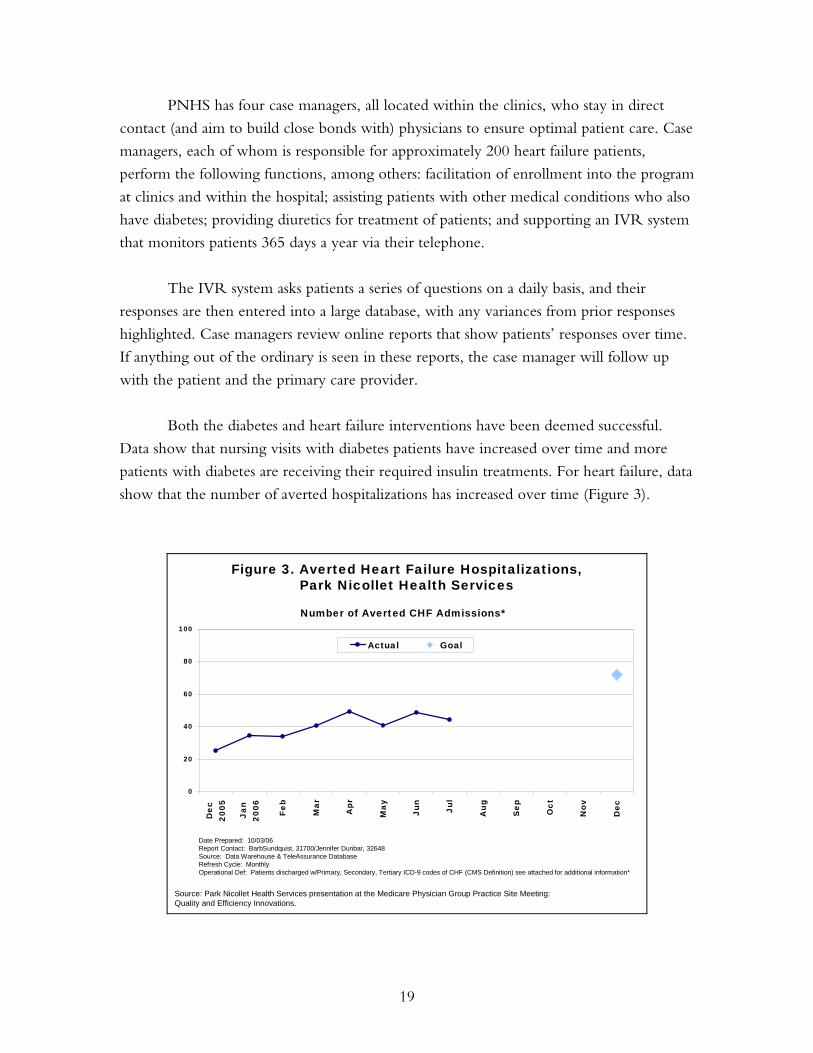
Both the diabetes and heart failure interventions have been deemed successful.
Data show that nursing visits with diabetes patients have increased over time and more
patients with diabetes are receiving their required insulin treatments. For heart failure, data
show that the number of averted hospitalizations has increased over time (Figure 3).
Figure 3. Averted Heart Failure Hospitalizations,Park Nicollet Health Services
Source: Park Nicollet Health Services presentation at the Medicare Physician Group Practice Site Meeting: Quality and Efficiency Innovations.
0
20
40
60
80
100
Dec
2005
Jan
2006 Fe
b
Mar
Apr
May
Jun
Jul
Aug
Sep Oct
Nov
Dec
Actual Goal
Number of Averted CHF Admissions*
Date Prepared: 10/03/06Report Contact: BarbSundquist, 31700/Jennifer Dunbar, 32648 Source: Data Warehouse & TeleAssurance DatabaseRefresh Cycle: MonthlyOperational Def: Patients discharged w/Primary, Secondary, Tertiary ICD-9 codes of CHF (CMS Definition) see attached for additional information*

20
Dartmouth-Hitchcock Clinic
Under the PGP demonstration, the Dartmouth-Hitchcock Clinic (DHC) has
implemented two sets of interventions—one aimed at reducing costs and the other at
improving quality.
Cost-reduction interventions include analysis of risk scores, predictive modeling,
and strategies to reduce readmissions. Analysis of diagnostic risk categories showed that 23
percent of DHC’s assigned beneficiaries represent 73 percent of Medicare payments for
assigned beneficiaries overall. As a result, one of their goals is to find ways to target
interventions to that high-cost group.
Analysis of the cost effect of patients with readmissions showed that the 5,928
assigned beneficiaries with readmissions had annual Medicare costs of $30,052, while the
22,176 assigned beneficiaries without readmissions had annual costs of only $2,629. Closer
study of those with readmissions indicated that they were more frequently dual eligibles—
patients who had both psychiatric and medical conditions. As a result, another goal is to
tailor interventions to their unique set of issues.
DHC developed an approach to stratifying high-risk Medicare beneficiaries, who
may then be targeted for interventions. Reports are prepared, using DHC billing data for
each clinic site, to identify such “Gold Star” patients, who are defined as meeting any of
the following criteria:
• Three or more co-morbidities from among: diabetes, CAD, HF, hypertension,
cancer, psychiatric, chronic obstructive pulmonary disease (COPD), or vascular
disease
• Seven or more CMS PGP demonstration assignment-related E&M visits
• Patients hospitalized in the past year with charges of $10,000 or more.
DHC’s quality improvement strategies include a health-coaching program and
development of disease registries. A health coach is a specially trained professional (such as
a nurse or dietitian) who instructs or directs patients in aspects of personal health care.
Health coaches are charged with providing evidence-based health information to patients
by telephone, during office visits, through educational materials, and through group
classes. They are integrated into primary care practices within DHC divisions and target
their interventions on high-risk chronic disease patients (e.g., with diabetes, HF, or CAD).
Hospital-based sites target interventions on post-discharge follow-up and readmissions.
21
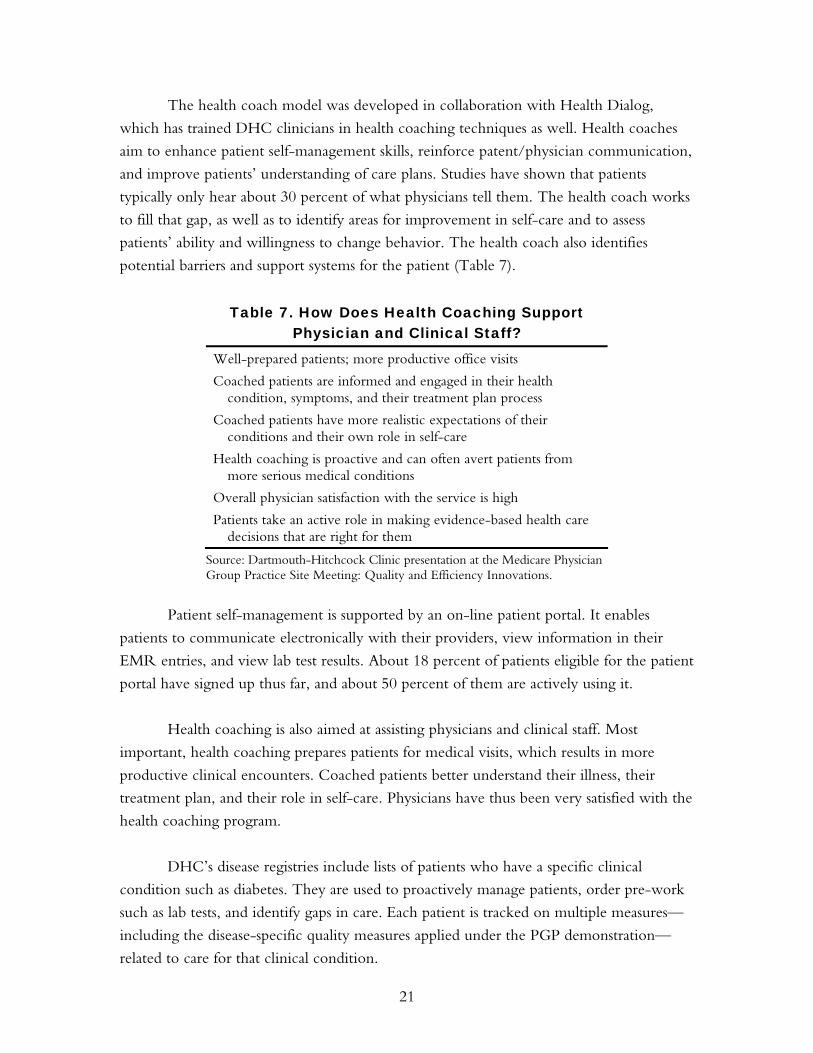
The health coach model was developed in collaboration with Health Dialog,
which has trained DHC clinicians in health coaching techniques as well. Health coaches
aim to enhance patient self-management skills, reinforce patent/physician communication,
and improve patients’ understanding of care plans. Studies have shown that patients
typically only hear about 30 percent of what physicians tell them. The health coach works
to fill that gap, as well as to identify areas for improvement in self-care and to assess
patients’ ability and willingness to change behavior. The health coach also identifies
potential barriers and support systems for the patient (Table 7).
Table 7. How Does Health Coaching Support Physician and Clinical Staff?
Well-prepared patients; more productive office visits
Coached patients are informed and engaged in their health condition, symptoms, and their treatment plan process
Coached patients have more realistic expectations of their conditions and their own role in self-care
Health coaching is proactive and can often avert patients from more serious medical conditions
Overall physician satisfaction with the service is high
Patients take an active role in making evidence-based health care decisions that are right for them
Source: Dartmouth-Hitchcock Clinic presentation at the Medicare Physician Group Practice Site Meeting: Quality and Efficiency Innovations.
Patient self-management is supported by an on-line patient portal. It enables
patients to communicate electronically with their providers, view information in their
EMR entries, and view lab test results. About 18 percent of patients eligible for the patient
portal have signed up thus far, and about 50 percent of them are actively using it.
Health coaching is also aimed at assisting physicians and clinical staff. Most
important, health coaching prepares patients for medical visits, which results in more
productive clinical encounters. Coached patients better understand their illness, their
treatment plan, and their role in self-care. Physicians have thus been very satisfied with the
health coaching program.
DHC’s disease registries include lists of patients who have a specific clinical
condition such as diabetes. They are used to proactively manage patients, order pre-work
such as lab tests, and identify gaps in care. Each patient is tracked on multiple measures—
including the disease-specific quality measures applied under the PGP demonstration—
related to care for that clinical condition.

22
Information Technology Applications for Improving Care
Geisinger Health System
Geisinger Health System (GHS) is utilizing its electronic health record (EHR) as a key
element in its response to the PGP demonstration incentives. Bringing to bear a long-
standing commitment to health information technology, GHS’s primary goals in
developing an EHR were to develop an efficient and adaptable system that would reduce
administrative burdens, improve clinical outcomes, and be scalable and exportable. It was
also intended to be user-friendly for patients so they would readily be able to access
information from it regarding their health status and care.
The EHR now serves GHS providers, referring physicians, and patients. It collects
data on over one million visits provided by GHS providers each year, and can accommodate
more than 5,000 concurrent users. The EHR connects GHS to over 500 non-GHS
physicians and 10,000 patient records. Patients may also access portions of the EHR, called
“MyGeisinger,” for viewing test and lab results, scheduling appointments, interacting with
their physician, and renewing medications. The patient portion is expanding rapidly,
currently adding over 2,000 new users per month.
Patient-level alerts and reminders are used within the EHR to assist physicians and
their office staff in providing standardized and highly reliable care. In addition, “operational
registries” with condition-specific lists of patients are used to first identify those who are
deficient in various aspects of standards-based care and then to reach out to them through
such mechanisms as letters, referrals, laboratory test orders, and secure e-mails.
The registries are focused on a range of PGP demonstration interventions,
including chronic disease return visits (for patients with HF, COPD, or diabetes),
pneumococcal vaccination, and diabetes management. Table 8 illustrates the standards set
for diabetes care.

23
Table 8. “All or None” Process Reliability, Diabetes “Bundle”
Measures Quality standard
HgbA1c measurement Every 6 months
HgbA1c control < 7
LDL measurement Yearly
LDL control < 100
Blood pressure control < 130/80
Retinal exam Yearly
Urine (protein) exam Yearly
Foot exam Yearly
Influenza immunization Yearly
Pneumococcal immunization Once
Smoking status Non-smoker
Use of ACE/ARB for microalbuminuria/DM nephropathy
Yes
Use of ACE/ARB for hypertension Yes
Patients who receive/achieve ALL of the above
Yearly
Source: Geisinger Clinic presentation at the Medicare Physician Group Practice Site Meeting: Quality and Efficiency Innovations.
Geisinger has focused on setting high standards of care for treatment of diabetes,
including LDL < 100 versus 130, blood pressure < 130/80 versus 140/90, and evaluation
of smoking status versus smoking assessment or education. Quality of care analysis also
includes evaluation of the number of patients who achieved standards for all of the
measures.
The registries are updated automatically and reviewed on a monthly basis. The use
of registries has increased the number of patients receiving clinical services. One
particularly successful application has been informing patients of their need for
pneumococcal vaccinations. The registries permit Geisinger Clinic to track and target
patients who have not yet received the recommended vaccinations.
The Geisinger EHR also provides best practice alerts to providers at the point of
care. They allow physicians to view a summary of the patient’s care, receive reminders
about tests and other interventions, and ensure that they have not missed anything
regarding needed care.

24
Billings Clinic
Billings Clinic implemented an integrated EMR, in July 2004, that provides a common
data repository for information from laboratories, pharmacies, and radiologists, as well as
from the provider. It also allows for online medication ordering and prescribing, with full
implementation of this module expected in 2006.
The EMR has been Billings Clinic’s main vehicle for quality-of-care and process
improvement under the PGP demonstration. It supports chronic disease management
programs by facilitating the identification of eligible patients through registries, enabling
development of disease management modules, generating quality and care performance
reports for organizations and providers, and generating score cards for individual patients
that highlight specific patient needs (e.g., laboratory tests). The EMR, through health
maintenance modules, also alerts providers regarding gaps in preventive services such as
tests, screenings, or immunizations.
In addition, the EMR improves patient safety through medication reconciliation
applied during transitions in care. The reconciliation process is made possible through
online prescribing and development of patient-friendly medication lists.
Use of the EMR has generated cost savings and quality improvement alike for
diabetes and HF patients, who are a focus of the PGP demonstration. For diabetes, the cost-
savings emphasis has been on preventing avoidable admissions, frequent readmissions, and
readmission complications. Quality improvement efforts include a diabetes patient registry, a
disease management module, provider reports and benchmarking, and a patient score card
that reflects the PGP demonstration quality measures. These efforts have shown results at
Billings Clinic. For example, foot exam documentation rates for diabetes patients increased
substantially from May 2005 (20 percent) to April 2006 (> 50 percent) (Figure 4).

25
Figure 4. Foot Exam Documentation Rate,Billings Clinic
Source: Billings Clinic presentation at the Medicare Physician Group Practice Site Meeting: Quality and Efficiency Innovations.
Percent of patients, May 2005–April 2006
Time Frame
20
3035
42 4347 49 50 49
54 55 55
0
10
20
30
40
50
60
May-05
Jun-05
Jul-05
Aug-05
Sep-05
Oct-05
Nov-05
Dec-05
Jan-06
Feb-06
Mar-06
Apr-06
For HF, the cost-savings goal is to reduce all-cause admissions by 20–50 percent.
Quality improvement is supported by an HF clinic redesign that includes an increased role
for nurse practitioners, an HF patient registry, disease management, enhanced provider
education on new treatment guidelines, and improved patient education. Heart failure
patients are monitored in-between office visits by Billings Clinic nurses using an
interactive voice response system that prompts patients to respond on a daily basis to
questions about their weight, medications, and symptoms. Currently, over 700 patients are
enrolled in this service, with a goal of 1,000 patients.
Future efforts are planned for other diseases and interventions targeted by the PGP
demonstration. Disease management modules will be expanded to include CAD and
hypertension. Health maintenance modules will be developed for cancer screening,
including mammography and colonoscopy.
St. John’s Health System
St. John’s Health System (SJHS) developed a comprehensive patient registry to help
respond to the PGP demonstration’s quality improvement incentives, and it has been
viewed as critical to the demonstration’s success at SJHS. An Advisory Board of senior
staff, including physicians, nurses, case managers, office managers, and IT specialists, was
formed to design and implement the registry over a period of about eight months.

26
The patient registry is based on Java and includes an Oracle Database available
through SJHS’s intranet. It is designed for tracking patient information, identifying gaps in
care, and ensuring that appropriate and timely care is provided.
The registry’s database is populated through interfaces with existing billing,
scheduling, and clinical systems, including IDX, Cerner, Sunquest, STAR, Apollo-
Cardio, and MOHSAIC. Some information is also entered manually. Data elements
include patient demographics, diagnoses, procedures, laboratory test results, ejection
fractions, and immunizations (Table 9).
Table 9. Electronic Interfaces for the Patient Registry, St. John’s Health System
Clinical and billing systems interfaced
IDX, Cerner, Sunquest, STAR, Apollo-Cardio, MOHSAIC
Data elements
Patient demographics
Diagnoses
Procedures—mammograms, colon cancer screenings
Labs—HbA1c, cholesterol, urine protein
Ejection fractions
Immunizations—influenza and pneumonia
Source: St. John’s Health System presentation at the Medicare Physician Group Practice Site Meeting: Quality and Efficiency Innovations.
A key element of the patient registry is the Visit Planner, which complements the
established clinical workflow process at SJHS. It provides a “to do” list for physicians prior
to each patient visit, with reminders for needed tests or interventions. The Visit Planner
consists of a one-page summary for each patient that shows key demographic and clinical
data, including test dates and results. It highlights tests for which the patient is due,
including those for the PGP demonstration quality measures.
Physicians have responded positively to the Visit Planner, indicating that it helps
them in preparing for patient encounters. For example, they do not need to look through
the medical record to see if mammograms or colonoscopies have been done. As a result,
physicians have actively assisted with the effort to keep the patient registry database up to
date by entering new information into the system right after patient visits. SJHS views this
result as a lesson learned from the PGP demonstration: when data systems are integrated
into the physicians’ workflow, and viewed as supportive by them, data are more easily
obtained for management reports and monitoring efforts.
27
The patient registry also provides reports on areas where patient care can be
improved. An Exception List includes patients who are due for tests or other
interventions. This is viewed as a “clean-up” process—to identify gaps in care that were
missed in the regular clinical workflow. Patients can then be contacted regarding the need
for a visit or test.
Finally, the patient registry generates quality measure and outcome summary
reports at both the individual provider and clinic levels. They are unblinded, thereby
encouraging competition among physicians for quality improvement.
CROSS-SITE THEMES
Several cross-site themes emerged from the PGPs’ presentations on the strategies and
innovations they have applied under the demonstration. This section highlights the four
major themes: 1) improving care management and coordination of care; 2) expanding
palliative and hospice care; 3) modifying physician practice patterns and behavior; and 4)
enhancing information technology.
Improving Care Management and Coordination of Care
Improving care management and coordination of care are common goals of the
participating PGPs. Viewed as having the potential both to reduce costs and improve
quality, these goals are thus responsive to the twin incentives provided to PGPs under the
demonstration.
However, it is important to note that the terminology for these interventions is
not standardized. Care management and coordination of care often mean different things
to different PGPs. The University of Michigan noted that a recent evidence-based review
found 20 different definitions for coordination of care! Common approaches, however,
include chronic disease management, high-cost/high-risk patient management, and
transition management.
Chronic disease management. Most of the participating PGPs have actively
implemented chronic disease management programs for diabetes and HF patients, as these
are conditions targeted by the PGP demonstration quality measures and are frequently the
focus of managed care disease management programs. HF programs in particular are
known to have the potential for reducing hospital admissions, and thus enable PGPs to
more easily meet the cost-savings goal of the demonstration, as these programs focus on a
condition that is highly prevalent in the Medicare population and accounts for a significant
portion of Medicare expenditures.

28
A common objective of disease management is to improve patient disease self-
management skills. This may include individual training with certified educators or
community based classes. As noted, patients are thought to retain at times as little as 30
percent of the information that is provided to them in the physician’s office. Appropriate
follow-up education can help to improve treatment adherence and allow patients the
opportunity to empower themselves with respect to managing their own health care. For
example, Dartmouth-Hitchcock Clinic providers have noticed an improvement in the
productivity of physician visits when patients are more aware of their condition and
necessary treatments.
Provider-based disease management programs, enhanced by the availability of
detailed patient-level clinical information through electronic medical records and patient
registries, can be more closely tailored to individual patients and their often-complex
situations. Further, individual physicians will often feel more comfortable “buying in” to a
system that is internally developed, because they can be more involved in its design and
implementation. Patients may also feel more comfortable receiving health education
advice from their providers.
Several PGPs have developed telemonitoring systems for patients with chronic
diseases. These systems often involve daily follow-up with patients regarding their
condition and any changes related to their health status.
High-cost/high-risk patient management. High-cost/high-risk patient management
programs are generally viewed as more broadly defined than disease management programs,
given that the former usually serve patients who have multiple chronic diseases while the
latter tend to focus on single diseases. Thus high-cost/risk-patient management is viewed
as potentially more useful for Medicare populations, as Medicare patients generally have
multiple co-morbidities that need more intensive services. For example, nurses, case
managers, and social workers may be employed to improve coordination among multiple
specialists treating patients with multiple co-morbidities, aid the patient and family in
managing the often-complex drug regimens involved in treatment of their multiple
ailments, and manage the special social and medical needs of geriatric patients. Consequently, a
high-cost/high-risk patient management program may be better able to treat a frail elderly
person with HF than a more narrowly focused HF disease management program.
The stratification of patients based on their level of risk is thought to make care
management more cost-effective and more affordable. One of the challenges to
appropriate risk stratification, however, has been how best to identify the high-cost/high-

29
risk patients. For example, some patients with HF may stay in primary care, some may be
referred to a cardiologist, and some with multiple co-morbidities may be referred for
complex case management. The best procedures to use for this triaging process are being
explored and tested by several PGPs, who are using data to stratify patients by risk level in
order to aid in targeting services.
Finally, several participating PGPs have been working toward implementing
collaborative care management interventions with nursing homes. These services, within
nursing homes, can potentially address a significant source of fragmentation of care,
especially when the nursing homes are not part of the PGPs’ systems. For example,
Middlesex Health System has placed special emphasis on collaborative outreach to skilled
nursing facilities, and has reported positive results from those efforts.
Transition management. Several groups highlighted improvements in transitional care
as an important intervention for improving coordination of care. Transitional care
interventions have generally involved improving hospital and ED discharge planning to
ensure that appropriate follow-up care is received. Appropriate transitional care
management is often viewed as a strategy to avoid hospital readmissions.
In response to analysis that indicated readmission rates are lower when patients
have follow-up visits sooner, the Everett Clinic set up an automatic encounter request to
remind primary care physicians and their nurses to contact discharged patients for follow-
up within five days of discharge. The Dartmouth-Hitchcock Clinic noted that it has
implemented a policy for a post-discharge follow-up telephone call to patients even
earlier, within 24 hours. This process has worked well at its main hospital at Dartmouth-
Hitchcock Medical Center, and the Clinic is now working on ways to expand the policy
to its affiliated community hospitals.
Improving levels of cooperation from non-affiliated hospitals by sharing discharge
information—in order to facilitate follow-up efforts—was cited by several PGPs as an area
for future emphasis. The lack of incentives for information-sharing—an issue that
highlights the fragmentation of care in the U.S. health care system—was cited as a
common barrier. Future efforts to remove such barriers, and thus reduce the
fragmentation, could be initiated both on the broader policy level and through
disseminating case studies of successful information-sharing arrangements (as documented
by participating PGPs and other providers).
30
Several sites discussed analysis they had conducted on the typical reasons behind
readmissions and on the characteristics of patients at highest risk for readmission. Nursing
home patients, those over 80 years of age, and those with sepsis or end stage renal disease,
among others, were cited as high-risk. Future analysis could address ways to identify
optimal follow-up strategies for each high-risk group.
Given that many Medicare patients take multiple medications, often with complex
regimens that are prescribed at multiple points along the continuum of care, the
opportunity for medication errors in prescribing and compliance are significant. Several
PGPs are focusing on medication reconciliation as part of their transitional care programs,
with the goal of avoiding medication errors and readmissions. For example, the University
of Michigan developed a pharmacy discharge program to assist patients in managing their
complement of medications.
Expanding Palliative and Hospice Care
Several PGPs have developed or explored programs for expanding access to palliative,
hospice, or end-of-life care. The Everett Clinic’s presentation on this topic prompted
discussion regarding how best to define and distinguish the roles of these different services,
which are viewed as generally underutilized for Medicare beneficiaries and other patients
in the U.S. health care system. Yet they have promise both for reducing utilization of
high-cost hospital care and improving patient quality-of-life during end-of-life care.
Providers may need education about their potential roles and how they are distinct,
however. Palliative care nurses can also play a major role in this type of care, but their
precise roles and the training they may need are not well understood.
MHS noted that it has developed a palliative and end-of-life care program,
implemented as a community-based strategy, through a Quality of Life Coordinator in its
nursing department. MHS is also working on how to clarify the distinction between
palliative and hospice care, and on defining the best roles for each type of care.
Modifying Physician Practice Patterns and Behavior
Physician behavior is central to efforts for reducing costs and improving quality of care,
given that physicians have the largest influence on the health care system and the
treatment of patients. It is not surprising, then, that all of the participating PGPs have
considered ways to influence or modify physician practice patterns. They include
modifying physician work processes, encouraging physicians to consider the health of a
panel of patients rather than individual patients, and feedback reports to encourage
coordination of care and quality improvement.

31
The participating PGPs indicated that physicians’ support is crucial for success
under the demonstration, and in many instances they were the ones who drove their
organizations to apply for the demonstration. As a result, physicians are often deeply
involved in the development and implementation of their interventions. Physician buy-in
has, for many sites, involved assurance that administrative burdens will be minimal. Such
buy-in has been particularly important for MHS, because it is a network model with less
direct influence over providers.
Strategies to involve providers in the demonstration have typically included
education about the program and best practice models, as well as the dissemination of
provider performance feedback. Such feedback, typically on quality and efficiency
measures, allows providers to track how they are doing against external targets and how
they compare to their peers. All of the groups have implemented some form of feedback
report to providers as part of the demonstration.
A key challenge is to identify the optimal ways to modify clinical work processes,
such as when physicians can delegate some of their routine work. For example, some
PGPs have considered delegating diabetic foot exams to nurses or medical assistants. This
could free up physicians to have more time to review results from these and other tests,
and focus on how best to intervene for the patient.
Park Nicollet recognized that doctors may not have time to single-handedly
review lists of high-risk patients, but they often can work with population managers to go
through the lists and then discuss what issues are most salient for particular patients.
Geisinger developed its on-site certified diabetes educator (CDE) nurse program to
provide clinical support to physicians as well. An ongoing issue for these and related efforts
is how best to evaluate work that has been redesigned and how to consider whether the
new processes need further revision.
Enhancing Information Technology
Most of the PGPs participating in the demonstration highlighted information technology
interventions as critical for their success. Their interventions include identification and
tracking of high-risk patients, chronic disease patient registries, detailed Dashboard or Visit
Planner reports to doctors on individual patients, feedback reports on quality measures and
cost-related factors, and automated reminders to physicians or support staff on needed care.
Several sites are using information technology to facilitate their data collection and
reporting efforts. Some groups have made enhancements to their existing EMRs, while

32
others have focused on more limited and less expensive patient registries. Patient registries
and EMRs assist in the standardization and automation of care processes, give providers
prompts and reminders for evidence-based care at the point of care, and allow groups to
collect data elements needed for calculating quality measures.
In addition, IT improves information flow throughout the system and limits the
possibility of human error, particularly in the case of medication prescriptions. IT
intervention for medication reconciliation can potentially contribute directly to reduction
of hospital admissions or readmissions.
IMPLICATIONS FOR MEDICARE AND THE U.S. HEALTH CARE SYSTEM
The PGP demonstration experience to date has shown that it is possible for large multi-
specialty group practices to respond to a hybrid set of quality improvement and cost-
containment incentives layered on top of an FFS payment system. PGPs have used the
demonstration as a vehicle for expanding data systems, care management programs,
coordination-of-care efforts, and other interventions that are not directly reimbursed in
FFS payments. At the same time, the PGP demonstration system retains many of the
positive features of FFS reimbursement, such as the patient’s free choice of provider and
reduced incentives for undertreatment.
As Medicare’s first pay-for-performance initiative for physicians, the PGP
demonstration enables doctors to provide the high-quality and appropriate services they
would like to give their patients but frequently feel they are penalized for under the
current health care financing system. The focus among participating PGPs is less on direct
financial rewards for individual providers and more on “getting the reimbursement system
out of the way” so that doctors can provide services they know that patients need. For
example, the demonstration provides opportunities for sharing in savings derived from
care management programs—activities that are not reimbursed under FFS. This may be
one of the long-term benefits of the PGP demonstration model and other pay-for-
performance programs.
Participating PGPs have also emphasized that quality and efficiency are
characteristics of care systems involving many actors and processes. The PGPs largely
intend to reinvest performance payments they may earn into system-level improvements.
For example, an increased emphasis on systems, under this new reimbursement model,
may generate a variety of higher-quality and lower-cost interventions.
33
The combination of Medicare’s role as the largest single payer in the U.S. health
care system and its interaction with these large, multi-specialty group practices can also
serve as a catalyst to increase standardization of quality measures and incentive programs
across payers. Some individual commercial payers may develop similar programs, but none
on their own are as large or influential as Medicare. Several PGPs indicated that one effect
of the demonstration has been to work with commercial health plans in their geographic
area to develop uniform quality measures and performance payments.
A goal for the future is to develop ways to expand the PGP demonstration
approach to other practice formats. MHS’s experience as a “network” of small group
practices was cited as one possible model for applying PGP demonstration incentives.
Smaller groups generally have few incentives for care coordination, as they usually do not
receive payment beyond the evaluation and management fees they are able to bill for
acute visits. However, by banding together under the umbrella of organizations, and
becoming eligible for performance payments through the PGP demonstration or similar
incentive programs, they have more motivation and support for care coordination.
Moreover, physician networks or virtual physician groups can provide staff support for
data analysis, disease management, and coordination of care that cannot be supported by
smaller groups individually but are nonetheless important for responding to incentives for
quality improvement and cost containment.
The PGP demonstration model represents a provider-based approach to Medicare
reform. Incentives are given directly to providers, they are put in charge of managing
patient care, and they share the rewards of improving quality and efficiency. Participating
provider groups may contract with external organizations, such as care management,
disease management, and patient-monitoring companies to assist in patient care
management activities, but this is at the discretion of the providers. No private insurance
companies are involved to act as intermediaries between the Medicare program and the
provider groups. Moreover, the insurance arrangements of Medicare beneficiaries are not
affected in any way.
A barrier to previous private sector attempts to establish direct financial incentives
for quality and efficiency for providers has been the inability of many provider
organizations to accept financial risk for patient care. The PGP demonstration model
addresses this concern by eschewing a downside penalty for underperformance; it focuses
instead on the gains from better than expected performance. It tests whether a provider-
based approach emphasizing “the carrot” rather than “the stick” will prove effective in
enhancing the quality and efficiency of care received by Medicare beneficiaries.
34
APPENDIX A. CONTACT INFORMATION FOR
PGP DEMONSTRATION PARTICIPANTS
Billings Clinic
Jennifer Carmody, CPA 406-657-4844 [email protected]
Patricia Coon, MD 406-235-5451 [email protected]
Dianne Elliott, RN 406-657-8412 [email protected]
Elaine Watkins, RN 406-657-4146 [email protected]
Dartmouth-Hitchcock Clinic
John Robert Butterly, MD 603-650-5606 [email protected]
Sheila Johnson, RN 603-229-5200 [email protected]
Darlene Saler, BSN, RN, BMA 603-650-8320 [email protected]
Barbara Walters, DO, MBA 603-629-1101 [email protected]
Everett Clinic
Aiwei Fung, RN 425-317-3938 [email protected]
Shashank Kalokhe, PhD 425-339-5468 [email protected]
James Lee, MD 425-317-3649 [email protected]
Forsyth Medical Group
Nan Holland, RN, BSN, MPH, CPHRM 336-277-1403 [email protected]
Denise Segraves, RN, BSN 336-277-1190 [email protected]
Geisinger Health System
Frederick Bloom, MD 570-639-3600 [email protected]
Albert Bothe, Jr., MD 570-271-5048 [email protected]
Sabrina Girolami, RN, BSN 570-271-6776 [email protected]
Mark Selna, MD 570-271-7060 [email protected]
35
Marshfield Clinic
Marilyn Follen, RN, MSN 715-389-3020 [email protected]
Brent Miller 202-872-1469 [email protected]
Theodore Praxel, MD, FACP, MMM 715-389-3188 [email protected]
Catherine Truchinski 715-221-9860 [email protected]
Middlesex Health
Susan Menichetti, MPA 860-704-3000 [email protected]
Katherine Schneider, MD, MPhil 860-704-3000 [email protected]
Park Nicollet Health Services
David Knutson 952-993-3287 [email protected]
Mark Skubic 952-993-6139 [email protected]
Catherine Spurr, RN 952-993-3321 [email protected]
St. John’s Health System
Alice Lord, CMPE, CHE, MBA 417-820-3916 [email protected]
Janet Pursley, RN, BSN, MBA 417-820-3134 [email protected]
James Rogers, MD, FACP 417-820-3916 [email protected]
Mary Wehlacz 417-820-3405 [email protected]
University of Michigan
Vinita Bahl, DMD, MPP 734-615-0294 [email protected]
Steven Bernstein, MD, MPH 734-647-9688 [email protected]
Caroline Blaum, MD 734-764 2280 [email protected]
Kathleen Ward, MPA 734-936-6156 [email protected]
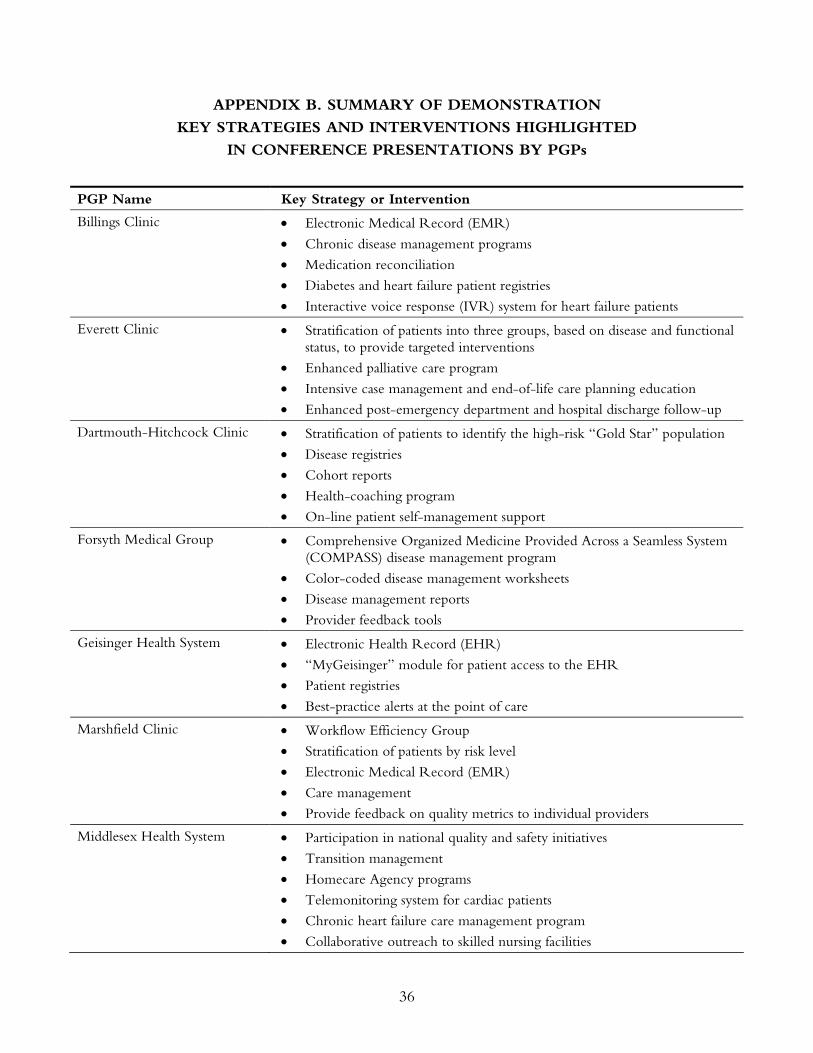
36
APPENDIX B. SUMMARY OF DEMONSTRATION
KEY STRATEGIES AND INTERVENTIONS HIGHLIGHTED
IN CONFERENCE PRESENTATIONS BY PGPs
PGP Name Key Strategy or Intervention
Billings Clinic • Electronic Medical Record (EMR)
• Chronic disease management programs
• Medication reconciliation
• Diabetes and heart failure patient registries
• Interactive voice response (IVR) system for heart failure patients
Everett Clinic • Stratification of patients into three groups, based on disease and functional status, to provide targeted interventions
• Enhanced palliative care program
• Intensive case management and end-of-life care planning education
• Enhanced post-emergency department and hospital discharge follow-up
Dartmouth-Hitchcock Clinic • Stratification of patients to identify the high-risk “Gold Star” population
• Disease registries
• Cohort reports
• Health-coaching program
• On-line patient self-management support
Forsyth Medical Group • Comprehensive Organized Medicine Provided Across a Seamless System (COMPASS) disease management program
• Color-coded disease management worksheets
• Disease management reports
• Provider feedback tools
Geisinger Health System • Electronic Health Record (EHR)
• “MyGeisinger” module for patient access to the EHR
• Patient registries
• Best-practice alerts at the point of care
Marshfield Clinic • Workflow Efficiency Group
• Stratification of patients by risk level
• Electronic Medical Record (EMR)
• Care management
• Provide feedback on quality metrics to individual providers
Middlesex Health System • Participation in national quality and safety initiatives
• Transition management
• Homecare Agency programs
• Telemonitoring system for cardiac patients
• Chronic heart failure care management program
• Collaborative outreach to skilled nursing facilities
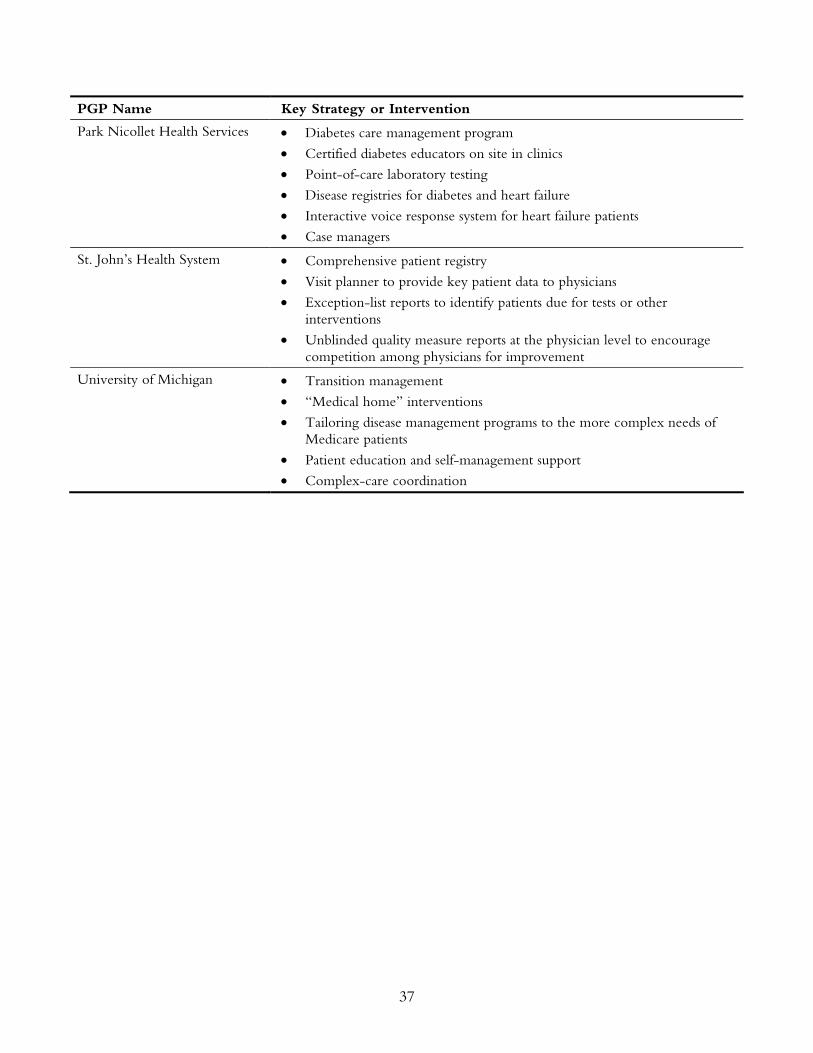
37
PGP Name Key Strategy or Intervention
Park Nicollet Health Services • Diabetes care management program
• Certified diabetes educators on site in clinics
• Point-of-care laboratory testing
• Disease registries for diabetes and heart failure
• Interactive voice response system for heart failure patients
• Case managers
St. John’s Health System • Comprehensive patient registry
• Visit planner to provide key patient data to physicians
• Exception-list reports to identify patients due for tests or other interventions
• Unblinded quality measure reports at the physician level to encourage competition among physicians for improvement
University of Michigan • Transition management
• “Medical home” interventions
• Tailoring disease management programs to the more complex needs of Medicare patients
• Patient education and self-management support
• Complex-care coordination
38
RELATED PUBLICATIONS
Publications listed below can be found on The Commonwealth Fund’s Web site at www.cmwf.org.
The Cost of Privatization: Extra Payments to Medicare Advantage Plans—Updated and Revised (November 2006). Brian Biles, Lauren Hersch Nicholas, Barbara S. Cooper, Emily Adrion, and Stuart Guterman. On the Front Lines of Care: Primary Care Doctors’ Office Systems, Experiences, and Views in Seven Countries (November 2, 2006). Cathy Schoen, Robin Osborn, Phuong Trang Huynh, Michelle M. Doty, Jordon Peugh, and Kinga Zapert. Health Affairs Web Exclusive (In the Literature summary). Why Not the Best? Results from a National Scorecard on U.S. Health System Performance (September 2006). The Commonwealth Fund Commission on a High Performance Health System. Assessing Medicare Prescription Drug Plans in Four States: Balancing Cost and Access (August 2006). Erika Heaton, Tanisha Carino, and Heidi Dix. Medicare Physician Payment: Are We Getting What We Pay For? Are We Paying for What We Want? (July 25, 2006). Stuart Guterman. Medicare Beneficiary Out-of-Pocket Costs: Are Medicare Advantage Plans a Better Deal? (May 2006). Brian Biles, Lauren Hersch Nicholas, and Stuart Guterman. Medicare: Making It a Force for Innovation and Efficiency (July 2005). Jessica Mittler.