medicare payment system design: an overvie payment system design: an overview a. bruce steinwald...
TRANSCRIPT
Medicare Payment System Design: An Overview
A. Bruce Steinwald Director, Health CareU.S. Government Accountability Office
January 15, 2009
Mark E. Miller, Ph.D.Executive DirectorMedicare PaymentAdvisory Commission

2
Roadmap
• Introduction to Medicare Payment Systems
• Inpatient Prospective Payment System
• Physician Fee Schedule
• Post-Acute Care Services
• Q & A

3
Total benefit spending for CY2007=$428 billion
Source: CMS Office of the Actuary, 2008
Hospital outpatient
6%
Physician14%
Managed care18%
Outpatient prescription
drugs12%
Home health4%
Skilled nursing facility
5%
Hospital inpatient
29%
Other fee-for-service
settings 12%
4
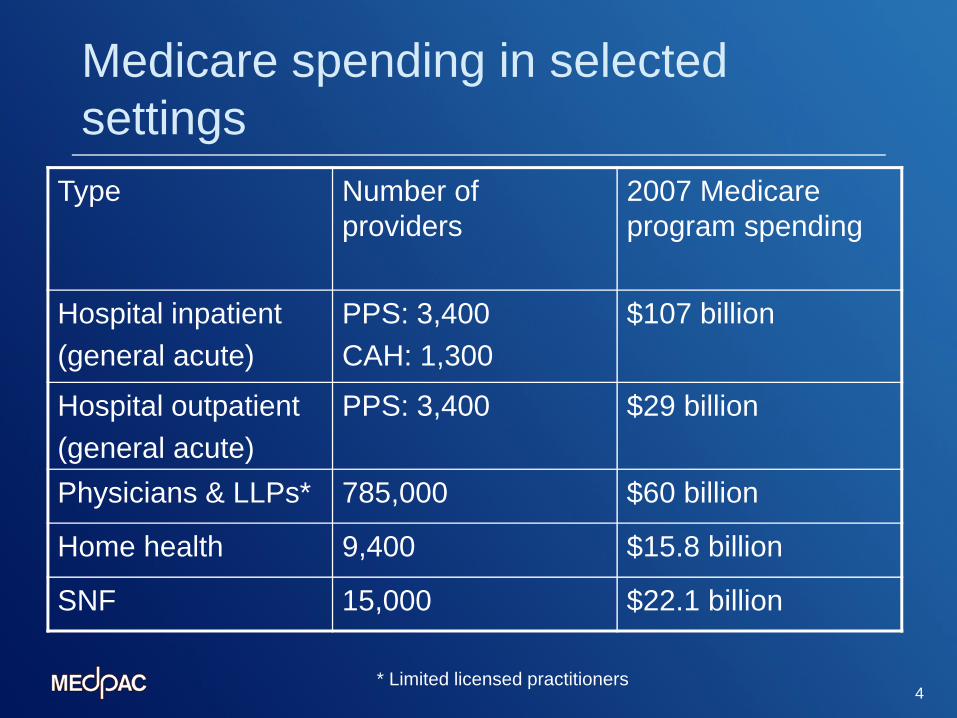
Medicare spending in selected settings
* Limited licensed practitioners
Type Number of providers
2007 Medicare program spending
Hospital inpatient(general acute)
PPS: 3,400CAH: 1,300
$107 billion
Hospital outpatient(general acute)
PPS: 3,400 $29 billion
Physicians & LLPs* 785,000 $60 billion
Home health 9,400 $15.8 billion
SNF 15,000 $22.1 billion

5
Components of Medicare spending
Number of beneficiaries
(population)
Number of Services
(utilization)
Paymentsper service
(payment rates)
Total programexpenditures
XX =

6
Principles of Medicare Payment
Ensure beneficiary access to high quality care in an appropriate settingGive providers an incentive to supply care efficientlyPay similarly for services, irrespective of settingControl program spending
7
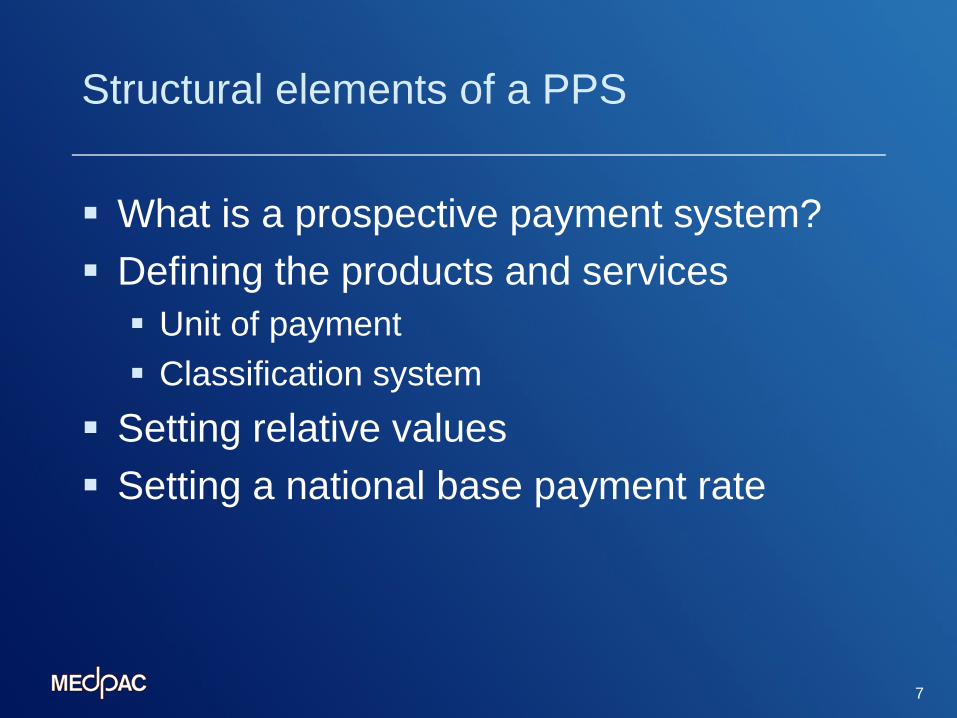
Structural elements of a PPS
What is a prospective payment system?Defining the products and services
Unit of paymentClassification system
Setting relative valuesSetting a national base payment rate

8
Structural elements of a PPS, continued
Adjusting for local market conditionsVariation in the cost of providing care (input prices)
Other adjustments (teaching; nonphysicians)Updating payment rates

9
Key elements of selected payment systems
Payment system description
Inpatient acute care hospitals
Home health agencies
Physicians
Product definitionUnit of payment
Classification system
Hospital stay
745 MS-DRGs
60-day episode
153 HHRGs
Service
6,700+ HCPCS codes
Relative valuesComponents
of relativevalues
Sources ofrelative values
Single value for each DRG
Hospitals’ billed costs
Single value for each HHRG
Estimated mean cost per HHRG
Physician work; practice expense; liability insurance
Expert judgment; practice expense data; premium survey

10
Key elements of selected payment systems, continued
Payment system description
Inpatient acute care hospitals
Home health agencies
Physicians
Base rateSource of
baseamount
Updated providers’ 1982 costs
Spending in preceding system
Projected spending under preceding payment method
Local market adjustmentsLabor inputprices
Hospital wage index (HWIr)
Hospital wage index (HWIu)
Separate GPCIs: work, practice expenses, PLI

11
Key elements of selected payment systems, continued
Payment system description
Inpatient acute care hospitals
Home health agencies
Physicians
Other payment adjustments
Low-income patients (DSH); IME programs; rural payments
Shortage areas; Nonphysician practitioners (reduced rate)
Payments for capital costs
Separate prospective rates
Included in payment rate
Included in payment for practice expense

12
Total spending for 2007=$428 billion
Source: CMS Office of the Actuary, 2008, as reported by MedPAC
Hospital outpatient
6%
Physician14%
Managed care18%
Outpatient prescription
drugs12%
Home health4%
Skilled nursing facility
5%
Hospital inpatient
29%
Other fee-for-service
settings 12%

13
Other Part A & B Payment Systems
• Hospital Outpatient Prospective Payment System (OPPS)• Post-Acute Care (PAC)• Ambulatory surgical centers (ASCs)• End-Stage Renal Disease (ESRD)• Clinical laboratory services• Ambulance services• Durable medical equipment (DME)• Part B drugs
• Not included in a prospective payment system or fee schedule• Cancer hospitals, children’s hospitals, critical access
hospitals
14
Other Medicare Payment Systems
• Medicare Advantage plans (Part C)
• Prescription drug plans (Part D)
15
Inpatient Prospective Payment System (IPPS)
• IPPS replaced the previous cost-based reimbursement system in FY 1984
• Under IPPS, hospitals generally receive a fixed predetermined amount for each inpatient hospital stay, regardless of their actual costs
• The payment amount is based largely on the patient’s principal diagnosis
• First prospective payment system used in Medicare
16
Two Major Changes in IPPS Will Be Completed in 2009
• Charge-based Cost-based Diagnosis-Related Groups (DRG) weights
• DRGs Medicare Severity Diagnosis-Related Groups (MS-DRGS)
17
What are MS-DRGs?
• MS-DRGs identify patients with similar clinical problems who are expected to consume similar amounts of hospital resources
• Groupings are based on factors such as patient diagnoses and whether the patient had surgery
• There are about 300 base DRGs that are split into more than 700 MS-DRGs depending on the presence of a (major) comorbidity or complication
• Each MS-DRG is assigned a relative weight, which compares its costliness to the average Medicare case

18
IPPS Payment: Two Payment Components
Operating Payment + Capital Payment
• Payment per discharge
• Hospital-specific formula
19
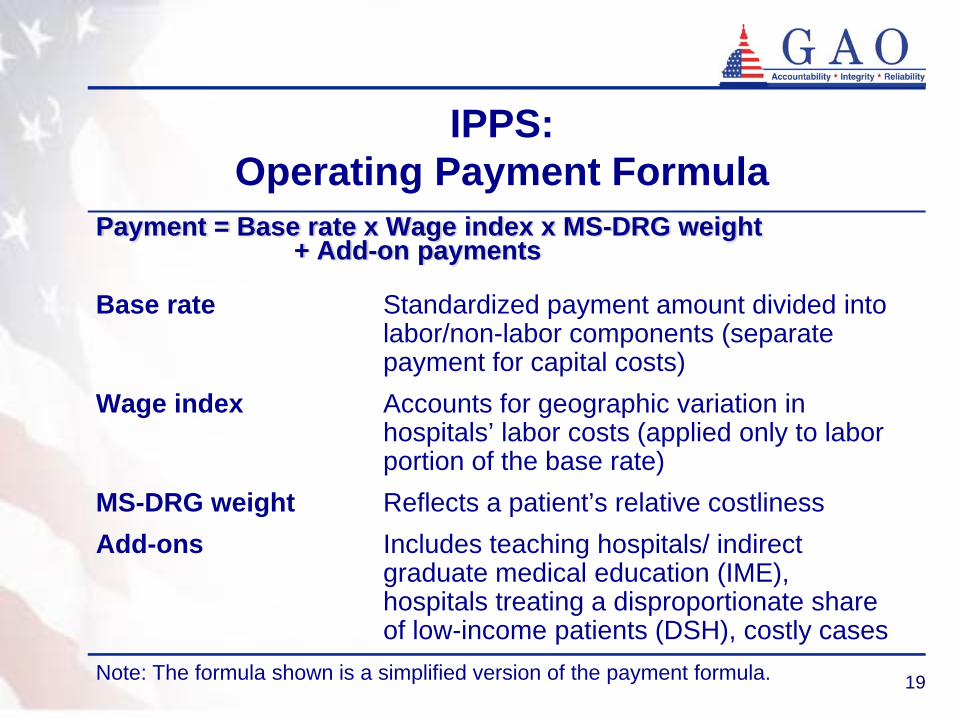
IPPS: Operating Payment Formula
Payment = Base rate x Wage index x MS-DRG weight+ Add-on payments
Base rate Standardized payment amount divided into labor/non-labor components (separate payment for capital costs)
Wage index Accounts for geographic variation in hospitals’ labor costs (applied only to labor portion of the base rate)
MS-DRG weight Reflects a patient’s relative costlinessAdd-ons Includes teaching hospitals/ indirect
graduate medical education (IME), hospitals treating a disproportionate share of low-income patients (DSH), costly cases
Note: The formula shown is a simplified version of the payment formula.

20
Inpatient PPS: Payment Example
MS-DRG 231- Coronary bypass w/ percutaneous transluminal coronary angioplasty (PTCA) and major complication or comorbidity•Major diagnostic category 5: Circulatory diseases•Surgical MS-DRG•Performed at a local Washington DC hospital that has a teaching program
and treats a large share of low-income patients
[ (Base rate labor x Wage index) + (Base rate non-labor) ] x MS-DRG weight
[($3,574.50 x 1.0974) + $1,553.91] x 7.6438 = $41,861.78Add-onsIME = $ 13,917.79DSH = $ 6,532.53
$ 62,312.10
Note: This payment is for operating costs only, based on rates for FY2009.

IPPS Issues

22
Payments for Physician Services
• The physician fee schedule (PFS) replaced the previous reasonable charge method in 1992
• Services include office visits, surgical procedures and diagnostic tests, and are identified by over 7,000 procedure codes
• The fee schedule is based on resource-based relative value scale (RBRVS)
• Spending targets are set by the Sustainable Growth Rate (SGR) system to update physician fees annually

23
Nationally Uniform Relative Value Units
• Under the RBRVS, each physician service is given a weight that measures its relative costliness
• The weights, known as relative value units (RVUs), have 3 components:
Physician workTime, skill, & training Practice expense
Rent, utilities, equipment, supplies, staff Malpractice expense
Liability coverage
RVU

24
Physician Payment Formula
Payment= RVU x Geographic adjustment x Conversion factor *
RVU Reflects relative cost of physician service
Geographic adjustment
Accounts for geographic variation in the cost of providing physician services
Conversion factor
Converts adjusted RVU into dollar amounts
*Other adjustments
e.g., Non-physician providers, Health Professional Shortage Areas
Note: The formula shown is a simplified version of the payment formula.

25
Physician Payment: Example 1
Office visit, detailed (established patient)• Procedure code 99213• Performed by Washington DC physician in a non-facility setting
RVU x Geographic adjustment x Conversion factor1.70 x 1.121 x $36.0666
= $68.73
Note: This example is based on current rates effective January 1, 2009.

26
Physician Payment: Example 2
Knee arthroscopy/surgery• Procedure code 29850• Performed by Washington DC physician in a facility setting
RVU x Geographic adjustment x Conversion factor14.67 x 1.121 x $36.0666
= $593.12
Note: This example is based on current rates effective January 1, 2009.

27
Sustainable Growth Rate (SGR) is the system used by Medicare to annually update physician fees
• The SGR system sets spending targets and adjusts physician fees based on the extent to which actual spending aligns with specified targets.
• The SGR system has called for fee reductions largely in response to increased spending caused by Medicare beneficiaries receiving an increasing volume and intensity of services.
• Under current law, the fees that Medicare pays to physicians will be reduced by 21 percent in 2010. Past fee reductions have been averted by administrative and legislative actions since 2002.

28
Growth in Volume and Intensity of Medicare Physician Services per FFS Beneficiary,1980-2007
Percentage
aMedicare Volume Performance Standard
Source: GAO analysis of data from CMS and the Boards of Trustees of the Federal Hospital Insurance (HI) and Federal Supplementary Medical Insurance (SMI) Trust Funds.
8.3
3.7
7.6
9.7
3.9
6.5
9.09.4
0.2
1.52.0
1.2
3.9 4.1
6.3
4.5
5.9
3.2
4.0 3.7
-0.2-0.7
1.7
2.9
-1
0
1
2
3
4
5
6
7
8
9
10
1980 1985 1986 1987 1988 1989 1990 1991 1992 1993 1994 1995 1996 1997 1998 1999 2000 2001 2002 2003 2004 2005 2006 2007
Fee schedule and spending targets first
affected updates
Charge-based system Fee schedule and MVPSa Fee schedule and SGR

PFS Issues
30
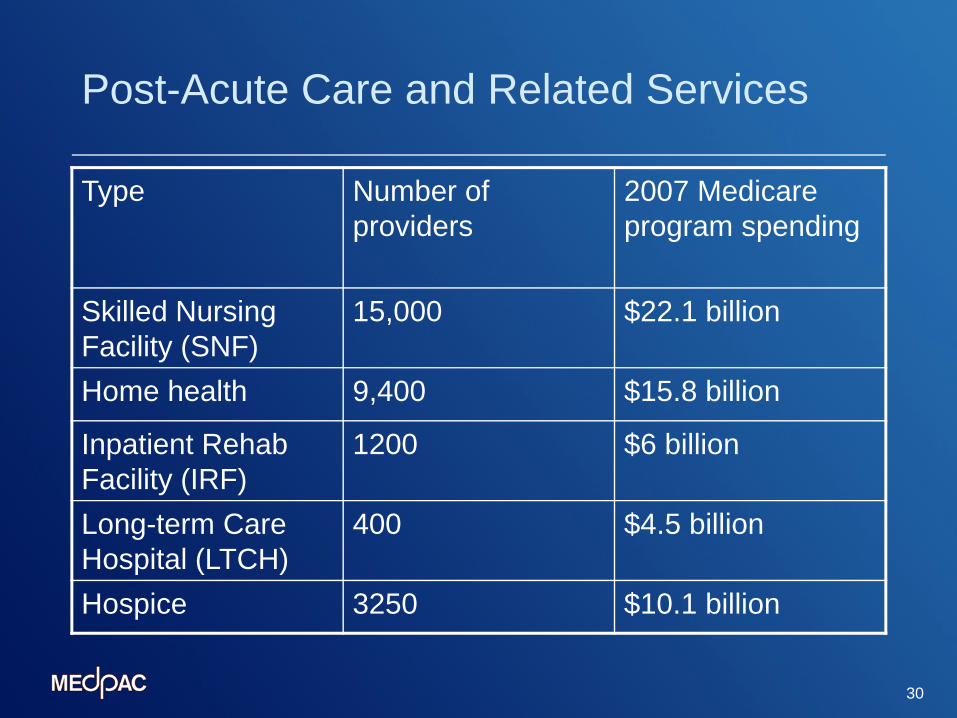
Post-Acute Care and Related Services
Type Number of providers
2007 Medicare program spending
Skilled Nursing Facility (SNF)
15,000 $22.1 billion
Home health 9,400 $15.8 billion
Inpatient Rehab Facility (IRF)
1200 $6 billion
Long-term Care Hospital (LTCH)
400 $4.5 billion
Hospice 3250 $10.1 billion
31
Issues in Post-Acute Care
PPS’ vary (daily/discharge/episode)Patient selectionNo common patient assessment toolsMore difficult to define services and episode (e.g. home health)Medicare pays differently across settings for the “same” patient