medical liability, malpractice insurance and healthcare
DESCRIPTION
Discussions about how to solve our vast national health care crisis, questions are often raised about why the system is so expensive and how costs can be reduced to make health care affordable for everyone.TRANSCRIPT

90 Broad Street Suite 401 New York, NY 10004-3307 (212) 267-2801 Fax (212) 459-0910 [email protected] www.insurance-reform.org (A project of the Center for Justice & Democracy)
TRUE RISK:
MEDICAL LIABILITY, MALPRACTICE INSURANCE AND HEALTH CARE
Principal Contributors:
J. Robert Hunter Gillian Cassell-Stiga
Joanne Doroshow
July 22, 2009
© Copyright 2009, Americans for Insurance Reform. All rights reserved.

2
TRUE RISK: MEDICAL LIABILITY, MALPRACTICE INSURANCE
AND HEALTH CARE
Americans for Insurance Reform SUMMARY/KEY FINDINGS In discussions about how to solve our vast national health care crisis, questions are often raised about why the system is so expensive and how costs can be reduced to make health care affordable for everyone. Some of the discussions have focused on medical malpractice insurance and liability issues, raising questions about the cost of insurance for doctors and whether there is a need to further limit patients’ ability to bring claims against incompetent doctors or unsafe hospitals. To answer these questions, Americans for Insurance Reform, (AIR), a coalition of nearly 100 consumer and public interest groups around the country, has produced the most comprehensive review of medical malpractice premiums, claims, profits and the impact of medical malpractice tort law limits to date. Based on its analysis, AIR finds:
• Medical malpractice premiums, inflation-adjusted, are nearly the lowest they have been in over 30 years.
• Medical malpractice claims, inflation-adjusted, are dropping significantly, down 45
percent since 2000.
• Medical malpractice premiums are less than one-half of one percent of the country’s overall health care costs; medical malpractice claims are a mere one-fifth of one percent of health care costs. In over 30 years, premiums and claims have never been greater than 1% of our nation’s health care costs.
• Medical malpractice insurer profits are higher than the rest of the property casualty
industry, which has been remarkably profitable over the last five years.
• The periodic premium spikes that doctors experience, as they did from 2002 until 2005, are not related to claims but to the economic cycle of insurers and to drops in investment income.
• Many states that have resisted enacting severe restrictions on injured patients’ legal rights
experienced rate changes (i.e., premium increases or decreases for doctors) similar to those states that enacted severe restrictions on patients’ rights, i.e., there is no correlation between “tort reform” and insurance rates for doctors.

3
AIR concludes that there absolutely no reason to further limit the liability of doctors and hospitals, who already benefit from more liability protection for their negligence than any profession in the country. Further, doing so would have almost no impact on overall health care expenditures – except that the costs of medical error and hospital-induced injury would remain. BACKGROUND Health care reform is now at the top of Washington’s agenda, but medical malpractice issues have been at the top of legislative agendas at the state level for years. Over the last decade, many states have been engaged in fierce battles about the cause of a several-year spike in medical malpractice rates for doctors, which took place from 2002 until 2005. Those rates have now stabilized, but the rhetoric about medical malpractice lawsuits and insurance rates has not ceased. At the national level, the American Medical Association largely failed in its recent national multi-million dollar public relations and lobbying campaign to push for so-called “tort reform, which was aimed at taking advantage of the rise in insurance rates for doctors.1 Congress rejected the push to “cap” damages. However, state activity is another thing. For more than 30 years, the state medical and insurance lobbies have argued that establishing legal roadblocks in the way of injured patients was the only way to reduce periodically high malpractice insurance rates and keep doctors practicing. As a result of this lobbying, many state lawmakers succumbed to political pressure and enacted hundreds of state laws that weaken the rights of patients injured by medical negligence, make it more difficult for them to obtain fair compensation, or make it harder to hold accountable those responsible – so-called “tort reform.” The medical profession now has more legal protection for their negligence than any other profession in the country. (See Exhibit C). As a result, according to insurance industry analysts at A.M. Best, the number of injured patients bringing medical malpractice claims (i.e., claims frequency) has reached “historic lows.”2 Texas is good example. After a hard fought legislative and initiative battle requiring an amendment to the state constitution, Texas enacted severe “tort reform” in 2003. The impact was made clear in a June 1, 2009, New Yorker magazine article about why the town of McAllen, Texas, “was the country’s most expensive place for health care.”3 The following exchange took place with a group of doctors and the article’s author:
“It’s malpractice,” a family physician who had practiced here for thirty-three years said. “McAllen is legal hell,” the cardiologist agreed. Doctors order unnecessary tests just to protect themselves, he said. Everyone thought the lawyers here were worse than
1 Simon Avery, “Doctors vow tort reform to reduce insurance costs,” Associated Press, March 11, 2002. See also, “AMA: To Campaign For Malpractice Tort Reform,” American Health Line, March 13, 2002. 2 “Solid Underwriting Undercut by MPLI’s Investment Losses,” Best’s Special Report, A.M. Best, April 27, 2009. 3 Atul Gawande, “The Cost Conundrum; What a Texas town can teach us about health care,” New Yorker, June 1, 2009 (emphasis added). http://www.newyorker.com/reporting/2009/06/01/090601fa_fact_gawande

4
elsewhere. That explanation puzzled me. Several years ago, Texas passed a tough malpractice law that capped pain-and-suffering awards at two hundred and fifty thousand dollars. Didn’t lawsuits go down? “Practically to zero,” the cardiologist admitted. “Come on,” the general surgeon finally said. “We all know these arguments are bullshit. There is overutilization here, pure and simple.” Doctors, he said, were racking up charges with extra tests, services, and procedures.
What’s more, despite getting about everything they wanted legislatively, Texas insurers initially requested rate hikes. They lowered rates only after being forced to do so.4 Moreover, doctors never returned to rural areas they had abandoned supposedly due to the cost of insurance, an issue that “tort reform” campaigners exploited and blamed on lawsuits. In 2007, the Texas Observer found:
“The campaign’s promise, that tort reform would cause doctors to begin returning to the state’s sparsely populated regions, has now been tested for four years. It has not proven to be true. … Those doctors are following the Willie Sutton model: They’re going, understandably, where the better-paying jobs and career opportunities are, to the wealthy suburbs of Dallas and Houston, to growing places with larger, better-equipped hospitals and burgeoning medical communities.5
So while Texas patients lost significant legal rights and many unsafe health care providers are now unaccountable, rural communities that were exploited during the “tort reform” campaign have seen no improvement in access to physicians. And as this report shows, medical malpractice insurers are charging doctors at rates that are not much different than any other state in the country, irrespective of their “tort” laws. Rates would have eventually dropped in Texas no matter what the legislature did. Americans for Insurance Reform, (AIR), a coalition of nearly 100 consumer and public interest groups around the country, has produced an extensive review of the medical malpractice insurance industry in the country going back to years before the most recent medical malpractice insurance crisis, showing, indeed, that the Texas experience is typical. Under the direction of actuary J. Robert Hunter, Director of Insurance for the Consumer Federation of America, and former Federal Insurance Administrator and Texas Insurance Commissioner, AIR has analyzed national and state premium, claims and profit figures for the medical malpractice industry. Based on its analysis, AIR finds the following:
4 Center for Justice & Democracy Fact Sheet, “The Real Story of Texas Insurance Rates,” http://centerjd.org/archives/issues-facts/MB_TexasRates.pdf 5 Suzanne Batchelor, “Baby, I Lied; Rural Texas is still waiting for the doctors tort reform was supposed to deliver,” Texas Observer, October 19, 2007. http://www.texasobserver.org/article.php?aid=2607

5
• Medical malpractice premiums, inflation-adjusted, are nearly the lowest they have been in 30 years.
• Medical malpractice claims, inflation-adjusted, are dropping significantly, down 45
percent since 2000.
• Medical malpractice premiums are less than one-half of one percent of the country’s overall health care costs; medical malpractice claims are a mere one-fifth of one percent of health care costs. In over 30 years, premiums and claims have never been greater than 1% of our nation’s health care costs.
• Medical malpractice insurer profits are higher than the rest of the property casualty
industry, which has been remarkably profitable over the last five years.
• The periodic premium spikes that doctors experience, as they did from 2002 until 2005, are not related to claims but to the economic cycle of insurers and to drops in investment income.
• Many states that have resisted enacting severe restrictions on injured patients’ legal rights
experienced rate changes (i.e., premium increases or decreases for doctors) similar to those in states that enacted severe restrictions on patients’ rights, i.e., there is no correlation between “tort reform” and insurance rates for doctors.
THE CONTEXT: HISTORIC CYCLES Medical liability insurance is part of the property/casualty sector of the insurance industry. This industry’s profit levels are cyclical, with insurance premium growth fluctuating during hard and soft market conditions. This is because insurance companies make most of their profits, or return on net worth, from investment income. During years of high interest rates and/or excellent insurer profits, insurance companies engage in fierce competition for premium dollars to invest for maximum return, particularly in “long-tail” lines – where the insurers hold premiums for years before paying claims – like medical malpractice. Due to this intense competition, insurers may actually underprice their policies (with premiums growing below inflation) in order to get premium dollars to invest. This period of intense competition and stable or dropping insurance rates is known as the “soft” insurance market. When interest rates drop or the economy turns causing investment decreases, or the cumulative price cuts during the soft market years make profits unbearably low, the industry responds by sharply increasing premiums and reducing coverage, creating a “hard” insurance market. This usually degenerates into a “liability insurance crisis” often with sudden high rate hikes that may last for a few years. Hard markets are followed by soft markets, when rates stabilize once again. The country experienced a hard insurance market in the mid-1970s, particularly in the medical malpractice and product liability lines of insurance. A more severe crisis took place in the mid-1980s, when most liability insurance was impacted. Again, from 2001 through 2004, a “hard

6
market” took hold again. Each of these periods was followed by a soft market, and in fact, we have been in such a period since 2005, as will be explained more fully below. Another economic pattern related to the hard and soft markets is the manipulation of money insurers set aside as “reserves” for payment of future claims. Reserves include estimates of some claims they have received but also insurers’ “estimates” of claims that they do not even know about yet (called “Incurred but Not Reported” or “IBNR”). During hard markets, insurers may vastly (and unnecessarily) increase reserves despite no increase in payouts or any trend suggesting large future payouts. This phenomenon seems often to be politically-inspired, used by insurers as a way to justify imposition of large premiums increases for doctors. During subsequent soft markets, these reserves often are released through income statements as profits, as they are actually not needed to pay future claims. Also, during the soft phase of the cycle, insurers are trying to gain market share, and insurers must show profits to keep rates down. The practice of over-reserving in hard markets by medical malpractice insurers was confirmed by a June 24, 2002, Wall Street Journal front page investigative article, finding that insurance company St. Paul, which until 2001 had 20% of the national med mal market, pulled out of the business after mismanaging its reserves. The company set aside too much money in reserves to cover malpractice claims in the 1980s, so it released $1.1 billion in reserves, which flowed through its income statements and appeared as profits. Seeing these profits, many new, smaller carriers came into the market. Companies started slashing prices to attract customers. From 1995 to 2000, rates fell so low that they became inadequate to cover malpractice claims. Many companies collapsed as a result. St. Paul eventually pulled out, creating huge supply and demand problems for doctors in many states.6 In 2002, at the start of the last hard market, AIR began a series of studies examining the effect of this cycle on doctors’ insurance rates. One study, Measured Costs, was an extensive review of medical malpractice insurance rate activity in states from 1995 through 2004.7 This study, which correlated state-by-state rate activity with tort restrictions, found that the sudden increases in insurance rates for doctors had nothing at all to do with the legal system, jury verdicts, payouts, or tort costs in general. In a series of related studies, Stable Losses/Unstable Rates, AIR examined three decades of data prepared by A.M. Best that included all that medical malpractice insurers paid in jury awards, settlements and other costs, and compared these actual costs with the premiums that insurers charged doctors, as well as with the economic cycle of the insurance industry. The last of these studies, released in 2007,8 found as follows:
6 Christopher Oster and Rachel Zimmerman, “Insurers’ Missteps Helped Provoke Malpractice ‘Crisis,’” Wall Street Journal, June 24, 2002. 7 Americans for Insurance Reform, Measured Costs, 2005; http://www.insurance-reform.org/issues/measured_costs.pdf 8 Americans for Insurance Reform, Stable Losses, Unstable Rates, 2007; http://www.insurance-reform.org/StableLosses2007.pdf.

7
• Inflation-adjusted payouts per doctor not only failed to increase between 2001 and 2004, a time when doctors’ premiums skyrocketed, but they have been stable or falling throughout this entire decade.
• Medical malpractice insurance premiums rose much faster in the early years of this decade than was justified by insurance payouts.
• At no time were recent increases in premiums connected to actual payouts. Rather, they reflected the well-known cyclical phenomenon called a “hard” market. Property/casualty insurance industry “hard” markets have occurred three times in the past 30 years.
• During this same period, medical malpractice insurers vastly (and unnecessarily) increased reserves (used for future claims) despite no increase in payouts or any trend suggesting large future payouts. The reserve increases in the years 2001 to 2004 could have accounted for 60 percent of the price increases witnessed by doctors during the period.
True Risk represents a continuation and update of these earlier studies, and examines new data, as well. HIGH PROFITS WHILE EVERYONE ELSE STRUGGLES Before examining premium and cost data in detail, it is worth analyzing medical malpractice insurers’ current bottom line, and determine how well they did in recent years as they raised rates on doctors and pushed states and Congress to enact laws to limit the liability of their clients - health care providers. To say medical malpractice insurers did well during this period would be an understatement. Despite their lobbying position that medical malpractice claims and lawsuits were making it difficult for them to survive, these companies thrived. In fact, they did so well last year that while every other sector in the economy began suffering through a global economic crisis, medical malpractice insurers had “a very good” 2008.9 This came “after posting record profits in 2007.” 10 And the good news for the medical malpractice insurance industry is not over yet. A.M. Best predicts that their “operating profits will continue through 2009.”11 There are several ways to examine how well these companies have been doing, and they all indicate the same thing. Profit/Return on net worth
• According to the National Association of Insurance Commissioners (NAIC), in 2007 the medical malpractice insurance industry had an overall return on net worth of 15.6%, well over the 12.5% overall profit for the entire property/casualty industry.12
• Over the last five years, the return on net worth for medical malpractice insurers was 11.1%, again outpacing the entire property/casualty insurance industry at 10.3%.13
9 “Solid Underwriting Undercut by MPLI’s Investment Losses,” Best’s Special Report, A.M. Best, April 27, 2009. 10 Ibid. 11 Ibid. 12 Report on Profitability by Line by State in 2007, National Association of Insurance Commissioners, 2008, p. 38.

8
• In 2007, medical malpractice insurer profit based just on insurance transactions, that is, just on the premiums they took in, was 24.6%. This was more than double the amount on insurance transactions for the entire industry (11.0%).14
Loss Ratio Profitability can also be measured by the loss ratio, which compares the premiums that insurers take in and the money expected to be paid in claims. The lower the loss ratio, the less the insurer expects to pay for claims and the more profitable the insurer likely is (assuming all other things are equal.) A low loss ratio also indicates a very inefficient delivery system for benefits. According to A.M. Best, the loss ratio for medical malpractice insurers has been declining for at least five years.15 In 2008, it was 61.1%. Put another way, medical malpractice insurers believe they will pay out in claims only 61.1 cents for each premium dollar they take in. The rest goes towards overhead and profit. This profit is in addition to the profit the insurer also makes by investing premiums during the “float” period. (The “float” occurs between the time when premiums are taken in by the insurer and losses paid out—e.g., while there is about a 15 month lag for auto insurance, there is a much longer 5 to 10 year lag for medical malpractice, allowing for more investment income.) Given all these factors, a 61.1 percent loss ratio is remarkably low and is another key to demonstrating how well medical malpractice insurers have been performing while other industries struggle. Reserves Another way to illustrate how well insurers have been actually doing in recent years is by examining “reserves” – the money set aside for future claims that, as explained above, are often manipulated by insurers for reasons having little to do with actual claims. Indeed, according to A.M. Best, reserves were “redundant” (i.e. excessive) during the last hard market - 2002 to 2004.16 In those years, insurers told lawmakers that they needed dramatically to raise rates for doctors in order to pay future claims. It wasn’t true. As reserves went up, so did rates. AIR and others predicted that the large increase in reserves from 2002-2004 was unjustified, not at all indicated by what insurers could reasonably be expected to pay in claims.17 Reserves are now dropping at a substantial rate, with a whopping 13.6% drop in the last two years, as the following chart shows:
13 Id., p. 142. 14 Id., p. 38. 15 “Solid Underwriting Undercut by MPLI’s Investment Losses,” Best’s Special Report, A.M. Best, April 27, 2009. 16 Ibid. 17 Americans for Insurance Reform, Stable Losses/Unstable Rates 2007, http://www.insurance-reform.org/StableLosses2007.pdf.

9
U.S. Medical Professional Liability
Reserve Development (2000-2008*)Change in
Composite
Reserves
% Change From
Prior-Year
Reserves2000 -44 -0.32001 -226 -1.62002 505 3.42003 469 2.82004 207 1.1
2005 -378 -1.92006 -759 -3.72007 -1030 -6.52008* -1482 -7.1
*The current and historical data shown are from
companies (87.5% of total composite) that filed 2008
results with A.M. Best by 4/9/09. For comparison
purposes, those companies not yet included in the 2008
data, were extracted from previous years' results.
Source: A.M. Best Co., Best's Quantitative Analysis
Report; A.M. Best Company – by permission.
Very simply, insurers increased the money they kept on hand to pay claims even though they did not need it, raising rates to do so. Now they have to do something with this money. Where is it now going? For the most part, it’s going into insurers’ income statements as profit. MEDICAL MALPRACTICE INSURANCE PREMIUMS – ASTONISHING DECREASES
From the late 1980s through about 2001, doctors and hospitals nationwide experienced a relatively stable medical malpractice insurance market. Insurance was available and affordable. Rate increases were modest, often far below medical inflation. Meanwhile, profits for medical malpractice insurers soared, generated by high investment income. As explained below, during this period, doctors benefited from an extended “soft market” period. That changed after 2001. After dropping interest rates and an economic downturn, compounded by years of cumulative price cuts during the prolonged soft market, insurers suddenly began raising premiums and canceling some coverage for doctors, or at least threatening to do so, in virtually every state in the country. This was an industry-wide insurance phenomenon, not just a medical malpractice phenomenon. It was not a state-specific phenomenon either. It was not even a country-specific phenomenon. It was even happening in countries like Australia and Canada that do not have jury trials in civil cases. This was a classic “hard market.”
However, like all hard markets, it did not last. Next we examine medical malpractice insurance premiums today, looking at three different sources of data. In each case, we arrive at the same conclusion, despite the same rhetoric to the contrary.

10
Council of Insurance Agents & Brokers
Data from the Council of Insurance Agents & Brokers shows a drop in premium growth during the last five years across all lines of insurance (not just medical malpractice). In other words, as this chart shows, this country has clearly been in a soft insurance market period since 2005, with rates dropping since then.
A.M. Best According to A.M. Best, after reaching a high of 14.2% in 2003 during the last hard market, medical malpractice premium growth has been dropping, decreasing by 6.6% nationally in 2007, and an additional 5.3% in 2008.18 This decrease is also evidenced in Exhibit A, a chart showing both premium and claims data per doctor since 1975, controlled for medical inflation. Inflation-adjusted per doctor premiums have been dropping since 2004 from an average $15,260.07 that year to $11,152.22 in 2008. This is nearly the lowest they have been in over 30 years. Insurance Services Office (ISO) The insurance pure premium19 or loss costs,20 is particularly important to examine. This is the one component of an insurance rate that should be affected by verdicts, settlements, payouts, or
18 “Solid Underwriting Undercut by MPLI’s Investment Losses,” Best’s Special Report, A.M. Best, April 27, 2009.

11
so-called “tort reform.” It is the largest part of the premium dollar for most lines of insurance. And it is compiled by a private company called the Insurance Services Office (ISO). The ISO has the largest database of audited, unit transaction insurance data of any entity in the United States. This is important data because ISO makes filings with state insurance departments on behalf of the insurance companies using their services. ISO develops the pure premium number by taking the historic loss and loss adjustment expense information, including both actual payments and estimates of future payouts, and trending that information into the future, reflecting anticipated inflation and other factors. The results are changes in the levels of pure premium charges approved by state insurance departments, which then are used by many insurance companies in their pricing models. We obtained data on medical malpractice insurance loss cost movement in states from 1995 through 2008.21 (See Exhibit B.) As this chart shows, ISO’s data is consistent with all the other premium data we have examined so far, showing the same cyclical pattern with the biggest increases during the hard market of 2002-2005, and dropping steadily since then with 2008 seeing an astonishing 11% decrease. This confirms that we are experiencing a very soft market.
19 “Pure premium” is a term used interchangeably with “loss costs.” It is the part of the premium used to pay claims and the cost of adjusting and settling claims, including adjuster and legal expenses. 20 “Loss cost” is the term for the portion of each premium dollar taken in, that insurance companies use to pay for claims and for the adjustment of claims. Insurers use other parts of the premium dollar to pay for: their profit, commissions, other acquisition expenses, general expenses and taxes. Loss costs include both paid and outstanding claims (reserves are included through an actuarial process known as “loss development”) but also include trends into the future since rates based on ISO loss costs are for a future period. Thus, loss costs include ISO’s adjustments to make sure that everything is included in the price, even such factors as future inflation. 21 Data not available for Hawaii, New York, or Texas, or for California until 2000. Data not available for physicians or surgeons for Massachusetts, or for Washington in 1998.

12
ISO Percent Change
1995 5%
1996 7%
1997 6%
1998 9%
1999 2%
2000 5%
2001 1%
2002 3%
2003 5%
2004 9%
2005 9%
2006 3%
2007 -3%
2008 -11% In fact, the 11% drop in 2008 was the biggest single year price movement since 1995. Moreover, this decrease might have been even greater had 17 states not limited the decrease to 20%, likely because ISO wanted to control this drop. Most likely, this result was due to the recognition that, with profits as high as they were, medical malpractice insurance for doctors was greatly overpriced in prior years. MEDICAL MALPRACTICE INSURANCE CLAIMS – HISTORIC LOWS
As A.M. Best put it, “Overall, the most significant trend in [medical professional liability insurance] results over the five years through 2008 is the ongoing downward slope in the frequency of claims.…”22 The data certainly bears this out, but it also shows that the decrease extends beyond just the drop in claims frequency – the number of claims filed. It also shows that the amount insurers are paying out in claims has been steadily dropping as well.
As already noted, one way to determine if payouts are rising is to look at the ISO’s “pure premium” data. This is the component of an insurance rate that should be affected by verdicts, settlements, payouts, or so-called “tort reform.” While relatively flat over the last decade, pure premiums dropped steadily since 2005, with 2008 seeing an 11% decrease. In other words, there is nothing in this data suggesting any recent spike in claims, verdicts, settlements or payouts. In fact, quite the opposite seems true. Exhibit A shows the actual premium and claims data, overall totals for the country since 1975, as well as averages per doctor, controlled for medical inflation. According to the industry’s own data, total annual payouts for everyone in the country have stayed under $5 billion per year since 2005, approximately what they were in the late 1990s even before inflation adjustments.
22 “Solid Underwriting Undercut by MPLI’s Investment Losses,” Best’s Special Report, A.M. Best, April 27, 2009.

13
Moreover, inflation-adjusted per doctor claims have been dropping since 2002 from $8,676.21 that year to $5,217.49 in 2007 and $4,896.05 in 2008. In fact, at no time during this decade did claims spike, or “explode.” Rather, payouts in constant dollars have been stable or falling throughout this entire decade, down 45 percent since 2000. In sum, these data confirm that neither jury verdicts nor any other factor affecting total claims paid by insurance companies that write medical malpractice insurance have had much impact on the system’s overall costs. Only medical inflation and growth in the number of doctors correlate with the paid loss trends. WHY DID PREMIUMS GO UP? – A COMPARISON OF PREMIUMS AND CLAIMS If premiums and claims are both down, then one might ask why medical malpractice insurance is an issue at all? The reason is that there have been well-known periods of time when insurance rates for doctors have spiked, even though claims did not rise. The most recent time this occurred was from 2002 until 2004. AIR’s prior studies showed that during this period, payouts were stable or dropped. True Risk finds the same phenomenon. Compare the following two charts.
(Note that the 1992 data point was not a classic cycle bottom, but reflected the impact of Hurricane Andrew and other catastrophes in that year.)

14
Since 1975, the data show that (in constant dollars), per doctor written premiums — the amount of premiums that doctors have paid to insurers — have fluctuated almost precisely with the insurer’s economic cycle, which is driven by such factors as insurer mismanagement of pricing during the cycle and changing interest rates. Notably, the amounts were not affected by lawsuits, jury awards or the tort system. In other words, according to the industry’s own data, premiums have not tracked costs or payouts in any direct way. (See Exhibit A). Clearly, during the early to mid part of this decade, medical malpractice insurance premiums rose much faster than was justified by insurance payouts. These hikes were similar to, although perhaps not quite a severe as, the rates hikes of the past “hard” markets, which occurred in the mid-1980s and mid-1970s. None were connected to actual increased payouts. MEDICAL MALPRACTICE PREMIUMS AND CLAIMS ARE A TINY PERCENTAGE OF OVERALL HEALTH CARE COSTS Another reason why medical malpractice insurance is an issue today is because fixing national health care is on the agenda and some lawmakers are pointing to medical malpractice claims and premium costs as driving up overall health care expenses for everyone. But as the data in Exhibit A show, medical malpractice premiums and claims are a tiny percentage of overall health care costs and have been for 35 years. Total medical malpractice premiums written for doctors in 2008 was $10,694,165,000. This is only 0.45 % - less than half a percent- of total 2008 National Health Care Expenditures ($2.379

15
trillion). Payouts – the amount of money we spend in this country to take care of the hundreds of thousands injured by medical negligence each year - are even less. At $4,694,956, these losses are only one-fifth of 1 percent of total health care costs. (See Exhibit D.) Even if every single medical malpractice lawsuit were eliminated, including every legitimate case, costs saved would still be less than 1% of this country’s health care expenditures. Even if doctors did as much “defensive medicine” as the entire medical malpractice insurance industry pays out in claims and lawsuits in a year, it would still total less than 1% of this country’s health care expenditures. It should also be emphasized that neither claims nor premiums have ever gone above 1% of overall health care expenditures since data became available in 1975.
THE DISCONNECT BETWEEN TORT LAWS AND INSURANCE PREMIUMS In the early to mid part of this decade, insurance rates for some doctors skyrocketed. The public was told by insurance and medical industry lobbyists that these rates were rising due to increasing claims by patients, rising jury verdicts and “exploding” tort system costs in general. The insurance industry argued and, worse, convinced doctors to believe that patients who file medical malpractice lawsuits were being awarded more and more money, leading to unbearably high losses for insurers. Insurers said that to recoup money paid to patients, medical malpractice insurers had to raise insurance rates or, in some cases, pull out of the market altogether. They also said that the only way to bring down insurance rates was to limit an injured patient’s ability to sue in court.

16
In order to determine most accurately the connection between insurance rates for doctors and so-called “tort reform,” and whether tort law changes in states have any impact on rates, it is important to examine the component of the rate that would be affected by verdicts, settlements, payouts, or so-called “tort reform.” That part is called the “pure premium”23 or “loss cost”.24 As noted earlier, the most comprehensive and reliable database for determining insurance pure premium or loss costs, is that used by the Insurance Services Office (ISO). ISO makes filings with state insurance departments on behalf of the insurance companies using their services. ISO takes the historic loss and loss adjustment expense information, including both actual payments and estimates of future payouts, and trend that information into the future using trend factors to reflect anticipated inflation and other changes. The results are changes in the levels of pure premium charges approved by the state insurance departments, which then are used by many insurance companies in their pricing models.25 (See Exhibit B.) Findings. If the insurance industry assertions are correct – that a sudden increase or “explosion” in jury awards or payouts in medical malpractice cases drove high insurance rates for doctors in this decade – then states should be experiencing high insurance loss cost increases in those years. The data show the opposite. Loss costs for medical injuries have moved up slowly, staying relatively flat over the last decade with a 2% increase per year over this period and 1% over the last 5 years (with a huge drop occurring now). These results are below even CPI inflation, much less medical inflation. Had the industry increased rates based on ISO’s projected losses, rates for doctors should have increased only 2 percent on average over the last decade, instead of 100 percent or more for some doctors. Despite the rhetoric and lobbying by the insurance industry in their push for “tort reform,” they have been raising doctors’ premiums even though expenses related to claims have remained quite consistent and risen slowly, near medical inflation. The reasons for these dramatic premium increases of the recent hard market must be found elsewhere. State by State Comparisons This section of True Risk is designed to test the impact of tort restrictions passed by state legislators (or voters by ballot initiative) in reaction to the most recent medical malpractice insurance crisis that hit from 2002 until 2005. We are examining the impact on both medical malpractice insurance rates and insurance company profits. We obtained medical malpractice data on insurance rate and loss cost movement in every state from 1995 through 2008. We then segregated the states into two categories: states that had enacted the most number of medical malpractice tort laws and states that enacted the fewest. The hypothesis we tested was simple: if tort law limits succeed in reducing insurance costs for
23 See note 18. 24 See note 19. 25 Data not available for Hawaii, New York, or Texas, or for California until 2000. Data not available for physicians or surgeons for Massachusetts, or for Washington in 1998.

17
doctors and hospitals, that should be evident in the trends of insurance costs in the states, as well as on industry profits. As tort law limits get more severe, the trends in rates and underlying loss costs should be less and the profits should be more. Methodology: In order to measure the impact of medical malpractice-related tort law limits, we placed the states into two categories, based on the following criteria: We evaluated the major medical malpractice limits enacted by state legislatures or by ballot initiative in medical malpractice cases. Decisions as to what constituted a “major tort law limit” were based on traditional “tort reforms” as defined by groups like the American Tort Reform Association and the American Association for Justice, as well as additional legal research and consultation with some experts. We defined as a “major medical malpractice tort law limit” provisions including the most talked-about “tort reform”: caps on damages. We also included modifications to joint and several liability, modifications to the collateral source rule, structured settlements (except if optional for plaintiffs), limits on prejudgment interest, and limits on contingency fees for plaintiffs’ attorneys. Certain unique state statutes were also included, such as Virginia’s Birth-Related Neurological Injury Compensation Act, an injury compensation fund for catastrophically injured newborns that precludes non-economic and punitive damages. Not included, either because they were part of the common law or were court imposed (this study is only evaluating the impact of legislative or voter responses), were limited to narrow causes of action, or ones that varied so widely from state to state as to make them impossible to compare, such as: statutes of limitations, punitive damages standards (many are court imposed), review panels, certificates of merit, arbitration rules, or wrongful death statutes. Sometimes, as with joint and several liability, the legislature decided to modify the law in some respect. Other times, it decided to abolish the doctrine altogether. Also, caps on damages vary in size. No subjective weight was attached to any of these decisions, or to the reforms themselves. The assumption was that whatever was enacted was whatever the legislature was convinced was necessary to bring down insurance rates, among other things, in that state at that time. States (plus the District of Columbia) were then divided into two categories. Category 1 represents the states with the most medical malpractice tort limits passed over time; Category 2 represents the fewest. It must be noted that these categories are relative. Therefore, a state may have enacted a number of medical liability limits during these years, yet may not be placed in Category 1 because other states have done more. The state law breakdowns are listed in Exhibit C. Rate Findings. The trends in rates/loss costs do not support the hypothesis that “tort reform” has succeeded in holding down insurance costs or rates. Despite what the insurance industry and medical lobbies promised lawmakers, legal limits on injured patients have not lowered insurance rates in the ensuing years. Some states with little or no restrictions on

18
patients’ legal rights have experienced the same level of insurance rate changes as those states that enacted severe restrictions on patients’ rights. Moreover, some states with severe and longstanding caps on damages have seen loss costs rise faster than some states without caps. Compare, for example, Missouri and Iowa, two neighboring Midwest states. Missouri has had a cap since the mid-1980s, as well as other “tort reform” in medical malpractice cases. Iowa has never had a cap. In the last five years, Missouri’s pure premium increased 1%. Iowa’s dropped 6%. Among states that had pure premium increases of more than 5% in the last five years included states with significant medical malpractice limits like FL, NV, and UT, and states with fewer restrictions like NH, VT and WY. In other words, the data do not support any conclusion that changing the legal system by limiting patients’ rights will result in lower premiums for doctors. Profit Findings. A.M. Best said in its recent review of the medical malpractice insurance industry, “carriers in states without tort reform may fare better than those in tort-reform states.”26 Indeed, that seems clearly true based on profit figures released by the National Association of Insurance Commissioners. Exhibit E shows the return on net worth for med mal insurers in 2007 broken down by states. These data do not support any correlation between a state’s tort system in medical malpractice cases and the industry’s profit. CONCLUSION To our knowledge, True Risk is the most comprehensive review of premiums, claims, profits and the impact of medical malpractice tort law limits to date. The key findings are that premiums and claims are significantly down, medical malpractice insurance companies are doing very well despite the global economic meltdown, that medical malpractice claims and premiums are each less than one percent of overall health care costs in this country and enactment of tort law limits does not result in reduced insurance costs for doctors or hospitals. Periodic liability insurance crises are driven by the insurance underwriting cycle and not a tort law cost “explosion” as many insurance industry and organized medicine lobbyists claim. Laws that restrict the rights of injured patients to go to court do not produce lower insurance or health care costs, and insurance companies that claim they do are severely misleading this country’s lawmakers.
26 “Solid Underwriting Undercut by MPLI’s Investment Losses,” Best’s Special Report, A.M. Best, April 27, 2009.

19
Exhibit A
Direct Premiums
Written
Direct Losses
Paid
Loss
Ratio
Number Doctors
in USA
Medical Care
Inflation
Direct Premiums
Written
Direct Losses
Paid
Direct Premiums
Written, per doctor
Direct Losses Paid,
per doctor
Year (thousands) (thousands) (active) (CPI-U) per doctor per doctor 2008 Dollars 2008 Dollars
1975 865,208 190,867 22.1% 393,742 47.5 $2,197.40 $484.75 $16,843.64 $3,715.75
1976 1,187,978 188,545 15.9% 408,529 52 $2,907.94 $461.52 $20,361.18 $3,231.54
1977 1,423,091 248,969 17.5% 423,317 57 $3,361.76 $588.14 $21,473.99 $3,756.86
1978 1,412,555 294,456 20.8% 438,104 61.8 $3,224.25 $672.11 $18,995.92 $3,959.82
1979 1,405,991 391,800 27.9% 452,892 67.5 $3,104.47 $865.11 $16,745.76 $4,666.45
1980 1,493,543 521,849 34.9% 467,679 74.9 $3,193.52 $1,115.83 $15,524.18 $5,424.20
1981 1,616,470 665,570 41.2% 485,123 82.9 $3,332.08 $1,371.96 $14,634.64 $6,025.71
1982 1,815,056 847,543 46.7% 501,958 92.5 $3,615.95 $1,688.47 $14,233.17 $6,646.20
1983 2,033,911 1,079,862 53.1% 519,546 100.6 $3,914.79 $2,078.47 $14,168.72 $7,522.58
1984 2,282,590 1,197,979 52.5% 536,986 106.8 $4,250.74 $2,230.93 $14,491.53 $7,605.64
1985 3,407,177 1,556,300 45.7% 552,716 113.5 $6,164.43 $2,815.73 $19,775.04 $9,032.67
1986 4,335,863 1,709,883 39.4% 569,160 122 $7,618.00 $3,004.22 $22,735.37 $8,965.88
1987 4,781,084 1,905,491 39.9% 585,597 130.1 $8,164.46 $3,253.93 $22,849.20 $9,106.50
1988 5,166,811 2,128,281 41.2% 593193 138.6 $8,710.17 $3,587.84 $22,881.47 $9,425.20
1989 5,500,540 2,273,628 41.3% 600,789 149.3 $9,155.53 $3,784.40 $22,327.71 $9,229.08
1990 5,273,360 2,415,117 45.8% 615,421 162.8 $8,568.70 $3,924.33 $19,163.79 $8,776.72
1991 5,043,773 2,423,418 48.0% 634242 177 $7,952.44 $3,820.97 $16,358.67 $7,859.97
1992 5,228,362 2,808,838 53.7% 653,062 190.1 $8,005.92 $4,301.03 $15,333.80 $8,237.79
1993 5,469,575 3,028,086 55.4% 670,336 201.4 $8,159.45 $4,517.27 $14,751.03 $8,166.52
1994 5,948,361 3,174,987 53.4% 684,414 211 $8,691.17 $4,638.99 $14,997.42 $8,005.00
1995 6,107,568 3,326,846 54.5% 720,325 220.5 $8,478.91 $4,618.53 $14,000.77 $7,626.34
1996 6,002,233 3,556,151 59.2% 737,764 228.2 $8,135.71 $4,820.17 $12,980.77 $7,690.73
1997 5,864,218 3,587,566 61.2% 756,710 234.6 $7,749.62 $4,741.01 $12,027.44 $7,358.06
1998 6,040,051 3,957,619 65.5% 765,922 242.1 $7,885.99 $5,167.13 $11,859.93 $7,770.97
1999 6,053,323 4,446,975 73.5% 797,634 250.6 $7,589.10 $5,575.21 $11,026.30 $8,100.29
2000 6,303,206 4,988,474 79.1% 802,156 260.8 $7,857.83 $6,218.83 $10,970.23 $8,682.04
2001 7,288,933 5,424,197 74.4% 836,156 272.8 $8,717.19 $6,487.06 $11,634.64 $8,658.14
2002 8,928,252 5,806,463 65.0% 853,187 285.6 $10,464.59 $6,805.62 $13,340.89 $8,676.21
2003 10,142,575 5,622,377 55.4% 871,535 297.1 $11,637.60 $6,451.12 $14,262.03 $7,905.93
2004 11,501,864 5,485,200 47.7% 884,974 310.1 $12,996.84 $6,198.15 $15,260.07 $7,277.48
2005 11,577,418 4,872,760 42.1% 902,053 323.2 $12,834.52 $5,401.86 $14,458.69 $6,085.44
2006 11,882,901 4,751,654 40.0% 921,904 336.2 $12,889.52 $5,154.17 $13,959.17 $5,581.90
2007 11,138,531 4,735,895 42.5% 941,304 351.1 $11,833.09 $5,031.21 $12,271.22 $5,217.49
2008 10,694,165 4,694,956 43.9% 958,927 364.1 $11,152.22 $4,896.05 $11,152.22 $4,896.05
Sources: Premiums and Losses from Special compilation of Annual Statement data by A. M. Best & Co.;
Number of total doctors from US Census Bureau; 1976-79, 1988 and 1991 estimated as straight line growth between the years with data;
Source of doctors data since 1998: Physician Characteristics and Distribution in the U.S., American Medical Association, 2008 estimated using 5-year average growth.
Inflation Index: Bureau of Labor Statistics.

20
Exhibit B
Averages
STATE 1 9 9 5 1 9 9 6 1 9 9 7 1 9 9 8 1 9 9 9 2 0 0 0 2 0 0 1 2 0 0 2 2 0 0 3 2 0 0 4 2 0 0 5 2 0 0 6 2 0 0 7 2 0 0 8 14 Yr. 10 Yr. 5 Yr.
Category 1 States (more tort limits):
Alaska 0 % 0 % 0 % 0 % 0 % 0 % 0 % 0 % 0 % 0 % 0 % 0 % 0 % 0 % 0 % 0 % 0 %
Calif. na na na na na - 1 % 3 % 1 7 % 2 % 1 % - 1 3 % 5 % - 7 % - 2 0 % N A N A - 7 %
Colo. 8 % 1 6 % 0 % 0 % 1 2 % 3 % 0 % - 3 % - 1 % - 2 % - 1 2 % - 4 % - 1 % - 1 0 % 0 % - 2 % - 6 %
Florida 0 % 0 % 0 % 1 9 % - 1 9 % 1 2 % 8 % 7 % 7 % 0 % 4 1 % 4 % - 1 0 % 0 % 5 % 5 % 7 %
Ga. 0 % 0 % 9 % 1 9 % 0 % 1 % 1 % 0 % 0 % 1 0 % 3 1 % 0 % 9 % - 2 0 % 4 % 3 % 6 %
Idaho 0 % 0 % 7 % 0 % 0 % 7 % 6 % 1 2 % 2 3 % 2 5 % 6 % 1 4 % - 1 1 % - 2 0 % 5 % 6 % 3 %
Illinois 1 5 % 2 2 % - 3 % 0 % - 1 6 % 0 % - 1 0 % 2 7 % 5 % 2 5 % 4 5 % 0 % - 5 % - 1 2 % 7 % 6 % 1 1 %
Indiana 1 5 % 5 0 % 0 % 3 0 % - 1 5 % - 1 % - 1 4 % - 4 % - 1 2 % 0 % 9 % - 6 % 0 % - 2 0 % 2 % - 6 % - 3 %
Kansas 0 % 0 % 2 5 % 2 5 % 2 3 % - 1 5 % - 1 9 % - 1 0 % 3 % 7 % - 8 % - 1 % - 8 % 0 % 2 % - 3 % - 2 %
Louisiana 0 % 2 9 % 0 % 0 % 0 % 1 6 % 0 % - 1 % 8 % 1 1 % 6 % - 1 5 % 1 7 % 0 % 5 % 4 % 4 %
Mich. - 1 1 % - 1 0 % 0 % 1 8 % 1 6 % 0 % 7 % - 6 % - 5 % 5 % - 1 0 % 6 % - 1 5 % - 1 6 % - 2 % - 2 % - 6 %
Miss. 2 5 % 0 % 0 % 2 3 % 9 % 8 % 0 % 1 3 % 1 8 % 2 2 % 1 7 % 1 % - 3 % - 1 2 % 9 % 7 % 5 %
Mo. 5 6 % 2 0 % - 1 2 % - 1 3 % - 6 % 0 % - 1 7 % - 9 % 1 3 % 2 5 % 7 % - 1 % - 6 % - 2 0 % 3 % - 1 % 1 %
Mt. - 1 0 % 0 % 0 % 2 0 % 1 0 % 1 3 % 1 4 % 1 9 % 1 2 % 2 4 % 3 % 0 % 1 2 % 1 0 % 9 % 1 2 % 1 0 %
Neb. 0 % 1 0 % 1 0 % 6 % 0 % 0 % - 8 % 0 % 1 2 % 1 3 % 1 % 5 % - 3 % - 1 9 % 2 % 0 % - 1 %
Nevada 0 % 0 % 2 5 % 0 % 2 3 % 2 5 % 2 0 % 2 0 % 2 5 % 0 % 4 5 % 0 % 0 % - 4 % 1 3 % 1 5 % 8 %
N.M. 0 % 2 5 % 5 % 0 % 0 % 1 8 % - 1 1 % - 1 7 % - 4 % - 3 % 0 % 0 % 0 % - 2 0 % - 1 % - 4 % - 5 %
N.D. 0 % 0 % - 1 % 0 % 2 % 0 % 0 % 0 % 2 % 0 % 1 7 % 4 % - 2 % - 6 % 1 % 2 % 3 %
Ohio 1 4 % 1 5 % - 2 4 % 0 % 0 % - 3 % 0 % 1 6 % 3 % 1 2 % 3 % 5 % - 1 4 % - 2 0 % 1 % 0 % - 3 %
Oklahoma 0 % 0 % 2 0 % 0 % - 4 % - 1 % - 2 % 3 % - 3 % 7 % 6 % 2 % 0 % - 2 0 % 1 % - 1 % - 1 %
S.D. 0 % 0 % 1 % 9 % 0 % 7 % - 4 % - 1 % - 2 % 0 % - 1 % 1 7 % - 9 % 2 % 1 % 1 % 2 %
Texas na na na na na na na na na na na na na na N A N A N A
Utah 0 % 0 % 0 % 4 8 % 1 9 % 1 6 % 8 % 0 % 4 % 0 % 5 % 2 3 % 1 1 % - 8 % 9 % 8 % 6 %
Virginia 1 2 % 0 % 2 1 % 2 9 % 0 % - 8 % 8 % 0 % 2 % 1 8 % 1 % - 1 6 % - 1 4 % - 2 0 % 2 % - 3 % - 6 %
W.V. 2 5 % 2 2 % - 9 % - 6 % 0 % 0 % 1 2 % 1 0 % 1 0 % 0 % 1 0 % 1 0 % - 2 % - 2 0 % 4 % 3 % 0 %
Wisc. 0 % 3 0 % 0 % 0 % 0 % - 5 % - 1 2 % - 5 % - 1 % - 3 % 8 % 3 % - 6 % 0 % 1 % - 2 % 0 %
Category 2 States (fewer tort limits):
Ala. 1 5 % 0 % 0 % 0 % 0 % 0 % 0 % 1 2 % - 1 % 0 % 0 % - 1 4 % 6 % - 9 % 1 % - 1 % - 3 %
Arizona 0 % 0 % 1 6 % 2 8 % 1 3 % 1 2 % 1 4 % 0 % 3 % 9 % - 1 % 0 % - 1 2 % - 1 7 % 5 % 2 % - 4 %
Ark. 1 9 % 1 0 % 0 % 1 7 % 0 % 1 5 % - 7 % 2 % 7 % 6 % 4 % - 8 % 1 0 % 0 % 5 % 3 % 2 %
Conn. - 1 5 % 0 % 1 0 % 1 4 % 8 % 6 % 9 % 1 2 % 1 2 % 8 % 0 % - 2 % - 1 5 % 0 % 3 % 4 % - 2 %
Dela. 1 4 % 0 % 0 % 0 % - 4 % - 7 % - 1 0 % - 6 % 7 % 6 % 3 % 0 % 0 % 2 % 0 % - 1 % 2 %
D.C. 0 % - 1 0 % 2 5 % 1 0 % 0 % 1 9 % 0 % 0 % 1 0 % 0 % 4 5 % 7 % 0 % 0 % 8 % 8 % 1 0 %
Hawaii na na na na na na na na na na na na na na N A N A N A
Iowa 0 % 0 % 0 % 1 4 % 0 % 7 % 1 2 % 7 % 1 0 % 1 1 % - 9 % - 4 % - 8 % - 2 0 % 1 % 1 % - 6 %
Ky. 6 1 % 0 % 7 % 0 % - 4 % 0 % - 2 2 % - 3 % - 7 % 4 % 4 % 1 2 % - 4 % - 2 0 % 2 % - 4 % - 1 %
Maine 0 % 0 % 0 % 9 % 0 % 8 % 0 % 2 % 0 % 0 % 3 0 % 1 5 % - 2 2 % - 2 0 % 2 % 1 % 1 %
Md. 0 % 3 0 % 0 % 1 7 % - 1 1 % - 9 % - 1 2 % 0 % 8 % 1 2 % 3 7 % 7 % 1 1 % - 2 0 % 5 % 2 % 9 %
Mass. 0 % 0 % 1 5 0 % 0 % 3 7 % 2 2 % 1 9 % 1 8 % 1 5 % 2 5 % 0 % 1 1 % 0 % 0 % 2 1 % 1 5 % 7 %
Minn. 0 % 1 1 % - 9 % 0 % 0 % 3 % 0 % - 7 % - 6 % 6 % 1 % - 1 % - 3 % - 2 0 % - 2 % - 3 % - 3 %
N.H. - 1 0 % - 1 0 % 0 % 4 1 % 1 5 % 1 5 % 2 4 % 1 4 % 2 0 % 1 3 % 4 1 % 1 1 % 0 % - 1 7 % 1 1 % 1 4 % 1 0 %
N.J. 0 % 1 5 % 0 % 0 % 0 % - 1 1 % - 1 1 % - 1 0 % 5 % 9 % 0 % 8 % - 1 7 % - 2 0 % - 2 % - 5 % - 4 %
N.Y. na na na na na na na na na na na na na na N A N A N A
N.C. 0 % 3 1 % 9 % 0 % 0 % - 1 % 3 % 1 0 % - 2 % 2 2 % 8 % - 4 % 0 % - 2 1 % 4 % 2 % 1 %
Oregon 0 % - 1 5 % 0 % 0 % 0 % 2 5 % 2 9 % 0 % 2 % 0 % 1 7 % 1 1 % 6 % - 5 % 5 % 9 % 6 %
Penn. 0 % 0 % 1 5 % - 3 % - 1 3 % 2 % - 8 % 1 4 % 8 % 2 5 % 9 % - 7 % - 1 7 % - 2 0 % 0 % - 1 % - 2 %
R.I. 0 % 0 % 0 % 0 % 0 % 0 % 0 % 0 % 0 % 0 % 0 % 0 % 0 % 0 % 0 % 0 % 0 %
S.C. 0 % 2 5 % 0 % 0 % 0 % 0 % 1 6 % 0 % 2 5 % 2 2 % - 4 % 5 % 0 % - 1 2 % 6 % 5 % 2 %
Tenn. 0 % 0 % 0 % 1 9 % 0 % 1 1 % 5 % 9 % 0 % 1 5 % - 1 % - 3 % - 6 % 0 % 4 % 3 % 1 %
Vt. 1 0 % 0 % 0 % 1 5 % 1 1 % 9 % 5 % 0 % 6 % 1 1 % 2 % 1 7 % 7 % - 7 % 6 % 6 % 6 %
Wash. 0 % 0 % 0 % 4 % 0 % 1 2 % 0 % 4 % 3 % 1 1 % 0 % 2 % - 9 % - 1 7 % 1 % 1 % - 3 %
Wyo. 1 0 % 0 % 0 % 0 % 4 % 6 % 0 % 0 % 0 % 0 % 2 0 % 1 5 % 1 1 % - 1 4 % 4 % 4 % 6 %
Category
1 Average 6.5% 10.0% 3.2% 9.9% 2.3% 4.0% -0.4% 3.7% 5.0% 8.2% 9.0% 2.3% -2.8% -11.5% 3.5% 2.0% 1.0%
Category
2 Average 4.5% 3.8% 9.7% 8.0% 2.4% 6.3% 2.9% 3.4% 5.4% 9.3% 9.0% 3.4% -2.7% -11.2% 3.9% 2.8% 1.6%
National
Average 5.4% 6.7% 6.3% 8.8% 2.3% 4.9% 1.2% 3.5% 5.1% 8.6% 8.8% 2.8% -2.7% -11.1% 3.7% 2.4% 1.3%
Combined effect of 2 revisions
Original Filing Amended
Dentists Only

21
Exhibit C
MAJOR MEDICAL MALPRACTICE TORT RESTRICTIONS Alabama 87: med mal cap, noneconomic (but declared unconstitutional in 91) 87: med mal cap, total damages (but declared unconstitutional in 95) 87: punitive cap (but declared unconstitutional in 93) 87: collateral source (declared unconstitutional in part in 96, but then overruled in 2000) 99: punitive cap Alaska 86: cap, noneconomic 86: joint and several liability 86: collateral source rule 88: joint and several liability (ballot initiative) 97: cap, noneconomic 97: punitive cap 97: prejudgment interest 05: cap, noneconomic Arizona Pre-1985: med mal collateral source 87: joint and several 89: med mal structured settlements (but declared unconstitutional in 94) 93: collateral source rule 02: contingent fee Arkansas Pre-1985: medical malpractice structured settlements 03: punitive cap 03: joint and several liability California Pre-1985: med mal cap, noneconomic; med mal collateral source; med mal contingency fees; med mal structured settlements 86: joint and several liability (ballot initiative) Colorado 86: cap, noneconomic 86: joint and several liability 86: punitive cap 86: collateral source 88: med mal cap, non economic and all damages 88: med mal statute of repose 88: med mal structured settlements 92: med mal collateral source 95: prejudgment interest 03: med mal cap, noneconomic (increase) Connecticut Pre-1985: punitive cap, products liability 85: med mal collateral source

22
86: joint and several 86: contingency fees 86: structured settlements 87: joint and several Delaware Pre-1985: collateral source; med mal contingency fees; med mal structured settlements District of Columbia Pre-1985: collateral source Florida 86: cap, noneconomic (but declared unconstitutional in 1987) 86: joint and several liability 86: collateral source (but declared unconstitutional in 87) 86: med mal structured settlements 86: contingency fees 86: punitive cap 88: med mal cap, noneconomic (depending on arbitration) 99: punitive cap 99: joint and several liability 03: med mal cap, noneconomic 07: collateral source 06: joint and several liability Georgia 87: punitive cap 87: joint and several liability 87: collateral source (but declared unconstitutional in 91) 03: prejudgment interest 05: joint and several liability (eliminated) 05: cap, noneconomic (pending ruling on constitutionality) Hawaii 86: cap, noneconomic damages 86: joint and several liability (except medical products) 86: collateral source (liens) 94: joint and several liability (government defendants) 07: collateral source Idaho 87: cap, noneconomic 87: joint and several liability (except medical products) 87: structured settlements 90: collateral source 03: cap, noneconomic 03: punitive cap 03: joint and several liability, medical products 08: collateral source Illinois Pre-1985: med mal collateral source 85: medical malpractice structured settlements
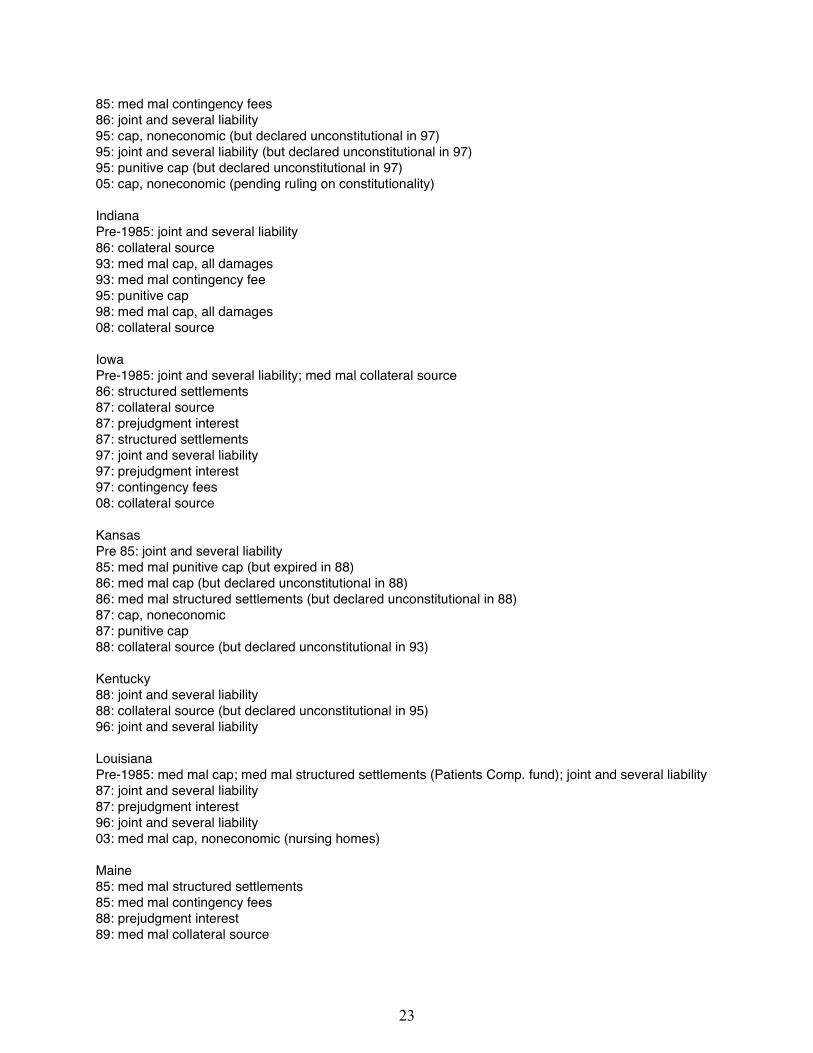
23
85: med mal contingency fees 86: joint and several liability 95: cap, noneconomic (but declared unconstitutional in 97) 95: joint and several liability (but declared unconstitutional in 97) 95: punitive cap (but declared unconstitutional in 97) 05: cap, noneconomic (pending ruling on constitutionality) Indiana Pre-1985: joint and several liability 86: collateral source 93: med mal cap, all damages 93: med mal contingency fee 95: punitive cap 98: med mal cap, all damages 08: collateral source Iowa Pre-1985: joint and several liability; med mal collateral source 86: structured settlements 87: collateral source 87: prejudgment interest 87: structured settlements 97: joint and several liability 97: prejudgment interest 97: contingency fees 08: collateral source Kansas Pre 85: joint and several liability 85: med mal punitive cap (but expired in 88) 86: med mal cap (but declared unconstitutional in 88) 86: med mal structured settlements (but declared unconstitutional in 88) 87: cap, noneconomic 87: punitive cap 88: collateral source (but declared unconstitutional in 93) Kentucky 88: joint and several liability 88: collateral source (but declared unconstitutional in 95) 96: joint and several liability Louisiana Pre-1985: med mal cap; med mal structured settlements (Patients Comp. fund); joint and several liability 87: joint and several liability 87: prejudgment interest 96: joint and several liability 03: med mal cap, noneconomic (nursing homes) Maine 85: med mal structured settlements 85: med mal contingency fees 88: prejudgment interest 89: med mal collateral source

24
05: punitive cap Maryland Pre-1985: collateral source (only med mal) 86: cap, noneconomic 86: structured settlements 05: cap, noneconomic (raised) Massachusetts 86: med mal cap, noneconomic 86: med mal collateral source 86: med mal contingency fees Michigan 86: med mal cap, noneconomic 86: collateral source 86: structured settlements 86: prejudgment interest 87: joint and several liability 93: med mal cap, noneconomic 95: joint and several liability Minnesota 86: collateral source 86: prejudgment interest 88: joint and several liability 03: joint and several liability Mississippi 89: joint and several liability 98: med mal statute of repose 02: med mal cap, noneconomic 02: joint and several liability, med mal 04: med mal cap, noneconomic 04: cap, noneconomic 04: punitive cap 04: joint and several liability Missouri 86: med mal cap, noneconomic 86: med mal structured settlements 87: joint and several liability 87: collateral source 87: joint and several liability 05: cap lowered, noneconomic 05: punitive cap Montana: 87: joint and several liability (but declared unconstitutional in 94) 87: collateral source 95: med mal cap, noneconomic 95: med mal structured settlements 97: joint and several liability

25
03: punitive cap Nebraska Pre-1985: collateral source, contingency fees Pre-1985: med mal cap, all damages (cap increased in 92, 03) 86: prejudgment interest (but improved prior standard) 92: joint and several liability (but improved prior standard) Nevada Pre-1985: med mal collateral source 87: joint and several liability 89: punitive cap 02: med mal cap, noneconomic 02: joint and several liability 04: med mal cap, noneconomic (initiative) 04: joint and several liability (initiative) 04: structured settlements (initiative) 04: contingency fees New Hampshire 86: med mal cap, noneconomic (but declared unconstitutional in 90) 86: cap, noneconomic (but declared unconstitutional in 91) 86: punitive damages abolished 86: contingency fees 89: joint and several liability 95: prejudgment interest 01: prejudgment interest New Jersey Pre-1985: contingency fees 87: joint and several liability 87: collateral source 95: punitive cap 95: joint and several liability 07: collateral source New Mexico Pre-1985: med mal cap, noneconomic 87: joint and several liability (but codified common law) 92: med mal structured settlement 92: med mal cap, noneconomic (increase) New York 86: joint and several liability 86: collateral source 86: structured settlements 86: med mal contingency fees 03: structured settlements North Carolina 95: punitive cap

26
North Dakota 87: joint and several liability 87: collateral source 87: structured settlements 93: punitive cap 95: med mal cap, noneconomic Ohio 87: joint and several liability 87: structured settlements (but declared unconstitutional in 94) 87: collateral source (but declared unconstitutional in 91) 96: cap, noneconomic (but declared unconstitutional in 99) 96: joint and several liability (but declared unconstitutional in 99) 96: punitive cap (but declared unconstitutional in 99) 96: collateral source (but declared unconstitutional in 99) 96: prejudgment interest 03: med mal cap, noneconomic 03: joint and several liability 03: collateral source, med mal 04: cap, noneconomic 04: punitive cap 04: collateral source 04: prejudgment interest Oklahoma: 83: joint and several liability 86: prejudgment interest 95: punitive cap 03: med mal cap, noneconomic 03: collateral source 03: prejudgment interest, med mal 04: med mal cap, noneconomic 04: joint and several liability 04: prejudgment interest Oregon 87: cap, noneconomic (but declared unconstitutional in 99) 87: joint and several liability 87: med mal punitive damages abolished against doctors 87: collateral source 95: joint and several liability Pennsylvania Pre-1985: med mal collateral source 96: med mal punitive cap 02: joint and several liability (ruled unconstitutional in 05) 02: collateral source 02: structured settlements Rhode Island 86: med mal collateral source 87: prejudgment interest

27
South Carolina Pre-1985: med mal structured settlements (Patient Comp. Fund with annual cap) 05: joint and several liability 05: med mal cap, noneconomic South Dakota Pre-1985: med mal collateral source Pre-1985: med mal cap, noneconomic 86: med mal cap, economic (but declared unconstitutional in ‘96) 86: med mal structured settlements 87: joint and several liability Tennessee Pre-1985: med mal collateral source 92: joint and several liability Texas 87: med mal cap (but declared unconstitutional in 88, although allowed for wrongful death in 90) 87: joint and several liability 87: punitive cap 87: prejudgment interest 95: joint and several liability 95: punitive cap 03: med mal cap, noneconomic 03: joint and several liability 03: prejudgment interest Utah 85: med mal collateral source 85: contingency fees 86: med mal cap, noneconomic 86: joint and several liability 86: med mal structured settlements 99: joint and several liability Vermont: Pre-85: joint and several liability Virginia Pre-1985: med mal cap (although cap raised in 83 and 99), joint and several liability 87: med mal (children injured at birth, no right to sue, no noneconomic or punitive damages) 87: punitive cap Washington Pre-1985: punitive cap; med mal collateral source, contingency fees 86: cap, noneconomic damages (but declared unconstitutional in 89) 86: joint and several liability 86: structured settlements 04: post judgment interest 06: collateral source West Virginia 86: med mal cap, noneconomic

28
86: med mal joint and several liability 03: med mal cap, noneconomic 03: joint and several liability 05: joint and several liability 06: prejudgment interest 06: collateral source Wisconsin Pre-1985: med mal (Patient Compensation Fund) 86: med mal cap, noneconomic (but expired 90) 86: med mal contingency fees 95: med mal cap, noneconomic (declared unconstitutional in 05) 95: joint and several liability 95: med mal structured settlements 95: med mal collateral source 06: med mal cap, noneconomic Wyoming 86: joint and several liability.

29
Exhibit D
Premiums and Claims as Percent of Total Health Care Costs
YEAR
Direct Premiums
Written
(thousands)
Direct Losses
Paid
(thousands)
Nationtal
Health Care
Expenditures
(billions of $)
DPW % of
Expend.
DLP % of
Expend.
1975 865,208 190,867 133.1 0.65% 0.14%
1976 1,187,978 188,545 152.5 0.78% 0.12%
1977 1,423,091 248,969 172.8 0.82% 0.14%
1978 1,412,555 294,456 194.1 0.73% 0.15%
1979 1,405,991 391,800 219.9 0.64% 0.18%
1980 1,493,543 521,849 253.4 0.59% 0.21%
1981 1,616,470 665,570 293.6 0.55% 0.23%
1982 1,815,056 847,543 330.7 0.55% 0.26%
1983 2,033,911 1,079,862 364.7 0.56% 0.30%
1984 2,282,590 1,197,979 401.6 0.57% 0.30%
1985 3,407,177 1,556,300 439.3 0.78% 0.35%
1986 4,335,863 1,709,883 471.3 0.92% 0.36%
1987 4,781,084 1,905,491 513.0 0.93% 0.37%
1988 5,166,811 2,128,281 574.0 0.90% 0.37%
1989 5,500,540 2,273,628 638.8 0.86% 0.36%
1990 5,273,360 2,415,117 714.1 0.74% 0.34%
1991 5,043,773 2,423,418 781.6 0.65% 0.31%
1992 5,228,362 2,808,838 849.0 0.62% 0.33%
1993 5,469,575 3,028,086 912.5 0.60% 0.33%
1994 5,948,361 3,174,987 962.1 0.62% 0.33%
1995 6,107,568 3,326,846 1,016.3 0.60% 0.33%
1996 5,996,557 3,556,151 1,068.5 0.56% 0.33%
1997 5,744,387 3,587,566 1,124.9 0.51% 0.32%
1998 6,060,121 3,957,619 1,190.1 0.51% 0.33%
1999 6,012,482 4,446,975 1,265.2 0.48% 0.35%
2000 6,376,040 4,988,474 1,353.2 0.47% 0.37%
2001 7,457,325 5,424,197 1,469.4 0.51% 0.37%
2002 9,280,247 5,806,463 1,602.3 0.58% 0.36%
2003 10,724,371 5,622,377 1,734.9 0.62% 0.32%
2004 11,501,864 5,485,200 1,854.8 0.62% 0.30%
2005 11,577,418 4,872,760 1,980.6 0.58% 0.25%
2006 11,882,901 4,751,654 2,112.7 0.56% 0.22%
2007 11,138,531 4,735,895 2,241.2 0.50% 0.21%
2008 10,694,165 4,694,956 2,378.6 0.45% 0.20%
0.63% 0.29%
Source: Premiums and Losses from A. M. Best, Health Expenditures from U.S.
Department of Health & Human Services
Average

30
Exhibit E
Return on Net Worth, 2007, by State
Category 1 States (more tort limits):
Alaska 2.2%
California 22.0%
Colorado 18.9%
Florida 23.1%
Georgia 17.6%
Idaho 18.6%
Illinois 13.9%
Indiana 12.4%
Kansas 17.0%
Louisiana 15.3%
Michigan 23.2%
Mississippi 20.7%
Missouri 26.5%
Montana 19.3%
Nebraska 27.6%
Nevada 23.5%
New Mexico 1.2%
North Dakota 22.2%
Ohio 26.0%
Oklahoma 15.1%
South Dakota 12.0%
Texas 37.6%
Utah 12.2%
Virginia 22.6%
West Virginia 6.9%
Wisconsin 4.3%
Category 2 States (fewer tort limits):
Alabama 20.3%
Arizona 14.1%
Arkansas 0.7%
Connecticut 2.6%
Delaware 18.8%
D.C. -1.5%
Hawaii 17.8%
Iowa 24.8%
Kentucky 10.7%
Maine 27.4%
Maryland 15.4%
Massachussets 11.6%
Minnesota 21.0%
New Hampshire 36.8%
New Jersey 11.0%
New York 6.3%
North Carolina 22.0%
Oregon 16.8%
Pennsylvania 14.3%
Rhode Island 11.6%
South Carolina 17.4%
Tennessee 16.8%
Vermont -20.8%
Washington 20.6%
Wyoming -5.8%
Category 1 Average 17.8%
Category 2 Average 13.2%
National Average 15.5%
Source: NAIC