medical imaging equipment age profile density · medical imaging equipment, it continues to...
TRANSCRIPT

COCIRSUSTAINABLE COMPETENCE IN ADVANCING HEALTHCARE
European Coordination Committee of the Radiological, Electromedical and Healthcare IT Industry
2016 EDITION
RENEWAL & REPLACEMENT NOW ESSENTIAL & LONG OVERDUE
MEDICAL IMAGING EQUIPMENTAGE PROFILE & DENSITY

European Coordination Committee of the Radiological, Electromedical and Healthcare IT Industry
IMAGING EQUIPMENT AGE PROFILE & DENSITY 2016 3
SITUATION DETERIORATING ON INSTALLED BASE OF IMAGING EQUIPMENT
This 2015 Medical Imaging Equipment Age Profile and Density report from COCIR provides worrying reading.
Despite earlier COCIR publications highlighting the dramatic deterioration in the age of the installed base of
medical imaging equipment, it continues to decline. It is now older than ever before, while the overall equipment
density in Western Europe is declining. This should not be the case.
Advances in technology have allowed required radiation doses to be lowered, reducing the risk to patients.
Despite this, one quarter of the Computed Tomography installed base falls below accepted standards for
radiation dose optimisation. Meanwhile, more than 3000 scanners in Europe are now so old that they are no
longer suitable for upgrade.
The risk to patients posed by a deteriorating equipment age profile and increasing obsolescence has also been
further communicated during the ECR* 2015 and 2016; the EuroSafe campaign has also drawn attention to
this alarming situation. This 2016 COCIR report provides supporting evidence that policymakers and healthcare
providers need to act now in order to reverse this negative trend.
The industry is continuously innovating to develop equipment that optimises levels of radiation without affecting
quality of images, as part of an ongoing dedication to continuously improving patient safety. This commitment
should be shared by all stakeholders; the consistent and persistent deterioration in the age profile of the
equipment base should not be allowed to continue. Embracing innovative financing models will make renewing
the equipment base affordable.
There is no reason for further delay. The benefits to patients and clinicians of renewing the Medical Imaging
Technology base are clear and irrefutable.
Nicole DENJOY,
COCIR Secretary General
FOREWORD
NICOLE DENJOY
* European Congress of Radiology

European Coordination Committee of the Radiological, Electromedical and Healthcare IT Industry
4 IMAGING EQUIPMENT AGE PROFILE & DENSITY 2016
TABLE OF CONTENTS
FOREWORD . . . . . . . . . . . . . . . . . . . . . . . . . . . . . . . . . . . . . 3
1. INTRODUCTION. . . . . . . . . . . . . . . . . . . . . . . . . . . . . . . . . . . . 5
The COCIR Golden Rules . . . . . . . . . . . . . . . . . . . . . . . . . . . . . . . . . 5
2. EXECUTIVE SUMMARY . . . . . . . . . . . . . . . . . . . . . . . . . . . . . . . . 5
Obsolescent Technology is undermining Patient Safety . . . . . . . . . . . . . . . . . . . . . . 5
3. COCIR RECOMMENDATIONS . . . . . . . . . . . . . . . . . . . . . . . . . . . . . . 6
4. AT A GLANCE: KEY INSTALLED BASE FINDINGS . . . . . . . . . . . . . . . . . . . . . 6
5. WHY INNOVATION MATTERS . . . . . . . . . . . . . . . . . . . . . . . . . . . . . . 7
A. Computed Tomography . . . . . . . . . . . . . . . . . . . . . . . . . . . . . . . . . 7
B. Addressing the financial challenge of implementing innovations . . . . . . . . . . . . . . . . . . 8
C. Advances in Computed Tomography technology . . . . . . . . . . . . . . . . . . . . . . . . 9
6. 2016 AGE PROFILE: DETAILED ANALYSIS OF RESULTS. . . . . . . . . . . . . . . . . . . 11
A. Computed Tomography . . . . . . . . . . . . . . . . . . . . . . . . . . . . . . . . . 11
B. Magnetic Resonance Imaging. . . . . . . . . . . . . . . . . . . . . . . . . . . . . . . 13
C. X-Ray Angiography . . . . . . . . . . . . . . . . . . . . . . . . . . . . . . . . . . 15
D. Molecular Imaging PET . . . . . . . . . . . . . . . . . . . . . . . . . . . . . . . . . 16
7. ANNEX 1: DETAILED RESULTS . . . . . . . . . . . . . . . . . . . . . . . . . . . . . 18
A. Computed Tomography . . . . . . . . . . . . . . . . . . . . . . . . . . . . . . . . . 18
B. Magnetic Resonance Imaging. . . . . . . . . . . . . . . . . . . . . . . . . . . . . . . 23
C. X-Ray Angiography . . . . . . . . . . . . . . . . . . . . . . . . . . . . . . . . . . 26
D. Molecular Imaging PET . . . . . . . . . . . . . . . . . . . . . . . . . . . . . . . . . 29
E. Equipment density trends . . . . . . . . . . . . . . . . . . . . . . . . . . . . . . . . 32
8. ANNEX 2: MEDICAL IMAGING TECHNOLOGIES . . . . . . . . . . . . . . . . . . . . . . 33
A. Computed Tomography . . . . . . . . . . . . . . . . . . . . . . . . . . . . . . . . . 33
B. Magnetic Resonance Imaging. . . . . . . . . . . . . . . . . . . . . . . . . . . . . . . 33
C. X-Ray . . . . . . . . . . . . . . . . . . . . . . . . . . . . . . . . . . . . . . . 33
D. Molecular Imaging PET . . . . . . . . . . . . . . . . . . . . . . . . . . . . . . . . . 34

European Coordination Committee of the Radiological, Electromedical and Healthcare IT Industry
IMAGING EQUIPMENT AGE PROFILE & DENSITY 2016 5
1. INTRODUCTIONCOCIR has been collating statistics and proactively supporting European Member States in monitoring their installed base of medical imaging equipment since the 1990s. COCIR use these parameters to monitor any changes in the age profile of the installed base in European Countries. In this edition, we have widened the scope of the analysis, including data from 33 new locations outside of Europe.
In 2003, COCIR drafted a set of pragmatic and prudent ‘Golden Rules’, on the basis that an appropriate mix in the age profile of installed equipment is essential for efficient and productive healthcare systems.
These rules support evaluation of the medical equipment installed base and aid procurement processes. They take into account the need to balance the benefits of innovation against the obligation to derive maximum value from capital investment.
THE COCIR GOLDEN RULES 1. AT LEAST 60% OF THE INSTALLED EQUIPMENT BASE SHOULD BE LESS THAN FIVE YEARS OLD.Medical technology life-cycle averages suggest equipment that is up to five years old adequately reflects the current state of technology with opportunities for economically viable upgrade measures.
2. NO MORE THAN 30% OF THE INSTALLED EQUIPMENT BASE SHOULD BE BETWEEN SIX TO TEN YEARS OLD.Medical technology that is between six to ten years old is still fit for purpose. However, systems replacement strategies should be developed to benefit from efficiency gains afforded by the latest technologies.
3. NO MORE THAN 10% OF THE AGE PROFILE SHOULD BE MORE THAN TEN YEARS OLD.Medical technology more than ten years old is outdated and challenging to maintain and repair. Compared with current medical guidelines and best practices, it can be considered obsolete or inadequate for conducting some procedures; replacement is essential.
2. EXECUTIVE SUMMARYOBSOLESCENT TECHNOLOGY IS UNDERMINING PATIENT SAFETYAusterity measures imposed on healthcare systems mean that the installed base of medical imaging equipment in Europe is older than ever before. The continued use of this equipment is exposing patients to unnecessary risk.
In some countries, the installed base-age profile trend is improving. However, this is more than offset by the fact that a quarter of the European Computed Tomography (CT) installed base is unsuitable for ‘radiation dose saving software upgrades’. This renders around 3000 units technologically obsolescent and immediate targets for replacement.
Increasingly rapid incremental innovation offers benefits for a larger, more mobile and ageing population. However, there is a serious lag in implementation. If we want societal benefits for all patients equally, then all stakeholders must urgently address this delay. This was highlighted in our 2013 report; it is clear that action is still required.
European Coordination Committee of the Radiological, Electromedical and Healthcare IT Industry
6 IMAGING EQUIPMENT AGE PROFILE & DENSITY 2016
3. COCIR RECOMMENDATIONSREPLACE OBSOLESCENT EQUIPMENT THAT CANNOT BE UPGRADED:COCIR calls upon national and regional governments and EU policy-makers to support replacing technologically obsolescent equipment that cannot be upgraded, using cohesion policy funding to ensure comprehensive, coherent and sustained investment. This will transform the delivery of care for all.
ADOPT AND DIFFUSE MANAGED SERVICES: COCIR calls upon Member States and regions to encourage hospitals and healthcare providers to use the European Fund for Strategic Investments to adopt and diffuse Managed Services. This will provide part of the solution for assuring long-term access to quality healthcare services for citizens.
ADOPT A PATIENT-CENTRIC APPROACH TO DOSE REDUCTION AND OPTIMISATION: COCIR calls upon healthcare providers to become more patient-centric on dose reduction and dose optimisation when replacing ageing equipment. This will enhance patient safety.
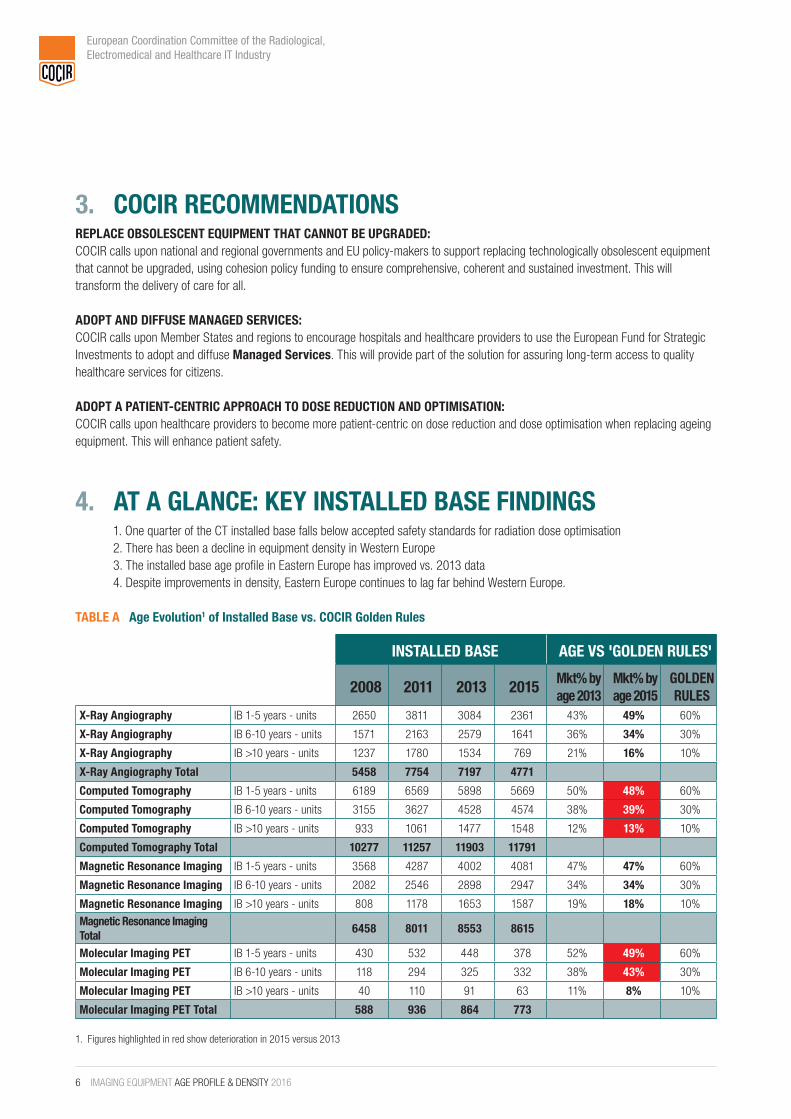
4. AT A GLANCE: KEY INSTALLED BASE FINDINGS1. One quarter of the CT installed base falls below accepted safety standards for radiation dose optimisation2. There has been a decline in equipment density in Western Europe3. The installed base age profile in Eastern Europe has improved vs. 2013 data4. Despite improvements in density, Eastern Europe continues to lag far behind Western Europe.
TABLE A Age Evolution1 of Installed Base vs. COCIR Golden Rules
1. Figures highlighted in red show deterioration in 2015 versus 2013
INSTALLED BASE AGE VS 'GOLDEN RULES'
2008 2011 2013 2015 Mkt% by age 2013
Mkt% by age 2015
GOLDEN RULES
X-Ray Angiography IB 1-5 years - units 2650 3811 3084 2361 43% 49% 60%
X-Ray Angiography IB 6-10 years - units 1571 2163 2579 1641 36% 34% 30%
X-Ray Angiography IB >10 years - units 1237 1780 1534 769 21% 16% 10%
X-Ray Angiography Total 5458 7754 7197 4771
Computed Tomography IB 1-5 years - units 6189 6569 5898 5669 50% 48% 60%
Computed Tomography IB 6-10 years - units 3155 3627 4528 4574 38% 39% 30%
Computed Tomography IB >10 years - units 933 1061 1477 1548 12% 13% 10%
Computed Tomography Total 10277 11257 11903 11791
Magnetic Resonance Imaging IB 1-5 years - units 3568 4287 4002 4081 47% 47% 60%
Magnetic Resonance Imaging IB 6-10 years - units 2082 2546 2898 2947 34% 34% 30%
Magnetic Resonance Imaging IB >10 years - units 808 1178 1653 1587 19% 18% 10%
Magnetic Resonance Imaging Total
6458 8011 8553 8615
Molecular Imaging PET IB 1-5 years - units 430 532 448 378 52% 49% 60%
Molecular Imaging PET IB 6-10 years - units 118 294 325 332 38% 43% 30%
Molecular Imaging PET IB >10 years - units 40 110 91 63 11% 8% 10%
Molecular Imaging PET Total 588 936 864 773

European Coordination Committee of the Radiological, Electromedical and Healthcare IT Industry
IMAGING EQUIPMENT AGE PROFILE & DENSITY 2016 7
5. WHY INNOVATION MATTERSInnovative medical technologies have always been a major driving force for improving healthcare quality. However, such technologies can now provide much more, driving integrated patient–centric care pathways that can improve the efficiency and productivity of healthcare. Investing in innovative products and solutions can improve medical consistency, patient safety, productivity or connectivity, or looking to maximise the use of human and financial capital.
Each year, engineering and IT advances, coupled with a greater understanding of disease at a molecular level, deliver innovation in medical technology. For the installed base of medical imaging equipment, advances are often incremental, improving current processes while extending the usefulness of medical imaging equipment. These developments often offer clinicians with unprecedented visual and functional information about their patients and faster more intelligent diagnostic imaging systems that support decision-making, reduce complexity and increase productivity.
Since these advances are often incremental, industry offers upgrades that help extend the life of equipment over a defined period. However, as equipment ages, increasing numbers of technical incompatibilities e.g. in equipment control and the redesign of components, renders updates uneconomical, even impossible.
The European Society of Radiology has recognised the clinical importance of planning for timely replacement of equipment. In 2014, it published a position paper2 on renewal, stating that; “Equipment less than five years old is state-of-the-art technology. Properly maintained equipment between six and ten years old is suitable for practice, but radiology departments should develop a strategy to replace them. Machines over ten years old must be replaced.”
The issue of ‘technological obsolescence’ can often go unnoticed; it is influenced by an imbalance between the pace of incremental innovation on the one hand and the rate of equipment replacement on the other. This forms the basis for COCIR’s ‘Golden Rules’.
A COMPUTED TOMOGRAPHYIn the case of Computed Tomography (CT) COCIR believes that the installed base should be renewed more quickly to improve patient safety. Specifically, COCIR recently identified ‘significant’ triggers in the technological, medical and regulatory areas. These include CT Dose modulation and CT Reiterative reconstruction algorithm technologies, which dramatically reduce the required X-Ray dose. For example, reductions of >50% in paediatric imaging without a loss of diagnostic quality have been published3. These software applications, available as upgrades, also improve hospital efficiency, clinical effectiveness and reduce costs.
Dose modulation technologies automatically calculate the optimum tube current for each anatomical area and the real-time current control for the X-Ray tube. This ensures patients receive the minimum dose necessary (ALARA principle – as low as reasonable achievable).
Reiterative reconstruction algorithm technologies reproduce higher dose protocol scans using raw low-dose scan data. This reduces the absorbed dose and provides higher quality images for the same exposure.
However, a quarter of the European CT installed base is too old to be upgraded with these technologies. This makes them inadequate from a dose optimisation and radiation safety perspective; they should be replaced.
This means approximately 2500 CT units in Western Europe and 500 CT units in Eastern Europe cannot be upgraded. The majority are in Poland, Germany, Italy and Spain.
2. “Renewal of radiological equipment” http://www.ncbi.nlm.nih.gov/pmc/articles/PMC4195838/ 3. C. Saidlear et al, ECR 2015 / C-1888, 2015 http://posterng.netkey.at/esr/viewing/index.php?module=viewing_poster&pi=128238

European Coordination Committee of the Radiological, Electromedical and Healthcare IT Industry
8 IMAGING EQUIPMENT AGE PROFILE & DENSITY 2016
COCIR National Trade Associations members in Italy (Assobiomedica) and in Spain (Fenin) have conducted further studies. In Italy, Assobiomedica has shown that out of 470 CT scanners in the “up to 16 slices” segment currently in use, 222 are technologically obsolete and exceed the threshold of seven years old. This poses questions over safety, efficacy and value.
In Spain, most of the CT equipment installed cannot be considered “low dose” by today’s standards. A Fenin study shows that 67% of CT scanners in use are older than five years. This is 27 percentage points higher than the COCIR Golden Rules and 17 percentage points higher than the European average.
COCIR believes that the patient benefits offered by these advances are clear and compelling. At the very least, this should drive upgrades to the current CT installed base and encourage investment in new and replacement low-dose CT technology throughout Europe.
B ADDRESSING THE FINANCIAL CHALLENGE OF IMPLEMENTING INNOVATIONSThe current delays in implementing innovative imaging technology leaves many advances stranded in manufacturers’ warehouses; irrespective of their long-term ‘value’ or ability to improve clinical outcomes.
These delays in uptake show a disconnect stemming from both short-term policy constraints and silo budgeting. In addition, many Member States view innovative medical technologies as a cost, rather than an opportunity to improve quality, efficacy, patient safety and productivity. Currently, most purchase decisions are price-driven and fail to consider any ‘incremental value’ the technology or method provides.
Hospitals and healthcare providers need access to new business models that allow the financial flexibility to secure long-term access to these innovative technologies and/or broader healthcare solutions. This is essential in accelerating implementation.
New business models, such as Managed Services, shift funding from capital expenditure to a more predictable operational expenditure, while including an element of risk-sharing. This arguably provides the financial platform to allow innovative solutions to reach more patients.
The recent Commission Expert Panel on Effective Ways of Investing in Health4 report on ‘Disruptive Innovation: Considerations for health and health care in Europe’ 5 supports this approach. It highlighted the importance of innovative financial models, such as Managed Services, in implementing and disseminating innovation. The report also suggested that these models should be considered ‘disruptive innovations’ in their own right.
Given appropriate incentives and investment, more hospitals and patients in Europe will benefit from greater efficiencies and improved outcomes afforded by ongoing advances in medical technology. The drivers of change will be universal; – increased efficiencies, increased access and improved clinical outcomes. However, adapting funding mechanisms will be also be fundamentally important.
However, the detail in this report is overshadowed by the glaring disparities between Western and Eastern Europe. This long-term challenge, to balance the current inequity, is a long-term one and highlights the significant infrastructure challenges in Eastern Europe. Clearly, Structural Funds can play a huge role here. Given the innovative trend of shifting from capital to operational budgeting for appropriating medical technology, COCIR believes it is time to relax of the current ESIF rules to support this.
4. http://ec.europa.eu/health/expert_panel/index_en.htm 5. http://ec.europa.eu/health/expert_panel/sites/expertpanel/files/012_disruptive_innovation_en.pdf

European Coordination Committee of the Radiological, Electromedical and Healthcare IT Industry
IMAGING EQUIPMENT AGE PROFILE & DENSITY 2016 9
C ADVANCES IN COMPUTED TOMOGRAPHY TECHNOLOGYOver the last 10 years, advances in CT technology have delivered enhancements for clinicians and patients.
TABLE B6 Timeline of technological advances vs. national CT dose surveys
Source: Doses from Computed Tomography (CT) Examinations in the UK – 2011 Review (PHE-CRCE-013), Shrimpton et al for Public Health England, PHE publications gateway number: 2014179
DOSES FROM COMPUTED TOMOGRAPHY (CT) EXAMINATIONS IN THE UK – 2011 REVIEW
4
FIGURE 5 Timeline showing the schedule of national CT dose surveys in relation to technological advances in CT, 1985–2014 (figure supplied by Sue Edyvean, PHE)
Jones and Shrimpton, 1991). Using data from 83% of all UK scanners, this seminal survey provided estimates of typical organ and effective doses for standard protocols and established, for the first time, both the relatively high patient doses and also the importance of CT as a source of population dose (Shrimpton and Wall, 1993). It also demonstrated significant variations in practice between CT centres for similar types of examination and hence the scope for improvement in patient protection (Shrimpton and Wall, 1992). In addition, the work underpinned the development of specific reference dose quantities for CT (Shrimpton, 1997; Shrimpton et al, 1998) and provided some initial values for Europe as part of quality criteria for CT (European Commission, 1999).
The second national CT dose survey was conducted for 2003 on the basis of data collected from a sample of 27% of all UK scanners, of which 37% were multi-detector-row CT (MDCT) scanners (Shrimpton et al, 2005, 2006, 2007). The survey included scan information in relation to both standard protocols and also individual patients and provided updated typical effective doses and national reference doses (DRLs). Wide variations in practice were still apparent between CT centres, with doses from MDCT (four+ detector-row) scanners being in general slightly higher than those from single-slice scanners, although the study did demonstrate an initial trend for reduction by 10–40% in national reference doses for some common CT procedures since the previous UK survey for 1989.
Following further significant changes in UK CT practice, including increasing numbers of examination (Figure 1) and the implementation of new technology (Figure 5) since 2003, a third national survey has been conducted for 2011 to provide updated information concerning typical doses for an expanded range of contemporary examinations and an assessment of present
A NEWER CT SCANNER HAS SEVERAL ADVANTAGES OVER ONE TEN YEARS OLDER:
> Newer, more advanced scanners enable high-resolution cardiac imaging through high spatial resolution, wide coverage and high-speed imaging. This ability to image the heart in a single beat allows improved imaging in patients with, for example, arrhythmias, elevated heart rates or atrial fibrillation. This would not be possible on earlier generation scanners7.
> One of the most important advances in CT technology is the improvements in patient safety achieved by reducing the radiation dose. Scanning patients at the lowest possible radiation dose is important, as the data suggests that high doses increase the likelihood of developing cancer. Low-dose CT scanners are particularly beneficial in higher risk populations, such as children and young females, where the higher sensitivity of growing tissues makes strict dose limitation a necessity. Cancer patients that have frequent follow-up scans benefit immensely from low-dose scanners. Improvements in dose-reduction technologies can now continually optimise dose while maintaining diagnostic image quality, while advances in data acquisition, image reconstruction and optimisation processes reduce the effective dose levels for routine CT. Techniques such as iterative reconstruction provide the same image quality at up to 82% lower radiation doses than conventional image reconstruction.
6. https://www.gov.uk/government/publications/doses-from-computed-tomography-ct-examinations-in-the-uk Contains public sector information licensed under the Open Government Licence v3.0 https://www.nationalarchives.gov.uk/doc/open-government-licence/version/3/
7. NICE DG3 guidance http://guidance.nice.org.uk/DG3

European Coordination Committee of the Radiological, Electromedical and Healthcare IT Industry
10 IMAGING EQUIPMENT AGE PROFILE & DENSITY 2016
> Other new features enable dose setting, monitoring and tracking to manage and record patient dose. For example, Dose Check allows users to set limits for every scan, alerting the user if they are prescribing a dose that is outside their usual range.
> A hospital study in the US showed that dose reduction strategies (protocols and new technology) delivered in 30% to 52% decreases in radiation exposure for the targeted body areas. [Reference: Rayo et al Journal of the American College of Radiology Volume 11, Issue 7, July 2014, Pages 703–708]
CT SCANNERS ARE BECOMING FASTER, MORE SENSITIVE AND ACCURATE WHILE OCCUPYING A SMALLER FOOTPRINT. THIS IMPROVES BOTH EFFICIENCY AND EFFECTIVENESS:
> CT scanners have been shown to reduce mortality by 20% when used for lung cancer screening in place of digital X-Ray. Lung screening requires a scanner with at least 16-slices and a 0.5 s rotation speed. All current 16-slice and above CT scanners are capable of lung screening; some of the 16-slice scanners from ten years ago are capable. The majority of scanners more than ten years ago are not 16-slice scanners and thus not capable.
> Advances in CT technology over the last 10 years have provided faster, better quality images, improving many types of examination. These include circulatory system disorders, aneurysms, blood clots, spinal conditions, kidney and bladder stones, abscesses, inflammatory conditions and head, skeletal system and internal organ injuries.
> CT scanning is increasingly used in Oncology for Radiation Therapy planning. As therapy devices become more targeted, the accuracy and image quality of CT is increasingly important. CT has also become a vital tool for physicians in tracking treatment response. It has become the “tracking tool” for monitoring any potential recurrence of cancer and for the evaluation of suspected abnormalities in other scans. For example, if an ultrasound scan shows a suspected liver mass, the next step would likely be a CT scan to better visualise the mass and to assess next steps.
> CT colonography (CTC) is a non-invasive procedure and offers a good alternative where patients cannot undergo a colonoscopy.
> Low-dose CT screening shows a 20% reduction in lung cancer mortality in high-risk patients8. CT provides the high resolution needed to detect nodules, increasing early detection in high-risk patients.
8. Reference: The National Lung Screening Trial Research Team. Reduced Lung-Cancer Mortality with Low-Dose Computed Tomographic Screening. N Engl J Med 2011;365:395-409

European Coordination Committee of the Radiological, Electromedical and Healthcare IT Industry
IMAGING EQUIPMENT AGE PROFILE & DENSITY 2016 11
IN ADDITION TO ITS GOLDEN RULES ANALYSIS, COCIR HAS CONDUCTED AN IN DEPTH ANALYSIS ON THE TWO TECHNOLOGY BREAKTHROUGHS THAT NECESSITATE A FASTER PACE OF RENEWAL TO IMPROVE PATIENT SAFETY:
CT DOSE MODULATION CT REITERATIVE RECONSTRUCTION ALGORITHMS
This shows that a quarter of the European CT installed base cannot be upgraded with these important advances. This renders them obsolete from a dose optimisation and radiation safety perspective and should be considered for replacement.
This is equivalent to approximately 2500 units in Western Europe and 500 units in Eastern Europe.
The highest levels were found in Poland, Germany, Italy and Spain9.COCIR National Trade Associations members in Italy (Assobiomedica) and in Spain (Fenin) have conducted further studies in both countries.
In Italy, Assobiomedica has shown that out of 470 CT scanners in the “up to 16 slices” segment currently in use, 222 are technologically obsolete and exceed the threshold of seven years old. This poses questions over safety, efficacy and value.
In Spain, most of the CT equipment installed cannot be considered “low dose” by today’s standards. A Fenin study shows that 67% of CT scanners in use are older than five years: 27 percentage points higher than the COCIR Golden Rules and 17 percentage points higher than the European average.
6. 2016 AGE PROFILE: DETAILED ANALYSIS OF RESULTSComparing the 2015 and historical data to the Golden Rules criteria
A COMPUTED TOMOGRAPHYCOCIR Companies participating in Age Profile reporting; GE, Hitachi, Philips, Siemens, Toshiba
EUROPE:COCIR has monitored the Age Profile of CT equipment since 1998. It began with Western Europe, subsequently expanding its coverage to include Eastern Europe.The most alarming finding is that the number of countries with more than 10% of CT machines older than ten years has trebled in the last 7 years.
Western Europe:> AGE PROFILE CONTINUES TO DECLINE
> EQUIPMENT DENSITY HAS ALSO DECLINED> Overall, the observed CT scanner age profile continues to deteriorate against the Golden Rules criteria. The percentage of
systems over five years old has increased from 40% in 2008 to 53 % in 2015.> In spite of earlier warnings, Western Europe regularly and significantly infringes COCIR’s Golden Rule that no more than
9. Tables 4,5,6

European Coordination Committee of the Radiological, Electromedical and Healthcare IT Industry
12 IMAGING EQUIPMENT AGE PROFILE & DENSITY 2016
10% of the installed base should be more than ten years old.
> The CT scanner age profiles show fall appreciably short of the Golden Rules criteria, notably in Italy, Spain, Portugal, Finland, Ireland and Greece.
> In these countries, the “six years and older” proportion of the age profile is in the range of 62% to 68% of the installed equipment. This deviates sharply from the Golden Rule of not exceeding 30%.
> Average CT density (number of systems in use per million inhabitants) in Western Europe has decreased slightly from to 24.9 in 2013 to 24.1 in 2015. Denmark (42), Austria (36.1), Germany (32.8) and Portugal (32.5) had densities greater than 30. Meanwhile Belgium, Finland, Netherlands and UK have densities lower than 20.
Central and Eastern Europe:> SLIGHT IMPROVEMENT IN BOTH AGE PROFILE AND EQUIPMENT DENSITY
> Although the overall CT equipment age profile has shown a slight improvement, it still falls short of the COCIR Golden Rules.
> The age profile in Albania, Bulgaria, Macedonia and Romania, meet or surpass the Golden Rules.
> The three Baltic countries and Ukraine also marginally improved the age profile of their equipment.
However, the age profiles in several other countries deviate from the “six years and older” Golden Rule, with Czech Republic (over 60%) and Slovenia (78%).
> The average CT density in Central and Eastern Europe increased slightly from 12.6 in 2013 to 13. However, this remains significantly lower than the Western European average. The lowest densities were in Serbia (3.9) and Ukraine (4.4).
RUSSIAN FEDERATION:In 2013, the CT equipment age profile fell just short of the Golden Rules. It has subsequently deteriorated, with the “six years and older” portion representing 40% of installed equipment.CT density is higher than the Eastern European average at 16.6.
TURKEY:The CT age profile has deteriorated since the 2011 and 2013 surveys; 60% of CT systems are now more than six years old. Average density is 14.
REST OF THE WORLD10:Brazil fails to meet the Golden Rules criteria. The proportion within the installed base deteriorated, with the percentage of machines six years and older increasing from 48% in 2013 to 56% in 2015.
10. Equipment density data does not include local vendors. Estimated COCIR coverage for CT is 98% in Russia; 90% in Greater China and 92% -94% in the Indian Subcontinent

European Coordination Committee of the Radiological, Electromedical and Healthcare IT Industry
IMAGING EQUIPMENT AGE PROFILE & DENSITY 2016 13
Data for Greater China and the Indian subcontinent also show progressive ageing of equipment.
Within the Middle East region, the Emirates (UAE), Oman, Yemen and Iraq meet COCIR Golden Rules criteria. All have shown a marked improvement since 2013.
From the Commonwealth of Independent States (CIS) countries, Azerbaijan and Uzbekistan meet the Golden Rules.
Equipment density ranges from 2.4 in the Indian Subcontinent to an average of 7.1 in the Middle East (mainly driven by 19.1 in Saudi Arabia), 9.4 in the Greater China area, 12.5 in CIS (16.6 in Russia) and 14.1 in Brazil.
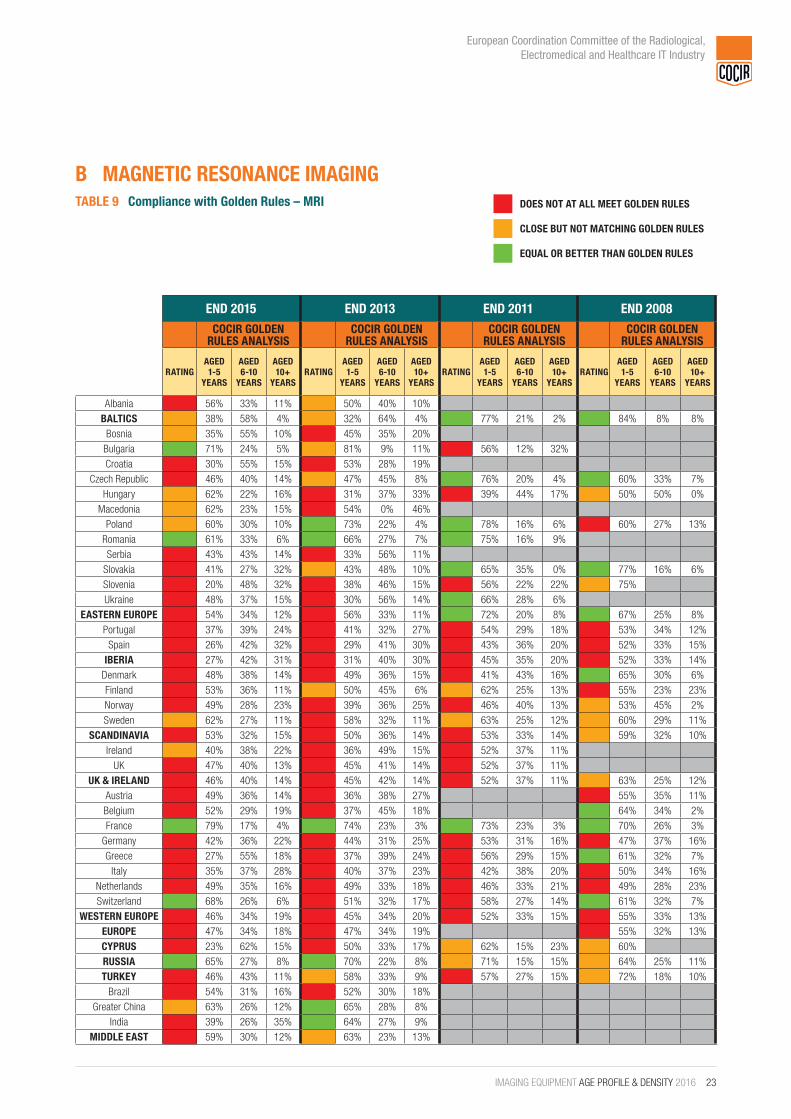
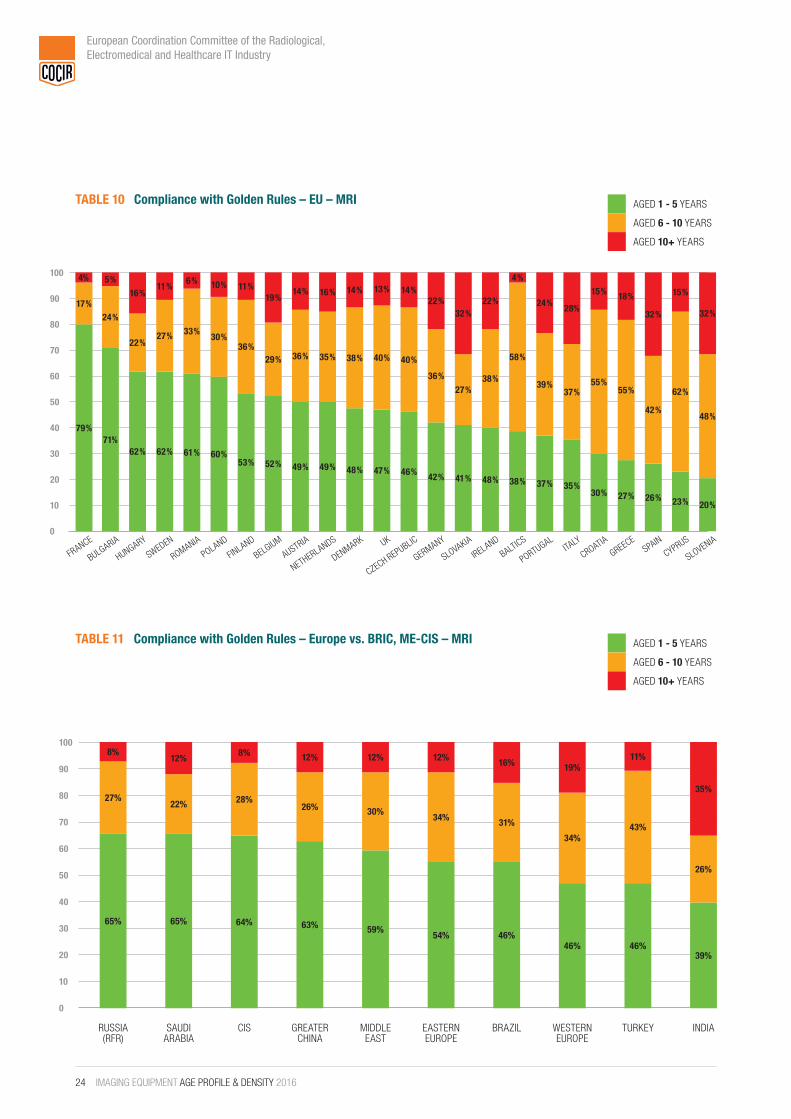
B MAGNETIC RESONANCE IMAGINGCOCIR COMPANIES PARTICIPATING IN AGE PROFILE REPORTING: GE, HITACHI, PHILIPS, SIEMENS, TOSHIBA
EUROPE:COCIR has monitored the Age Profile of MRI since 1998. It began with Western Europe, subsequently expanding its coverage to include Eastern Europe.
Western Europe:> AGE PROFILE STABLE BUT STILL NOT MEETING THE COCIR GOLDEN RULES
> EQUIPMENT DENSITY IN DECLINE
> Overall, the MRI equipment age profile does not meet the COCIR Golden Rules. The situation has not improved since previous studies. As in 2013, 54% of all installed MRI systems still exceed five years of age. One in five MRI systems is more than ten years old.
> Only France and Switzerland meet all Golden Rules criteria, with Sweden and Ireland falling just short.
> The age profile in several individual countries, Spain, Greece and Italy fail to meet the “six years and older” Golden Rule. There has been extensive ageing since the 2011 study, reaching 65% with peaks of 74%. Germany has deteriorated from 56% in 2013 to 58% in 2015.
> The average MRI density (number of systems in use per million inhabitants) in Western Europe amounted to 18.5, a slight decrease from 18.9 in 2013.
> Switzerland (43.2), Norway (29.6), Germany (29.4) Denmark (25.2), Austria (23.8), Finland (23.2) and Spain (20.2) achieved densities greater than 20.

European Coordination Committee of the Radiological, Electromedical and Healthcare IT Industry
14 IMAGING EQUIPMENT AGE PROFILE & DENSITY 2016
Central and Eastern Europe:> MARGINAL IMPROVEMENT IN AGE PROFILE AND IN EQUIPMENT DENSITY
> Only two countries, Bulgaria and Romania, meet all Golden Rules criteria
> Several countries fall just short, having improved since from 2013; the three Baltic countries, Bosnia, Hungary, Macedonia and Poland
> The average MRI density in Central and Eastern Europe has improved from 5.5 in 2013 to 6.5. However, it remains significantly below the all-European average of 15.1 systems. The lowest densities were in Serbia (1), Ukraine (1.9), Albania (3) and Slovakia (4).
RUSSIAN FEDERATION:The MRI equipment age profile in Russia has shown steady improvement since COCIR began monitoring in 2006, meeting the Golden Rules since 2013.
TURKEY:The equipment age profile has considerably deteriorated since 2013. Notably, the numbers of “six years and older” systems have increased from 42% to 54%.
REST OF THE WORLD11:Brazil fails to meet the Golden Rules and the proportion within the installed base deteriorated, even though the percentage of machines older than six years decreased slightly from 48% in 2013 to 46% in 2015.
Greater China and the Indian subcontinent met the Golden Rules in 2013; however, the 2015 figures show a slight deterioration.
Within the Middle East region, Bahrain, Emirates (UAE), Kuwait, Oman meet the COCIR Golden Rules. All have shown a marked improvement since 2013.
In the Commonwealth of Independent States (CIS) countries, only Uzbekistan meets the Golden Rules.
Equipment density ranges from 1.1 in the Indian Subcontinent to an average of 4.4 in the Middle East. This is mainly driven by the UAE (24.9) and the Lebanon (24). Greater China area achieves 3.5, CIS 5.3, driven by Russia (6.9), Brazil 9.7 and Turkey 13.1.
11. Equipment density data does not include local vendors. Estimated COCIR coverage for MRI is 94-95% in Russia; 88-89% in Greater China; 97% in the Indian Subcontinent

European Coordination Committee of the Radiological, Electromedical and Healthcare IT Industry
IMAGING EQUIPMENT AGE PROFILE & DENSITY 2016 15
C X-RAY ANGIOGRAPHYCOCIR COMPANIES PARTICIPATING IN AGE PROFILE REPORTING: GE, PHILIPS, SHIMADZU, SIEMENS, TOSHIBA
EUROPE:
Western Europe:> DETERIORATION OF AGE PROFILE
> MARKED DETERIORATION OF EQUIPMENT DENSITY
> The X-Ray Angiography equipment age profile falls a long way short of the Golden Rules criteria, with many countries deteriorating compared to their 2013 levels.
> The only countries in Western Europe to improve slightly are Finland, Ireland and the UK.
> The “six years and older” fails to meet the Golden Rules 60% criteria in a number of countries, including Italy (70%), Spain (66%), Denmark (65%), Portugal (63%).
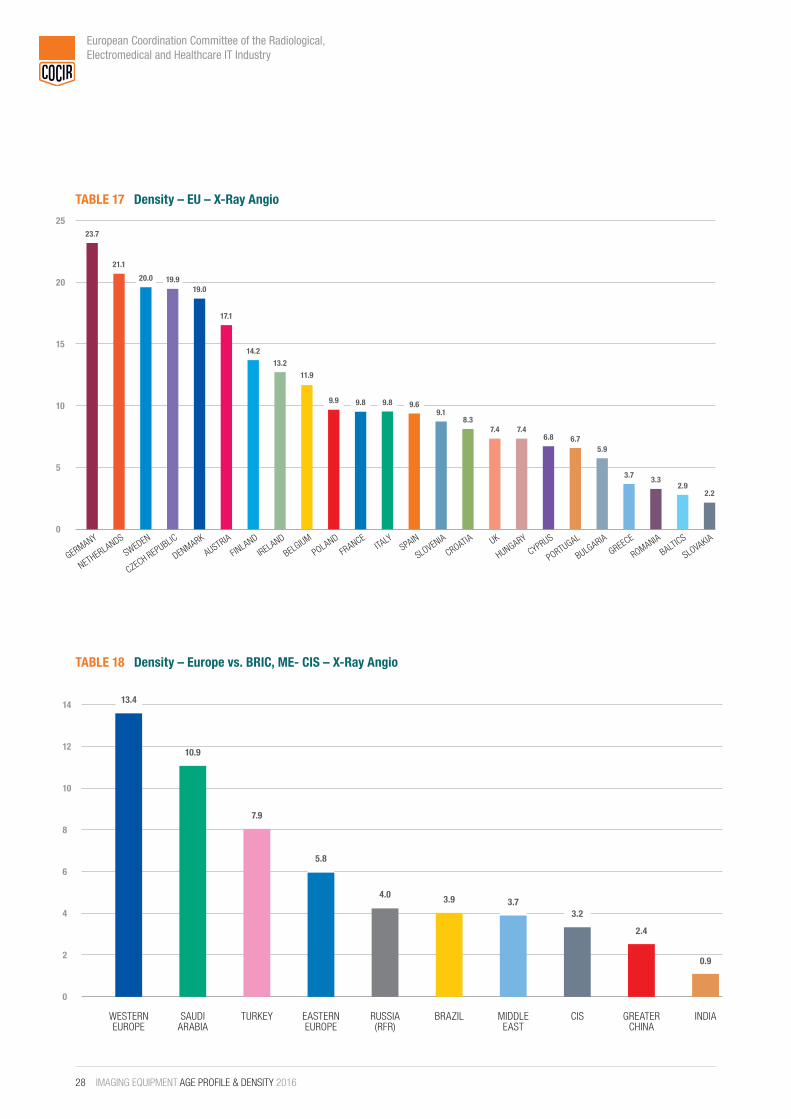
> The average X-Ray Angiography density (number of systems in use per million inhabitants) in Western Europe amounted to 13.4, deteriorating from 15.6% in 2013. There were densities of 20 or higher in Norway and Sweden (20), Netherlands (21.1) Germany (23.7) and Switzerland (25.7). France (9.8), Spain (9.6), UK (7.4) Portugal (6.7) and Greece (3.7) had densities below ten.
Central and Eastern Europe:> MARKED IMPROVEMENT OF AGE PROFILE
> SLIGHT INCREASE IN EQUIPMENT DENSITY
> Overall, the X-Ray Angiography age profile shows a marked improvement, with Albania, Croatia, Macedonia and Ukraine meeting the criteria for the Golden Rules
> Romania continues its improvement since 2011, with 75% of its Angiography systems aged five years or less
> Hungary, Serbia and Slovakia registered a slight improvement, but still fell short of the Golden Rules criteria
> The average X-Ray Angiography density in Central and Eastern Europe was 5.8, a slight increase over the 2013 level of 5.7 in 2013 and well below the all-European average of 11.2. Serbia (1), Ukraine (1.3) and Slovakia (2.2) had the lowest densities.
RUSSIAN FEDERATION:The X-Ray Angiography age profile has deteriorated sharply, with the percentage of “six years and older” systems increasing from 32% to 40%.

European Coordination Committee of the Radiological, Electromedical and Healthcare IT Industry
16 IMAGING EQUIPMENT AGE PROFILE & DENSITY 2016
TURKEY:The X-Ray Angiography age profile has increased, falling well short of the Golden Rules criteria. The “six years and older” segment of the installed equipment increased from 56% in 2013 to 57%.
REST OF THE WORLD12:Brazil fails to meet the Golden Rules criteria. The percentage of machines “6 years and older” increased from 43% (2013) to 49% (2015).
Greater China continues its improvement since 2013, with 65% of its X-Ray angiography systems now five years old or less.
The Indian subcontinent met the Golden Rules in 2013, but has deteriorated since then, with 2015 figures showing the percentage of “six years and older” systems increasing from 38% to 66%.
In the Middle East region, Bahrain, UAE, Oman and Yemen meet the Golden Rules criteria. The latter shows a marked improvement over 2013.
In the Commonwealth of Independent States (CIS) countries, Azerbaijan, Kazakhstan and Uzbekistan comply with the Golden Rules.
Equipment Density ranges from 0.9 in the Indian Subcontinent to 2.4 in the Greater China area, 3.2 in CIS (driven by 4.0 in Russia). Average in the Middle East is 3.7, driven by Lebanon (20.1) and UAE (20.6), Brazil (3.9) and Turkey (7.9).
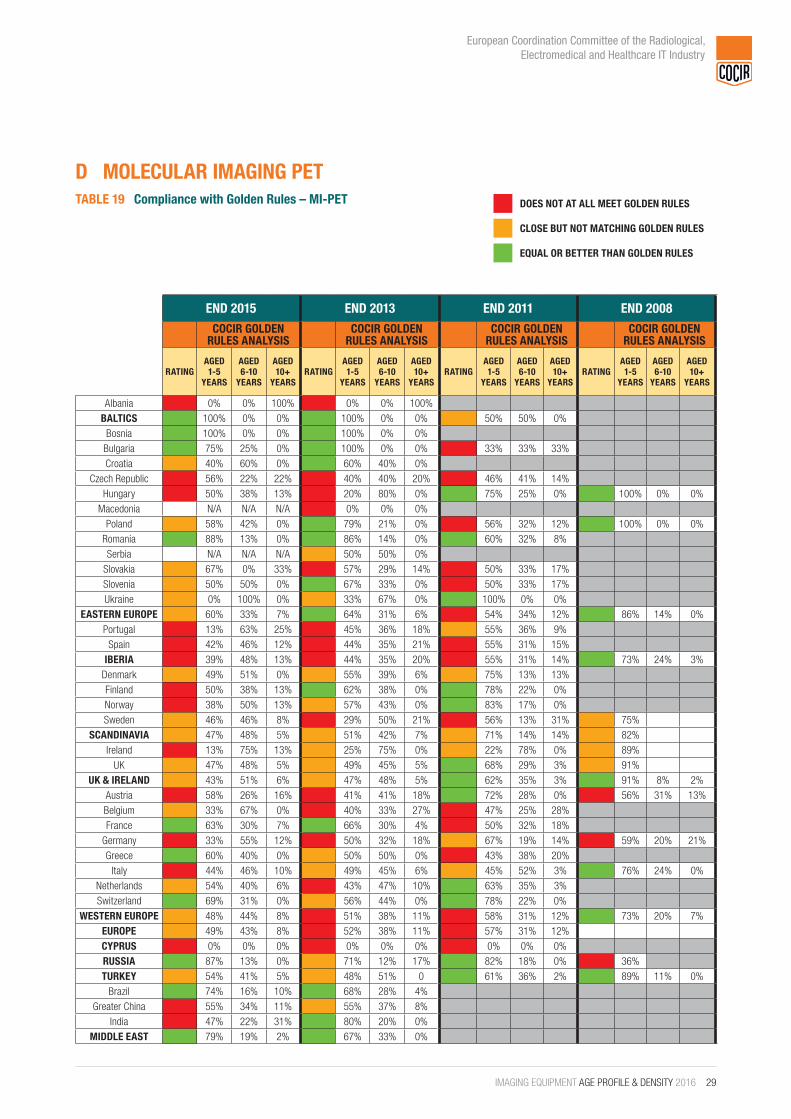
D MOLECULAR IMAGING PET
EUROPE:COCIR COMPANIES PARTICIPATING IN AGE PROFILE REPORTING: GE, PHILIPS, SIEMENS
Western Europe:> SLIGHT IMPROVEMENT IN AGE PROFILE
> DECREASE IN EQUIPMENT DENSITY
> Overall, the MI-PET equipment age profile has improved slightly since 2013, with a slight improvement in meeting the Golden Rules criteria.
> France and Greece have substantially renewed their installed base with 63% and 60% (respectively) currently aged five years or less
> Sweden, UK, Belgium and Netherlands also show a moderate amount renewal, however they still fail to meet the Golden Rules criteria
> The age profiles of a number of countries, notably Norway (63%), Germany (67%), Ireland and Portugal (both 88%), show extensive ageing since 2013 and now deviate markedly from the “six years and older” Rule
12. Equipment density data does not include local vendors. Estimated COCIR coverage for X-Ray Angio is 98-99% in Russia; 98% in Greater China; 98% in the Indian Subcontinent

European Coordination Committee of the Radiological, Electromedical and Healthcare IT Industry
IMAGING EQUIPMENT AGE PROFILE & DENSITY 2016 17
> The average MI-PET density (number of systems in use per million inhabitants) for Western Europe is 1.7, a small decrease from 1.9 in 2013
> Denmark (6.3) and Switzerland (3.9) have the highest MI-PET densities.
Central and Eastern Europe:> SLIGHT DETERIORATION OF AGE PROFILE> EQUIPMENT DENSITY STABLE
> The MI-PET equipment age profile has deteriorated slightly since 2013 and now fails to meet the Golden Rules criteria
> The few Eastern European countries that still meet the criteria are: the three Baltic countries, Bosnia, Bulgaria and Romania
> A number of other countries have deteriorated since 2013. Hungary, Slovenia and Croatia, at 50% and above of the installed base, fall significantly short of the “six years and older” Rule
> The average Central and Eastern European MI-PET density is 0.4 (the same as 2013), only a quarter of that of Western Europe.
RUSSIAN FEDERATION:The MI-PET equipment age profile has improved remarkably, with 87% of systems less than five years old. Average density is 0.4, in line with Central and Eastern Europe.
TURKEY:Turkey continues to fall short of the Golden Rules criteria. However, it has improved, with systems aged five years or less increasing from 48% in 2013 to 54% in 2015. Average density is 1.7, in line with Western Europe.
REST OF THE WORLD13:Brazil continues to meet Golden Rules criteria. It is also improving, with systems aged five years or less increasing from 68% in 2013 to 74% in 2015.
Equipment in Greater China and the Indian subcontinent is deteriorating and progressively ageing.
Within the Middle East region, most countries meet the Golden Rules criteria, with the exception of Yemen, Syria and Israel.
In the Commonwealth of Independent States (CIS) countries, Belarus and Uzbekistan meet the Golden Rules criteria.
Equipment Density in the Indian Subcontinent is 0.14, 0.21 in Greater China and 0.25 in the Middle East (driven by 0.59 in Saudi Arabia), reaching 0.6 in Brazil.
13. Equipment density data does not include local vendors. Estimated COCIR coverage for MI-PET is 99% in Russia; 97% in Greater China; 100% in the Indian Subcontinent

European Coordination Committee of the Radiological, Electromedical and Healthcare IT Industry
18 IMAGING EQUIPMENT AGE PROFILE & DENSITY 2016
7. ANNEX 1: DETAILED RESULTS
A COMPUTED TOMOGRAPHY
TABLE 1 COMPLIANCE WITH GOLDEN RULES – CT DOES NOT AT ALL MEET GOLDEN RULES
CLOSE BUT NOT MATCHING GOLDEN RULES
EQUAL OR BETTER THAN GOLDEN RULES
END 2015 END 2013 END 2011 END 2008
COCIR GOLDEN RULES ANALYSIS
COCIR GOLDEN RULES ANALYSIS
COCIR GOLDEN RULES ANALYSIS
COCIR GOLDEN RULES ANALYSIS
RATINGAGED1-5
YEARS
AGED6-10
YEARS
AGED 10+
YEARSRATING
AGED1-5
YEARS
AGED6-10
YEARS
AGED 10+
YEARSRATING
AGED1-5
YEARS
AGED6-10
YEARS
AGED 10+
YEARSRATING
AGED1-5
YEARS
AGED6-10
YEARS
AGED 10+
YEARS
Albania 61% 29% 10% 65% 22% 12%
BALTICS 64% 23% 13% 43% 47% 9% 68% 24% 8% 70% 26% 4%
Bosnia 51% 36% 13% 46% 40% 14%
Bulgaria 67% 28% 5% 76% 16% 8% 33% 52% 15% 52% 24% 24%
Croatia 40% 47% 14% 34% 43% 24%
Czech Republic 35% 49% 16% 46% 38% 16% 66% 22% 12% 60% 30% 9%
Hungary 58% 19% 22% 41% 42% 17% 43% 52% 5% 52% 43% 6%
Macedonia 72% 20% 8% 61% 21% 18%
Poland 52% 34% 14% 61% 33% 6% 68% 27% 5% 69% 22% 9%
Romania 61% 34% 5% 66% 27% 6% 79% 17% 4% 70% 20% 11%
Serbia 46% 39% 14% 36% 44% 20%
Slovakia 42% 38% 20% 48% 40% 11% 62% 28% 10% 55% 27% 18%
Slovenia 22% 51% 27% 26% 51% 23% 52% 24% 24% 52% 22% 26%
Ukraine 54% 36% 10% 51% 36% 14% 66% 26% 8% 54% 13% 33%
EASTERN EUROPE 52% 35% 13% 54% 35% 11% 66% 26% 8% 63% 24% 13%
Portugal 38% 43% 19% 45% 43% 12% 52% 38% 10% 64% 29% 7%
Spain 35% 46% 19% 35% 41% 24% 50% 33% 17% 54% 32% 15%
IBERIA 36% 45% 19% 38% 42% 21% 50% 34% 16% 56% 31% 13%
Denmark 61% 35% 3% 63% 31% 6% 67% 27% 6% 63% 31% 6%
Finland 36% 48% 17% 45% 44% 11% 63% 28% 9%
Norway 53% 37% 10% 42% 46% 12% 51% 43% 6% 63% 31% 7%
Sweden 55% 38% 7% 61% 31% 8% 63% 34% 4%
SCANDINAVIA 54% 38% 8% 55% 37% 9% 61% 33% 6% 60% 35% 5%
Ireland 34% 51% 15% 34% 55% 11% 57% 37% 5% 72% 24% 4%
UK 54% 38% 8% 44% 46% 10% 62% 36% 1% 60% 36% 4%
UK & IRELAND 52% 40% 9% 43% 47% 10% 62% 37% 2% 61% 35% 4%
Austria 43% 44% 12% 39% 45% 16% 52% 36% 12% 59% 32% 9%
Belgium 55% 37% 8% 49% 43% 8% 25% 72% 3% 70% 27% 3%
France 70% 26% 4% 71% 26% 4% 71% 27% 3% 73% 25% 2%
Germany 45% 42% 13% 49% 39% 12% 60% 31% 9% 58% 31% 12%
Greece 32% 51% 17% 38% 43% 19% 62% 28% 10% 62% 30% 8%
Italy 36% 43% 21% 43% 40% 18% 49% 35% 16% 53% 35% 12%
Netherlands 47% 35% 18% 50% 39% 11% 50% 40% 10% 62% 35% 3%
Switzerland 57% 36% 7% 52% 39% 9% 59% 38% 4% 71% 27% 2%
WESTERN EUROPE 47% 40% 13% 49% 39% 13% 56% 35% 9% 60% 31% 9%
EUROPE 48% 39% 13% 50% 38% 13% 57% 34% 9% 60% 31% 9%
CYPRUS 50% 31% 19% 29% 43% 29% 47% 47% 5% 67%
RUSSIA 60% 28% 13% 68% 22% 10% 66% 19% 14% 58% 23% 19%
TURKEY 40% 47% 13% 48% 42% 10% 60% 25% 16% 72% 13% 14%
Brazil 44% 33% 24% 52% 29% 19%
Greater China 56% 28% 16% 54% 32% 14%
India 51% 23% 25% 51% 41% 8%
MIDDLE EAST 56% 32% 11% 58% 27% 15%

10
20
30
40
50
60
70
80
90
100
0
FRANCE
BULGARIA
BALTICS
DENMARK
ROMANIA
HUNGARY
SWEDEN
BELGIUM UK
POLAND
CYPRUS
NETHERLANDS
GERMANY
AUSTRIA
SLOVAKIA
CROATIA
PORTUGALITA
LY
FINLANDSPAIN
IRELANDGREECE
SLOVENIA
CZECH REPUBLIC
10
20
30
40
50
60
70
80
90
100
0
RUSSIA (RFR)
CIS MIDDLE EAST
GREATER CHINA
SAUDI ARABIA
EASTERN EUROPE
INDIA WESTERN EUROPE
BRAZIL TURKEY
European Coordination Committee of the Radiological, Electromedical and Healthcare IT Industry
IMAGING EQUIPMENT AGE PROFILE & DENSITY 2016 19
TABLE 2 COMPLIANCE WITH GOLDEN RULES – EU – CT
TABLE 3 COMPLIANCE WITH GOLDEN RULES – EUROPE VS. BRIC, ME-CIS – CT
AGED 1 - 5 YEARS
AGED 6 - 10 YEARS
AGED 10+ YEARS
AGED 1 - 5 YEARS
AGED 6 - 10 YEARS
AGED 10+ YEARS
67% 64 % 61 % 58 % 60 % 55 % 55 % 54 % 52 % 50 % 47 % 45 % 43 % 42 % 40 % 38 % 36 % 36 % 35 % 35 % 34 % 32 %22 %
28 %23 %
35 % 34 %
19 %
38 % 37 % 38 %34 %
31 % 35 % 42 % 44 %38 % 47 %
43 % 43 % 48 % 46 % 49 % 51 % 51 %
51 %
5 %4%13%
3 % 5 %
22 %
7 % 8 % 8 %14 %
19 % 18 %13 % 12 %
20 %14 %
19 % 21 % 17% 19 % 16 % 15 % 17 %27 %
26 %
70 %
60% 59% 56% 56% 53% 52% 51% 47% 44% 40%
28% 28% 32%28% 34% 35%
23%40%
33%47%
13% 13% 11%16% 13% 13%
25%
13%
24%
13%

European Coordination Committee of the Radiological, Electromedical and Healthcare IT Industry
20 IMAGING EQUIPMENT AGE PROFILE & DENSITY 2016
0
1000
1500
500
2500
2000
3000
3500
4000
4500
TABLE 4 Units CT – EUROPE
TABLE 5 Units CT – WESTERN EUROPE
ITALY 25%
PORTUGAL 5%
SPAIN 14%
DENMARK 4%
FINLAND 1%NORWAY 1%SWEDEN 1%IRELAND 0%
UK 7%
AUSTRIA 3%BELGIUM 2%
FRANCE 5%
NETHERLANDS 2%
GREECE 4%
GERMANY 26%
EASTERN EUROPE
WESTERN EUROPE
EUROPE
CT UNITS THAT CAN BE UPGRADED
CT UNITS THAT HAVE TO BE
REPLACED

European Coordination Committee of the Radiological, Electromedical and Healthcare IT Industry
IMAGING EQUIPMENT AGE PROFILE & DENSITY 2016 21
TABLE 6 Units CT – EASTERN EUROPE
TABLE 7 Density – EU – CT
POLAND 40%
HUNGARY 6%
CROATIA 1%
BULGARIA 9%SLOVENIA 4%
SLOVAKIA 10%
ROMANIA 18%
CZECH REPUBLIC 12%
5
10
15
20
25
30
35
40
0
DENMARK
AUSTRIA
GERMANY
PORTUGAL
GREECEITA
LY
SWEDEN
CZECH REPUBLIC
CYPRUS
FRANCESPAIN
IRELAND
POLAND
FINLAND
BULGARIA
SLOVENIA
HUNGARY
NETHERLANDS
BELGIUM
SLOVAKIA
BALTICS
CROATIA
ROMANIA UK
42.0
36.1
32.8 32.5
27.826.2
24.523.0 22.2 22.2
21.520.3 20.0 19.2
18.6 18.6
15.5 15.314.5 14.0 13.3 13.0 13.0
11.6

European Coordination Committee of the Radiological, Electromedical and Healthcare IT Industry
22 IMAGING EQUIPMENT AGE PROFILE & DENSITY 2016
TABLE 8 Density – Europe vs. BRIC, ME- CIS – CT
5
10
15
20
25
0
WESTERN EUROPE
24.1
SAUDI ARABIA
19.1
RUSSIA (RFR)
16.6
BRAZIL
14.1
TURKEY
14.0
EASTERN EUROPE
13.0
CIS
12.5
GREATER CHINA
9.4
MIDDLE EAST
7.1
INDIA
2.4
European Coordination Committee of the Radiological, Electromedical and Healthcare IT Industry
IMAGING EQUIPMENT AGE PROFILE & DENSITY 2016 23
B MAGNETIC RESONANCE IMAGINGTABLE 9 Compliance with Golden Rules – MRI DOES NOT AT ALL MEET GOLDEN RULES
CLOSE BUT NOT MATCHING GOLDEN RULES
EQUAL OR BETTER THAN GOLDEN RULES
END 2015 END 2013 END 2011 END 2008
COCIR GOLDEN RULES ANALYSIS
COCIR GOLDEN RULES ANALYSIS
COCIR GOLDEN RULES ANALYSIS
COCIR GOLDEN RULES ANALYSIS
RATINGAGED1-5
YEARS
AGED6-10
YEARS
AGED 10+
YEARSRATING
AGED1-5
YEARS
AGED6-10
YEARS
AGED 10+
YEARSRATING
AGED1-5
YEARS
AGED6-10
YEARS
AGED 10+
YEARSRATING
AGED1-5
YEARS
AGED6-10
YEARS
AGED 10+
YEARS
Albania 56% 33% 11% 50% 40% 10%
BALTICS 38% 58% 4% 32% 64% 4% 77% 21% 2% 84% 8% 8%
Bosnia 35% 55% 10% 45% 35% 20%
Bulgaria 71% 24% 5% 81% 9% 11% 56% 12% 32%
Croatia 30% 55% 15% 53% 28% 19%
Czech Republic 46% 40% 14% 47% 45% 8% 76% 20% 4% 60% 33% 7%
Hungary 62% 22% 16% 31% 37% 33% 39% 44% 17% 50% 50% 0%
Macedonia 62% 23% 15% 54% 0% 46%
Poland 60% 30% 10% 73% 22% 4% 78% 16% 6% 60% 27% 13%
Romania 61% 33% 6% 66% 27% 7% 75% 16% 9%
Serbia 43% 43% 14% 33% 56% 11%
Slovakia 41% 27% 32% 43% 48% 10% 65% 35% 0% 77% 16% 6%
Slovenia 20% 48% 32% 38% 46% 15% 56% 22% 22% 75%
Ukraine 48% 37% 15% 30% 56% 14% 66% 28% 6%
EASTERN EUROPE 54% 34% 12% 56% 33% 11% 72% 20% 8% 67% 25% 8%
Portugal 37% 39% 24% 41% 32% 27% 54% 29% 18% 53% 34% 12%
Spain 26% 42% 32% 29% 41% 30% 43% 36% 20% 52% 33% 15%
IBERIA 27% 42% 31% 31% 40% 30% 45% 35% 20% 52% 33% 14%
Denmark 48% 38% 14% 49% 36% 15% 41% 43% 16% 65% 30% 6%
Finland 53% 36% 11% 50% 45% 6% 62% 25% 13% 55% 23% 23%
Norway 49% 28% 23% 39% 36% 25% 46% 40% 13% 53% 45% 2%
Sweden 62% 27% 11% 58% 32% 11% 63% 25% 12% 60% 29% 11%
SCANDINAVIA 53% 32% 15% 50% 36% 14% 53% 33% 14% 59% 32% 10%
Ireland 40% 38% 22% 36% 49% 15% 52% 37% 11%
UK 47% 40% 13% 45% 41% 14% 52% 37% 11%
UK & IRELAND 46% 40% 14% 45% 42% 14% 52% 37% 11% 63% 25% 12%
Austria 49% 36% 14% 36% 38% 27% 55% 35% 11%
Belgium 52% 29% 19% 37% 45% 18% 64% 34% 2%
France 79% 17% 4% 74% 23% 3% 73% 23% 3% 70% 26% 3%
Germany 42% 36% 22% 44% 31% 25% 53% 31% 16% 47% 37% 16%
Greece 27% 55% 18% 37% 39% 24% 56% 29% 15% 61% 32% 7%
Italy 35% 37% 28% 40% 37% 23% 42% 38% 20% 50% 34% 16%
Netherlands 49% 35% 16% 49% 33% 18% 46% 33% 21% 49% 28% 23%
Switzerland 68% 26% 6% 51% 32% 17% 58% 27% 14% 61% 32% 7%
WESTERN EUROPE 46% 34% 19% 45% 34% 20% 52% 33% 15% 55% 33% 13%
EUROPE 47% 34% 18% 47% 34% 19% 55% 32% 13%
CYPRUS 23% 62% 15% 50% 33% 17% 62% 15% 23% 60%
RUSSIA 65% 27% 8% 70% 22% 8% 71% 15% 15% 64% 25% 11%
TURKEY 46% 43% 11% 58% 33% 9% 57% 27% 15% 72% 18% 10%
Brazil 54% 31% 16% 52% 30% 18%
Greater China 63% 26% 12% 65% 28% 8%
India 39% 26% 35% 64% 27% 9%
MIDDLE EAST 59% 30% 12% 63% 23% 13%
10
20
30
40
50
60
70
80
90
100
0
FRANCE
BULGARIA
HUNGARY
SWEDEN
ROMANIA
POLAND
FINLAND
BELGIUM
AUSTRIA
NETHERLANDS
DENMARK UK
CZECH REPUBLIC
GERMANY
SLOVAKIA
IRELAND
BALTICS
PORTUGALITA
LY
CROATIA
GREECESPAIN
CYPRUS
SLOVENIA
10
20
30
40
50
60
70
80
90
100
0
RUSSIA (RFR)
SAUDI ARABIA
CIS GREATER CHINA
MIDDLE EAST
EASTERN EUROPE
BRAZIL WESTERN EUROPE
TURKEY INDIA
European Coordination Committee of the Radiological, Electromedical and Healthcare IT Industry
24 IMAGING EQUIPMENT AGE PROFILE & DENSITY 2016
TABLE 10 Compliance with Golden Rules – EU – MRI
TABLE 11 Compliance with Golden Rules – Europe vs. BRIC, ME-CIS – MRI
AGED 1 - 5 YEARS
AGED 6 - 10 YEARS
AGED 10+ YEARS
AGED 1 - 5 YEARS
AGED 6 - 10 YEARS
AGED 10+ YEARS
71%62 % 62 % 61 % 60 %
53 % 52 % 49 % 49 % 48 % 47 % 46 % 42 % 41 % 48 % 38 % 37 % 35 %30 % 27 % 26 % 23 % 20 %
24 %
22 %27 % 33 %
30 %36 %
29 % 36 % 35 % 38 % 40 % 40 %
36 %
27 %38 %
58 %
39 %37 %
55 %55 %
42 %
62 %
48 %
5 %4%
16 %11 %
6 % 10 % 11 %19 %
14 % 16 % 14 % 13 % 14 %22 %
32 %22 %
4 %
24 % 28%
15 % 18 %
32 %
15 %
32 %17 %
79 %
65% 65% 64% 63% 59%54% 46%
46% 46%39%
27%22% 28%
26% 30%34% 31%
34%43%
26%
8%12%
8% 12% 12% 12% 16% 19%11%
35%

European Coordination Committee of the Radiological, Electromedical and Healthcare IT Industry
IMAGING EQUIPMENT AGE PROFILE & DENSITY 2016 25
TABLE 12 Density – EU – MRI
TABLE 13 Density – Europe vs. BRIC, ME- CIS – MRI
5
10
15
20
25
30
0
GERMANY
DENMARK
AUSTRIA
FINLANDSPAIN
SWEDEN
IRELAND
NETHERLANDSITA
LY
PORTUGAL
GREECE
FRANCE
SLOVENIA
POLAND
CYPRUS
CZECH REPUBLIC
CROATIA UK
HUNGARY
BELGIUM
ROMANIA
BALTICS
BULGARIA
SLOVAKIA
29.4
25.7
23.823.2
20.2
18.4
16.715.9
14.8 14.5 14.1 13.8
12.611.9
11.1 10.7 10.5 10.2
7.97.3
6.55.9
4.1 4.0
2
4
6
8
10
12
14
16
18
0
WESTERN EUROPE
18.5
TURKEY
13.1
SAUDI ARABIA
12.0
BRAZIL
9.7
RUSSIA (RFR)
6.9
EASTERN EUROPE
6.5
CIS
5.3
MIDDLE EAST
4.4
GREATER CHINA
3.5
INDIA
1.1

European Coordination Committee of the Radiological, Electromedical and Healthcare IT Industry
26 IMAGING EQUIPMENT AGE PROFILE & DENSITY 2016
C X-RAY ANGIOGRAPHYTABLE 14 Compliance with Golden Rules – X-Ray Angiography DOES NOT AT ALL MEET GOLDEN RULES
CLOSE BUT NOT MATCHING GOLDEN RULES
EQUAL OR BETTER THAN GOLDEN RULES
END 2015 END 2013 END 2011 END 2008
COCIR GOLDEN RULES ANALYSIS
COCIR GOLDEN RULES ANALYSIS
COCIR GOLDEN RULES ANALYSIS
COCIR GOLDEN RULES ANALYSIS
RATINGAGED1-5
YEARS
AGED6-10
YEARS
AGED 10+
YEARSRATING
AGED1-5
YEARS
AGED6-10
YEARS
AGED 10+
YEARSRATING
AGED1-5
YEARS
AGED6-10
YEARS
AGED 10+
YEARSRATING
AGED1-5
YEARS
AGED6-10
YEARS
AGED 10+
YEARS
Albania 88% 13% 0% 54% 31% 15%
BALTICS 33% 50% 17% 37% 47% 16% 45% 39% 16% 60% 27% 13%
Bosnia 46% 38% 15% 27% 36% 36%
Bulgaria 59% 32% 10% 63% 31% 6% 50% 23% 27%
Croatia 73% 19% 8% 45% 25% 30%
Czech Republic 57% 28% 15% 49% 30% 22% 53% 27% 20% 37% 33% 31%
Hungary 66% 14% 21% 31% 49% 20% 28% 41% 31% 51% 27% 22%
Macedonia 82% 12% 6% 59% 18% 23%
Poland 54% 28% 18% 48% 39% 13% 58% 31% 12% 64% 25% 11%
Romania 75% 25% 0% 63% 31% 6% 75% 19% 6% 55% 21% 24%
Serbia 29% 71% 0% 29% 56% 15%
Slovakia 33% 58% 8% 24% 35% 41% 43% 27% 30%
Slovenia 22% 67% 11% 32% 29% 39% 33% 56% 11%
Ukraine 65% 28% 7% 46% 46% 9% 75% 18% 7% 71%
EASTERN EUROPE 58% 28% 14% 45% 37% 17% 55% 30% 16% 54% 27% 19%
Portugal 38% 28% 35% 29% 37% 34% 41% 22% 37% 41% 26% 33%
Spain 34% 39% 27% 33% 37% 29% 45% 26% 29% 51% 29% 19%
IBERIA 35% 37% 28% 33% 37% 30% 44% 25% 30% 50% 29% 21%
Denmark 35% 48% 17% 31% 60% 9% 63% 21% 16%
Finland 52% 41% 7% 48% 45% 7% 59% 30% 11%
Norway 40% 45% 14% 42% 35% 23% 46% 27% 28% 56% 21% 23%
Sweden 53% 36% 11% 45% 35% 20% 47% 30% 23% 44% 36% 20%
SCANDINAVIA 46% 41% 13% 41% 44% 15% 52% 27% 21% 49% 31% 20%
Ireland 56% 36% 8% 32% 36% 31% 36% 45% 19% 59% 29% 13%
UK 52% 43% 5% 41% 40% 19% 44% 34% 22% 56% 28% 16%
UK & IRELAND 52% 42% 6% 40% 40% 20% 43% 35% 22% 56% 28% 15%
Austria 52% 38% 11% 34% 42% 24% 51% 23% 26% 47% 27% 27%
Belgium 48% 28% 23% 40% 30% 30% 41% 27% 32% 42% 35% 23%
France 51% 34% 15% 47% 35% 18% 50% 27% 23% 43% 29% 28%
Germany 54% 33% 14% 47% 30% 22% 52% 26% 21% 48% 26% 26%
Greece 45% 33% 23% 23% 39% 39% 39% 30% 30% 37% 39% 25%
Italy 30% 34% 35% 40% 36% 25% 44% 29% 28% 43% 35% 22%
Netherlands 48% 35% 16% 44% 38% 18% 60% 18% 22% 52% 22% 26%
Switzerland 49% 38% 13% 40% 40% 20% 46% 33% 21% 53% 26% 21%
WESTERN EUROPE 47% 36% 17% 42% 36% 22% 49% 28% 24% 48% 29% 23%
EUROPE 49% 34% 17% 43% 36% 21%
CYPRUS 63% 13% 25% 38% 25% 38% 49% 28% 23%
RUSSIA 60% 27% 13% 69% 20% 11% 38% 25% 38% 56% 29% 15%
TURKEY 43% 43% 14% 44% 45% 12% 64% 18% 17% 63% 17% 21%
Brazil 51% 24% 25% 57% 24% 19%
Greater China 65% 25% 10% 61% 29% 10%
India 34% 20% 46% 62% 31% 8%
MIDDLE EAST 64% 24% 12% 51% 34% 16%

10
20
30
40
50
60
70
80
90
100
0
ROMANIA
CROATIA
HUNGARY
CYPRUS
BULGARIA
CZECH REPUBLIC
IRELAND
POLAND
GERMANY
SWEDEN
FINLAND
AUSTRIA UK
FRANCE
BELGIUM
NETHERLANDS
GREECE
PORTUGAL
DENMARKSPAIN
SLOVAKIA
BALTICSITA
LY
SLOVENIA
10
20
30
40
50
60
70
80
90
100
0
GREATER CHINA
MIDDLE EAST
SAUDI ARABIA
CIS RUSSIA (RFR)
EASTERN EUROPE
BRAZIL WESTERN EUROPE
TURKEY INDIA
European Coordination Committee of the Radiological, Electromedical and Healthcare IT Industry
IMAGING EQUIPMENT AGE PROFILE & DENSITY 2016 27
TABLE 15 Compliance with Golden Rules – EU – X-Ray Angiography
TABLE 16 Compliance with Golden Rules – Europe vs. BRIC, ME-CIS – X-Ray Angio
AGED 1 - 5 YEARS
AGED 6 - 10 YEARS
AGED 10+ YEARS
AGED 1 - 5 YEARS
AGED 6 - 10 YEARS
AGED 10+ YEARS
73%66 % 63 % 59 % 57 % 56 % 54 % 54 % 53 % 52 % 52 % 52 % 51 % 48 % 48 % 45 %
38 % 35 % 34 % 33 % 33 % 30 %22 %
19 %
14 %13 %
32 %28 %
36 %
28 %33 % 36 % 41 %
38 %43 %
34 %
28 %35 %
33 %
28 %
48 %
39 %
58 %50 %
34 %
67 %
8 %
0%
21 % 25 %
10 %15 %
8 %18 %
14 % 11 %7 %
11 %5 %
15 %23 %
16 %23 %
35 %
17%
27 %
8 %17 %
35 %
11 %
75 %
25 %
65% 64% 63% 62% 60% 58%51% 47% 43%
34%
25% 24%22% 26% 27% 28%
24%36% 43%
20%
10% 12% 15% 12% 13% 14%
25%17% 14%
46%
European Coordination Committee of the Radiological, Electromedical and Healthcare IT Industry
28 IMAGING EQUIPMENT AGE PROFILE & DENSITY 2016
5
10
15
20
25
0
TABLE 17 Density – EU – X-Ray Angio
TABLE 18 Density – Europe vs. BRIC, ME- CIS – X-Ray Angio
GERMANY
NETHERLANDS
SWEDEN
CZECH REPUBLIC
DENMARK
AUSTRIA
FINLAND
IRELAND
BELGIUM
POLAND
FRANCEITA
LYSPAIN
SLOVENIA
CROATIA UK
HUNGARY
CYPRUS
PORTUGAL
BULGARIA
GREECE
BALTICS
ROMANIA
SLOVAKIA
23.7
21.1
20.0 19.919.0
17.1
14.2
13.2
11.9
9.9 9.8 9.8 9.69.1
8.37.4 7.4
6.8 6.75.9
3.7 3.32.9
2.2
2
4
6
8
10
12
14
0
WESTERN EUROPE
SAUDI ARABIA
10.9
TURKEY
7.9
13.4
EASTERN EUROPE
5.8
RUSSIA (RFR)
4.0
BRAZIL
3.9
MIDDLE EAST
3.7
CIS
3.2
GREATER CHINA
2.4
INDIA
0.9
European Coordination Committee of the Radiological, Electromedical and Healthcare IT Industry
IMAGING EQUIPMENT AGE PROFILE & DENSITY 2016 29
D MOLECULAR IMAGING PET TABLE 19 Compliance with Golden Rules – MI-PET DOES NOT AT ALL MEET GOLDEN RULES
CLOSE BUT NOT MATCHING GOLDEN RULES
EQUAL OR BETTER THAN GOLDEN RULES
END 2015 END 2013 END 2011 END 2008
COCIR GOLDEN RULES ANALYSIS
COCIR GOLDEN RULES ANALYSIS
COCIR GOLDEN RULES ANALYSIS
COCIR GOLDEN RULES ANALYSIS
RATINGAGED1-5
YEARS
AGED6-10
YEARS
AGED 10+
YEARSRATING
AGED1-5
YEARS
AGED6-10
YEARS
AGED 10+
YEARSRATING
AGED1-5
YEARS
AGED6-10
YEARS
AGED 10+
YEARSRATING
AGED1-5
YEARS
AGED6-10
YEARS
AGED 10+
YEARS
Albania 0% 0% 100% 0% 0% 100%
BALTICS 100% 0% 0% 100% 0% 0% 50% 50% 0%
Bosnia 100% 0% 0% 100% 0% 0%
Bulgaria 75% 25% 0% 100% 0% 0% 33% 33% 33%
Croatia 40% 60% 0% 60% 40% 0%
Czech Republic 56% 22% 22% 40% 40% 20% 46% 41% 14%
Hungary 50% 38% 13% 20% 80% 0% 75% 25% 0% 100% 0% 0%
Macedonia N/A N/A N/A 0% 0% 0%
Poland 58% 42% 0% 79% 21% 0% 56% 32% 12% 100% 0% 0%
Romania 88% 13% 0% 86% 14% 0% 60% 32% 8%
Serbia N/A N/A N/A 50% 50% 0%
Slovakia 67% 0% 33% 57% 29% 14% 50% 33% 17%
Slovenia 50% 50% 0% 67% 33% 0% 50% 33% 17%
Ukraine 0% 100% 0% 33% 67% 0% 100% 0% 0%
EASTERN EUROPE 60% 33% 7% 64% 31% 6% 54% 34% 12% 86% 14% 0%
Portugal 13% 63% 25% 45% 36% 18% 55% 36% 9%
Spain 42% 46% 12% 44% 35% 21% 55% 31% 15%
IBERIA 39% 48% 13% 44% 35% 20% 55% 31% 14% 73% 24% 3%
Denmark 49% 51% 0% 55% 39% 6% 75% 13% 13%
Finland 50% 38% 13% 62% 38% 0% 78% 22% 0%
Norway 38% 50% 13% 57% 43% 0% 83% 17% 0%
Sweden 46% 46% 8% 29% 50% 21% 56% 13% 31% 75%
SCANDINAVIA 47% 48% 5% 51% 42% 7% 71% 14% 14% 82%
Ireland 13% 75% 13% 25% 75% 0% 22% 78% 0% 89%
UK 47% 48% 5% 49% 45% 5% 68% 29% 3% 91%
UK & IRELAND 43% 51% 6% 47% 48% 5% 62% 35% 3% 91% 8% 2%
Austria 58% 26% 16% 41% 41% 18% 72% 28% 0% 56% 31% 13%
Belgium 33% 67% 0% 40% 33% 27% 47% 25% 28%
France 63% 30% 7% 66% 30% 4% 50% 32% 18%
Germany 33% 55% 12% 50% 32% 18% 67% 19% 14% 59% 20% 21%
Greece 60% 40% 0% 50% 50% 0% 43% 38% 20%
Italy 44% 46% 10% 49% 45% 6% 45% 52% 3% 76% 24% 0%
Netherlands 54% 40% 6% 43% 47% 10% 63% 35% 3%
Switzerland 69% 31% 0% 56% 44% 0% 78% 22% 0%
WESTERN EUROPE 48% 44% 8% 51% 38% 11% 58% 31% 12% 73% 20% 7%
EUROPE 49% 43% 8% 52% 38% 11% 57% 31% 12%
CYPRUS 0% 0% 0% 0% 0% 0% 0% 0% 0%
RUSSIA 87% 13% 0% 71% 12% 17% 82% 18% 0% 36%
TURKEY 54% 41% 5% 48% 51% 0 61% 36% 2% 89% 11% 0%
Brazil 74% 16% 10% 68% 28% 4%
Greater China 55% 34% 11% 55% 37% 8%
India 47% 22% 31% 80% 20% 0%
MIDDLE EAST 79% 19% 2% 67% 33% 0%

10
20
30
40
50
60
70
80
90
100
0
ROMANIA
BULGARIA
SLOVAKIA
FRANCE
GREECE
AUSTRIA
POLAND
CZECH REPUBLIC
NETHERLANDS
SLOVENIA
FINLAND
HUNGARY
DENMARK UK
SWEDENITA
LYSPAIN
CROATIA
BELGIUM
GERMANY
IRELAND
PORTUGAL
CYPRUS
BALTICS
10
20
30
40
50
60
70
80
90
100
0
CIS RUSSIA (RFR)
MIDDLE EAST
BRAZIL SAUDI ARABIA
EASTERN EUROPE
GREATER CHINA
TURKEY WESTERN EUROPE
INDIA
European Coordination Committee of the Radiological, Electromedical and Healthcare IT Industry
30 IMAGING EQUIPMENT AGE PROFILE & DENSITY 2016
TABLE 20 Compliance with Golden Rules – EU – MI-PET
TABLE 21 Compliance with Golden Rules – Europe vs. BRIC, ME-CIS – MI-PET
AGED 1 - 5 YEARS
AGED 6 - 10 YEARS
AGED 10+ YEARS
AGED 1 - 5 YEARS
AGED 6 - 10 YEARS
AGED 10+ YEARS
100 %
0% 0% 0%0% 0%0% 0% 0% 0%
0%
88%
13 %
75%
25 %
67 %
33 %
63 %
30 %
7 %
60 %
40 %
58 %
26 %
16 %
58 %
42 %
56 %
22 %
22 %
54 %
40 %
6 %
50 %
50 %
50 %
38 %
13 %
50 %
38 %
13 %
49 %
51 %
47 %
48 %
5 %
46 %
46 %
8 %
44 %
46 %
10 %
42 %
46 %
12 %
40 %
60 %
33 %
67 %
33 %
55 %
12 %
13 %
75 %
13 %
13 %
63 %
25 %
0 %
87% 87%79%
74%69%
60%55% 54%
48% 47%
11% 13%19%
16%31%
33%34%
41%44%
2% 2%0% 0%
10% 7% 11%5% 8%
31%
22%

European Coordination Committee of the Radiological, Electromedical and Healthcare IT Industry
IMAGING EQUIPMENT AGE PROFILE & DENSITY 2016 31
1
2
3
4
5
6
0
TABLE 22 Density – EU – MI-PET
TABLE 23 Density – Europe vs. BRIC, ME- CIS – MI-PET
DENMARK
NETHERLANDS
AUSTRIA
FRANCE
IRELAND
GERMANYITA
LY
FINLANDSPAIN
SWEDEN
BELGIUM
CROATIA
SLOVENIA UK
GREECE
CZECH REPUBLIC
HUNGARY
PORTUGAL
POLAND
BULGARIA
SLOVAKIA
BALTICS
ROMANIA
CYPRUS
6.28
3.08
2.312.14
1.66 1.65 1.56 1.52 1.45 1.341.15 1.12
1.01 1.00 0.93 0.85 0.81 0.74 0.680.58 0.55 0.48 0.37
0.00
0.2
0.4
0.6
0.8
1.0
1.2
1.4
1.6
1.8
0
WESTERN EUROPE
1.71
TURKEY
1.67
BRAZIL
0.60
SAUDI ARABIA
0.59
EASTERN EUROPE
0.43
RUSSIA (RFR)
0.36
CIS
0.29
MIDDLE EAST
0.25
GREATER CHINA
0.21
INDIA
0.15

European Coordination Committee of the Radiological, Electromedical and Healthcare IT Industry
32 IMAGING EQUIPMENT AGE PROFILE & DENSITY 2016
0
5
10
15
20
25
D EQUIPMENT DENSITY TRENDSTABLE 24 Equipment density trends in Western and Eastern Europe
WESTERN EUROPE
MRI MI-PETCT X-RAY ANGIO24.9
2013 2015
12.6
5.7
24.1
13.0
5.8
EASTERN EUROPE
EASTERN EUROPE
18.9 18.5
WESTERN EUROPE
5.56.5
EASTERN EUROPE
15.6
13.4
WESTERN EUROPE
1.9 1.7
WESTERN EUROPE
0.4 0.4
EASTERN EUROPE
European Coordination Committee of the Radiological, Electromedical and Healthcare IT Industry
IMAGING EQUIPMENT AGE PROFILE & DENSITY 2016 33
8. ANNEX 2: MEDICAL IMAGING TECHNOLOGIES
A COMPUTED TOMOGRAPHYAlso commonly referred to as a CT scan, Computed Tomography is an imaging technique that combines multiple X-ray images taken from different angles. This produces detailed cross-sectional internal images. The first CT scanner for medical use dates from 1972.
The resulting images provide greater information than regular X-rays, allowing doctors to examine individual slices within the 3-D images. Contrast agents are commonly used in combination with CT scans to perform angiographies and other specific tissue examinations. CT SCANS ARE OFTEN USED TO EVALUATE:
> Organs in the pelvis, chest and abdomen> Colon health (CT colonography)> Presence of tumours> Pulmonary embolism (CT angiography)> Abdominal aortic aneurysms (CT angiography)> Spinal injuries > Cardiology.
Technological improvements in CT such as dose modulation acquisition techniques and iterative reconstruction algorithms dramatically reduce the required X-Ray dose, improve hospital efficiency and clinical effectiveness and reduce costs.
B MAGNETIC RESONANCE IMAGINGMagnetic Resonance Imaging (MRI) is a technology that uses radio waves and a magnetic field to provide detailed images of organs and tissues. The first magnetic resonance image was taken in 1973 and the first MRI scanner for medical imaging was developed in 1977.
The type of radiation in this kind of imaging technique generates images of the soft tissues, omitting the bones. This characteristic has proven highly effective in diagnosing a number of conditions by showing the difference between normal and diseased tissues. MRI is often used to evaluate:
> Blood vessels> Breasts> Major organs
C X-RAYX-rays are the oldest and most commonly used medical imaging technique. X-rays were discovered in 1895 and first used to image human tissue in 1896. X-rays use ionizing radiation to produce images of a person’s internal structure by sending beams through the body. These are absorbed at different levels depending on the density of the tissue.
X-ray radiation can generate three kinds of medical images; conventional X-ray imaging, angiography and fluoroscopy.
Conventional X-ray imaging generates an image of a localised part of the body, which will be analysed for anatomical abnormalities. This kind of imaging usually evaluates:
> The skeletal systems> The oral cavity (bone and teeth)> Any ingested objects> The lungs
European Coordination Committee of the Radiological, Electromedical and Healthcare IT Industry
34 IMAGING EQUIPMENT AGE PROFILE & DENSITY 2016
> The breast (Mammography)> The digestive system.
Angiography uses X-rays in combination with a contrast agent (chemical substances used to enhance specific structures in images) in order to visualise blood vessels, particularly the coronary arteries.
Fluoroscopy uses X-rays to visualise the internal structure in real-time, providing moving images of the interior of an object, such as hearts beating or throats in the process of swallowing.
D MOLECULAR IMAGING PETMolecular Imaging is a diagnostic tool where metabolic processes can be visualised by administering small amounts of radioactive pharmaceuticals to patients. These accumulate in a specific part of the body in a controlled way.
Unlike other ionizing radiation techniques, which can only generate anatomical images, this technique generates functional images. Some conditions initially have a physiological effect, rather than an anatomical change in the body. Molecular imaging allows for an earlier diagnosis. Combining molecular imaging with CT or MRI images can provide clinicians with superior images. AIPES1 has developed a comprehensive tool on nuclear medicine. See website2 for further information.
1. http://www.aipes-eeig.org/2. http://www.whatisnuclearmedicine.com/Home


COCIR HOW TO JOIN US COCIR aisbl : : Diamant Building : : Boulevard A. Reyerslaan 80 : : 1030 Brussels : : BelgiumTel +32 (0)2 706 8960 : : Fax +32 (0)2 706 8969 : : Email [email protected] : : www.cocir.org
COCIR COMPANY MEMBERS:
NATIONAL TRADE ASSOCIATIONS MEMBERS:
GENERAL INFORMATION ABOUT COCIR
COCIR is the European Trade Association representing the medical imaging, radiotherapy, health ICT and electromedical industries.
Founded in 1959, COCIR is a non-profit association headquartered in Brussels (Belgium) with a China Desk based in Beijing since 2007. COCIR is unique as it brings together the healthcare, IT and telecommunications industries.
Our focus is to open markets for COCIR members in Europe and beyond. We provide a range of services in the areas of regulatory, technical, market intelligence, environmental, standardisation, international and legal affairs.
COCIR is also a founding member of DITTA, the Global Diagnostic Imaging, Healthcare IT and Radiation Therapy Trade Association (www.globalditta.org).
© C
OCIR
NO
VEM
BER
2016
/
D-N
ICE
GRAP
HIC
DES
IGN
BELGIUM FINLAND FRANCE GERMANYGERMANY
SPAIN SWEDEN TURKEY UNITED KINGDOMTHE NETHERLANDS
THE NETHERLANDSGERMANY HUNGARY ITALY PORTUGAL
**