medicaid's disproportionate share hospital program ... · 3 nhpf background paper september...
TRANSCRIPT

NHPF Background PaperSeptember 14, 2004
Medicaid’s DisproportionateShare Hospital Program: ComplexStructure, Critical PaymentsRobert E. Mechanic, Consultant
OVERVIEW — This background paper describes the history and political evo-lution of Medicaid’s disproportionate share hospital (DSH) program and ex-amines DSH as it exists today. It highlights the importance of DSH paymentsfor the viability of safety net hospitals and considers the consequences of states’creative financing strategies for maximizing federal Medicaid matching funds.Finally, this paper reviews several options for improving the structure andeffectiveness of the DSH program.

2
NHPF Background Paper September 14, 2004
National Health Policy Forum2131 K Street NW, Suite 500Washington DC 20037
202/872-1390202/862-9837 [fax][email protected] [e-mail]www.nhpf.org [web]
Judith Miller JonesDirector
Sally CoberlyDeputy Director
Monique MartineauPublications Director
NHPF is a nonpartisan education andinformation exchange for federalhealth policymakers.
Contents
INTRODUCTION .............................................................................. 3
Figure 1: Federal and State Medicaid DSH Expenditures,1998–2002 (in billions) ................................................................. 4
A BRIEF HISTORY OF MEDICAID DSH .............................................. 5
State Creative Financing Strategies ............................................... 5
Figure 2: Illustrative Example of a DSH Program ............................ 6Congressional Restrictions on Medicaid DSH................................. 7
The Continuing Federal-State Conflict .......................................... 8
CURRENT STATUS OF MEDICAID DSH ............................................. 9
State Medicaid DSH Program Structure ....................................... 10Net DSH Payments to Hospitals .................................................. 11
DSH Payments to Safety Net Hospitals ........................................ 12
State and Local Government Contributions to Medicaid DSH ..... 13
THE FUTURE OF MEDICAID DSH AND FEDERAL SUPPORTFOR THE HEALTH CARE SAFETY NET ............................................. 14
Options for Change .................................................................... 15
CONCLUSION ............................................................................... 17
ENDNOTES ................................................................................... 17
APPENDIX
Table 1: Medicaid DSH Expenditures per Enrollee and perUninsured Person, 2001 ............................................................. 19
Table 2: State Sources of Funds, Reported DSH Payments,and Net DSH Payments by Entity in 2000.................................... 21Table 3: Net DSH Gains by Hospital Ownership and DSHResidual Funds in 32 States, State Fiscal Year 2001 ..................... 22Table 4: Distribution of DSH Program Revenues andExpenditures (in percent) ............................................................ 24
3
NHPF Background Paper September 14, 2004
Medicaid’s DisproportionateShare Hospital Program: ComplexStructure, Critical Payments
Today, nearly 45 million Americans lack health insurance coverage. In2004, uninsured persons will incur medical care expenditures approach-ing $125 billion, with an estimated $40 billion of that in the form of un-compensated care.1 The uninsured gain access to health care servicesthrough a “safety net” that includes public hospitals, private nonprofithospitals, community health centers, and some private physicians, all ofwhom help shoulder the burden of uncompensated care. While a broadrange of providers serve uninsured patients, the largest share of uncom-pensated care, in dollar terms, is delivered by hospitals.
Safety net hospitals serve predominantly low-income communities andhave substantial caseloads of Medicaid patients whose costs frequentlyare not covered by Medicaid reimbursement rates. Often, these hospitalsare also the principal source of care for uninsured patients in their com-munities. They include general inpatient facilities, some of which are teach-ing hospitals, as well as specialty facilities such as psychiatric hospitals.Although all safety net hospitals provide inpatient care, many also pro-vide outpatient services through hospital-based clinics. Safety net insti-tutions typically have small caseloads of private patients, limiting theextent to which they can “cost shift” by charging higher rates to privateinsurers. As a result, many safety net hospitals rely on some public finan-cial support to sustain their charitable missions.
Congress established the Medicaid disproportionate share hospital (DSH)program in 1981 to help ensure that states provide adequate financialsupport to hospitals that serve a significant number of low-income pa-tients with special needs. Recognizing that safety net hospitals typicallyincur higher uncompensated care costs than other hospitals and relyheavily on Medicaid, which historically has low reimbursement rates,Congress authorized DSH payments to assist states in financing the pro-grams. Congress also established DSH payments for hospitals underMedicare’s prospective payment system. Over the past two decades, DSHprograms have become a major source of funding for the nation’s safetynet hospitals. In 2002, the federal government provided $9 billion inmatching funds for state Medicaid DSH programs and $6.2 billion indirect DSH payments through Medicare.2 These payments representabout two-thirds of the $22.3 billion in uncompensated care costs re-ported by hospitals in 2002.

4
NHPF Background Paper September 14, 2004
Although safety net hospitals often receive appropriations from state andlocal governments to subsidize the costs of serving the uninsured, DSHfunding has become a lifeline for many large institutions. Survey datacollected by the National Association of Public Hospitals (NAPH) indi-cate that Medicaid DSH payments fund 25 percent of unreimbursed costsfor NAPH members while the Medicare DSH program funds about 6 per-cent.3 Medicaid and Medicare DSH dollars are also important fundingsources for many rural providers.
However, Medicaid DSH became mired in controversy as states discov-ered unforeseen opportunities to maximize federal funds and reduce statematching contributions. Medicaid DSH spending skyrocketed from lessthan $600 million in 1989 to more than $17 billion by 1992 (Figure 1). TheCongress and several administrations have taken steps to control thegrowth of state DSH programs and curtail inappropriate financingschemes, enacting major program changes in 1991, 1993, 1997, and 2000.At the same time, many in Congress view Medicaid DSH as a criticalsafety net funding source. Congress recently increased state DSH allot-ments as part of the Medicare Modernization Act of 2003. Experts gener-ally agree that reforms are needed but that they must be undertaken withextreme care to minimize damage to safety net providers that have cometo rely on these funds.
FIGURE 1Federal and State Medicaid DSH Expenditures,
1989–2002 (in billions)
Source: U.S. Department of Health and Human Services, CMS-64 financial management reports.
$0.0
$2.0
$4.0
$6.0
$8.0
$10.0
$12.0
$14.0
$16.0
$18.0
20022001
20001999
19981997
19961995
19941993
19921991
19901989
5
NHPF Background Paper September 14, 2004
A BRIEF HISTORY OF MEDICAID DSHPrior to 1981, Medicaid based its payments to hospitals on reasonablecosts for services provided to program beneficiaries. Congress was con-cerned that this “cost-based reimbursement” was inherently inflationary.The Omnibus Budget Reconciliation Act of 1981 (OBRA 1981) enabledstates to experiment with prospective hospital payments as long as reim-bursement was “reasonable and necessary to the efficient and economi-cal delivery of services.” Congress was concerned, however, that thischange could harm hospitals serving large numbers of Medicaid anduninsured patients. Therefore, it required states to “take into account thesituation of hospitals which serve a disproportionate share of low-incomepatients with special needs.” The Medicaid DSH program was intendedto improve the financial stability of these hospitals and preserve access toquality health services for low-income patients. Because the requirementwas broad and vague, many states ignored it. By 1985, only 17 states hadinitiated DSH programs.
Congress attempted to remedy this problem in the Omnibus Reconcili-ation Act of 1987 (OBRA 1987) by establishing a federal definition forDSH hospitals and requiring states to make payments to these facili-ties.4 The definition included hospitals with (a) a Medicaid utilizationrate of one standard deviation or more above the mean Medicaid utili-zation rate in the state or (b) a low-income utilization rate of 25 percentor more.5 OBRA 1987 also established broad parameters for DSH pay-ment adjustments that included (a) applying the Medicare DSH formulato Medicaid’s base inpatient payments or (b) paying a proportional in-crease based on hospitals’ Medicaid or low-income utilization rates.However, OBRA 1987 allowed states to designate additional DSH-eli-gible hospitals and set reimbursement levels. As a result, DSH paymentsvaried considerably across states.
State Creative Financing Strategies
In 1985, the Health Care Financing Administration, or HCFA (now the Cen-ters for Medicare and Medicaid Services, or CMS) ruled that states coulduse hospital taxes and donations to fund the nonfederal share of MedicaidDSH payments. This set the stage for creative financing approaches thatcould generate new federal funds without matching state contributions.Several factors made this possible. First, Medicaid financing is shared be-tween states and the federal government. Each dollar of allowable stateMedicaid spending generates federal matching funds according to a fed-eral medical assistance percentage (FMAP) that ranges from 50 percent to77 percent based on a state’s per capita income.6 Second, OBRA 1987 main-tained state flexibility to designate DSH hospitals and set payment levels,allowing states to direct new Medicaid payments to specific providers. Fi-nally, the federal government did not establish any limits on the amount ofstate DSH payments eligible for federal matching funds.
DSH was intended toimprove the financialstability of hospitalsand preserve access tocare for low-incomepatients.

6
NHPF Background Paper September 14, 2004
In the late 1980s several states, starting with West Virginia, determinedthat it would be permissible to collect donations from hospitals, use thedonations to draw down federal matching funds, and make DSH pay-ments to those same hospitals without actually putting up state dollars.7
Figure 2 illustrates how the process worked. In this example, a state col-lects $10 million from a hospital through a provider tax, donation, or trans-fer. The state then makes a $12 million DSH payment back to the hospitaland draws down $6 million in federal funds (assuming a 50 percent fed-eral matching percentage). At the end of the transaction, the hospital hasa net gain of $2 million ($12 million DSH payment minus $10 milliondonation) while the state’s net gain is $4 million ($10 million donationplus $6 million federal match minus $12 million DSH payment). As otherstates began to grasp the implications of West Virginia’s approach, theyrushed to establish their own programs.
By the early 1990s, alarm bells were going off in Washington as the growthin DSH payments became apparent and stories of inappropriate use offunds began to emerge. Most states did not report how they used fundsgenerated by DSH. In many cases, states used new federal money to en-hance payments for safety net providers or expand coverage for low-in-come populations. Others used the funds to replace state dollars in thebudget—often as an alternative to cutting Medicaid eligibility in the faceof double-digit spending growth. Federal officials were most concerned byreports that some states had diverted federal Medicaid funds for unrelated
FIGURE 2Illustrative Example of a DSH Program
Source: Urban Institute, 2000.
IGT=Intergovernmental transferFFP= federal financial participation (federal match)
Provider State Federal
$10 Million
Tax, IGT, or Donation
$12 Million
Medicaid DSH Payment
$6 Million
FFP Reimbursement
+$10M from hospital+$6M federal match-$12M paid to hospital
+$4M net
+$12M from state-$10M paid to state
+$2M net -$6M FFP paid to state

7
NHPF Background Paper September 14, 2004
purposes. They were also concerned about reports of “recycling” wherestates would use excess DSH funds as the state share of new Medicaidexpenditures to draw down additional federal payments. Certain statesestablished DSH payments far in excess of what Congress would likelyconsider reasonable or rational. For example, in 1992, DSH payments were51 percent of total Medicaid program spending in New Hampshire, 36percent in Louisiana, and 31 percent in Missouri.8
Congressional Restrictions on Medicaid DSH
Congress’s first major action to curb state abuses came with the MedicaidVoluntary Contribution and Provider-Specific Tax Amendments of 1991(P.L. 102-234). The law banned most provider donations and required thatprovider taxes be (a) broad based, (b) uniformly imposed, and (c) struc-tured so that providers are not held harmless for the cost of the tax. Con-gress also passed state-specific DSH allotments and limited future growthin these allotments to the annual rate of increase in total Medicaid spend-ing. The new law substantially reduced states’ use of provider taxes tofund Medicaid and put the brakes on growth in total DSH payments.However, it also locked in large inequities in states’ ability to utilize DSHthat persist today. A few states made major program changes to preservefederal funding they expected to lose. The most notable example wasTennessee, which negotiated an exceptionally generous federal Section1115 Medicaid waiver to implement broad eligibility expansions under anew managed care program called Tenncare. While the new law elimi-nated the mechanism Tennessee had used to finance a large proportion ofits Medicaid program, the waiver preserved the high levels of fundingTennessee received prior to the 1991 reforms.
The 1991 restrictions were the beginning of a continuing conflict over Med-icaid financing. Most states found they could not muster political supportfor allowable provider taxes that required some hospitals to pay new taxesthat would not be reimbursed through DSH payments. Instead many statesshifted to intergovernmental transfer (IGT) programs. Under IGTs, state orlocal governments that operate hospitals transfer funds to Medicaid as thestate match for DSH payments. Under this arrangement, states directed alarge share of DSH payments to a relatively small number of public hospi-tals. In a 1994 report, the General Accounting Office (now the GovernmentAccountability Office), or GAO, identified IGT programs that allowedMichigan, Tennessee, and Texas to obtain about $800 million in federalMedicaid matching funds without committing state funds.9
In the Omnibus Reconciliation Act of 1993, Congress imposed hospital-specific DSH caps, limiting payments to 100 percent of unreimbursedcosts of care for Medicaid and uninsured patients. The law provided atransition period for “high-volume” DSH hospitals, capping paymentsat 200 percent in fiscal year (FY) 1995 and 100 percent in FY 1996. Al-though the hospital-specific DSH caps reduced states’ ability to game
Certain states estab-lished DSH paymentsfar in excess of whatCongress would likelyconsider reasonable orrational.
8
NHPF Background Paper September 14, 2004
the DSH program, Congress has since created exceptions to the caps forcertain states and hospital categories.10
The Balanced Budget Act (BBA) of 1997 cut Medicaid DSH payments fur-ther, reducing state allotments by 8.6 percent between 1998 and 2002 andlimited spending on institutions for mental disease (IMDs). Since its incep-tion, Medicaid has specifically excluded coverage for services delivered topatients between the ages of 21 and 64 in an IMD.11 Since many IMDs arestate-owned, patient care in these facilities has been state-funded. Recog-nizing that the “IMD exclusion” relates only to reimbursement for servicesand that DSH payments need not be linked to specific patients or services,many states in the early 1990s substituted Medicaid DSH funding for stateIMD funding, in some cases generating large financial windfalls.12 The BBAlimited IMD spending to 33 percent of a state’s total DSH payments, re-ducing windfalls for certain states. Finally, the BBA required states to sub-mit data to HCFA documenting DSH payments to individual hospitals.
In 2000, Congress passed the Medicare, Medicaid, and SCHIP BenefitsImprovement and Protection Act (BIPA). The law eliminated the BBA’sDSH cuts for FY 2001 and FY 2002 and reinstated an annual increase instate allotments based on the consumer price index. But BIPA allowedthe full BBA cuts to become effective in FY 2003, creating what has beencalled the “DSH cliff.” The DSH cliff went into effect as scheduled, reduc-ing state allotments by 11.6 percent. However, the Medicare PrescriptionDrug Improvement and Modernization Act (MMA) of 2003 increased 2004state allotments by 16 percent. For most states, the allotments in the drugbill will remain level in subsequent years, but low DSH states (those withallotments less than 3 percent of total Medicaid spending) receive a 16percent annual increase through 2009—doubling their allotments over afive-year period.
The DSH program’s history illustrates inherent tensions in Congress be-tween those who want to use Medicaid as a vehicle to finance care forlow-income uninsured persons and those who want to control the growthin federal Medicaid payments. Congressional action to limit federal DSHfunding has often been followed by new legislation to increase it, as illus-trated by passage of the MMA. The BIPA of 2000 simultaneously increasedDSH caps for public hospitals and eliminated state loopholes for usingMedicaid upper payment limits (see sidebar, page 9—UPL: A New StateApproach). Medicaid policymaking has been intensely political and rifewith special deals such as the 1997 exemptions to hospital-specific DSHlimits for California hospitals. Members of Congress who oppose Medic-aid fiscal gamesmanship often support their own governors when statefunding is on the line.
The Continuing Federal-State Conflict
The most recent federal action to rein in special Medicaid hospital pay-ments came in a January 2004 CMS proposal to review state plans for
Congressional actionto limit federal DSHfunding has oftenbeen followed by leg-islation to increase it.

9
NHPF Background Paper September 14, 2004
Medicaid spending prospectively. The pro-posal, which was buried in the January 7Federal Register and had a one-day commentperiod, caused an outcry. On February 20,Department of Health and Human Services(DHHS) Secretary Tommy Thompson de-layed plans to implement these changes andannounced a “consultation period” with theNational Governors Association. The con-tinuing duel between states and federalregulators has created substantial animos-ity without much progress towards morerational policies. Efforts are hamperedby a lack of reliable data detailing what isactually happening in state programs.States have resisted attempts to developaccurate reporting systems, fearing that thiswould be an initial step toward reducedfunding. States are unlikely to cooperatewithout a roadmap for reform they perceiveas equitable.
CURRENT STATUSOF MEDICAID DSHThe Medicaid DSH program as it exists to-day is an amalgam of 50 state programswith different rules, varying resource lev-els, and few reporting requirements. Whilefederal legislation enacted in the 1990s es-sentially halted the program’s exponentialgrowth, Congress continued to allow stateflexibility to structure DSH programswithin federal funding constraints. DSHpayments declined from 14 percent of totalMedicaid spending in 1992 to about 7 per-cent in 2002. However, the federal DSH al-lotments locked in funding inequities thatarose between states that aggressivelymaximized DSH payments early on andthose that were slow to follow. In 2001, five states reported DSH pay-ments of at least $1,000 per resident below 100 percent of the federalpoverty level, while 16 states reported payments of less than $100 perlow-income resident (Table 1, see Appendix).
Despite evidence that many major safety net hospitals rely heavily onMedicaid DSH, the program’s impact on care to the poor is difficult to
Following the DSH restrictions, states continued to explore newrevenue maximization strategies, perhaps most significantly up-per payment limit (UPL) programs.13 Federal law states thatMedicaid programs cannot make payments in excess of what“would have been paid under Medicare principles”—the UPL.Originally, this restriction was designed to limit the federalgovernment’s liability for Medicaid matching payments. How-ever, states now use the UPL as a rationale for new supplemen-tal payments that help them increase federal Medicaid revenue.
States are required to certify that Medicaid payments do notexceed the Medicare UPL in state plans submitted to the fed-eral government. However, there is no standard methodologyfor calculating the UPL, which is applied as an aggregate pay-ment limit for broad classes of providers such as hospitals andnursing homes. Medicaid DSH payments are excluded fromthe UPL calculation.
In the mid-1990s, several states saw an opportunity to use the“room under the upper limit” as a rationale for supplementalpayment programs. There were very few federal limits onsupplemental payments, so that states could make large UPLpayments to individual providers while remaining within ag-gregate limits. States structured UPL programs much like theoriginal DSH programs—using provider taxes or intergovern-mental transfers as the state share to generate federal matchingfunds, then making supplemental payments back to contribut-ing providers.
A 2001 analysis by the DHHS Office of the Inspector Generalidentified 28 state UPL programs accounting for more than $10billion in FY 2000 Medicaid payments.14 Evidence to date sug-gests that states retain a relatively high percentage of UPL pro-gram gains rather than paying them to providers.15 CMS modi-fied its UPL regulation to establish aggregate caps for three cat-egories of hospitals (private, state, and public nonstate) in 2001but did not enact limits on provider-specific UPL payments. Incontrast, the GAO has a longstanding recommendation thatCongress limit UPL payments to provider costs.16
UPL: A NEW STATE APPROACH
10
NHPF Background Paper September 14, 2004
document with precision. Federal officials struggle to make informed deci-sions in the absence of basic program information, including the following:
■ How are individual state DSH programs structured?
■ What proportion of reported DSH payments are available to financecare for low-income patients after netting out funds returned to statesthrough provider taxes and IGTs?
■ What proportion of net DSH payments go to safety net as opposed tonon–safety net hospitals?■ How much funding do state and local governments actually contrib-ute to Medicaid DSH?
State Medicaid DSH Program Structure
While each state DSH program is unique, several general approaches arerelatively common. One is for states to structure programs using the OBRA1987 guidelines that defined DSH hospitals. For example, in Wisconsin,qualifying hospitals must have a low-income utilization rate (LIUR) of atleast 25 percent or a Medicaid utilization rate that is one standard devia-tion above the statewide mean. Qualifying hospitals are paid using an add-on to the Medicaid DRG rate that ranges from 3.0 percent to 4.5 percent,depending on each hospital’s LIUR. Wisconsin’s DSH program is relativelymodest, with payments of about $50 million in 2002.17 The state share ofDSH is financed predominantly with general revenues, although Wiscon-sin also uses an IGT from Milwaukee County to help finance the county’sGeneral Assistance Medical Program. This OBRA 1987 approach is morecommon for states with small DSH programs and few public hospitals.
Another general approach is illustrated by states that direct the majorityof DSH funds to public hospitals—creating a structure where the stateshare of DSH payments can be financed through intergovernmental trans-fers. In California, both public and private hospitals are eligible for DSHif they meet the OBRA 1987 guidelines. However, DSH payments are basedon a mathematical formula designed to achieve a predetermined distri-bution of payments between public and private hospitals. The formulatakes into account hospital type and LIUR and rewards Medicaid daysmore than charity care. Funds not expended in base payments are dis-tributed through supplemental payments to remaining DSH hospitals. In2002, approximately one-third of California hospitals received DSH pay-ments that totaled approximately $1.4 billion. The state share is financedprimarily through IGTs from counties and the University of California.
A third general approach is to make DSH payments to virtually all hospi-tals in the state. Such programs typically exist in states, such as New York,Massachusetts, and Ohio, that finance DSH payments in part through aprovider tax. New York, for example, has an indigent care pool that quali-fies for federal matching funds under the DSH program. Hospitals qualifyfor pool payments if their bad debt and charity care costs are at least 0.5
While each state DSHprogram is unique,several general ap-proaches are relativelycommon.

11
NHPF Background Paper September 14, 2004
percent of total hospital costs. As a result, virtually all New York hospi-tals receive DSH payments. The state pays between 60 and 100 percent ofhospitals’ uncompensated care costs, depending on their bad debt andcharity care percentage. New York also has created supplemental DSHprograms for public hospitals. New York’s FY 2002 DSH payments wereabout $2.9 billion. The state’s share of indigent care pool payments isfinanced by a uniform assessment on hospital’s private-sector chargesand an insurer assessment. The state’s share of the public-sector DSHprograms is financed primarily by IGTs.
Net DSH Payments to Hospitals
Despite success limiting aggregate growth in Medicaid DSH payments,federal officials remain concerned about whether states actually use thesefunds to support hospital uncompensated care. The federal governmentrequires states to report hospital-specific DSH payments to CMS but doesnot require hospital-specific information about transfers back to statesthrough provider taxes and intergovernmental transfers. As a result, thesereports provide little insight into what is really happening to DSH funds.
The Urban Institute, however, has conducted state surveys on the sourcesand uses of Medicaid DSH funds for FY 1993, FY 1997, and FY 2001.18 The2001 survey includes DSH data from 32 states accounting for about two-thirds of that year’s total payments. Although the survey data are not acomplete or audited accounting of Medicaid DSH programs, they do of-fer the most comprehensive picture of DSH financing available to date.The surveys also illustrate how state programs have evolved over time inresponse to federal legislative changes.
States responding to the Urban Institute’s DSH survey reported $10.7 bil-lion in total DSH payments. Of this amount, net DSH gains to hospitalsor state governments (defined by the Urban Institute as federal matchingfunds) were $6.2 billion (Table 2, see Appendix). Almost 74 percent of thenet DSH gains went to private or nonstate hospitals, 15 percent went tostate hospitals, and 11 percent were kept by states as residual funds. In2002, the federal government made $9 billion in matching payments ontotal reported DSH payments of $15.9 billion. Extrapolating from the sur-vey percentages suggests that hospitals received $8.1 billion in 2002 netDSH payments (total DSH payments minus provider taxes and IGTs).However, this amount understates net DSH payments to hospitals be-cause the Urban Institute’s definition does not include payments financedby state general revenues.
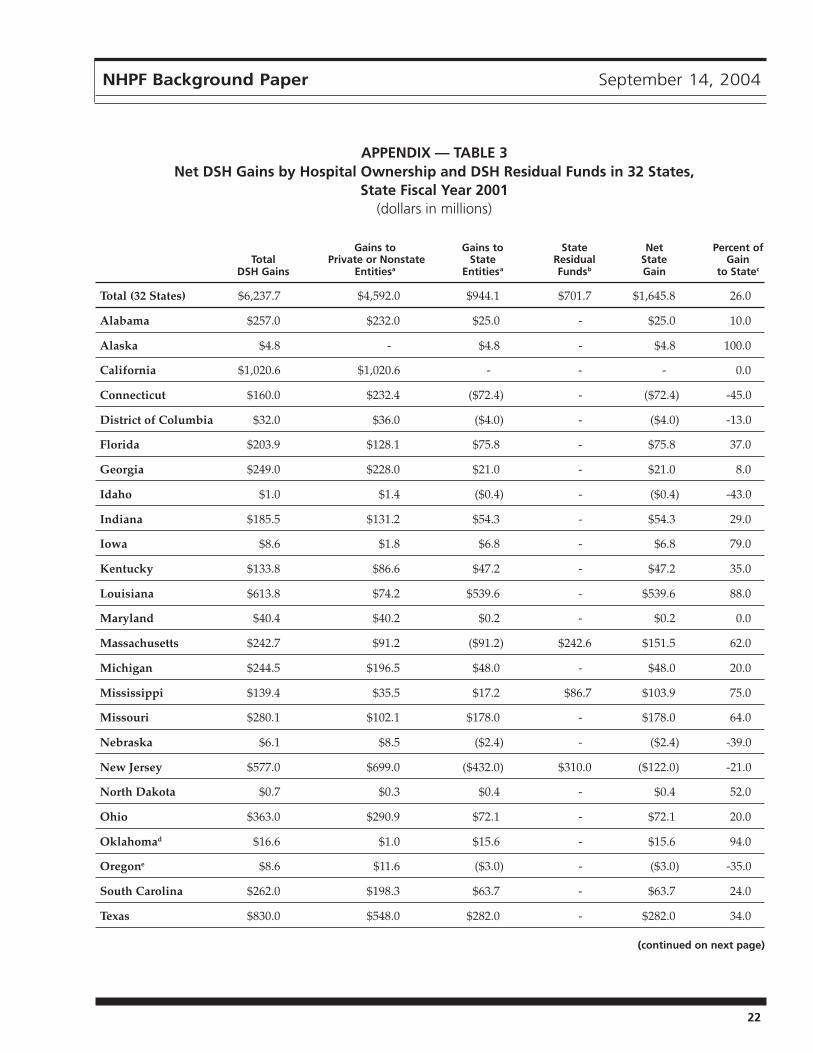
The distribution of DSH gains varies by state (Table 3, see Appendix). Forexample, New Jersey made $699 million in DSH payments to private hos-pitals while drawing down $577 million in federal matching funds forDSH, suggesting that the state contributed at least $122 million in stategeneral revenues to fund DSH payments to private hospitals. Nine of the32 survey states made net state DSH contributions, although these were

12
NHPF Background Paper September 14, 2004
relatively modest in all but New Jersey and Connecticut. In contrast, somestates captured large DSH gains. For example, Louisiana financed its 2001DSH program predominantly with state appropriations but made themajority of DSH payments to state hospitals. In 2001, Louisiana’s net stategain was almost $540 million. However, Louisiana did not report a trans-fer of funds from state hospitals back to the general fund, suggesting thatthe gains finance health services delivered at state hospitals.
DSH Payments to Safety Net Hospitals
Hospitals are the nation’s largest providers of uncompensated care, de-livering a substantially larger volume of services to low-income patientsthan community health centers, local clinics, or private physicians. Med-icaid DSH is the largest source of federal funding for uncompensatedhospital care. However, the burden of uncompensated care is highly vari-able across hospitals, and policymakers are justifiably interested in un-derstanding how well payments are targeted to safety net providers.
A September 2002 report prepared for the Office of the Assistant Secre-tary of Planning and Evaluation (ASPE) by RAND and the Urban Insti-tute identifies four major dimensions of safety net hospitals. The hospitalmust have a legal mandate or mission to serve individuals regardless oftheir ability to pay, provide service to vulnerable populations (for example,uninsured persons, homeless persons, those with substance abuse prob-lems or mental illness), provide a disproportionate amount of care to low-income populations, and make available specialized services such astrauma care and emergency room services.19 The structure of the healthcare safety net varies from community to community. In cities such asDallas and Los Angeles, the majority of hospital care provided to unin-sured and Medicaid patients is concentrated in a small number of publichospitals. In cities such as New York and Detroit, care for the uninsuredis shared across a broad range of institutions.20 Therefore, the health caresafety net includes hospitals that vary in size, location, and governance.
The ASPE study analyzed the distribution of DSH payments across hos-pitals and estimated that 64 percent of net Medicaid DSH payments wentto hospitals with at least 30 percent low-income patients while 80 percentof net payments went to hospitals with at least 20 percent low-incomepatients.21 Furthermore, it found that 63 percent of net Medicaid DSHpayments went to hospitals with Medicaid utilization rates at least onestandard deviation above their statewide average. Roughly 75 percent ofnet Medicaid DSH payments went to hospitals that had negative totalmargins before receiving these payments. These findings imply that DSHcuts would result in service reductions for uninsured patients. The ASPEstudy conducted simulations of Medicaid DSH payments using alterna-tive distribution formulas. The authors concluded that the current distri-bution of net DSH payments targets financially vulnerable safety nethospitals at least as well as alternatives examined in the report.
Medicaid DSH is thelargest source of federalfunding for uncompen-sated hospital care.

13
NHPF Background Paper September 14, 2004
Taken together, the Urban Institute’s DSH survey and the ASPE study sug-gest that the majority of federal DSH funds accrue to hospitals and that asubstantial proportion of these funds flow to safety net institutions. How-ever, the extent to which DSH funds can be considered well-targeted tosafety net institutions varies across states. Safety net providers in stateswith low DSH allotments receive very limited DSH funding. This remainsa major gap in the program’s ability to target payments to providers withthe greatest need.
Although recent research has provided improved insight into theprogram’s financial flows, very little is known about how hospitals useDSH funding to render care to uninsured patients. To assess this issuein greater detail, DHHS sponsored another study by the Urban Insti-tute to examine selected programs that use DSH funds to enhance carefor uninsured patients.22
The experience of Denver Health (DH) illustrates the role of DSH in sup-porting a local safety net program. DH, the principal source of care foruninsured patients in the Denver metropolitan area, includes a 350-bedhospital, 11 federally qualified community health centers, the local healthdepartment, and 12 school-based clinics. In 1991, DH faced a $40 millionoperating deficit, but a rapid infusion of Medicaid DSH funding in the1990s was a critical factor in DH’s subsequent financial turnaround. Be-tween 1991 and 2000, DH received nearly $320 million in DSH funding. In1999, DH provided approximately $75 million in care to the uninsured, $39million of which was supported by net DSH payments. In addition to sup-porting direct care, Medicaid DSH has allowed DH eliminate its operatingdeficit, invest in new infrastructure, and reorganize into a vertically inte-grated delivery system that can deliver care in a more coordinated andcost-effective manner.
State and Local Government Contributions to Medicaid DSH
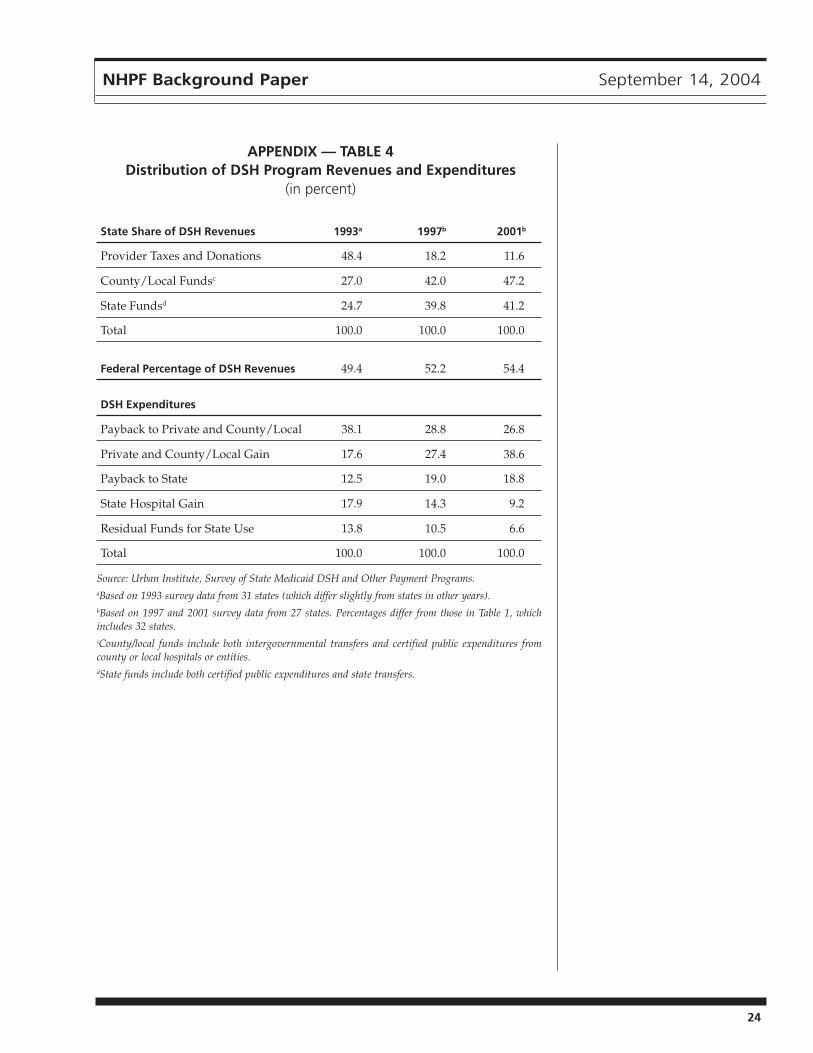
Congressionally mandated restrictions on provider taxes caused a ma-jor shift in Medicaid DSH financing. According to the Urban Institutesurvey, local government funding used to finance the state share of DSHpayments increased from 27 percent in 1993 to 47 percent in 2001, whileprovider taxes declined from almost 50 percent of the state share in 1993to 11.6 percent in 2001 (Table 4, see Appendix). Local government fundsare considered a legitimate source of Medicaid financing. According tofederal statute, up to 60 percent of the state share may come from localsources. States have a long history of local government revenue shar-ing. For example, New York has long required that county governmentscontribute part of the state share of Medicaid. Similarly, provider-specific taxes are legitimate sources of state funds if they conform toCMS regulations. The critical question is not whether states use localfunding to finance the state share, but whether reported DSH paymentsare valid expenditures for hospital services.
According to federalstatute, up to 60 per-cent of the state sharemay come from localsources.

14
NHPF Background Paper September 14, 2004
Congressionally mandated hospital-specific DSH caps can substantiallyreduce state governments’ ability to generate excess federal matching pay-ments through the DSH program. Under caps that limit payments to 100percent of hospitals’ unreimbursed costs, states can still use intergovern-mental transfers as the state share of DSH but cannot hold local govern-ments harmless for the cost of these transfers. If a county hospital has $10million in unreimbursed costs, a state cannot make DSH payments to thehospital in excess of this amount. Figure 3 illustrates that a state with a 75percent federal matching rate could use a $2.5 million county IGT to drawdown $7.5 million in federal matching funds and then make a $10 millionDSH payment without appropriating state funds. The county hospital hasa net DSH payment of $7.5 million (DSH payment less IGT) but also hasunreimbursed costs of $10 million. Therefore, the county has to finance theremaining $2.5 million in unreimbursed costs. This example illustrates thatthe 100 percent DSH cap requires either state or local government to con-tribute the full statutory nonfederal share of the Medicaid DSH payment.However, when hospital-specific DSH caps are raised above 100 percent(as is the case under BIPA for public hospitals in 2004 and 2005), states canstill generate excess DSH payments that may be used to finance other healthcare services for low-income patients or diverted for other purposes.
THE FUTURE OF MEDICAID DSH AND FEDERALSUPPORT FOR THE HEALTH CARE SAFETY NETMedicaid DSH provides essential funding to many safety net hospitals.In this capacity, the program helps maintain access to health services forlow-income patients. While federal legislation has corrected many of theproblems that occurred in the program’s early years, Medicaid DSH stillhas significant flaws:■ Lack of transparency and financial controls. Medicaid DSH lacksoversight mechanisms and financial controls that one would expect in alarge government program. Studies by the GAO and others discusshow problems with oversight and management result in questionablefederal expenditures.23 The absence of reliable data protects states thatengage in questionable practices and limits the momentum of efforts tochange the program in ways that would benefit low-income patients.
■ Inequity across states. The Medicaid DSH program is highly inequi-table. States with large DSH allotments receive substantially morefederal DSH funding than those with smaller allotments. State allot-ments are not based on need, but rather on historical program spendinglevels at the time when the federal government established state DSHallotments. States that were most effective in maximizing DSH fundingin the early years have continued to benefit for more than a decade.
■ Lack of incentives for delivery system reform. The DSH programperpetuates a hospital-centric model of health care delivery. DSH doesnot fund nonhospital services and accordingly does not provide

15
NHPF Background Paper September 14, 2004
incentives for investment in primary care and prevention programsdesigned to keep patients healthy and out of the hospital.
Enacting change will be difficult. Federal officials are reluctant to investin a program some view as a raid on the federal treasury. Yet major re-form without a new infusion of federal money will create shortfalls forcertain states and providers that have come to rely on DSH funds.
Options for Change
Proposals for structural changes to DSH policies that address the threemajor issues highlighted above include the following options:
Establishing New Medicaid DSH Reporting Systems and FinancialControls — The federal government continues to struggle with the no-tion of state flexibility in reviewing and approving financing methodolo-gies. In 2002, the GAO added Medicaid to its list of “high-risk” programs,citing lack of financial controls over states claims for federal matching.24
The Bush administration has proposed establishing Medicaid block grantsto reduce federal exposure to future growth in program costs and givestates more management flexibility. Yet a recent report for the Kaiser Fam-ily Foundation argues that improving financial management within thecurrent program structure is a viable alternative to more radical restruc-turing of the federal-state Medicaid partnership.25 The report identifies avariety of specific actions to be considered, including the following:■ Creating a Medicaid financial oversight board.
■ Developing a comprehensive plan for Medicaid fiscal integrity.
■ Further clarifying allowable Medicaid funding sources.■ Publishing an upper payment limit methodology and applying itconsistently across all states.
■ Auditing supplemental payment programs.
■ Redesigning CMS Medicaid information systems to collect keyfinancial data from states.
■ Reporting on effective matching rates.
In addition to controlling costs and reducing Medicaid’s exposure to abuse,stronger fiscal controls would limit manipulations that create temporarywinners, inequities among states, and financial dislocations when newrules are implemented to eliminate loopholes.
If improved transparency and accountability are considered priority ar-eas for Medicaid DSH reform, the federal government could developnational standards for reporting hospital uncompensated care and a pro-cess for collecting consistent data on the volume of care delivered tolow-income and uninsured patients. Some states, like Massachusetts,have specific definitions for charity care and require that hospitals docu-ment patients’ financial status before they can receive uncompensatedcare funding. However, the only national data source is the American
The federal govern-ment continues tostruggle with the no-tion of state flexibilitywith respect to Medic-aid financing.

16
NHPF Background Paper September 14, 2004
Hospital Association (AHA) annual survey. Hospitals do not use consis-tent definitions for reporting bad debt and charity care to the AHA, nor isthere any way to determine what proportion of this care is provided touninsured patients. Furthermore, the AHA data are neither audited norpublicly available. National uncompensated care reporting standardswould assist both the federal and state governments in targeting DSHpayments to more precisely meet policy goals.
Federalizing Medicaid DSH Payments — Another way to control fed-eral DSH payments and ensure a more equitable distribution of fundswould be to establish a uniform federal Medicaid DSH program. Federalpayments would go directly to hospitals, eliminating opportunities forstates to engage in financial manipulations. Under this scenario, statescould also make DSH payments, but these would not be eligible for fed-eral matching funds.
Medicare already has a uniform federal DSH program. However,Medicare’s current qualification criteria and payment formulas are notappropriate for Medicaid DSH. The ASPE analysis found that a smallerproportion of Medicare DSH payments went to hospitals with high ratiosof low-income patients than the current state-based Medicaid DSH pro-gram. The Medicare Payment Advisory Commission has recommendedthat Congress require disproportionate share payments be distributedaccording to each hospital’s share of low-income patient costs—definedbroadly to include all care to the poor delivered in both inpatient andoutpatient settings.26 However, the ASPE study demonstrates that addi-tional research and better data are needed to ensure payments are effec-tively targeted to hospitals with the greatest need.
The most difficult issue facing a federal Medicaid DSH program wouldbe determining the level and distribution of funding. Some have sug-gested increasing the proportion of Medicaid DSH payments directed athospitals that serve a very high percentage of low-income and uninsuredpatients.27 This approach is appealing to those who advocate greater fed-eral support for “true” safety net providers. But such a change wouldresult in large redistributions relative to the current structure.
Developing New Funding Models to Support Integrated Systems ofCharity Care — A third option would be a new comprehensive institu-tional financing program for safety net providers designed to replace theexisting patchwork of state and federal payments. By establishing stable,predictable, multiyear funding to support a full continuum of services forlow-income patients, this option could create a financial structure that en-courages integrated, coordinated systems of care. This approach could bestructured like a global budget, providing selected safety net providerswith the flexibility and financial incentives to treat patients in the mostappropriate, cost-effective settings. Such a program would need to incor-porate accountability guidelines and require health systems to demonstratemeasurable progress in improving patient safety, service quality, and com-munity health status in order to qualify for continued funding.

17
NHPF Background Paper September 14, 2004
CONCLUSIONDSH is a critical source of financing for health care provided to low-income and uninsured patients; however, it continues to be a focal pointin the federal-state battle over Medicaid financing. The DSH program iscomplex and lacks good reporting systems and financial controls. Con-troversy over states’ use of DSH programs to enhance federal Medicaidmatching funds sometimes overshadows the importance of directingnecessary funding to institutions that serve low-income patients. Further-more, growth of supplemental payment programs like DSH that are fi-nanced by provider taxes and IGTs greatly complicates Medicaid programevaluation and oversight. In the absence of a viable plan to broadly expandhealth insurance coverage, support for providers that serve low-incomepatients will become increasingly critical. It is essential that states and thefederal government come together to design funding strategies that equi-tably and effectively strengthen the nation’s health care safety net.
ENDNOTES1. Jack Hadley and John Holohan, “The Cost of Care for the Uninsured: What Do WeSpend, Who Pays, and What Would Full Coverage Add to Medical Spending?” KaiserCommission on Medicaid and the Uninsured, Washington, DC, May 10, 2004.
2. Medicare DSH data are from the Centers for Medicare and Medicaid Services, “Hospi-tal Cost Report: CMS-2552-96,” U.S. Department of Health and Human Services; accessedAugust 6, 2004, at www.cms.hhs.gov/data/download/hcris_hospital/default.asp. Med-icaid DSH data are from the Centers for Medicare and Medicaid Services, “Quarterly Med-icaid Statement of Expenditures for the Medical Assistance Program: CMS-64,” U.S. De-partment of Health and Human Services; accessed June 15, 2004, at www.cms.hhs.gov/medicaid/mbes/ofs-64.asp.
3. Ingrid Singer, Lindsay Davison, and Lynne Fagnani, “America’s Safety Net Hospitalsand Health Systems, 2001: Results of the 2001 Annual NAPH Member Survey,” NationalAssociation of Public Hospitals and Health Systems, Washington, DC, September 2003;accessed August 27, 2004, at www.naph.org/Content/ContentGroups/Publications1/MON_2003_09_characteristics.pdf.
4. Lynne Fagnani and Jennifer Tolbert, “The Dependence of Safety Net Hospitals andHealth Systems on the Medicare and Medicaid Disproportionate Share Hospital PaymentProgram,” Commonwealth Fund, New York, November 1999.
5. The Medicaid utilization rate is the ratio of Medicaid inpatient days to total inpatientdays. The low-income utilization rate is the sum of the ratio of Medicaid revenues dividedby total revenues and the ratio of inpatient charity care charges divided by total charges.
6. See, for example, National Health Policy Forum, The Basics: Medicaid Financing, Sep-tember 14, 2004, at www.nhpf.org/pdfs_basics/Basics_MedicaidFinancing.pdf.
7. Teresa A. Coughlin and David Liska, “The Medicaid Disproportionate Share HospitalPayment Program: Background and Issues,” Urban Institute, Washington, DC, October 1997.
8. Fagnani and Tolbert, “Dependence.”
9. U.S. General Accounting Office, “Medicaid: States Use Illusory Approaches to Shift Pro-gram Costs to Federal Government,” GAO/HEHS-94-133, Washington, DC, August 1994, 2.
10. In 1997 Congress raised the hospital-specific caps for public hospitals in California to 175percent. In 2000 it raised the caps to 175 percent for public hospitals for FY 2004 and FY 2005.

18
NHPF Background Paper September 14, 2004
11. Medicaid defines an IMD as “a facility of more than 16 beds that is primarily engagedin providing treatment services for individuals diagnosed with mental illness.”
12. U.S. General Accounting Office, “Medicaid: Disproportionate Share Payments to StatePsychiatric Hospitals,” GAO/HEHS-98-52, Washington, DC, January 1998.
13. See, for example, Karen Matherlee, “The Federal-State Struggle over Medicaid Match-ing Funds: An Update,” Background Paper, National Health Policy Forum, Washington,DC, May 31, 2002.
14. Office of the Inspector General, “Review of Medicaid Enhanced Payments to LocalPublic Providers and the Use of Intergovernmental Transfers,” A-03-00-002 16, U.S. De-partment of Health and Human Services, Washington, DC, September 2001.
15. Teresa A. Coughlin, Brian K. Bruen, and Jennifer King, “States’ Use of Medicaid UPLand DSH Financing Mechanisms in 2001,” Urban Institute, Washington, DC, January 2003.
16. U.S. General Accounting Office (GAO), “Medicaid: Improved Federal Oversight ofState Financing Schemes Is Needed,” GAO-04-228, Washington, DC, February 2004.
17. Summary information about DSH programs in Wisconsin, California, and New York isincluded in Barbara Wynn, Teresa A. Coughlin, Serhiy Bondarenko, and Brian Bruen, “Analy-sis of the Joint Distribution of Disproportionate Share Hospital Payments,” Project Memo-randum, Assistant Secretary of Planning and Evaluation, U.S. Department of Health andHuman Services, September 20, 2002; accessed May 1, 2004, at http://aspe.hhs.gov/health/reports/02/DSH/. Medicaid 2002 DSH payments reported in this section are from CMS-64 financial management reports accessed June 5, 2004, at www.cms.hhs.gov/medicaid/mbes/ofs-64.asp. CMS-64 reports may differ from state-specific sources.
18. Coughlin, Bruen, and King, “States’ Use,” January 2003. See also Teresa A. Coughlin,Leighton Ku, and Johnny Kim, “Reforming the Medicaid Disproportionate Share HospitalProgram,” Health Care Financing Review, 22, no. 2 (Winter 2000); Teresa Coughlin, BrianBruen, and Jennifer King, “States’ Use of Medicaid DSH and UPL Financing Mechanisms,”DataWatch, Health Affairs, 23, no. 2 (March/April 2004).
19. Wynn, Coughlin, Bondarenko, and Bruen, “Analysis.”
20. Raymond J. Baxter and Robert E. Mechanic, “The Status of Local Health Care SafetyNets,” Health Affairs, 16, no. 4 (July/August 1997).
21. Wynn, Coughlin, Bondarenko, and Bruen, “Analysis.”
22. Teresa A. Coughlin, Stuart Guterman, Brian K. Bruen, and Amy Westpfahl Lutzky,“The Medicaid DSH Program and Providing Health Care Services to the Uninsured: ALook at Five Programs,” Urban Institute, Washington, DC, March 2001.
23. See, for example, GAO, “Improved Federal Oversight”; U.S. General Accounting Office,“Medicaid: HCFA Reversed Its Position and Approved Additional State Financing Schemes,”GAO-02-147, October 2001; Kathryn G. Allen, U.S. General Accounting Office, “Medicaid:State Financing Schemes Again Drive Up Federal Payments,” GAO/T-HEHS-00-193, testi-mony before the Committee on Finance, U.S. Senate, Washington, DC, September 6, 2000.
24. U.S. General Accounting Office, “Major Management Challenges and Program Risks:Department of Health and Human Services,” GAO-03-101, Washington, DC, 27–29.
25. Penny Thompson, “Medicaid’s Federal-State Partnership: Alternatives for ImprovingFinancial Integrity,” Kaiser Commission on Medicaid and the Uninsured, Washington, DC,February 2004.
26. Medicare Payment Advisory Commission, Report to the Congress: Medicare PaymentPolicy, (Washington, DC: Medicare Payment Advisory Commission, March 1999), 60–66.
27. National Association of Public Hospitals and Health Systems, Safety Net Financing: APolicy Source Book for Healthcare Executives, ed. Jennifer Tolbert, (Washington, DC: NationalAssociation of Public Hospitals and Health Systems, June 2003).

19
NHPF Background Paper September 14, 2004
Percent of DSH Payment2001 DSH Total per Resident DSH perPayments Medicaid below Uninsured
(in thousands) Payments 100% FPL Person
U.S. Average $15,854,176 7.4% $482 $385
Alabama $366,738 12.8% $527 $640
Alaska $13,975 2.4% $259 $140
Arizona $102,774 3.9% $132 $108
Arkansas $22,685 1.2% $48 $53
California $1,926,284 8.1% $446 $287
Colorado $186,310 8.7% $486 $271
Connecticut $290,828 9.0% $1,168 $841
Delaware $4,140 0.7% $78 $57
District of Columbia $82,381 8.4% $816 $1,177
Florida $338,809 4.0% $163 $119
Georgia $425,146 8.4% $398 $309
Hawaii $0 0.0% $0 $0
Idaho $10,047 1.4% $67 $48
Illinois $379,004 4.9% $303 $226
Indiana $656,157 16.4% $1,284 $919
Iowa $14,273 0.9% $67 $66
Kansas $46,991 2.8% $176 $156
Kentucky $191,149 5.8% $380 $389
Louisiana $872,308 20.8% $1,230 $1,032
Maine $49,160 3.7% $372 $372
Maryland $62,822 1.9% $163 $96
Massachusetts $485,283 7.3% $865 $933
Michigan $431,720 6.0% $466 $420
Minnesota $64,322 1.7% $178 $164
Mississippi $178,733 7.3% $332 $389
Missouri $455,068 9.6% $847 $805
Montana $244 0.1% $2 $2
APPENDIX — TABLE 1Medicaid DSH Expenditures
per Enrollee and per Uninsured Person, 2001
(continued on next page)

20
NHPF Background Paper September 14, 2004
APPENDIX — TABLE 1 (continued)
Percent of DSH Payment2001 DSH Total per Resident DSH perPayments Medicaid below Uninsured
(in thousands) Payments 100% FPLa Person
Nebraska $318 0.0% $2 $2
Nevada $76,042 11.3% $500 $221
New Hampshire $158,370 18.1% $1,955 $1,331
New Jersey $1,117,458 15.7% $1,636 $1,008
New Mexico $15,265 1.0% $47 $41
New York $2,455,754 7.8% $922 $842
North Carolina $415,288 6.8% $410 $356
North Dakota $1,061 0.3% $12 $18
Ohio $637,259 7.6% $543 $511
Oklahoma $22,702 1.1% $45 $37
Oregon $30,494 1.1% $75 $69
Pennsylvania $761,019 7.0% $657 $680
Rhode Island $81,058 6.8% $811 $1,013
South Carolina $371,948 12.3% $617 $754
South Dakota $1,075 0.2% $17 $16
Tennessee $0 0.0% $0 $0
Texas $1,346,134 11.6% $430 $271
Utah $724 0.1% $3 $2
Vermont $26,500 4.4% $449 $457
Virginia $236,402 7.8% $419 $305
Washington $327,824 7.6% $517 $420
West Virginia $102,034 6.6% $351 $436
Wisconsin $11,855 0.3% $28 $29
Wyoming $241 0.1% $6 $3
Source: National Association for Public Hospitals, Safety Net Financing: A Policy Sourcebook forState Executives, June 2003.
Data from CMS-64 2001 annual reports and March 2002 current population survey.aFPL = federal poverty level ($17,650 for a family of four in 2001).

21
NHPF Background Paper September 14, 2004
APPENDIX — TABLE 2State Sources of Funds, Reported DSH Payments,
and Net DSH Payments by Entity in 2000:Summary Results from 32 States
Amount Percent of Percent ofSources of DSH Funds (in millions) Total State Share
Provider taxes $567.2 5.0 10.9
Local/county IGT $2,296.2 20.1 44.1and CPEa
State transfers and CPEs $1,068.9 9.3 20.5
General appropriations $1,276.9 11.2 24.5
Federal Medicaid match $6,237.6 54.5 N/A
Total fundsb $11,446.8 100.0 100.0
Reported DSH Payments
Private acute hospitals $3,630.7 33.8 N/A
Public (nonstate)acute hospitals $3,707.3 34.5 N/A
State acute hospitals $1,466.5 13.6 N/A
Private IMDsc $6.1 0.1 N/A
Public (nonstate) IMDs $110.8 1.0 N/A
State IMDs $1,823.4 17.0 N/A
Total DSH Payments $10,744.8 100.0
Net DSH Payments by Entity
Private or nonstatehospitals $4,592.0 73.6
State hospitals $944.1 15.1
State residual funds $701.7 11.2
Total net paymentsd $6,237.8 100.0
Source: Urban Institute, Survey of UPL and DSH Programs, 2002.
aCPE = certified public expenditurebSources of funds total exceeds DSH paymentstotal because certain states collect more thanthey need to cover the state share of DSH pay-ments.cIMD = institution for mental diseasedTotal gains is equal to total federal matchingfunds. A number of states make total DSHpayments above the federal matching fundsthey receive. In the aggregate, states with netpayments are combined with states that havenet DSH gains.
22
NHPF Background Paper September 14, 2004
APPENDIX — TABLE 3Net DSH Gains by Hospital Ownership and DSH Residual Funds in 32 States,
State Fiscal Year 2001(dollars in millions)
Gains to Gains to State Net Percent ofTotal Private or Nonstate State Residual State Gain
DSH Gains Entitiesa Entitiesa Fundsb Gain to Statec
Total (32 States) $6,237.7 $4,592.0 $944.1 $701.7 $1,645.8 26.0
Alabama $257.0 $232.0 $25.0 - $25.0 10.0
Alaska $4.8 - $4.8 - $4.8 100.0
California $1,020.6 $1,020.6 - - - 0.0
Connecticut $160.0 $232.4 ($72.4) - ($72.4) -45.0
District of Columbia $32.0 $36.0 ($4.0) - ($4.0) -13.0
Florida $203.9 $128.1 $75.8 - $75.8 37.0
Georgia $249.0 $228.0 $21.0 - $21.0 8.0
Idaho $1.0 $1.4 ($0.4) - ($0.4) -43.0
Indiana $185.5 $131.2 $54.3 - $54.3 29.0
Iowa $8.6 $1.8 $6.8 - $6.8 79.0
Kentucky $133.8 $86.6 $47.2 - $47.2 35.0
Louisiana $613.8 $74.2 $539.6 - $539.6 88.0
Maryland $40.4 $40.2 $0.2 - $0.2 0.0
Massachusetts $242.7 $91.2 ($91.2) $242.6 $151.5 62.0
Michigan $244.5 $196.5 $48.0 - $48.0 20.0
Mississippi $139.4 $35.5 $17.2 $86.7 $103.9 75.0
Missouri $280.1 $102.1 $178.0 - $178.0 64.0
Nebraska $6.1 $8.5 ($2.4) - ($2.4) -39.0
New Jersey $577.0 $699.0 ($432.0) $310.0 ($122.0) -21.0
North Dakota $0.7 $0.3 $0.4 - $0.4 52.0
Ohio $363.0 $290.9 $72.1 - $72.1 20.0
Oklahomad $16.6 $1.0 $15.6 - $15.6 94.0
Oregone $8.6 $11.6 ($3.0) - ($3.0) -35.0
South Carolina $262.0 $198.3 $63.7 - $63.7 24.0
Texas $830.0 $548.0 $282.0 - $282.0 34.0
(continued on next page)

23
NHPF Background Paper September 14, 2004
Gains to Gains to State Net Percent ofTotal Private or Nonstate State Residual State Gain
DSH Gains Entitiesa Entitiesa Fundsb Gain to Statec
Utah $2.7 $1.4 $1.3 - $1.3 49.0
Vermont $15.2 $24.5 ($9.3) - ($9.3) -61.0
Virginia $97.2 $17.8 $79.4 - $79.4 82.0
Washington $176.0 $93.7 $19.9 $62.4 $82.3 47.0
West Virginia $58.9 $50.3 $8.7 - $8.7 15.0
Wisconsin $6.6 $8.7 ($2.1) - ($2.1) -32.0
Wyoming $0.1 $0.1 ($0.1) - ($0.1) -56.0
Source: Urban Institute, Survey of UPL and DSH Programs, 2002
Notes:aDSH payments to both acute care and mental hospitals are combined for each ownership type shown.bResidual funds are state revenues received in excess of the amount needed to draw down the maximum amount of federal funds available based on each state’sreported total DSH payments. In states taking in excess funding, the [Urban Institute] authors cut back the level of funding reported from each source (forexample, private, local or state) proportionate to the levels reported to estimate the amounts used to draw down federal matching funds. The amount of federalmatching funds needed was estimated based on total DSH payments.cThese percentages represent the share of total gains from DSH, including residual funds, that are kept by state entities.dGains to state-owned acute-care hospitals in Oklahoma include payments to a former state operated hospital that has entered into a jointoperating agreement with a private hospital system.eOregon did not provide revenue or payment information for the state’s mental health DSH program in its survey response, but the statemakes approximately $17 million in DSH payments to mental hospitals annually, according to CMS data.
APPENDIX — TABLE 3 (continued)
24
NHPF Background Paper September 14, 2004
State Share of DSH Revenues 1993a 1997b 2001b
Provider Taxes and Donations 48.4 18.2 11.6
County/Local Fundsc 27.0 42.0 47.2
State Fundsd 24.7 39.8 41.2
Total 100.0 100.0 100.0
Federal Percentage of DSH Revenues 49.4 52.2 54.4
DSH Expenditures
Payback to Private and County/Local 38.1 28.8 26.8
Private and County/Local Gain 17.6 27.4 38.6
Payback to State 12.5 19.0 18.8
State Hospital Gain 17.9 14.3 9.2
Residual Funds for State Use 13.8 10.5 6.6
Total 100.0 100.0 100.0
Source: Urban Institute, Survey of State Medicaid DSH and Other Payment Programs.aBased on 1993 survey data from 31 states (which differ slightly from states in other years).bBased on 1997 and 2001 survey data from 27 states. Percentages differ from those in Table 1, whichincludes 32 states.cCounty/local funds include both intergovernmental transfers and certified public expenditures fromcounty or local hospitals or entities.dState funds include both certified public expenditures and state transfers.
APPENDIX — TABLE 4Distribution of DSH Program Revenues and Expenditures
(in percent)