mediation and moderation: what are they? are they for me?
TRANSCRIPT

4251 3
0011 0010 1010 1101 0001 0100 1011
Mediation and Moderation:
What are they? Are they for me?

Overview
• Definitions of M&M and Differences between M&M
• Methods for testing for mediation• Advanced topics in mediation• Methods for testing for moderation• Advanced topics in moderation• Advanced topics in mediation and
moderation

Simple Mediation and Moderation:Similarities
• Both involve 3 variables• The goal is to determine how a third
variable affects the simple relationship between two variables
• Both can be analyzed with regression or structural equation modeling (SEM) software

Simple Mediation and Moderation:Differences
• Moderation involves product terms, not mediation
• Mediation is best used with longitudinal data, but this is not required for moderation
• Centering variables is usually required in moderation, but not in mediation
• Graphing is essential in moderation, but only highly recommended in mediation

Definitions and Important Questions
• Mediation– A mediating variable is the mechanism by
which an effect occurs between a predictor and an outcome
– The important question is whether a third variable (Med) partially or completely controls the relationship between a predictor (X) and an outcome (Y)

Definitions and Important Questions
• Moderation– A moderating variable is one that affects the
direction and/or strength of the relationship between a predictor variable and a criterion variable
– The important question is whether the relationship between the predictor (X) and the outcome (Y) differs across the levels of the moderator (mod)

Frequency of Mediation Analyses
• Number of mentions of “mediation” “mediator” or “mediates” in the title of psychology journal articles, 1970 - 2010
1970s 1980s 1990s 2000s0
1000
2000
3000
267639
1182
2893
Years
Frequency

Introduction to Mediation
• Simple Model

Introduction to Mediation
• Mediation Model

Introduction to Mediation
• Rephrasing the important question:– Does the simple relationship between X and Y
[c] shrink or disappear when the mediator is present in the model (i.e., is c΄<c, or is c΄=0)?
– A relationship that shrinks indicates partial mediation, whereas a relationship that disappears indicates full mediation• More on full and partial mediation to come

Decomposition of Effects
• Total Effect = Indirect Effect + Direct Effect• c = c΄ + ab
– Thus, ab = c - c΄
• This holds exactly for least squares estimates (e.g., standard multiple regression), but is only an approximation with other estimation methods

Baron & Kenny …I wish I was cited like that
• The most famous reference to mediation is Baron & Kenny (1986)
• Baron, R. M., & Kenny, D. A. (1986). The moderator-mediator variable distinction in social psychological research: Conceptual, strategic, and statistical considerations. Journal of Personality and Social Psychology, 51, 1173-1182
• This paper has been referenced more than 25000 times

Why was the Baron & Kenny article so popular?
• It laid out mediation in a set of simple to implement steps:
1) Test X -> Y (path c)
2) Test X -> M (path a)
3) Test M -> Y, controlling for X (path b)
4) Test X -> Y, controlling for M (path c΄)
– If steps 1 to 3 are significant, and c΄ is reduced then we have partial mediation (or if c΄ = 0 we have full mediation)
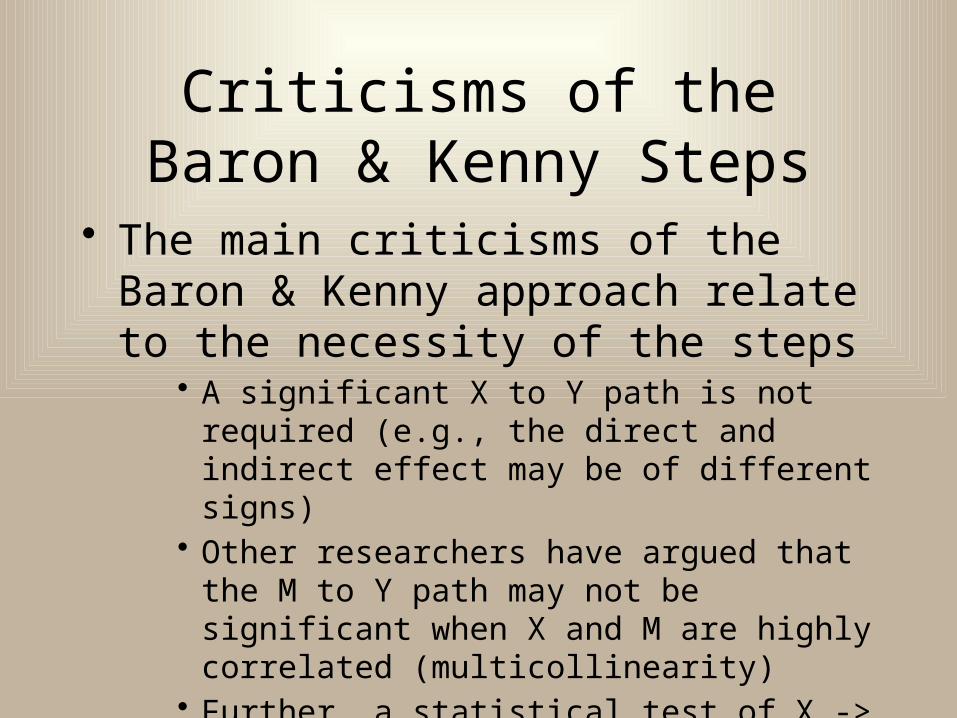
Criticisms of the Baron & Kenny Steps
• The main criticisms of the Baron & Kenny approach relate to the necessity of the steps
• A significant X to Y path is not required (e.g., the direct and indirect effect may be of different signs)
• Other researchers have argued that the M to Y path may not be significant when X and M are highly correlated (multicollinearity)
• Further, a statistical test of X -> Y in the last step is meaningless since it cannot prove partial or full mediation

How do we test for partial mediation?
• There are two popular approaches for testing whether c΄ < c (i.e., whether partial mediation has occurred)– Sobel Test
• OK test when sample sizes are large (>100)
– Bootstrapping• Good test for small or large sample sizes
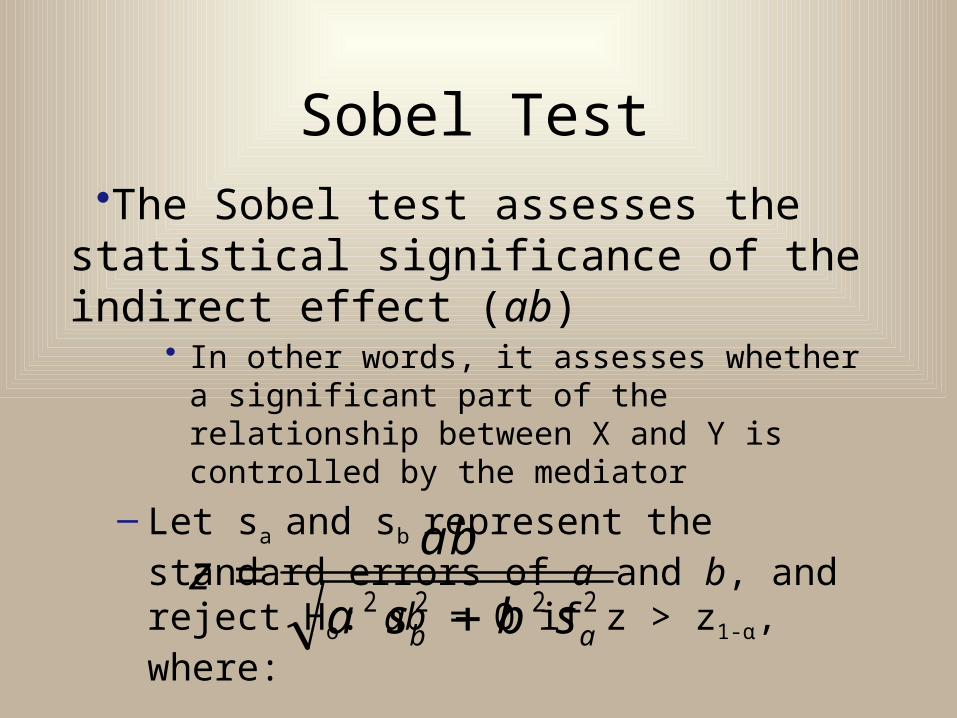
Sobel Test•The Sobel test assesses the statistical
significance of the indirect effect (ab)• In other words, it assesses whether a significant part
of the relationship between X and Y is controlled by the mediator
– Let sa and sb represent the standard errors of a and b, and reject Ho: ab = 0 if z > z1-α, where:
zab
a s b sb a
2 2 2 2

Problem with the Sobel Test
• The distribution of ab is highly positively skewed, and thus relying on a method that assumes a normally distributed sampling distribution (i.e., Sobel test) reduces power– In other words, the tail probability is going to
be larger (larger p-value) if we assume a normal distribution than if we assume a skewed distribution

Bootstrapping
• Bootstrapping allows researchers the opportunity to resample from the data in order to generate an empirical sampling distribution of ab
• Researchers can then use the empirical (bootstrap) estimate of ab, along with the standard error of the bootstrap estimates, to compute a z statistic or a confidence interval (which will generally be asymmetric)

Example
•Let’s say we are interested in determining if anxiety (anx) mediates the relationship between hindrances to doing well in a stats course (hindr) and the exam average (exavg)
– r(anx,hindr)=.452*– r(anx,exavg)=-.367*– r(hindr,exavg)=-.303*
• Let’s use α = .05

Mediational Model
Hindrances
Anxiety
ExamAverage

Regression Equations•Predicting exavg from hindr:
–Exavg = -3.874 (hindr) + 91.825 (p < .001)
• Predicting anx from hindr:–Anx = .552 (hindr) + .335 (p < .001)
•Predicting exavg from both hindr and anx:–Exavg = -2.203 (hindr) -3.027 (anx) + 94.352–p-value for hindr = .062; p-value for anx = .002
•Therefore, since p(hindr)> α, many would say (but we won’t) that anx fully mediates the prediction of exavg from hindr

Added Variable Plots• The relationship between examavg and hindrances
is weaker after controlling for anxiety
b=-3.87 b=-2.20

Sobel Test• We can evaluate whether or not anx is a
significant mediator by using the Sobel test– More specifically, we can evaluate the significance of
the indirect effect using the Sobel test– We will need the regression coefficients (and standard
errors) for: 1) predicting anx from hindr and; 2) predicting exavg from anx, with hindr in the equation:• Anx = .335 + 0.552 (hindr)
– [SE (hindr) = .097]
• Exavg = 94.352 - 2.203 (hindr) - 3.027 (anx) – [SE (anx) = .959]

ExampleSobel Test Calculation
•Therefore, with Sobel z = -2.76 (p = .0058), we can say that anxiety significantly mediates the relationship between stats related hindrances and the exam average•A Sobel calculator is available at:
•http://www.afhayes.com/spss-sas-and-mplus-macros-and-code.html
zab
a s b sb a
2 2 2 2 2 2 2 2
5 5 2 3 0 2 7
5 5 2 9 5 9 3 0 2 7 0 9 72 7 6
. * .
. * . ( . ) * ..

Bootstrap Analyses
• Method 1: AMOS • or any other SEM software that computes
bootstrapped indirect effects and standard errors
– Indirect Effect: -1.671– Standard Error: .668– z = -1.671/.668 = -2.50 (p = .0062)

Bootstrap Analyses
• Method 2: SPSS/SAS/MPlus Macros• http://www.afhayes.com/spss-sas-and-mplus-macros
-and-code.html
– Indirect Effect: -1.683– 95% CI: -3.145, -.5982– Standard Error: .678– z = -1.683/.678 = -2.48 (p = .0066)

Effect Size Measures
• Completely Standardized Indirect Effect– Product of the Beta coefficients for a and b– βa = .452
– βb = -.289
– CSIE = .452 * -.289 = -.131• According to Cohen, .01-.09 is small, .10-.25 is
medium, and .25 + is large
– Thus we have a medium sized indirect effect

Effect Size Measures
• Proportion of the Total Effect that is Mediated– An alternative to the CSIE, that is very intuitive
• % Mediated = indirect effect / total effect = ab / c
– For our example:• % Mediated = -1.671 / -3.874 = 43%• Therefore, 43% of the relationship between
hindrances to doing well in stats and the exam average is mediated by stats-related anxiety

Full Mediation• There is a lot of debate over how to
determine full mediation, or whether full mediation could ever exist in psychology– Initially, it was suggested by Baron & Kenny that
a nonsignificant predictor effect, after controlling for the mediator (path c΄), would indicate full mediation• However, statistical significance on its own is not
good, and with a small sample size, or a weak X-Y relationship, we would find full mediation too often

Full Mediation, cont’d
• It has been suggested that a significant Sobel test, and a % Mediated > .80, is indicative of full mediation (davidakenny.net/cm/mediate.htm)
• Constance Mara derived an equivalence- and bootstrap-based test of full mediation that involves demonstrating that the raw correlation (rxy) is equivalent to the correlation implied by the indirect effect (rxy*) = βaβb

Multiple Mediators
• Many models evaluate the effects of more than one mediator
• It is best to investigate all potential mediators in one model so that you control for the effects of the different mediators
• It is also advantageous to use statistical software to conduct the separate mediational analyses simultaneously

Mediational Model
Hindrances
Anxiety
ExamAverage
ExamAbility

Multiple Mediator Model in AMOS
• A disadvantage of AMOS is that generally it only provides a total indirect effect, not the separate indirect effects for each mediator
• We can use “ghost variables” to be able to obtain the separate indirect effect estimates

Multiple Mediational Model in AMOS
Hindrances
Anxiety
ExamAverage
ExamAbility
a1
a2 b2
b1
b2b1
a2a1

Bootstrap Analyses
• Method 1: AMOS – Anxiety as Mediator:
– Indirect Effect: -1.813– Standard Error: .670– z = -1.859/.689 = -2.69 (p = .0036)
– Exam Ability as Mediator– Indirect Effect: .265– Standard Error: .244– z = .265/.244 = 1.086 (p = .1387)

Bootstrap Analyses
• Method 2: SPSS Macro from Preacher/Hayes– Anxiety as Mediator:
– Indirect Effect: -1.859– 95% CI: -3.3939, -.6915– Standard Error: .689– z = -1.859/.689 = -2.69 (p = .0036)
– Exam Ability as Mediator– Indirect Effect: .275– 95% CI: -.0550, .9573– Standard Error: .247– z = .275/.247 = 1.113 (p = .1330)

Further Topics in Mediation
• Latent Variable Mediation Models• Categorical Outcomes• Dichotomous or Multicategorical Predictors• Nonlinear relationships• 4 variable mediation chains
– X M1 M2 Y

Introduction to Moderation• What is moderation? …. INTERACTION!
– The effect of X on Y differs at different levels of the moderator• Ex: The effects of provoked anger on aggression
differs at different levels of trait aggressiveness
– We could deal with interactions in ANOVA (all categorical predictors), but ‘moderation’ often implies interaction with at least one continuous variable (and we would never categorize a continuous variable in order to use ANOVA!)

Visual Representations of Moderation
YX
Mod
X
ModX*Mod
Y
Understanding Moderation
• Interaction terms represent a relationship between X and Y, and Mod and Y, that is more than just additive– In other words, the combined effect of X and
Mod is more substantial than what would be expected by just summing the effects of X and Mod
Y
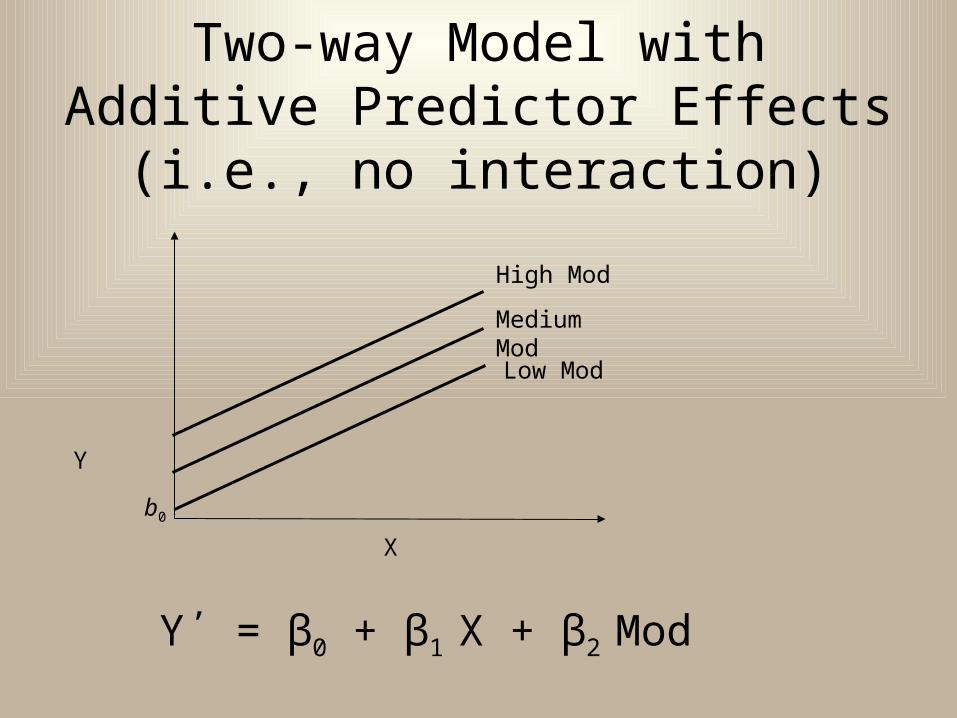
Two-way Model with Additive Predictor Effects (i.e., no interaction)
X
b0
Low Mod
Medium Mod
High Mod
Y΄ = β0 + β1 X + β2 Mod

Two-way Model with Interaction
X
b0
Low Mod
Med Mod
High Mod
Y΄ = β0 + β1X + β2Mod + β3X*Mod
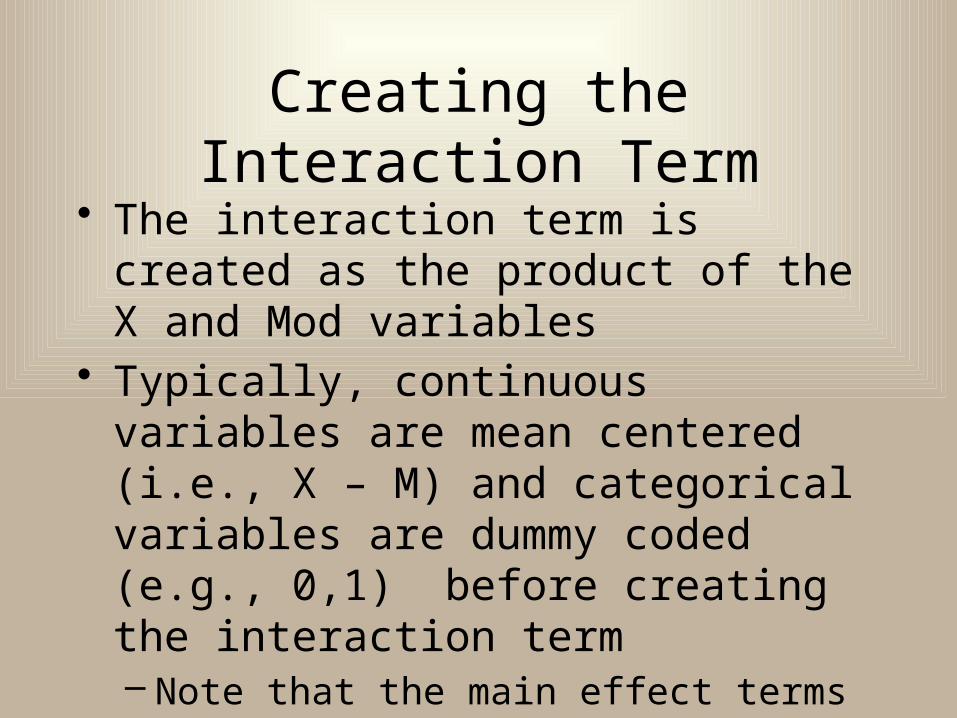
Creating the Interaction Term• The interaction term is created as the
product of the X and Mod variables• Typically, continuous variables are mean
centered (i.e., X – M) and categorical variables are dummy coded (e.g., 0,1) before creating the interaction term– Note that the main effect terms must be
included in the model with the interaction term, or the interaction term is confounded

Centering• Centering does not affect the interaction
term (β3)
• In fact, centering is not necessary for simply screening for the presence of an interaction
• However, if you are going to interpret the main effects with the interaction term in the model (e.g., for conducting simple effects), then the interaction term should be created using appropriate centering

More on Centering• When an interaction term is present in a model,
the effect of X is interpreted as the effect of X when Mod = 0 (or the effect of Mod when X = 0), which is often uninformative
• Thus, we want to create an interaction term which allows us to interpret the main effects in a meaningful way, for example the effect of X at the mean of Mod (which will be important for understanding the nature of interactions)
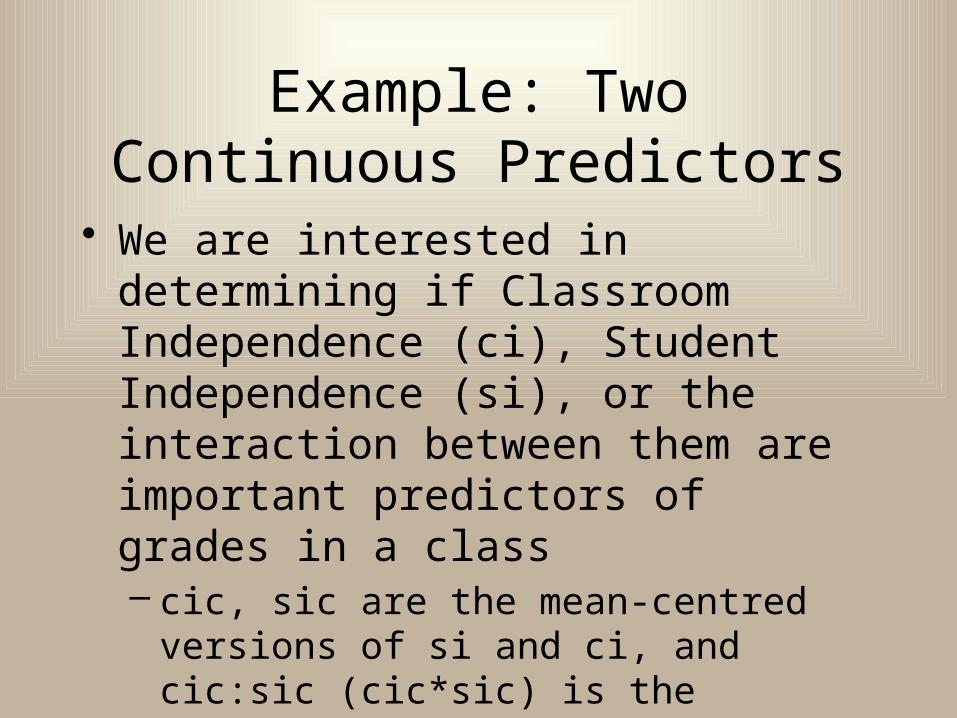
Example: Two Continuous Predictors
• We are interested in determining if Classroom Independence (ci), Student Independence (si), or the interaction between them are important predictors of grades in a class– cic, sic are the mean-centred versions of si and
ci, and cic:sic (cic*sic) is the interaction term
• We start by exploring the interaction
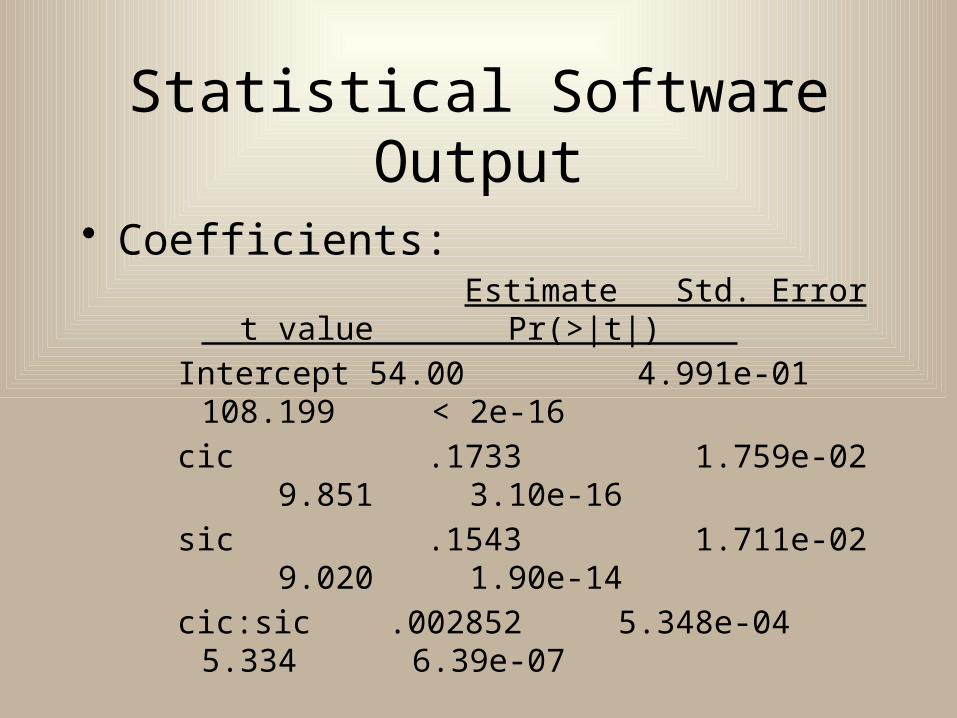
Statistical Software Output
• Coefficients: Estimate Std. Error t value Pr(>|t|)
Intercept 54.00 4.991e-01 108.199 < 2e-16
cic .1733 1.759e-02 9.851 3.10e-16
sic .1543 1.711e-02 9.020 1.90e-14
cic:sic .002852 5.348e-04 5.334 6.39e-07
- Since the interaction is significant, we want to explore the nature of the interaction (and avoid trying to interpret the main effects)

R Plot of the Interaction

Interpreting the Nature of the Interaction
• As si increases, the relationship between ci and grades gets stronger
• Although this R plot is very informative, often researchers follow traditions such as creating a plot of the effect of ci on grades at the mean and +/- one standard deviation from the mean of si, and obtaining the significance of the simple slopes
• These plots/analyses are done using the calculators at: http://quantpsy.org/interact/mlr2.htm, and excel files are available at: http://www.jeremydawson.co.uk/slopes.htm

Plot of the Interaction
• 1 sd below mean, mean, 1 sd above mean

Simple Slopes Analysis
• Simple Slopes at Conditional Values of SIC– At 1 sd below the mean on SIC
• cic simple slope = 0.0991, t=3.379, p=0.0011
– At the mean on SIC• cic simple slope = 0.1733, t=9.851, p<.0001
– At 1 sd above the mean on SIC• cic simple slope = 0.2475, t=9.7616, p<.0001

Simple Slopes Analyses
• It is very easy to conduct simple slopes analyses without available macros
• Since our interaction terms were created from centered variables, the effect of cic on grades is at the mean of sic (i.e., sic = 0) so that is our first simple slope
• We can obtain the simple slope of cic on grades at one sd below the mean on sic by shifting our data so that sic = 0 is at one sd below the mean
– We do that by ADDING one sd to the scores on the centred si variable before creating the interaction term
• We reverse this procedure for obtaining the simple slope of ci on grades at one sd above the mean of si

More on Simple Slopes Analyses• Simple slopes analyses are often over-used
– A significant interaction indicates that the effect of X on Y differs across the levels of mod
– So, if you focus on the significance of the simple slopes, you might be missing the important point which is that the slopes differ significantly (regardless of the statistical significance of any particular simple slope)• This is the same as focusing on simple effects when
following up an interaction in ANOVA
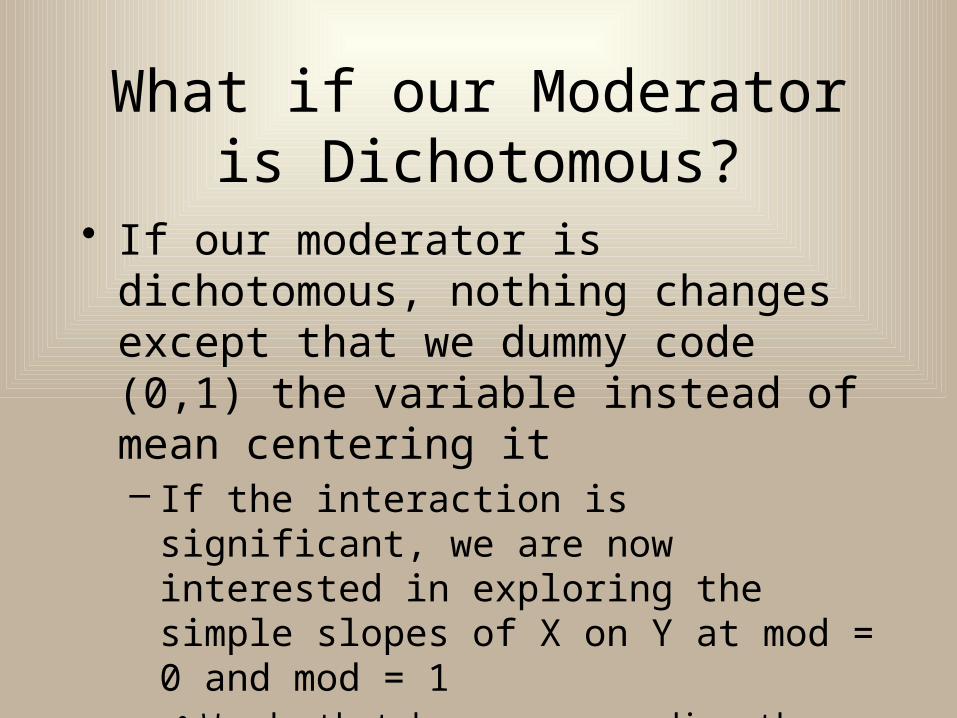
What if our Moderator is Dichotomous?
• If our moderator is dichotomous, nothing changes except that we dummy code (0,1) the variable instead of mean centering it– If the interaction is significant, we are now
interested in exploring the simple slopes of X on Y at mod = 0 and mod = 1• We do that by reverse coding the variable in order to
obtain both simple slopes
– As before we can graph and explain the nature of the interaction

What if our moderator is multicategorical?
• If our moderator has more than two categories (c), then we need c-1 dummy variables– 3 Category Example (first category as referent):
• Dummy Variable 1 (DV1): c1=0, c2=1, c3=0• Dummy Variable 2 (DV2): c1=0, c2=0, c3=1
– We now create 2 interaction variables:• Int 1 = DV1 * X (note that X is mean centered)• Int 2 = DV2 * X

What if our moderator is multicategorical?
• We include X, both dummy variables, and the two interaction variables in our regression equation– The significance of the interaction is determined using
the R2 change from a hierarchical regression, where the interaction terms are added to the model after the main effects
Y΄ = β0 + β1X + β2DV1+ β3DV2 + β4X*DV1+ β5X*DV2

What if our moderator is multicategorical?
– To follow-up a significant interaction, it is again important to plot the interaction• The simple slopes from the plots are useful for
interpretation (i.e., understanding how the relationship between X and Y differs for different levels of mod), but the significance of the simple slopes is usually uninformative
– Useful tests for interpreting the interaction are the DV*X interactions, as each tests whether the slope differs for the referent and the comparison groups (and the referent group can be changed)

Higher-Order Interactions
• If you are interested in testing 3-way interactions in regression (and I don’t recommend testing 4-way or higher interactions), all of the same centering, coding, etc. rules apply
• The question being asked is whether the 2-way interaction between X and Z differs across the values of mod

Higher-Order Interactions
– Interpreting 3-way interactions REQUIRES plots– More specifically, start by plotting the X*Z
interaction at different levels of mod, and then following up each as if it were a two-way interaction• There are different ways to plot the interaction, and the
method you choose will depend on how the variables are coded and the theory being evaluated
• As always, try to focus less on the significance of the simple slopes, or simple, simple slopes, and more on interpreting the nature of the interaction
Y΄ = β0 + β1X + β2Z+ β3Mod + β4X*Z+ β5X*Mod + β6Mod*Z+ β7X*Z*Mod

Further Topics in Moderation and Mediation
• Categorical outcome variables• Moderated Mediation• Mediated Moderation• Nonlinear interactions• Comparing Software for Analyzing
Mediation and Moderation• Etc., Etc., Etc. ……