and analysis... · web viewchapter 3 presents analysis and information about the telecommunications...
TRANSCRIPT

Chapter 3Telecommunications consumer safeguards and quality of service OverviewChapter 3 presents analysis and information about the telecommunications industry’s performance in meeting key regulatory obligations. Areas of compliance examined within this chapter relate to each of the following: the Telecommunications (Customer Service Guarantee) Standard 2011 (CSG Standard); the Network Reliability Framework (NRF); priority assistance; number portability and telemarketing and spam investigations. Industry compliance with telecommunications codes, trends in TIO complaints and the ACMA’s consumer satisfaction research are also examined.
Key developments in relation to these matters during 2012–13 included:> declines in the total number of payphones and the number of fixed-line services
covered by the CSG Standard > increase in the number of occasions where customers waived their rights under the
CSG Standard (iiNet received a majority of these waivers)> increase in the amount of compensation payments to customers as a result of
failing to meet CSG Standard time frames> major carriers meeting CSG Standard time frames for new service connections in
most cases> an increase in the number of local numbers ported and a decline in the number of
mobile numbers ported> an increase in the number of participants on the DNCR> a decline in the average number of automated daily reports provided to ISPs about
infected computing devices residing on their networks> a decline in complaints to the ACMA regarding potential breaches of the DNCR Act
and a decline in complaints to the TIO> overall satisfaction levels were marginally higher for fixed-line telephone and
internet users than mobile phone and VoIP users.
Fixed-line consumer safeguardsAmendments to telecommunications legislation during 2010 introduced new powers. They included strengthening the protections offered by the Universal Service Obligation (USO) and the customer service guarantee (CSG), to enable the ACMA to continue to protect consumers in the transition to the NBN, to maintain and improve service quality and to ensure continued access to basic voice services.
In the previous reporting period, the CSG performance reporting was consistent with the approach applied previously, rather than fully reflecting the new benchmark obligations—for reasons outlined in the ACMA Communications report 2011–12. In 2011–12, an assessment of compliance was undertaken by the ACMA, with no breaches being found. While no enforcement action was considered appropriate, Telstra was advised that the ACMA would continue to monitor compliance with CSG benchmarks closely under the new arrangements.
acma | 59

For the period 2012–13, the ACMA assessed the compliance of four qualifying carriage service providers (QCSPs) (Telstra, Optus, Primus and iiNet) against the CSG benchmarks.1 Telstra’s compliance against the payphone benchmarks was also assessed. Based on the CSG and payphone record-keeping rule compliance data provided to the ACMA, Optus, iiNet and Primus met all of the CSG benchmark requirements and Telstra met all payphone benchmark requirements. However, Telstra did not meet two of the nine annual CSG benchmarks—new connection of services in urban areas and remote areas nationally.
To ensure the delivery of universal service outcomes and public interest telecommunications services during and after the transition to the NBN, the Telecommunications Universal Service Management Agency (TUSMA) was established in 2012 under the Telecommunications Universal Service Management Agency Act 2012 (TUSMA Act). TUSMA commenced operations from 1 July 2012. TUSMA manages contracts and grants to support the delivery of USO services, being the standard telephone service and payphones, as well as other public interest telecommunications services such as emergency call person services and the NRS.
During 2012–13, the ACMA provided advice and assistance to the Department of Broadband, Communications and the Digital Economy (now the Department of Communications) and TUSMA in setting up the legislative, policy and procedural arrangements to deliver public policy outcomes. These services and TUSMA’s costs to deliver them are part funded by the government, with the remainder shared by telecommunications carriers that earn above $25 million, through applying the telecommunications industry levy (TIL). The TIL replaces the USO and NRS levies, which were charged to carriers for the last time during the 2012–13 financial year for the purposes of the 2011–12 eligible revenue period. Under the TUSMA Act, the ACMA has an ongoing statutory role to undertake the assessment, collection and recovery of the levy imposed by the Telecommunications (Industry Levy) Act 2012 from the 2012–13 eligible revenue period (to be paid in the 2013–14 financial year) onwards.
The TIL and other public policy outcomesThe TIL funds the residual costs (after government funding) of activities undertaken by TUSMA. In particular, this levy provides for:> reasonably accessible standard telephone services and payphone services to all
Australians on an equitable basis, regardless of where they live or carry on business (the USO for voice telephony services and the USO for payphones)
> a national telephone service to enable people who are deaf or have a hearing and/or speech impediment to make and receive telephone calls (the NRS)
> delivery of emergency call person services > delivery of other public policy telecommunications outcomes.
The ACMA is responsible for the billing and collection of the TIL, while TUSMA manages the contractual arrangements and service provider payments. This provides greater transparency in this process.
60 | acma

Period in which eligible revenue is earned
Period in which eligible revenue return is lodged
and assessed
Period in which payment is made by Participating
Persons for eligible revenue earned in ERP
Industry levies and paymentsThe ACMA manages the assessment and collection of levies over a three-year cycle.
Eligible Revenue Period Eligible Levy Period Financial year (ERP) (ELP) 2011–12 2012–13 2013–14
The TIL amount of a carrier licence holder, who was a participating person under the TUSMA Act, is the amount which that person must contribute to the cost of funding TUSMA. Contributions are, in general, proportional to that participating person’s share of the industry’s total eligible revenue for the relevant eligible revenue period.
For the delivery of TIL and other public policy telecommunications outcomes during the 2012–13 eligible levy period (ELP), the assessed eligible revenue of participating persons, will be used to calculate the amount of TIL and annual carrier licence charges (ACLC). The TIL will be invoiced to participating persons in the 2013–14 financial year.
ACLC are imposed under the Telecommunications (Carrier Licence Charges) Act 1997 and payable by participating persons. The ACLC was invoiced to participating persons in the 2012–13 financial year.
Final TIL assessmentFollowing advice from the ACMA, the minister determined the amount of the 2012–13 TIL as $254.9 million. This amount differs significantly to previous years as the scope of the levy has changed. The final TIL for the 2012–13 ELP is $254,927,064.42, which will be invoiced and collected during the 2013–14 financial year.
There were 206 carriers and 52 participating persons assessed for the 2012–13 ELP. Fourteen were assessed as having nil eligible revenue and were not required to contribute to the TIL. The levy payable by the remaining participating persons ranged from $52 to $155.6m.
Table 3.1 below sets out the TIL liabilities of participating persons (in excess of $1m) and now includes Telstra, as it is required to pay its levy to the ACMA, rather than the offset arrangements of previous years.
As a transitional arrangement, the Commonwealth has contributed $34,108,165.93 to ‘cap’ the total non-Telstra contribution to 2012–13 TIL at the same total amount paid by them for the previous year’s USO and NRS levies.
Table 3.1 Levies payable (in excess of $1m, and net of government contribution) for participating persons, 2012–13 levy period (payable in the 2013–14 financial year)
Sub-total Levy ($)
TelstraTelstra Corporation Limited 155,620,463.33
Telstra Multimedia Pty Limited 1,829,416,73 157,449,880.06
Optus
acma | 61

Optus Mobile Pty Limited 26,928,222.73
Optus Networks Pty Limited 8,578,503.35 35,506,726.08
VodafoneVodafone Australia Pty Limited 10,988,277.22
Vodafone Hutchison Australia Pty Limited 6,057,728.02 17,046,005.24
AAPT 1,375,103.37
Chime Communications Pty Ltd 1,275,842.92
Source: The ACMA.
Public payphonesPayphone services in Australia are provided on either a commercial basis or as part of the USO. Telstra is the current primary universal service provider (PUSP) for payphones and from 1 January 2012, it must comply with payphone performance standards and benchmarks made by the minister under the Telecommunications (Consumer Protection and Service Standards) Act 1999 (the TCPSS Act).
The ACMA monitors Telstra’s payphone performance and also receives information about the number of payphones supplied or operated on a commercial basis by other providers.
Numbers of payphones and payphone sitesDuring 2012–13, the total number of payphones (both Telstra-operated and privately operated) in Australia fell by five per cent from 31,032 to 29,523. This comprised:> a net decrease of 1.2 per cent in the number of Telstra-operated payphones,
from 18,246 to 18,035> a net decrease of 10.2 per cent in the number of privately operated payphones,
from 12,786 to 11,488.
During the reporting period, there was a decrease of 0.4 per cent in the number of Telstra-operated payphone sites, from 14,991 to 14,938 (noting some sites have more than one payphone). At 30 June 2013, 61.1 per cent of payphones were operated by Telstra. The remaining payphones were provided by other telecommunications companies, such as TriTel Australia Pty Ltd (the second-largest provider of payphones) or other businesses, such as hotels, clubs and convenience stores.
Figure 3.1 shows that the total number of Telstra-operated and non-Telstra-operated payphones has decreased over the past five reporting periods, while the annual number of payphone removals has also generally declined over the same period. The net annual reduction in Telstra-operated payphones has reduced over this period from 1,666 payphones in 2009–10 to 304 payphones in 2010–11, 467 payphones in 2011–12 and 211 payphones in 2012–13.
62 | acma

Figure 3.1 Number of payphones in operation
Jun-09 Jun-10 Jun-11 Jun-12 Jun-13
20,68319,017 18,713 18,246 18,03518,645
15,99514,488
12,78611,488
Telstra-operated Non-Telstra-operated*
Num
ber o
f pay
phon
es
*Includes TriTel payphones and payphones provided via Telstra access lines.Source: Telstra and TriTel.
Table 3.2 provides the geographic distribution of Telstra payphones and payphones provided via Telstra access lines as at 30 June 2013.
Table 3.2 Distribution of Telstra payphones by geographical category, 30 June 2013
Urban Rural Remote* RIC
Telstra-operated payphones12,363(68.6%)
4,777(26.4%)
895(5.0%)
592(3.3%)
Other payphones (provided via Telstra access lines) 8,252 2,022 403 254
RIC=Remote Indigenous communities.*Including RIC.Note: Excludes TriTel payphonesSource: Telstra.
Payphone fault repair performanceTimely repair of payphone faults is an important component of the equitable provision of payphone services under the USO.
From 1 January 2012, regulatory benchmarks were put in place for Telstra’s performance in remediating faults under the Telecommunications Universal Service Obligation (Payphone Performance Benchmarks) Instrument (No. 1) 2011 (Payphone Performance Benchmarks). These benchmarks relate to performance against standards for the repair of payphones. The time frames vary according to the location of the service—one working day for urban locations, two for rural and three for remote locations (including remote Indigenous communities).
Table 3.3 shows Telstra’s national performance in repairing faults for 2012–13 against the payphone fault repair performance benchmarks detailed in the Payphone Performance Benchmarks. Failure to meet a benchmark under this instrument may result in the ACMA taking compliance action.
acma | 63

Table 3.3 Telstra payphone fault repair performance, 2012–13
Urban Rural Remote*
Payphone fault repair benchmark 90.0% 90.0% 80.0%
Fault repair performance 96.1% 96.2% 88.7%
*Including RIC.Source: Telstra.
Installation of payphonesUnder the Telecommunications Universal Service Obligations (Location of Payphones) Determination 2011, communities or members of the public can apply for installation of a Telstra-operated payphone in a public place. During 2012–13, there were 53 such applications, of which 50 (94 per cent) were accepted by Telstra.
Payphone removalsTable 3.4 shows the number of Telstra payphones removed from service, the number of installations and the number of proposed removals cancelled by Telstra during 2012–13. All removals, where the payphone is the last remaining payphone at the site, are only undertaken after public consultation or after the withdrawal of the property owner’s consent to retain the payphone at a site.
Table 3.4 Telstra payphone removals and installations, 2012–13
Urban Rural Remote* Total
Telstra payphones removed 275 22 28 325
Telstra payphones installed 105 6 3 114
Cancellation of proposed payphone removals 2 2 0 4
*Including RIC.Source: Telstra.
Payphones for people with disabilitiesAt 30 June 2013, Telstra had 151 teletypewriter payphones in operation in metropolitan and regional areas, a decrease of two from the previous year.
Customer Service Guarantee StandardThe CSG Standard sets minimum service standards for CSPs in installing and repairing standard telephone services and meeting appointments for residential and small business customers. A CSP is exempt from complying with a performance standard for a service if the CSP supplies a customer with more than five services. If a CSP fails to meet the minimum performance standards, compensation may be payable to the customer.
In addition, formal CSG performance benchmarks commenced on 1 October 2011. These benchmarks are established by the Telecommunications (Customer Service Guarantee – Retail Performance Benchmarks) Instrument (No. 1) 2011 and apply to the qualifying carriage service providers.
64 | acma

The CSG performance benchmarks are set at 90 per cent for:> new connections in urban, major rural, minor rural and remote areas (national)> in-place connections in all areas (national)> fault rectifications in urban, rural and remote areas (national)> appointment-keeping in all areas (national).
If a CSP fails to meet a CSG performance benchmark, the ACMA may take compliance action, including the option to issue the CSP with an infringement notice in certain circumstances.
At 30 June 2013, there were 6.68 million services subject to the CSG Standard, compared to 7.12 million at 30 June 2012—a decline of 6.1 per cent (Table 3.5). This decline may have resulted from the growth in the number of consumers without a fixed-line telephone service in the home and consumers using voice services provided by VoIP (see Chapter 1). Services subject to the CSG Standard accounted for approximately 65 per cent of all fixed-line telephone services in Australia at June 2013 compared with 66 per cent at June 2012.
At June 2013, there were 247,657 occasions nationally where customers of the major CSPs waived their rights under the CSG Standard, an increase of nine per cent since June 2012. At June 2013, iiNet accounted for the majority of waivers (98.8 per cent).
Table 3.5 Services subject to the CSG Standard by provider, at 30 June
2009(‘000)
2010(‘000)
2011(‘000)
2012(‘000)
2013(‘000)
iiNet n/a n/a 370* 493 418
Optus 915 949 930 913 850
Primus n/p 127 115 103 101
Telstra 6,281 6,038 5,828 5,608 5,314
Other 292 242 43 0 0
Total 7,488 7,356 7,286 7,117 6,683
n/a=not applicable. n/p=not provided.*iiNet acquired AAPT’s Consumer Division on 1 October 2010.Source: CSP data.
Table 3.6 sets out the CSG Standard time frames within which service providers must connect telephone services and complete fault repairs. The CSG Standard time frames vary according to the location of the customer and, in the case of connections, whether infrastructure is readily available and whether there is an existing in-place connection.
acma | 65

Table 3.6 CSG Standard time frames (working days)
Community In-place connection New service connection Fault repairClose to
infrastructureNot close to
infrastructureUrban 2 5 20 1
Major rural 2 10 20 2
Minor rural 2 15 20 2
Remote 2 15 20 3
Note: ‘Urban’ is defined as communities with 10,000 or more people, ‘major rural’ is defined as communities with between 2,500 and 10,000 people, ‘minor rural’ is defined as communities with between 200 and 2,500 people, ‘remote’ is defined as communities with up to 200 people.Source: CSG Standard.
ConnectionsIn 2012–13, the performance of the major CSPs in meeting CSG Standard time frames for new service connections nationally was 89.0 per cent (Telstra), 98.5 per cent (Optus), 94.4 per cent (iiNet) and 100 per cent (Primus). Table 3.7 shows CSP performance in 2012–13 in meeting CSG Standard time frames for new service connections and for in-place service connections. Any compliance action for non-compliance with annual performance benchmarks is considered by the ACMA after the reporting period.
A ‘new service connection’ is the connection of a standard telephone service to premises where there is the need for additional work to be completed (for example, cabling) before a service can be connected. This excludes in-place service connections where there has been a previous working CSG service that is available for reconnection or reactivation by the CSP.
Table 3.7 Percentage and number of new service and in-place connections provided within CSG Standard time frames, 2012–13
iiNet Optus Primus Telstra
% No. % No. % No. % No.New service connections Urban areas 94.4% 53,097 98.5% 161,956 100% 2,881 88.6% 253,044
Major rural areas 95.4% 2,249 100% 170 100% 115 91.6% 25,668
Minor rural areas 92.6% 1,235 100% 108 100% 131 90.4% 20,410
Remote areas 99.1% 106 100% 6 100% 1 89.0% 701
All areas 94.4% 56,867 98.5% 162,240 100% 3,128 89.0% 299,823
In-place service connections All areas 97.7% 67,322 n/a n/a 100% 8,853 93.8% 321,987
n/a=not applicable.Note: During 2012–13, qualifying CSPs were required to record the number of requests that were not complied with within the applicable performance time frames and to identify if the CSP’s failure to do so was wholly or partly attributable to one or more acts or omissions by another CSP.Source: CSP data.
66 | acma

AppointmentsDuring 2012–13, Telstra made 389,972 CSG Standard-related appointments and did not meet 2.7 per cent (or 10,346) within the CSG Standard appointment-keeping time frames. During the same period, Optus did not meet four per cent of appointments, iiNet did not meet 0.2 per cent of appointments and Primus met all appointments. Table 3.8 shows CSP performance in 2012–13 in meeting CSG Standard for appointment-keeping time frames.
Fault repairsIn 2012–13, the performance of the major CSPs in meeting CSG Standard time frames for fault repairs nationally was 90.9 per cent (Telstra), 96.9 per cent (Optus), 91.3 per cent (iiNet) and 98.5 per cent (Primus).
Table 3.8 Percentage and number of faults repaired within CSG Standard time frames and appointment-keeping performance, 2012–13
iiNet Optus Primus Telstra
% No. % No. % No. % No.Fault repairs Urban areas 91.5% 46,475 96.9% 147,896 98.4% 22,186 90.6% 629,391
Rural areas 90.1% 7,568 99.2% 309 99.9% 2,625 91.7% 215,238
Remote areas 100% 75 100% 2 100% 6 92.3% 3,126
All areas 91.3% 54,118 96.9% 148,207 98.5% 24,817 90.9% 847,755
Appointments (new service connections and fault repair)
99.8% 8,636 96.0% 64,524 100% 10,740 97.3% 379,626
Note: During 2012–13, qualifying CSPs were required to record the number of requests that were not complied with within the applicable performance timeframes and to identify if the CSP’s failure to do so was wholly or partly attributable to one or more acts or omissions by another CSP.Source: CSP data.
Table 3.9 shows CSP performance in 2012–13 in meeting CSG Standard time frames for fault repairs.
Table 3.9 Number of new service connections, in-place connections and fault repairs requested at the national level and appointment-keeping performance, 2011–12 and 2012–13.
iiNet Optus Primus Telstra
2012 2013 2012 2013 2012 2013 2012 2013New service connections
48,493 60,232 181,724 165,099 2,964 3,223 342,750 336,944
In-place connections 87,766 68,964 n/a n/a 8,279 8,937 440,750 343,274
Fault repairs 78,559 63,436 176,349 163,425 22,967 26,001 1,008,832 933,052
Appointments (new service connections and fault repair)
n/p 8,657 66,816 67,214 n/p 10,814 450,972 389,972
n/p=not provided. n/a=not available.Source: CSP data.
CSG Standard paymentsAs a result of failing to meet CSG Standard time frames during 2012–13, CSPs made compensation payments to customers as shown in Table 3.10.
acma | 67

Table 3.10 Volume and value of compensation payments made by CSPs to customers, 2011–12 and 2012–13.
2011–12 2012–13
Volume $ (million) Volume $ (million)iiNet 6,725 0.52 9,504 0.80
Optus 20,701 0.62 20,767 0.92
Primus 826 0.06 1,411 0.03
Telstra 137,348 4.57 143,294 6.14
Total 165,600 5.77 174,976 7.89
Note: During 2012–13, qualifying CSPs were required to record the number of requests that were not complied with within the applicable performance timeframes and to identify if the CSP’s failure to do so was wholly or partly attributable to one or more acts or omissions by another CSP.Source: CSP data.
Payments totalled $7.89 million for 2012–13, compared to a total of $5.77 million made during 2011–12—an increase of 37 per cent.
Exemptions from the CSG StandardA CSP is exempt from complying with a performance standard in certain situations that are specified in Part 3 of the CSG Standard. For example, a CSP may be exempt from compliance with the CSG Standard for the period when circumstances beyond its control affect its ability to comply with the CSG Standard. A CSP also may be exempt if there is a need to move staff or equipment to an area affected by circumstances beyond its control. Many exemptions are a result of extreme weather events or natural disasters.
CSPs must notify affected customers of an exemption. The CSP can choose to notify customers either individually or publicly (via a public notice published in a newspaper circulating in the affected area). If a CSP’s performance is exempt as a result of extreme weather conditions, the notice must identify evidence that the extreme weather conditions outlined in the notice meet the definitions set out in the CSG Standard. The numbers of exemptions for the major CSPs for 2012–13 are shown in Table 3.11.
The number of CSG exemptions claimed in 2012–13 is similar to that claimed in previous years. However, the number of services estimated to be affected and the duration for which CSG exemptions applied increased in 2012–13 compared to previous years, as a result of significant weather events during 2012–13.
Table 3.11 Numbers of CSG exemptions for the major CSPs, 2012–13
Reason for exemption Eftel group
iiNet group
Optus Dodo Telstra M2 Group Primus*
Extreme weather conditions 34 42 39 27 42 21 2
Natural disasters 3 3 3 3 3 1 0
Other 7 7 7 7 7 7 0
Total 44 52 49 37 52 29 2
*Primus was acquired by the M2 Group, effective 1 June 2012. Since December 2012, Primus exemption notifications have been included in M2 Group notifications.Source: CSP data.
68 | acma

Network Reliability FrameworkThe ACMA monitors the reliability of Telstra’s fixed-line telephone service network under the NRF. Compliance with the NRF is a condition of Telstra’s carrier licence. The NRF applies only to services Telstra provides to its CSG Standard-eligible customers—residential and small-business fixed-line customers with no more than five telephone services. Telstra is required to report to the ACMA on the performance of its network and to fix poorly performing cable runs and individual services, as triggered.
The NRF requires monitoring and/or remedying network reliability performance at three levels:> 1—National and geographical area level, based on Telstra’s 44 field service areas
(FSAs)> 2—Local level, cable runs in disaggregated parts of the network> 3—Individual service level, which includes all Telstra services covered by the CSG
Standard.
Level 1 is designed to inform the public about overall network reliability performance. Under levels 2 and 3, Telstra is required to remediate poorly performing parts of its network as a priority.
Level 1—national and field service area performanceLevel 1 of the NRF requires Telstra to publish monthly data showing the reliability of services nationally and in 44 FSAs across Australia. Telstra’s national Level 1 performance data is presented in Figure 3.2. The reliability measures under this level are:> Level 1(a)—the percentage of CSG Standard services that did not experience a
fault during the month reported> Level 1(b)—the percentage of time in a month that CSG Standard services, on
average, are available.
The ACMA also uses data provided under Level 1 of the NRF to calculate:> Level 1(c)—the average time (in hours) for fault-affected CSG Standard services to
be repaired for the month (Figure 3.3).
Figure 3.2 Telstra’s Level 1(a) and (b) performance, based on monthly reports
Jun-
08Au
g-08
Oct-0
8Dec
-08
Feb-
09Ap
r-09
Jun-
09Au
g-09
Oct-0
9Dec
-09
Feb-
10Ap
r-10
Jun-
10Au
g-10
Oct-1
0Dec
-10
Feb-
11Ap
r-11
Jun-
11Au
g-11
Oct-1
1Dec
-11
Feb-
12Ap
r-12
Jun-
12Au
g-12
Oct-1
2Dec
-12
Feb-
13Ap
r-13
Jun-
13
97.0
97.5
98.0
98.5
99.0
99.5
100.0
NRF Level 1aNRF Level 1b%
in e
ach
cate
gory
Source: The ACMA, Telstra.
acma | 69

During 2012–13, Telstra experienced an increase in fault activity during the summer months that can be partly attributed to extreme weather events occurring across various parts of Australia (in particular Queensland and New South Wales). While the percentage of fault-free services remained above 98 per cent for each month during 2012–13, it should be noted that small changes in this figure represent relatively large changes in the number of faults occurring on the network.
Under Level 1(a), FSAs in urban areas experienced a slightly lower percentage of faults than those in non-urban areas. On average, 1.44 per cent of services experienced a fault in any given month in urban areas, while this figure was 1.52 per cent in non-urban areas. Figure 3.2 shows the cyclical nature of NRF Level 1(a) performance.
Level 1(b) measures the percentage of time in a month that services (on average) are available; that is, not awaiting repair. The performance is calculated based on the total amount of time associated with fault repairs and then averaged across all services, whether or not they had a fault in the relevant month. In 2012–13, services were available, on a monthly average, 99.84 per cent of the time (nationally), whereas in 2011–12 services were available, on a monthly average, 99.89 per cent of the time (nationally).
Level 1(c) measures the average number of hours Telstra took to restore fault-affected services in the month. While Level 1(b) takes into account all services, Level 1(c) only considers services that experienced a fault.
Figure 3.3 Level 1(c)—average time for Telstra to restore fault-affected services
Jun-0
8
Sep-08
Dec-08
Mar-09
Jun-0
9
Sep-09
Dec-09
Mar-10
Jun-1
0
Sep-10
Dec-10
Mar-11
Jun-1
1
Sep-11
Dec-11
Mar-12
Jun-1
2
Sep-12
Dec-12
Mar-13
Jun-1
30
20
40
60
80
100
120
140
Hou
rs
Source: Telstra.
Performance for Level 1(c) indicates that the average time taken to restore fault-affected services increased during 2012–13 compared with previous years. In terms of elapsed time, it took an average of 80 hours to restore services that had a fault in 2012–13 compared to an average of 56 hours in 2011–12. As in previous years, CSG Standard services affected by faults in urban areas usually experienced lower average downtime hours compared to non-urban areas. In terms of elapsed time, it took an average of 76 hours to restore fault-affected services in urban areas and 85 hours in non-urban areas. This compared with 52 hours to restore fault-affected services in urban areas and 63 hours in non-urban areas in 2011–12.
70 | acma

Performance across Level 1(c) has remained relatively stable since June 2008, with the exception of three notable spikes relating to significant severe weather events and natural disasters that affected eastern Australia at these times. Notwithstanding the cyclical nature of these spikes, the time taken to restore fault-affected services has been abnormally high over the period January 2013 to June 2013. For the period January to June, the average time for Telstra to restore fault-affected services has increased as follows:> January to June 2010: 43.8 hours> January to June 2011:57.1 hours> January to June 2012:69.2 hours > January to June 2013: 102.5 hours.
Level 2—local cable run remediationsLevel 2 of the NRF requires Telstra to report on and undertake remediation work on the 40 poorest performing cable runs (a set of 10 or 100 copper wire pairs within a physical cable sheath) each month.
During 2012–13, Telstra completed remediation and monitoring of 483 cable runs, some of which were identified for remediation in previous reporting periods. For the year, Telstra identified the required 480 cable runs to be remediated. Telstra also remediated an additional 208 cable runs associated with the reported cable runs, significantly more than in 2011–12 when it remediated an additional 121 cable runs. Telstra estimated that remediation work undertaken as part of Level 2 of the NRF in 2012–13 improved the reliability of 24,893 services.
Level 3—individual service performanceTelstra is required to take action to prevent an individual CSG Standard-eligible service from experiencing more than either:> three faults in a rolling 60-day period—NRF Level 3(a)> four faults in a rolling 365-day period—NRF Level 3(b).
Telstra is required to report to the ACMA any services that breach these thresholds, investigate the performance of the service and undertake necessary remediation.
Figure 3.4 shows that the number of services experiencing four or more faults in a rolling 60-day period or five or more faults in a rolling 365-day period varies significantly from month to month.
acma | 71

Figure 3.4 Level 3(a) and 3(b)—Telstra CSG Standard services with four or more faults in a rolling 60-day period and with five or more faults in a rolling 365-day period
Jun-0
8
Sep-08
Dec-08
Mar-09
Jun-0
9
Sep-09
Dec-09
Mar-10
Jun-1
0
Sep-10
Dec-10
Mar-11
Jun-1
1
Sep-11
Dec-11
Mar-12
Jun-1
2
Sep-12
Dec-12
Mar-13
Jun-1
30
50
100
150
200
250
300
NRF Level 3a NRF Level 3b
Num
ber o
f ser
vice
s
Source: Telstra.
Telstra has reported a slight decrease in the number of services experiencing breaches of the 60-day threshold, reporting 35 breaches per month (on average) in 2012–13 and a total of 414 for the year. In 2011–12, Telstra reported an average of 37 breaches per month and a total of 446 for the year.
Telstra also reported a slight decrease in the number of services experiencing breaches of the 365-day threshold, with 178 breaches per month (on average) and a total of 2,137 for 2012–13. This compares to 2011–12 where Telstra reported 197 breaches per month (on average) and a total of 2,365 for the year.
Telstra is required to remediate any service that breaches the fault thresholds and then monitor that service for an eight-month period. If a service experiences another fault during the monitoring period (known as a monitoring period fault), Telstra must report this to the ACMA together with an assessment as to whether the fault is related or unrelated to the original fault(s) that caused the contravention. In 2012–13, Telstra reported 691 monitoring period faults (across 589 individual services) and assessed 19 faults as related to the original contravention. In 2011–12, Telstra reported 811 monitoring period faults (across 685 individual services) and assessed 17 faults as related to the original contravention.
Each service reported under Level 3 is required to undergo remediation. Telstra is required to report to the ACMA on the expected date for completion of the remediation and to report on a quarterly basis any services where remediation has not been completed within the expected time frames. In 2012–13, Telstra reported 659 delays to remediation (that is, where remediation was not completed within the expected time frames), with an average reported delay to remediation of 133 days. Some services were reported as experiencing more than one delay.
72 | acma

Priority assistancePriority assistance is the priority telephone connection and repair service for people with a diagnosed life-threatening medical condition who are at risk of suffering a rapid and life-threatening deterioration in their condition. Telstra must offer the service as a requirement of its carrier licence conditions. Other CSPs may offer priority assistance services but are not obliged by regulation to do so. In 2012–13, Primus was the only CSP to voluntarily offer priority assistance services in line with industry code ACIF: C609:2007 Priority Assistance for Life Threatening Medical Conditions.
The number of priority assistance customers is presented in Table 3.12. During 2012–13, the number of priority assistance customers increased by 16 per cent.
Table 3.12 Number of priority assistance customers, at 30 June
2009 2010 2011 2012 2013TelstraTotalProvisionalValidated
195,17373,426
121,747
210,46285,587
124,875
188,97454,152
134,822
221,35091,009
130,341
256,549144,435112,114
iiNetTotalProvisionalValidated
n/an/an/a
n/an/an/a
2,417*49
2,368
7†
0
7
0
0
0PrimusTotalProvisionalValidated
1,515n/pn/p
57963
516
81955
764
20923
186
58854
534
Total 196,688 211,041 192,210 221,566 257,137
n/a=not applicable.n/p=not provided.*iiNet acquired AAPT’s Consumer Division on 1 October 2010.†iiNet notified the ACMA in March 2012 that it would cease offering a priority assistance service.Source: Telstra, iiNet, Primus.
Priority assistance customers are given faster connections and fault repairs of their fixed-line telephone service. A service must be connected or a fault repaired within 24 hours in urban and rural areas or 48 hours in remote areas. Table 3.13 provides information about the performance of Telstra, iiNet and Primus in meeting priority assistance time frames for connections and fault repairs since 2008–09.
Table 3.13 Priority assistance—percentage of connection and fault restoration requests completed on time, by financial year (Volumes completed on time for Telstra are shown in brackets for 2011–12 and 2012–13)
Connection requests Fault restoration requests
2008–09
2009–10
2010–11*
2011–12†
2012–13
2008–09
2009–10
2010–11*
2011–12†
2012–13
Telstra
National 88% 92% 93%92%
(40,881)93%
(42,700)93% 92% 93%
95%(130,946)
96%(155,378)
Urban 88% 92% 94%92%
(30,618)93%
(32,536)94% 93% 94%
96%(95,586)
97%(114,800)
Rural 88% 92% 93%92%
(9,970)93%
(9,886)90% 89% 90%
92%(34,855)
92%(40,045)
Remote 85% 90% 89% 84% 89% 86% 84% 87% 94% 92%
acma | 73

(295) (277) (469) (502)iiNetNational n/a n/a 89% 100% n/a n/a n/a 87% 95% n/a
Urban n/a n/a 85% n/a n/a n/a n/a 88% 93% n/a
Rural n/a n/a 100% 100% n/a n/a n/a 83% 100% n/a
Remote n/a n/a n/a n/a n/a n/a n/a n/a n/a n/a
PrimusNational n/p 100% 100% 100% 100% n/p 100% 100% 93% 84%
Urban n/p 100% 100% 100% 100% n/p 100% 100% 93% 90%
Rural n/p 100% 100% 100% 100% n/p 100% n/a 92% 72%
Remote n/p 100% 100% 100% n/a n/p n/a 100% n/a n/a
n/a=not applicable. n/p=not provided. *iiNet acquired AAPT’s Consumer Division on 1 October 2010, and so iiNet data is for only three-quarters of 2010–11. †iiNet has informed the ACMA that it is no longer providing new priority assistance connections. Note: ‘Urban’ is defined as communities with 10,000 or more people, ‘rural’ is defined as communities with between 200 and 10,000 people, ‘remote’ is defined as communities with up to 200 people. Source: CSP data.
Telstra’s local presence planAs part of its licence conditions—Carrier Licence Conditions (Telstra Corporation Limited) Declaration 1997—Telstra is required to maintain a local presence in regional, rural and remote Australia, to the extent that this is broadly compatible with its overall commercial interest. The local presence plan must set out the range of activities and strategies that Telstra will deploy to fulfil its obligation.
On 26 June 2012, the ACMA received notification from the minister that Telstra’s 2012–15 local presence plan (also known as Telstra’s Regional and Rural Presence Plan 2012–15) had been approved. The 2012–15 local presence plan replaces the 2009–12 plan and is effective until June 2015. Under its licence conditions, Telstra must report annually on the progress of its local presence plan. Telstra has submitted a report to the ACMA setting out how it met the requirements of this carrier licence condition in 2012–13.
74 | acma

National Relay ServiceThe NRS is an Australian Government initiative that gives people who are deaf or have a hearing and/or speech impairment access to a standard telephone service on comparable terms and circumstances to the access other citizens have to a standard telephone service. From 1 July 2012, the ACMA handed over responsibility for management of the NRS contracts to TUSMA. Information about the NRS can be found in TUSMA’s annual report at www.tusma.gov.au.
The total number of minutes relayed by the NRS during 2012–13 was 3.06 million, an increase of three per cent in comparison to 2011–12. Internet relay call minutes accounted for 58 per cent of total call minutes relayed during 2012–13, compared to 52 per cent during 2011–12.2
Disability equipment programThe Telecommunications (Equipment for the Disabled) Regulations 1998 specifies the kinds of equipment that people with a disability can use to access telecommunications services. The provision of the equipment listed in the regulations is an obligation on Telstra, as the PUSP.
Telstra outlines the services it will provide to eligible customers with a disability under its USO Standard Marketing Plan and it supplies equipment through its disability equipment program. Optus also has a disability equipment program for customers who directly access the Optus telephone network.
During 2012–13, Telstra fulfilled 6,891 requests under the disability equipment program compared to 8,038 during 2011–12 and 9,652 in 2010–11.
Number portabilityNumber portability allows a customer to keep an existing telephone number when changing service provider. It is available for:> local numbers (numbers beginning with the area codes 02, 03, 07 and 08)> freephone (numbers beginning with 1800) and local rate numbers
(numbers beginning with 13 and 1300)> mobile numbers.
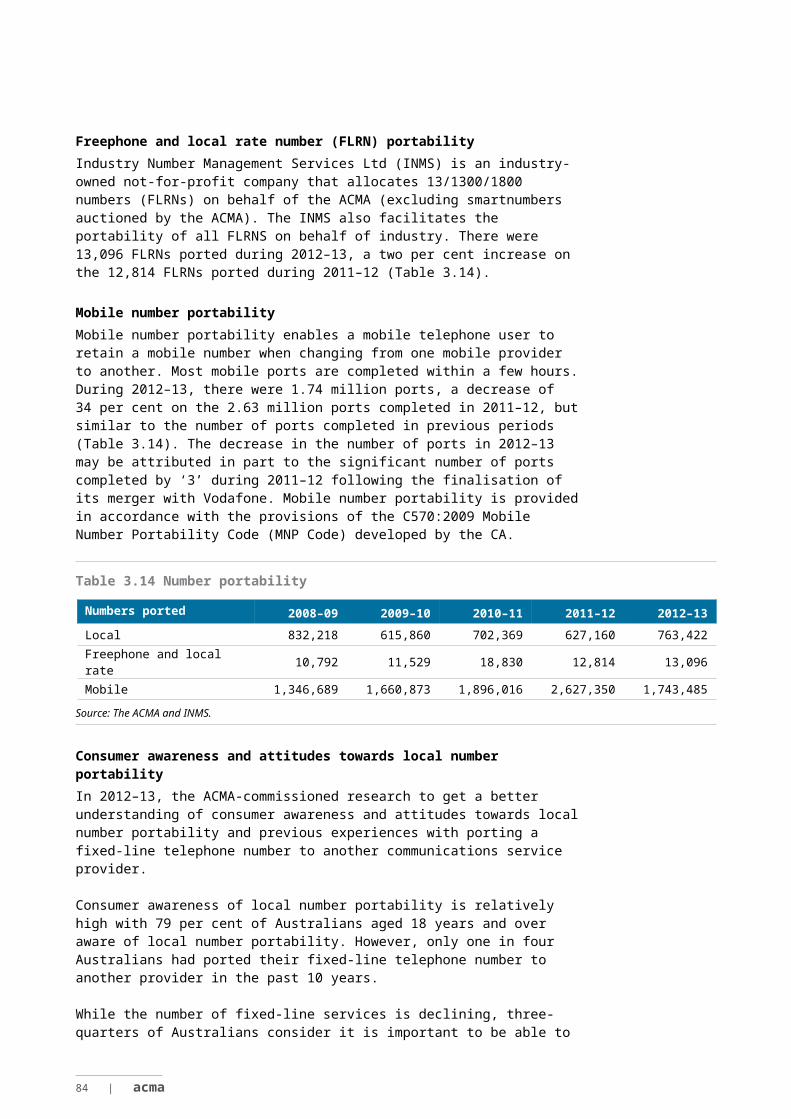
Local number portabilityDuring 2012–13, 763,422 local numbers were ported. This represents a 22 per cent increase from the 627,160 numbers ported in 2011–12, but remains within the range of local numbers ported during previous periods (Table 3.14).
The C540:2007 Local Number Portability Code (LNP Code) sets out carrier/CSP operational procedures for porting local numbers and includes performance standards. The LNP Code has been revised and released for public comment by the Communications Alliance Ltd (CA) in June 2013. The revised code seeks to clarify and streamline current LNP processes and ensure that industry arrangements continue to meet customers’ porting needs. CA is expected to present a revised LNP Code to the ACMA for registration in the next reporting period. CA is also undertaking a separate review of LNP arrangements to consider LNP in an NBN environment. The CA Board will consider the recommendations from this review in the next reporting period.
acma | 75

Freephone and local rate number (FLRN) portabilityIndustry Number Management Services Ltd (INMS) is an industry-owned not-for-profit company that allocates 13/1300/1800 numbers (FLRNs) on behalf of the ACMA (excluding smartnumbers auctioned by the ACMA). The INMS also facilitates the portability of all FLRNS on behalf of industry. There were 13,096 FLRNs ported during 2012–13, a two per cent increase on the 12,814 FLRNs ported during 2011–12 (Table 3.14).
Mobile number portabilityMobile number portability enables a mobile telephone user to retain a mobile number when changing from one mobile provider to another. Most mobile ports are completed within a few hours. During 2012–13, there were 1.74 million ports, a decrease of 34 per cent on the 2.63 million ports completed in 2011–12, but similar to the number of ports completed in previous periods (Table 3.14). The decrease in the number of ports in 2012–13 may be attributed in part to the significant number of ports completed by ‘3’ during 2011–12 following the finalisation of its merger with Vodafone. Mobile number portability is provided in accordance with the provisions of the C570:2009 Mobile Number Portability Code (MNP Code) developed by the CA.
Table 3.14 Number portability
Numbers ported 2008–09 2009–10 2010–11 2011–12 2012–13
Local 832,218 615,860 702,369 627,160 763,422
Freephone and local rate 10,792 11,529 18,830 12,814 13,096
Mobile 1,346,689 1,660,873 1,896,016 2,627,350 1,743,485
Source: The ACMA and INMS.
Consumer awareness and attitudes towards local number portabilityIn 2012–13, the ACMA-commissioned research to get a better understanding of consumer awareness and attitudes towards local number portability and previous experiences with porting a fixed-line telephone number to another communications service provider.
Consumer awareness of local number portability is relatively high with 79 per cent of Australians aged 18 years and over aware of local number portability. However, only one in four Australians had ported their fixed-line telephone number to another provider in the past 10 years.
While the number of fixed-line services is declining, three-quarters of Australians consider it is important to be able to keep their telephone number when changing providers, with 53 per cent citing it as very important (Figure 3.5).
76 | acma

Figure 3.5 Importance of keeping fixed-line number
Very important Somewhat important Not very important Not at all important
53
23
13 9 %
of A
ustra
lians
age
d 18
yea
rs a
nd
over
Source: ACMA-commissioned research, May 2013.
Pre-selection and call overridePre-selection and call override are features provided on a standard telephone service that allow a consumer to nominate a preferred provider to supply specific call types, either on an ongoing basis or for an individual call. Pre-selectable services include:> national long-distance calls> international direct-dial calls (0011)> certain operator-assisted calls> international ring-back pricing code (0012) calls> fixed-to-mobile calls.
There were a total of 13 active pre-selection agreements between carriers during 2012–13, and a total of 16 active override dial codes allocated to carriers during the same period. There were no complaints concerning pre-selection.
Cabling regulationRegistered cablersAll individual cablers who perform customer cabling work connected to the telecommunications network or intended for use on the customer side of the network boundary must either be registered with an ACMA-accredited registrar as a cabling provider or supervised by a person who is registered.
Table 3.15 shows that the total number of registered cablers in the industry has increased marginally each year since 30 June 2008.
Table 3.15 Total number of licensed/registered cablers
Jun-08 Jun-09 Jun-10 Jun-11 Jun-12 Jun-13
Number of cablers 59,743 61,904 64,587 65,696 67,637 69,155
Source: The ACMA.
acma | 77

In 2012–13, there were five ACMA-accredited registrars providing registration and other associated services to cablers. Registrars offered three types of cabler registration in accordance with the Telecommunications Cabling Provider Rules 2000 (the Cabling Provider Rules):> open—covering all types of residential and commercial cabling work> restricted—covering a restricted range of cabling work typically conducted in
residential and small business settings> lift—covering telecommunications cabling for lift installations.
Before being granted registration, cablers must meet the ACMA’s competency requirements that address health, safety and network integrity issues.
Enforcing cabling complianceThe ACMA investigates complaints about non-compliant cabling work or work performed by unregistered cablers. Where appropriate, the ACMA conducts investigations arising from these complaints.
During 2012–13, the ACMA received 31 cabling-related complaints predominantly related to contraventions of the Cabling Provider Rules or alleged unregistered cablers. During the period, the ACMA also conducted 11 cabling inspections.
The ACMA issued two warning notices under the Act for labelling of non-compliant cable. There were no telecommunications infringement notices issued.
Do Not Call Register The DNCR is a secure database that allows people to list their numbers to avoid receiving unsolicited telemarketing calls and marketing faxes. A number is eligible to be registered if it is:> used or maintained primarily for private or domestic purposes> used for transmitting and/or receiving faxes> used exclusively by a government body> an emergency service number.
In April 2013, the minister extended the period for which numbers are registered from six to eight years.
More than one million numbers were added to the DNCR in 2012–13, taking the total number of numbers listed to 8.74 million.
To avoid breaching the DNCR Act, telemarketers and fax marketers are able to submit their contact lists to the DNCR operator for checking, or ‘washing’, against the DNCR. During 2012–13, 1,251 telemarketers and fax marketers submitted databases with a total of over 1.25 billion numbers for checking (Table 3.16).
78 | acma

Table 3.16 Numbers submitted for checking against the DNCR, by financial year
2007–08 2008–09 2009–10 2010–11 2011–12 2012–13Numbers submitted for checking
1.05 b 0.98 b 1.08 b 1.12 b 1.19 b 1.25 b
b=billion.Source: Register operator (Service Stream Solutions Pty Ltd) reports to the ACMA.
Telemarketers and fax marketers may select one of four methods, or ‘channels’, to wash their contact lists. Figure 3.6 shows the volume of numbers submitted during 2012–13 using the primary washing channels.
Figure 3.6 Numbers submitted for checking against the DNCR, by channel
14 million
1,007 mil-lion
230 million Real time access—for small quantities of numbers (1%)Manual file upload—for large quantities of numbers (81%)Automated washing service—for large quantities of numbers (18%)
Note: Overall there are four channels available, however only the primary channels are included: real time access, manual file upload and automated washing service.Source: ACMA-commissioned research.
Compliance and enforcementThe ACMA administers a suite of legislation designed to minimise the impact on Australians of unsolicited telemarketing, fax marketing and commercial electronic messages (including emails, SMS, MMS and instant messaging).
Complaints In 2012–13, the ACMA received a total of 19,677 complaints from Australians under Part 26 of the Telecommunications Act (see Figure 3.7).This was a decrease on the previous year, due in part to a decline in the number of complaints about the ‘Microsoft Imposters’ scam following joint action by the ACMA, the US Federal Trade Commission and the Canadian Radio-television and Telecommunications Commission in October 2012.
acma | 79

Figure 3.7 Complaints received
2008–09 2009–10 2010–11 2011–12 2012–13
10,644 11,323
19,70921,976
19,677
Source: Complaints to the Do Not Call Register.
Complaint classificationsFigure 3.8 shows the classification of the complaints the ACMA received during 2012–13 in terms of potential breaches of the DNCR Act, Telemarketing and Research Standard and Fax Marketing Standard.
Figure 3.8 Classification of the complaints received by the ACMA 2012–13
Fax Marketing Standard
Telemarketing and Research Standard
Do Not Call Register Act
1
42
78
% of total complaints
Note: Complaints may potentially breach both the DNCR Act and one of the standards so figures will not add up to 100 per cent.Source: Complaints to the Do Not Call Register.
Telemarketing and fax marketingTelemarketing complaints in 2012–13 continue to indicate the preference of Australian businesses to conduct most of their telemarketing during the cooler months (July–October and April–June) when more consumers tend to be home, and reduced activity as the weather gets warmer (November–March).
In 2012–13, the solar product and home maintenance industries were, respectively, the first and third industries generating consumer complaints about telemarketing (Table 3.17). The high level of telemarketing complaints in both of these industries has, in part, been due to the activities of ‘lead generators’. Lead generators independently make telemarketing calls to generate interest in various products or services and identify potential purchasers. Calling lists developed through these calls are then sold on to relevant businesses.
80 | acma

Table 3.17 Top 10 industries the subject of telemarketing complaints in 2012–13
Industry1 Solar
2 Telecommunications
3 Home maintenance
4 Finance
5 Energy
6 Travel/Tourism
7 Marketing
8 Personal services
9 Pharmaceuticals
10 Real estate
Source: The ACMA.
Businesses operating in the telecommunications industry generated the second highest level of consumer complaints in 2012–13. The majority of complaints received were about smaller CSPs (complaints about larger carriers have fallen following successful compliance action in previous years).
Businesses in the finance, energy, marketing and real estate and marketing industries were also in the top 10, generating numerous complaints from consumers. The ACMA conducted six investigations into businesses operating in these sectors.
Advisory and warning letters (informal phase)Advisory and warning letters are an informal approach to compliance problems and, in most cases, lead to recipients rectifying their poor compliance without further intervention by the ACMA.
During 2012–13, the ACMA sent 918 advisory letters to people and businesses identified as potentially in breach of the requirements of the DNCR Act and industry standards.
Investigation and enforcement (formal phase)During 2012–13, the ACMA finalised 11 telemarketing-related investigations under Part 26 of the Telecommunications Act.
As a result of these investigations, the ACMA accepted two enforceable undertakings, issued three infringement notices and issued three informal warnings.
Spam and e-marketingSpamThe Spam Act 2003 sets out rules and requirements for the sending of all commercial electronic messages—emails, SMS and MMS, and instant messaging.
Australians may lodge complaints about spam under Part 26 of the Telecommunications Act and report spam or make enquiries via the ACMA website, email, telephone or SMS.
acma | 81

In 2012–13, the ACMA received a total of 412,743 complaints, reports and enquiries directly from members of the public about spam compared to 226,816 during 2011–12. The majority of these (396,908) were about email spam.
The ACMA aims to action 90 per cent of the complaints it receives about spam within eight days of receipt. In 2012–13, 99 per cent of complaints were actioned.
E-marketingThe breadth of industries using e-marketing in 2012–13 has been evident in the complaints the ACMA has received from consumers, with more than 40 industries being identified. Table 3.18 lists the top 10 industries that have been the subject of e-marketing complaints in 2012–13.
Table 3.18 Top 10 industries the subject of spam contacts in 2012–13
Industry1 E-business and online stores
2 Retail
3 Finance
4 Real estate
5 Entertainment
6 Telecommunications
7 IT & C Marketing/Development
8 Advertising/Marketing9 Automotive10 Sports/Fitness
Source: The ACMA.
E-business and online stores have attracted the most complaints in the financial year, growing 17 per cent on the previous year, most likely reflecting a shift from traditional retail environments. In 2012–13, many large mainstream retailers participated in online marketing events such as ‘Click Frenzy’ to promote and sell online, with e-marketing operating as an important promotional tool. However, the ACMA has observed that not all customers respond positively and that they are suffering from ‘e-marketing fatigue’ as a result of the frequent messages some members of this industry send. The main compliance issues identified in the complaints were problems with consent and failure to action requests to unsubscribe, which resulted in the ACMA conducting two investigations into e-businesses and online stores in 2012–13.
The ACMA’s e-marketing blog program Successful e-marketing ... it’s about reputation in 2012–13 encourages best practice compliance for all industry, but it has a special focus on the e-business and online stores sector. A blog released in November 2012, for example, encouraged best practice consent in the lead up to the ‘Click Frenzy’ event.3 Around 600 e-marketers across all industries are directed to the ACMA’s e-marketing blog each month making this an effective mechanism to educate and address compliance.
Other industry sectors that featured prominently in complaints were the finance and advertising/marketing industries. Two investigations were conducted in 2012–13 that related to these sectors.
82 | acma

CybersecurityDuring 2012–13, the Internet Industry Association of Australia (IIA) continued its review of the icode, a voluntary ISP code of practice aimed at promoting a security culture within the Australian internet industry. The icode, which commenced operating on 1 December 2010, is designed to provide a consistent approach for Australian ISPs to help inform, educate and protect their customers against cybersecurity risks. At 30 June 2013, 34 Australian internet providers had confirmed to the IIA that they were ‘icode compliant’.
A key objective of the icode is to reduce the number of compromised computers in Australia. Compromised computers often form into ‘botnets’—networks of computing devices that have become compromised through the surreptitious installation of malicious software (malware). This malware enables these devices to be controlled remotely for illegal and harmful activities, including disseminating spam, hosting of ‘phishing’ sites and distributing denial of service attacks on internet infrastructure.
The icode is supported by the ACMA’s Australian Internet Security Initiative (AISI) program, which provides daily reports to AISI participants—Australian ISPs and universities—about ‘infected’ computing devices residing on their networks. When they receive a report of an infection, AISI participants are expected to contact their customers, inform them that their computing devices are infected and provide information to help restore these devices to safe operation.
At 30 June 2013, there were 133 participants in the AISI, with these participants covering around 98 per cent of allocated Australian IP address ranges. The average number of reports provided to ISPs per day in 2012–13 was 16,034, compared to 16,517 in 2011–12.
A separate cybersecurity activity of the ACMA in 2012–13 was the expansion of its automated system for reporting suspected ‘phishing’ URLs extracted from spam emails reported to the ACMA. Phishing emails direct internet users to fraudulent websites that represent themselves as belonging to legitimate businesses, such as banks. Their main function is to obtain financial and personal information from unsuspecting internet users for criminal purposes.
Recipients of the ACMA’s phishing reports include the Australian Tax Office, Facebook, Telstra and a number of major financial institutions. Approximately 33,600 reports of suspected phishing URLs were provided to these organisations in 2012–13. To assist the early shutdown of these malicious websites, the reports are provided a few minutes after the spam is reported to the ACMA.
Telecommunications codes—development and reviewUnder Part 6 of the Act, the ACMA may register codes developed by industry bodies. At 30 June 2013, 22 codes were registered, comprising:> 19 codes developed by CA > the Cabling Requirements for Business Code, developed by the Cabling Industry
Committee> the Australian eMarketing Code of Practice, developed by the Australian Direct
Marketing Association> the Internet Industry Spam Code of Practice, developed by the Internet Industry
Association with the Western Australian and South Australian internet associations.
acma | 83
CA revised the following industry codes in 2012–13:> C628:2012 Telecommunications Consumer Protections Code—registered
1 September 2012> C564:2011 Mobile Base Station Deployment Code—registered 1 July 2012.
Industry compliance with telecommunications codesThe ACMA has the power to conduct investigations into certain matters under Part 26 of the Act, including where the ACMA believes that there has been a contravention of a code registered under Part 6 of the Act. In 2012–13, the ACMA conducted 280 preliminary enquiries and commenced nine investigations into compliance with the Telecommunications Consumer Protections Code (TCP Code).
AAPT investigationFollowing media reports in July 2012 of a security incident involving AAPT customer information being stolen, the ACMA commenced an investigation. It found that AAPT failed to protect the privacy of its customers’ personal information as required by the TCP Code 2007.
In particular, AAPT did not protect the personal information of some of its small business customers whose billing and related personal information it had collected. The personal information was stored in a server offsite managed by a third party, and was the subject of a hacking incident.
AAPT received a formal warning under section 122(2) of the Act for contravening clause 6.8.1 of the TCP Code 2007, which was in place at the time of the incident.4
Telstra—international roaming investigationTelstra contacted the ACMA on 22 November 2012 to advise that it identified in April 2012 that it had overcharged 260,165 consumers a total of $30 million for international data roaming sessions. The overcharging began in October 2006 and the median amount overcharged was $4.50. Telstra became aware of the issue during an investigation into an international roaming customer billing complaint. Upon discovering that the customer in question had been charged multiple session flag fall fees for a single session, Telstra initiated a wider investigation and audit.
The ACMA commenced an investigation into Telstra’s compliance with the TCP Code on 30 November 2012. It found that from February 2009, Telstra contravened clause 6.4.1 of the TCP Code 2007 because Telstra failed to take appropriate action to ensure that it verified and demonstrated billing accuracy after receiving complaints about inaccurate billing for international data roaming sessions.
Had the TCP Code 2012 been in force at the time, the same conduct would have contravened clause 5.5.1 given that this provision is almost identical to clause 6.4.1 of the TCP Code 2007 and the minor differences are not material to the factual circumstances of the present case.
The ACMA is satisfied that Telstra is now compliant with clauses 5.5.1 and 5.5.2 of the TCP Code 2012 in relation to billing for international data roaming sessions.
Startel investigationOn 12 June 2012, the ACMA commenced an investigation into Startel’s compliance with the TCP Code 2007 and the C518:2006 Call Charging and Billing Accuracy Code (the CCBA Code). This investigation resulted from Startel’s voluntary admission to the ACMA of a billing system error that was rectified within 24 hours of being identified.
84 | acma

It found that Startel had contravened clause 6.4.1 of the TCP Code 2007 for not ensuring that it could verify and demonstrate billing accuracy, and clause 4.2 of the CCBA Code by failing to have a test plan in place.
Startel has now entered into a deed with the ACMA, which requires the provider to reimburse all the customers affected by its billing error and to provide regular reports to the ACMA on the progress of the reimbursements.
Compliance with the TCP Code 2012As noted above, the TCP Code 2012 was registered on 1 September 2012.
The TCP Code 2012 includes: > enhanced rules for complaints-handling—particularly providers delivering on the
undertakings they make to customers when resolving complaints> enhanced rules for credit management—particularly those concerning financial
hardship, which industry has delivered largely independent of the ACMA’s Reconnecting the Customer public inquiry
> new information requirements for advertising—both the inclusion of standard charging information and potentially misleading and confusing claims
> a new requirement to provide a critical information summary> a new requirement to provide comparative billing information> new rules for spend management alerts> the establishment of Communications Compliance (CommCom). CommCom is a
self-regulatory industry body that aims to improve industry members’ compliance with code rules.
The implementation of these new obligations is being phased to give telecommunications providers the opportunity to implement new systems and processes (Table 3.19).
Table 3.19 Phased implementation of the TCP Code 2012
Effective date Obligations
1 September 2012 Complaints-handling, credit management and requirements for advertising
27 October 2012 Advertising of standard charging information
1 March 2013Rules for critical information summaries, comparative billing information and communications compliance
1 September 2013 Rules for spend management alerts—large providers
1 September 2014 Rules for spend management alerts—small providers
Between 1 September 2012 and 30 June 2013, the ACMA found that industry’s compliance with the new code rules was generally very good:> 27 advertisements from 22 providers in the first 10 weeks of the code’s
implementation were assessed as compliant with requirements not to use confusing advertising terms such as ‘capped’, ‘free’ and ‘unlimited’ where the offers are not capped, free or unlimited, respectively
> the majority of 33 advertisements of eight larger providers complied with requirements for prominent standard charge information
> after a slow start, the majority of Critical Information Summaries (CIS) of 88 providers were assessed as compliant
acma | 85

> 22 financial hardship policies and 23 complaints-handling policies, covering an estimated 95 per cent of the Australian consumer market were assessed as compliant or quickly became complaint, with one exception
> companies with an estimated 99 per cent of market share (based on TIO complaints) lodged required compliance documentation with CommCom. However, 186 small providers who had at least one TIO complaint in the previous twelve months and had failed to lodge required documents received a preliminary breach finding. Submissions from these providers were due on 1 July 2013.
Instances where providers did not provide a satisfactory response and were issued with directions or formal warnings include:> Touch Mobile and Jadi1 received directions to comply with the TCP Code 2012 for
failing to make CIS documents available> Sure Telecom, iTalkBB and Australian Private Networks (trading as Activ8me)
received formal warnings for non-compliance with CIS requirements> Vodafone received a formal warning for failing to prominently display its standard
charges in a mobile phone offer> Clear Networks received a formal warning for deficiencies in its financial hardship
policy> Southern Cross Telco received a formal warning after informing the ACMA of
unauthorised disclosures of personal information.
Industry compliance with TIO scheme Section 128 of the TCPSS Act requires carriers and eligible CSPs to join the TIO scheme. Eligible CSPs are those providers who supply fixed standard telephone, mobile or internet services to residential and small-business customers. TIO scheme members are required to comply with the scheme.
In 2012–13, the TIO referred 18 providers to the ACMA for failure to join the scheme and one provider for failure to comply with the scheme. The ACMA found four providers were not eligible to join the TIO scheme and three providers joined the scheme without further intervention from the ACMA. The ACMA opened investigations into the 12 remaining providers. Six of these have been resolved by the providers joining the TIO scheme. The other six remain the subject of ACMA investigations.
On 1 February 2013, the Federal Court awarded civil penalties against a Canberra-based ISP, Bytecard Pty Ltd and its director, Mr Brian Morris. The Court found that Bytecard and its director breached the TIO scheme, the Act and the TCPSS Act by failing to comply with five remedial directions issued by the ACMA. These related to Bytecard’s non-compliance with five determinations made by the TIO. Justice Foster’s decision sends a clear message to the industry about the importance of complying with the TIO scheme.
Complaints to the TIOThe TIO scheme provides for the resolution of unresolved complaints about carriers or CSPs made by residential and small-business customers where those complaints are not resolved by the CSP/carrier.
In 2012–13, the TIO had 1,360 members, up from 1,221 in 2011–12.
There were 158,652 new complaints made to the TIO during 2012–13, down substantially (18 per cent) from 2011–12. The most significant decrease in complaints was for mobile services, which may reflect the impact of the new TCP Code and its focus on improving customer outcomes, particularly for post-paid mobile services.
86 | acma

The TIO records a new complaint when it receives an expression of dissatisfaction from a consumer whose complaint has not been resolved by the service provider. The TIO allocates complaint issues within each new complaint from a choice of keywords that are aligned to industry codes or common complaint categories identified by the TIO. Each new complaint involves at least one complaint issue.
Figure 3.9 Annual TIO new complaints by service type
2007–08 2008–09 2009–10 2010–11 2011–12 2012–13 -
20,000
40,000
60,000
80,000
100,000
120,000
140,000
Mobile phone Fixed-line Internet
Num
ber o
f com
plai
nts
Source: TIO.
Table 3.20 shows the top five TIO new complaint issues for the last two financial years. The number of complaint issues in each category has fallen in 2012–13.
Table 3.20 Top five TIO new complaint issues
Complaint issue category 2011–12 2012–13 % changeCustomer service 109,502 94,639 –14%Billing and payments 93,941 78,160 –17%
Faults 78,829 75,325 –4%
Complaints-handling 65,818 50,504 –23%Credit management 52,907 46,138 –13%
Source: TIO.
Consumer satisfaction with communications servicesThe majority of Australian communications consumers are generally satisfied with their communications services.5
Compared to results from 2012, the level of overall satisfaction (includes ‘very satisfied’ and ‘satisfied’ responses) with communications services has dropped by four percentage points for mobile telephones and seven percentage points for fixed-line phones. VoIP services saw the biggest change in satisfaction levels with a drop of nearly 10 percentage points. The results for internet cannot be compared due to a change in methodology.
In 2013, overall satisfaction levels were higher for fixed-line and internet users (71 per cent and 76 per cent respectively) than for mobile phones and VoIP users (69 per cent
acma | 87

and 55 per cent respectively). Levels of overall dissatisfaction with these four types of communications services ranged from eight (internet) to 13 per cent (VoIP).
Figure 3.10 Change in overall satisfaction with select communications services
2012 2013 2012 2013 2012 2013 2012 2013Fixed-line Mobile telephone Internet* VoIP
45
29 3124
33 31 2517
33
42 4245
43 45
39
38
1520 19 22
16 1629
33
5 6 5 6 5 6 5 11
2 3 3 3 2 2 2 2
Very satisfied Satisfied Neither satisfied nor dissatisfiedDissatisfied Very dissatisfied
Per
cen
t of s
ervi
ce u
sers
age
d 18
yea
rs a
nd o
ver
Note: Communications consumers are defined as having a fixed-line telephone and/or a mobile phone.The response category ‘Overall’ is not an average of all other response categories. Respondents were asked a separate question about their overall level of satisfaction with each of the services identified. *Due to changes to methodology, the overall internet satisfaction data is sourced from the Roy Morgan Single Source, Apr–Jun 2013.Source: ACMA-commissioned survey May 2012 and May 2013.
Satisfaction with communications service componentsTable 3.21 presents a summary of results from the 2013 satisfaction survey.
Customer service—the levels of satisfaction ranged between 57 per cent and 59 per cent across all services. Dissatisfaction levels were also similar ranging between 14 per cent and 16 per cent.
Service reliability—fixed-line services recorded the highest levels of satisfaction (81 per cent) and mobile phone services the lowest (64 per cent). Mobile phone services also recorded the highest level of dissatisfaction (13 per cent).
Call/service and line rental costs—the highest levels of satisfaction with call/service costs were recorded for mobile phone services (54 per cent) compared to 51 per cent for both fixed-line telephone and internet services. Both fixed-line telephone and internet services recorded the highest levels of dissatisfaction for service costs (19 per cent each). Line rental costs for fixed-line telephone services had the highest recorded level of dissatisfaction—32 per cent at May 2013—for all services and service components.
Billing information—levels of satisfaction with billing information provided to customers were similar for the three main communications services, with 71 per cent for internet, 70 per cent for fixed-line telephone and 67 per cent for mobile phones. Dissatisfaction levels were also similar—10 per cent for both fixed-line and mobile telephone services and nine per cent for internet.
88 | acma

Mobile phone internet access and internet data speeds—at May 2013, 56 per cent of consumers with internet access via their mobile phone were satisfied with their mobile internet access and 17 per cent were dissatisfied. In terms of internet data speeds in general, 56 per cent were satisfied and 18 per cent were dissatisfied.
Table 3.21 Consumer satisfaction with communications services, May 2013
Fixed-line telephone Mobile Internet
Customer service
Very satisfiedSatisfiedDissatisfiedVery dissatisfied
23%34%
9%6%
22%37%
9%5%
25%34%10%
6%
Service reliability
Very satisfiedSatisfiedDissatisfiedVery dissatisfied
42%39%
4%2%
26%38%
9%4%
30%42%
7%3%
Call/service costs
Very satisfiedSatisfiedDissatisfiedVery dissatisfied
20%31%12%
7%
22%32%12%
5%
20%31%13%
6%
Billing information
Very satisfiedSatisfiedDissatisfiedVery dissatisfied
32%38%
7%3%
30%37%
7%3%
35%36%
6%3%
Line rental cost
Very satisfiedSatisfiedDissatisfiedVery dissatisfied
14%23%21%11%
n/a n/a
Internet access
Very satisfiedSatisfiedDissatisfiedVery dissatisfied
n/a
20%36%12%
5%
n/a
Data speeds
Very satisfiedSatisfiedDissatisfiedVery dissatisfied
n/a n/a
21%35%12%
6%
Technical support
Very satisfiedSatisfiedDissatisfiedVery dissatisfied
n/a n/a
28%34%
8%5%
Speed of repairing faults
Very satisfiedSatisfiedDissatisfiedVery dissatisfied
n/a n/a
21%33%10%
7%
n/a: not available. Respondents reporting ‘neither satisfied nor dissatisfied’ have not been identified separately in the table. However, these responses have been included in the base numbers when calculating percentages for satisfaction and dissatisfaction.Source: ACMA-commissioned survey, May 2013.
Levels of satisfaction for these aspects of a fixed-line telephone and mobile telephone were similar to levels recorded in 2012, with only a slight drop in satisfaction for fixed-line customer service (six percentage points) and a slight increase in fixed-line billing satisfaction (five percentage points). Satisfaction levels for internet cannot be compared to 2012 due to a change in methodology.
The overall satisfaction with services was higher than for individual service components, a likely reflection of the overall importance people place on having a
acma | 89

particular communications service. For example, 76 per cent of Australians aged 18 years and over were satisfied with their internet service, in comparison to lower levels of satisfaction with customer services, service reliability and billing information (59, 72 and 71 per cent, respectively).
Communications infrastructure regulationWhen installing large telecommunications facilities such as mobile phone towers, carriers generally need to obtain local council planning permission and comply with relevant state and territory planning laws. Schedule 3 of the Act allows licensed carriers to install a limited range of facilities referred to as ‘low-impact facilities’ without seeking state or territory approval. Low-impact facilities as defined in the Ministerial Telecommunications (Low-impact Facilities) Determination 1997 are designed to be unobtrusive.
While low-impact facilities are exempt from local government planning laws, carriers must still comply with Schedule 3 of the Act and the Telecommunications Code of Practice 1997, which includes notifying land owners and occupiers of their activities, ensuring minimal detriment and damage is caused by the activity and restoring the land to a similar condition before the activity began. The ACMA may investigate systematic breaches of the Act and relevant codes.
Complaints and enquiries to the TIOThe TIO can consider objections to land access, and the installation and maintenance of low-impact facilities. The majority of complaints to the TIO relate to damage to property by carriers and the user charges billed as a result of damage reported to cables. During the reporting period, the TIO received a total of 327 complaints (not including enquiries)—a 20 per cent decrease from the 2011–12 reporting period. Of complaints received by the TIO during 2012–13:> 153 were from owners/occupiers of land about alleged damage to property by
the provider > 99 were from owners/occupiers of land about carriers billing them for repairing
damage to infrastructure allegedly caused by the owner/occupier > 20 related to the standard of service from providers when installing subscriber
connections> 31 related to the failure of a carrier to give notice to the landowner or occupier> 24 were objections by the landowner or occupier to the activity.
The TIO found no valid grounds for objection pursuant to section 4.31 of the Telecommunications Code of Practice 1997.
90 | acma

Figure 3.11 Facility installation complaints received by the ACMA and the TIO
2007–08 2008–09 2009–10 2010–11 2011–12 2012–13
820
1,1111,023
480411
327
18 46138
32109 76
Complaints to the TIO Complaints and enquiries to the ACMA
Source: The ACMA and the TIO.
Mobile phone base stations Optus, Telstra and VHA are the three carriers that operate mobile phone networks in Australia. When installing mobile phone base stations, these carriers are required to comply with the C564:2011 Mobile Phone Base Station Deployment Code (the industry code). The industry code supplements the requirements already imposed on carriers under the existing legislative scheme by requiring them to consult with local communities and to adopt a precautionary approach in planning, installing and operating mobile phone base stations.
The communications industry has developed a national database of mobile phone base stations—the national site archive—to improve access to information about the deployment of mobile phone infrastructure across Australia. The archive contains information about most mobile phone towers deployed by carriers and includes Electromagnetic Energy reports about a particular communications facility. This information is available at www.rfnsa.com.au/nsa/index.cgi.
Complaints and enquiries to the ACMAComplaints about carriers’ compliance with the industry code are directed to the carriers in the first instance. The industry code specifies mandatory processes for complaints-handling by carriers. The ACMA examines complaints against the code and may take regulatory action under Part 6 of the Act.
During the reporting period, the ACMA received 75 enquiries and one complaint about matters covered by Schedule 3 of the Act and the Telecommunications Code of Practice 1997. The ACMA also received three complaints and 25 enquiries related to the industry code. The carriers undertook a total of 4,109 consultations during this period.
acma | 91
1Endnotes A CSP is a QCSP if on the last day of the financial year preceding the CSG benchmark period, the CSP supplied 100,000 or more CSG services nationally. The QCSP is also required to report on areas where it satisfies the following national location specific thresholds: urban (10,000 CSG services), major rural (1,000 CSG services), minor rural (1,000 CSG services) and remote (500 CSG services).2 TUSMA, www.tusma.gov.au/. 3 ACMA, ‘Generate a Click Frenzy on your website’, November 2012, www.acma.gov.au/theACMA/engage-blogs/engage-blogs/Marketers/Emarketing/Generate-a-Click-Frenzy-on-your-website.4 www.acma.gov.au/theACMA/Newsroom/Newsroom/Media-releases/acma-issues-formal-warning-to-aapt5 ACMA-commissioned survey, May 2013.