media.nature.com · web viewa single multifunctional daq board (usb-6216 oem, national instr.,...
TRANSCRIPT

Supplementary file
Compact prototype microfabricated gas chromatographic analyzer for autonomous determinations of VOC mixtures at typical workplace concentrationsJunqi Wang,1,5,6 Jonathan Bryant-Genevier,2,5,6 Nicolas Nuñovero,2,5 Chengyi Zhang,2,5 Bruce Kraay,1,5 Changhua Zhan,2,5 Kee Scholten,3,5 Robert Nidetz,4,5 Sanketh Buggaveeti,4,5 Edward T. Zellers1,2,5*
1Department of Chemistry, University of Michigan, Ann Arbor, MI, USA 481092Department of Environmental Health Sciences, Univ. of Michigan, Ann Arbor, MI, USA 481093Applied Physics Program, University of Michigan, Ann Arbor, MI, USA 481094Department of Mechanical Engineering, University of Michigan, Ann Arbor, MI, USA 481095Center for Wireless Integrated MicroSensing and Systems, Univ. of Michigan, Ann Arbor, MI,
USA 481096These authors contributed equally to this work
* Corresponding author ([email protected])
Abstract:
Included in this Supplementary Information file are data and descriptions of various components and aspects of the PEMM-1 prototype design and operation that elaborate on those presented in the main body of the article. We have organized these into sections (i.e., S1, S2, etc.) as follows, and refer to these, and to the corresponding figures and tables, in the main body of the article:
S1. PEMM-1 Electronics and Power/Energy Dissipation EstimatesS2. System Design and Operating SpecificationsS3. Pre-trap Characterization S4. PCF CharacterizationS5. Column CharacterizationS6. PEMM-1 Thermal Stability and Interconnect HeatersS7. PEMM-1 Sample Throughput: Effect of Pre-Trap on QuantificationS8. Calibration Curves, Sensitivities, and LODsS9. Reliability: Medium Term StabilityS10. Response Patterns and Confusion Matrices
1

S1. PEMM-1 Electronics and Power/Energy Dissipation Estimates
Figure S1. Block diagram of the PEMM-1 electronic hardware and associated fluidic hardware and microsystem components to which they are connected.
Electronic Circuitry. A schematic diagram of the PEMM-1 electronic circuits is presented in Figure S1. Although the PEMM-1 is AC powered, an external AC-DC converter was used to match the DC operating voltage to be used in the PEMM-2 (wearable) prototype. A set of adjustable high efficiency DC-DC converters was employed to supply the range of voltages required for each system component. Two PCBs were fabricated to provide the control signals to and to read output signals from all components. The “Manifold” PCB was dedicated to actuating the pump, valves and fans. The “MEMS” PCB was dedicated to mediating the control and data acquisition functions for µPCF heating, µcolumn heating, and µCR array sensor output signals. Step-down converters were used for powering the pump, valves, fans, µCR sensors, interconnection heaters and PCF. Step-up voltage regulators were avoided due to noise affecting the temperature sensors of the micro-devices, and instead a direct feed from the AC-DC converter was used to supply the voltage level required (24VDC) to control the µcolumn heaters. For the µCR array acquisition circuit the DC-DC converter was electrically isolated and additional voltage regulation was employed to achieve low baseline noise on the sensor signals.
A single multifunctional DAQ board (USB-6216 OEM, National Instr., Austin, TX) was identified to meet all acquisition and control requirements. Electronic signal handling circuitry was needed to attain the resolution and dynamic range for the µCR array signals for the wide range of concentrations anticipated for the targeted compounds.
2

Among the considerations in the PCB layouts was the appropriate use of low-noise design techniques to maintain the integrity of the noise-sensitive signals, most importantly from the µCRs. At the front-end of the µCR interface electronics, a nulling circuit was implemented to cancel the baseline resistance contribution to the sensor output signals. An algorithm was developed to generate the digitally controlled signals for baseline cancellation during initial start-up of the instrument. This implementation also compensated for medium- and long-term drift in sensor resistances, and maximized the signal-to-noise ratio prior to digitization.
In addition, an automated selection feature of appropriate excitation voltages for the µCRs was created, achieving similar circuit sensitivities regardless of sensor resistances, and improving the reproducibility of the response measurements. By monitoring the cancelling signals applied to the aforementioned nulling circuit, it was possible to convert the measured output voltages to changes in relative resistance (i.e., R/R) and to display the responses in such units in real time.
Independent proportional-integral-derivative (PID) feedback loops were designed to achieve control and optimal reproducibility of the device temperature programs at the specified heating rates and set-point temperatures. Solid-state relays, mounted on the PCBs, were used to control the device heaters by pulse-width-modulation (PWM) generated signals. The µCR array signals, device temperatures, and instrument configuration parameters were monitored and stored for subsequent data analysis.
Each CR in the array was connected in series with an on-board bank of four reference resistors having values of 300K, 1M, 3M and 10M, respectively. These resistance values were selected to cover the expected span of MPN-coated CR baseline resistances, Rb. Each sensor channel on the MEMS board was configured to allow one of these resistors to be selected to serve as a reference. A direct current was applied to each sensor in the CR array. Then, using a custom LabVIEW program, Rb was estimated for each CR sensor and the reference resistor that most closely matched Rb was automatically selected from the bank. For performance characterization tests, 3 VDC was applied to each CR in series with its reference resistor. A voltage signal, controlled by LabVIEW, was generated to subtract the baseline voltage (Vb) of each CR sensor to obtain the voltage drop (ΔV) associated to the sensor response. This voltage was then amplified, collected and finally converted by the LabVIEW software to the preferred output signal, relative resistance change (ΔR/Rb), via the expression:
ΔR/Rb = 3∙ ΔV
V b [ G (3−V b )−ΔV ]
where G is the gain of the amplifiers.
Power and Energy Dissipation. From the anticipated battery requirements of PEMM-2, a 24V, 60W power supply was selected for PEMM-1 on the basis of iterative analyses of the voltage requirements of the Ti/Pt heaters of the columns and PCF estimated from simulations and experiments. The total cycle time was conservatively assumed to be 8 min, of which 1 min was allotted for sampling, 4 min for separation and detection, and 3 min for cool down and backflushing the pre-trap in preparation for the next sample. On the basis of previous tests, the desorption time from the PCF (i.e., time
3

of heating) was set at 40 s, which ensures complete desorption of the least volatile analytes. The 4-min separation time is conservative; the temperature program assumed for the columns is the same as that used to assess the temperature stability of the system (see Figure S6 and associated text below). The inter-column interconnect heater and the press-tight heater between the downstream column and the sensor array were included in the budget. The press-tight heater between the PCF and upstream column was shown not to be necessary so was not included. In addition, since the internal temperature of the unit was ~30 C and stable, the CR array heater was not included in the budget.
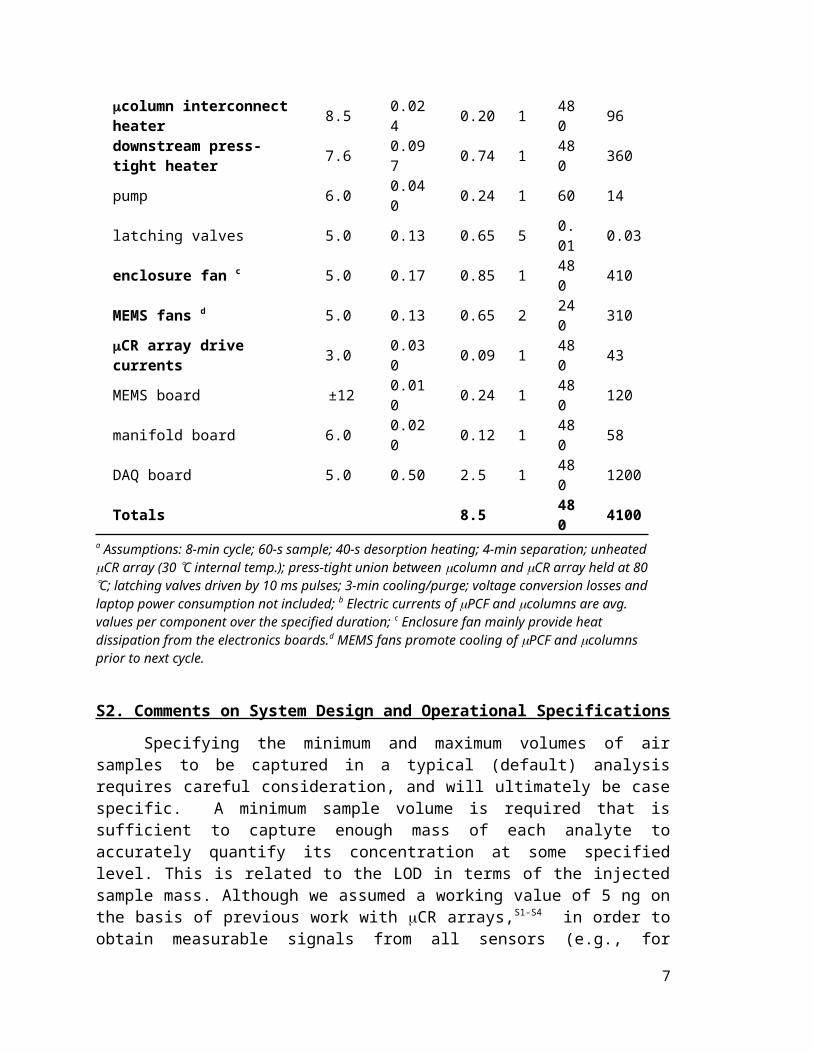
As shown in Table S1, the total energy per cycle is 4.1 kJ, corresponding to an average power of 8.5 W for an 8-min cycle. It can be seen that the columns are the largest consumers of energy, using 34% of the total system energy, and 92% of the energy used for the microsystem. Of the total system energy, an additional ~11% is consumed by the interconnect heaters between columns and between the downstream column and CR array. The control electronics (DAQ, MEMS and Manifold PCBs) account for another 34% of the PEMM-1 energy consumption. The pneumatic components (pump and latching valves) only account for the 0.3% of the total energy. The energy required to cool the PEMM-1 unit and the micro devices represents ~18% of the total system demand. The remaining ~3% is devoted to heating the PCF and to the drive currents in the CR array.
Table S1. Power demand of each component in PEMM-1 and net energy dissipation for a typical sampling and analytical cycle.a
Component Voltage (V)
Currentb (A)
Power b
(W)Qty
Time (s)
Energy (J)
PCF heater 16 0.12 1.9 1 40 76column heaters 24 0.12 2.9 2 240 1400column interconnect heater 8.5 0.024 0.20 1 480 96downstream press-tight heater 7.6 0.097 0.74 1 480 360
pump 6.0 0.040 0.24 1 60 14
latching valves 5.0 0.13 0.65 5 0.01 0.03
enclosure fan c 5.0 0.17 0.85 1 480 410MEMS fans d 5.0 0.13 0.65 2 240 310CR array drive currents 3.0 0.030 0.09 1 480 43MEMS board ±12 0.010 0.24 1 480 120manifold board 6.0 0.020 0.12 1 480 58DAQ board 5.0 0.50 2.5 1 480 1200Totals 8.5 480 4100
a Assumptions: 8-min cycle; 60-s sample; 40-s desorption heating; 4-min separation; unheated CR array (30 C internal temp.); press-tight union between column and CR array held at 80 C; latching valves driven by 10 ms pulses; 3-min cooling/purge; voltage conversion losses and laptop power consumption not included; b Electric currents of PCF and columns are avg. values per component over the specified duration; c Enclosure fan mainly provide heat dissipation from the electronics boards.d MEMS fans promote cooling of PCF and columns prior to next cycle.
4

S2. Comments on System Design and Operational Specifications
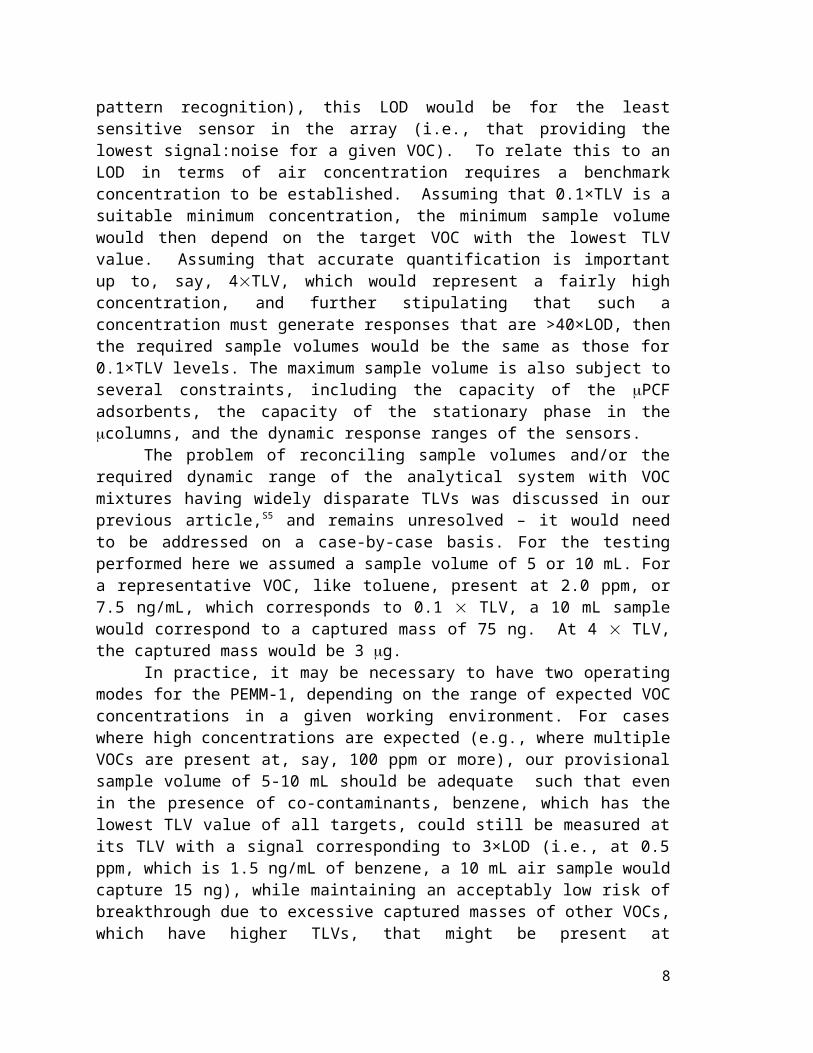
Specifying the minimum and maximum volumes of air samples to be captured in a typical (default) analysis requires careful consideration, and will ultimately be case specific. A minimum sample volume is required that is sufficient to capture enough mass of each analyte to accurately quantify its concentration at some specified level. This is related to the LOD in terms of the injected sample mass. Although we assumed a working value of 5 ng on the basis of previous work with CR arrays,S1-S4 in order to obtain measurable signals from all sensors (e.g., for pattern recognition), this LOD would be for the least sensitive sensor in the array (i.e., that providing the lowest signal:noise for a given VOC). To relate this to an LOD in terms of air concentration requires a benchmark concentration to be established. Assuming that 0.1×TLV is a suitable minimum concentration, the minimum sample volume would then depend on the target VOC with the lowest TLV value. Assuming that accurate quantification is important up to, say, 4TLV, which would represent a fairly high concentration, and further stipulating that such a concentration must generate responses that are >40×LOD, then the required sample volumes would be the same as those for 0.1×TLV levels. The maximum sample volume is also subject to several constraints, including the capacity of the PCF adsorbents, the capacity of the stationary phase in the columns, and the dynamic response ranges of the sensors.
The problem of reconciling sample volumes and/or the required dynamic range of the analytical system with VOC mixtures having widely disparate TLVs was discussed in our previous article,S5 and remains unresolved – it would need to be addressed on a case-by-case basis. For the testing performed here we assumed a sample volume of 5 or 10 mL. For a representative VOC, like toluene, present at 2.0 ppm, or 7.5 ng/mL, which corresponds to 0.1 TLV, a 10 mL sample would correspond to a captured mass of 75 ng. At 4 TLV, the captured mass would be 3 g.
In practice, it may be necessary to have two operating modes for the PEMM-1, depending on the range of expected VOC concentrations in a given working environment. For cases where high concentrations are expected (e.g., where multiple VOCs are present at, say, 100 ppm or more), our provisional sample volume of 5-10 mL should be adequate such that even in the presence of co-contaminants, benzene, which has the lowest TLV value of all targets, could still be measured at its TLV with a signal corresponding to 3×LOD (i.e., at 0.5 ppm, which is 1.5 ng/mL of benzene, a 10 mL air sample would capture 15 ng), while maintaining an acceptably low risk of breakthrough due to excessive captured masses of other VOCs, which have higher TLVs, that might be present at concentrations of, say, 4×TLV. For low concentration environments, sample volumes as high as 30 mL could be used without risk of benzene breaking through the PCF, even in the presence of interferences.S5
S3. Pre-trap Characterization
Devices were challenged with test atmospheres of one or more VOCs in N2-filled sampling bags, which were placed in a sealed drum and pressurized to push the atmosphere through the pre-trap at a known rate. A bench scale GC (Agilent 6890, Agilent Technol., Palo Alto, CA) was used downstream to monitor the VOC concentrations directly or via a sampling loop that was periodically injected. Either a
5

short segment of uncoated, deactivated capillary or a short PDMS-coated separation column was used between the GC inlet port and the FID.
Initial tests used packed-tubes containing 5.4 mg of either C-F or C-C (i.e., pre-trap A) and entailed individual challenges with n-alkanes C11 to C13 at ~200 ppm. Both adsorbents showed significant fractional retention of C11 from 10 mL sample volumes and, while the C-F provided a 10% breakthrough volume of ~25 mL for C13, it required heating with backflushing for regeneration. Additional experiments with different bed masses and at different temperatures and concentrations failed to arrive at a viable arrangement with these granular adsorbents. We also tried glass beads, but these did not show sufficient retention of C13.
We then explored capillary-column pre-traps B1 and B2, again using C11 and C13
as our primary test vapors. With pre-trap B1, the breakthrough volumes of both analytes were independent of flow rate, from 4 to 11 mL/min, and concentration, from ~0.4 to ~2 ppm, and linearly dependent on the length of the pre-trap, from 4 to 10 cm. Increasing the pre-trap temperature from 20 to 25 °C resulted in a 10% decrease in the 10% breakthrough volume for C13. Both pre-traps B1 and B2 showed similar retention behavior. Pre-trap B2, however, showed slightly better discrimination between C11 and C13 based on the ratio of 90% and 10% breakthrough volumes, respectively (Figure S2). For mixtures of compounds with pv values similar to that of C11, the presence of additional compounds did not decrease the breakthrough volume relative to that of any single compound for either pre-trap. Regarding regeneration, after passing 10 mL of a 3 ppm sample of C13 through pre-trap B2 and reversing the fluidic connections to allow monitoring with a downstream FID while backflushing at ambient temperature, it required 20 mL before the FID had returned to baseline. As discussed below, we ended up using pre-trap B1 in the final testing of PEMM 1 in this study. Additional results are presented in Section S7.
Figure S2. Fractional breakthrough of C11, C12, and C13 vapors (individual exposures at ~ 100 ppm each) as a function of sample volume (5 mL/min) for pre-trap B2 (consisting of 6.5 cm long segment of 250 µm i.d. capillary with a 0.1 µm thick wall coating of Rtx-20). Note that the 10% breakthrough volume for C13 was ~5 mL while the 90% breakthrough volume for C11 was 1.2 mL.
6
S4. PCF Characterization
Figure S3 presents the injection peaks for benzene, toluene, and n-dodecane using a 2:1 split injection (i.e., 9 mL/min desorption flow rate; 3 mL/min analytical flow rate). See text in the main body of the article for discussion.
Figure S3. Injected peaks for benzene, toluene, and n-C12 from the μPCF prior to system integration. The device was connected across two ports of a 6-port valve, 0.5 µg of each vapor was loaded from individual-vapor static test atmospheres, and thermally desorbed with a 2:1 split directly to the FID; analytical flow rate was maintained at 3 mL/min. S5. Column Characterization
Figure S4. Golay plot for the dual μcolumns generated from a mixture of methane (for hold-up time) and n-octane in N2 and He carrier gases as indicated. Gas-tight syringe injections and FID detection were used. The maximum plate count, N, was ~4,300 plates/m with N2 or He at optimal flow rates of 0.17 and 0.56 mL/min, respectively. The vertical dashed line highlights the difference in H values at 3 mL/min, which was the analytical-path flow rate used for most testing.
7
Prior to system integration, the separation efficiency and sample capacity of the dual μcolumns were characterized. The µcolumns were installed in the oven of the bench scale GC-FID and connected between the inlet and FID via press-tight unions. Analytes were introduced by autosampler syringe or by sample loop connected to a 6-port valve (Model AC6WE, Vici Valco, Houston TX) mounted to the GC. The FID was calibrated with analytes diluted in CS2. Injections of a vapor-phase mixture of methane and n-octane were made at each of several flow rates in both N2 and He carrier gases at 30°C. Plate height, H, determined by standard methods,S6 was plotted against flow rate as shown in the Golay plots in Figure S4 for both carrier gases. Results are discussed in the text of the main body of this article.
To evaluate column capacity, separations were conducted at 50°C and 3 mL/min of a mixture of neat benzene, toluene, and isopropylbenzene (i.e., cumene, pv = 0.6 kPa) over a range of injected masses from 0.15 µg to as high as 30 µg, and the fwhm values of the peaks were used as the metric. S6 The resulting fwhm values are plotted in Figure S5a. For benzene and toluene, the fwhm values increased by < 10% up to about ~8 g and then increased at a somewhat higher rate up to 30 g. The ratio of fwhm values for the highest lowest injected masses was < 1.7 for both compounds. For cumene, with a substantially larger retention factor, the fwhm also increased by < 10% up to ~8 µg and then showed a sharp increase with larger injection masses up to 15 g. In this case, the ratio of fwhm values for the highest and lowest injection masses was also < 1.7. Of course, temperature is an important cofactor: higher temperatures reduce the retention factors of all analytes and, thus, the dependence of the fwhm on mass injected, because sorption equilibria are shifted in favor of the mobile phase. With temperature programmed separations, the influence of this factor would vary; benzene would probably elute completely before the columns reached 50C, increasing the chances of overloading, whereas cumene would likely elute at > 50C, reducing the ultimate impact of this factor on the fwhm.
In a follow-up experiment the chromatographic resolution of benzene and trichloroethylene under the same GC conditions was constant up to an injected mass of ~8 g of each component, and then started to decrease at larger injected masses. Results are presented in Figure S5b. Taken together, these data provide some confidence that injections smaller than ~8 g of any single component would not result in significant reductions in chromatographic performance due to overloading of the stationary phase.
S6. PEMM-1 Thermal Stability and Effect of Interconnect Heaters
Thermal Profiles. The assembled PEMM-1 prototype was then run through a series of sampling and analytical cycles to check for thermal stability and reproducibility. First, a blank static test atmosphere of N2 was sampled for 1 min at 10 mL/min, valves were actuated and the pump stopped, He was passed at 3 mL/min through the core microsystem, the PCF was heated to mimic (splitless) injection, and the µcolumn heaters initiated a temperature program typical of that to be used in practice. The full analytical cycle lasted 4 min. Upon reaching the maximum µcolumn temperature, the instrument was allowed to cool for 3 min, during which time two dedicated cooling fans adjacent to the µPCF and µcolumns, respectively, were activated. This 8-min sequence was repeated 22 times over the course of 3 hours; readings from the RTDs in the system and the thermocouple on the fluidic carrier plate were recorded.
8

Figure S6 shows the data from a representative run. The fidelity of component temperatures to their set point temperatures was excellent. The temperature of the fluidic carrier plate, which reflects the internal temperature of the prototype, rose by only ~3 °C in sync with the temperatures of the µcolumns. Active cooling (optional) reduced the temperature of the μPCF during sampling to roughly 27-28 °C during the above sequence of runs. There was no cumulative drift over the course of the experiment.
Although variability was low, deviation from the applied ramp was apparent at the beginning of each new ramp rate. As can be seen in Figure S6, small, transient increases in the temperature ramp for both columns at 0 and 2 minutes indicate a small over-shoot in the slow ramps. These are apparently an artifact of the voltages used in the PWM algorithm used to control the temperatures of these components. Due to the highly reproducible nature of these deviations, their impact on retention times is low.
Figure S5. Effect of injected mass on chromatographic resolution for the µcolumn ensemble (6 m total length); a) effect of mass on fwhm for three target vapors, benzene, toluene and cumene, and b) effect of injected mass on chromatographic resolution of benzene and trichloroethylene. Mass in b) is the average mass of trichloroethylene and benzene in the injection, and the binary mixture was in a 1.5:1 ratio, respectively, to account for differences in FID sensitivity (i.e., to maintain similar peak sizes).
9
0
1
2
3
4
0.1 1 10 100
fwhm
(s)
Inj. mass (μg)
benzene
toluene
cumene
0
2
4
6
8
0.1 1.0 10.0 100.0
RS
Avg. inj. mass (µg)
a)
b)

For the µCR array, without active heating, the relative standard deviation around the average temperature was 1.7% (temperature ranged from 29.8 to 30.2°C). There was no trend in this variation; it did not track the temperature of the enclosure or the µcolumns. This extremely small shift in temperature is likely attributable to the engineered thermal isolation of the device, which is elevated above its PCB (i.e., suspended by the connecting capillaries) and shielded inside a metallic faraday cage with no circulating air.
Figure S6. Temperature profiles of system components for a representative analytical cycle of PEMM 1 prototype. µPCF temperatures are referenced to the left hand vertical axis, and temperatures of the other components are referenced to the right hand vertical axis. The fluidic carrier “plate” thermistor was used to indicate ambient internal temperature of the system enclosure; all other measurements were taken directly from the fluidic component RTDs; µcolumn 1 was ramped at 5°C/min from an initial 30°C to 35°C (1 min), then at 75° C/min to 110 °C (1 min), then at 20°C/min to 150 °C (2 min); µcolumn 2 was ramped at 5°C/min from an initial 30°C to 35°C (1 min), then 85° C/min to 125 °C (1 min), then 15°C/min to 150 °C (2 min).
Interconnect heaters. The analytical cycle described above was repeated without heating one or the other press-tight unions connecting the µcolumns to the µPCF and µCR array, to evaluate the effect. A test atmosphere containing a homologous series of n-alkanes from C6 to C12 at ~100 ppm each was used. Since these press-tight union heaters demand a large amount of power, it was necessary to evaluate their relevance to the chromatographic performance of the system. When the union between the μPCF and μcolumns was left unheated, no change in fwhm was observed for any of the 7 compounds (n-hexane through n-dodecane). This makes sense, because the first μcolumn was held at 30°C for the first 30 sec of the separation. It was concluded that the more volatile fraction of analytes does not adhere to the uncoated union at these temperatures, and the less volatile fraction of analytes undergoes on-column focusing upon reaching the μcolumn, reducing any extra-column band broadening due to the transfer capillary.S7
10

When the union between the µcolumn and FID was left un-heated, fwhm for n-nonane, n-decane, n-undecane, and n-dodecane increased by 2.8%, 7.0%, 12% and 21%, respectively (no change in fwhm was observed for n-hexane, n-heptane or n-octane). The changes in fwhm for n-nonane and n-decane were not significant. This suggests that for mixtures containing analytes with vapor pressures < 0.59 kPa, the unheated downstream union introduces a significant source of extra column band broadening.
S7. PEMM-1 Sample Throughput: Effect of Pre-Trap on Quantification
To double check the pre-trap retention properties when installed at the inlet of PEMM-1, the B1 pretrap (65 mm, 250 m i.d. capillary column with 0.1 m thick PDMS, Rtx-1 phase) was installed at the front of the PEMM-1 prototype. A test atmosphere containing 10 compounds spanning a pv range from 58.1 kPa (n-C5) to 0.0075 kPa (n-C13) each at ~100 ppm was prepared in an 8-L Flex-foil bag, and 10 mL of the mixture was sampled through the pre-trap or the same length of an uncoated capillary and the μPCF was heated to inject the VOCs (splitless). For these tests, the CR array was bypassed and eluting peaks were quantified with an FID. For quality control, a sample of the same mixture was collected in a sample loop and analyzed by GC-FID in parallel. Triplicates were collected for all tests.
Results are summarized in Figure S7 in terms of each of three ratios of peak areas, R1, R2 and R3: R1 = PEMM-1 without pre-trap vs. GC-FID; R2 = PEMM-1 with pre-trap vs. GC-FID; and R3 = PEMM-1 with pre-trap vs. PEMM-1 without pre-trap. A smaller value of R1 would reflect either breakthrough of the μPCF, in the case of the more volatile analytes, or retention or entrainment losses on components of the PEMM-1 flow path not related to the pre-trap. A smaller value of R2 would reflect retention on the pre-trap and retention or entrainment losses relative to the reference method. A smaller R3
would reflect losses only due to the pre-trap. The 8-12% loss of the co-eluting pair, C5 and MEK, can be ascribed to PCF
breakthrough of a portion of the sampled masses of these vapors, since these compounds would not be retained at all by the pre-trap. Since these are less volatile than benzene, and thus were considered interferences, some degree of PCF breakthrough was expected (see ref S5). All later-eluting target compounds, from benzene to C12, were analyzed with 97-99% throughput (see the R3 values in Figure S7). For C13, the R3 value indicates that the pre-trap removed/retained all but 28% of the sample mass compared to operation without the pre-trap. However, the R1 value indicates that there are other loss mechanisms, since operation without the pre-trap resulted in only 73% throughput compared to the parallel GC-FID analysis. Adsorption on surfaces of other components in the flow path are apparently involved. This reveals an inherent constraint of the PEMM-1, which does not have heated transfer lines upstream of the columns. Thus, the threshold vapor pressure below which quantitative throughput would not be expected is somewhere between 0.027 kPa (C12) and 0.007 kPa (C13), notwithstanding any mitigating effects arising from the polarity of the VOC.
11

S8. Calibration Curves, Sensitivities, and LODs
Calibration curves for all VOC-sensor combinations are given in Figure S8. Values of the slope, derived from least-squares linear regression with forced zero are given in Table S2 along with the R2 values. The corresponding limits of detection (LOD) calculated from injected masses are given in Table S3. LODs, in ng, were calculated as 3/slope, where is the RMS noise level.
Although LODs tended to vary directly with vapor pressure for the non-polar C8- and EOE-coated sensors, there were several exceptions, and no such trend was observed among the sensors with more polar MPN coatings. This is because sensitivity also varies with the affinity between the functional groups in the VOCs and MPN thiolates and, evidently, the MPN film thickness, which would affect the rates of VOC sorption and desorption.
12
Figure S7. Results of tests of PEMM-1 sample throughput for representative compounds using an FID in place of the uCR array for detection. Peak areas (A) with and without the pre-trap are compared to each other and to those generated from samples analyzed by a reference GC-FID. R1=PEMM-1 without pretrap/GC-FID, R2=PEMM-1 with pretrap/GC-FID, R3= PEMM-1 with pretrap/PEMM-1 without pretrap. PEMM-1conditions: 10 mL sample of a mixture of all compounds shown at ~100 ppm of each; splitless injection at 3 mL/min in helium; FID. Pretrap B2 was used (65 mm, 250μm ID with 0.1 μm thick Rtx-20). GC-FID: 100 L loop injection; He carrier gas. Responses from the GC-FID were multiplied by 100 x to account for smaller sample volume.

Figure S8. Calibration curves for 17 targets from PEMM-1. For each target VOC, the peak height is plotted as a function of injected mass. Peak heights were converted from relative voltage changes to relative resistance changes (i.e., ΔR/Rb) prior to plotting (see Section S1). The range of masses corresponds to a concentration range of 0.1-4 TLV, assuming a sample volume of 10 mL. All calibrations were performed with He carrier gas using a split injection, with a split ratio of 2:1(vent: analysis), where the flow rate through the analytical path was 3 mL/min. The temperature programs of both µcolumns were as follows: 28 °C for 0.5 min, then 10°C/min to 33°C, then 50°C/min to 125°C, then hold at 125°C for 1.2 min. The CR array temperature was 30 °C. Legend: EOE, filled circles; C8, filled triangles; OPH, filled diamonds; TEG, crosses; HME, unfilled squares.
13

Table S2. Forced-zero regression slopes and R2 values of the 17 target VOCs from the calibration curves presented in Figure S8 for the PEMM-1 prototype GC. a
CR BEN TCE C7 MIBKSlope R2 Slope R2 Slope R2 Slope R2
EOE 0.0416 0.998 0.0395 0.997 0.0232 0.992 0.0217 0.999C8 0.0360 0.999 0.0195 0.997 0.0165 0.999 0.0115 0.994
OPH 0.0156 0.991 0.0068 0.990 0.0036 0.997 0.0098 0.997TEG 0.0303 0.993 0.0331 0.996 0.0052 0.998 0.0206 0.998HME 0.0221 0.994 0.0035 0.981 0.0032 0.994 0.0114 0.998
CR TOL MBK BAC ETBSlope R2 Slope R2 Slope R2 Slope R2
EOE 0.0457 0.996 0.0155 0.996 0.0367 0.997 0.0568 0.998C8 0.039 0.996 0.0052 0.990 0.0264 0.998 0.048 0.999
OPH 0.0154 0.997 0.0063 0.995 0.0236 0.998 0.019 0.997TEG 0.0276 0.996 0.014 0.996 0.0315 0.998 0.0269 0.993HME 0.019 0.994 0.0065 0.985 0.0181 0.994 0.0218 0.995
CR XYL EBK PPB TMBSlope R2 Slope R2 Slope R2 Slope R2
EOE 0.0651 1.000 0.0715 0.999 0.0555 0.995 0.0718 0.990C8 0.0541 0.998 0.0475 0.995 0.0458 0.995 0.0598 0.998
OPH 0.0263 0.997 0.0439 0.995 0.0145 0.992 0.0178 0.998TEG 0.0315 0.997 0.0536 0.999 0.0188 0.983 0.0213 0.991HME 0.0238 0.997 0.0304 0.990 0.0212 0.990 0.024 0.995
CR C10 NBZ C11 TCBSlope R2 Slope R2 Slope R2 Slope R2
EOE 0.0803 0.999 0.1049 0.989 0.0306 0.987 0.1679 0.989C8 0.05 0.997 0.0354 0.986 0.0161 0.985 0.131 0.990
OPH 0.004 0.989 0.1005 0.990 0.0031 0.976 0.0939 0.988TEG 0.0084 0.993 0.0798 0.989 0.0029 0.989 0.0915 0.988HME 0.0078 0.993 0.1146 0.981 0.0043 0.987 0.1277 0.991
CR C12
Slope R2
EOE 0.0037 0.986C8 0.0026 0.984
OPH 0.0006 0.985TEG 0.0009 0.986HME 0.0011 0.986
a Slope is in units of ΔR/Rb/g, where the mass is 1/3 of the mass captured on the PCF to account for the 2:1 injection split . See caption of Figure S8 for conditions of analysis. Acronyms for the VOCs in the column headings and for the sensor MPN coatings in the rows are defined in the main body of the article.
14

Table S3. Limits of detection (LOD) of the 17 target compounds for each CR in the PEMM-1 prototype GC on the basis of injected mass using a 2:1 split injection.a
Compounds LOD (ng)EOE C8 OPH TEG HME
BEN 9.5 11 32 19 30TCE 10 19 73 18 190C7 17 23 140 110 200MIBK 18 33 51 28 57TOL 8.7 10 32 21 34MBK 26 73 79 41 100BAC 11 14 21 18 36ETB 7.0 7.9 26 22 30XYL 6.1 7 19 18 27EBK 5.5 8 11 11 22PPB 7.1 8 34 31 33TMB 5.5 6 28 27 27C10 4.9 8 46 49 63NBZ 4.8 11 4.9 7.3 5.7C11 13 23 100 200 150TCB 2.4 2.9 5.3 6.3 5.1C12 110 140 820 640 590
aLODs were calculated as 3σ/sensitivity, where σ is the standard deviation of the baseline noise for each sensor and sensitivity is the forced-zero linear-regression slope of peak height versus injected mass. The values of σ, in units of (ΔR/Rb) × 106, were as follows: 132(EOE), 126 (C8), 165 (OPH), 193 (TEG), and 218 (HME). The conditions of analysis are given in the caption of Figure S8. Only 1/3 of the mass captured on the PCF was injected due to the 2:1 split employed. Acronyms for the VOCs and MPN sensor coatings are given in the text of the main body of the article.
15

S9. Reliability: Medium Term Stability
To assess the reproducibility of analyses performed daily over 7 days, samples from the same static test atmosphere (Flex-foil bag) containing a subset of 9 VOCs at ~100 ppm each were collected by the PEMM-1 prototype (10 mL sample volume) and by a 100 L sample loop of a bench-scale GC-FID system. The PEMM-1 analyses employed a 2:1 split injection whereas the GC-FID analyses employed a splitless injection. Separation conditions were otherwise the same for both methods, entailing the same temperature program and a He carrier gas flow rate of 3 mL/min in the analytical path. For the PEMM-1, 4 samples were collected each day, with each sample separated in time by at least 1 hr. For the GC-FID, only 1 sample was collected at the end of each day. Results are summarized in Tables S4 and S5.
In Table S4 the RSD (%) around the mean response (peak area) and mean retention time (tR) obtained from each of two CR sensors are presented. The C8 sensor gave the lowest variability and the OPH gave the highest variability, on average, among the sensors in the array, and are therefore considered representative of the data set. The peak area data are the same as presented in Table 2 in the main article, and show that the range of intra-day RSD values is quite low for the C8 sensor (range: ~1 to 8 %) and higher for the OPH sensor (range: ~1 to 10%). For the tR data, the variability is quite low for both sensors, ranging from 0.1 to 1.3% for all VOCs except for n-heptane (C7), which is the earliest eluting mixture component, and which had RSDs ranging from 0.2 to 3.6%. Overall, these data demonstrate a high level of analytical reproducibility by the PEMM 1 prototype, though the variation in sensitivity exhibited by the OPH-coated sensor would argue for replacing this sensor in the future.
Table S5 compares the weekly average values of peak area, fwhm, and tR from the C8 sensor of the PEMM 1 and from the GC-FID, along with the corresponding RSDs for each of the 9 VOCs in the mixture. As shown in Table S5, the mean values of peak area were higher for the GC-FID due to its higher sensitivity. Despite this, the variability in replicate responses, expressed as the RSD (%) around the mean values, were only slightly higher for the PEMM-1 C8 sensor for all 9 VOCs: 2.7-9.6% for PEMM-1 (C8) and 1.3-7.5% for the GC-FID. The relative variation of fwhm values was lower for the PEMM-1, in part, because of the larger values of fwhm from the C8 sensor. The variation of tR
values was lower for the GC-FID in all cases, but was < 1% for the majority of VOCs with the PEMM-1, which is considered quite acceptable. Overall, the medium-term stability of analytical performance of the PEMM-1 is judged to be quite good on the basis of these results.
As shown in Table S6, when operated autonomously over 2 days, the PEMM-1 exhibited small but consistent decreases in retention time, peak height, and peak area for the 6 VOCs included in the test. Within either day or between the two days, these changes were all < 10% and typically < 5%, again, illustrating the stability of performance.
16

Table S4. Stability of peak area and retention time measurements from PEMM-1 on the basis of 4 measurements per day for each of 7 days for a 9-VOC mixture.
Cmpd CR
Daily RSD (%)a
peak area (A) retention time (tR)
1 2 3 4 5 6 7 1 2 3 4 5 6 7C7 C8 1.6 2.1 2.4 2.4 2.4 1.1 1.6 1.5 1.3 1.7 1.5 0.9 0.5 0.4
OPH 4.1 3.1 4.7 7.3 6.6 3.4 3.0 3.6 1.6 1.2 2.3 2.2 0.2 0.3
BAC C8 1.3 2.4 2.1 1.5 3.7 2.9 2.0 0.7 1.0 1.6 1.0 0.6 0.4 0.6OPH 0.8 2.0 1.2 1.4 1.4 2.6 1.5 1.2 0.8 0.6 1.8 1.4 0.4 0.3
XYL C8 2.4 3.1 1.8 3.6 4.4 3.0 1.0 0.6 0.8 1.1 0.7 0.4 0.3 0.4OPH 2.2 3.5 3.6 5.0 2.1 4.0 2.8 0.7 0.7 0.4 1.3 1.1 0.4 0.2
EBK C8 2.4 4.1 3.5 3.5 3.5 4.2 4.7 1.0 0.7 1.0 0.7 0.4 0.4 0.4OPH 2.3 3.2 1.9 2.4 1.6 3.0 3.5 0.7 0.7 0.4 1.1 1.0 0.3 0.1
PPB C8 2.7 3.2 3.4 1.9 4.8 3.2 2.0 0.7 0.7 0.8 0.6 0.3 0.2 0.5OPH 3.0 5.9 4.1 5.1 5.7 7.9 4.0 0.4 0.7 0.3 0.9 0.9 0.4 0.1
TMB C8 2.7 3.0 2.8 3.3 2.4 5.9 2.3 0.5 0.6 0.8 0.5 0.2 0.2 0.4OPH 6.3 6.6 9.8 5.4 7.3 7.3 5.1 0.4 0.6 0.4 0.8 0.8 0.3 0.1
C10 C8 2.3 1.3 1.6 3.7 4.2 4.8 4.4 0.6 0.6 0.7 0.5 0.2 0.2 0.4OPH 6.2 2.3 1.7 5.0 2.0 7.5 6.6 0.3 0.7 0.4 0.8 0.7 0.4 0.2
C11 C8 4.5 4.2 5.8 3.6 4.5 5.8 3.8 0.7 0.6 0.6 0.5 0.2 0.1 0.3OPH 8.5 9.8 8.5 8.5 5.1 6.2 6.7 0.2 0.7 0.5 0.6 0.6 0.4 0.1
C12 C8 4.6 7.4 8.0 4.2 5.8 7.0 5.4 0.5 0.5 0.4 0.4 0.2 0.5 0.4OPH 9.1 7.8 9.9 9.7 6.3 7.6 9.3 0.5 0.7 0.4 0.6 1.0 0.3 0.2
a Analyses entailed collection of a 10-mL sample of static test atmosphere containing all mixture components at a concentration corresponding to ~2 TLV (see Table 1 in the main body of the article). Separation conditions were the same as those given in the caption of Figures S8. Each RSD value is based on 4 separate determinations collected at least one hour apart each day.
17

Table S5. Comparison of inter-day stability of PEMM-1 and a reference GC-FID on the basis of peak area (A), peak width (fwhm), and retention time (tR) for each component of a 9-VOC mixture. For the PEMM-1, the data from the C8 sensor is presented. Entries are averages of daily values collected for 7 consecutive days (see caption of Figures S8 for conditions).
Cmpd
PEMM-1/C8 sensora GC-FIDa
A(102)
((ΔR/Rb)·s)
FWHM
(s)
tR
(s)
A
(pA·s)
FWHM
(s)
tR
(s)
C7 12 (3.9)b 1.4 (3.8) 40.1 (2.0) 121 (1.9) 0.44 (0.7) 24.6 (0.1)
BAC 23 (2.9) 1.9 (2.1) 78.8 (1.3) 173 (1.3) 0.92 (2.8) 49.3 (0.1)
XYL 18 (2.7) 1.2 (0.9) 94.3 (0.9) 109 (2.2) 0.82 (2.5) 66.0 (0.1)
EBK 11 (4.9) 1.2 (1.4) 99.3 (0.9) 94.3 (4.6) 0.93 (3.9) 71.5 (0.1)
PPB 11 (5.2) 1.1 (0.9) 117 (0.7) 59.3 (4.3) 0.81 (4.8) 91.4 (0.1)
TMB 2.2 (6.8) 1.1 (1.5) 127 (0.6) 12.0 (5.3) 0.80 (8.1) 102 (0.1)
C10 11 (5.3) 1.0 (0.7) 132 (0.6) 21.1 (4.4) 0.79 (4.5) 109 (0.2)
C11 6.6 (9.0) 1.7 (1.0) 154 (0.5) 21.1 (6.0) 0.83 (2.1) 135 (0.3)
C12 1.0 (9.6) 2.9 (2.3) 175 (0.5) 8.80 (7.5) 0.85 (5.1) 159 (0.4)
a 7-day average where each day’s value was the avg of 4 replicates (see Table S4) for the PEMM-1 and was a single value for the GC-FID.
b Values in parentheses are relative standard deviations (RSD, n=7) expressed as percentage (%).
18

Table S6. Results (C8 sensor) of continuous, autonomous PEMM-1 operation: analyses of a 6-VOC mixture over 8 hr/day for 2 days.a
Cmpd
Intra-dayDay 1 Day 2
tR (s) H(ΔR/Rb×102)
A(ΔR/Rb·s×102) tR (s) H
(ΔR/Rb×102)A
(ΔR/Rb·s×102)amb pmc Δ%d am pm Δ% am pm Δ% am pm Δ% am pm Δ% am pm Δ%
BEN 25.1 24.8 -1.20 3.6 3.6 0 4.1 3.9 -4.9 23.8 23.7 -0.420 3.5 3.4 -2.9 3.9 3.8 -2.6TOL 48.9 48.3 -1.23 4.4 4.3 -2.3 7.7 7.3 -5.2 46.1 45.9 -0.434 4.3 3.9 -9.3 7.1 6.5 -8.5MBK 56.7 55.8 -1.59 3.4 3.2 -5.9 6.0 5.7 -5.0 53.4 53.2 -0.375 3.1 3 -3.2 5.7 5.5 -3.5BAC 69.0 68.1 -1.30 4.3 4.2 -2.3 7.3 6.6 -9.6 65.6 65.2 -0.610 4.0 3.9 -2.5 7.1 6.5 -8.5ETB 83.9 83.2 -0.83 6.5 6.1 -6.2 8.6 8.1 -5.8 81.2 80.8 -0.493 6.1 5.5 -9.8 8.2 7.5 -8.5XYL 87.1 86.3 -0.92 6.5 5.9 -9.2 9.7 9.0 -7.2 84.4 84.0 -0.474 6.0 5.5 -8.3 9.0 8.5 -5.6
Cmpd
Inter-daye
tR (s) H(ΔR/Rb×102)
A(ΔR/Rb·s×102)
Day 1 Day 2 Δ% Day 1 Day 2 Δ% Day 1 Day 2 Δ%BEN 25.0 23.8 -4.80 3.6 3.5 -2.8 4.0 3.9 -2.5TOL 48.6 46.0 -5.35 4.3 4.1 -4.7 7.5 6.8 -9.3MBK 56.3 53.3 -5.33 3.3 3.0 -9.1 6.0 5.6 -6.7BAC 68.6 65.4 -4.67 4.2 4.0 -4.8 7.0 6.8 -2.9ETB 83.6 81.0 -3.11 6.3 5.8 -7.9 8.0 7.9 -1.3XYL 86.7 84.2 -2.88 6.2 5.7 -8.1 9.3 8.8 -5.4
a PEMM-1 was operated continuously for 8 hr per day on each of two consecutive days; tR = retention time; H = peak height; A = peak area; values are based on the responses from the C8 sensor; baverage from 3 consecutive analyses collected at the outset in the morning; caverage from 3 consecutive analyses collected at the end of the afternoon; d difference (%) = [(pm- am)/am] ×100 or [(Day 2- Day1)/Day 1] ×100; e inter-day comparisons are based on the averages of am and pm values from a given day. Samples (10 mL) were collected from a static test atmosphere of the mixture in N2 with each compound at ~100 ppm. Separation conditions were the same as those given in the caption of Figure S8 using the on-board He canister as the carrier gas.
19

S10. Response Patterns and Confusion Matrices
Figure S9 shows the normalized response patterns for all 17 target compounds. Tables S7 and S8 present the confusion matrices obtained from Monte Carlo simulations coupled with extended disjoint principal components regression (EDPCR) classification models on the basis of arrays of all 5 sensors (Table S7) and 4 sensors (Table S8, OPH removed).S8 Using the experimental sensitivity (slope) values (Table S2), synthetic responses from each CR sensor to a selected vapor were generated by randomly selecting a vapor concentration within the range of 5-10×LOD, where the LOD for each compound was that corresponding to the least sensitive sensor in the array to ensure that all sensors contributed to the response patterns. A synthetic response was calculated from the calibration-curve regression equation for each sensor. Then, error was introduced by adding to the response a value obtained by multiplying that response value by a factor derived from randomly sampling a Gaussian distribution with a mean of zero and a standard deviation corresponding to the average RSD determined for each sensor on the basis of repeated measurements (like those presented for C8 and OPH sensors in Table S4, above). The “error enhanced” responses from all sensors were then combined (vector sum in “n-space”, where n is the number of sensors in the array) and the location of the resulting response vector was projected onto the principal component corresponding to the original calibrations for each vapor via EDPCR. The identity of the vapor assigned to this synthetic response vector was determined by the shortest Euclidean distance. This procedure was performed iteratively (i.e., 500 samples) to yield a statistical estimate of recognition rate (RR, %) for each vapor.
20

Figure S9. Normalized response patterns for 17 targets derived from the slopes of the calibration curves presented in Table S2.
21

Table S7. Confusion matrix showing errors in assigned identities and net recognition rate (RR, %) for the 17 individual target VOCs from MC-EDPCR analyses of response patterns derived from all 5 sensors in the CR array.a
VOCs BEN TCE C7 MIBK TOL MBK BAC ETB XYL EBK PPB TMB C10 NBZ C11 TCB C12
BEN 459 0 0 0 30 0 0 0 2 14 0 0 0 0 0 8 0TCE 14 481 0 0 0 14 0 0 0 0 0 0 0 0 0 0 0C7 0 0 457 0 0 0 0 0 0 0 0 0 35 0 18 0 0MIBK 0 0 0 479 0 3 4 0 0 0 0 0 0 1 0 0 0TOL 26 0 0 0 429 0 0 21 22 0 0 0 0 0 0 0 0MBK 0 4 0 14 0 483 0 0 0 1 0 0 0 0 0 0 0BAC 0 0 0 4 0 0 413 0 0 70 0 0 0 7 0 0 0ETB 1 0 0 0 36 0 0 410 47 0 7 18 0 0 0 0 0XYL 0 0 0 0 5 0 0 52 426 4 0 6 0 0 0 0 0EBK 0 0 0 0 0 0 77 0 1 411 0 0 0 0 0 0 0PPB 0 0 0 0 0 0 0 16 2 0 356 105 0 0 0 0 2TMB 0 0 0 0 0 0 0 1 0 0 107 330 0 0 0 0 38C10 0 15 36 0 0 0 0 0 0 0 0 0 406 0 49 0 7NBZ 0 0 0 0 0 0 0 0 0 0 0 0 0 486 0 0 0C11 0 0 0 0 0 0 0 0 0 0 0 0 51 0 433 0 0TCB 0 0 0 3 0 0 6 0 0 0 13 0 0 1 0 484 0C12 0 0 0 0 0 0 0 0 0 0 17 41 8 0 0 0 453
RRb 92 96 91 96 86 97 83 82 85 82 71 66 81 97 87 97 91a Actual identities are listed in the top row and assigned identities are listed in the first column; n = 500 iterations for each VOC; error values assumed in generating synthetic responses are given in the text above; b recognition rate (%) for correct identity assignments. Notes: 5 cases with RR > 95%; 8 cases with RR > 90%; 9 cases with RR from 66-87%.
22
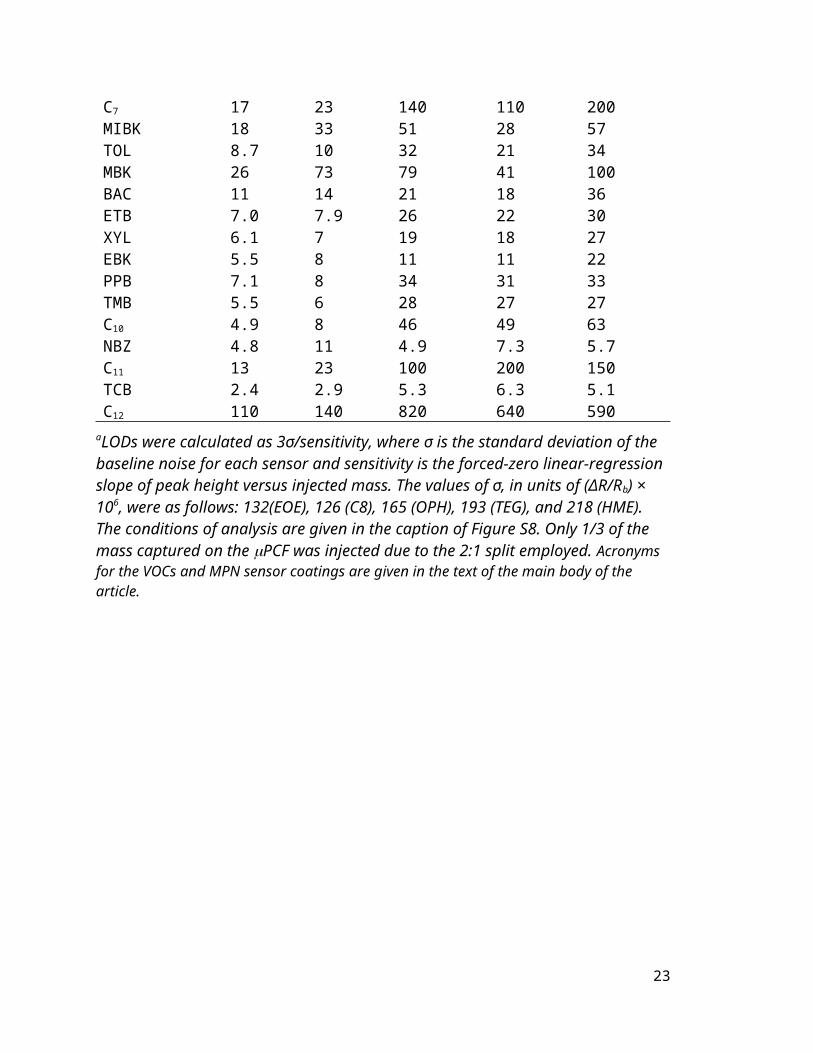
Table S8. Confusion matrix showing errors in assigned identities and net recognition rate (RR, %) for the 17 individual target VOCs from MC-EDPCR analyses of response patterns derived from 4 of the 5 sensors in the CR array (OPH sensor was omitted).a
VOCs BEN TCE C7 MIBK TOL MBK BAC ETB XYL EBK PPB TMB C10 NBZ C11 TCB C12
BEN 470 0 0 0 18 0 13 0 0 11 0 0 0 0 0 5 0TCE 0 492 0 0 0 0 0 0 0 0 0 0 0 0 0 0 0C7 2 0 469 0 5 0 0 0 0 0 0 0 41 0 7 0 0MIBK 0 2 0 490 0 9 9 0 0 4 0 0 0 6 0 0 0TOL 18 0 0 0 430 0 0 28 34 1 0 0 0 0 0 0 0MBK 0 0 0 0 0 491 0 0 0 0 0 0 0 0 0 0 0BAC 0 0 0 0 0 0 389 0 0 2 0 0 0 0 0 0 0ETB 0 0 0 0 30 0 0 273 153 0 5 2 0 0 0 0 0XYL 0 0 0 0 11 0 0 181 304 0 0 1 0 0 0 0 0EBK 10 6 0 10 6 0 89 0 0 482 0 0 0 0 0 0 0PPB 0 0 0 0 0 0 0 18 9 0 405 76 0 0 0 0 0TMB 0 0 0 0 0 0 0 0 0 0 74 376 0 0 0 0 59C10 0 0 26 0 0 0 0 0 0 0 0 0 425 0 28 0 0NBZ 0 0 0 0 0 0 0 0 0 0 0 0 0 493 0 0 0C11 0 0 0 0 0 0 0 0 0 0 0 0 34 0 465 0 0TCB 0 0 0 0 0 0 0 0 0 0 0 0 0 1 0 495 0C12 0 0 0 0 0 0 0 0 0 0 16 45 0 0 0 0 441
RRb 94 98 94 98 86 98 78 55 61 96 81 75 85 99 93 99 88a Actual identities are listed in the top row and assigned identities are listed in the first column; n = 500 iterations for each VOC; error values assumed in generating synthetic responses are given in the text above; b recognition rate (%) for correct identity assignments. Notes: 6 cases with RR > 95%; 9 cases with RR > 90%; 8 cases with RR from 55-88%.
References
23

S1. Bryant-Genevier J. Scholten K, Kim SK, et al. Multivariate curve resolution of co-eluting vapors from a gas chromatograph with microsensor array detector. Sens. Actuator B: Chemical 2014; 202: 167-176.
S2. Wright L, Zellers ET, A nanoparticle-coated chemiresistor array as a microscale gas chromatograph detector for explosive marker compounds: flow rate and temperature effects. Analyst 2013; 138: 6860-6868.
S3. Lu CJ, Steinecker WH, Tian WC, et al. First-generation hybrid MEMS gas chromatograph. Lab Chip 2005; 5:1123-1131.
S4. Kim SK, Burris DR, Chang H, et al. Microfabricated gas chromatograph for on-site determinations of trichloroethylene in indoor air arising from vapor intrusion, part 1: field evaluation. Env. Sci. and Tech. 2012; 46: 6065-6072.
S5 Bryant-Genevier J, Zellers ET, Toward a microfabricated preconcentrator-focuser for a wearable micro-scale gas chromatograph. J. Chrom. A. 2015; 1422: 299-309.
S6. Grob RL, Barry EF, Modern practice of gas chromatography. 4th ed. Hoboken: Wiley Interscience, 2004: 114-115.
S7. Lu CJ, Zellers ET. A dual-adsorbent preconcentrator for a portable indoor-VOC microsensor system. Anal. Chem 2001; 73: 3449-3457.
S8. Zhong Q, Steinecker W, Zellers ET. Characterization of a high-performance portable GC with a chemiresistor array detector. Analyst 2009; 134: 283-293.
24