media.nature.com · web viewincluding blood counts and differential counts, bone marrow (bm)...
TRANSCRIPT

Supplementary Appendix (Hadzijusufovic et al.)
This appendix has been created by the authors to provide additional information to readers
about their work in Hadzijusufovic et al.
Nilotinib-induced vasculopathy: identification of vascular endothelial cells
as a primary target site
Treatment of CML patients with Nilotinib
Between May 2006 and December 2013, a total of 36 patients with Philadelphia
chromosome-positive (Ph+) CML (females, n=16; males, n=20) received Nilotinib at the
Medical University of Vienna. All of them were included in our study and no additional
selection criteria (i.e. AOD-related) were applied. The patient´s characteristics are shown in
Table 1 in the main document. Cytogenetic and molecular findings are shown in Table S1.
These were sequential patients treated at our center in Vienna and most of them (>90%)
received their first-line therapy in our center. The median age at diagnosis was 49 years
(range: 22-83 years). Of the 36 patients, 35 received Nilotinib as second- or third-line therapy
because of resistance or intolerance against Imatinib or/and other tyrosine kinase inhibitors
(TKI) following the guidelines of the European Leukemia Net (ELN).1,2 Previous anti-CML
therapy (prior to Nilotinib) and co-medications used during Nilotinib are shown in Table S2.
One patient received frontline Nilotinib within the ENESTnd trial (Gov: NCT00471497).3 At
the start of Nilotinib-therapy, the median age was 56.5 years (range: 33-84 years). Most
patients (30/36) received 2x400 mg Nilotinib per os daily throughout the observation-period.
In 5 patients, Nilotinib was reduced to 2x300 mg/day, and in one patient, the dose of Nilotinib
was reduced to 2x200 mg/day because of cytopenia. Metabolic data before and during
Nilotinib-therapy are shown in Table S3. Before starting Nilotinib, a complete staging,
1

including blood counts and differential counts, bone marrow (BM) examinations, serum
chemistry (including fasting glucose and cholesterol levels), coagulation parameters, and
BCR/ABL1 mutation analyses, were performed. BM examinations included cytology, routine
histology and immunohistochemical analyses as well as cytogenetic studies (see below).
BCR/ABL1 mRNA levels were determined in peripheral blood (PB) cells using ABL1 as a
reference gene and the International Scale (IS) (after introduction) for standardized
quantification.4-6 Preexisting risk factors for AOD development and related comorbidities
were recorded in a retrospective manner. In particular, a detailed case history, including
smoking habits, arterial hypertension, known hypercholesterolemia (hyperlipidemia),
previous vascular disorders and signs and symptoms of overt atherosclerosis, including
peripheral AOD and coronary artery disease, were recorded retrospectively in all patients.
One of the 36 patients examined had a history of AOD (myocardiac infarction) before start of
Nilotinib-treatment. In a second case, no recorded data were available before the start of
Nilotinib; and in 34 of 36 patients, no AOD was known. We also examined all patients for the
presence of thrombophilia-associated parameters, including activity of protein S and protein
C, presence of the Factor V Leiden mutation (F5 c.1601G>A, p.Arg534Gln) and the
Prothrombin mutation (F2 c.*97G>A) as described.7 Factor V Leiden was detected using the
Factor V Leiden kit and the Prothrombin mutation was analyzed using the Factor II G20210A
kit following the recommendations of the manufacturer (Roche Molecular Diagnostics,
Rotkreuz, Switzerland).7
Hematologic follow up and evaluation of response to Nilotinib
During treatment with Nilotinib, patients were examined for their hematologic, cytogenetic,
and molecular response. All patients were seen in regular time-intervals (every 1-6 months) in
our center (Medical University of Vienna). BCR/ABL1 mRNA levels were measured every 3-
12 months. Mutation analysis was performed in case of a persistently elevated BCR/ABL1 2

following generally accepted recommendations.8 Conventional karyotyping was performed on
BM mononuclear cells before and during treatment with Nilotinib in 3-12 months intervals.
At least 20 BM metaphases were examined whenever possible. Karyotypes were reported
according to available guidelines9 and are expressed as percentage of Ph+ metaphases. In case
of questionable results or poor growth, fluorescence in situ hybridization (FISH) was
performed. Treatment responses were classified according to recommendations provided by
the ELN1,2 and are shown in Table 1 in the main document. To study the effects of Nilotinib
on microvessel density and expression of endothelial antigens, BM sections, obtained before
and after treatment with Nilotinib, were analyzed by indirect immunohistochemistry (see
below).
Evaluation of vascular adverse events in CML patients receiving Nilotinib and in age-and risk
factor-matched control cohorts
In our CML patients receiving Nilotinib, the development of clinically overt arterial occlusive
disease (AOD) was recorded after a median observation time (MOT) of 2.0 years, 3.0 years
and 3.7 years. We also examined 4 age-matched, risk factor-matched (number of risks factor
for AOD development) and observation time-matched control cohorts in our center after a
MOT of 2.0 years. Control patients included 34 CML patients receiving Imatinib, 34 with
lymphoproliferative neoplasms (LPN), 34 with JAK2 V617F+ myeloproliferative neoplasms
(MPN), and 34 with myelodysplastic syndromes (MDS). The patient’s characteristics of these
groups are shown in Table S4. In the MPN patients enrolled, the presence of JAK2 V617F
was not counted as additional risk factor for AOD development (for matching against the
Nilotinib group). In all control patients, the case history and the occurrence of symptomatic
(grade 2 or higher) AOD events were recorded in the same retrospective manner as in our
CML patients receiving Nilotinib.
3

Symptomatic AOD events were divided into non-severe AOD events and severe AOD events.
Severe AOD was defined as event with one of the following criteria: i) life-threatening (e.g.
myocardial infarction), ii) requiring prolonged hospitalization and treatment, or iii) resulting
in percutaneous or other surgical intervention (bypass-surgery, stent-implantation, angioplasty
or amputation). Moreover, AOD events were divided into peripheral AOD (PAOD) events,
coronary artery (ischemic heart disease)-related events and cerebral ischemic events (stroke).
The number (percentage) of patients developing clinically overt AOD and the number of
patients developing severe overt AOD were recorded in each patient-cohort. Since several of
our CML patients developed repeated AOD events during Nilotinib therapy, we also recorded
the total numbers of all AOD events and the total number of all severe AOD events in each
cohort. We also compared the difference in the number of AOD events in our patient
population with the expected number of AOD events in a risk-factor (hypertonia, diabetes
mellitus, nicotine abuse) matched population in high-income countries described in a meta-
analysis by Fowkes et al.10 In addition, we assessed the risk for developing an AOD event in
our patients relative to the risk for AOD development in the population described by Fowkes
et al. Finally, we determined the risk for developing a fatal cardiovascular disease (CVD) in
all patients at the time of starting Nilotinib therapy by applying the European Society of
Cardiology (ESC) SCORE (Table S7). This score indicates the relative risk of lethal CVD
within 10 years and is based on gender, age, total cholesterol, systolic blood pressure and
nicotine intake.11 The relative numbers (percentages) of patients in each risk group were
determined and compared in patients who developed AOD and those who did not develop
AOD during treatment with Nilotinib. All patients gave informed consent for participation in
our studies.
4

Statistical analyses
For determining the significance level in results obtained from bioassays (in vitro studies) an
unpaired, two-way, student’s t-test for normally distributed samples was used. In order to
determine the level of statistical significance in differences in AOD- and severe AOD events
(frequencies of events) among the patients´ cohorts examined, the chi square test was applied.
Differences were considered significant when p was <0.05. In the hind limb ischemia model,
an unpaired, one-way ANOVA comparing the mean of each column with the control column
was applied to determine statistical significance in differences between the three groups of
mice. Results were considered statistically significant when p was <0.05.
Analysis of age-related clonal hematopoiesis in patients treated with Nilotinib
Since age-related mutations in myeloid cells have recently been implicated in the occurrence
of cardiovascular disorders12, we examined the type and numbers of such mutations in our
patients treated with Nilotinib. Samples of 36 patients were analyzed using the Myeloid
Solution Kit (Sophia Genetics, Saint Sulpice, Switzerland) according to manufacturer's
recommendations. The libraries were prepared using QIAGEN® QIAseq FX DNA Library
Kit (QIAGEN, Venlo, Netherlands) for fragmentation and amplified with the KAPA Library
Amplification Kit KK2620 (Kapa Biosystems, Wilmington, MA, USA). The libraries were
further analyzed on a MiSeq Sequencing System (Illumina, San Diego, CA, USA) using the
MiSeq Reagent Kit v3 (Illumina). Data processing was done by Sophia Genetics using
DDMv3 Software. Variants under 2% allele frequency were dismissed due to background
artefacts. Significance was calculated using the chi-squared test. The following genes were
sequenced: CEBPA, CSF3R, DNMT3A, ETV6, EZH2, RUNX1, TET2, TP53, ZRSR2, ABL1
(exons 4-9), ASLX1 (exons 9, 11-12), BRAF (exon 15), CALR (exon 9), CBL (exons 8-9),
FLT3 (exons 13-15, 20), RAS (exons 2-3), IDH1 (exon 4), IDH2 (exon 4), JAK2 (all but exon
15), KIT (exons 2, 8-11, 13, 17- 18), KRAS (exons 2-3), MPL (exon 10), NPM1 (exons 10-5

11), NRAS (exons 2-3), PTPN11 (exons 3, 7-13), SETBP1 (exon 4), SF3B1 (exons 0-16),
SRSF2 (exon 1), U2AF1 (exons 2, 6), and WT1 (exons 6-10). Mutations in ABL1 detected in
patients with high levels of BCR/ABL1 were classified as TKI-resistance related point
mutations in BCR/ABL1 and were thus excluded from further analyses regarding AOD. The
most commonly reported mutation in ASXL1 c.1934dupG, p.Gly646TrpfsX12 was discarded
because of concerns about its validity as a true somatic mutation as published by Abdel-
Wahab et al. in Leukemia (2010). This variant was detected in three patients with AOD (#4,
#10, #22) and one without (#29) yet was not included in our analyses.
Reagents and antibodies
Nilotinib and Imatinib were kindly provided by Dr. Paul W. Manley and Dr. Elisabeth
Buchdunger (Novartis, Basel, Switzerland). The BCR/ABL1 inhibitors Dasatinib and
Ponatinib, the JAK1/JAK2 inhibitors Ruxolitinib, AZD1480, TG101348, Oclacitinib, the
MAP kinase 14 (p38) inhibitors VX-702, Doramapimod, SB 203580, and the MEK inhibitors
RDEA119 and PD0325901 were purchased from ChemieTek (Indianapolis, IN, USA). The
JAK1/JAK2 inhibitor CYT387, the JAK1/JAK3 inhibitor ZM39923, the MAP kinase 14
(p38) blocker Losmapimod, the KDR inhibitors Cabozantinib, Axitinib and Linifanib, the
BTK inhibitor Ibrutinib, a TEK inhibitor (Tie2 Kinase Inhibitor), the MAP kinase 14 (p38)
inhibitor Skepinone-L from Cayman Chemical (Ann Arbor, MI, USA), and the BRAF
inhibitor AZ628 were purchased from Selleck Chemicals (Houston, TX, USA). PF-114 was
kindly provided by Dr. Ghermes Chilov (Fusion Pharma, Moscow, Russian Federation). PF-
114 is a novel, potent TKI that exerts major effects on various BCR/ABL1 mutants, including
T315I, but spares most vascular targets, including TEK, FGFR3, BRAF, MAPKs and JAK1.13
The BCR/ABL1 inhibitor Bosutinib was purchased from LC Laboratories (Woburn, MA,
USA). A goat polyclonal KDR-blocking antibody (AF357), a goat polyclonal TEK-blocking
antibody (AF313), a human Angiopoietin-1 antibody (923-AN), a human Angiopoietin-2 6

antibody (623-AN), and a human Angiopoietin-4 antibody (964-AN) were purchased from
R&D Systems (Minneapolis, MN, USA). TNF-alpha was purchased from BioLegend (San
Diego, CA, USA; purchase number: 570104). Cell culture grade dimethyl sulfoxide (DMSO)
was purchased from Sigma-Aldrich (St. Louis, MO, USA) and recombinant human vascular
endothelial growth factor (VEGF) from Life Technologies (Paisley, U.K.). DMSO was used
as solvent control and did not exhibit any significant effects in all assays tested.
Evaluation of drug effects in a mouse model of atherosclerosis
Male ApoE -/- mice were obtained from Jackson Laboratories (Bar Harbor, ME, USA). Mice
were separated into three groups (10 mice per group). No randomization was applied, due the
fact that all mice were from the same strain, sex and age group. All mice (in all groups) were
fed with a lipid-rich Western type diet (Ssniff, Soest, Germany). The diet was supplemented
either with Nilotinib (37.5 mg/kg twice a day), Imatinib (50 mg/kg twice a day) or DMSO
(control group) (13-20 animals/group). After 8 weeks, mice were sacrificed by cervical
dislocation, their hearts were removed and atherosclerotic lesions in the aortic root were
quantified as described.14 In brief, hearts and the aortic arch were perfused with PBS and fixed
in 4% phosphate-buffered paraformaldehyde. Thereafter, serial sections of cardiac tissue
located between the valves and in the aortic arch were prepared for quantitative analysis of
lipid deposition. A total of 180-200 slices were prepared per mouse. Every sixth slice was
stained with Oil red-O and hematoxylin in order to identify atherosclerotic (plaque) lesions.
Images were captured by using a JVC 3-charge-coupled device video camera (JVC,
Yokohama, Japan). Sections were analyzed using the computer-assisted Quips Image analysis
system (Leica Microsystems, Wetzlar, Germany). Because this computer-assisted analysis
was performed independent of human microscopy examination, no blinding was required.
7

Evaluation of drug effects in a mouse model of experimental vascular occlusion
Male, 12 to 14 week old, C57BL/6 wild-type mice (Charles River, Sulzfeld, Germany) were
randomly separated in three different groups (20 mice per group) and subjected to unilateral
hind-limb surgery for arterial occlusion under anesthesia with intra-peritoneal administration
of ketamine (90 mg/kg) and xylazine (12 mg/kg) as described.15,16 No randomization was
applied, due the fact that all mice were from the same strain, sex and age group. Briefly, the
left femoral artery was exposed, ligated with 7-0 (Prolene®, Ethicon, OH, USA) ligatures and
excised. Mice were then treated with peanut butter/oil alone (control), Nilotinib (75
mg/kg/day) dissolved in DMSO and mixed with peanut butter/oil, or Imatinib (50 mg/kg
twice a day) solved in DMSO and mixed with peanut butter/oil per os for 28 days. The
Nilotinib-treated mice and the corresponding control mice were fed once daily and the
Imatinib-treated mice and the corresponding control mice were fed twice daily. Plasma trough
levels of both drugs were determined by high-performance liquid chromatography (HPLC)
and tandem mass spectrometry (MS/MS). Plasma trough levels confirmed the presence of
pharmacologically relevant concentrations of Nilotinib and Imatinib in drug-treated mice
(Nilotinib level: 2.1±2.7 µM; Imatinib level: 1.39±0.55 µM). Blood flow measurements were
performed weekly after arterial ligation using a laser Doppler perfusion imaging (LDPI)
analyzer (moorLDI2 V5.X, Moor Instruments, Devon, UK). Blood perfusion was expressed
as the LDPI index representing the ratio of left (operated, ischemic leg) versus right (not-
operated, not-ischemic leg) limb blood flow. Because of the use of a LDPI analyzer, no
blinding was performed. Clinically overt signs of limb necrosis were captured on day 28.
Mice were considered as having overt limb necrosis when at least one toe was fully necrotic.
Immunohistochemical evaluation of mouse tissue
To analyze the in vivo effects of Nilotinib on pericytes and on the expression of ICAM-1,
VCAM-1 and E-selectin in endothelial cells in the mouse model of experimental vascular 8
occlusion, immunohistochemical (IHC) studies were performed on tissue sections of the
ischemic vs. the non-ischemic hind limb after treatment with vehicle control, Nilotinib or
Imatinib. Tissue sections were examined for expression of NG2, ICAM-1, VCAM-1 and E-
selectin using an immunofluorescence staining method as described.17 In brief, frozen sections
were treated with NG2 (AB5320, EMD Millipore Corporation, MA, USA), VCAM-1
(AF643, R&D Systems) or ICAM-1 (ab25375, Abcam, Cambridge, United Kingdom) or E-
selectin (ab2497, Abcam) antibodies followed by visualization with alexa fluor 488. Positive
cells were counted in blinded slides in 5 random and non-repeated fields of the muscle tissue
section.
Culture of human endothelial cells
Human umbilical vein endothelial cells (HUVEC) were either purchased from Technoclone
(Vienna, Austria) or PromoCell (Heidelberg, Germany) or were isolated from fresh umbilical
cords according to a standard protocol.18 Human coronary artery endothelial cells (HCAEC)
were either purchased from Lonza (Verviers, Belgium) or PromoCell or were isolated from
pieces of coronary arteries obtained from patients undergoing heart transplantation. HCAEC
were isolated by mild collagenase treatment and cultured as described.18 Human saphenous
vein endothelial cells (HSVEC) were purchased from PromoCell or were generated from
saphena veins (surgery specimens) according to a published protocol.18 HUVEC, HCAEC and
HSVEC were cultured in EBM-2 medium (Lonza, Basel, Switzerland) supplemented with
endothelial growth supplement EGM-2 containing 5% fetal calf serum (FCS; Lonza) at 37°C
and 5% CO2. The microvascular human endothelial cell line HMEC-1 was kindly provided by
Dr. Ades EW (Atlanta, GA, USA) and cultured in MCDB 131 medium (Life Technologies,
Paisley, UK) supplemented with 10% FCS (GE Healthcare, Piscataway, NJ, USA) and
antibiotics at 37°C and 5% CO2. The identity of HMEC-1 cells was reconfirmed using the
Authentication of Human Cell Lines Service of the “Deutsche Sammlung von Zelllinien und 9

Mikroorganismen - DSMZ”, Braunschweig, Germany in September 2016. Endothelial cells
were passaged using trypsin (0.05%) and EDTA. In all experiments, HUVEC, HCAEC or
HSVEC obtained from the 2nd, 3rd or 4th passage were used.
Additional cell lines used in this study
PANC-1 cells were purchased from the American Type Culture Collection (order number:
CRL-1469, Rockville, MD, USA) and cultured in DMEM medium (Life Technologies)
supplemented with 10% FCS and antibiotics at 37°C and 5% CO2. The identity of PANC-1
cells was confirmed by microsatellite genotyping performed by ECACC (Salisbury, UK) in
2013 (the time when experiments were performed). The human pancreatic beta cell line 1.4E7
was purchased from ECACC and cultured in RPMI1640 medium (GE Healthcare),
supplemented with 2 mM glutamine and 10% FCS at 37°C and 5% CO2. As the 1.4E7 cell
line was used directly after purchase, no identity validation was performed. The HMC-1 cell
line was kindly provided by Dr. J. H. Butterfield (Mayo Clinic, Rochester, MN). The identity
of the subclones HMC-1.1 or HMC-1.2 was shown by sequencing for the presence of V560G
(in HMC-1.1) or V560G and D816V (in HMC-1.2) mutations. All cell lines examined in this
study were regularly tested for contamination with mycoplasms using the Venor®GeM
Classic Kit, order number: 11-1100, from Minerva Biolabs (Berlin, Germany).
Evaluation of TKI effects on proliferation of endothelial cells
3H-thymidine uptake experiments were performed on HMEC-1, HUVEC, HCAEC, HSVEC,
PANC-1 and 1.4E7 cells. Cells were incubated with medium containing Nilotinib (0.1-10
µM), Imatinib (0.1-10 µM), Ruxolitinib (0.5-2 µM), AZD1480 (0.5-2 µM), TG101348
(0.001-10 µM), ZM 39923 (0.05-10 µM); CYT387 (0.05-10 µM), RDEA119 (0.5-10 µM),
PD-325901 (0.5-10 µM), SB 203580 (0.001-10 µM), Doramapimod (0.001-10 µM), VX-702
(0.001-10 µM), Tie2 Kinase Inhibitor (0.05-1 µM), Cabozantinib (0.05-1 µM), Bosutinib 10

(0.05-10 µM), Ponatinib (0.001-2 µM), PF-114 (0.05-10 µM), Oclacitinib (0.05-10 µM),
Axitinib (0.05-10 µM), Linifanib (0.01-10 µM), Ibrutinib (0.05-10 µM), AZ628 (0.01-10
µM), selected combination of drugs (Drug Cocktail, Figure S9C) or DMSO as vehicle control
for 48 hours. DMSO did not influence proliferation of HUVEC when used at a concentration
equivalent to 10 µM of solved compound. HUVEC were also exposed to blocking antibodies
(anti-Angiopoietin-1, -2, -4, each 0.1-1 µg/ml; or anti-TEK, 0.5-15 µg/ml) for 48 hours.
HUVEC were additionally exposed to an anti-KDR antibody (5-250 ng/ml; 48 hours). After
incubation, 0.5 µCi 3H-thymidine was added to each well and the cells were kept for 16 hours
at 37°C. Cells were then harvested on filter membranes (Packard Bioscience, Meriden, CT) in
a Filtermate 196 harvester (Packard Bioscience). Filters were air-dried and the bound
radioactivity counted in a ß-counter (Top-Count NXT, Packard Bioscience). All thymidine
uptake experiments using HCAEC, HUVEC, HMEC-1, PANC-1 or 1.4E7 cells were
performed in at least three independent experiments. Experiments with HSVEC cells were
performed in triplicates. In select experiments, the proliferation of HUVEC was tested by
measuring BrdU uptake by an ELISA kit from Roche Applied Science (Rotkreuz,
Switzerland) following the recommendations of the manufacturer. In these experiments,
HUVEC were incubated in Nilotinib or Imatinib (10-20 µM) supplemented with either 0.5%
BSA or with 0.5% BSA and VEGF (50 ng/ml) at 37°C for 16 hours.
Evaluation of apoptosis of drug-exposed endothelial cells and normal islet cells
In survival-experiments, HUVEC were cultured in EBM-2 medium (without supplements)
containing 0.5% bovine serum albumin (BSA, Sigma-Aldrich) or in medium with 0.5% BSA
and VEGF (50 ng/ml) (without additional supplements) at 37°C. Nilotinib or Imatinib (10 or
20 µm each) were added for 16 hours. After incubation, cells were examined for caspase 3
and 7 activity using the Caspase-Glo® 3/7 Assay (Promega) according to the manufacturer’s
instructions. HCAEC were cultured in EBM-2 medium (without supplements) containing 11

0.5% BSA or in medium with 0.5% BSA and VEGF (50 ng/ml) (without supplements) at
37°C. Nilotinib or Imatinib (1 µM each) were added for 16 hours. After incubation, cells were
examined for caspase 3 and 7 activity using the Caspase-Glo® 3/7 Assay. Human islet cells
were purchased from Prodo Laboratories (Irvine, CA, USA) and cultured according to the
manufacturer’s recommendation. Human islet cells were incubated in control medium or
medium supplemented with either Nilotinib or Imatinib (1-10 µM) for 24 or 48 hours.
Afterwards, the amount of active caspase-3 was detected using flow cytometry. In brief, islet
cells were harvested, washed and fixed in a paraformaldehyde solution (2%) for 15 minutes.
Then, cells were permeabilized using 100% methanol for 20 minutes on ice. Thereafter, cells
were stained with PE-labeled anti-active caspase-3 antibody (C92-605, from Becton
Dickinson) for 30 minutes at room temperature and then analyzed by flow cytometry using a
FACS Calibur (Becton Dickinson).
Evaluation of endothelial cell migration and capillary tube formation
HUVEC were cultured to confluence using EGM-2 medium containing VEGF. After serum
starvation (1 hour), a scratch was produced using a pipet tip and 0-hour (control) photographs
were taken. Cells were then cultured in VEGF (100 ng/ml) in the presence or absence of
DMSO, a blocking anti-KDR antibody (50 ng/ml), Imatinib (7.5 µM), Nilotinib (0.5 - 7.5
µM), a combination of Nilotinib and the anti-KDR antibody or a blocking anti-TEK antibody
(15 µg/ml). After 18 hours, another series of photographs were taken. Wound healing was
calculated using ImageJ software. The cell-free areas in each picture were measured and
wound healing was defined as: [1-(area18h/area0h)]*100. To study tube-formation of
endothelial cells (HUVEC), the ECMatrix in vitro angiogenesis kit from Chemicon
(Millipore) was employed according to the recommendation of the manufacturer. In brief, 96-
well plates were coated with matrigel, and 5,000 HUVEC per well were incubated with
VEGF (50 ng/ml) in the presence or absence of Nilotinib or Imatinib (each 100 nM) at 37°C 12

for 6 hours. Images of tube formation were taken using an inverted phase-contrast microscope
(Nikon Diaphot, Nikon Instruments, Melville, NY, USA). Tube formation was quantified by
measuring the length of tubes in random fields from each well using the ImageJ program.
Immunohistochemical (IHC) evaluation of BM cells in CML patients before and during
treatment with Nilotinib
IHC studies were performed on BM sections of CML patients (n=7) before and after
treatment with Nilotinib. IHC was performed by the indirect immunoperoxidase staining
technique using serial sections (2 µm) prepared from formalin-fixed, paraffin-embedded, BM
specimens as described.19,20 Tissue sections were stained with an anti-CD34 antibody
(QBEND/10, Leica BioSystems, Nussloch, Germany, 1:50; 16 hours) and the anti-tryptase
mAb AA1 (DakoCytomation, Carpinteria, CA, USA 1:100; 16 hours). After incubation, slides
were washed, incubated with a biotinylated second step horse anti-mouse antibody (30
minutes). Antibody reactivity was made visible by 3-amino-9-ethyl-carbazole (Sigma-
Aldrich). Slides were counterstained in Meyer´s hematoxylin. Microvessel density was
determined on CD34-stained BM sections as described previously.20 The percentage of mast
cells (of all nucleated cells) was determined on anti-tryptase-stained BM sections.
Evaluation of tryptase levels in the peripheral blood obtained from CML patients before and
during treatment with Nilotinib
Serum was obtained from CML patients at diagnosis, before starting Nilotinib, and during
treatment with Nilotinib. Serum samples were stored at -20°C. Tryptase levels were measured
by fluoroenzyme-immunoassay (FEIA, Thermo Fisher Scientific, Uppsala, Sweden). The
detection limit for total (alpha+beta-type) tryptase in this assay is 1 ng/mL. The median serum
tryptase level in healthy controls amounts to 5.6±2.8 ng/mL (range: 0-15 ng/mL).
13

Evaluation of drug effects on expression of pro-atherogenic, pro-thrombotic, pro-fibrinolytic
and anti-fibrinolytic molecules in endothelial cells
A number of additional endothelial cell functions relevant to vascular biology and repair were
examined after exposure to Nilotinib or Imatinib. In particular, we screened for drug effects
on expression of PI-linked surface antigens or adhesion-related cell surface proteins on
HUVEC. HUVEC were incubated for either 4 hours or 24 hours with Nilotinib or Imatinib
(1.5-10 µM). For evaluation of mRNA expression after 24 hours, supernatant was removed
and mRNA was isolated using High Pure RNA Tissue Kit (Roche, Basel, Switzerland)
according to the manufacturer’s instructions. mRNA was reverse transcribed into cDNA using
Transcriptor First Strand cDNA Synthesis Kit (Roche) according to the manufacturer’s
instructions. Real-Time-PCR for PAI-1, tPA, uPA, uPAR, eNOS, ICAM-1, VCAM-1, E-
Selectin, TNF-alpha and MCP-1 was performed using LightCycler® TaqMan® Master
UniversalProbeLibrary (Roche) according to the manufacturer’s instructions. Primers, shown
in Table S8, were designed using the Roche Universal ProbeLibrary Assay Design Center
(http://www.universalprobelibrary.com/). The amplification conditions consisted of an initial
incubation at 95°C for 10 minutes, followed by 50 cycles of 95°C for 10 seconds, 60°C for 20
seconds and 72°C for 20 seconds and a final cooling to 40°C. Data were analyzed using
LightCycler 480 Software Version 1.5 Service Pack 3 (Roche). CD87, ICAM-1, VCAM-1, E-
selectin and TNF-alpha expressions at the cell surface were measured after an incubation time
of 4 hours with 7.5 µM Nilotinib or Imatinib by flow cytometry (FACS Canto II, Becton
Dickinson, Franklin Lakes, NJ, USA). HUVEC were gently detached by detachment buffer
(25 mM HEPES (Boehringer Mannheim GmbH, Germany), 10 mM EDTA (Pierce, Rockford,
IL, USA) in Dulbecco’s PBS without calcium and magnesium (PAA, Pasching, Austria).
Endothelial cells were incubated at room temperature with PE-labeled antibodies against
CD87, ICAM-1, E-selectin (Becton Dickinson), VCAM-1 (BD Pharmingen, San Jose CA,
14

USA) or with the mIgG1 PE isotype-matched control antibody, for 15 minutes. Thereafter,
cells were washed, resuspended in PBS, and analyzed by flow cytometry.
Evaluation of molecular drug targets expressed in endothelial cells
Several different studies have evaluated target interaction profiles between Nilotinib and
various kinases in neoplastic (hematopoietic and non-hematopoietic) cells.21,22 However, so
far, no study has analyzed interactions between Nilotinib and its targets in endothelial cells.
To study physical binding of coupleable (c) Nilotinib and c-Imatinib to endothelial targets,
lysates of HUVEC and HMEC-1 were subjected to chemical proteomics profiling (CPP) and
mass spectrometry (MS). Drug pull-down and MS analyses were performed as described.23,24
In order to prevent loss of reactive sites due to coupling, two different forms of Nilotinib and
Imatinib were used: c-Nilotinib-East, c-Nilotinib-West, c-Imatinib East, and c-Imatinib-West.
East and West stand for opposite chemical sites of coupling on the Nilotinib-molecule. To
investigate activation of receptor tyrosine kinases (RTK) in cytokine-activated HUVEC,
phospho-RTK arrays were performed. After 1 hour of incubation with Nilotinib or Imatinib
(each 10 µM) cells were stimulated with FCS (20%) for 40 minutes, and were then harvested.
Drug effects on activation of RTK were assessed using a human phospho-RTK array kit
following the recommendations of the manufacturer (R&D systems). Western blots were
performed to confirm expression of phosphorylated target kinases and the inhibitory effects of
Nilotinib. In these experiments, cells were incubated with medium (without supplements)
containing 0.5% BSA. HUVEC were plated on 60 mm tissue culture dishes and starved with
EGM-2 medium without supplements for 16 hours. Cells were preincubated with 1-10 µM
Nilotinib, Imatinib or the corresponding amount of DMSO for 60 minutes. Afterwards
HUVEC were stimulated with VEGF 50 ng/ml for 5 minutes for phosphorylation analyzes.
For the analysis of KDR expression cells were processed without VEGF pre-incubation. Cells
were lysed with RIPA buffer (Millipore) containing protease inhibitor cocktail (complete, 15

Mini, EDTA-free, Roche) and phosphatase inhibitors (Halt™ phosphatase inhibitor cocktail,
Roche). Respectively 12 µg protein (determined with bicinchoninic acid, BCA protein assay
kit from Thermo Scientific) was separated by gel-electrophoresis (Bio-Rad, 4-15% Tris-HCl
ready gels), transferred to nitrocellulose transfer membranes (Protran, Whatman) and blocked
by 5% non-fat milk in PBST (Phosphate-buffered saline with 0,1% Tween 20). For MAPK-
signaling evaluation, blots were incubated with primary antibodies against phospho-p44/42
MAPK (9106, Cell Signaling, Cambridge, UK) or α-tubulin (2144, Cell Signaling), diluted
1:1000 in 3% BSA in PBST for 16 hours. After washing, blots were incubated for 80 min
with the secondary goat anti-mouse HRP-conjugated antibody (Jackson ImmunoResearch,
West Grove, PA, USA) diluted 1:10,000 and washed again. For evaluation of the effects on
KDR, primary antibodies against pKDR (Tyr951, Santa Cruz), KDR (C-1158, Santa Cruz),
and β-actin (#4967, Cell Signaling) diluted 1:1000 in 3% BSA in PBST for 16 hours were
applied. After washing, blots were incubated for 80 min with the secondary goat anti-rabbit
HRP-conjugated antibody (Jackson ImmunoResearch) diluted 1:10,000 and washed again.
Signals were visualized by ECL staining (GE Healthcare). In select experiments, drug-
exposed cells were cultured in the presence or absence of vascular endothelial growth factor
(VEGF) or other relevant angiogenic cytokines (angiopoietin-1 and hepatocyte growth factor,
HGF), various glucose concentrations, or blocking antibodies against VEGF receptor type 2
(KDR) or TEK.
Evaluation of the effects of ABL2 knockdown on expression of KDR in endothelial cells
HUVEC were transfected for 24 hours with scrambled si-RNA (sc-37007, Santa Cruz) or
ABL2 si-RNA (sc-38945, Santa Cruz) using the Dharmafect 4 kit (T-2004-03, Thermo
Scientific) as described by the manufacturer. After 24 hours, cells were washed with PBS and
cultured in EBM-2MV medium for another 24 hours. Down-regulation of ABL2 was
16

confirmed by Western blotting using a rabbit anti-ABL2 antibody from Novus (Littleton, CO,
USA; NBP1-18875; 1:1500).
Evaluation of TKI effects on platelets
In a separate set of experiments, we screened for effects of Nilotinib and Imatinib on platelet
adhesion and -aggregation. Both, in vitro- and ex vivo experiments were performed. In the in
vitro experiments, Nilotinib and Imatinib (20 µM each) or vehicle control (DMSO) were
added to 2 mL of hirudin-anticoagulated whole blood obtained from normal donors at 37°C
for 30 minutes before analysis. In ex vivo experiments, whole blood obtained from CML
patients treated either with Nilotinib (n=6) or Imatinib (n=5) was analyzed. Platelet adhesion
and plug formation were measured under high shear rates with the platelet function analyzer
(PFA-100) as described.25 In brief, whole blood was pumped through a membrane coated
either with adenosine diphosphate or epinephrine. These agonists in connection with collagen,
included in the membrane, induce degranulation and aggregation of platelets and erythrocytes.
This leads to further activation of platelets and the closure of the membrane. The
measurement of the time period from the beginning of the experiment until the complete
closure of the membrane can be used to assess disturbances in platelet activity.
In addition, platelet aggregation was measured by impedance aggregometry using the multi-
plate electrode aggregometer Multiplate Analyser from Dynabyte Medical (Munich,
Germany) according to the manufacturer´s recommendations and the results were expressed
as units of the Area under the Curve (AUC). In brief, whole blood anticoagulated with hirudin
was stored at room temperature for 30 minutes. Thereafter, whole blood was transferred to the
test cuvettes and the effects of various agonists on platelet adhesion and aggregation were
measured by detecting changes in electrical impedance expressed in units (U). The agonists
used in our experiments were: adenosine diphosphate, collagen, ristocetin or the thrombin
receptor activating peptide.
17

Evaluation of TKI effects on pancreatic cells and mast cells
In 3H-thymidine uptake experiments, PANC-1 and 1.4E7 cells were incubated with control
medium or medium containing Nilotinib (0.1-1.5 µM) or Imatinib (0.1-1.5 µM) for 48 hours.
After incubation, 3H-thymidine was measured as described above. All 3H-thymidine uptake
measurements were performed in at least three independent experiments. Human islet cells
were purchased from Prodo Laboratories (Irvine, CA, USA) and cultured according to the
manufacturer’s recommendation. Human islet cells were incubated in control medium or
medium supplemented with either Nilotinib or Imatinib (1-10 µM) for 24 or 48 hours before
survival and insulin production was measured by qPCR: Total RNA was extracted from islet
cells using the RNeasy Micro Kit (Qiagen, Hilden, Germany). After treatment with DNAse
(Promega, Medison, WI), cDNA was synthesized using Moloney murine leukemia virus
reverse transcriptase (Invitrogen, Carlsbad, CA, USA), random primers, dNTPs (2 mM)
(Invitrogen), and RNasin according to the manufacturer`s instructions. PCR was performed
using primers shown in Table S8. mRNA levels were quantified on a 7900HT Fast Real-Time
PCR System (Applied Biosystem, Foster City, CA) using iTAq SYBR Green Supermix with
ROX (Bio-Rad, Hercules, CA).
MC were cultured from hematopoietic progenitor cells present in cord blood mononuclear
cells (MNC). In brief, Ficoll-isolated cord blood MNC (1x10⁶/ml) were cultured in 24-well
culture plates in RPMI 1640 medium containing 10% FCS, SCF (100 ng/ml) and IL-6 (100
ng/ml). Cultures were maintained with or without various concentrations of Nilotinib (0.001-1
µM). After 2 weeks, medium, cytokines, and Nilotinib were replaced. After 4 weeks, cells
were recovered and examined for the percentage of MC by Wright-Giemsa staining (Figure
S10A). To determine the in vivo effects of Nilotinib on tissue MC, we examined MC numbers
in BM sections in our CML patients before and after treatment with Nilotinib. As mentioned
before, MC numbers in BM sections were determined by immunohistochemistry using anti-
tryptase mAb AA1 (Figure S10B).19,20 Tryptase levels in patients with CML were measured 18

before and after more than one year of treatment with Nilotinib (Figure S10C). In a separate
set of experiments, the effects of Nilotinib on expression and release of tissue type
plasminogen activator (tPA) in the human MC line HMC-1 and in cultured cord blood
progenitor cell-derived human MC were examined (Figure S10D,E). In brief, cord blood
progenitor-derived MC were pre-incubated with SCF (100 ng/ml). After 16 hours, cell lysates
and cell-free supernatants were recovered. tPA was measured in lysates and supernatants by a
commercial t-PA combi-actibind ELISA kit (Technoclone, Vienna, Austria).
Study approval
Retrospective investigations of vascular events occurring in patients with CML and other
hematologic neoplasms (control cohorts) were approved by the local ethics committee (IRB)
of the Medical University of Vienna and no informed consent was deemed necessary due to
the retrospective nature of the study.
All studies involving isolation of endothelial cells from donors were approved by the IRB of
the Medical University of Vienna and the donors gave informed consent. In case of isolation
of endothelial cells from umbilical cords, informed consent was given by the mothers.
All animal protocols were approved by the local Ethical Committees and the Austrian Animal
Care and Use Committee.
19

Supplementary Figures
Figure S1. Nilotinib anti-angiogenic effects in vivo. Hind-limb ischemia was induced in C57BL/6 wild-type mice by ligation of their left femoral artery. Thereafter, mice (13 mice per group) were treated with vehicle control, Imatinib (50 mg/kg twice daily) or Nilotinib (75 mg/kg/day) for 28 days. (A) Clinically overt (macroscopic) limb necrosis on day 28 provided as mean±S.D. of all mice in each group. *, p<0.05 compared to control. (B) Capillary density in hind-limb muscle sections in control mice and Nilotinib-treated mice (ischemic hind-limb) was assessed on day 28 by immunohistochemistry using an antibody against the pericyte-antigen NG2. Results are expressed as NG2 positive capillaries per microscopic high power field (HPF) and represent the mean±S.D. of all mice in each group. *, p<0.05 compared to control. (C) A representative staining for NG2 expression in the M. quadriceps femoris of the ischemic limb from mice treated with vehicle control (Control) or mice treated with Nilotinib (Nilotinib) is shown.
20

Figure S2. Effects of Nilotinib and Imatinib on apoptosis in human endothelial cells. (A) Human coronary artery endothelial cells (HCAEC) were cultured overnight in control medium (EBM2 + 0.5% BSA without VEGF) or in medium containing VEGF (50 ng/ml). Thereafter, Nilotinib or Imatinib (as indicated) were added for 16 hours and apoptosis was evaluated by measuring active caspase 3 and 7 by luminescence assay. (B) HCAEC were cultured overnight in control medium (EBM2 + 0.5% BSA without VEGF). Thereafter, Nilotinib or Imatinib (as indicated) were added for 16 hours and apoptosis was evaluated by measuring active caspase 3 and 7 by luminescence assay. Results in A and B show the mean±S.D. of triplicates compared to control. (C) Human umbilical vein endothelial cells (HUVEC) were cultured in EBM2 medium containing 0.5% BSA (without VEGF) at 37°C in the absence (Control) or presence of various concentrations of Nilotinib or Imatinib (as indicated) for 16 hours and apoptosis was evaluated by measuring active caspase 3 and 7 by luminescence assay. Results show the mean±SD of 4 independent experiments. *, p<0.05 compared to control.
21

Figure S3. Nilotinib inhibits migration of endothelial cells in in vitro experiments. (A) After producing a scratch, human umbilical vein endothelial cells (HUVEC) were cultured in fully supplemented EGM-2 medium (containing VEGF) in the absence or presence of Imatinib (10 µM) or Nilotinib (10 µM) at 37°C for 18 hours. Migration was assessed by measuring the relative amount (percent) of closed (repopulated) scratch-area. Results are expressed as percent of control (no drugs) and represent the mean±S.D. of 3 independent experiments. (B) Dose-dependent effect of Nilotinib on migration of HUVEC. *, p<0.05 compared to control.
22

Figure S4. Effects of Imatinib and Nilotinib on expression of pro-atherogenic cell surface molecules in vascular endothelial cells. (A) HUVEC were incubated in control medium or medium containing 5 µM of Nilotinib or Imatinib for 24 hours. Then, ICAM-1, VCAM-1 and E-selectin mRNA expression levels were determined by qPCR. Results show mean±S.D. values relative to control of 3 independent experiments. (B) HUVEC were treated with control medium or 7.5 µM of Nilotinib or Imatinib for 4 hours. Thereafter, expression of cell surface adhesion-molecules (CAM) was evaluated by flow cytometry. Results show mean±S.D. values from 3 independent experiments. (C) Tissue sections of mouse hind-limbs (animals treated with vehicle control, Nilotinib or Imatinib) were examined for expression of VCAM-1 by immunofluorescence-staining. Results show the mean±S.D. of VCAM-1 positive cells per HPF. Statistics: (A-C) unpaired, two-way t-test. *: p<0.05.
23

Figure S5. TKI target expression profiles in endothelial cells. Target expression profiles for Nilotinib and Imatinib as determined by chemical proteomics profiling and mass spectrometry performed with lysates obtained from human umbilical vein endothelial cells (HUVEC) and HMEC-1. Major kinase-binders in HUVEC and HMEC-1 are shown in form of kinome-maps adapted from Cell Signaling Technology (Cambridge, UK). Binding intensity (spectral counts) is indicated by color intensity of the circles. Kinases relevant for angiogenesis are marked by a dashed red circle.
24

Figure S6. Evaluation of phosphorylated kinase-targets expressed in cultured human endothelial cells. (A-C): HUVEC or HCAEC were incubated in control medium (Control) or in medium containing Nilotinib (10 µM) or Imatinib (10 µM) at 37°C for 60 minutes. (A) After drug exposure, HUVEC were incubated in 20% fetal calf serum (FCS) for 40 minutes. Then, phosphorylation was analyzed using a human phospho-RTK array kit. (B) HUVEC were stimulated with VEGF (50 ng/ml) plus 0.5% bovine serum albumin (BSA) for 5 minutes. Thereafter, Western blot analyses were performed using antibodies against pKDR (Tyr951) or total KDR (upper panel), and pMAPK (Thr202/Tyr204) or tubulin (middle panel). HUVEC shown in the lower panel were incubated with angiopoietin-1 (ANGPT1; 50 ng/ml) plus BSA for 5 minutes. Thereafter, MAPK activation was evaluated using an antibody against pMAPK (Thr202/Tyr204). (C) After drug exposure, HCAEC were incubated in 20% FCS for 40 minutes and analyzed for phosphorylation of FLT-1 and KDR using a human phospho-RTK array kit.
25

Figure S7. Effects of TKI and ABL2 siRNA on expression of KDR in cultured human umbilical vein endothelial cells (HUVEC) and human coronary artery endothelial cells (HCAEC). (A) HUVEC were incubated in control medium or in medium containing 1 µM of Imatinib or Nilotinib (as indicated) for 24, 48 or 72 hours. Thereafter, the expression of KDR was analyzed by Western blotting. ß-actin was used as loading control. (B) HUVEC were incubated with a scrambled siRNA or ABL2 siRNA for 24 hours. Then, cells were cultured for another 24 hours in medium. Thereafter, the effect of the ABL2 knockdown on expression of KDR and ABL2 was analyzed by Western blotting. Tubulin was used as loading control. (C) HCAEC were incubated in control medium or in medium containing 1 µM of Imatinib or Nilotinib (as indicated) for 48 hours. Thereafter, the expression of KDR was analyzed by Western blotting. ß-actin was used as loading control. (D) HCAEC were incubated with a scrambled siRNA or ABL2 siRNA for 24 hours. Then, cells were cultured for another 24 hours in medium. Thereafter, the effects of the ABL2 knockdown on expression of KDR and ABL2 were analyzed by Western blotting. ß-actin was used as loading control. *, p<0.05 compared to control. The respective diagrams for a-d represent the densitometry measurements of at least three independent experiments for each setting and are expressed as mean±SD.
26

Figure S8. Influence of Nilotinib and anti-KDR antibody on migration of cultured human umbilical vein endothelial cells (HUVEC). HUVEC were cultured to confluence in medium containing VEGF. After serum starvation (1 hour), a scratch was produced and 0-hour (control) photographs were taken. Cells were then cultured in VEGF (100 ng/ml) in the presence or absence of DMSO, Nilotinib (7.5 µM), or a blocking anti-KDR antibody (50 ng/ml). After 18 hours, another series of photographs were taken. Wound healing was calculated using ImageJ software. The cell-free areas in each picture were measured and wound healing was defined as: [1-(area18h/area0h)]*100. The diagram shows the mean±SD of 3 independent experiments. *, p<0.05 compared to control. No significant effects were observed with Imatinib (7.5 µM) or with an anti-TEK antibody (15 µg/ml) (data not shown). In addition, no significant synergistic effect was observed with a combination of Nilotinib or an anti-KDR antibody (not shown).
27

Figure S9. Influence of PF-114, Ponatinib or a mixture of different targeted drugs on the proliferation of cultured human umbilical vein endothelial cells (HUVEC). HUVEC were incubated with control medium or various concentrations of the BCR/ABL1 T315I inhibitors Ponatinib (A) or PF-114 (B) or with a Cocktail of more specific targeted drugs (C) at 37°C for 48 hours. The drugs included in the Cocktail and their concentrations are shown in form of the table in ‘C’. After 48 hours, 3H-thymidine uptake was measured. Results are expressed as percent of control and represent the mean±S.D. of at least 3 independent experiments.
28

Figure S10. Nilotinib effects on mast cells. (A) Cord blood mononuclear cells were cultured in RPMI 1640 medium and 10% fetal calf serum (FCS) supplemented with stem cell factor, SCF (100 ng/ml) and interleukin-6 (100 ng/ml) together with various concentrations of Nilotinib (0.001-1 µM) for 4 weeks. Then, cells were stained with Wright-Giemsa and the percentage of mast cells was assessed by microscopy. Results show the mean±SD of triplicates. (B) Bone marrow (BM) sections of patients treated with Nilotinib (n=8) were analyzed before treatment and after at least one year of Nilotinib-therapy. BM sections were examined for the presence (numbers) of tryptase-positive cells (mast cells) by immunohistochemistry. Results are expressed as percentage of tryptase+ cells (of all nucleated BM cells) and represent the mean±SD of all patients. (C) Serum tryptase levels in our CML patients (n=35) before treatment with Nilotinib (pre-) and at the time of best response during Nilotinib. Because Nilotinib was started at various stages of the disease (with or without overt hematologic relapse), a broad concentration range of tryptase (in part produced in clonal CML cells) was found before the start of Nilotinib. (D) The human mast cell leukemia cell line HMC-1.1 was incubated with control medium or Nilotinib (as indicated) overnight. Thereafter, the concentration of tissue type plasminogen activator (tPA) was measured in supernatants (full bars) and cell lysates (open bars) by a commercial ELISA. (E) Cord blood-derived mast cells were incubated in control medium or medium supplemented with Nilotinib and/or 500 ng/ml SCF (as indicated) overnight. Then, tPA concentrations were measured in supernatants (full bars) and cell lysates (open bars) by ELISA. Results in ‘D’ and ‘E’ show the mean±SD of 3 independent experiments. *, p<0.05 compared to control.
29

Figure S11. Effects of Nilotinib and Imatinib on platelet adhesion and plug formation. (A) Whole blood was obtained from CML patients treated either with Nilotinib (n=6) or Imatinib (n=5) and analyzed using the Multiplate Analyzer for platelet adhesion (Multiplate-) or the PFA-100 Analyzer for plug formation (PFA-) by indicated agonists: ADP (adenosine diphosphate); ASPI (Aspirin®); TRAP (thrombin receptor activating peptide); COL (collagen); RISTO (ristocetin) or EPI (epinephrine). The area under the aggregation curve (AUC) shows the aggregation response over time in the Multiplate Analyzer and is shown in units (U) and represents the mean±SD of all patients tested. Results from the PFA-100 Analyzer are shown in seconds and represent the mean±SD of all patients tested. (B) Whole blood of normal donors was incubated with dimethyl sulfoxide (DMSO), Nilotinib or Imatinib (each 20 µM) for 30 minutes at 37°C. Thereafter, blood samples were analyzed for the same parameters and using the same methods as described for ‘A’. No significant influences of Nilotinib or Imatinib on platelet adhesion or plug formation in CML patients or in normal donors were detected.
30

Figure S12. Events of arterial occlusive disease (AOD) during treatment with Nilotinib. (A) Five age-matched groups of patients (n=170) were followed in our center and examined for the occurrence of AOD. AOD events (black bars) and severe AOD events requiring hospitalization and/or intervention (open bars) were recorded retrospectively. Patients included 34 CML patients receiving Nilotinib, 34 CML patients receiving Imatinib, 34 patients suffering from lymphoproliferative neoplasms (LPN), 34 patients with JAK2 V617F+ myeloproliferative neoplasms (MPN), and 34 patients with myelodysplastic syndromes (MDS). The median observation time in all groups was 24 months. All four control cohorts were matched for age and risk factors for AOD development. (B) The diagram shows the accumulation of AOD events (black bars) and severe AOD events (open bars) in CML patients treated with Nilotinib in our center.
31

Figure S13. ARCH somatic mutations found in Nilotinib-treated patients (selected for BCR/ABL1 <1%). Overview of ARCH gene variants in all Nilotinib-treated patients selected for residual BCR/ABL1 mRNA levels lower than 1%. Patient’s peripheral blood samples were analyzed for the presence of neoplasm/ARCH mutations by gene sequencing at the time of best response. The table shows all patients with residual BCR/ABL1 levels lower than 1% (BCR/ABL1 mRNA levels as % of ABL1 according to IS, right column) and all mutations detected. White numbers indicate the variant allele frequencies. The difference in the percentages of mutations between the two groups of patients (AOD patients versus patients without AOD) was significant (p<0.05) as assessed by the chi-squared test. Abbreviations: AOD: arterial occlusive disease; ARCH: age related clonal hematopoiesis.
32
Figure S14. Potential etiology of vascular events in TKI-treated patients. Proposed mechanisms underlying Nilotinib effects on AOD development: Nilotinib acts on a number of different target kinases expressed in endothelial cells and presumably also in many other cell types. Vascular targets that may play a pathogenetic role include TEK, KDR, MAPKs and JAK1. Nilotinib exerts pro-atherogenic and growth-inhibitory effects on vascular endothelial cells, presumably via these and other (unknown) target structures. However, Nilotinib also induces peripheral insulin resistance with subsequent elevations in blood glucose levels and hypercholesterolemia. All these factors as well as pre-existing (patient-related) risk factors including acquired somatic mutations may act together to trigger atherosclerosis and thus AOD development in Nilotinib-treated patients with CML. AOD: Arterial occlusive disease; JAK1: Janus kinase 1; KDR: Kinase insert domain receptor; MAPKs: Mitogen-activated protein kinases; TEK: Angiopoietin-1 receptor.
33

Figure S15. Effects of TNF-alpha on expression of mRNA specific for pro-atherogenic cell surface molecules in vascular endothelial cells. (A) HUVEC were incubated in control medium or medium containing 10 ng/ml TNF-alpha (TNFa) for 24 hours. Then, ICAM-1, VCAM-1 and E-selectin mRNA expression levels were determined by qPCR. Results represent the percent of control and are expressed as mean±S.D. of triplicates. (B) HUVEC were treated with control medium, Nilotinib, Imatinib or TNFa for 4 hours. Thereafter, expression of cell surface adhesion-molecules was evaluated by flow cytometry. Results represent the percent of control and are expressed as mean±S.D. values from at least 3 independent experiments. Statistics: unpaired, two-way t-test; *: p<0.05. Abbreviations: TNF-alpha: tumor necrosis factor alpha; ICAM-1: Intercellular adhesion molecule 1; VCAM-1: Vascular cell adhesion molecule 1.
34

Supplementary Tables
Table S1. Karyotype and BCR/ABL1 mutation status
1at start of Nilotinib therapy | Abbreviations: m: male; f: female; n.d.: not determined
35
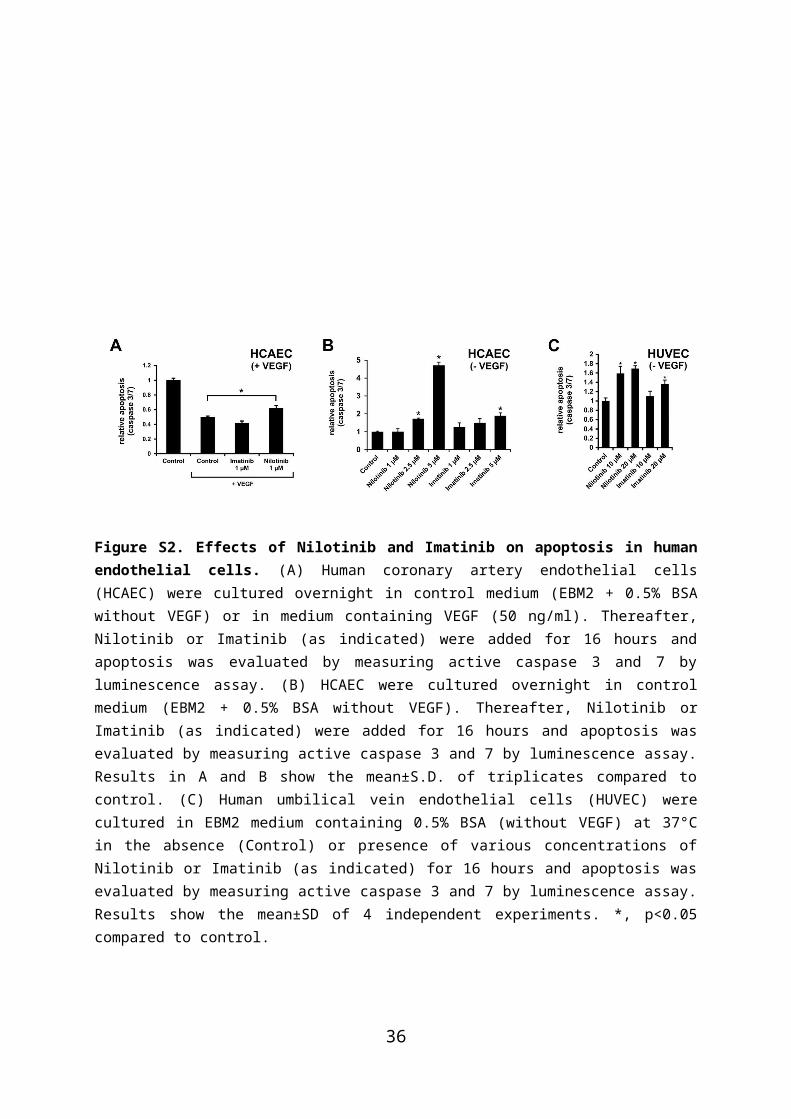
Table S2. Anti-CML therapy prior to Nilotinib and co-medication used during Nilotinib-therapy
Abbreviations: IM: Imatinib; IFN: Interferon alpha; CYT: Cytarabine; HU: Hydroxyurea; RAPA: Rapamycine; DA: Dasatinib; ME: Mercaptopurin; PEG: Pegintron; n.a.: not known
36

Table S3. Metabolic parameters recorded before and during treatment with Nilotinib
1before Nilotinib therapy | 2during Nilotinib therapy | Abbreviations: AOD: arterial occlusive disease; HbA1c: glycated hemoglobin; HDL: high density lipoprotein; LDL: low density lipoprotein; n.d.: not determined
37

Table S4. Characteristics of Nilotinib-treated patients with Ph+ CML and the age- and risk-factor matched control groups after at an observation time of 2 years
1at start of observation. 2risk factors were: nicotine abuse; obesity (>100 kg for men, >80 kg for women); overt diabetes mellitus (requiring treatment with anti-diabetic drugs), arterial hypertonia (requiring pharmacologic treatment), hypercholesterolemia (requiring treatment with lipid-lowering drugs).Abbreviations: AOD: arterial occlusive disease; Ph+: Philadelphia positive; CML: chronic myeloid leukemia; MPN: myeloproliferative neoplasm; MDS: myelodysplastic syndrome; LPN: lymphoproliferative neoplasm.
38

Table S5. Effects of various targeted drugs in cultured human endothelial cells
Abbreviations: HUVEC: cultured human umbilical vein endothelial cells; HCAEC: cultured human coronary artery endothelial cells (HCAEC); HSVCE: human saphenous vein endothelial cells; BCR/ABL1: breakpoint cluster region/Abelson murine leukemia viral oncogene homolog; BRAF: B-rapidly accelerated fibrosarcoma; BTK: Bruton’s tyrosine kinase; JAK: janus kinase; KDR: kinase insert domain receptor; MAPK14: mitogen-activated protein kinase 14; MEK: mitogen-activated protein kinase kinase; TEK: angiopoietin-1 receptor; TYK: tyrosine kinase;
39
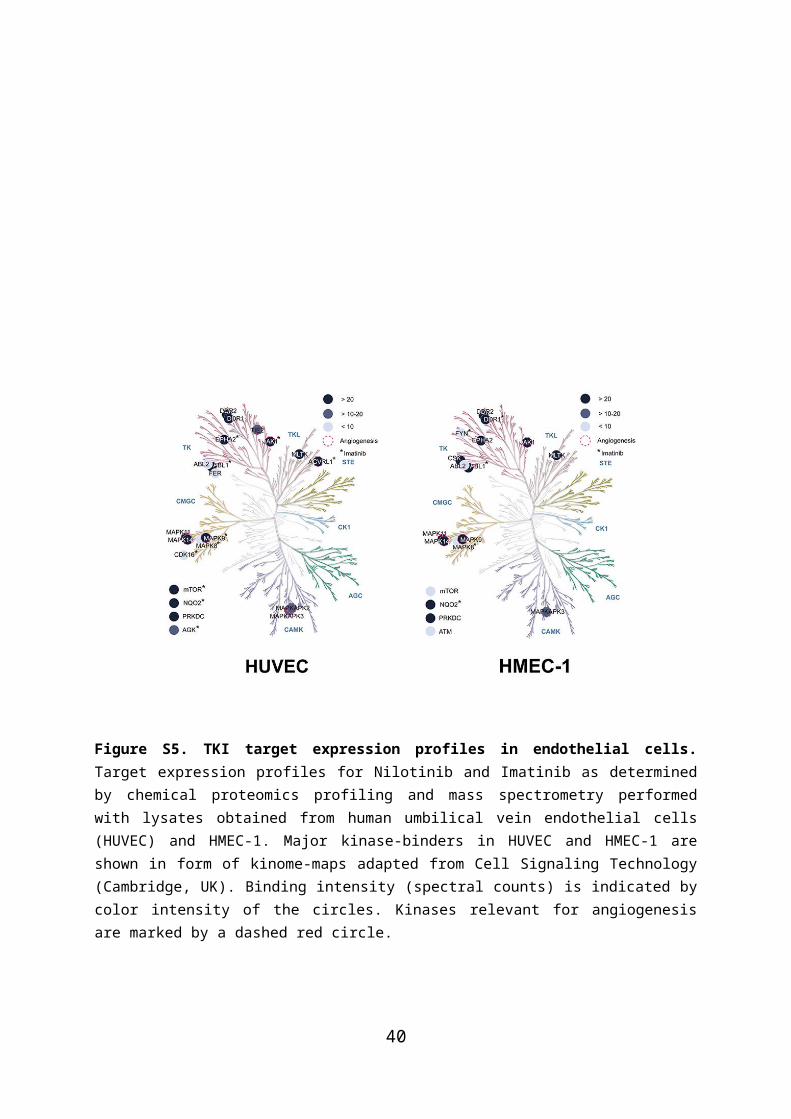
Table S6. Nilotinib targets obtained in drug-pulldown experiments with HUVEC and HMEC-1
Overview of Nilotinib-binding kinases that were not recognized by Imatinib. Lysates of HUVEC (left panels) and the human microvascular endothelial cell line HMEC-1 (right panels) were subjected to chemical proteomics profiling and mass spectrometry as described in the text of this Supplement. In order to cover all potential binders, Nilotinib was coupled to the binding-matrices in two different ways (East: c-Nilotinib-E and West: c-Nilotinib-W) as described in the text. The table shows the binding ratio defining the binding capacity of coupleable Nilotinib relative to uncoupled drug. Gene names refer to accessible data-bank systems. Abbreviation: HUVEC: cultured human umbilical vein endothelial cells.
40

Table S7. Cardiovascular risk according to ESC SCORE in patients receiving Nilotinib
% Nilotinib-treated patients per ESC SCORE developingESC Score no AOD all AOD severe AOD
0-1 76 24 122-4 46 54 15≥5 20 80 60
ESC SCORE, European Society of Cardiology - Systematic COronary RiskEvaluation; AOD, arterial occlusive disease; 0-1: 17 patients; 2-4: 13 patients; ≥5: 5 patients. The ESC SCORE defines the relative risk to develop a fatal cardiovascular event within 10 years.
41

Table S8. Primers used in PCR experiments
Primer
(Sequence ID(s))
fwd-Primer
(corresponding position(s))
rev-Primer
(corresponding position(s))
UPL probe (Amplicon Size [bp])
GAPDH(NM_002046.3)
5’-agc cac atc gct cag aca c-3’(83 - 101)
5’-gcc caa tac gac caa atc c-3’(130 - 148)
#60(66)
PAI-1(NM_000602.2)
5’-tcc agc agc tga att cct g-3’(64 - 82)
5’-gct gga gac atc tgc atc ct-3’(146 - 165)
#15(102)
tPA(NM_000930.3)(NM_033011.2)
5’-gag aaa acc tct gcg agg aa-3’(145 - 164)(145 - 164)
5’-gct tca cag cgt ccc tta aa-3’(186 - 205)(186 - 205)
#12(61)
uPA(NM_002658.2)
5’-ttg ctc acc aca acg aca tt-3’(927 - 946)
5’-ggc agg cag atg gtc tgt at-3’(1001 - 1020)
#46(94)
uPAR(NM_002659.2)(NM_001005377.1)(NM_001005376.1)
5’-gcc tta ccg agg ttg tgt gt-3’(490 - 509)(490 - 509)(490 - 509)
5’-ctt cgg gaa tag gtg aca gc-3’(546 - 565)(546 - 565)(546 - 565)
#37(76)
eNOS(NM_000603.4)(NM_001160109.1)(NM_001160110.1)(NM_001160111.1)
5‘-gca tcc cta ctc cca cca g-3‘(423 - 441)(127 - 145)(127 - 145)(127 - 145)
5‘-ttc ttc aca cga ggg aac ttg-3‘(494 - 514)(198 - 218)(198 - 218)(198 - 218)
#23(92)
ICAM-1(NM_000201.2)
5‘-cct tcc tca ccg tgt act gg-3‘(633 - 652)
5’-agc gta ggg taa ggt tct tgc-3’(702 - 722)
#71(90)
VCAM-1(NM_001078.2)(NM_080682.1)
5’-tga atc tag gaa att gga aaa agg-3’(417 - 440)(417 - 440)
5‘-tga atc tct gga tcc tta gga aa-3‘(463 - 485)(463 - 485)
#39(69)
e-Selectin(NM_000450.2)
5’-acc agc cca ggt tga atg-3’(1186 -1203)
5’-ggt tgg aca agg ctg tgc-3’(1257 - 1274)
#86(89)
MCP-1(NM_002982.3)
5’-ttc tgt gcc tgc tgc tca t-3’(93 - 111)
5’-ggg gca ttg att gca tct-3’(148 - 165)
#83(73)
TNF-alpha(NM_000594.2)
5'-cag cct ctt ctc ctt cct gat-3'(268 - 288)
5'-gcc aga ggg ctg att aga ga-3' (371 - 390)
#29(123)
Insulin--
5’-cgg ctc aca cct ggt gga agc tc-3’(137 - 159)
5’-aag ggc tgc agg ctg cct gca c-3’(262 - 282)
--(147)
Abbreviations: BP: base pair; eNOS: Endothelial nitric oxide synthase; fwd: forward; GAPDH: Glyceraldehyde 3-phosphate dehydrogenase; ICAM-1: Intercellular adhesion molecule 1; MCP-1: Monocyte chemotactic protein 1; PAI-1: Plasminogen activator inhibitor-1; rev: reverse; tPA: Tissue plasminogen activator; uPA: Urokinase-type plasminogen activator; uPAR: Urokinase receptor; UPL: Universal probe library; VCAM-1: Vascular cell adhesion molecule 1
42

References
1. Baccarani M, Cortes J, Pane F, Niederwieser D, Saglio G, Apperley J, et al. Chronic
myeloid leukemia: an update of concepts and management recommendations of European
LeukemiaNet. J Clin Oncol 2009; 27: 6041-6051.
2. Baccarani M, Deininger MW, Rosti G, Hochhaus A, Soverini S, Apperley JF, et al.
European LeukemiaNet recommendations for the management of chronic myeloid leukemia:
2013. Blood 2013; 122: 872-884.
3. Saglio G, Kim DW, Issaragrisil S, le Coutre P, Etienne G, Lobo C, et al. Nilotinib versus
imatinib for newly diagnosed chronic myeloid leukemia. N Engl J Med 2010; 362: 2251-
2259.
4. Hughes T, Deininger M, Hochhaus A, Branford S, Radich J, Kaeda J, et al. Monitoring
CML patients responding to treatment with tyrosine kinase inhibitors: review and
recommendations for harmonizing current methodology for detecting BCR-ABL transcripts
and kinase domain mutations and for expressing results. Blood 2006; 108: 28-37.
5. Martinelli G, Iacobucci I, Soverini S, Cilloni D, Saglio G, Pane F, et al. Monitoring
minimal residual disease and controlling drug resistance in chronic myeloid leukaemia
patients in treatment with imatinib as a guide to clinical management. Hematol Oncol 2006;
24: 196-204.
6. Muller MC, Cross NC, Erben P, Schenk T, Hanfstein B, Ernst T, et al. Harmonization of
molecular monitoring of CML therapy in Europe. Leukemia 2009; 23: 1957-1963.
7. Cooper PC. Detection of Factor V Leiden and prothrombin c.20210G>A allele by Roche
Diagnostics LightCycler(R). Methods Mol Biol 2011; 688: 239-255.
43

8. Soverini S, Hochhaus A, Nicolini FE, Gruber F, Lange T, Saglio G, et al. BCR-ABL kinase
domain mutation analysis in chronic myeloid leukemia patients treated with tyrosine kinase
inhibitors: recommendations from an expert panel on behalf of European LeukemiaNet. Blood
2011; 118: 1208-1215.
9. Brothman AR, Persons DL, Shaffer LG. Nomenclature evolution: Changes in the ISCN
from the 2005 to the 2009 edition. Cytogenet Genome Res 2009; 127: 1-4.
10. Fowkes FG, Rudan D, Rudan I, Aboyans V, Denenberg JO, McDermott MM, et al.
Comparison of global estimates of prevalence and risk factors for peripheral artery disease in
2000 and 2010: a systematic review and analysis. Lancet 2013; 382: 1329-1340.
11. Perk J, De Backer G, Gohlke H, Graham I, Reiner Z, Verschuren WM, et al. European
Guidelines on cardiovascular disease prevention in clinical practice (version 2012): The Fifth
Joint Task Force of the European Society of Cardiology and Other Societies on
Cardiovascular Disease Prevention in Clinical Practice (constituted by representatives of nine
societies and by invited experts). Atherosclerosis 2012; 223: 1-68.
12. Jaiswal S, Fontanillas P, Flannick J, Manning A, Grauman PV, Mar BG, et al. Age-related
clonal hematopoiesis associated with adverse outcomes. N Engl J Med 2014; 371: 2488-2498.
13. Mian AA, Rafiei A, Haberbosch I, Zeifman A, Titov I, Stroylov V, et al. PF-114, a potent
and selective inhibitor of native and mutated BCR/ABL is active against Philadelphia
chromosome-positive (Ph+) leukemias harboring the T315I mutation. Leukemia 2015; 29:
1104-1114.
14. Hennuyer N, Tailleux A, Torpier G, Mezdour H, Fruchart JC, Staels B, et al. PPARalpha,
but not PPARgamma, activators decrease macrophage-laden atherosclerotic lesions in a
44

nondiabetic mouse model of mixed dyslipidemia. Arterioscler Thromb Vasc Biol 2005; 25:
1897-1902.
15. Couffinhal T, Silver M, Zheng LP, Kearney M, Witzenbichler B, Isner JM. Mouse model
of angiogenesis. Am J Pathol 1998; 152: 1667-1679.
16. Kirchmair R, Gander R, Egger M, Hanley A, Silver M, Ritsch A, et al. The neuropeptide
secretoneurin acts as a direct angiogenic cytokine in vitro and in vivo. Circulation 2004; 109:
777-783.
17. Egger M, Schgoer W, Beer AG, Jeschke J, Leierer J, Theurl M, et al. Hypoxia up-
regulates the angiogenic cytokine secretoneurin via an HIF-1alpha- and basic FGF-dependent
pathway in muscle cells. FASEB J 2007; 21: 2906-2917.
18. Wojta J, Zoellner H, Gallicchio M, Hamilton JA, McGrath K. Gamma-interferon
counteracts interleukin-1 alpha stimulated expression of urokinase-type plasminogen activator
in human endothelial cells in vitro. Biochem Biophys Res Commun 1992; 188: 463-469.
19. Krauth MT, Simonitsch I, Aichberger KJ, Mayerhofer M, Sperr WR, Sillaber C, et al.
Immunohistochemical detection of VEGF in the bone marrow of patients with chronic
myeloid leukemia and correlation with the phase of disease. Am J Clin Pathol 2004; 121:
473-481.
20. Wimazal F, Jordan JH, Sperr WR, Chott A, Dabbass S, Lechner K, et al. Increased
angiogenesis in the bone marrow of patients with systemic mastocytosis. Am J Pathol 2002;
160: 1639-1645.
21. Ganguly SS, Fiore LS, Sims JT, Friend JW, Srinivasan D, Thacker MA, et al. c-Abl and
Arg are activated in human primary melanomas, promote melanoma cell invasion via distinct
pathways, and drive metastatic progression. Oncogene 2012; 31: 1804-1816.45

22. Weisberg E, Manley PW, Breitenstein W, Bruggen J, Cowan-Jacob SW, Ray A, et al.
Characterization of AMN107, a selective inhibitor of native and mutant Bcr-Abl. Cancer Cell
2005; 7: 129-141.
23. Hantschel O, Rix U, Schmidt U, Burckstummer T, Kneidinger M, Schutze G, et al. The
Btk tyrosine kinase is a major target of the Bcr-Abl inhibitor dasatinib. Proc Natl Acad Sci U
S A 2007; 104: 13283-13288.
24. Rix U, Hantschel O, Durnberger G, Remsing Rix LL, Planyavsky M, Fernbach NV, et al.
Chemical proteomic profiles of the BCR-ABL inhibitors imatinib, nilotinib, and dasatinib
reveal novel kinase and nonkinase targets. Blood 2007; 110: 4055-4063.
25. Jilma B. Platelet function analyzer (PFA-100): a tool to quantify congenital or acquired
platelet dysfunction. J Lab Clin Med 2001; 138: 152-163.
46