mechanomyography for neuromuscular … · bertindakbalas dengan stimulasi elektrik, dan seterusnya...
TRANSCRIPT

MECHANOMYOGRAPHY FOR NEUROMUSCULAR ELECTRICAL STIMULATION FEEDBACK APPLICATIONS
IN PERSONS WITH SPINAL CORD INJURY
IBITOYE MORUFU OLUSOLA
FACULTY OF ENGINEERING UNIVERSITY OF MALAYA
KUALA LUMPUR
2017
MECHANOMYOGRAPHY FOR NEUROMUSCULAR
ELECTRICAL STIMULATION FEEDBACK
APPLICATIONS IN PERSONS WITH SPINAL CORD
INJURY
IBITOYE MORUFU OLUSOLA
THESIS SUBMITTED IN FULFILMENT OF THE
REQUIREMENTS FOR THE DEGREE OF DOCTOR OF
PHILOSOPHY
FACULTY OF ENGINEERING
UNIVERSITY OF MALAYA
KUALA LUMPUR
2017

ii
UNIVERSITY OF MALAYA
ORIGINAL LITERARY WORK DECLARATION
Name of Candidate: IBITOYE MORUFU OLUSOLA (I.C/Passport No: )
Registration/Matric No: KHA120081
Name of Degree: DOCTOR OF PHILOSOPHY
Title of Project Paper/Research Report/Dissertation/Thesis (“this Work”):
MECHANOMYOGRAPHY FOR NEUROMUSCULAR ELECTRICAL
STIMULATION FEEDBACK APPLICATIONS IN PERSONS WITH SPINAL
CORD INJURY
Field of Study: BIOMEDICAL ENGINEERING
I do solemnly and sincerely declare that:
(1) I am the sole author/writer of this Work;
(2) This Work is original;
(3) Any use of any work in which copyright exists was done by way of fair dealing
and for permitted purposes and any excerpt or extract from, or reference to or
reproduction of any copyright work has been disclosed expressly and
sufficiently and the title of the Work and its authorship have been
acknowledged in this Work;
(4) I do not have any actual knowledge nor do I ought reasonably to know that the
making of this work constitutes an infringement of any copyright work;
(5) I hereby assign all and every rights in the copyright to this Work to the
University of Malaya (“UM”), who henceforth shall be owner of the copyright
in this Work and that any reproduction or use in any form or by any means
whatsoever is prohibited without the written consent of UM having been first
had and obtained;
(6) I am fully aware that if in the course of making this Work I have infringed any
copyright whether intentionally or otherwise, I may be subject to legal action
or any other action as may be determined by UM.
Candidate’s Signature Date:
Subscribed and solemnly declared before,
Witness’s Signature Date:
Name:
Designation:

iii
ABSTRACT
Neuromuscular Electrical Stimulation (NMES)-evoked muscle contractions confers
therapeutic and functional gains on persons with Spinal Cord Injury (SCI). However, the
optimal efficacy of commercial NMES systems’ application is inhibited by the
imprecision in muscle force/torque production and rapid muscle fatigue. Evidence
suggests that the application of a muscle mechanical response (force/torque) as a feedback
to modulate the administration of NMES could optimize the efficacy of the technology
by enabling muscle force regulation, and delaying the onset of muscle fatigue. Currently,
a direct muscle force measurement is impractical and there is also lack of a reliable,
electrical stimulus artifact-free and non-invasive proxy of muscle force to drive the
NMES systems for enhanced controllability and clinical use. Attempts on the application
of evoked-electromyography for this purpose remain debatable and clinically limited. As
a viable alternative, this thesis proposes a non-invasive muscle force/torque measurement
technique based on the mechanical activity of contracting muscles (Mechanomyography
or MMG). This investigation was motivated by the knowledge that mechanomyography
is immune from certain limitations of evoked-electromyography and provides direct
information on muscle’s mechanical responses to the electrical stimulation. Systematic
literature survey revealed a lack of clear understanding of the relationship between
mechanomyography and NMES-evoked torque production in a paralyzed muscle.
Therefore, the present research introduces mechanomyography as a proxy of NMES-
evoked torque in persons with SCI. At the outset, a hybrid procedure was developed to
establish mechanomyography as a proxy of muscle force/torque in healthy volunteers and
persons with SCI. This was used to investigate the pattern of incremental torque
production and subsequently facilitated the estimation of the torque from
mechanomyography using a computational intelligent technique based on Support Vector
Regression (SVR) modelling. This thesis also demonstrated, in a clinical setting, the

iv
validity of the mechanomyography as a relevant parameter for studying muscle fatigue
during critical knee buckling stress i.e. standing-to-failure challenge in persons with SCI.
Due to the peculiarity of the study participants/target population and the intended clinical
application of NMES-supported standing, the quadriceps muscle group, widely reported
for its relevance in studying the knee torque dynamics, was selected as the study site.
Findings from these studies revealed that the mechanomyographic amplitude is highly
correlated (r> 0.95; P< 0.05) to the muscle force in persons with SCI as it reliably tracked
the muscle’s motor unit recruitment pattern during NMES contractions. The SVR
modelling results demonstrated a good predictive accuracy (R2≥ 89%) with generalization
capacity and suggested that the quadriceps’ mechanomyography is a good indicator of
NMES-evoked torque during knee extension tasks. Thus, the signal might be deployed as
a direct proxy of muscle torque during leg exercise and functional movements in SCI
populations. Additionally, the reliability (intraclass correlation coefficient range: 0.65-
0.79; P> 0.05) of the mechanomyography during force production might be useful to
evaluate the recovery or deterioration of motor unit activities following NMES supported
exercise and as an alternative technique for monitoring the NMES-evoked muscle activity
for practical control applications. Together, this thesis lays a foundation for the future
implementation of MMG-driven NMES technologies.

v
ABSTRAK
Rangsangan kontraksi otot secara Stimulasi Elektrikal Neuromuskular (NMES)
memberikan banyak faedah terapeutik dan fungsi berguna di kalangan pesakit saraf
tunjang. Walaubagaimanapun, keberkesanan optimum yang ditawarkan oleh NMES
komersil terhalang oleh penghasilan daya/tork otot yang tidak tepat dan keletihan otot
yang berlaku begitu pantas berikutan pembalikan corak perekrutan motor unit semulajadi.
Bukti menunjukkan bahawa penggunaan sistem maklumbalas terhadap tindakbalas otot
(daya/tork dan keletihan) bagi mengawal stimulasi NMES boleh mengoptimumkan
keberkesanan sistem NMES dengan adanya pengawalan daya otot dan melambatkan
masa untuk berlakunya keletihan otot. Sehingga kini, tiada proksi kepada daya otot/tork
otot yang boleh dipercayai, mudah dan tidak invasif untuk mendorong sistem NMES
meningkatkan kadar kawalan dan kegunaan klinikal. Oleh itu, pelbagai percubaan telah
dilakukan dengan menggunakan rangsangan-isyarat elektrik otot (EEMG), namun masih
dipersoalkan dan terhad secara klinikal. Hal ini terdorong oleh isu-isu yang melibatkan
kualiti isyarat yang tidak sempurna disebabkan oleh peluh yang terhasil akibat
penggunaan otot yang terlalu kerap. Tambahan pula, artifak-artifak yang terdapat di
permukaan stimulasi elektrikal menepui penguat EEMG dan teknik-teknik lazim bagi
penghapusan/penindasan artifak tersebut masih belum disempurnakan. Sebagai alternatif,
tesis ini mencadangkan satu teknik yang tidak invasif untuk mengukur tork berdasarkan
aktiviti mekanikal dari kontraksi otot-otot (isyarat mekanikal otot atau MMG). Kajian ini
didorong oleh fakta yang menyatakan bahawa isyarat MMG tidak mempunyai
kekurangan seperti yang dinyatakan sebelum ini dalam EEMG yang mana ianya tersebar
melalui tisu lembut dan memberikan maklumat terus dari mekanikal otot yang
bertindakbalas dengan stimulasi elektrik, dan seterusnya memberikan lebih banyak
maklumat yang berguna, terutamanya maklumat mengenai neuromuskular yang berkaitan
dengan aktiviti otot-otot semasa stimulasi elektrik. Maklumat yang telah diperolehi dari

vi
kajian literatur menunjukkan bahawa hubungan MMG dan penghasilan tork otot yang
lumpuh semasa rangsangan-NMES kontraksi masih samar. Oleh itu, kajian ini merupakan
satu cubaan unik dalam membina tork yang boleh dianggar atau teknik ukuran dari isyarat
mekanikal otot dalam kalangan pesakit yang mempunyai kecederaan saraf tunjang
semasa rangsangan kontraksi-NMES. Fokus pertama di dalam tesis ini ialah untuk
membangunkan prosedur hibrid untuk menghasilkan MMG sebagai proksi kepada
daya/tork otot, terutamanya dalam kalangan individu sihat dan yang mengalami
kecederaan saraf tunjang. Ini digunakan untuk mengkaji corak penambahan
membolehkan penghasilan tork otot berperingkat stabil, hasil dari tork dan seterusnya
memudahkan membantu penganggaran tork otot dari isyarat mekanikal otot dengan
menggunakan teknik pengiraan pintar – pemodelan Support Vector Regression (SVR).
Tesis ini juga bertujuan untuk telah membuktikan bahawa dalam situasi klinikal,
kesahihan isyarat MMG adalah satu parameter yang relevan dan optimum untuk kajian
permulaan mengenai dalam mengkaji keletihan otot semasa pembengkokan lutut kritikal
knee buckling stress, iaitu dalam keadaan berdiri-sehingga-keletihan di kalangan individu
yang mengalami kecederaan saraf tunjang. Disebabkan oleh keunikan peserta dalam
kajian ini/populasi sasaran dan tujuan aplikasi klinikal, sebagai contoh, berdiri dengan
sokongan NMES, otot quadrisep telah dipilih untuk kajian. Kumpulan otot ini telah
banyak dilaporkan kerana ianya relevan dengan kajian yang melibatkan dinamik tork
lutut. Dapatan dari kajian ini menunjukkan bahawa amplitude isyarat MMG mempunyai
hubungkait yang baik bagi penghasilan daya kerana kebolehpercayaannya dalam
menjejak corak perekrutan motor unit semasa kontraksi-kontraksi otot rangsangan-
NMES. Keputusan pemodelan SVR telah menunjukkan ketepatan ramalan cemerlang
dengan kebolehannya dalam penyamarataan dan isyarat MMG dari otot quadricep
dicadangkan sebagai indikator tork rangsangan-NMES yang bagus ketika latihan isometri
extensi lutut. Berikutan itu, isyarat MMG telah dicadangkan sebagai proksi kepada

vii
ukuran tork otot semasa latihan kaki dan pergerakan-pergerakan berfungsi kepada
populasi dengan kecederaan saraf tunjang. Di samping itu, tahap kebergantungan isyarat
MMG dalam mengukur daya otot berkemungkinan besar berguna dalam menilai
pemulihan atau kemerosotan aktiviti-aktiviti MU unit motor selepas latihan NMES dan
bertindak sebagai alternatif untuk mengetahui aktiviti otot yang dirangsang NMES
sebagai aplikasi kawalan praktikal. Secara keseluruhannya, tesis ini dapat menjadi
menyandarkan asas kepada perlaksanaan teknologi NMES dorongan-MMG untuk masa
depan.

viii
ACKNOWLEDGEMENTS
The journey of my doctoral study would have been incomplete without the
immeasurable support and encouragement of many people whom I cannot thank enough.
Among who are my supervisors: Dr. Nur Azah Hamzaid, Dr. Ahmad Khairi Abdul
Wahab, and Assoc. Prof. Dr. Nazirah Hasnan for their patience, encouragement, care and
supports throughout the duration of my study. Thank you for giving me the intellectual
freedom when required and guidance when needed. The financial support by the
University of Malaya and Ministry of Higher Education, Malaysia through HIR Grant
No. UM.C/625/1/HIR/MOHE/ENG/39 is gratefully acknowledged. I would like to
appreciate the efforts of Prof. Glen M. Davis, from the University of Sydney, Australia
for his unwavering support at various critical times, too numerous to mention. Special
appreciation to Dr. K. B. Mustapha for his guidance and direction throughout the duration
of this study. Dr. S. O. Aadam’s pre-dawn brainstorming sessions, as well as numerous
others who generously devoted their time and energy in support of my research, are also
acknowledged. Special thanks to my friends: Wasiu A. Hammed, Dr. Mushafau A Oke,
and other friends from the University of Ilorin and University of Malaya for their
encouragements. Engr. AbdulHakeem O. Kuranga and Dr. Tawfeeq Oloyede whose
friendship I cherish so much, are specially acknowledged. I would like to appreciate my
guardians Prof. S. A. Kuranga, Pharmacist R. A. Kuranga and Dr. Sirajudeen Bilal for
being sources of inspiration. I gratefully acknowledge and persons with SCI who
participated in the series of experiments conducted. This thesis would not have been
possible without your generous cooperation and understanding. My special appreciation
goes to the healthy volunteers who bore the neurostimulation pains during pilot
investigations. Many thanks to my colleagues in the NMES laboratory who facilitated
patients’ exercise conditioning training and assisted during various experimental
activities. To my amazing family, whom I feel exceedingly fortunate to be part of, in

ix
particular, parents—Alhaji AbdulGaniy Ibitoye and Mrs. Muibat Ibitoye, parents’ in-
law—Dr. Luqman Gbadamosi and Mrs. Risqot Gbadamosi for instilling in me the work
ethics and dedication necessary to persevere at every stage of my life, I say may Allah
preserve you in good faith and health. The prayers and unwavering supports of my
siblings and in-laws are gratefully acknowledged. With a passionate heart, the
unconditional love of my wife, Ayesha ‘Lola, is truly appreciated. To our blessings,
Abdullah, AbdurRahman and Zaynab, thank you for seeing Daddy through this journey,
I love you loads! Indeed, this work was made possible by The Most Exalted and The Most
Knowledgeable: Almighty Allah, all praises belong to you.

x
TABLE OF CONTENTS
Abstract ............................................................................................................................ iii
Abstrak .............................................................................................................................. v
Acknowledgements ........................................................................................................ viii
Table of Contents .............................................................................................................. x
List of Figures ................................................................................................................ xvi
List of Tables................................................................................................................ xviii
List of Symbols and Abbreviations ................................................................................ xix
List of Appendices ......................................................................................................... xxi
CHAPTER 1: INTRODUCTION .................................................................................. 1
1.1 Background .............................................................................................................. 1
1.2 Motivation for this Study ......................................................................................... 6
1.3 Research Objective .................................................................................................. 7
1.4 Research Significance ............................................................................................ 10
1.5 Research Scope ...................................................................................................... 12
1.6 Thesis Organization ............................................................................................... 12
CHAPTER 2: LITERATURE REVIEW .................................................................... 15
2.1 Introduction............................................................................................................ 15
2.2 Motor Control in Human ....................................................................................... 16
2.3 Basic Skeletal Muscle Responses Post Spinal Cord Injury ................................... 17
2.4 Neuromuscular Electrical Stimulation ................................................................... 22
2.5 NMES Assisted Rehabilitation in the Lower Limbs Post-SCI .............................. 27
2.6 Major Biopotential Sources for NMES Feedback Applications............................ 34
2.6.1 Electromyography .................................................................................... 34

xi
2.6.2 Mechanomyography ................................................................................. 36
2.7 Mechanomyography Measurement Techniques .................................................... 39
2.8 Mechanomyography Parameters ........................................................................... 43
2.8.1 Time Domain Parameters ......................................................................... 43
2.8.2 Frequency domain parameters .................................................................. 46
2.8.3 Potentials of Mechanomyography as an NMES Feedback Signal ........... 48
2.9 Machine Learning Methodology ........................................................................... 50
2.9.1 Support Vector Machine .......................................................................... 51
2.10 Summary ................................................................................................................ 55
CHAPTER 3: DEVELOPMENT OF A HYBRID PROCEDURE TO ESTABLISH
MECHANOMYOGRAPHY AS A PROXY OF NMES-EVOKED TORQUE ....... 56
3.1 Introduction............................................................................................................ 56
3.2 Literature Review .................................................................................................. 57
3.3 Materials and Methods .......................................................................................... 60
3.3.1 Experimental Protocol .............................................................................. 60
3.3.1.1 NMES-Evoked Muscle Contractions and Knee Torque
Measurements ............................................................................ 61
3.3.1.2 MMG Acquisition and Processing ............................................ 62
3.3.2 Support Vector Regression Modelling Approach .................................... 64
3.3.2.1 Model Development .................................................................. 68
3.3.2.2 Optimal Parameters Search Approach ...................................... 68
3.3.2.3 Model Statistical Performance Criteria ..................................... 71
3.4 Results and Discussion .......................................................................................... 71
3.5 Conclusion ............................................................................................................. 76

xii
CHAPTER 4: MECHANOMYOGRAPHY AS A PROXY OF MUSCLE FORCE
DURING NMES-EVOKED KNEE EXTENSION TASK IN PERSONS WITH
SCI………………. ......................................................................................................... 78
4.1 Introduction............................................................................................................ 78
4.2 Literature Review .................................................................................................. 79
4.3 Materials and Methods .......................................................................................... 82
4.3.1 Participants ............................................................................................... 82
4.3.2 Experimental Protocol .............................................................................. 84
4.3.3 Familiarization .......................................................................................... 84
4.3.4 Stimulation Protocol ................................................................................. 85
4.3.5 Measurements ........................................................................................... 86
4.3.5.1 NMES-evoked isometric torque measurement ......................... 86
4.3.5.2 MMG measurements ................................................................. 87
4.3.6 Signal Processing ..................................................................................... 88
4.3.7 Statistical Analysis ................................................................................... 89
4.4 Results. .................................................................................................................. 90
4.4.1 Reliability ................................................................................................. 90
4.4.2 Torque Production .................................................................................... 91
4.4.3 MMG and Contraction Intensity .............................................................. 91
4.5 Discussion .............................................................................................................. 92
4.5.1 MMG Sensor Reliability .......................................................................... 94
4.5.2 NMES-Evoked Torque Production .......................................................... 94
4.5.3 Mechanomyographic Responses to NMES-Evoked Isometric Torque .... 96
4.5.3.1 MMG amplitude ........................................................................ 96
4.5.3.2 MMG frequency ........................................................................ 98
4.5.4 Influence of Knee Flexion Angles on Mechanomyographic Response ... 99

xiii
4.5.5 Correlations among MMG and NMES-Evoked Torque ........................ 100
4.5.6 Potential Clinical Applications ............................................................... 100
4.6 Conclusion ........................................................................................................... 102
CHAPTER 5: MUSCLE FORCE ESTIMATION FROM
MECHANOMYOGRAPHY IN PERSONS WITH SCI ......................................... 103
5.1 Introduction.......................................................................................................... 103
5.2 Literature Review ................................................................................................ 103
5.3 Materials and Methods ........................................................................................ 107
5.3.1 Experimental procedures ........................................................................ 107
5.3.2 Signal acquisition and analysis ............................................................... 109
5.3.3 Development of the Support Vector Regression Model ........................ 110
5.3.4 Optimal parameters search approach...................................................... 112
5.3.5 The statistical performance evaluation of the proposed model .............. 113
5.4 Results and Discussion ........................................................................................ 114
5.4.1 Clinical Implications .............................................................................. 117
5.5 Conclusion ........................................................................................................... 118
CHAPTER 6: MUSCLE FATIGUE TRACKING DURING NMES STANDING TO
FAILURE CHALLENGE IN PERSONS WITH MOTOR COMPLETE SCI USING
MECHANOMYOGRAPHY ...................................................................................... 120
6.1 Introduction.......................................................................................................... 120
6.2 Literature Review ................................................................................................ 121
6.3 Materials and Methods ........................................................................................ 124
6.3.1 Participant ............................................................................................... 124
6.3.2 Experimental design ............................................................................... 125
6.3.2.1 Familiarization ........................................................................ 125

xiv
6.3.2.2 Test protocol ............................................................................ 126
6.3.2.3 Standing challenge task ........................................................... 127
6.3.3 Mechanomyogram .................................................................................. 129
6.3.4 Signal processing .................................................................................... 129
6.4 Data analysis ........................................................................................................ 130
6.5 Results. ............................................................................................................ …131
6.5.1 MMG amplitude during muscle fatigue contractions ............................. 131
6.6 Discussion ............................................................................................................ 134
6.6.1 Relationship between MMG amplitude characteristic and duration of
sustained standing-to-fatigue failure ...................................................... 134
6.6.2 Effects of the stimulation frequency on the MMG response to muscle
failure ...................................................................................................... 135
6.6.3 Potential clinical implication .................................................................. 137
6.7 Conclusion ........................................................................................................... 138
CHAPTER 7: CONCLUSION AND RECOMMENDATION ............................... 140
7.1 Conclusion ........................................................................................................... 140
7.2 Contributions ....................................................................................................... 144
7.3 Study Limitations ................................................................................................ 146
7.4 Recommendation for Future Research ................................................................ 147
References ..................................................................................................................... 149
LIST OF PUBLICATIONS AND PRESENTED PAPERS .................................... 181
APPENDICES…. ........................................................................................................ 189

xv
APPENDIX A: THE LETTER OF ETHICS APPROVAL FOR THE KNEE
EXTENSION EXPERIMENT ................................................................................... 189
APPENDIX B: THE LETTER OF ETHICS APPROVAL FOR THE STANDING
EXPERIMENT………………………………………………………………………191
APPENDIX C: EXPERIMENTAL PROCEDURES FOR THE NMES-
SUPPORTED STANDING ........................................................................................ 192
APPENDIX D: THE ORIGINAL CONSENT FORM ............................................ 193
APPENDIX E: ENGLISH LANGUAGE TRANSLATION OF THE CONSENT
FORM………….. ........................................................................................................ 194
APPENDIX F: SAMPLE OF HONORARIUM FORM .......................................... 195
APPENDIX G: MATLAB SCRIPT FOR THE SVR MODELLING .................... 196

xvi
LIST OF FIGURES
Figure 1.1: Incidence rate of SCI by gender and age group.............................................. 2
Figure 2.1: Basic representation of the nervous system function. .................................. 17
Figure 2.2: Classification of the levels of spinal cord injury according to the American
Spinal Injury Association. ............................................................................................... 19
Figure 2.3: Basic component of a surface NMES system. .............................................. 23
Figure 2.4: Electric field propagation and generation of the action potential to evoke
muscle contractions during surface neuromuscular electrical stimulation. .................... 24
Figure 2.5: Stimulation parameters. ................................................................................ 25
Figure 2.6: Typical NMES-assisted lower limb rehabilitation. ...................................... 30
Figure 2.7: Basic principle of MMG generation during a muscle fibre contraction. ...... 37
Figure 2.8: SVR methodology illustrated. ...................................................................... 52
Figure 3.1: Experimental set-up at 90° knee angle. ........................................................ 61
Figure 3.2: Schematic representation of the experimental setup. ................................... 64
Figure 3.3: Flow chart of the procedure for obtaining optimal parameters, as shown in
(Table 3.1), for the proposed SVR model. ...................................................................... 69
Figure 3.4: Plots of the correlation coefficients for the training (A) and testing; (B)
subsets. ............................................................................................................................ 74
Figure 3.5: Cross plots of training sets—actual vs. predicted values. ............................ 74
Figure 3.6: Cross plots of testing set—actual vs. predicted values. ................................ 75
Figure 4.1: Experimental set-up showing the MMG and NMES electrode placement over
the quadriceps muscle in a representative participant with SCI. .................................... 85
Figure 4.2: Simultaneous recordings of repetitive NMES-evoked torque and raw MMG
signal from RF at stimulation current of 90 mA and 600 knee flexion angle from a
representative participant. ............................................................................................... 89
Figure 4.3: MMG recordings of RF at 50mA (A) and 100mA (B) neurostimulation current
amplitude and the corresponding spectra at 600 knee flexion angle. .............................. 92
xvii
Figure 4.4: Correlations between the NMES-evoked torque and stimulation intensity
(mA) during quadriceps contractions at 300 (■), 600 (▲) and 900 (●) knee angles. ....... 93
Figure 4.5: Correlations between the normalized MMG-RMS as a function of %PT during
quadriceps NMES-evoked contractions at 300 (■), 600 (▲) and 900 (●) knee angles. ... 95
Figure 4.6: Correlations between the normalized MMG-PTP and stimulation intensity
(mA) during quadriceps NMES-evoked contractions at 300 (■), 600 (▲) and 900 (●) knee
angles............................................................................................................................... 97
Figure 5.1: Sketch of the experimental setup for measuring the MMG signal and torque
in a person with SCI. ..................................................................................................... 108
Figure 5.2: Relationships between the experimental/actual torque and estimated torque
using gaussian (A) and polynomial (B) based kernel functions for training dataset. ... 115
Figure 5.3: Relationships between the experimental/actual torque and estimated torque
using gaussian (A) and polynomial (B) based kernel functions for the testing dataset.116
Figure 5.4: Plots of the actual versus predicted data points for (A) training and (B) testing
subsets. .......................................................................................................................... 118
Figure 6.1: Experimental setup for the FES supported standing task. .......................... 128
Figure 6.2: MMG-RMS amplitude versus standing time during LF and HF FES-evoked
fatiguing contractions within the first 70 s. ................................................................... 133

xviii
LIST OF TABLES
Table 2.1: American Spinal Injury Association Impairment Scale (AIS) ...................... 18
Table 2.2: Common kernel functions. ............................................................................. 54
Table 3.1: Optimal parameters for the proposed Support Vector Regression model. .... 70
Table 3.2: Summary of the datasets. ............................................................................... 72
Table 3.3: Statistical parameters of the datasets. ............................................................ 73
Table 3.4: Performance measures that determined the accuracy of the developed model.
......................................................................................................................................... 73
Table 4.1: Participants’ Physical Characteristics ............................................................ 83
Table 4.2: Test–retest reliability of torque and MMG measures. ................................... 91
Table 5.1: Typical kernel functions. ............................................................................. 111
Table 5.2: Optimal parameters for the proposed Support Vector Regression model. .. 113
Table 5.3: Summary of the datasets. ............................................................................. 113
Table 5.4: Statistical parameters of the datasets. .......................................................... 113
Table 5.5: The accuracy of the developed model. ........................................................ 117
Table 6.1: Participants’ characteristics. ........................................................................ 125
Table 6.2: Stimulation current for FES-standing based on participants’ responses. .... 126
Table 6.3: Exponential muscle fatigue regression model and goodness of fit coefficients.
....................................................................................................................................... 132
Table 6.4: Total standing time to failure during the two stimulation protocols. ........... 134

xix
LIST OF SYMBOLS AND ABBREVIATIONS
ANN
CNS
:
:
Artificial Neural Network
Central Nervous System
R2 : Coefficient of Determination
EEG : Electroencephalogram
EEMG : Evoked-Electromyography
EMG : Electromyography
ENG : Electroneurogram
ε : Epsilon
FES : Functional Electrical Stimulation
Hz : Hertz
HF : High Stimulation Frequency
ICC : Intraclass Correlation Coefficient
η : Kernel option
: Lambda/hyper parameter
LF : Low Stimulation Frequency
mA : milliAmpere
µs : microseconds
MMG : Mechanomyography
MU : Motor Unit
NMES : Neuromuscular Electrical Stimulation
PT : NMES-evoked Peak Torque
PTP : Peak to Peak
r : Pearson’s Correlation coefficient
PNS : Peripheral Nervous System

xx
QOL : Quality of Life
QP : Quadratic Programming
C : Regularization parameter/factor
RBF : Radial Basis Function :
RF : Rectus Femoris
RMS : Root Mean Square
RMSE : Root Mean Square Error
W : Shapiro-Wilk
SCI : Spinal Cord Injury
SD : Standard Deviation
SEM : Standard Error of Measurements
SVM : Support Vector Machine
SVR : Support Vector Regression
UMMC : University of Malaya Medical Centre
WHO : World Health Organization (WHO)
xxi
LIST OF APPENDICES
Appendix A: The letter of ethics approval for the knee extension experiment...189
Appendix B: The letter of ethics approval for the standing experiment….......191
Appendix C: Experimental procedures for the NMES-supported standing….192
Appendix D: The original consent form……………………………………...193
Appendix E: English language translation of the consent form……………...194
Appendix F: Sample of honorarium form …………………………………...195
Appendix G: Matlab Script for the SVR Modelling………………………....196

1
CHAPTER 1: INTRODUCTION
1.1 Background
According to the World Health Organization (WHO), an estimated 250 to 500
thousand people suffer a spinal cord injury (SCI) each year (Bickenbach et al., 2013).
Although the incidence rate of SCI is pronounced in the developed economy (Singh et
al., 2014), the rate is on the rise in the developing countries including Malaysia (Ibrahim
et al., 2013) and China (Yang et al., 2014). Based on the available data (Figure 1.1), there
are consistent higher incidences of SCI among adult males—up to 80% of cases
(Bickenbach et al., 2013). This has negative economic implications on the affected
persons (and their family members) as there are over 60% unemployment rate in these
populations, globally (Young & Murphy, 2009). For instance, within the affected
population in Malaysia, not more than 57% could return to work post-acute care
(Ramakrishnan et al., 2011).
Therefore, SCI drastically decreases the quality of life (QOL) of those affected due to
a partial or total loss of functional capacity below their injury levels (Jacobs & Nash,
2004). This is often accompanied by secondary complications of a significant impairment
to their physiological and cardiorespiratory performances which could lead to a marked
degeneration of the affected neuromuscular functions (Davis et al., 2008; Hasnan et al.,
2013). These changes are worsened by the sedentary lifestyle imposed by the impaired
neuromuscular function due to the lack of appropriate physical exercise programs
(Ragnarsson, 2007).

2
Figure 1.1: Incidence rate of SCI by gender and age group.
Adapted with permission from Vogel et al. (2012).
Depending on a number of factors such as the type of injury/lesion (upper motor
neuron or lower motor neuron), severity of the injury, and user preference, neuromuscular
electrical stimulation (NMES)-evoked muscle contraction has been generally
recommended and validated for health promotion via exercise therapy and functional
recovery in the affected populations (Hamid & Hayek, 2008; Ragnarsson, 2007). NMES
applied via a pair of bipolar stimulating electrodes and over the human neuromusculature
produces muscle contractions by depolarizing motor axons beneath the stimulating
electrodes (Collins, 2007). Once the electrical stimulus amplitude exceeds the excitation
threshold of the axons of the motor neuron, and through the principle of neuromotor
plasticity (Martin et al., 2012; Singer, 1987), there will be elicitation of muscle
contraction and force production (Reed, 1997). The product of the electrical stimulus-
evoked muscle force and the muscle length or moment arm generates joint torques needed
to execute functional tasks. Therefore, the foremost clinical objective of the NMES
technology in restoring muscle functions is to substitute for the absence of motor function
0
20
40
60
80
100
0-5 6-12 13-15 16-21 22+
Pro
port
ion
of
SC
I p
op
ula
tion
(%
)
Age group (year)
Male Female

3
due to the lesion of the central nervous system (Vodovnik et al., 1981; Vrbová et al.,
2008).
Although the NMES technology is gaining increasing popularity for its huge potentials
in clinical rehabilitation applications (Peckham & Kilgore, 2013), the conventional
control strategy of its stimulation parameters (frequency (Hz), current (mA) and pulse
width (µs)) poses a significant drawback. For example, in most of the commercial surface
NMES systems, users regulate the stimulation parameters manually via open-loop
strategy. This is usually administered via "button presses" according to the users’
perceived need. This strategy is highly subjective, enforces unnecessary constant
stimulation intensity and thus, makes the outcome of the NMES suboptimal (Ragnarsson,
2007) and frustrating.
Automated NMES control strategy via closed-loop technology has recently become
attractive (Ibitoye et al., 2016; Popović, 2014) to prolong muscle contraction, as several
advanced simulations’ results of the strategy have shown promise in enhancing the NMES
utility and clinical prominence. This is due to the fact that the strategy is more effective,
relevant and safer when compared to the traditional open-loop strategy (Braz et al., 2009).
Basically, the closed-loop NMES strategy allows an efficient use of the technology as it
automates the adjustment of electrical stimulus parameters throughout the entire duration
of muscle contractions (Peckham & Knutson, 2005). However, one requirement of an
automated NMES modulation is a reliable interpretation of the muscle response
information generated as an indicator of neuromotor output following NMES-evoked
contractions (Kimura et al., 2004; Peckham & Knutson, 2005; Popović, 2014). This is
essentially required by the NMES controller to regulate muscle responses based on the
muscle state.

4
Investigators (Hug et al., 2015; Scott, 2004) have identified the muscle force
production following NMES-evoked contractions as an indicator of motor output.
Therefore, muscle force could be used as a neural correlate of a muscle’s motor
performance. However, at the moment, a simple or artifact-free, direct and non-invasive
measurement of muscle force production by individual muscle during NMES-evoked
contraction is impractical (Erdemir et al., 2007; Popović, 2014). The estimation of the
muscle force from other measurable muscle characteristics such as biopotentials has been
promoted (Peckham & Knutson, 2005) as the control signal source for optimal
performance of NMES systems.
Evoked-electromyography (EEMG) of a contracting muscle is the traditional source
of NMES control signals as the signal is rich in muscle contraction and force information
(Disselhorst-Klug et al., 2009; Thompson et al., 2011). However, the application of
EEMG as an NMES control signal has a limited impact on the routine clinical practice.
This is mainly due to the large size of stimulation artifact current in relation to the EEMG
signal (Merletti et al., 1992; Yamaguchi et al., 2012) which has continued to challenge
the reliability of the signal for the estimation of NMES-evoked muscle force (Popović,
2014). Practically, several strategies have been applied to decode the neural information
in EEMG embedded in the electrical stimulation artifact but none has been so effective
for clinical use (Chesler & Durfee, 1997; Hoffer et al., 1996; Popović, 2014). In addition,
the sensitivity of the signal to the external electromagnetic interferences, variations in
differential electrode positioning and skin impedance fluctuation due to perspiration
(Yamamoto & Takano, 1994) often lead to the deterioration of EEMG signals and a
compromise of its reliability on frequent use.
Furthermore, EEMG signal is unable to reflect changes in mechanical properties of
muscle during fatigue stimulation (Orizio et al., 1999). With EEMG, muscle fatigue study

5
is challenging as usually the signal continues to increase with increasing muscle’s motor
unit recruitment despite a decrease in the muscle effort/force due to muscle fatigue (Falla
& Farina, 2008). Although EEMG reflects the degree of neural excitation responsible for
the generation of muscle contractions and force, the muscle fatigue phenomenon, which
EEMG may not discriminate from fresh contraction (Vøllestad, 1997), is also within the
continuum of effective muscle contractions (Lei et al., 2011). Thus, quantification of
NMES-evoked force production by EEMG alone during NMES-evoked contraction is
deficient (Lei et al., 2011; Levin et al., 2000; Popović, 2014).
As a less complicated alternative, a mechanical activity of contracting muscles is
gaining recent prominence as a proxy of muscle force. The surface measurement of the
mechanical activity is called mechanomyography—MMG (Orizio, 1993; Stokes &
Blythe, 2001). The rationale for investigating MMG signal as an alternative control signal
source for NMES technology is as follows: (i) MMG is a mechanical "counterpart" of
EMG for neuromuscular performance assessment (Croce et al., 2015; Orizio, 1993; Yuan-
Ting et al., 1992), which summates the mechanical activity of active muscle fibre during
contractions (Orizio et al., 1996) and in addition, reflects the peripheral adaptations in
mechanical properties of muscle as reflected by muscle’s dimensional changes (Cè et al.,
2015) (ii) the signal readily propagates through the skin surface enabling a non-invasive
recording of the muscle activity relevance for the estimation of the level of neural
activation, and (iii) the MMG signal has been used to investigate motor unit (MU)
activation strategy which is responsible for muscle contractions and force modulation
(Beck et al., 2004; Orizio, 1993). Collectively, the highlighted MMG signal
characteristics may allow a non-invasive estimation of muscle state as required for a
closed-loop NMES operation to implement an automatic modulation of the stimulation
parameters. An immediate question that may ensue following this preamble is, why is

6
MMG signal important in this setting? The study’s motivation as illustrated in the
following paragraphs answers this question.
1.2 Motivation for this Study
There is compelling evidence that a closed-loop control of NMES supported activity
promotes the optimal utility of the technology in the clinical rehabilitation of persons with
SCI. The lack of a direct, artifact-free, non-invasive and reliable proxy of muscle force
from the stimulated muscles and affected limbs motivated this present study which sought
to investigate the potential of MMG signals as a proxy of torque for NMES feedback
applications.
However, in order to obtain an approximation of the functional capability and
characteristics of NMES-evoked contractions of a muscle, its capacity to elicit isometric
torque production must be assessed (Jaeger, 1986; Mohammed et al., 2012). Specifically,
for the clinical application of NMES for therapeutic and functional gains, the use of
muscle contraction signals (i.e., biopotentials) for the assessment of muscle activity has
been suggested (Peckham & Knutson, 2005; Wannstedt & Herman, 1978) for an effective
joint control. This is required for neuromuscular training (Shields et al., 2006), in
particular, during NMES supported knee extension, standing, and ambulation tasks.
Therefore, a reliable measurement of muscle force, during these muscle activities, by a
biopotential of muscle contraction origin for application as feedback control signals could
significantly improve the functional outcomes of NMES-evoked contractions (Nataraj et
al., 2010).
Although as a biosignal, several studies have evaluated the voluntary muscle
performance using MMG signals (Barry et al., 1985; Beck et al., 2004; Ibitoye et al. 2014;
Orizio, 1993), the specific interpretation and practical relevance of the signal parameters
during NMES-evoked contraction of paralyzed muscles remain poorly understood.

7
Specifically, there is limited knowledge on the effects of muscle fibre type transformation
and impaired muscle function following a SCI (Burnham et al., 1997) on the MMG
characteristics of a muscle during intermittent and sustained NMES-evoked contractions.
Understanding these may elucidate the relevance of the signal as a proxy of muscle force
response for NMES control applications and consequently overcoming a technical
challenge inhibiting the progress in NMES rehabilitation of muscles after SCI. This is
based on the existing knowledge that the effect of muscle fibre transformation after SCI
on the muscle force modulation and the associated muscle fatigue characteristics
(Thrasher & Popovic, 2008) may be tracked by MMG signal responses (Kimura et al.,
2004).
1.3 Research Objective
The main objective of this thesis was to develop a mechanomyographic-based NMES-
evoked muscle force/torque estimation technique for feedback applications in NMES
systems, particularly for use in persons with SCI. To address the main objective, the
specific tasks carried out were:
To develop a hybrid procedure to demonstrate MMG signal as a proxy of
NMES-evoked muscle force in healthy volunteers.
To deploy the developed procedure for studying the reliability of MMG signal
as a proxy of muscle force during NMES supported knee extension task in
persons with SCI.
To demonstrate the potential relevance of MMG signal as a useful parameter
for studying muscle fatigue during a critical knee buckling stress due to a
sustained NMES-supported standing to fatigue failure task.

8
For a clear perspective, the experiments were designed to evaluate NMES-evoked
contractions during common musculoskeletal assessment settings including knee
extension activity against gravity and sustained standing (Clarkson, 2000). Therefore, the
target muscle group was the quadriceps which has been well-established for its relevance
in the study of knee torque dynamics during knee extension task, standing and ambulation
training (Franken et al., 1993).
Based on this premise, the first specific objective aimed to develop a method to assess
a healthy quadriceps muscle force via knee extension torque production during ‘seated’
NMES-evoked isometric quadriceps contraction using MMG signals. The objective was
also meant to learn the adjustment required for the deployment of the same protocol in
persons with SCI. The rationale for this study was based on the well-known knowledge
of a healthy voluntary knee extension torque assessment and it is as follows:
The NMES-evoked muscle contraction increases with stimulation intensity as a result
of an increase in the number of motor unit recruitment, to a certain critical level when the
motor unit is fully recruited—a point preceding muscle fibre fusion and force saturation
which may lead to a reduction in the muscle surface oscillation (Orizio et al., 1992).
Specifically, the correlation between the MMG signal and the incremental NMES-evoked
muscle force was examined. However, as the joint angle or muscle length influences the
muscle force production (Pasquet et al., 2005; Rassier et al., 1999), the MMG responses
to NMES-evoked muscle force at various knee angles could also be investigated. Based
on this, the reliability of MMG signals as a proxy of muscle force was established, at
incremental stimulation intensity levels, in order to mimic a typical practical clinical
application of NMES-evoked muscle contractions for knee extension task. By this
approach, the validity of the MMG signal to track muscle force production could be

9
resolved while guiding the implementation of the same methodology in persons with
neurological conditions.
The second specific objective is an application of the method developed in the first
objective to study muscle response in persons with SCI. This is necessary as the MMG
responses in healthy muscle may not adequately represent the situation in denervated or
paralyzed muscle under neuromuscular provocation (Scott et al., 2007). This objective
verified that the incremental NMES-evoked knee torque as measured by a commercial
isokinetic dynamometer can be tracked by the MMG signal. Specifically, the experiment
was conducted on persons with motor complete SCI; A and B according to the American
Spinal Injury Association Impairment Scale (AIS, see Table 2.1 for details) (Kirshblum
et al., 2011) during ‘seated’ NMES-evoked knee extension task for torque production via
isometric quadriceps contractions. This mode of contraction is clinically relevant as
NMES-evoked leg extension task involving short bouts of contractions and recovery
periods has been suggested as an alternative modality to functional ambulation training
in persons with SCI (Crosbie et al., 2009).
Subsequently, the data obtained from this experiment were used for knee torque
estimation from MMG signal using a machine learning technique based on support vector
regression algorithm. This was necessary to investigate whether the factors that influence
muscle force modulation including stimulation intensity, knee angle, and the generated
MMG signal could be intelligently combined to estimate the knee extensor torque. By
this approach, the established positive correlations between the MMG signal and muscle
force could be corroborated using a SVR model which is more robust, especially, in
handling regression tasks, than the traditional regression methods (Yu et al., 2010).
In the two previously described specific objectives, the experiments were conducted
in a laboratory and on an isokinetic dynamometer. The third specific objective was

10
conducted in a rehabilitation gymnasium to examine the clinical relevance of the MMG
signal as a muscle fatigue contraction sensor. The rationale for this experiment was to
investigate whether MMG signal could track the paralyzed muscle activation pattern
during a practical standing-to-failure task in persons with motor complete SCI. The
quadriceps muscle failure as reflected by knee buckle served as an indication of muscle
fatigue which is typically characterized by a torque reduction (Sayenko et al., 2015).
As the torque reduction is impractical or difficult to measure directly during NMES-
supported standing tasks, a 300 drop in the knee angle was used as a critical fatigue failure
indicator. This measurement together with the quadriceps’ MMG signal responses over
the contraction time allowed an investigation of whether MMG signals could be a reliable
method for NMES-evoked muscle fatigue assessment. This approach was based on the
knowledge that the muscle fatigue could be better assessed during NMES contraction as
the limitation imposed by central nervous system (CNS), such as motivation, is absent
(Vøllestad, 1997).
Collectively, the experimental settings adopted in this study was typical of clinical
NMES applications for sustained muscle contractions to verify whether MMG signal
could track the changes in motor unit recruitment strategy during fresh and fatigued
contractions.
1.4 Research Significance
Findings from this thesis provide unique insights into the development of an NMES-
evoked muscle force/torque measurement and tracking system using MMG signal in
persons with SCI. Specifically, the thesis presents the technical assessment and
implication of the MMG signal generated during NMES-evoked muscle contractions for
applications in MMG-driven NMES systems. Such a system has the potential to impact
the quality of life of many potential users, specifically from our rehabilitation program at

11
the Department of Rehabilitation Medicine of the University of Malaya Medical Centre
(UMMC) and in general, for other patients from among the affected population within
Malaysia and beyond. Specifically, the following points summarize the significance of
the thesis.
The current open-loop mode of NMES technology has largely confined its
application to research activities rather than its deployment for routine clinical use.
The MMG signal proposed in this thesis as a stimulation artifact-free and non-
invasive proxy of muscle force can be applied as a reliable NMES feedback signal
source to promote the flexibility and efficacy of NMES technologies for routine
clinical applications.
The muscle force assessment method based on MMG signal, as proposed in this
thesis, can be used to examine the level of NMES-evoked torque generation within
and outside of laboratory and during NMES exercise for health benefits including
minimizing muscle atrophy/wasting in paralyzed muscles (Panisset et al., 2016),
promotion of neural repair (Young, 2015), healing of pressure ulcers (Lala et al.,
2015) and prevention of secondary peripheral nerve deterioration (Lee et al., 2015)
and joint contracture (Peckham & Kilgore, 2013) in persons with SCI.
The thesis sought to provide a new knowledge on the potential application of
MMG signals as a sensor to monitor the deterioration or improvement of motor
control activity—responsible for muscle contractions following NMES-evoked
contractions. This could guide clinicians and other allied health professionals
administering NMES as a treatment option in rehabilitation and aid the
development of effective rehabilitation interventions.
The thesis also explores a novel approach for tracking muscle fatigue states during
NMES supported standing based on the muscle’s MMG signals and proposed the
signal as a fatigue-failure predictor during critical functional tasks.

12
1.5 Research Scope
The reported studies are limited to the experimental investigations of the MMG signal
as a proxy of NMES-evoked muscle force/torque during knee extension and standing
tasks in healthy and spinally injured persons. The implementation of the proposed MMG
signal as a feedback signal in a real-time NMES control setting was not investigated. The
thesis also applied the computational intelligent approach of SVR modelling to predict
torque from MMG signal/datasets. However, the predictive SVR model used was based
on the standard SVR algorithm as the algorithm gave a good predictive accuracy. This
was in agreement with the knowledge that SVR often demonstrate an impressive
performance in comparison with other machine learning algorithms in related fields
(Ameri et al., 2014; Meyer et al., 2003). Therefore, comparison of SVR with other
modelling techniques was not covered in this thesis.
1.6 Thesis Organization
This thesis is an integration of three major separate but dependent studies. Each study
is presented in a separate Chapter with subsections including the introduction, literature
review, methodology, results, discussion and conclusion. As the thesis style is based on
the article format, there may be certain unavoidable redundant information, particularly
in introduction and literature review subsections of each Chapter. Also, included in each
of these Chapters are the relevant theoretical background and assumption that informed
the selection of the methodology adopted. The publication by the author that is related to
each Chapter is included within the Chapter.
Chapter 2 provides the synthesis of an extensive background information to the
research within this thesis. The Chapter specifically discussed the basic muscle
physiology as well as neuromuscular principles of an impaired lower limb muscle
function following a SCI. The Chapter also discussed the principle of NMES technology
13
in evoking muscle contractions, its pattern of motor unit recruitment strategy and the
limitations of the technology in order to identify the technical challenges militating
against its optimal performance. As the literature revealed a research gap of a reliable,
artifact-free, and non-invasive proxy of NMES-evoked muscle force, review of a machine
learning modelling technique for an intelligent estimation of muscle force from MMG
was also presented. The Chapter contains a synthesis of the author’s four published
review articles as listed under the introduction to Chapter 2.
Chapter 3 reports the procedure used to establish the MMG signal as a proxy of NMES-
evoked quadriceps muscle force/torque in healthy volunteers. Moreover, the Chapter also
presented the estimation of quadriceps muscles force from the MMG signal using support
vector regression (SVR) modelling approach. The Chapter contains text from the author’s
published article:
Ibitoye, M. O., Hamzaid, N. A., Abdul Wahab, A. K., Hasnan, N., Olatunji, S. O., &
Davis, G. M. (2016). Estimation of Electrically-Evoked Knee Torque from
Mechanomyography Using Support Vector Regression. Sensors, 16 (7), 1115.
Chapter 4 presents the application of the procedure established in Chapter 3 to relate
the MMG signals with NMES-evoked knee torque in persons with SCI. The Chapter
contains text from the author’s published article:
Ibitoye, M. O., Hamzaid, N. A., Hasnan, N., Abdul Wahab, A. K., Islam, M. A., Kean,
V. S. P., & Davis, G. M. (2016). Torque and mechanomyogram relationships during
electrically-evoked isometric quadriceps contractions in persons with spinal cord
injury. Medical Engineering & Physics, 38 (8), 767-775
Chapter 5 reports the estimation of the paralyzed quadriceps electrically evoked
muscle force from MMG signal using SVR modelling approach.

14
Chapter 6 describes the protocol for NMES-aided sustained standing to fatigue failure
in persons with motor complete SCI. This was used to evaluate the validity of MMG
signal as a proxy of muscle fatigue due to critical knee buckling stress during standing
challenge task.
Chapter 7 summarizes the findings of this research study, discusses their implications
and overall significance. Furthermore, the Chapter also enumerates the limitations of this
study and provides suggestions for further investigations as applies to NMES control
systems.
15
CHAPTER 2: LITERATURE REVIEW
2.1 Introduction
This Chapter reviewed related literature on muscle physiology and musculoskeletal
impairment after a spinal cord injury (SCI), particularly for the benefits of the audience
with an engineering background. The Chapter also discussed the neuromuscular electrical
stimulation (NMES) technology as a popularly recommended rehabilitative intervention
for persons after SCI while highlighting the major limitations of the NMES-evoked
muscle contractions. The prominently identified limitations are (i) imprecision in torque
production for effective functional applications and (ii) inherent rapid muscle fatigue
probably due to a reversed or non-physiological recruitment of motor unit (Bickel et al.,
2011).
Based on the available knowledge in the literature, optimal application of NMES for
rehabilitative interventions warrants an automatic modulation of the stimulation
parameters (Ibitoye et al., 2016). Therefore, NMES rehabilitation post-SCI has been
discussed highlighting the need for biopotential sources for NMES feedback applications.
Popular biopotential sources which have been used to assess the muscle performance
(force/torque and fatigue) are also discussed to highlight the need for this thesis.
Following the provision of a novel insight into the potential of a unique application of the
muscle contraction characteristics (mechanomyography, MMG) as an NMES control
signal, the Chapter concluded with a discussion on a machine learning modelling
technique for muscle force/torque estimation using the MMG signal.
The literature discussed in this Chapter has been previously published, in part, in the
following articles which were retrieved with permission from the publishers:

16
(i) Ibitoye, M. O., Estigoni, E. H., Hamzaid, N. A., Abdul Wahab, A. K., & Davis,
G. M. (2014). The Effectiveness of FES-Evoked EMG Potentials to Assess
Muscle Force and Fatigue in Individuals with Spinal Cord Injury. Sensors, 14
(7), 12598-12622.
(ii) Ibitoye, M. O., Hamzaid, N. A., Zuniga, J. M., & Abdul Wahab, A. K. (2014).
Mechanomyography and Muscle Function Assessment: A Review of Current
State and Prospects. Clinical Biomechanics, 29 (6), 691-704.
(iii) Ibitoye, M. O., Hamzaid, N. A., Zuniga, J., Hasnan, N., & Abdul Wahab, A. K.
(2014). Mechanomyographic Parameter Extraction Methods: An Appraisal for
Clinical Applications. Sensors, 14 (12), 22940-22970.
(iv) Ibitoye, M. O., Hamzaid, N. A., Hasnan, N., Abdul Wahab, A. K., & Davis, G.
M. (2016). Strategies for Rapid Muscle Fatigue Reduction during FES Exercise
in Individuals with Spinal Cord Injury: A Systematic Review. PLoS One, 11 (2),
e0149024.
2.2 Motor Control in Human
Humans with intact neuromuscular function have controls over the performance of
intended muscular activities via nervous system which controls the stimuli, perturbations
and coordinates body activities (Hu et al., 2012; Rosenbaum, 2010). The nervous system
is made up of (i) the central nervous system (CNS) which is composed of the brain and
spinal cord, and (ii) the peripheral nervous system (PNS), that links the CNS with
“various receptors and effectors” (Keijzer et al., 2013; Mackie, 1990). Typically, for
motor and function coordination, there is typical information “signal pickup by sensory
receptors” which is transmitted back and forth to the CNS through the PNS for processing
(Keijzer et al., 2013) (Figure 2.1). However, injury to the spinal cord may lead to a
malfunction of the sensory and/or motor function and coordination as a result of a partial

17
or complete loss of motor or sensorimotor capability based on the severity of the injury
(McDonald & Sadowsky, 2002; Valenzuela et al., 2016).
Figure 2.1: Basic representation of the nervous system function.
Adapted from JDifool and Looie496 (2009) according to the creative common
license from Wikimedia.
2.3 Basic Skeletal Muscle Responses Post Spinal Cord Injury
An intact spinal cord propagates the motor and sensory information between the brain
and the peripheral nerves that inerves muscles (Purves et al., 2001). This allows a
voluntary movement coordination by the nervous system while the postural control and
joint stability needed for skeletal movements for activity performance are normally
supported by the skeletal muscle (Blottner & Salanova, 2015; Hogan, 1985). Following
a SCI due to a disease or trauma to the spinal cord, there is usually partial or total loss of
skeletal muscle functions. This is as a result of the disruption in the motor and sensory
information below the injury level (Biering-Sørensen et al., 2009; Hamid & Hayek,
2008). As the human skeletal muscle which is responsible for movements and activities

18
is innervated by spinal nerves accommodated within a particular segment of the spinal
cord, injury to that segment logically translate to a loss of muscle activity below the injury
site (Biering-Sørensen et al., 2009; Hamid & Hayek, 2008).
The rehabilitative technique or treatment options for the affected persons depends
largely on the level (Figure 2.2) and severity or completeness of the SCI based on the
injury classification. Table 2.1 describes the neurological injury classification according
to the International Standards for Neurological Classification of SCI i.e. American Spinal
Injury Association Impairment Scale (AIS) (Kirshblum et al., 2011; Waters et al., 1991).
Furthermore, Figure 2.2 illustrates the relationships between the spinal cord segment and
the supported functions.
Table 2.1: American Spinal Injury Association Impairment Scale (AIS)
(Kirshblum et al., 2011).
Classification Grade A Grade B Grade C Grade D Grade E
Injury
completeness
Sensorimotor
complete
Motor
complete but
sensory
incomplete
Motor and
sensory
incomplete
Motor and
sensory
incomplete
Sensorimotor
function is
intact
Interpretation
Both motor
and sensory
functions are
absent below
the injury
level and in
the sacral
segment S4-
S5.
Only sensory
function is
preserved
below the
injury level
and in the
sacral
segment S4-
S5.
Motor
function is
intact below
the injury
level, with
key muscles
having
muscle
grade < 3
Motor
function is
intact below
the injury
level, with
key muscles
having
Muscle
grade ≥ 3
Normal
neurological
function
Note: Key muscles refer to the muscles below the injury level.

19
Figure 2.2: Classification of the levels of spinal cord injury according to the
American Spinal Injury Association.
Reproduced from Bickenbach et al. (2013) under the general distribution terms of the
World Health Organization.
Depending on the post-injury duration, SCI is also classified as acute (mostly while
the affected persons is hospitalized for a primary rehabilitation intervention) and chronic
(post-rehabilitation phase or community dwelling) (Curt et al., 1998) and a stage between
the two is termed subacute (Fawcett et al., 2007). While there has been no definitive
consensus on the demarcation of when an acute injury becomes chronic, chronic injury
implies a relative stability in the body composition as compared to acute SCI (Hamid &

20
Hayek, 2008; Houle & Tessler, 2003). This knowledge is essential as there are differences
between the physiological responses of a muscle in chronic and acute stages of SCI. Such
responses are due to the variations in the duration of inactivity associated with the changes
in the muscle metabolism, blood flow, and fibre composition (Peckham et al., 1976;
Shields, 2002).
Consequently, the effect of this transformation confers different fatigue resistance
capacities on the skeletal muscles during different post-SCI stages (Nguyen et al., 2011).
For example, unlike during chronic SCI phase, an acutely denervated skeletal muscle
might be characterized by an unusual muscle fibre composition—as indicated by the
relative proportion of slow and fast myosin heavy chain isoform expression (Burnham et
al., 1997). This is as a result of the alteration of fibre type morphology and histochemistry
after SCI (Burnham et al., 1997; Gorgey et al., 2014). Therefore, there are different
muscle force and fatigue temporal responses between an acutely-denervated versus
chronically denervated muscle to a rehabilitative intervention and functional recovery.
Following a SCI, the main classes of muscle fibre types responsible for variations in
the muscle responses are slow-twitch/fatigue resistant fibre and fast-twitch/fatigable
fibre. Fast-twitch fibres' response to a contractile impulse is quicker than that of slow-
twitch fibres, but at the expense of rapid onset of muscle fatigue. While slow-twitch fibres
are more fatigue-resistant than fast-twitch fibres, response to a contractile impulse in
slow-twitch fibres is slower in comparison with that of fast-twitch fibres (Bogdanis,
2012). Although the extent of muscle atrophy due to disuse and the level of physical
exercise influence the ratio of the fibre types in skeletal muscle, alteration in the
proportion of the slow-twitch fibre to fast-twitch fibre is a negative neuromuscular
sequela to SCI (Round et al., 1993; Tanaka et al., 2013).

21
As a consequence of these morphological and histochemical adaptations, resistance to
rapid fatigue is impaired in denervated or paralyzed skeletal muscles compromised by the
upper motor neuron lesions in the spinal cord (Hillegass & Dudley, 1999). Accordingly,
the power output and exercise capacity of the affected muscles are diminished due to the
inactivity and unloading concomitant with post-SCI wheelchair confinement (Castro et
al., 1999). This is clearly evident in the decline of the force-generating capacity of the
muscle (i.e., specific tension (Ncm-2)) (Hunter et al., 1998; Kluger et al., 2013).
Therefore, there is a significant influence of SCI on the muscle response and general
health conditions of the affected persons (Davis et al., 2008; Noreau & Shephard, 1995).
The common consequences of SCI includes: (i) disuse atrophy and consequently,
osteoporosis with an increased risk of bone fracture, (ii) limited cardiorespiratory fitness
due to sedentary lifestyle, (iii) decubitus ulcers, (iv) incontinence among various other
physiological and biomechanical disorders (Davis et al., 2008). This justifies why
returning the affected persons back to their “productive lives” has become a research
priority (Boschen et al., 2003; Ditunno & Formal, 1994).
Thus, a recovery of the lost function or at least a preservation of muscle health integrity
significantly impacts the quality of life of the affected persons. Evidence (Ditunno &
Formal, 1994; Nash, 2005) suggests that rehabilitative interventions promote
independence in “self-care” and “mobility” through exercise in the affected population.
Thus, SCI-related health problems could be offset by therapeutic and functional
rehabilitative interventions. One promising engineering technique that has been
recognized and recommended for exercise is neuromuscular electrical stimulation
assisted contractions. This technique has been used to offset sedentary lifestyle, and its
complications, in the affected persons in order to improve their physical capacity (Hamid
& Hayek, 2008; Ho et al., 2014; Jacobs & Nash, 2004).

22
2.4 Neuromuscular Electrical Stimulation
Neuromuscular electrical stimulation (NMES) is an engineering technique for
artificially applying electrical current to the muscle or nerve to generate skeletal muscle
contractions (Bajd & Munih, 2010; Hamid & Hayek, 2008). The technique is based on
the discovery of Galvani and Volta (1793) which demonstrated muscle contractions with
an electrical current propagation along muscle fibres. In clinical settings, NMES is used
to activate skeletal muscle for rehabilitative purposes while the technique is used in
research settings for the assessment of muscle performance and for the improvement of
neuromuscular activation levels (Bickel et al., 2011).
Technically, NMES systems are made up of a “microprocessor-based electronic
stimulator that coordinates the modus operandi of the stimulation. The system also has
stimulation channels that communicate to individual pulses using pairs of stimulation
electrodes connected to the neuromuscular system” (Hamid & Hayek, 2008; Papachristos,
2014) and a portable power source with a rechargeable battery (Ragnarsson, 2007). Figure
2.3 depicts the NMES scheme in open- and closed-loop configurations. Open-loop
configuration is based on the manual bottom press while in a closed-loop configuration,
proxies of muscle responses are inputs to the control interface from where the stimulator
receives the command signals. The electrical stimulus pulses that are generated by the
controller are delivered to the target muscle via pairs of stimulator electrode depending
on the number of channels. This results in muscle contractions required for therapeutic
and/or functional gains.

23
Figure 2.3: Basic component of a surface NMES system.
The stimulator generates a train of pulses (i.e., similar to the neural twitches passing
through the spinal cord to the peripheral nerves during voluntary contraction in an intact
spinal cord) below spinal cord lesion to effect artificial muscle contractions (Durand et
al., 2005; Hamid & Hayek, 2008). Specifically, the generated stimuli triggers action
potentials in the peripheral nerves within the muscle fibres to activate muscle contractions
(Rattay et al., 2003). The action potential, being “a fundamental unit of communication
in the nervous system, is an electrochemical signal that travels along the neurons as a flux
of ionic current between the extracellular and intracellular matrix” (Grill & Kirsch, 2000).
Therefore, when NMES current is applied to a pair of stimulating electrodes affixed to
the skin surface overlying sensorimotor structures, an electric field triggers action
potentials along the nerve bundle, which leads to muscle contractions (Figure 2.4). This
is effective as the released ions produce current in the tissue due to the transmission of
action potentials along the axon to the peripheral nerve innervating the muscle (Durand
et al., 2005; Grill & Kirsch, 2000).

24
Figure 2.4: Electric field propagation and generation of the action potential to
evoke muscle contractions during surface neuromuscular electrical stimulation.
Reproduced from Bajd and Munih (2010) with permission from the publisher.
The propagation of the action potential along the nerve leads to muscle contractions
through the activation of the PNS (Durand et al., 2005; Grill & Kirsch, 2000). The potency
of the NMES is based on the system parameters’ setting (intensity (current or voltage),
pulse width and frequency; Figure 2.5) which determines the extent of muscle fibre
recruitments, muscle contraction and consequently, muscle force generation (Bhadra,
2015). These electrical stimulation parameters are functions of the muscle force
production while pulse frequency, specifically, affects the muscle fatigability (Ibitoye et
al., 2016).
Evidence (Bickel et al., 2011) suggests that the NMES’s recruitment pattern of motor
unit (MU) is nonselective, spatially fixed and synchronous. This implies that the MUs are
stimulated or activated at the same time without obeying the size principle of Henneman
(1957). The size principle suggests that the normal physiological recruitment of MUs
involves a progressive recruitment of slow twitch MUs before fast twitch MUs (Jabre &
Spellman, 1996). This may justify why a stimulation frequency of 20 Hz and above,
which is within the “physiologically relevant frequency of motoneuron discharge” (Al-
Majed et al., 2000), is usually required for achieving effective electrical stimulus muscle

25
contractions (Thompson et al., 2014). This is opposed to a voluntary MU activation
strategy, which is asynchronous and requires a frequency range between 6 Hz and 8 Hz
(Lynch & Popovic, 2008) for effective muscle contractions.
Figure 2.5: Stimulation parameters.
The period of stimulation (T (ms)) is the inverse of the frequency of stimulation (F
(Hz)). PW (µs) stands for pulse width and I (mA) represents the stimulation current.
As earlier mentioned, the NMES is typically administered through pulses of electrical
signals with specific parameters—current, pulse width, and frequency (Figure 2.5), using
stimulating electrodes (Hamid & Hayek, 2008). These electrodes can be fixed to the skin
surface non-invasively (transcutaneous), or surgically implanted and affixed to the
muscle’s motor point (epimysial), or implanted inside the muscle
(percutaneous/intramuscular), or surgically wrapped around the nerve (helix or a cuff), or
inserted (intraneural) within the nerve that innervates the muscle of interest (Popovic &
Sinkjær, 2000; Ragnarsson, 2007).
Although implanted-based NMES electrode generally allows good muscle selectivity
and promote excellent motor unit recruitment (Polasek et al., 2009), the technique may

26
be characterized by infection, low user preference (Rohde et al., 2012) and has not been
widely approved for clinical use (Peckham & Knutson, 2005). This has resulted in a
limited “commercial success” of the technology (Peckham & Knutson, 2005).
Conversely, while surface NMES technology is relatively safer and easier to use
(Mangold et al., 2004), selective muscle contractions especially of deeper muscles is
challenging. However, the modality is potentially appealing to the users and more
commonly used in home and clinical settings (Keller & Kuhn, 2008; Ragnarsson, 2007).
Therefore, based on the highlighted strengths of the surface stimulation modality, with
consideration to the main objective of the present thesis and in accordance with previous
related studies on knee extension (Gorgey et al., 2016; Hillegass & Dudley, 1999) and
standing (Kralj & Bajd, 1989; Yarkony et al., 1990) tasks, surface stimulation was
considered suitable and thus adopted for use in the various investigation performed in the
present thesis.
On the mode of control of NMES system, the modulation of the stimulation parameters
can be effected through an open-loop or closed-loop configuration (Ragnarsson, 2007).
In an open-loop NMES modulation, the operation of the NMES system is dependent on
the subjective users’ perceived need. Therefore, information of the muscle state in terms
of muscle force/joint torque and fatigue is absent and could not be compensated for. Other
than being characterized by a sub-optimal muscle response, the modality predisposes a
muscle to injury (Fitts, 1994). Although this type of NMES system is mostly available
for therapeutic applications, its effectiveness for functional applications is limited as the
modality overstimulates the muscle to ensure sufficient activation—a practice which
leads to a rapid muscle fatigue (Hoffer et al., 1996).
Conversely, in a closed-loop NMES system, the real-time information on the muscle
response/state such as muscle force or joint torque and fatigue status are automatically

27
fed back to the NMES system by peripherally placed sensors to modulate or regulate the
NMES operations (Peckham & Knutson, 2005). This type of NMES operation is more
efficient, mostly required for functional activities and reduces “cognitive burden” of
open-loop NMES systems—where the user is expected to be conscious of emerging
perturbations (Hoffer et al., 1996).
By these two strategies, NMES provides muscle contractions for the restoration of
movement or function (Bajd & Munih, 2010). The application of NMES therapy to
promote the ‘restoration’ of purposeful function has been demonstrated in several studies
(Doucet et al., 2012; Fouad & Tetzlaff, 2012; Scott et al., 2005). Useful clinical
application of the NMES technology has been applied to maintain, improve or restore
muscle trophism, promote health and augment functional outcomes after SCI (Collins,
2007; Deleys et al., 2015), in post-acute care, rehabilitation settings and exercise
programmes (Fouad & Tetzlaff, 2012; Kebaetse et al., 2005; Mohr et al., 1997). In the
next session, lower limbs rehabilitation applications of the NMES technology in post-SCI
care is discussed.
2.5 NMES Assisted Rehabilitation in the Lower Limbs Post-SCI
NMES applied over the human neuromusculature produces muscle contractions by
depolarizing motor axons beneath the stimulating electrodes (Collins, 2007). Previous
neurophysiological studies have shown that the larger motor units’ axons are more readily
depolarized, allowing preferential recruitment of fast twitch fibres during NMES-evoked
contractions (Bickel et al., 2011; Blair & Erlanger, 1933). However, in persons with SCI,
inactivity following wheelchair confinement leads to disuse atrophy and alters the normal
physiological muscle response (Castro et al., 1999; Round et al., 1993). To preserve the
integrity of muscle health in this population, NMES rehabilitative option exploits the
adaptive potential of skeletal muscle fibres to increase loading effect on joints.

28
Therefore, there is strong evidence (Ho et al., 2014; Sadowsky et al., 2013) that
NMES-evoked muscle contractions promote the recovery and/or preservation of health,
and offset the secondary complications of the SCI (Griffin et al., 2009; Hasnan et al.,
2013; Jacobs & Nash, 2004). Specifically, the NMES technology has shown promise in
the rehabilitation of both the upper and lower limbs as well as human body functions
mostly in persons with upper motor neuron lesions but intact peripheral nerve/lower
motor neuron (Kern et al., 2007; Ragnarsson, 2007). In these persons, the affected
muscles still retain the “ability” to contract and generate force (Biering-Sørensen et al.,
2009).
However, depending on the type of paralysis, regaining standing and ambulation are
typical important rehabilitative priorities in persons with paraplegia—those with lower
limb and trunk paralysis (Ragnarsson, 2007) as well as those with low tetraplegia (Davis
et al., 2001; Jaeger et al., 1989; Peckham & Knutson, 2005). NMES supported standing
in these populations has been a major research concern for over five decades with the
pioneer works of Kantrowitz (1963), Bajd et al. (1981) and Kralj and Bajd (1989).
Therefore, standing and short distance ambulation represent major purposes of NMES
application in the lower limbs (Peckham & Knutson, 2005) as the inability to stand or
ambulate may disallow the affected persons the capacity to manipulate objects within
their environments, transfer between places and have an equal level interaction (Davis et
al., 1999; Peckham & Knutson, 2005).
Figure 2.6 represents an open-loop control of NMES administration for knee
extension, standing, and ambulation training. In this case, the stimulation is triggered
manually by a finger switch to effect knee lock in stance phase and unlocks the knee
during swing phase in order to prevent collapse, while the NMES system consisting of
about 16-channel stimulation via surface electrodes, moves the ankle. Evidence (Faghri

29
et al., 2001) suggests that the NMES-assisted standing improves a joint range of motion,
prevents orthostatic hypotension and circulatory hypokinesis and improves
cardiorespiratory and metabolic functions for the promotion of the quality of life (Rohde
et al., 2012). In addition, NMES supported standing may prevent disuse atrophy,
promotes muscle strength and endurance, enhances cardiopulmonary status and tissue
integrity to prevent pressure sore associated with inactivity (Triolo & Bogie, 1999).
Moreover, being a requirement (Davoodi & Andrews, 1999) for reaching and
ambulation, standing allows persons with SCI to fulfill activity of daily living (Simpson
et al., 2012). The need to channel research activities in line with this concern has
continued to motivate research activity in this area of lower limb rehabilitation.
Leading among the NMES supported standing research priorities has been the
strategies for “standing up”, “sit-to-stand” and “prolonged standing” during stance phase
(Eng et al., 2001; Kern et al., 1999). These functional activities are often preceded by
reconditioning of the involved muscles (Peckham & Knutson, 2005) through isometric
knee extension exercise (Jaeger, 1986) and other strength conditioning modalities which
could be used to promote the muscle resistant to rapid muscle fatigue for an extended
contraction duration.

30
Figure 2.6: Typical NMES-assisted lower limb rehabilitation.
(A) The NMES assisted knee extension exercise for improvement of muscle strength
and joint range of motion in preparation for standing tasks; (B1) The NMES supported
sit-to-stand and (B2) standing tasks; and (C) An example of an NMES setting for
ambulation training.

31
The specific population of SCI that possesses a good upper-limb strength which is
required for standing may be trained for NMES supported standing to access objects and
maneuver into places that are ordinarily inaccessible with a wheelchair (Davis et al.,
1999). Standing has both functional (Triolo et al., 1992) and therapeutic benefits (Veltink
& Donaldson, 1998). The functional standing task involves a stable and an upright posture
while part of/or whole of upper limbs are used for object manipulations (Triolo et al.,
1992). However, when the upper extremities are mainly used for postural control and
stability, such a standing task is limited to therapeutic benefits. While the latter may be
of limited clinical interest, its benefits are equally enormous (Veltink & Donaldson,
1998), particularly being a simple and cost-effective therapeutic exercise modality (Bajd
et al., 1999). In both cases, standing benefits can fully be realized if it is considerably
prolonged (Eng et al., 2001).
Currently, the dexterity of NMES supported standing is not comparable to that of
voluntary standing in persons with intact neuromuscular function. For example, in terms
of metabolic (energy) cost, the effort expended in NMES standing is estimated at 4 to 6
times higher than that of a normal voluntary standing (Graupe & Kohn, 1998; Jacobs &
Nash, 2004; Kobetic & Marsolais, 1994). Additionally, an insufficient duration of NMES
supported standing has been consistently reported and this is a limitation to the clinical
efficacy of the NMES technology (Peckham & Gorman, 2004; Ragnarsson, 2007) for
application in standing. Thus, the research interest to prolong the duration and improve
the efficacy of NMES supported standing has been on the rise recently (Braz et al., 2015).
To understand the reason behind the inefficient outcome of NMES supported standing
in persons with SCI, the knowledge of motor activities during voluntary recruitment of
motor unit is vital. As earlier mentioned, voluntary muscle contraction obeys Henneman’s
size principle (Henneman, 1957; Henneman et al., 1965). That is, the recruitment order

32
of motor units is from the smallest (slow twitch) to the largest (fast twitch). This has been
interpreted as orderly recruitments of muscle fibres’ motor units. This phenomenon
naturally delays the occurrence of muscle fatigue during sustained maximal isometric
contractions by allowing the “slowing” of motor unit firing rate— muscle wisdom (Boyas
& Guével, 2011; Garland & Gossen, 2002). One of the exceptions to the Henneman’s
size principle, however, has been the recruitment pattern of NMES where a reversal of
the size principle has been commonly reported (Bajd & Munih, 2010; Bickel et al., 2011).
In addition, the majority of evidence supports that the order of NMES-induced MU
recruitment is non-selective (Bickel et al., 2011; Maffiuletti, 2010), the consequent of
which is the exaggerated metabolic cost of NMES-evoked muscle contractions that lead
to rapid muscle fatigue (Collins, 2007; Maffiuletti, 2010). This limits the duration of
muscle contractions that NMES may evoke (Jaime et al., 2002). Therefore, while there
are various therapeutic and functional benefits associated with lower limb rehabilitation
(Thrasher & Popovic, 2008), the limitation imposed by rapid muscle fatigue demand that
the NMES modulation is automated for optimal applications.
The effect of muscle fatigue is particularly significant as it is time-varying and affects
the response of muscle, specifically, during high-intensity repetitive application of NMES
for antigravity activities such as in standing-up and sustained standing where muscle
fatigue may be evident in 60 secs of stimulation (Chesler & Durfee, 1997; Thrasher &
Popovic, 2008). Consequently, there is an increased tendency for muscle injury associated
with a prolonged muscle contraction due to the accumulated muscle fatigue (Fitts, 1994)
without proper monitoring. Therefore, an automated NMES operation allows intelligent
compensation for changes in the neurostimulated muscle response due to muscle fatigue
and other perturbations.

33
However, one major limitation of the commercial NMES technologies is the lack of a
reliable feedback signal source to gain muscle state information including the magnitude
of the force/torque generation and fatigue contractions (Popović, 2014). This may justify
why the available clinical NMES systems such as Parastep™ (Sigmedics, Inc., Fairborn,
OH, USA) still rely on the manual control by hand switches for operation (Ethier &
Miller, 2015). Till date, the development and validation of sensors to modulate and
automate the stimulation pattern, during NMES-evoked muscle contractions in order to
mimic the physiological coordination of muscular activities, is of interest and a wide
knowledge gap (Ragnarsson, 2007). Indirect measure of neural activities including
electromyogram (EMG), electroencephalogram (EEG), electroneurogram (ENG)
(Sinkjaer et al., 2003) and mechanomyogram (MMG) which is the mechanical equivalent
of EMG (Decker et al., 2010; Gobbo et al., 2006; Orizio, 1993) have been validated as
physiological signals that is rich in neural information to decode functional intentions
during muscle contraction.
These signals are generally promising in the design of biofeedback systems for NMES
control applications in the research and clinical settings (Hatsopoulos & Donoghue,
2009). They may be deployed as a proxy of muscle contractions and the generated muscle
force during fresh and fatiguing contractions or used to study the knee-joint dynamics
(Sharma et al., 2009) for lower limbs rehabilitation. They may be utilized as
biopotentials/signal sources for feedback applications to allow NMES systems to receive
real-time muscle information and consequently modulate the activity of NMES controller
to regulate the resulting muscle contractions for an effective muscle force production
(Collinger et al., 2013; Loeb et al., 1980; Ragnarsson, 2007). The following section
discussed certain physiological signals related to the neuromuscular system for NMES
feedback applications.

34
2.6 Major Biopotential Sources for NMES Feedback Applications
2.6.1 Electromyography
The robustness, optimization, and safety of the future NMES applications appear to be
dependent on the system’s sensitivity to the electrical stimulus-evoked muscle force and
reduction of fatigue occurrence. To access muscle state information during NMES
applications as well as subverting the influence of non-physiological muscle response to
the NMES, researchers (Ewins et al., 1988; Ibitoye et al., 2016; Sinkjaer et al., 2003) have
recommended the use of various biopotentials as feedback signal sources for NMES
control applications. One such biopotential is surface electromyography (SEMG)—
electrical event accompanying muscle contractions (Akataki et al., 2004; Disselhorst-
Klug et al., 2009). The SEMG measured from an activated muscle during NMES-evoked
contractions is termed evoked EMG (EEMG). The signal is the summation of the motor
unit action potential of the muscle fibres within the vicinity of the EEMG electrode
(Fuglevand et al., 1992).
Based on its relative magnitude in comparison with other relevant biopotentials
including nerve signals (electroneurogram, ENG) (Haugland & Sinkjaer, 1995) and brain
signals (electroencephalogram, EEG) (Wolpaw et al., 2000), EEMG signals seemed to be
mostly explored and favored as a biopotential for NMES feedback applications. This may
be due to the fact that the EMG is about a thousand times larger in amplitude than the
EEG (Thakor, 1999), substantially larger in amplitude than ENG (Rahal et al., 2000) and
therefore, less difficult to interpret. Additionally, EEG and ENG require more critical
process before they could be deployed to interpret neuromuscular functions due to the
low information transfer rate (Wolpaw et al., 2000), low signal to noise ratio (Rahal et
al., 2000) and high sensitivity to the body movement artifacts, eye blink and heartbeat
(Niedermeyer & da Silva, 2005; Thakor, 1999). However, EEMG reliability and ease-of-

35
use as an indicator of muscle activities is disputable and this continues to preclude its
application as a biopotential or biofeedback signal for NMES control applications (Hoffer
et al., 1996; Yamaguchi et al., 2012).
Although an indirect estimation of muscle force/torque production has been
traditionally assessed by EEMG (Merletti et al., 1992; Thompson et al., 2011), sensitivity
of the signal to the external electromagnetic interference, variations in differential
electrode positioning and skin impedance changes due to perspiration (Yamamoto &
Takano, 1994) presents a significant limitation (Castellini et al., 2014; Orizio, 1993).
Therefore, the reliability of EEMG estimation of muscle torque generation during NMES-
evoked contractions is debatable (Popović, 2014).
Unlike voluntary EMG signals the EEMG signals summate the synchronously firing
motor units, with increasing electrical stimulus-evoked motor unit activation, there is also
limited sensitivity of EEMG as an indicator of motor unit synchronization which could
be used to determine the rate of muscle force development (Semmler, 2002; Yue et al.,
1995). This is partly due to the inherent problem of the stimulation artifact i.e. an
electrical current of larger amplitude that saturates the EEMG amplifier (Merletti et al.,
1992; Popović, 2014; Yamaguchi et al., 2012).
Therefore, the trend of the investigations in utilizing EEMG signals to assess NMES-
evoked muscle performance generally showed that investigators had to trade-off (i)
aesthetics or a compact design for a rather complex electrical circuit to remove
stimulation artifacts and (ii) transcutaneous/surface electrodes for invasive
percutaneous/implanted stimulation electrodes for useful parameters of EEMG signals or
M-wave to be derived (Ibitoye et al., 2014).
36
Although there have been recommendations on the strategies to reduce the influence
of the stimulation artifact, many adjustments required to the EEMG amplifier, as well as
the complication of the artifact blanking process explain why investigators continuous to
look beyond EEMG as NMES feedback signal source (Chesler & Durfee, 1997; Hoffer
et al., 1996; Popović, 2014). Thus, estimation of NMES-evoked muscle force during fresh
and fatigue contractions by EEMG alone is deficient (Hoffer et al., 1996; Levin et al.,
2000; Vøllestad, 1997). An estimation of muscle force/torque from other relevant muscle
characteristics i.e. biopotentials of muscle activation, particularly, from physical sensors
has recently become, necessary, viable and attractive.
2.6.2 Mechanomyography
Another relevant biopotential that has been used to monitor neuromuscular activities
is mechanomyography (MMG), a mechanical equivalent of the EMG (Beck et al., 2004;
Gordon & Holbourn, 1948; Marek et al., 2005). As with emerging techniques, various
terminologies have been used to describe MMG based on the characteristics of the sensor
used for the signal acquisition, namely: accelerometermyography (Lammert et al., 1976),
muscle sound (Oster & Jaffe, 1980), acousticmyography (Barry et al., 1985),
soundmyography (Orizio et al., 1989), vibromyography (Keidel & Keidel, 1989),
phonomyography (Maton et al., 1990), among other terminologies, before the adoption
of mechanomyography at the CIBA Foundation (now known as Novartis Foundation)
Symposium in 1995 (Orizio, 1993; Stokes & Blythe, 2001) as the signal is mechanical in
nature (Beck et al., 2007). The MMG signal refers to any of these terminologies, in the
present thesis.

37
Figure 2.7: Basic principle of MMG generation during a muscle fibre contraction.
Note that yT, ɵ, and δ represent the lateral movement of the fibre, “axial twisting” as
a variant of lateral vibration, and radial thickness in xT direction, respectively. Reprinted
with permission from Posatskiy (2011).
As a mechanical manifestation of muscle activation signals, evidence (Barry, 1987;
Frangioni et al., 1987) suggests that the MMG signal is excited by “slow bulk movements
of the muscle” fibre vibrations at the natural/ eigenfrequency of muscle or due to the
pressure waves produced by muscle fibre dimensional changes (Orizio, 1993).
Specifically, during “skeletal muscle contraction, the MMG is generated by three primary
mechanisms (Figure 2.7): (i) a slow bulk movement of the muscle at the initiation of the
contraction, (ii) smaller subsequent lateral oscillations occurring at the resonant
frequencies of the muscle, and (iii) a pressure waves produced by dimensional changes
of active muscle fibre” (Barry, 1987; Barry & Cole, 1990; Beck et al., 2007; Beck et al.,
2004; Orizio, 1993).
Essentially, the MMG signal summates the activity of the muscle fibre’s motor unit
as each motor unit contributes to the pressure waves produced by the activated muscle
fibres during muscle contractions (Orizio et al., 2003). The MMG measurement is
predominantly captured by the lateral oscillation of muscle fibre during contraction
(Akataki et al., 1999; Frangioni et al., 1987). The MMG signal may estimate MU
activation strategy better than its “electrical counterpart” i.e. EMG (Akataki et al., 2004)

38
as the formal propagates through soft tissues and may be richer in neuromuscular
information pertaining to the activity of deeper muscles (Akataki et al., 2004; Orizio,
1993). The MMG signal can, therefore, be used to study the degree of motor units
recruitment and their firing frequency (Orizio et al., 2003). Consequently, MMG is
directly related to the two main force-generating mechanisms of human skeletal muscle—
magnitude and pattern of motor unit recruitment and their firing rates/frequency (Beck et
al., 2004).
MMG signal is commonly measured by a physical sensor such as an accelerometer
(Orizio, 2004). It is interesting to note that unlike electromyography, the MMG signal is
insensitive to electrical signal artifact (Yamaguchi et al., 2012) and impedance changes,
and thus, suitable for muscle contraction measurements in the presence of electrical
artifact noise, and could be subjected to a long time usage (Barry et al., 1986).
Currently, EEMG and MMG signals have been commonly used as control signal for
NMES systems, but MMG signal modality has been gaining recent attention for its
relevance for muscle activity detection for practical daily use “even in electrical noise”
(Reza et al., 2005; Yamaguchi et al., 2012). For example, due to the convenience of MMG
signal collection, its insusceptibility to skin impedance (Alves & Chau, 2010a), flexibility
of its sensing technology (Ibitoye et al., 2014; Silva et al., 2005), and immunity from
electrical stimulation artifacts associated with NMES (Orizio et al., 1999), the signal has
been successfully used to classify muscle activity for specific application in controlling
prostheses (Hong-Bo et al., 2009), and as a control signal for muscle machine interfaces
(Barry et al., 1986; Silva et al., 2005).
Additionally, MMG acquisition requires a single point measurement averting the
issues associated with the standardization of electrode spacing as needed for the common
bipolar surface EMG configuration (Yamamoto & Takano, 1994). However, the muscle

39
assessment and control applications of MMG signals have been mostly demonstrated
under well-controlled laboratory conditions and in persons with intact neuromuscular
function. There is a limited application of the signal in clinical settings and in persons
with neuromuscular conditions.
Therefore, the use of the MMG signal as a reliable proxy of muscle force and fatigue
during NMES contractions remains an open research question as several questions are
unanswered. Considering the signal strength as earlier highlighted and if the signal’s
ability to track the muscle actions could be sufficiently validated in the research and
clinical settings, there may be flexibilities in the applications of NMES technologies, with
the ultimate goal of optimizing the utility of the technology. However, in order to utilize
MMG as an NMES control signal, the signal features that reliably relate with muscle state
are usually employed (Gobbo et al., 2006). The next session discussed the MMG
measurement techniques and the extraction method of its predominant features in time
and frequency domain.
2.7 Mechanomyography Measurement Techniques
The mechanical response of muscle fibre to contractions has been recently identified
as a signature or indicator of the level of neural activation and a representation of muscle
force production (Castellini et al., 2014). Such a mechanical response is related to the
muscle surface oscillation or pressure waves generated by active muscle fibres’
dimensional changes (Barry et al., 1986; Orizio, 1993). This oscillation has been referred
to as the muscle MMG as the signal is a reflection of the mechanical activity of an
activated muscle (Orizio, 1993). Essentially, the overall muscle dimensional changes due
to the mechanical response of actin and myosin cross bridging formation following MU
activation—for muscle force generation (Webb & Trentham, 2010) could be acquired in
the form of MMG signal. As the MMG summates the motor unit contributions to muscle

40
contractions (Orizio, 1993; Orizio et al., 1996), the signal has been used to study the motor
unit activation strategies underlying muscle force modulation during low to high
contraction intensity levels (Beck et al., 2004; Orizio et al., 1989).
During skeletal muscle contractions, the MMG signals may be acquired on the surface
of the skin in the form of acceleration, vibration or sound signal (Orizio, 1993). Typically,
the characteristics of a reliable MMG transducer/sensor includes the following: (i) high
sensitivity in the muscle vibrational frequency range, i.e., 1 Hz up to 250 Hz (Beck et al.,
2005) and low sensitivity to random signals (noise); (ii) ease and standardization of the
sensor attachment; (iii) biocompatibility and applicability in a clinical environment
(Courteville et al., 1998), to mention only the major considerations. Although the MMG
signals can be collected by a variety of physical sensors (Watakabe et al., 2003; Yungher
et al., 2011), accelerometer-based sensors have been widely recommended due to their
superior features, that have supported their suitability for integration into a
neurostimulator, in comparison with other sensing modalities (Gobbo et al., 2006; Orizio,
2004).
To obtain MMG signals with acceptable integrity, the established technical guidelines
used for the acquisition and processing of electromyograms are often adapted (Yuan-Ting
et al., 1992). The uniformity of the MMG sensor’s placement in relation to the intended
signal site is crucial to ensure a reliable measurement. It has been previously
demonstrated that different results may be obtained between trials if sensor position varies
(Smith & Stokes, 1993). There is evidence (Frangioni et al., 1987; Stokes, 1993) that
higher MMG signal magnitude/power could be collected over the muscle belly than the
fascia at the muscle border or towards the tendon. This corroborates the significant
relationship between the magnitude of the signal and the relative distance of the sensor
from the muscle belly. However, there is an isolated report (Beck et al., 2009) on the high
41
level of association between MMG signals collected with sensors’ placement in different
axis/plane on the same muscle. Therefore, MMG signal measurement in a single axis has
been considered sufficient to interpret the neuromuscular activity during muscle
contraction especially in a bipennate muscle such as “rectus femoris” (Beck et al., 2009).
Another consideration during MMG acquisition is ensuring the sensor firmness to the
skin surface and contact pressure standardization to reduce the variability of the signal
during repeated recordings (Smith & Stokes, 1993). The consistency of the signal
response also depends significantly on the uniformity of the sensor location between trials
and sensor firmness on the skin surface (Bolton et al., 1989). However, MMG signals are
not influenced by changes in the skin impedance, and thus, may not require a rigorous
skin preparation during acquisition (Alves & Chau, 2010a). Nevertheless, for an
improved signal integrity, the standard practice for the signal acquisition may include the
use of double sided adhesive tape to fix signal’s sensor to the skin in order to ensure a
constant pressure. Isolation of irrelevant muscles through an experimental setup on a
standard testing device, such as a custom made or a commercial dynamometer, has been
suggested to limit the effects of cross-talk and movement artifact (Beck et al., 2010).
In some experimental designs, investigators may seek a comparison between muscles,
tasks and/or persons, thus, a normalization of the acquired signal has been recommended
(Burden, 2010). This practice offsets the effect of inter-individual variability that may
adversely influence the MMG signal integrity including differences in muscle mass,
length, strength and the thickness of the tissue between the sensor and the participants’
muscles. To eliminate the effect of these muscle variations, normalization to a reference
level has been prescribed (Burden, 2010; Lehman & McGill, 1999).
Specifically, normalization constitutes a means of adjusting data to conform to a
common scale for an objective averaging and analysis in order to validly compare

42
between muscles, task and persons (Mathiassen et al., 1995). Moreover, normalization
facilitates a comparison between electrode sites on the same muscle, two different
muscles, and between test days (Lehman & McGill, 1999). Therefore, normalization is
recommended to prevent erroneous conclusions especially if the test is meant to compare
between trials, between electrode re-applications, between different muscles and persons
(Burden, 2010).
In terms of the MMG signal collection, the cut-off frequency of the filter is flexible
based on the type of sensor used, the muscle of interest and muscle action, but usually
within 1 Hz and 250 Hz in most reported studies on human subjects (Beck et al., 2005).
Theoretically, methodological and physiological concerns may dictate the signal
sampling rate based on the site of the muscle of interest. A common compromise is to
sacrifice the storage space for a high sampling rate during a signal acquisition process. A
rule of thumb based on the Nyquist-Shannon sampling theorem goes thus; “for a reliable
reproducibility and representation, a signal should be sampled at least twice the highest
frequency content of the signal” (Shannon, 1949, 2001). This suggests that MMG signals
should be sampled at least twice the highest recorded MMG signal frequency. However,
the common sampling rate as found in the literature is 1000 Hz (1000 samples/s) or 2000
Hz (Cescon et al., 2008), presumably to check the aliasing effect which may be due to the
hardware limitations.
Furthermore, oversampling enables a “sufficient accuracy of the MMG signals’ cross-
correlation time measurements to detect a delay corresponding to the fastest transverse
vibration in the muscular medium” (Ouamer et al., 1999). This approach has been used
to demonstrate that MMG signal reflects the muscle response as a global resonant
structure to the local fluctuations of pressure during voluntary contractions (Ouamer et
al., 1999). However, if the concern is to select the highest possible sampling rate, there is

43
usually a point at which sampling above a certain threshold has no additional advantage
— “a point of diminishing return”. In order to save system storage, it is recommended
that the sampling frequency is kept within the standard limits.
Taken together, a reliable MMG signal collection requires an appropriate selection of
the signal analysis methods (Beck et al., 2005). As with other physiological signals’
collection procedures, it is equally pertinent that a clear and proper guide are given to the
experimental participants in order to perform the experimental trials identically with each
repetition through training and familiarization with the experimental protocols and
equipment. As the MMG signals are inherently mechanical, the signal acquisition task
may be facilitated because the signal can be collected without the need for a separate
circuitry to eliminate the electrical noise interference in electrically stimulated
contractions. Additionally, the signal acquisition may be performed with a single uniaxial
electrode configuration unlike the simplest monopolar configuration of EMG (which is
rarely used) with a separate reference electrode whereas bipolar and multipolar
configurations of EMG require even more electrodes. These facts justify the reason for a
simpler hardware requirements for MMG signal acquisition (Ibitoye et al., 2014; Silva et
al., 2005) which in effect, may result in the cost effectiveness of the signal acquisition
and processing (Fara et al., 2013; Silva et al., 2005).
2.8 Mechanomyography Parameters
2.8.1 Time Domain Parameters
One important feature of MMG is the time domain parameter or MMG amplitude
characteristics. The quantification of the muscle force development (Orizio et al., 1989;
Stokes, 1993), monitoring of muscle fatigue (Barry et al., 1985) and the examination of
neuromuscular disorders (Orizio et al., 1997) have been widely delineated by the changes
in the MMG time domain features which generally signifies changes in the motor unit

44
recruitment during muscle contractions (Barry et al., 1985; Beck et al., 2004; Hu et al.,
2007; Madeleine & Arendt-Nielsen, 2005; Orizio, 1993).
One important and predominant time domain feature of MMG is the root mean square
(RMS) amplitude. Before the estimation of RMS amplitude from MMG signals, the
digitally sampled and acquired time series MMG signal is rectified, smoothed and band-
pass filtered (typically between 1 Hz and 250 Hz (Beck et al., 2005; Goldenberg et al.,
1991; Smith & Stokes, 1993; Szumilas et al., 2015) depending on the type of sensors
used, the need for muscle tremor reduction and the level of signal conditioning required)
by a Butterworth filter. Butterworth filter has been commonly used for this purpose as it
provides a good compromise between the attenuation and phase response by providing a
“maximally flat magnitude response in the pass-band” (Fara et al., 2013; Murphy et al.,
2008). Furthermore, in comparison with other common filter types, the pulse response of
Butterworth filters is better than that of Chebyshev filters and its attenuation rate is better
than that of Bessel filters (Fara et al., 2013; Murphy et al., 2008). These probably make
Butterworth filter more suitable for use in MMG signal processing.
The RMS amplitude of MMG (MMG-RMS), as a measure of the magnitude of the
varying value, is the square root of the mean square value defined for a specific time
interval, T in secs. An important objective of RMS amplitude calculation is to obtain
indices of muscle force (Sarlabous et al., 2013). Specifically, the amplitude of the MMG
signal depends on the muscle fibre activations under tension (Watakabe et al., 2001), and
it increases with increasing muscle force/effort based on the contraction level (Fara et al.,
2013).
Thus, the signal amplitude may provide information on the level of muscle activation
that may be required for functional tasks (Beck et al., 2005). The RMS feature of MMG
correlates with muscle effort (Alves & Chau, 2010b) and has been used to estimate the

45
level of muscle force/torque production (Lei et al., 2011). For example, Akataki et al.
(2004) demonstrated an estimation of motor unit activation strategy underlying force
generation by utilizing the MMG-RMS. Therefore, there is a significant relationship
between the muscle force and MMG-RMS that may explain why MMG-RMS has been
considered as the most reliable and useful parameter in the time domain (Basmajian &
De Luca, 1985).
The commonly reported patterns of relationships between MMG-RMS amplitude and
muscle force/torque production have been a parallel increase up to: 100% maximum
voluntary contraction (MVC)/ effort (Beck et al., 2004; Coburn et al., 2005); and MMG
amplitude reduction from 60-80% MVC to 100% MVC (Coburn et al., 2004; Maton et
al., 1990; Orizio et al., 2003) due to a profound plateau or reduction in the muscle stiffness
and the associated muscle force fusion—a manifestation of muscle mechanical changes
during contraction (Orizio, 1993; Yoshitake et al., 2002). These patterns of relationships
depend mainly on the type of muscle fibre and nature of muscle contractions/actions
(Beck et al., 2005). In general, there have been consistent reports on the reduction or
plateau in the response of MMG amplitude characteristics at high contraction intensity
starting from around 60-80% MVC which has been suggested to be due to the fusion of
muscle fibre or the effect of high contraction rate that reduces the MMG signal amplitude
(Orizio, 1993; Yoshitake et al., 2002). This shows that MMG amplitude could be used to
monitor MU recruitment strategy as the submaximal and maximum recruitment of MU
could be monitored by the MMG signal amplitude.
Another important MMG amplitude characteristic is the peak-to-peak amplitude
(MMG-PTP). The MMG-PTP is one of the metrics of the signal amplitude representing
the distance between the signal’s peak or highest amplitude value and the trough or lowest
amplitude value. Although not commonly used for a time series amplitude representation

46
in MMG research, MMG-PTP has been adopted by a few isolated MMG studies (Gobbo
et al., 2006; Orizio et al., 1999; Petitjean et al., 1998) where the variable was applied to
monitor the changes in mechanical properties of a muscle during fatiguing voluntary
(Orizio et al., 1999) and electrically-evoked contractions (Gobbo et al., 2006; Petitjean et
al., 1998). For example, a consistent decrease or lack of recovery in the value of MMG-
PTP amplitude has been used to indicate the reduction of muscle force during the period
of stretching (Esposito et al., 2011), sustained contractions or muscle fatiguing
contractions (Gobbo et al., 2006; Orizio et al., 2003).
Therefore, MMG amplitude could be used to monitor the persistent changes in the
viscoelastic characteristics of muscle or series elastic component (tendon) which is
manifested as the reduction in the force-generating capacity of a muscle, in particular,
during muscle activity involving high level of contractions (Esposito et al., 2011) such as
in fatiguing contractions. This relationship could be used to infer important characteristics
about muscle tendon unit stiffness during voluntary or electrical stimulus strengthening
exercise (Esposito et al., 2011). Additionally, as muscle fatigue has been described as a
manifestation of the motor-neuro excitation failure or a reflection of the “impairment in
the action potential propagation” (Sharma, Patre, et al., 2009), this evidence suggests that
MMG amplitude could provide an important information on the muscle activation
strategy during incremental voluntary or electrical stimulus-evoked fatiguing contractions
(Orizio et al., 1999).
2.8.2 Frequency domain parameters
As some useful information in the MMG signal may not be ordinarily evident in time
domain, frequency domain analysis of the signal has been suggested (Beck et al., 2004;
Orizio et al., 1992). Different patterns in the spectral analysis during muscle contractions
have been reported during various types of muscle actions (Beck et al., 2004). A shift in

47
the frequency feature of MMG has been generally used to monitor muscle fatigue
development and track the associated muscle activation pattern (Beck et al., 2007; Orizio
et al., 1999). The magnitude of the changes is dependent on the type of muscle action,
i.e., dynamic (eccentric or concentric) or isometric (maximal or submaximal effort) and
muscle mechanical characteristics including intramuscular fluid pressure and muscle
stiffness (Beck et al., 2007). The measure of the magnitude and pattern of the MMG’s
spectral shift (compression or expansion) has been demonstrated (Beck et al., 2004;
Orizio et al., 1992) by the frequency characteristics of the signal including peak frequency
(PF), mean power frequency (MPF) and median frequency (MDF) (Beck et al., 2007;
Orizio et al., 1990).
During voluntary contraction, the MPF is the most widely used frequency feature of
the MMG signal compared to the PF and MDF. This is because the MPF is less affected
by the method of analysis (Figini & Diemont, 1989; Stokes, 1993). Therefore, MPF has
been an important metric for examining the mechanical changes underlying muscle
contractions (Diemont et al., 1988). However, investigators (Yoshitake & Moritani, 1999)
have also continued to explore the use of PF for the analysis of muscle response during
electrical stimulus contractions. This may be due to that fact that the electrical stimulus
contraction recruits motor unit synchronously (Orizio, 1993) and there seems to be no
effect of incremental stimulation intensity on the MMG frequency content especially
during unfused muscle contraction level (Yoshitake & Moritani, 1999).
Generally, the frequency content of the MMG signal reflects changes in the global
firing rate of an unfused activated motor unit during muscle contractions (Ryan et al.,
2008). Specifically, the frequency of MMG is closely related to the firing rates of the
active motor units during voluntary (Esposito et al., 1996; Yuan-Ting et al., 1992) and
NMES-evoked muscle contractions (Stokes & Cooper, 1992; Yoshitake & Moritani,

48
1999). While there are other domains for MMG signal analysis, this thesis limits the
literature discussion to only the time and frequency domains analyses of MMG signal as
these are the domains used in the present investigation. However, as MMG signal
characteristics are insufficiently understood (Hu et al., 2007) in some of their area of
potential applications, one such promising area is their application as a feedback signal
for NMES systems.
2.8.3 Potentials of Mechanomyography as an NMES Feedback Signal
Although the potential use of MMG signal as a proxy of muscle force/ joint torque for
NMES feedback applications has been poorly understood, the fact that the signal summate
the muscle fibre twitches following NMES-evoked contractions has been well established
(Barry, 1992; Orizio et al., 2003; Orizio et al., 1996). Given the complexity of the NMES-
evoked recruitment of motor units, it is pertinent to investigate whether MMG signal
could be a satisfactory representation of muscle force that has been evoked by electrical
stimulation, with acceptable reliability. However, this may not be the only requirement
for a signal to be a proxy of NMES-evoked muscle force as there is a need for the signal
to be able to provide sensory information regarding muscle force modulation. In line with
these requirements, the MMG signal has been suggested to be directly related to the two
main muscle force-generating mechanisms; the magnitude and pattern of motor unit
recruitment and their firing rates/rate coding (Beck et al., 2004).
Interestingly, by means of an electrical stimulation evoked muscle contractions, the
generated MMG signal could be used to assess contractile properties of muscle fibre’s
motor unit (Orizio et al., 1997). This information may be useful to optimize the NMES-
evoked contraction of a healthy, paretic or paralyzed muscle. An implementation of which
could be through a feedback of muscle fibre contractile/muscle state information to the
NMES system in order to automatically regulate the generated muscle force (Gobbo et

49
al., 2006; Kimura et al., 2004). By this strategy, the pattern of neural activation of muscle
force modulation could be tracked and used to efficiently modulate the NMES-evoked
muscle force.
Additionally, being within the continuum of effective muscle contractions, muscle
fatigue, a reflection of the inability of a muscle to sustain the required force or exercise
intensity for a muscle action (Edwards, 1983; Fitts, 1994), may also be regulated by
means of the muscle response feedback signal—MMG. This is clinically useful during
sustained contractions of lower limb muscles such as in NMES supported knee extension
exercise or standing where muscle fatigue may be evident within the first 60 sec of
contractions (Thrasher & Popovic, 2008). Therefore, MMG has been identified as a good
indicator of fresh and fatigued contractions as the signal could be used to monitor the
mechanical changes during motor unit activation (Esposito et al., 1998; Orizio et al.,
2003).
This knowledge is particularly useful in muscle force or joint torque control
applications in NMES-assisted lower limbs rehabilitation as the control strategies that
have been widely used have relied on external joint angle sensors or accelerometers
(Peckham & Knutson, 2005). The investigation on the integration of sensors for NMES
control is, therefore, an active area of research. This has been feasible by the recent
progress in the development of control algorithms that allows an automated
administration of the NMES systems (Peckham & Knutson, 2005).
As it is easy to measure and useful as a proxy of muscle force, MMG signal is
potentially relevant as a modulating and control signal for NMES feedback applications
(Gobbo et al., 2006). Additionally, the simplicity of the surface measurement and
processing of MMG signal without the influence of stimulation artifact is another
excellent advantage for the application of the signal as NMES feedback signal source.

50
Moreover, both the muscle force and MMG are mechanical output generated during
muscle contractions. However, the predictive accuracy of MMG signals for NMES
evoked muscle force, which is required for practical NMES systems, remains poorly
investigated. As the MMG signal is a “summation of the mechanical activity of active
muscle fibres” (Orizio et al., 2003), the summation may not be simple over the entire
physiological range of muscle contractions (Orizio et al., 1996). This is mainly due to the
development of fused contractions, in particular, during high contraction intensity
(Yoshitake et al., 2002). On this basis, the problem associated with the signal pattern that
may characterize the muscle response during electrical stimulus contractions (Crago et
al., 1980; Durfee & Palmer, 1994; Rabischong & Chavet, 1997) warrants an application
of a machine learning technique (Youn & Kim, 2010) for muscle force/ joint torque
estimation from MMG signals.
2.9 Machine Learning Methodology
The application of machine learning or computational intelligent approach has been
proposed for muscle force or joint torque estimation or prediction from other readily
available muscle contraction signals as a direct and noninvasive measurement of muscle
force is impractical (Erdemir et al., 2007). Based on the recent advancement in computer
software applications and signal processing, a machine learning method uses developed
algorithms by utilizing empirical data from sensors or databases to enable systems to
generate programs or behaviors of themselves for estimation or prediction tasks (Al-
Mulla et al., 2011).
Basically, a good machine learning method in a particular field of study is known to
have an excellent estimation or predictive accuracy and a fast computational time for
online implementation (Ameri et al., 2014). One example of machine learning algorithm
which has increasingly been applied based on its strengths (Meyer et al., 2003; Vapnik et

51
al., 1997) in medical applications (Ameri et al., 2014) is support vector machine through
its extensions i.e. support vector regression and classification (Noble, 2006). As applied
to the present thesis, an overview of the support vector machine methodology is discussed
hereunder.
2.9.1 Support Vector Machine
Support vector machines (SVM) are based on the framework of statistical or
supervised learning theory (Smola & Schölkopf, 2004; Vapnik, 1999a). Through training
or learning by several examples, the SVM uses an algorithm to develop a model and by
recognition of what has been learnt following the training, the algorithm can be used to
solve a classification, prediction or estimation task. Although to the author’s knowledge,
SVM has not been previously used to estimate NMES-evoked muscle force, a related
study (Ameri et al., 2014) on voluntary muscle contractions suggested that the technique
could be applied to predict muscle force that is produced through electrical stimulus
contractions. This view was supported by the fact that the SVM algorithms could be easily
applied to perform various numerical computations (Smola & Schölkopf, 2004) including
regression related tasks (Wu et al., 2007; Xue et al., 2009).
In order to implement SVM algorithm on a data instance with an input dataset ( x ), the
mapping of the dataset is performed by projecting it by a function into a higher
dimensional feature space ( )x (Ameri et al., 2014). This process allows a linear
estimation of the regression function ( )f x using the standard regression equation 2.1:
( ) . ( )f x w x b (2.1)
Where b denotes the “bias term” or “offset” which may be neglected following data
preprocessing, w represents “weight vector” while the input data can be multivariate
(Ameri et al., 2014; Cherkassky & Ma, 2004).

52
The solution of the optimization problem (described in detail in Chapter 3, equation
3.3 to 3.10) could explain how SVMs typically solve a regression problem and minimizes
the estimation error. Based on this solution, the basic illustration of a standard SVR as
applicable to the present thesis is as shown in Figure 2.8. The Figure illustrates the SVR
methodology and specifically shows that the effect of errors may be unimportant once
they are within ε-insensitive loss function zone. Additionally, the deviations are linearly
penalized as revealed in the loss function graph, in which case the “Loss” serves as the
“penalty” for deviations larger than ε (i.e., data point outside allowable ε) using a non-
negative slack variable i which represents upper and lower constraints on the system
output (Granata et al., 2016; Yu et al., 2006).
Figure 2.8: SVR methodology illustrated.
Adapted with permission from Yu et al. (2006).
For a non-linearly separable data in the input space, the idea of kernel function which
represents “a dot product in some feature space” (Statnikov et al., 2011) has been
introduced to transform such data into the feature space where the data could be linearly
separable (Smola & Schölkopf, 2004). A description of such concept of SVR has been
shown in Figure 2.8. Typically, the SVR projects a dataset from an original low-
dimensional to a high-dimensional feature space (Noble, 2006) through some non-linear

53
mapping selected a priori (Vapnik, 1999b)—kernel function through “kernel trick”. This
permit a construction of a linear model in the feature space (Figure 2.8B). Thus, the
process allows the construction of an optimal separating hyperplane (Vapnik, 1999b)
between classes of datasets in classification problems. However, in a support vector
regression analysis problem, such a linear hyperplane is required to correlate the multi-
dimensional input data points or support vectors to the output data points for an estimation
or a prediction task to be performed.
The idea of ε-insensitive loss function introduced by Vapnik (1995) allows the SVM
to be extended to support vector regression (SVR) (Smola, 1996), specifically, to solve
regression or estimation problems (Fernandez, 1999), including those related to clinical
estimation and predictions (Ameri et al., 2014). Essentially, the value of ε-insensitive loss
function influences the number of support vectors that is used to construct a
regression/predictive learning function (Cherkassky & Ma, 2004). The function measures
the quality of an estimation (Vapnik et al., 1997) by controlling the “width of the ε-
insensitive zone that is used to fit the training data” (Cherkassky & Ma, 2004; Vapnik,
1998). Together with the regularization parameter ( C ) (which is another user-defined
parameter that indicates the tradeoff between the function’s flatness and the amount of
permitted error beyond ε- insensitive zone (Gupta, 2007)), ε determine the complexity of
a regression model (Cherkassky & Ma, 2004).
Therefore, the selection of user-defined parameters including best kernel function
( , ) ( ). ( )i j i j
K x x x x (Smola & Schölkopf, 2004) for a specific problem, to obtain a
good generalization performance, is not normally direct and determines the performance
of an SVR model (Cherkassky & Ma, 2004). Investigators (Noble, 2006; Smola &
Schölkopf, 2004) have suggested many approaches such as “a statistically rigorous”
method of using cross-validation for optimal selection of kernel parameters.

54
According to Vapnik (1999b), any function that obeys Mercer’s condition can be used
as a valid kernel function. A list of commonly applied kernel function is a shown in Table
2.2.
Table 2.2: Common kernel functions.
Kernel type ( )i j
K x x Mathematical representation
Linear i jx x
Polynomial ( 1)d
i jx x
Gaussian (RBF) expd
i jx x
Sigmoid tanh( )i jx x r
Where, γ, r, and d are kernel parameters.
Therefore, the SVR modelling has been judged a viable alternative prediction or
estimation technique in comparison with both the traditional and other computational
intelligence modelling methods (Meyer et al., 2003; Osuna et al., 1997) even with a small
dataset (Zhao et al., 2015). For example, a recent evidence (Pochet & Suykens, 2006) also
suggested that SVR outperformed the traditional logistic regression model showing a
better generalization and higher performance in estimation or prediction tasks. In medical
related prediction applications, for example, SVR has been reported with a better
performance, as compared to multivariate linear regression, for prediction of tacrolimus
blood concentration in patients with liver transplant (Van Looy et al., 2007), and as
compared to an artificial neural network modelling for “simultaneous myoelectric control
of multiple degrees of freedom in some upper limb muscles” activities (Ameri et al.,
2014) at a computational speed that is useful for a real-time applications. In all, the
uniqueness of the datasets used in the present study, based on the SCI participants as well
as the area of application, is meant to advance the application of SVR modelling technique
in the biomechanics research and in the rehabilitation of clinical populations.

55
2.10 Summary
This Chapter has reviewed the literature on muscle responses following a SCI and the
NMES rehabilitation intervention that is often recommended. Furthermore, the Chapter
highlighted the limitation of the NMES technology. Specifically, the application of
NMES for lower limb rehabilitation as applied to the present thesis was also discussed to
gain a useful insight into the limitation of the current NMES technologies. Major NMES
feedback signal sources including EEMG and MMG were discussed with more attention
to MMG due to its relevance to the main objective of the thesis. As the MMG signal has
been recently promoted as a potential non-invasive and electrical stimulation artifact-free
NMES feedback signal source, the synthesis of the available knowledge on the potential
use of the signal as a feedback source was also presented. Furthermore, the Chapter
discussed the useful parameters of the MMG signal that could be used to intelligently
estimate muscle force using a SVR model.
Taken together, it could be inferred from the literature that there is a clear need for a
reliable proxy of muscle force for implementation of a closed-loop NMES system—
believed to promote the NMES technology among the clinicians and other allied
professional administering the technology as a treatment option in rehabilitation. On this
premise, the next Chapter (i.e. Chapter 3) is aimed at establishing the pattern of
relationship between MMG signal responses and NMES-evoked muscle force/torque in
healthy volunteers.

56
CHAPTER 3: DEVELOPMENT OF A HYBRID PROCEDURE TO ESTABLISH
MECHANOMYOGRAPHY AS A PROXY OF NMES-EVOKED TORQUE
3.1 Introduction
This study sought to elucidate specifically the relationship between
mechanomyographic (MMG) signals and torque production and to verify whether the
motor unit activation strategy (recruited motor unit and their firing rates) could be tracked
using MMG characteristics during incremental neuromuscular electrical stimulation
(NMES)-evoked isometric contractions in healthy volunteers. The rationale for this study
was that MMG signal measures muscle surface oscillation, due to the recruited muscle
fibre’s motor unit. This was based on the knowledge that electrically stimulated muscle
contractions allows one to measure and analyze the MMG signal generated in a controlled
settings as the contractions is mainly based on a “synchronous” recruitment of motor unit
(Orizio et al., 2003).
This Chapter describes a method for NMES-evoked isometric torque assessment in
healthy volunteers. Thereafter, an estimation of the knee torque from quadriceps muscle’s
MMG was demonstrated in eight healthy volunteers. The study described in this Chapter
is being reproduced under the open access license from a published article by the author:
Ibitoye, M. O., Hamzaid, N. A., Abdul Wahab, A. K., Hasnan, N., Olatunji, S. O., &
Davis, G. M. (2016). Estimation of Electrically-Evoked Knee Torque from
Mechanomyography Using Support Vector Regression. Sensors, 16 (7), 1115.
While the preliminary finding from this study was accepted for an oral presentation at
an IEEE Engineering in Medicine & Biology Society (EMBS) International Student
Conference (ISC) 2016, Carleton University, Ottawa, Canada.

57
3.2 Literature Review
The magnitude of the muscle force or joint torque generated during NMES-evoked
contractions has been used as a marker of physical performance in healthy volunteers
(Brocherie et al., 2005; Parker et al., 2003), as well as a benchmark of functional recovery
in persons with neurological conditions (Braz et al., 2009; Deley et al., 2015). To optimize
NMES technology in therapeutic and functional applications, real-time information about
the generated muscle force or joint torque, of the controlled limb, is vital (Braz et al.,
2009; Popović, 2014). Such information is required; (i) to automate the neuromuscular
stimulation characteristics based on the muscle state during the onset of fatigue, and (ii)
to modulate muscle forces based on the requirements of the task (therapeutic or
functional) to be performed, for example during sit-to-stand and sustained standing
perturbations. However, joint torque is often impractical or impossible to quantify
directly during real-time application of NMES (Popović, 2014). Estimation of joint torque
from readily available muscle characteristics (e.g., biopotentials of nerve and/or muscle
activation), particularly, from physical sensors has recently become both viable and
attractive (Popović, 2014).
One such neuromuscular biopotential is mechanomyographic signal (MMG), which
quantifies the mechanical equivalent of an electromyographic output generated during
muscle contractions (Orizio, 1993). The signal originates from the skeletal muscle
contractions due principally to the shortening of the muscle fibre length and an increase
in its diameter (Farina et al., 2008). The activation of muscle fibres and their dimensional
changes during muscle contractions creates pressure waves that can be detected on the
skin surface and translated into an acceleration obtained by physical sensors, such as an
accelerometer (Watakabe et al., 1998). The signal can reflect the extent of neuromuscular
contractions (Yuan-Ting et al., 1992) and has gained recent popularity due to its close
relationship with muscle force (Beck et al., 2004; Matheson et al., 1997). Specifically,

58
the signal is directly related to the two main force-generating mechanisms of human
skeletal muscle—magnitude and pattern of motor unit recruitment and their firing
rates/frequency (Beck et al., 2004; Youn & Kim, 2010).
Moreover, due to the convenience of MMG signal collection, its insusceptibility to
skin impedance (Alves & Chau, 2010a), flexibility of its sensing technology (Ibitoye et
al., 2014; Silva et al., 2005), and immunity from electrical stimulation artifacts associated
with NMES (Orizio et al., 1999), the signal has been successfully used to classify muscle
activity for specific application in controlling prostheses (Hong-Bo et al., 2009), and as a
control signal for muscle machine interfaces (Barry et al., 1986; Silva et al., 2005). In
addition, during NMES-evoked muscle contractions, MMG signal has been used to track
muscle fatigue in healthy volunteers (Gobbo et al., 2006). Thus, the signal may be used
to estimate muscle force during voluntary and NMES-evoked muscle contractions
(Ibitoye et al., 2014).
However, relating MMG signals as a direct proxy for NMES-evoked muscle force can
be practically challenging due to the complexity and diversity of the recruitment of
muscle’s motor units (Hong-Bo et al., 2009; Orizio, 1993). Accordingly, the application
of computational intelligence or machine-learning techniques for quantification of muscle
force via joint torque from MMG signals has been proposed through statistical predictive
modelling, and then validated during voluntary contractions (Xie et al., 2009; Youn &
Kim, 2010).
The use of machine-learning techniques has recently shown promise in estimation,
prediction and classification tasks. For example, Youn and Kim (2010, 2011) used an
artificial neural network (ANN) model to estimate elbow flexion force from MMG during
voluntary isometric contractions. The investigators obtained an estimation accuracy of up
to 0.892 (Youn & Kim, 2010) and 0.883 (Youn & Kim, 2011) in terms of cross-
59
correlation coefficient, and suggested the future application of other machine learning
techniques including Support Vector Regression (SVR) for probable improvement of
their model’s estimation accuracy (Youn & Kim, 2011).
However, due to the advancement in the field of signal processing, several other
computational intelligence regression techniques have been proposed with SVR yielding
a good predictive and estimation accuracy, with often low Root Mean Square Errors
(RMSE) (Shamshirband et al., 2014) and outstanding performance (Xie et al., 2009).
Being an extension of a support vector machine learning technique, SVR is based on the
principles of computational intelligence modelling that is built on the kernel method,
whereby data are mapped into a higher dimensional space in order for the training dataset
to be linearly separable to facilitate the regression analysis (Vapnik et al., 1997). SVR
algorithms take into account the error approximation to a dataset with the ability to adapt
and improve the estimation capability of a model (Shamshirband et al., 2014), particularly
when the model is used to evaluate an additional dataset for the purpose of generalization
(Jiang & He, 2012; Yang et al., 2009).
Moreover, SVR is robust in handling multivariate processes and offsets the limitation
of traditional regression methods (Yu et al., 2010)—which cannot solve problems with
high dimensional input dataset (Vapnik et al., 1997). Additionally, the SVR modelling
only involves a solution to a “convex optimization problems”, and unlike ANN model, it
is not influenced by the “local minimal problem” (Ziai & Menon, 2011) and the network
structure needs not to be defined (Shamshirband et al., 2015). Thus, the SVR algorithms
could be used to build a generalized model and well suited for regression tasks (Vapnik
et al., 1997). Based on these strengths, the technique has been successfully deployed in
several fields of applications including physical therapy and rehabilitation engineering
during voluntary muscle activation (Xie et al., 2009), medical diagnosis (GÜler & Koçer,

60
2005), and a host of other related fields. However, to the author’s knowledge, SVR
modelling has not been previously used to construct a joint torque estimation model,
particularly, during electrically stimulated contractions.
The purpose of this study was, therefore, to apply SVR modelling to predict knee
extensor torques from MMG signal characteristics during NMES-evoked incremental
muscle contraction intensities. Since it has been suggested (Youn & Kim, 2010) that a
combination of muscle contraction signals and related characteristics could compliment
the estimation accuracy of joint torques, the input parameters (related to the muscle
contractions) to the SVR model were chosen (MMG signals, level of electrical stimulation
or contraction intensity, and knee angle) to estimate knee torque accurately. This
information is particularly applicable to research areas where a real-time proxy of muscle
force is sought.
3.3 Materials and Methods
3.3.1 Experimental Protocol
To validate the performance of the proposed SVR model, a calibrated commercial
dynamometer (System 4; Biodex Medical System, Shirley, NY, USA) was used to record
isometric knee torques produced by NMES-evoked muscle contractions of the knee
extensors (Figure 3.1). Eight healthy male volunteers aged 23.4 (1.3) year (mean (SD)),
body mass 70.4 (5.9) kg and height (1.72 (0.05)) m participated in this experiment. All
participants were in good physical condition and were duly informed about the study
protocol prior to giving their consents (see Appendix D or E). The study was approved
by the University of Malaya Medical Ethics Committee (Approval No: 1003.14 (1)) as
detailed in Appendix A.
As portrayed in Figure 3.1, the participants were set-up, as has been previously
described by Brown and Weir (2001) for voluntary isometric knee torque measurements.
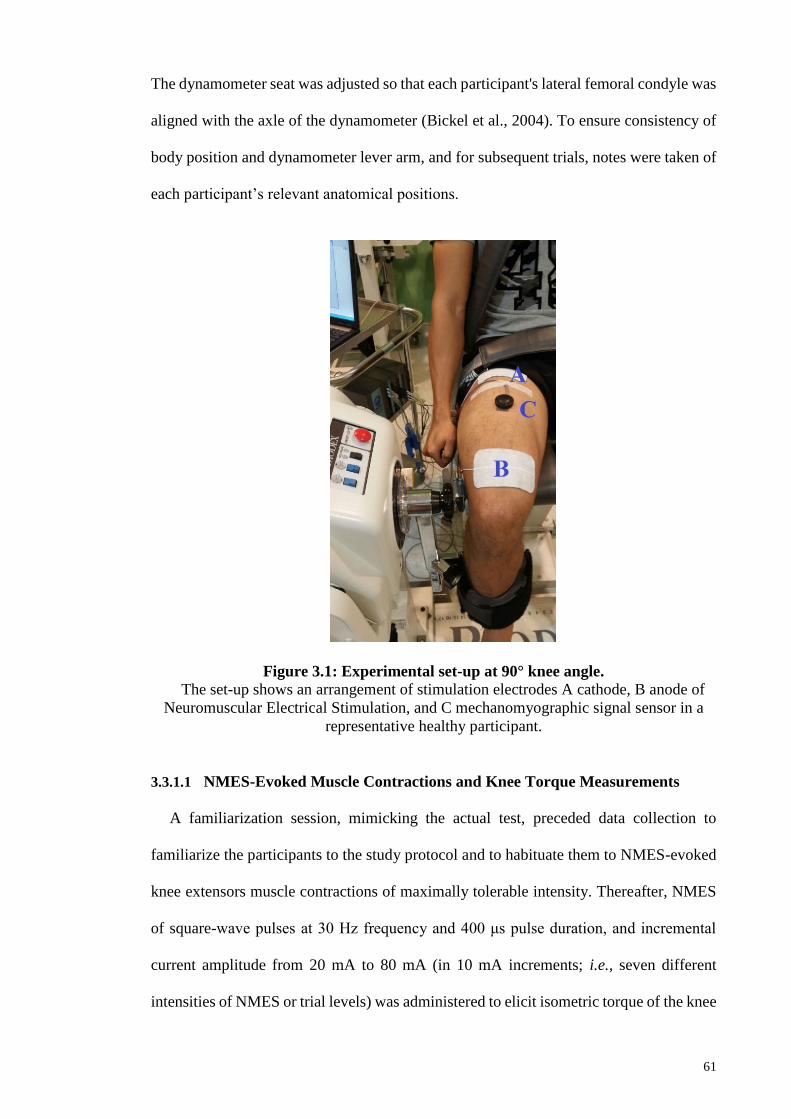
61
The dynamometer seat was adjusted so that each participant's lateral femoral condyle was
aligned with the axle of the dynamometer (Bickel et al., 2004). To ensure consistency of
body position and dynamometer lever arm, and for subsequent trials, notes were taken of
each participant’s relevant anatomical positions.
Figure 3.1: Experimental set-up at 90° knee angle.
The set-up shows an arrangement of stimulation electrodes A cathode, B anode of
Neuromuscular Electrical Stimulation, and C mechanomyographic signal sensor in a
representative healthy participant.
3.3.1.1 NMES-Evoked Muscle Contractions and Knee Torque Measurements
A familiarization session, mimicking the actual test, preceded data collection to
familiarize the participants to the study protocol and to habituate them to NMES-evoked
knee extensors muscle contractions of maximally tolerable intensity. Thereafter, NMES
of square-wave pulses at 30 Hz frequency and 400 μs pulse duration, and incremental
current amplitude from 20 mA to 80 mA (in 10 mA increments; i.e., seven different
intensities of NMES or trial levels) was administered to elicit isometric torque of the knee

62
extensors lasting 4 s (Orizio et al., 1992). Stimulation pulses were delivered through a
commercial computer-controlled neurostimulator (RehaStimTM, Hasomed GmbH,
Magdeburg, Germany) using 9 × 15 cm2 self-adhesive electrodes (Hasomed GmbH, D
39114, Magdeburg, Germany) on the dominant lower limb (Adams et al., 1993).
To preclude voluntary effort, the participants were carefully instructed not to assist or
resist NMES-evoked muscle contractions. A similar stimulation protocol has been used
for strength training with tolerable discomfort (Selkowitz, 1985) and without eliciting
rapid muscle fatigue (Babault et al., 2001). During each trial, the NMES-evoked torque
at maximum stimulation intensity (80 mA) was taken as the maximum NMES-evoked
peak torque (PT).
The PT value was used to normalize the submaximal contraction levels across
participants’ data. The adopted stimulation electrode position has been recommended by
Levin et al. (2000)—the anode electrode placed at “~ 5 cm proximal position to the patella
and the cathode electrode at ~ 8 cm distal to the inguinal area over the rectus femoris (RF)
muscle belly near the expected location of the motor points” (Figure 3.1). In order to
accommodate the effect of joint angle on the magnitude of joint torque (Ebersole et al.,
1998; Selkowitz, 1985), the experiment was conducted at three different randomized knee
angles: 30°, 60°, and 90° (where 0° represented full knee extension). A duration of 48 h
was allowed between each angle position, and there was a 10 min recovery between each
trial to minimize potential muscle fatigue.
3.3.1.2 MMG Acquisition and Processing
Simultaneous with the NMES-evoked torque, MMG signals were collected using an
accelerometer-based sensor (Sonostics BPS-II VMG transducer, sensitivity 50 V/g). As
shown in Figures 3.1 and 3.2, the sensor was attached directly to the muscle belly (i.e., at
the midpoint between the inguinal crease and the superior border of the patella (Ryan et

63
al., 2008) by means of double-sided adhesive tapes (3M Center St. Paul, MN, USA). The
MMG signals were collected from the RF muscle as a simple representation of the knee
extensors and a major contributor to the NMES-evoked knee torque production
(Shinohara et al., 1998). The signals were collected at 2 kHz sampling frequency and
were digitally band-pass filtered at 20–200 Hz (Goldenberg et al., 1991), amplified and
stored by AcqKnowledge data acquisition and analysis software (MP150, BIOPAC
Systems Inc., Santa Barbara, CA, USA) for offline analysis in the LabVIEW software
environment (version 12.0, National Instruments, Austin, TX, USA) using custom written
programs.
The peak torque values, MMG-root mean square (RMS) and peak to peak (PTP)
amplitudes were obtained during NMES-evoked isometric contractions from 2 s epoch of
the 4 s MMG and torque recordings (Katsavelis & Threlkeld, 2014) at each contraction
level across the three joint angles. The selected 2 s epoch of the signals coincided with
the middle position at which there was probable maximum muscle recruitment, without
on-transients or off-transients due to rise in force at the beginning and the end of muscle
contractions, respectively (Katsavelis & Threlkeld, 2014).

64
Figure 3.2: Schematic representation of the experimental setup.
Stimulation electrodes (A) cathode, (B) anode NMES electrodes, and (C) MMG
sensor.
To improve the model performance (Bray & Han, 2004), the MMG signals at each
contraction level were normalized (by the equivalent value of the MMG signal at the
highest stimulation intensity/ contraction level (80 mA)) and fed into the proposed SVR
model for training. Previous investigations (Beck et al., 2004; Orizio, 1993) have
validated the legitimacy of these MMG features for muscle force assessment, and,
therefore, they were equally used as joint torque predictors in this study.
3.3.2 Support Vector Regression Modelling Approach
SVR algorithm was proposed in this study because of its optimal predictive
performance even with a small dataset (Shin et al., 2005) and the ability to learn both
linear and non-linear relationships between predictors and outcome variables. Such
relationships have been used in establishing a pattern whereby unknown outcomes could
be predicted accurately (Vapnik et al., 1997; Xie et al., 2009). Theoretically, SVR is
derived from the statistical learning theory (Burges, 1998; Cortes & Vapnik, 1995) and
employs ε-insensitive loss function (Vapnik et al., 1997) which measures the flatness of
the generated pattern as well as maximum allowable deviations of the targets from the
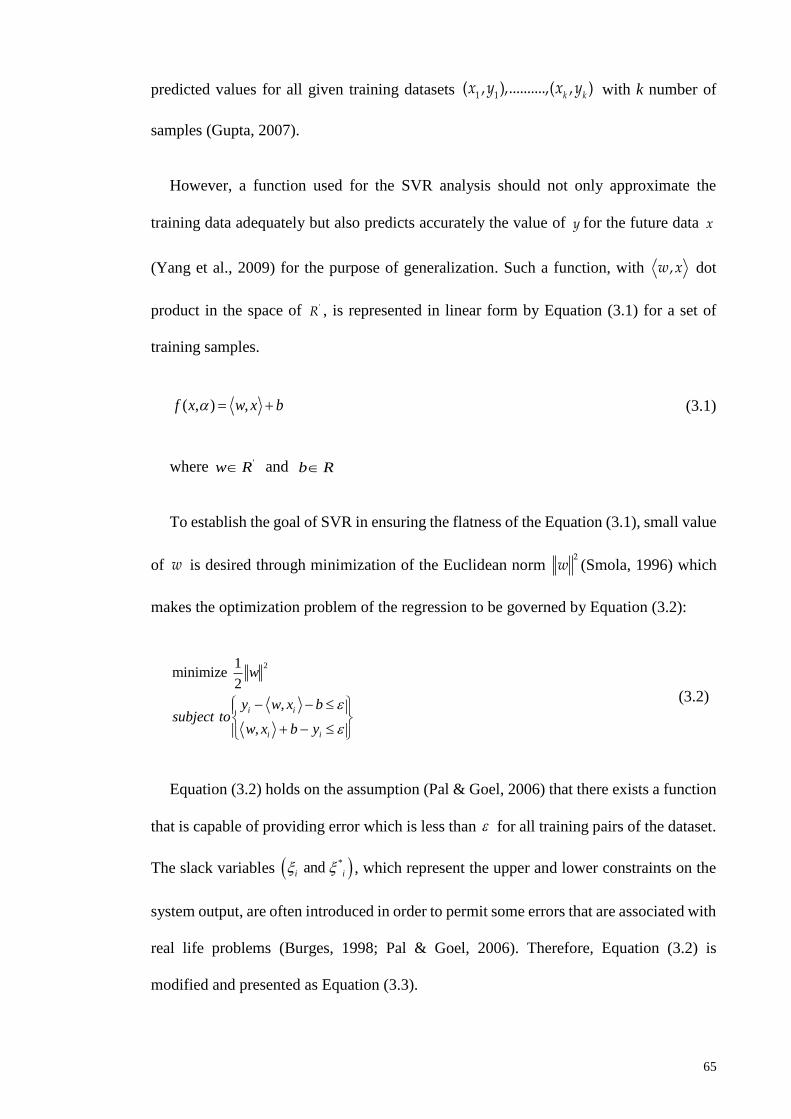
65
predicted values for all given training datasets 1 1( , ),..........,( , )
k kx y x y with k number of
samples (Gupta, 2007).
However, a function used for the SVR analysis should not only approximate the
training data adequately but also predicts accurately the value of y for the future data x
(Yang et al., 2009) for the purpose of generalization. Such a function, with ,w x dot
product in the space of 'R , is represented in linear form by Equation (3.1) for a set of
training samples.
( , ) ,f x w x b (3.1)
where 'w R and b R
To establish the goal of SVR in ensuring the flatness of the Equation (3.1), small value
of w is desired through minimization of the Euclidean norm 2
w (Smola, 1996) which
makes the optimization problem of the regression to be governed by Equation (3.2):
21minimize
2
,
,
i i
i i
w
y w x bsubject to
w x b y
(3.2)
Equation (3.2) holds on the assumption (Pal & Goel, 2006) that there exists a function
that is capable of providing error which is less than for all training pairs of the dataset.
The slack variables * and i i , which represent the upper and lower constraints on the
system output, are often introduced in order to permit some errors that are associated with
real life problems (Burges, 1998; Pal & Goel, 2006). Therefore, Equation (3.2) is
modified and presented as Equation (3.3).

66
2 *
1
*
*
1minimize
2
,
,
, 0 for all 1,2,......,
k
i i
i
i i i
i i i
i i
w C
y w x b
subject to w x b y
i k
(3.3)
The regularization parameter i.e. C is one of the user-defined parameters and also
indicates the tradeoff between the function’s flatness and the amount of permitted error
beyond ε- insensitive zone (Gupta, 2007). The optimization problem in Equation (3.3) is
better solved, through the -insensitive loss function, by using Lagrangian multipliers
* *( , , and )i i i i to transform the problem into dual space representation (Gupta, 2007;
Vapnik, 1999a). Therefore, the Lagrangian for the Equation (3.3) is presented in Equation
(3.4).
2 *
1 1
* * * *
1 1
1( ) ,
2
,
k k
i i i i i i
i i
k k
i i i i i i i i
i i
L w C y w x b
y w x b
(3.4)
It is easier to locate the saddle point of the Lagrangian function defined in Equation
(3.4) by equating the partial derivatives of the Lagrangian
*with respect to , , and w b
i i
to zero in order to obtain the expressions presented in
Equations (3.5) – (3.7):
*
1
.k
i i i
i
w x
(3.5)
i iC (3.6)
* *
i iC (3.7)

67
Thereafter, the optimization equation is maximized by substituting Equations (3.5) –
(3.7) in (3.4) to arrive at Equation (3.8):
* * * *
1 1 1 1
* *
1
1maximize - .
2
to 0, 0 and
k k k k
i i j j j i i i i i i
i j i i
k
i i i i
i
x x y
subject C
(3.8)
The solutions (* and i i ) obtained from Equation (3.8) are substituted in Equation
(3.1) and presented in Equation (3.9):
*( , ) ,1
kf x x x bi i i
i
(3.9)
However, since the concept of kernel function through ‘’kernel tricks’’ allows SVR to
solve non-linear problems by mapping the original non-linear data into higher
dimensional feature space where a linear model could be constructed (Lin et al., 2008), a
proper selection of kernel function allows optimization of SVR performance (Lin et al.,
2008). The regression function in feature space, after inserting the kernel function
,iK x x , could be written as presented in Equation (3.10).
*( , ) ,1
kf x K x x b
i i ii
(3.10)
As the kernel functions help in transforming datasets into hyperplane (Lin et al., 2008),
its variables determine the structure of high dimensional feature space which controls the
complexity of the final solution. As applied in the present study, Equations (3.11) – (3.14)
describe several kernel functions that are obtainable in the literature (Vapnik, 1999b)
which include Polynomial, Linear, Gaussian (radial basis function (RBF)) and Sigmoid,
respectively.

68
( , ) ( 1)dK x x x xi j i j
(3.11)
( , ) .TK x x x xi j i j (3.12)
( , ) expi j i j
dK x x x x (3.13)
( , ) tanh( )TK x x x x ri j i j
(3.14)
where , , r and d are kernel parameters and, ix and jx represent vectors in the input
space—vectors of features computed from training or testing subset (Shamshirband et al.,
2014).
3.3.2.1 Model Development
MATLAB software environment (Version 12, The MathWorks, Inc., Natick, MA,
USA) using SVR coding was used for the computational aspect of this research work.
Prior to the use of the dataset, the dataset was partitioned into two components to adhere
to the SVR modelling approach (Shamshirband et al., 2014)—a machine-learning
“training” subset and a “testing” subset in a ratio of 7:3, via stratified sampling to ensure
effective random partitioning (Akbani et al., 2004). Specifically, 70% of the dataset was
used for training and the remaining 30% was used for testing the SVR model via test-set
cross-validation method. This allowed a regression analysis to be performed on the
training dataset while estimating the future generalization accuracy, of the model, on the
remaining testing subset. For further detail on the working principle of the proposed SVR
model, readers are referred to Smola and Schölkopf (2004) and Vapnik et al. (1997).
3.3.2.2 Optimal Parameters Search Approach
The accuracy of an SVR model is dependent on the model parameters’ selection
(Shamshirband et al., 2014). However, due to the possibility of many different
combinations of SVR parameters, it is often difficult to obtain optimal SVR parameters

69
(Cherkassky & Ma, 2004). To solve this problem systematically, and in order to obtain
possible optimized parameters of SVR for an accurate estimation, a hybrid optimization
search technique, which has been recommended (Rıza, 2009), was adopted and a test-set
cross-validation technique was deployed (Owolabi et al., 2015).
Figure 3.3: Flow chart of the procedure for obtaining optimal parameters, as
shown in (Table 3.1), for the proposed SVR model.
The approach is as follows: for every partitioned training and testing subsets, the
performance measures were noted for the SVR parameters values including the

70
regularization parameter or factor C (bound on the Lagrangian multiplier),
(conditioning parameter for quadratic programming (QP) methods), ε (epsilon) and η
(kernel option) as well as the related kernel functions (Akande et al., 2015). Thereafter,
this computational step was repeated for every available SVR kernel function with an
incremental step of the parameters’ values. Parameters’ optimal values and the kernel
function associated with the best performance measure were identified. The search
procedures are presented summarily in Figure 3.3.
Table 3.1: Optimal parameters for the proposed Support Vector Regression
model.
C 879
Hyper-parameter (Lambda) 2−15
Epsilon ( ) 0.1205
kernel parameter 54
Kernel Gaussian (RBF)
A mathematical implementation (Akande et al., 2015) of the test-set cross-validation
technique is as described in Algorithm 3.1 as follows: 𝐾𝑖(𝑗) was defined where 𝐾 contains
all the available kernel functions (and 𝑖, 𝑗 and 𝑘, are the indexes for the kernel functions)
while 𝑖𝑦, 𝑗𝑦 and 𝑘𝑦 represent the indexes for optimal kernel function. The total number
of the available kernel function is represented by 𝑛𝑖. The maximum values of 𝐶 and η
were assumed to be 𝑛𝑗 and 𝑛𝑘, respectively. The recorded performance measures were
stored in 𝑝𝑓.
Algorithm 3.1: Optimal parameter search algorithm
𝐼𝑛𝑖𝑡𝑖𝑎𝑙𝑖𝑧𝑎𝑡𝑖𝑜𝑛; 𝑖𝑦 = 0, 𝑗𝑦 = 0, 𝑘𝑦 = 0, 𝑞𝑥 = 0
𝑓𝑜𝑟 𝑖 = 1: 𝑛𝑖 𝑓𝑜𝑟 𝑗 = 1: 𝑛𝑗 𝑝𝑓 = 𝑓(𝐾𝑖(𝑗)) 𝑓𝑜𝑟 𝑘 = 1: 𝑛𝑘 𝑝𝑓 = 𝑓(𝐾𝑖(𝑗)) [Performance measure for the present parameters combination]
𝑖𝑓 𝑝𝑓 𝑖𝑠 𝑏𝑒𝑡𝑡𝑒𝑟 𝑡ℎ𝑎𝑛 𝑞𝑥 𝑡ℎ𝑒𝑛 𝑞𝑥 = 𝑝𝑓 𝑖𝑦 = 𝑖, 𝑗𝑦 = 𝑗, 𝑘𝑦 = 𝑘 [𝑠𝑡𝑜𝑟𝑖𝑛𝑔 𝑡ℎ𝑒 𝑖𝑛𝑑𝑒𝑥 𝑜𝑓 𝑡ℎ𝑒 𝑏𝑒𝑠𝑡 𝑝𝑎𝑟𝑎𝑚𝑒𝑡𝑒𝑟] 𝑒𝑛𝑑 𝑒𝑛𝑑 𝑒𝑛𝑑

71
3.3.2.3 Model Statistical Performance Criteria
To evaluate the performance of the proposed model, common measures of association,
between the actual and the estimated values, were employed, including correlation
coefficient (r) and coefficient of determination (R2) to quantify the “goodness of fit’’, and
Root Mean Square Error (RMSE) to quantify the error of estimate. For further details on
their mathematical formulae, readers are referred to Youn and Kim (2011) and Olatunji
et al. (2014).
3.4 Results and Discussion
Table 3.2 describes the actual experimental dataset used in this study. The results of
the statistical analysis of the dataset are presented in Table 3.3. The suitability and
applicability of the chosen dataset are revealed from the mean, maximum value, median,
standard deviation, and minimum value. The MMG-RMS, MMG-PTP, level of electrical
stimulation or contraction intensity, and knee angle obtained experimentally were the
input to the SVR model to estimate the knee torque. Results of performance measures
obtained from the training and testing subsets are as shown in Table 3.4.
To the author’s knowledge, this is the first attempt to use an SVR modelling technique
for NMES-evoked knee torque estimation from MMG signals. The outcomes of the
developed SVR model (Table 3.4) indicated high correlation as well as low RMSE, and
the model could, therefore, be adjudged as accurate. Moreover, high accuracy of the
trained model, as evident by the coefficient of determination (R2 = 94%), in predicting
knee torque confirmed a reliable pattern between the predictors and the outcome which
might be otherwise difficult to learn using the classical multiple linear regression method
probably due to the concept of “curse of dimensionality” (Huang et al., 2006).

72
Table 3.2: Summary of the datasets.
Mechanomyographic signal (MMG) characteristics at seven Neuromuscular Electrical Stimulation (NMES) intensity levels, at three knee angles and
their respective peak torque values.
Stimulation
Intensity
(mA)
Knee Angle
30° 60° 90°
PT RMS PTP PT RMS PTP PT RMS PTP
20 13.9 (3.7) 14.7 (9.9) 23.6 (16.4) 4.1 (0.7) 17.4 (18.4) 21.7 (23.0) 4.3 (5.7) 20.4 (20.0) 22.0 (26.9)
30 23.3 (19.7) 51.9 (22.4) 55.8 (24.7) 9.7 (8.5) 37.4 (21.2) 38.7 (19.5) 11.0 (10.2) 51.3 (30.0) 50.8 (30.6)
40 58.2 (23.6) 75.3 (29.5) 73.54 (19.1) 27.6 (24.2) 77.7 (36.6) 65.88 (19.2) 21.4 (15.0) 93.4 (45.4) 84.0 (34.1)
50 76.6 (19.3) 84.2 (15.2) 85.04 (14.9) 51.5 (26.2) 82.6 (27.3) 72.7 (14.9) 40.7 (18.5) 115.7 (39.6) 101.0 (33.8)
60 86.1 (20.2) 104.9 (22.5) 94.86 (18.2) 74.7 (19.2) 94.9 (30.4) 85.27 (14.7) 62.1 (12.3) 104.3 (29.0) 101.1 (28.5)
70 91.1 (21.5) 100.2 (6.2) 98.34 (5.7) 91.0 (8.2) 88.1 (9.7) 90.57 (14.4) 84.2 (12.3) 118.5 (22.0) 113.2 (10.7)
80 100.0 (0) 100.0 (0) 100.0 (0) 100.0 (0) 100.0 (0) 100.0 (0) 100.0 (0) 100.0 (0) 100.0 (0)
Abbreviations: Stimulation Intensity—level of electrical stimulation or contraction intensity, PT—Peak torque, RMS—Normalized MMG-RMS%, PTP—Normalized MMG-PTP%. Values
are reported in mean (standard deviation) for N = 8.
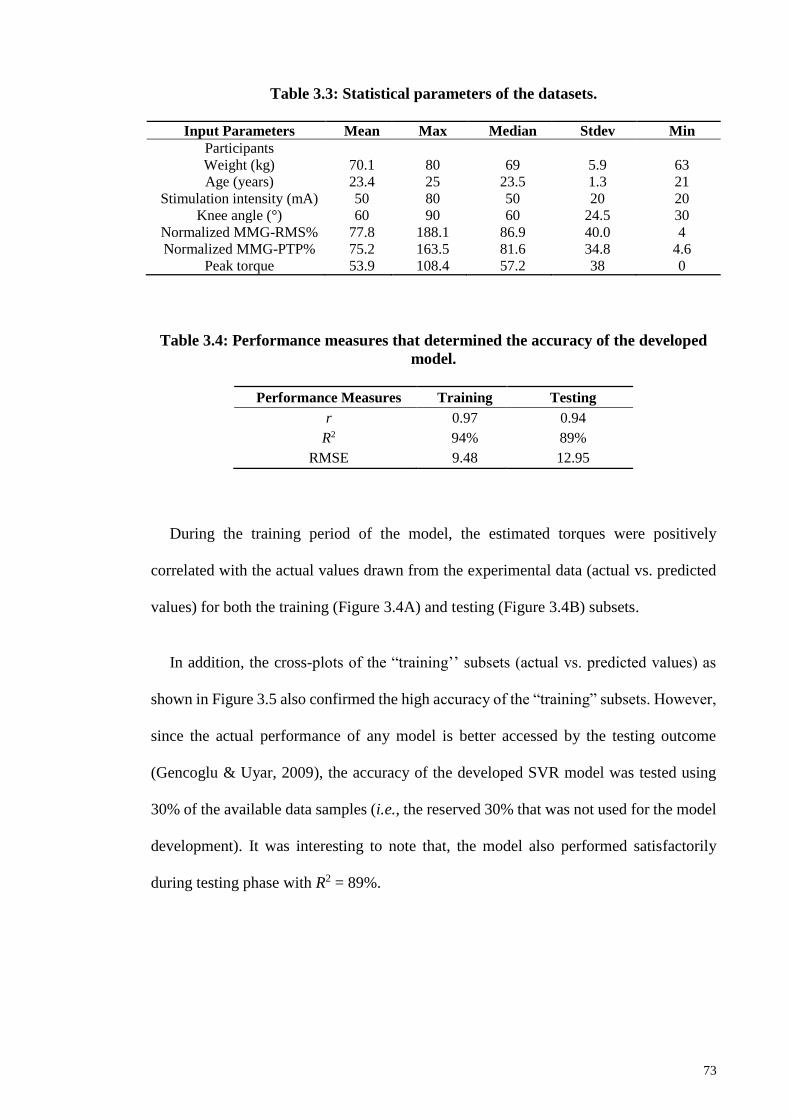
73
Table 3.3: Statistical parameters of the datasets.
Input Parameters Mean Max Median Stdev Min
Participants
Weight (kg) 70.1 80 69 5.9 63
Age (years) 23.4 25 23.5 1.3 21
Stimulation intensity (mA) 50 80 50 20 20
Knee angle (°) 60 90 60 24.5 30
Normalized MMG-RMS% 77.8 188.1 86.9 40.0 4
Normalized MMG-PTP% 75.2 163.5 81.6 34.8 4.6
Peak torque 53.9 108.4 57.2 38 0
Table 3.4: Performance measures that determined the accuracy of the developed
model.
Performance Measures Training Testing
r 0.97 0.94
R2 94% 89%
RMSE 9.48 12.95
During the training period of the model, the estimated torques were positively
correlated with the actual values drawn from the experimental data (actual vs. predicted
values) for both the training (Figure 3.4A) and testing (Figure 3.4B) subsets.
In addition, the cross-plots of the “training’’ subsets (actual vs. predicted values) as
shown in Figure 3.5 also confirmed the high accuracy of the “training” subsets. However,
since the actual performance of any model is better accessed by the testing outcome
(Gencoglu & Uyar, 2009), the accuracy of the developed SVR model was tested using
30% of the available data samples (i.e., the reserved 30% that was not used for the model
development). It was interesting to note that, the model also performed satisfactorily
during testing phase with R2 = 89%.

74
Figure 3.4: Plots of the correlation coefficients for the training (A) and testing; (B)
subsets.
Figure 3.5: Cross plots of training sets—actual vs. predicted values.
The plots show the performance of SVR with Gaussian kernel for torque prediction
on the training set.
This high correlation (r = 0.97; 0.94 for training and testing datasets, respectively) indicated
that the estimated knee torque by the SVR model was very close to the actual
experimentally recorded joint torque (from an isokinetic dynamometer) for each data
sample. For better visualization and understanding of the outcome of this study, the cross-
0
20
40
60
80
100
120
1 10 19 28 37 46 55 64 73 82 91 100 109 118
Norm
alz
ied
Pea
kT
orq
ue
Data Points
Actual valuesPredicted values

75
plot of testing sets (actual vs. predicted values) has been portrayed in Figure 3.6. The
level of accuracy in the testing phase (R2 = 89%) of the model development indicates that
the model is stable, efficient and not over-fitted. This was based on the suggestion of Tay
and Cao (2001) that an overfitted model could perform excellently on the training set (r
> 0.90) but will perform poorly on testing set (Tay & Cao, 2001). Therefore, the
developed SVR model in this study achieved a good performance for both training and
testing sets. These results are comparable to that of Youn and Kim (2011), where an
artificial neural network model has been successfully used to estimate elbow force during
voluntary contractions. Meanwhile, the potential of the SVR model for NMES-evoked
joint torque estimation, which has not been previously documented, has also been
demonstrated in the present study.
Figure 3.6: Cross plots of testing set—actual vs. predicted values.
The plots show the performance of SVR with Gaussian kernel for torque prediction
on the testing set.
Moreover, Figures 3.5 and 3.6 portrayed the closeness of the predicted torque by the
proposed SVR model to the actual experimental values. It could be noted that almost all
the predicted points fit exactly on the experimental point or at least fits very closely to the
target experimental point. Taken together, it could be inferred that the real-time knee
0
20
40
60
80
100
120
1 10 19 28 37 46
Norm
aliz
ed P
eak T
orq
ue
Data Point
Actual valuesPredicted values

76
torque information which is vital for the closed-loop implementation of NMES (Braz et
al., 2009; Popović, 2014) in physical therapy and rehabilitation engineering might be
reliably estimated by the proposed method. Nevertheless, the following limitations are
acknowledged in the study design: the performance of the developed model is limited to
the torque estimation during NMES-evoked isometric knee extension in healthy
volunteers. In the future studies, the performance of the model will be verified using
MMG signal and torque data from participants with neurological conditions. This will
allow us to examine and improve the performance of the model, and to derive clinically
relevant characteristics about the muscle force recruitment in the clinical populations.
3.5 Conclusion
Based on its previous estimation accuracy in relevant fields, SVR modelling was used
in this study through the integration of relevant variables to predict NMES-evoked knee
torque. The model was developed through training and testing via test-set cross-validation
technique with the experimental dataset partitioned into training and testing subsets.
Using the SVR methodology, the predicted knee torque was positively correlated with
the actual values drawn from the experimental data for the training subset. Thereafter, to
check the predictive ability of the model, the trained model was tested using the reserved
testing subset that was not used in model development. The model performance was
measured based on the correlation coefficient and RMSE. The outcomes from the
developed SVR model showed an accurate prediction of the knee torque, characterized
by a high coefficient of determination—up to 94% and 89%, and low RMSE of 9.48 and
12.95, for the training and testing cases, respectively. These results indicated a close
similarity between the estimated joint torque by the SVR model and the actual
experimental data obtained from the laboratory experiment. Additionally, the present
study has uniquely shown that an SVR model could estimate NMES-evoked knee torque,
77
generated by a synchronous modulation of muscle fibres’ motor units (Gregory & Bickel,
2005), from MMG signal in healthy volunteers. Therefore, the good performance
achieved in this study will motivate further studies in a similar direction to facilitate
accurate estimations of torque using datasets from clinical populations—in which the
NMES technology is more relevant, particularly among those with spinal cord injury.
Moreover, since SVR models can be adapted for classification tasks (Cortes & Vapnik,
1995); in the future, the developed model will be used to classify fresh and fatiguing
muscle contractions of knee extensors, from MMG signals, during standing and
ambulation tasks. Such models might offset the need to contend with the stimulation
artifacts (Braz et al., 2009; Popović, 2014) often encountered with the application of
surface EMG signal as NMES feedback source.

78
CHAPTER 4: MECHANOMYOGRAPHY AS A PROXY OF MUSCLE FORCE
DURING NMES-EVOKED KNEE EXTENSION TASK IN PERSONS WITH SCI
4.1 Introduction
Non-invasive estimation of muscle force is frequently sought in physical therapy and
rehabilitation engineering. Therefore, the evaluation of muscle performance through
torque production is used to grade the functional capability of a muscle in both healthy
and neurologically impaired persons. The work reported in this Chapter was designed to
apply the findings from healthy volunteers in persons with spinal cord injury (SCI). This
was necessary because, although healthy volunteers’ study was deemed required to
investigate the feasibility of the MMG signal to study NMES-evoked muscle response
and to learn about the safety of the experimental setting, such results cannot be
generalized or directly applied to study the muscle activities in persons with SCI (Scott
et al., 2007). This is as a result of the muscle paralysis in persons with SCI and the
consequent characteristics of an unusual fibre typing or distribution which may influence
their muscle responses to the neuromuscular provocation by electrical stimulation.
Therefore, this Chapter introduces a method for NMES-evoked isometric torque
assessment in persons with SCI and quantifies the degree of association between MMG
signals and isometric torque of the quadriceps muscle during incremental NMES-evoked
muscle contractions at various knee angles. The Chapter also investigates the reliability
of the MMG signals. The study described in this Chapter contains text from the author’s
published work reproduced with the permission from the publisher:
Ibitoye, M. O., Hamzaid, N. A., Hasnan, N., Abdul Wahab, A. K., Islam, M. A., Kean,
V. S. P., & Davis, G. M. (2016). Torque and mechanomyogram relationships during

79
electrically-evoked isometric quadriceps contractions in persons with spinal cord
injury. Medical Engineering & Physics, 38(8), 767-775.
4.2 Literature Review
The study of motor unit (MU) recruitment to evoke force production is of clinical
interest, particularly during NMES-evoked contractions of paretic or paralyzed muscles
in neurological populations (Levy et al., 1990). Incremental MU recruitment during
voluntary (Matheson et al., 1997; Orizio et al., 1989) and NMES-evoked contractions
(Petitjean et al., 1998) has been used to describe muscle force modulation in healthy
persons. However, while NMES-evoked contractions have been utilized for muscle force
production in persons with SCI (Nash, 2005), the mechanical and morphological changes
associated with muscle contractions in this population have been poorly understood.
To evaluate the effectiveness of NMES interventions, it is important to quantify
electrical stimulus-evoked muscle force. In particular, understanding motor recruitment
and muscle force characteristics could provide key insights about the contractile
properties of the muscle (Elek & Dengler, 1995) and this has important implications for
the use of NMES in rehabilitation. For example, measuring force or strength changes in
persons with SCI can provide evidence of recovery or deterioration of motor output, as
well as revealing the efficacy of rehabilitation interventions (Sisto & Dyson-Hudson,
2007). Beyond promoting the practical applications of NMES training in maintaining
‘muscle health’ (Shields et al., 2006), the ability to quantify an acute increase in muscle
force production following NMES exercise (Hornby et al., 2009) could widen the
application of this assistive technology in the clinical setting.
Traditionally, isokinetic dynamometers have been used to assess muscle force (via
joint torque) in a research setting, and they quantify torque throughout the limb range of

80
motion with acceptable reliability (Sisto & Dyson-Hudson, 2007). However, these
devices lack portability and are relatively expensive and cumbersome to deploy for
assessments in the clinical or home environment. The estimation of the muscle torque
from other muscle characteristics, particularly bio-potentials, becomes an attractive
option.
While an indirect estimation of torque production has been assessed using
electromyography (EEMG) (Merletti et al., 1992; Thompson et al., 2011), the signal’s
sensitivity to the external electromagnetic interference and skin impedance changes as a
result of perspiration (Yamamoto & Takano, 1994) presents significant limitations
(Orizio, 1993). Additionally, the reliability of EMG estimation of muscle torque
generation during NMES-evoked contractions remains debatable (Popović, 2014), largely
due to the size of stimulation artifact current in relation to the EMG signal (Merletti et al.,
1992). Thus, quantification of electrical stimulus-evoked force production by EMG alone
during neurostimulation is deficient (Levin et al., 2000).
A mechanical “counterpart” of the electrical activity of active motor units as measured
by EMG (i.e., muscle mechanomyogram; MMG) has been proposed for muscle torque
assessments (Alves et al., 2010; Beck et al., 2005). During skeletal muscle contractions,
the generated MMG signal is a function of the following mechanisms: “(i) a slow bulk
movement of the muscle at the initiation of the contraction, (ii) smaller subsequent lateral
oscillations occurring at the resonant frequencies of the muscle, and (iii) dimensional
changes of active muscle fibre” (Beck et al., 2005). Therefore, MMG reflects the
mechanical activity of physiological phenomena underlying muscle contractions. MMG
quantifies neuromuscular performance, and has been used to gain insights into muscle
capability during voluntary (Beck et al., 2005) and NMES-evoked contractions (Petitjean
et al., 1998).
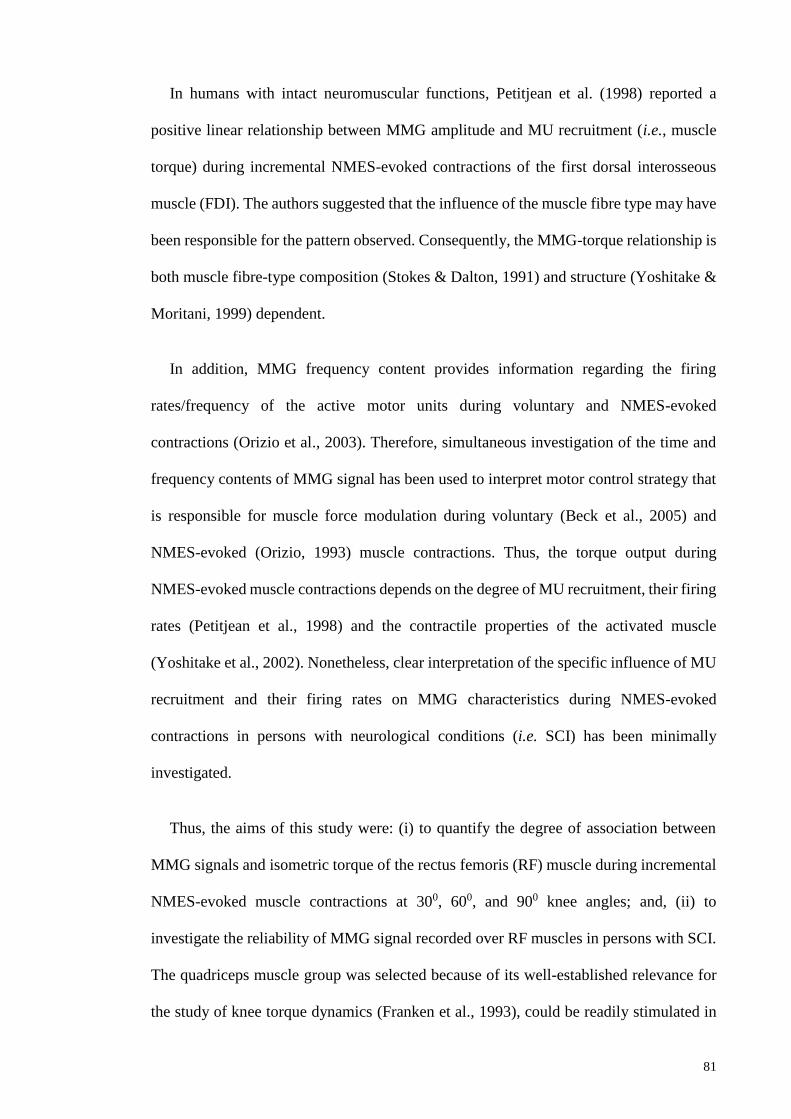
81
In humans with intact neuromuscular functions, Petitjean et al. (1998) reported a
positive linear relationship between MMG amplitude and MU recruitment (i.e., muscle
torque) during incremental NMES-evoked contractions of the first dorsal interosseous
muscle (FDI). The authors suggested that the influence of the muscle fibre type may have
been responsible for the pattern observed. Consequently, the MMG-torque relationship is
both muscle fibre-type composition (Stokes & Dalton, 1991) and structure (Yoshitake &
Moritani, 1999) dependent.
In addition, MMG frequency content provides information regarding the firing
rates/frequency of the active motor units during voluntary and NMES-evoked
contractions (Orizio et al., 2003). Therefore, simultaneous investigation of the time and
frequency contents of MMG signal has been used to interpret motor control strategy that
is responsible for muscle force modulation during voluntary (Beck et al., 2005) and
NMES-evoked (Orizio, 1993) muscle contractions. Thus, the torque output during
NMES-evoked muscle contractions depends on the degree of MU recruitment, their firing
rates (Petitjean et al., 1998) and the contractile properties of the activated muscle
(Yoshitake et al., 2002). Nonetheless, clear interpretation of the specific influence of MU
recruitment and their firing rates on MMG characteristics during NMES-evoked
contractions in persons with neurological conditions (i.e. SCI) has been minimally
investigated.
Thus, the aims of this study were: (i) to quantify the degree of association between
MMG signals and isometric torque of the rectus femoris (RF) muscle during incremental
NMES-evoked muscle contractions at 300, 600, and 900 knee angles; and, (ii) to
investigate the reliability of MMG signal recorded over RF muscles in persons with SCI.
The quadriceps muscle group was selected because of its well-established relevance for
the study of knee torque dynamics (Franken et al., 1993), could be readily stimulated in

82
persons with SCI (Gerrits et al., 2005), and could be easily compared with existing data
on voluntary contractions (Shinohara et al., 1998; Stokes & Dalton, 1991). RF was
selected to represent the quadriceps group because it is the major contributor to the
NMES-evoked quadriceps muscle torque production during knee extension (Richardson
et al., 1998; Shinohara et al., 1998). To the author’s knowledge, no previous studies have
reported the relationship between MMG parameters and the quadriceps torque production
during incremental NMES-evoked isometric contractions in persons with SCI.
It was hypothesized that the MMG signal would be a reliable proxy of incremental
torque production since a positive linear relationship has been previously demonstrated
in FDI, which is of comparable muscle fibre morphology to the quadriceps (Petitjean et
al., 1998) with a predominance of type II fibres in this muscle group after SCI (Gerrits et
al., 2005). Furthermore, a significant correlation between the MMG signal and muscle
torque production would a priori support the validity of the signal as a proxy of muscle
performance/torque, particularly when a direct measurement of torque might be
impractical (Popović, 2014), such as in activities of daily living.
4.3 Materials and Methods
4.3.1 Participants
Nine chronic motor complete (American Spinal Injury Association Impairment Scale
A and B) SCI (Kirshblum et al., 2011) participants with neurological lesions below C4
were recruited at the Department of Rehabilitation Medicine, University of Malaya
Medical Centre (UMMC), Kuala Lumpur, Malaysia. Their written informed consent (see
Appendix D or E) was obtained after a full disclosure of the rationale and procedures of
the experiment in compliance with the University of Malaya Medical Ethics Committee’s
approval (Approval No: 1003.14 (1)) as detailed in Appendix A) based on the declaration
of Helsinki. They were duly informed about the possible sources and discomforts of the

83
dynamometer assessment and electrical stimulation and were advised of their rights of
withdrawal from the study at any time. Persons with severe spasticity, joint contracture
or lower motor neuron lesion that might adversely affect the production of modest
quadriceps torque were excluded from participation. Also excluded were any participants
who, as a result of incremental NMES current amplitude, produced no relative increase
in their stimulus-evoked torque values.
Of the nine participants recruited at the outset, only seven successfully completed the
full test battery. However, a further participant was excluded due to lack of increase in
relative torque in response to increasing NMES current intensity. Therefore, the data of
the remaining six participants (Table 4.1) has been included for analysis. All participants
retained quadriceps spinal reflexes, and they could sit up on a dynamometer’s chair with
backrest. As part of clinical conditioning exercises (Bickel et al., 2004), at the time of the
investigation, participants were already involved in NMES cycle training (2 to 3 times
per week for at least 7 weeks) but were asked to refrain from the training for at least 48
hours before testing.
Table 4.1: Participants’ Physical Characteristics
Participants Gender Age (y) Body mass (Kg) Height (m) NLL AIS TSI (Yrs.)
1 M 49 79.6 1.74 T1 A 11
2 F 47 82.0 1.62 T4 B 24
3 M 28 62.4 1.71 C7 B 14
4 M 44 71.6 1.79 C6/C7 B 2.5
5 M 34 75.9 1.70 C6 A 17
6 M 33 44.0 1.71 C5/C6 A 13
Mean± SD 39.2±7.9 69.3±12.9 1.71±0.05 13.6±6.5
Abbreviation: NLL- Neurological lesion level, AIS- American Spinal Injury Association Impairment Scale,
TSI- Time since injury, F-Female, M-Male.

84
4.3.2 Experimental Protocol
Participants were secured to a calibrated isokinetic dynamometer (System 4; Biodex
Medical Systems, Shirley, NY, USA) by an inextensible restraining straps over the thigh,
pelvis and the trunk to minimize extraneous movements (Brown & Weir, 2001) and to
ensure only isometric contractions of the quadriceps could be performed (Bickel et al.,
2004) as depicted in Figure 4.1. Based on safety considerations of not putting bone health
at risk (Hartkopp et al., 1998), and to analyze the muscle torque in a range that will mimic
functionally relevant mode such as in standing up, the maximal torque calculations based
on the empirical data of Kagaya et al. (1995) was utilized. Those investigators suggested
that the knee extensor moment/ torque should not exceed that required for NMES
supported standing in persons with SCI.
Thus, careful attempts were made to keep the NMES-evoked muscle torque production
within a range that would not risk bone integrity. Although none of the participants could
be NMES-provoked to produce the maximum torque, the maximum torque production in
each participant was limited to 75 Nm as suggested by Gerrits et al. (2005).
4.3.3 Familiarization
A familiarization session was conducted (at least a day prior to testing) to acquaint
participants with the NMES-evoked isometric assessment procedures on the
dynamometer. Thereafter, participants attended the laboratory on two different test days,
separated by 48 hours, for each of the knee angles assessed, to quantify test-retest
reliability.

85
Figure 4.1: Experimental set-up showing the MMG and NMES electrode
placement over the quadriceps muscle in a representative participant with SCI.
Letters A and B are the cathode and anode electrodes, respectively, of the
neuromuscular electrical stimulator while C represents the MMG sensor.
4.3.4 Stimulation Protocol
Through palpation and visual inspection, the isolated activation of knee extensors was
ensured to establish that the muscle activation was primarily from quadriceps (Adams et
al., 1993), using 9 cm×15 cm self-adhesive stimulating electrodes (Hasomed GmbH, D
39114 Magdeburg, Germany). The cathode NMES electrode was placed 8 cm distal to
the inguinal area, over the RF belly near the expected location of the motor points (Botter
et al., 2011), and the position of electrode was then slightly adjusted to a location whereby

86
the maximal response, based on a palpable muscle response and force production, to the
stimulation could be identified. The anode electrode was affixed 5 cm proximal to the
patella as recommended by Levin et al. (2000). For both the distal and proximal
anatomical landmarks, motor points represent the location where the motor branch of a
nerve accesses the muscle belly whereby the maximal muscle force could be possibly
obtained for a given electrical stimulus (Botter et al., 2011; Sung et al., 2003). Indelible
marker was used to identify the electrode position for accurate placement between trials
and testing days.
NMES was used to evoke isometric contractions of the knee extensors with the hip
flexed at about 900, and the knee flexed to 900, 600 or 300 according to the study’s
protocol. NMES electrodes were connected to a neuromuscular stimulator delivering
square-wave pulses of current amplitude between 50-120 mA. During each electrical
stimulus-evoked contraction, a train of electrical stimulation (i.e., repeated bursts of
pulses at 30Hz, and 400μs pulse duration, with increasing stimulation amplitude (mA);
RehaStimTM, Hasomed GmbH, Magdeburg, Germany) was imposed to potentiate the
quadriceps activation.
4.3.5 Measurements
4.3.5.1 NMES-evoked isometric torque measurement
Following submaximal warm-up trials wherein the muscle belly was palpated to
ensure accurate MMG sensor fixation, 4s of randomly ordered NMES-evoked
submaximal-to-maximal torque levels were imposed on the participants’ quadriceps
muscle at 300, 600, or 900 knee angles (00 = full knee extension). The incremental torque
was evoked by stimulation intensity from 50 mA to 120 mA in 10 mA increments for
each participant. Previous studies have shown that this protocol elicits optimized
outcomes as it does not evoke premature muscle fatigue (Bickel et al., 2004). Torque

87
production (Nm) was quantified in real-time by the dynamometer and data were ‘gravity-
corrected’ by subtracting the passive torque produced by the leg mass affixed to the level
arm. This was effected automatically following the positioning of the knee angle at 450
from the full knee extension angle (00) while each participant was instructed to remain
relaxed. The recorded limb weight was automatically used by the dynamometer to “negate
the gravity effect” on the collected torque data (Biodex (V.4X) operation manual). To
eliminate any order effect, the administration of contraction intensities (mA) and knee
angles were randomized. A 10-min recovery was allowed between trials to reduce the risk
of cumulative muscle fatigue (Thomas et al., 2003).
4.3.5.2 MMG measurements
Simultaneously with the torque measurement, MMG signals from the RF were
obtained using an accelerometer-based vibromyographic sensor (Sonostics BPS-II VMG
transducer, compatible with Biopac MP150 platform, sensitivity 50 V/g) attached by
means of double-sided adhesive tapes (3M Center St. Paul, MN, USA) (Barry, 1992)
directly on the muscle belly (i.e., at the midpoint between the inguinal crease and the
superior border of the patella (Ryan et al., 2008)), in order to obtain the maximum muscle
surface oscillation (Figure 4.1). Before attaching the MMG sensor, the skin was shaved
(as needed) and cleaned with alcohol swabs. As it was sometimes difficult to identify the
precise location of the quadriceps’ muscle belly (due to muscle atrophy and adipose tissue
thickening), the determination of the MMG sensor location was assisted by electrical
stimulation of the muscle. During this procedure, a stimulation current amplitude of 50
mA (pulse width = 400µs, frequency = 30Hz) was administered to identify the probable
muscle belly by visual inspection and palpation. This location was standardized for
subsequent trials by indelible marker. An example of the pattern of MMG signals and the
torque production during NMES-evoked muscle contractions is as shown in Figure 4.2.

88
4.3.6 Signal Processing
Signals were acquired and analyzed using AcqKnowledge data acquisition and
analysis software (MP150, BIOPAC Systems, Santa Barbara, CA, Inc. USA) and a
customized programme in LabVIEW (Version 12.0, National Instruments, Austin, TX,
USA). The raw MMG signals were acquired at a sampling rate of 2 kHz and digitally
band-pass filtered (20-200 Hz), to suppress the influence of artifacts associated with
tremor and body movement (Goldenberg et al., 1991; Szumilas et al., 2015), for offline
analysis. The peak torque (PT) obtained from a dynamometer was calculated for each
NMES-evoked contraction level/stimulation intensity. The PT of the participants, MMG
root mean square (MMG-RMS), peak-to-peak (MMG-PTP) amplitude and MMG
frequency characteristic—peak frequency (MMG-PF) were extracted from the NMES-
evoked isometric contraction measurement from 1 s epoch of MMG signal around the
peak torque (location of probable maximum muscle recruitment) at each contraction
intensity level.
The middle 1 s epoch was selected to avoid the on-transient due to a rise in force at
the beginning and off-transient during the end of muscle contractions (Katsavelis &
Threlkeld, 2014). The PT value and the MMG parameters at maximum stimulation
intensity (120 mA) were used to normalize their relative submaximal values, at each knee
flexion angle, to allow for comparison between participants.

89
Figure 4.2: Simultaneous recordings of repetitive NMES-evoked torque and raw
MMG signal from RF at stimulation current of 90 mA and 600 knee flexion angle
from a representative participant.
4.3.7 Statistical Analysis
The test-retest reliability of measurements between days was quantified by intraclass
correlation coefficient (ICC), using a twoway mixed effects model, and standard error of
measurements (SEM%) (Weir, 2005) calculated as a percentage of relative mean values
(i.e., in order to examine the relative and absolute consistency of the parameters).
Thereafter, paired samples t-tests were performed on the dependent variables to determine
whether there was a significant mean difference between the test and retest scores. A data
normality test was conducted using Shapiro-Wilk statistic, and the data were normally
distributed except for a few (i.e., peak torque at 600 knee angle) that were skewed
probably due to the study’s small sample size (Table 4.2).

90
Based on the recommendation of Munro (2005), the interpretation of the ICCs were as
follows: >0.90, very high reliability; 0.70–0.89, high reliability; 0.50–0.69, moderate
reliability. The significant association between the NMES-evoked torque vs. stimulation
intensity, MMG-RMS vs. NMES-evoked torque, and MMG-PTP vs. stimulation intensity
(at 8 levels of torque production) was investigated using Pearson’s correlation coefficient
(r) (Stokes & Dalton, 1991). Prior to the analyses, MMG data were expressed as a
percentage of their values at maximum stimulation intensity level (Stokes & Dalton,
1991). A statistical software package (IBM SPSS for Windows Version 20, NY, USA)
and Microsoft Office Excel 2013 (Microsoft, Redmond, WA, USA) were used for data
analyses. A significant level of alpha (α) < 0.05 was set a priori for all statistical tests.
4.4 Results
After completing the full test battery and with one participant, out of seven, meeting
exclusion criteria, six participants, whose physical characteristics appeared in Table 4.1,
were included in the analyses presented herein.
4.4.1 Reliability
In Table 4.2, the ICC, SEM% and their respective probabilities for all the investigated
parameters were presented. Based on the normative categories previously described, ICC
ranged from “moderate to very high reliability” (i.e., 0.65 to 0.97). For SEM%, the values
ranged from 10.1 to 31.6% of their relative mean values. Paired sample t-tests indicated
that there were no significant differences between the mean values of any parameters (P>
0.05).

91
Table 4.2: Test–retest reliability of torque and MMG measures.
Probabilities (P-values) were obtained from paired t-test between trials. Standard
error of measurements (SEM) was expressed as a percentage of mean values. Shapiro-
Wilk (W) and its probability have been reported as a measure of normal distribution. PT
represents NMES-evoked peak torque.
Knee angle
Inter-day
Parameters
ICC
SEM%
P-value
Shapiro-Wilk
(W); P-value
300
PT 0.82 31.6 0.843 (0.961); 0.187
MMG-RMS 0.79 15.5 0.080 (0.975); 0.504
MMG-PTP 0.72 17.1 0.064 (0.972); 0.414
600
PT 0.97 11.4 0.996 (0.908); 0.001
MMG-RMS 0.77 22.6 0.277 (0.947); 0.058
MMG-PTP 0.73 21.3 0.490 (0.964); 0.227
900
PT 0.97 10.1 0.370 (0.082); 0.120
MMG-RMS 0.65 18.2 0.091 (0.983); 0.720
MMG-PTP 0.67 15.7 0.219 (0.972); 0.412
4.4.2 Torque Production
Figure 4.3 illustrates MMG recordings at 50 mA (low torque production) and 100 mA
(high torque production) and the corresponding spectra responses at 600 knee angle.
Figure 4.4 shows significant (P< 0.05) positive relationships between NMES-evoked
torques as a function of stimulation intensity (mA) for all the three knee angles.
4.4.3 MMG and Contraction Intensity
Figure 4.5 depicts significant (P< 0.05) positive correlations between the normalized
MMG-RMS and NMES-evoked torque expressed in %PT (20, 40, 60, 80 and 100% PT)
for 300, 600 and 900 knee angles at eight levels of contraction intensities (50, 60, 70, 80,
90, 100, 110, 120 mA).
In Figure 4.6, the relationship between MMG-PTP and stimulation intensity at the
three knee angles were shown. There were statistically significant (P< 0.05) positive

92
correlations between the two parameters at 300 (r= 0.792); 600 (r= 0.819); and 900 (r=
0.668) knee angles.
Figure 4.3: MMG recordings of RF at 50mA (A) and 100mA (B) neurostimulation
current amplitude and the corresponding spectra at 600 knee flexion angle.
The MMG-PF approximated the stimulation frequency of 30 Hz at both 50 mA and
100 mA contraction intensity levels, however, harmonics of the peak frequency
characterizes the stimulation intensity of 100 mA.
4.5 Discussion
To the author’s knowledge, this is the first study to investigate the degree of
association between mechanomyographic characteristics and isometric NMES-evoked
muscle torque in persons with motor ‘complete’ SCI. A moderate to very high test-retest
reliability, together with strong, positive correlations between the MMG signal and
contraction/stimulation intensity indicated that the underlying muscle mechanical
changes could be reliably tracked by the MMG signal. This finding was in agreement
with a previous investigation (Yoshitake et al., 2002) in healthy volunteers, and suggested
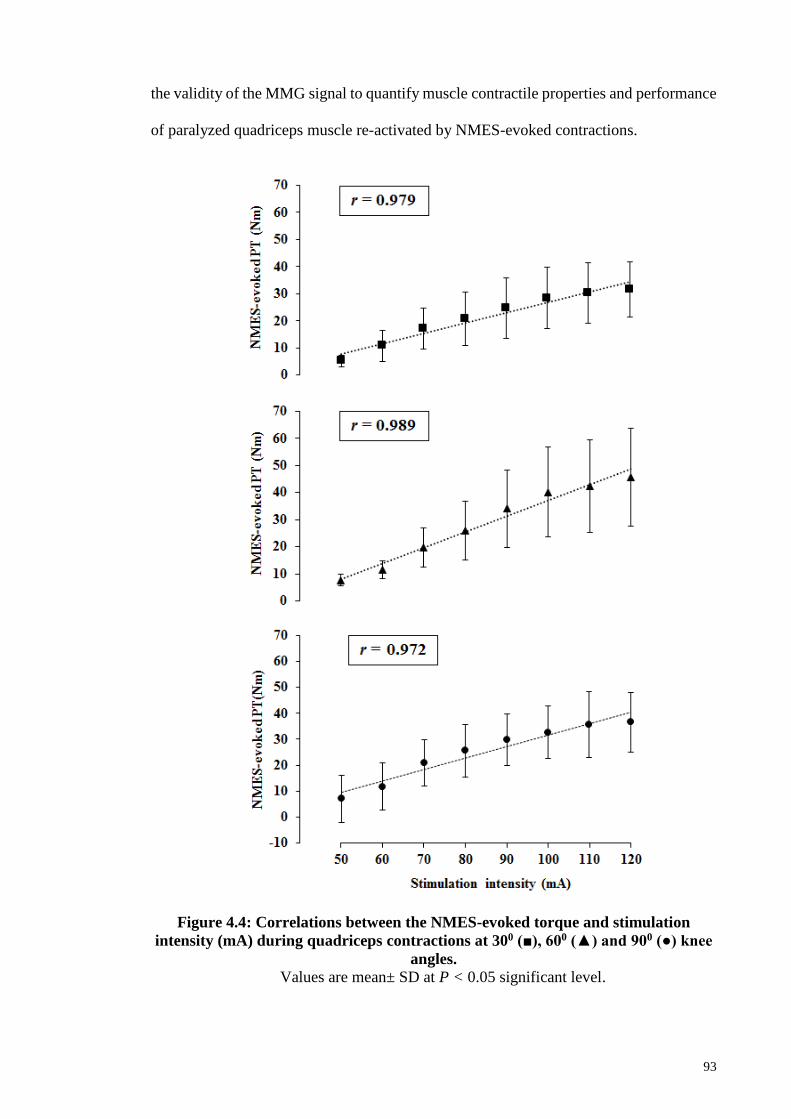
93
the validity of the MMG signal to quantify muscle contractile properties and performance
of paralyzed quadriceps muscle re-activated by NMES-evoked contractions.
Figure 4.4: Correlations between the NMES-evoked torque and stimulation
intensity (mA) during quadriceps contractions at 300 (■), 600 (▲) and 900 (●) knee
angles.
Values are mean± SD at P < 0.05 significant level.

94
4.5.1 MMG Sensor Reliability
In the present study, two measures of MMG amplitude (MMG-RMS and MMG-PTP)
demonstrated a comparable level of relative (ICC) and absolute (SEM) reliability (Table
4.2). Therefore, while MMG-RMS has been more widely used to ‘track’ muscle effort,
MMG-PTP could similarly follow the underlying mechanical changes reliably during
NMES-evoked contractions. This may justify why recent investigations (Cè et al., 2013;
Gobbo et al., 2006) have adopted the MMG-PTP parameter to track NMES-evoked
muscle fatiguing contractions in healthy volunteers. Additionally, based on the
assumption (Currier, 1984; Pincivero et al., 1997) that ICC greater than 0.8 could be
considered good enough for clinical applications, the findings from the present study
provide an insight into the potential clinical efficacy of the MMG signal for real-time
muscle performance grading during NMES-evoked contraction activities.
4.5.2 NMES-Evoked Torque Production
The NMES-evoked torque production was shown to be reliable between test days
(Table 4.2) and varied among knee angles. This is in agreement with a previous
investigation by Sinclair et al. (2006). The reduction in the torque production at the
extreme knee angles may be due to a smaller active working range of muscle fibres—
reduced fibre length (Gerrits et al., 2005). These results are in good agreement with those
studies (Gerrits et al., 2005; Kulig et al., 1984; Sinclair et al., 2006), which suggested that
muscle torque-generating capacity is knee angle dependent, in part due to the variation in
fibre type composition following SCI and orientation as a function of the change in
muscle length (Gerrits et al., 2005).

95
Figure 4.5: Correlations between the normalized MMG-RMS as a function of
%PT during quadriceps NMES-evoked contractions at 300 (■), 600 (▲) and 900 (●)
knee angles.
Data are eight levels of contraction intensities and values are mean ± SD at P < 0.05
significant level.

96
4.5.3 Mechanomyographic Responses to NMES-Evoked Isometric Torque
4.5.3.1 MMG amplitude
MMG-RMS provides physiological information about the activated MU recruitment
of muscle fibres (Beck et al., 2005; Orizio et al., 2003). The MMG recordings during
NMES-evoked torque production showed positive linear MMG versus torque
relationships for the paralyzed quadriceps muscles. Previous studies (Barry, 1992; Beck
et al., 2005; Gobbo et al., 2006; Munro, 2005; Petitjean et al., 1998; Yoshitake &
Moritani, 1999) have demonstrated strong positive linear or non-linear correlations
between MMG signal parameters and NMES-evoked isometric torque in healthy persons.
To the author’s knowledge, only a single investigation (Decker et al., 2010) has utilized
MMG amplitude to quantify NMES-evoked contraction levels based on cycling ride time
in quadriceps muscle of spinally injured persons. However, the present study has uniquely
investigated the relationship between MMG amplitude and NMES-evoked isometric
torque at submaximal-to-maximal contraction intensity levels in order to infer
characteristics about torque production in a SCI population. Such information may be of
a practical application during NMES supported sit-to-stand, standing, prolonged stance
or stepping tasks where a direct measurement of muscle force/torque is necessary for
fatigue estimation but it is impractical to measure with a dynamometer.
Although the torque values obtained in the present investigation were much lower
when compared with the previously reported data on voluntary quadriceps contractions
(Ebersole et al., 1998; Stokes & Dalton, 1991), MMG amplitude in the present study
comparably tracked the incremental NMES-evoked torque production. This suggests that
the sensitivity of MMG amplitude to the NMES-evoked muscle contractions is
independent of the level of torque production. Furthermore, the pattern of MMG
amplitude response was in good agreement with the previously reported patterns in

97
healthy volunteers (Petitjean et al., 1998; Yoshitake & Moritani, 1999; Yoshitake et al.,
2002).
Figure 4.6: Correlations between the normalized MMG-PTP and stimulation
intensity (mA) during quadriceps NMES-evoked contractions at 300 (■), 600 (▲)
and 900 (●) knee angles.
Values are mean± SD at P < 0.05 significant level.

98
Specifically, MMG-RMS increased linearly up to 80 %PT (for the investigated knee
angles) before the appearance of plateau due to the muscle stiffness and associated force
fusion—a manifestation of muscle mechanical changes during contractions (Orizio, 1993;
Yoshitake et al., 2002). This result suggests a possibility that MMG amplitude follows
the contraction intensity independently of knee angle up to ~80 %PT. This might be
sufficient for the implementation of a muscle performance feedback in situations where
torque information is required to modulate NMES-evoked contractions in order to
optimize its functional outcomes in persons with SCI as previously suggested by Gobbo
et al. (2006).
Furthermore, MMG-PTP amplitude has equally been used to monitor the muscle
mechanical changes i.e., “the viscoelastic characteristics of the series elastic component”
(Esposito et al., 2011) during NMES-evoked muscle contractions (Petitjean et al., 1998).
Petitjean et al. (1998) has previously established a positive linear relationship between
MMG-PTP and stimulation intensity in FDI and demonstrated that MMG-PTP could
reflect the summation of the contracting MU. The authors suggested an orderly
recruitment of the MU as the reason behind their observation. The present results confirm
this finding and showed a comparable correlation between the MMG-PTP and stimulation
intensity at the three knee angles investigated. In all, MMG-RMS and MMG-PTP may be
used as conjoint proxies of muscle force.
4.5.3.2 MMG frequency
Unlike involuntary muscle contractions (Cescon et al., 2004), the increase in
contraction intensity did not appear to influence the MMG peak frequency during NMES-
evoked muscle contractions. At higher stimulation intensity/torque level, multimodal
frequency characterized the MMG spectrum (Figure 4.3) and their values appeared to be
the harmonics of the fundamental/peak frequency of the MMG signal. The apparent

99
correspondence of the MMG peak frequency with the stimulation frequency (Figure 4.3)
suggested that the MMG frequency may represent the MU firing frequency. This
observation arose from the knowledge that the NMES-evoked muscle contraction is
“synchronous” and because the participants of the present study had motor complete SCI,
their muscle contractions were entirely involuntarily modulated. This implied that the
recorded MMG signals were mainly generated by the synchronously recruited muscle
fibres (Orizio, 1993).
This explanation is in good agreement with previous studies (Stokes & Cooper, 1992;
Yoshitake & Moritani, 1999) which also demonstrated that the MMG peak frequency
matched the stimulation frequency of contracting muscles. While a clearer interpretation
of this pattern is beyond the scope of the present study, Stokes and Cooper (1992) and
Yoshitake and Moritani (1999) have previously suggested that this phenomenon might be
a function of the type of muscle, properties of the MMG transducer, and valid mainly
during unfused contractions (Yoshitake & Moritani, 1999). In all, the MMG-PF may only
approximate the NMES-evoked firing frequency of muscles at submaximal torque
production levels of predominant fast twitch muscle fibre type, such as in denervated RF.
4.5.4 Influence of Knee Flexion Angles on Mechanomyographic Response
Although all the investigated knee angles revealed strong relationships between the
MMG amplitude and NMES-evoked isometric torque, the pattern of the relationship was
knee angle specific (Figure 4.5). This is in agreement with a previous investigation by
Ebersole and co-workers (1998), whereby the relationship between the production of the
quadriceps voluntary isometric torque and the associated MMG-RMS was knee angle
dependent. Those investigators (Ebersole et al., 1998) suggested that such differences
might be due to the variations in muscle stiffness or motor unit activation strategies as a
reflection of length-tension relationship.

100
4.5.5 Correlations among MMG and NMES-Evoked Torque
Strong, positive correlations were observed between MMG-RMS and NMES-evoked
torque, at all the three knee angles. The correlations might be attributed to the sensitivity
of MMG amplitude to the incremental force modulation. This has a direct implication on
the possibility of MMG to track the force modulation in paralyzed muscles with
predominant fast twitch fibre type (Gerrits et al., 2005; Round et al., 1993) and supports
the earlier suggestion (Yoshitake & Moritani, 1999) of examining muscle’s cellular
composition with MMG signal. This explanation is consistent with early voluntary
isometric contraction studies of the quadriceps (Shinohara et al., 1998; Stokes & Dalton,
1991) which identified that the MMG-RMS of muscles with predominant type II fibre
could increase up to 100% PT irrespective of the type of MMG sensor used (Shinohara
et al., 1998).
Additionally, during NMES-evoked contractions of gastrocnemius muscles (type II
fast twitch fibres predominant), a positive MMG-RMS linear relationship of up to 80%
PT has also been reported in healthy volunteers (Yoshitake & Moritani, 1999). The
present results with MMG-RMS attenuation at around 80% PT, reaffirmed those earlier
findings and showed that comparable correlations could be obtained in paralyzed
quadriceps muscle during NMES-evoked contractions.
4.5.6 Potential Clinical Applications
There is strong evidence (Crameri et al., 2002; Ibitoye et al., 2016; Jacobs & Nash,
2004; Panisset et al., 2016; Qin et al., 2010) that muscle deconditioning, due to “non-
use”, following SCI is attributed to a lack of physical activity in the affected populations.
Therefore, during exercise, MMG signal might be used as a non-invasive measure of
muscle effort to quantify the effectiveness of NMES training for neurological
populations. Moreover, the signal might be used as a real-time proto-dynamometer to

101
quantify muscle performance during activity of daily living—especially as a feedback
signal to up-titrate NMES current amplitude, pulse duration or regulate stimulation
frequency to optimize NMES activities. This finding also supports the suitability of MMG
signal as a practical NMES control signal, as it only requires the calculation of MMG
amplitude parameters for practical implementation (Gobbo et al., 2006). However, MMG
responses to NMES-evoked torque production in other functionally relevant muscles,
specifically of different fibre distribution, need to be investigated. Such information will
give further insight into the physiological relevance of the signal.
Additionally, as the deconditioning is responsible for muscle fibre wasting which is
manifested in the loss of muscle strength or functional capacity, there is current research
interest in preserving muscle integrity not only for the promotion of muscle capacity but
also for the prevention of secondary complication associated with disuse (Galea, 2012;
Lam et al., 2010). Thus, the health benefits of the NMES incremental isometric
contractions strategy used in this study may include; improvement of muscle tone,
bulk/mass, strength and blood flow in order to offset spasticity, disuse atrophy and
osteoporosis among other benefits. The collective clinical relevant of these benefits was
to prepare the musculoskeletal system for a critical task such as standing and ambulation
training (Kern et al., 2005).
The following limitations are acknowledged in the study design: (i) the findings were
dependent on the protocol used, (i.e. modulating the current amplitude while keeping the
pulse width and frequency constant) (ii) the NMES cycle training baseline of at least
seven weeks was adopted based on the previous recommendation (Bickel et al., 2004),
but a longer duration of training may have yielded different results, (iii) the investigation
was based on a sample size (n) of six and some data distributions were non-normally
skewed. Although the sample size was modest in comparison with other studies (Crameri

102
et al., 2002; Sabatier et al., 2005) that have employed persons with motor complete spinal
cord lesions, the size might have also affected the present findings so these should be
interpreted with caution. Therefore, a larger test population is warranted in the future
study to identify how broadly the present findings could be generalized.
4.6 Conclusion
The pattern of relationships between the MMG signals and NMES-evoked isometric
contractions to study the motor unit recruitment strategy in motor complete paralyzed
quadriceps have been demonstrated with an acceptable reliability of the MMG
measurements. Useful insights inferred from these findings are: (i) MMG signals were
sensitive to the incremental NMES-evoked muscle torque measured by a commercial
dynamometer (i.e. a “gold standard”), and as a physically small sensor, the MMG could
be a reliable proxy for these dynamometer measurements, (ii) MMG signals correlations
with NMES-evoked muscle torque could be used to assess the paralyzed quadriceps
mechanical changes during submaximal-to-maximal NMES-evoked muscle contractions.
The application of MMG amplitude as a proxy of electrical stimulus-evoked isometric
muscle force and relevance as a biofeedback source in NMES-evoked activities are
evident. Whether these results could be generalized to other muscles and mode of
contractions, specifically, during critical activities—such as NMES-supported standing,
is a topic of further research. Testing of such hypothesis remains a promising perspective,
particularly since automated NMES is clinically more relevant, effective and safe when
compared with the traditional “user-controlled” approach (Braz et al., 2009).

103
CHAPTER 5: MUSCLE FORCE ESTIMATION FROM
MECHANOMYOGRAPHY IN PERSONS WITH SCI
5.1 Introduction
In this Chapter, the dataset from the participants with spinal cord injury (SCI) was used
to construct a model to estimate muscle force from MMG signals collected during NMES-
evoked knee extension task. This was necessary for an intelligent torque estimation from
the muscle response parameters associated with NMES-evoked torque production in
order to avoid the “curse of dimensionality” which characterizes the traditional regression
approaches (Huang et al., 2006). Thus, this Chapter demonstrated the performance and
investigated the potential application of a statistical computational intelligent technique
based on support vector regression (SVR) modelling for NMES-evoked muscle torque
estimation from the quadriceps MMG signals of persons with chronic and motor complete
SCI in whose NMES-evoked knee extension exercise is crucial (Hamzaid & Davis, 2009),
particularly, for habituation and reconditioning in preparation for standing and
ambulation training.
The study described in this Chapter has been prepared and ready for submission to
IEEE Sensors Journal under the following heading:
NMES-Evoked Knee Torque Estimation from Paralyzed Quadriceps
Mechanomyographic signal Using Support Vector Regression Modelling.
5.2 Literature Review
Spinal Cord Injury is one of the catastrophic injuries of the nervous system which may
lead to permanent neurological impairments (Hamid & Hayek, 2008). This is due to the
manifestation of deficits in voluntary motor control and sensation, below the level of
injury, that limits the performance of daily tasks and the overall activity level of those

104
affected (Jacobs & Nash, 2004). Neuromuscular Electrical Stimulation (NMES)-evoked
muscle contraction has been recommended for motor relearning and strength training in
the affected population (Jacobs & Nash, 2004).
Conventionally, the NMES administration has been through manual control based on
open-loop strategy (Peckham & Knutson, 2005). Although NMES technologies based on
this approach have gained user preference probably due to their operational simplicity,
their clinical efficacy is limited (Sun & Morrell, 2014). To implement a closed-loop
NMES system, whereby the electrical stimulus parameters could be automated by the
muscle responses for optimization of the NMES utility, it has been suggested (Peckham
& Knutson, 2005) that the muscle state information is automatically fed back to the
NMES system by peripherally placed sensors to modulate the NMES operations. This
explains a recent surge in the research interest on reliable biopotential sensing modalities
to monitor the physiological and mechanical responses of contracting muscles (Popović,
2014).
One such biopotential which has been recently promoted is mechanomyography
(MMG)—the mechanical equivalent of muscle electromyography (Beck et al., 2004). The
MMG signal is generated by a lateral movement of activated muscle fibres at the resonant
frequency of the muscle, and it is reflected as the pressure waves produced by the
dimensional changes of contractile elements of the muscle (Beck et al., 2004; Orizio,
1993). It is interesting to note that unlike electromyography, the MMG signal is
insensitive to electrical signal artifact and impedance changes, and thus, suitable for
muscle contraction measurements in the presence of electrical artifact noise, and could be
subjected to a long time usage (Barry et al., 1986). The assessment of muscle contraction
by MMG signal is primarily effected through changes in the time and/or frequency
domain characteristics of the signal.

105
Although the signal has mostly been used as a proxy of muscle force during voluntary
muscle contractions (Ibitoye et al., 2014), emerging evidence suggests its close
relationship with NMES-evoked torque, mostly in healthy (Gobbo et al., 2006; Orizio,
1993; Petitjean et al., 1998; Stokes & Cooper, 1992; Yoshitake & Moritani, 1999) and
rarely in persons with neuromuscular or neurological conditions (Hu et al., 2007; Ibitoye
et al., 2016; Orizio et al., 1997). Therefore, the application of MMG signals for joint
torque estimation during electrical stimulus contraction is rudimentary as it has only been
investigated using traditional regression methodology.
The traditional regression methodologies are based on some assumptions that may be
unsuitable for the characteristics of contemporary datasets (Vapnik, 1998). For instance,
in situations where many factors contribute to a particular event that one intends to predict
such as in a highly dimensional problem. Solving this kind of a problem by a traditional
regression method would lead to a phenomenon termed “curse of dimensionality”,
whereby increasing the dimension of input dataset/independent variables requires an
exponentially increasing number of terms to be solved (Huang et al., 2006). Additionally,
real-life datasets may not be necessarily normally distributed and the assumption on
which the traditional regressions rely will become violated. To evade these limitations as
well as improve the torque estimation accuracy, statistical machine learning algorithms
have been recommended (Huang et al., 2006; Vapnik, 1998).
The estimation of torque from MMG signals using machine learning modelling has
recently been investigated in some upper limb muscles of healthy volunteers during
voluntary contraction. For example, Youn and Kim (2010, 2011) studied the accuracy of
an artificial neural network (ANN) model for elbow joints force prediction from MMG
signals. The investigators reported estimation accuracies of up to 0.892 (Youn & Kim,
2010) and 0.883 (Youn & Kim, 2011) and suggested the future development of other

106
machine learning techniques including Support Vector Regression (SVR) to improve the
accuracy of their model. As an extension of a well-known Support Vector Machine
(SVM) methodology, SVR depends on the statistical supervised learning theory (Vapnik,
1999b), as introduced by Vapnik et al. (1997), particularly for complex regression tasks
(Vapnik et al., 1997; Wang et al., 2003). SVM minimizes a prediction risk through a
‘trade-off’ between the training error and confidence range (Schölkopf & Smola, 2002;
Vapnik, 1998). The technique is particularly suitable for high dimensional problems even
with small sample size datasets (Gupta, 2007; Shin et al., 2005).
Based on the extension of standard SVM algorithms, SVR has two basic phases of
implementation, namely: (i) learning phase where a partitioned dataset is used to construct
a mathematical model to represent a relationship between the actual/target and estimated
parameters; and (ii) testing phase where the unused dataset for model development is used
to assess the performance of the developed model (Vapnik et al., 1997). SVR often
demonstrate an impressive performance, based on standard benchmarking tasks in
comparison with other machine learning algorithms (Meyer et al., 2003). For instance, as
compared to an ANN modelling, SVR has been used for a “simultaneous myoelectric
control of multiple degrees of freedom” of some upper limbs muscle actions (Ameri et
al., 2014), at a computational speed that is useful for real-time applications. Furthermore,
our group (Ibitoye et al., 2016) recently reported an accuracy of 94% for NMES-evoked
isometric knee extension torque estimation from MMG signal in healthy volunteers using
SVR modelling. Therefore, SVR methodology has been gaining recent prominence for
estimation and prediction problems in life sciences and medical fields (Van Looy et al.,
2007).
To date, limited studies (Ibitoye et al., 2016; Youn & Kim, 2010, 2011) have
investigated the application of machine learning techniques for torque estimation from

107
MMG signal. To the author’s understanding, a torque estimation study using MMG
collected during NMES-evoked contractions of paralyzed quadriceps has not been
previously reported and the available information on healthy volunteers could not be
extrapolated to interpret paralyzed quadriceps force responses (Scott et al., 2007).
Thus, the present study sought to investigate the estimation accuracy of an SVR model
for knee torque estimation from the quadriceps MMG signal measured during incremental
NMES-evoked knee extension task in persons with motor complete SCI. This knowledge
has an important practical implication in a closed-loop NMES control settings, where a
measurement of muscle response has been suggested as the preferred feedback signal
(Ibitoye et al., 2016; Popović, 2014). This is based on the premise that MMG provides
direct and immediate information on the response of the muscle to the electrical
stimulation. Therefore, the information derived from the present investigation has a direct
implication on the optimization of the efficacy of NMES applications in functionally
relevant modes of muscle activity including knee extension, with short bouts of
contraction and recovery periods (Crosbie et al., 2009), and standing tasks, where direct
torque measurement may be required as an NMES modulating signal but impractical to
measure directly.
The following section described the experimental investigation conducted to obtain
the dataset used for the modelling task.
5.3 Materials and Methods
5.3.1 Experimental procedures
This study was granted ethical approval by the University of Malaya Medical Ethics
Committee (Approval No:1003.14(1), as detailed in Appendix A). Eight chronic motor
complete persons with SCI [lesion levels between C5 and T7 (mean (SD) age, 39.8 (10.7)

108
years; stature, 1.7 (0.06) m; body mass, 67.9 (14.0) kg); time since injury, 10.9 (7.3)]
volunteered for the NMES-evoked isometric knee extension trials, for torque production,
to examine the accuracy of the SVR model. Participants’ lower limbs were safely
positioned on a calibrated commercial isokinetic dynamometer (Biodex 4, Shirley Corp.,
NY, USA) for torque measurement (Figure 5.1).
Figure 5.1: Sketch of the experimental setup for measuring the MMG signal and
torque in a person with SCI.
To prevent extraneous movement, participants were firmly secured using
dynamometer’s thigh, trunk, and pelvic belts. In order to generate incremental torque
values, the quadriceps muscle was stimulated with a current-controlled proprietary
stimulator (RehaStimTM, Hasomed GmbH, Magdeburg, Germany) at a constant frequency
of 30 Hz and pulse width of 400 µs with an incremental stimulation current between 50
mA and 120 mA in steps of 10 mA (i.e. eight randomly ordered contraction intensity
levels) for 4 s at each contraction intensity level.
The experiment was conducted at 600 and 900 knee angles. For an optimal muscle
response, the stimulation electrodes were placed on the quadriceps muscle group as

109
previously described in Ibitoye et al. (2016) based on the procedures of Botter et al. (2011)
and Levin et al. (2000). In order to keep the bone health within a safe limit (Kagaya et al.,
1995), the stimulation current was limited to 120 mA. To disallow probable rapid muscle
fatigue, a 10 min recovery was allowed between trials and 48 hrs between knee angles.
5.3.2 Signal acquisition and analysis
While there are various sensors that could be used to measure MMG signal,
accelerometers have been most widely utilized (Orizio, 2004). Therefore, the MMG
signals of the Rectus Femoris (RF), as a simple representation of the knee extensor, were
recorded with an accelerometer sensor (Sonostics BPS-II VMG transducer) compatible
with the MP150 data acquisition system and simultaneously with the torque generated
during NMES-evoked contractions. Using double-sided adhesive tape, the MMG sensor
was fixed on the muscle belly of the RF. The MMG signals were digitized at 2 kHz and
filtered between 20 and 200 Hz, to subdue the effects of muscle tremor and movement
artifact (Goldenberg et al., 1991), with a 16-bit analog-to-digital converter using
AcqKnowledge data acquisition and analysis software (MP150, BIOPAC Systems, Santa
Barbara, CA, Inc. USA) and a customized programme in LabVIEW (Version 12.0,
National Instruments, Austin, TX, USA).
To allow for maximal recruitment contractions in analyses, a middle 1 s epoch of the
collected signal, while avoiding the on and off transients during the initiation and
termination of muscle contractions, respectively, at each contraction level was retrieved
for further analyses (Orizio et al., 1989). The MMG time domain parameters including
root mean square (RMS) and peak to peak (PTP) amplitudes, that are related (Beck et al.,
2004; Orizio, 1993) to the motor unit recruitment level and measures of motor output
intensity were extracted for use as input variables to the proposed SVR model. The
following section briefly describes the development of the proposed SVR model.

110
5.3.3 Development of the Support Vector Regression Model
The data obtained from the experiment thus far described was used to train the SVR
model while the standard SVR coding in MATLAB software (Version 12, The
MathWorks, Inc., MA, USA) was used to construct the model. To build an SVR model,
the learning machine requires a training dataset of the form 1 1( , ),.........., ( , )k kx y x y of
continuous values. This dataset typically has an approximation function of the form:
( , ) ,f x w x b ; where 'w R and b R (5.1)
SVR finds a function ( , )f x that approximates the target data instance 1y …., ky .
The function usually uses an error of approximation, as measured by Vapnik’s alternative
-insensitivity error function (Vapnik et al., 1997), to measure the maximum allowable
deviation from the true value of the target data. That is, the permitted error on a training
set should be kept within zone. Also, for the avoidance of over-fitting, the function
( , )f x should be “as flat as possible” (Statnikov et al., 2011). Thus, Smola (1996) has
identified that minimization of the Euclidean norm 2
w is required to achieve the needed
flatness of the equation (5.1).
Moreover, for a non-linear SVR model, the kernel function selection represents an
important step in the regression performance as the models are robust and have the ability
to explore a given dataset effectively via a nonlinear kernel function (Schölkopf & Smola,
2002) by mapping the input dataset or original features into a high-dimensional feature
space. Thus, SVR, through ‘kernel tricks’ computes a regression function in a high
dimensional feature space—where the input data are mapped via a nonlinear mapping
function i.e. kernel function (Noble, 2006; Vapnik et al., 1997; Wang et al., 2003). The
resulting decision function with kernel function ,i
K x x is as shown in equation (5.2).
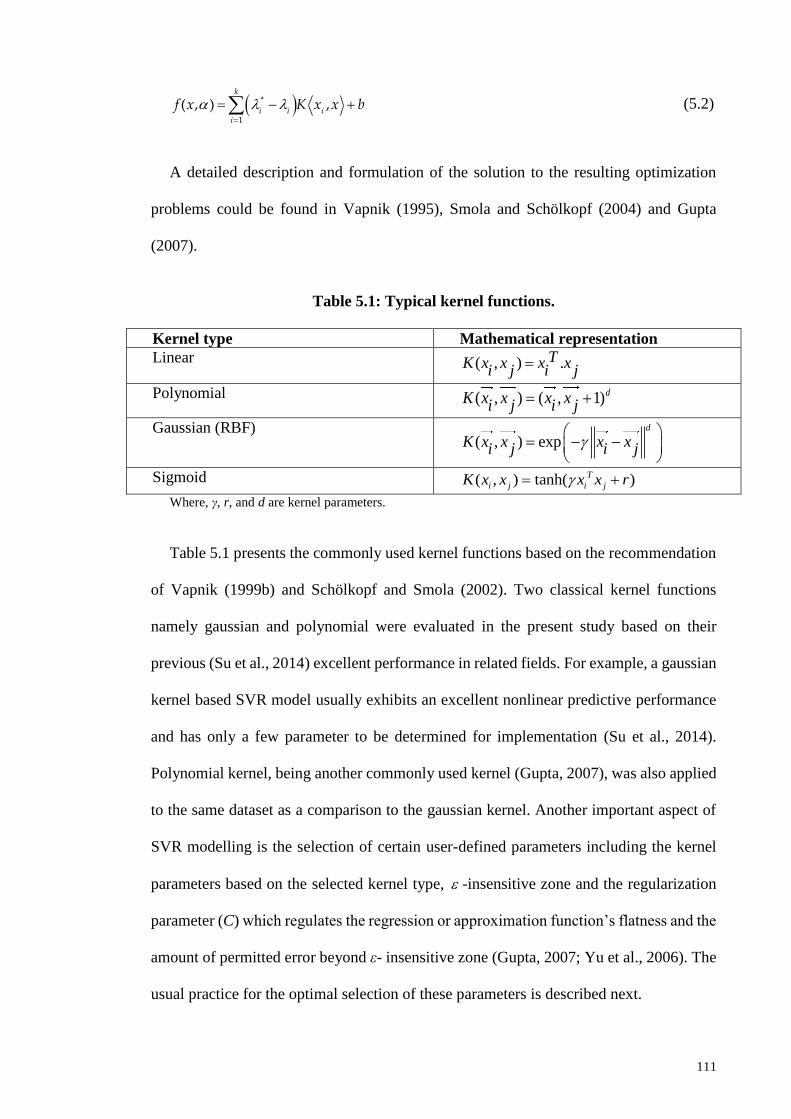
111
*
1
( , ) ,k
i i ii
f x K x x b
(5.2)
A detailed description and formulation of the solution to the resulting optimization
problems could be found in Vapnik (1995), Smola and Schölkopf (2004) and Gupta
(2007).
Table 5.1: Typical kernel functions.
Kernel type Mathematical representation
Linear ( , ) .TK x x x xi j i j
Polynomial ( , ) ( , 1)dK x x x xi j i j
Gaussian (RBF) ( , ) exp
d
K x x x xi j i j
Sigmoid ( , ) tanh( )T
i j i jK x x x x r
Where, γ, r, and d are kernel parameters.
Table 5.1 presents the commonly used kernel functions based on the recommendation
of Vapnik (1999b) and Schölkopf and Smola (2002). Two classical kernel functions
namely gaussian and polynomial were evaluated in the present study based on their
previous (Su et al., 2014) excellent performance in related fields. For example, a gaussian
kernel based SVR model usually exhibits an excellent nonlinear predictive performance
and has only a few parameter to be determined for implementation (Su et al., 2014).
Polynomial kernel, being another commonly used kernel (Gupta, 2007), was also applied
to the same dataset as a comparison to the gaussian kernel. Another important aspect of
SVR modelling is the selection of certain user-defined parameters including the kernel
parameters based on the selected kernel type, -insensitive zone and the regularization
parameter (C) which regulates the regression or approximation function’s flatness and the
amount of permitted error beyond ε- insensitive zone (Gupta, 2007; Yu et al., 2006). The
usual practice for the optimal selection of these parameters is described next.

112
5.3.4 Optimal parameters search approach
The selection of the optimized parameters is supposed to be automated, and
computationally efficient. This process involves multiple iterations. Specifically, the time
needed for the search or iteration is a function of the data size. The goal is to minimize
the computational duration. This is necessary for an optimized estimation as the
performance of an SVR model depends on the selection of optimal input parameters
(Shamshirband et al., 2014; Vapnik et al., 1997). One approach to minimizing the
computational duration is by using a partial dataset that could provide a near optimum
model for support vector learning process (Hens & Tiwari, 2012). Therefore, to optimize
the search for optimal kernel parameters to build the best model, a test-set cross-validation
technique was used in the present study and its implementation is as described in Chapter
3 (Algorithm 3.1). Table 5.2 depicts the optimal values of parameters used to develop the
final model.
Before use, the dataset was divided into two independent parts in compliance (Akande
et al., 2015) with the SVR modelling approach i.e., a training subset was 70% of the
dataset and a testing subset was the remaining 30% of the dataset. This was done through
test-set cross-validation method by stratified sampling approach for effective random
partitioning (Akbani et al., 2004; Hens & Tiwari, 2012). Following this approach, a SVR
analysis was performed on the training dataset and the generalization accuracy of the
model was verified on the testing subset.
Table 5.3 presents the data used in the present study. Apart from being a common
procedure for optimizing the performance of SVR (Ben-Hur & Weston, 2010), data
normalization as applied to the current study also compensated for the probable variations
in the participants’ muscle response to the electrical stimulus intensity. Table 5.4 depicts
the statistical analysis of the dataset.

113
Table 5.2: Optimal parameters for the proposed Support Vector Regression
model.
Kernel Gaussian (RBF) Polynomial
C 879 879
Hyper-parameter (Lambda) 2-15 2-15
Epsilon ( ) 0.1205 0.1205
Kernel option 54 2 Abbreviations: C = the regularization parameter.
5.3.5 The statistical performance evaluation of the proposed model
In order to evaluate the performance or estimation accuracy of the proposed SVR
model, the coefficient of determination (R2) and root mean square error (RMSE) were
utilized. Specifically, these measures were used to evaluate the goodness of fit of the
relationship between the estimated and actual/target outputs as well as the error of
estimation, respectively.
Table 5.3: Summary of the datasets.
MMG characteristics at eight NMES stimulation intensity levels, at two knee angles
and their respective peak torque values.
Stim.
Intensity
(mA)
Knee angle
600 90
0
Torque RMS PTP Torque RMS PTP
50 24.00(10.9) 32.67(13.9) 39.80(16.9) 20.55(8.5) 42.76(15.4) 49.44(11.3)
60 30.14(8.6) 48.73(8.9) 58.14(11.5) 38.04(12.5) 51.40(15.4) 57.76(16.7)
70 47.04(10.6) 56.55(8.8) 65.22(11.9) 56.90(10.3) 66.13(15.2) 74.51(17.0)
80 61.11(12.9) 69.54(13.0) 78.85(16.5) 67.67(12.1) 70.04(17.0) 88.24(21.3)
90 76.42(11.4) 83.77(23.3) 86.91(19.2) 78.61(8.5) 82.17(22.9) 77.76(18.0)
100 87.47(9.6) 96.18(17.6) 98.11(13.7) 88.44(6.4) 81.12(19.8) 77.96(19.1)
110 92.88(5.4) 100.88(6.8) 103.71(5.6) 95.16(3.8) 90.30(14.5) 91.22(17.0)
120 100.00(0) 100.00(0) 100.00(0) 100.00(0) 100.00(0) 100.00(0)
Abbreviations: RMS- Normalized MMG-RMS %, PTP- Normalized MMG-PTP%. Values are reported in mean (standard deviation).
Table 5.4: Statistical parameters of the datasets.
Input parameters Mean Max Median Stdev Min
Participants
Weight (kg) 67.9 82 73.8 14.0 44
Age (years) 39.8 58 39.0 10.7 25
Stimulation intensity (mA) 85 120 85 22.9 50
Knee angle (deg) 75 90 75 15 60
Normalized MMG-RMS% 73.3 128.2 72.5 26.0 15.7
Normalized MMG-PTP% 78.0 125.4 77.8 24.0 19.5
Torque 66.5 101.9 71.1 28.3 6.0
114
5.4 Results and Discussion
In this section, the dataset used for the experiment are described and the results of the
SVR modelling are presented. A comparison between the two selected kernel functions
(gaussian and polynomial) is also reported. Furthermore, the implications of the results
are discussed. Finally, a conclusion on the findings of the study as well as its clinical
implication is highlighted.
The present study assesses the predictive accuracy of SVR model to estimate the
torque measured during an incremental NMES-evoked knee extension task using
quadriceps MMG signals in persons with motor complete SCI. The input features to the
proposed model were MMG signal amplitude (MMG-RMS and MMG-PTP), stimulation
intensity, knee angle, participants’ weight and age with the NMES-evoked torque as the
target output. The results of the two kernel functions (gaussian and polynomial) were
compared in terms of the estimation accuracy using the two partitioned datasets (training
and testing) following the optimal selection of the SVR modelling parameters.
Figure 5.2 and 5.3 depict the relationship between the target/ experimental torque and
estimated torque using both kernel functions for the training and testing cases,
respectively. For the training case, R2, measure of the estimation accuracy, of 95% (with
RMSE = 6.28) and 92% (with RMSE = 7.99) were obtained with gaussian and polynomial
kernels, respectively. However, in the case of the testing dataset, R2 of 94% (with RMSE
= 8.19) and 91% (with RMSE = 9.82) were obtained for the gaussian and polynomial
kernel, respectively (Table 5.5). Moreover, Figures 5.2 and 5.3 show a slightly better
performance of gaussian kernel in comparison with the polynomial kernel for both
training and testing datasets, although both performances were comparably high.

115
Figure 5.2: Relationships between the experimental/actual torque and estimated
torque using gaussian (A) and polynomial (B) based kernel functions for training
dataset.
Plots in Figure 5.4 (A and B) show a close relationship between the actual and
estimated torque using the two kernel functions for training and testing subsets suggesting
a comparable performance of the two kernels used in the present study. The plots revealed
a slightly higher performance of gaussian kernel over polynomial kernel for torque
prediction on both the training and testing subsets, although both kernels closely tracked
the actual torque production.

116
Figure 5.3: Relationships between the experimental/actual torque and estimated
torque using gaussian (A) and polynomial (B) based kernel functions for the
testing dataset.
Based on the results obtained, the SVR-based model could be used to estimate the
NMES-evoked torque from MMG signal in persons with SCI. This finding introduces an
alternative approach for torque estimation with potential applications in research, outdoor
and clinical settings. Specifically, this technique may be applied to advance the clinical
assessment of rehabilitation intervention outcomes with a miniature sensor such as an
accelerometer used to measure MMG signal. Therefore, the knee torque estimation model

117
proposed in this study could lend further guidance for the study and analysis of knee
extension torque dynamics in SCI populations as a precursor for sit-to-stand, prolonged
standing or ambulation training as the tracking of changes in mechanical muscle response
to effect torque control requires that a joint torque must be accurately estimated.
Table 5.5: The accuracy of the developed model.
SVR Kernel
Training Testing
r R2 RMSE r R2 RMSE
Gaussian (RBF) 0.973 95% 6.28 0.969 94% 8.19
Polynomial 0.957 92% 7.99 0.952 91% 9.82
5.4.1 Clinical Implications
A number of approaches have been promoted for assessment of the strength
improvement following NMES exercise. The isokinetic dynamometer that measures
muscle strength gains via joint torque is laboratory based, not portable, and does not allow
an integration to the electrical circuits for flexible NMES applications in the home and
outdoors settings. With the findings of this present study, it may be possible that the
mechanical muscle response to the electrical stimulus contractions as a marker of strength
gain or deterioration (as revealed by the muscle’s MMG), could be monitored. This may,
therefore, strengthen clinical research with a tool that allows clinicians and other allied
professionals to monitor the state of the electrically stimulated muscles. Furthermore, a
predictive NMES-evoked torque control signal to automate NMES system may be
derived from the MMG signal. This directly relates to the optimization of the efficacy of
NMES systems as the proposed model could facilitate the controllability and versatility
of the NMES utility. Moreover, as the electrical stimulation paradigm adopted in this
study is similar to that used for routine clinical practice for knee extension strength
training, it can be hypothesized that a similar model may be required for torque estimation
during the application of NMES for critical tasks in persons with SCI.
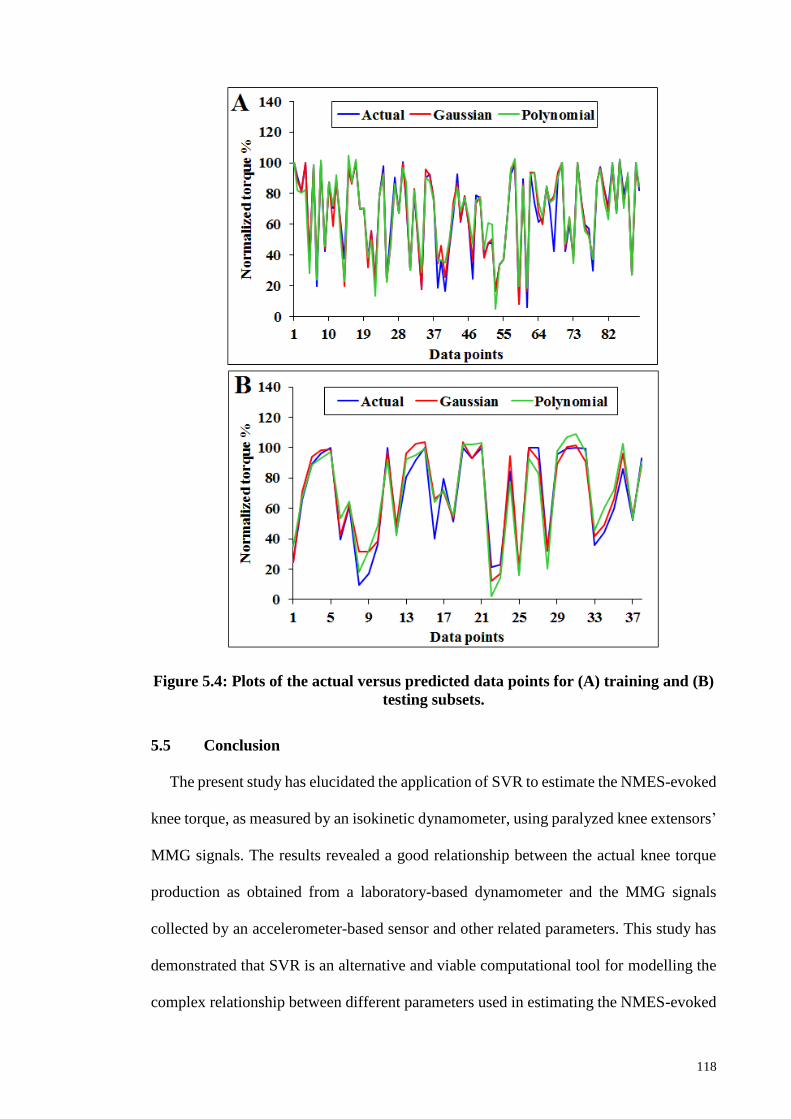
118
Figure 5.4: Plots of the actual versus predicted data points for (A) training and (B)
testing subsets.
5.5 Conclusion
The present study has elucidated the application of SVR to estimate the NMES-evoked
knee torque, as measured by an isokinetic dynamometer, using paralyzed knee extensors’
MMG signals. The results revealed a good relationship between the actual knee torque
production as obtained from a laboratory-based dynamometer and the MMG signals
collected by an accelerometer-based sensor and other related parameters. This study has
demonstrated that SVR is an alternative and viable computational tool for modelling the
complex relationship between different parameters used in estimating the NMES-evoked
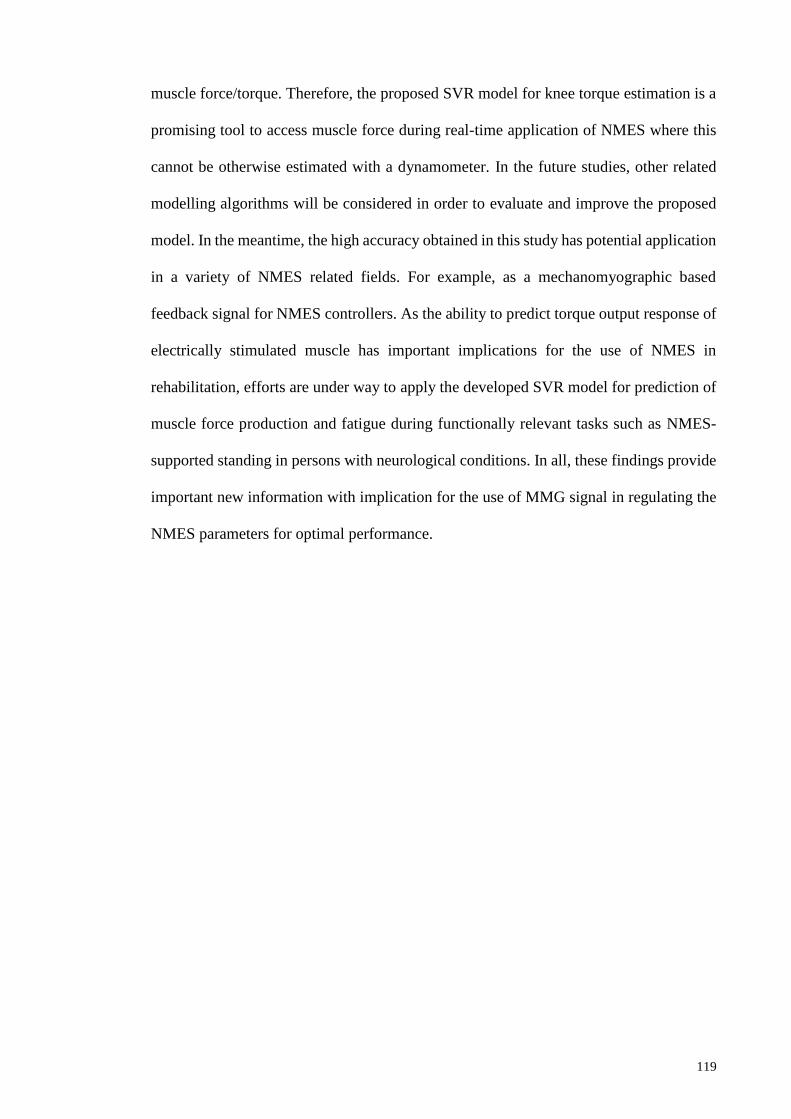
119
muscle force/torque. Therefore, the proposed SVR model for knee torque estimation is a
promising tool to access muscle force during real-time application of NMES where this
cannot be otherwise estimated with a dynamometer. In the future studies, other related
modelling algorithms will be considered in order to evaluate and improve the proposed
model. In the meantime, the high accuracy obtained in this study has potential application
in a variety of NMES related fields. For example, as a mechanomyographic based
feedback signal for NMES controllers. As the ability to predict torque output response of
electrically stimulated muscle has important implications for the use of NMES in
rehabilitation, efforts are under way to apply the developed SVR model for prediction of
muscle force production and fatigue during functionally relevant tasks such as NMES-
supported standing in persons with neurological conditions. In all, these findings provide
important new information with implication for the use of MMG signal in regulating the
NMES parameters for optimal performance.

120
CHAPTER 6: MUSCLE FATIGUE TRACKING DURING NMES STANDING
TO FAILURE CHALLENGE IN PERSONS WITH MOTOR COMPLETE SCI
USING MECHANOMYOGRAPHY
6.1 Introduction
Up to this stage, it has been verified that mechanomyography could be used to
investigate the recruitment pattern during isometric non-fatigued contractions where the
recruitment order is somewhat or relatively simple (Orizio et al., 2003). The present
Chapter reports the pattern of MMG signal to study motor unit recruitment during NMES
sustained standing to fatigue failure challenge in persons with motor complete spinal cord
injury (SCI). This study aimed to reveal the pattern of relationship between the MMG
signals and fatigue contractions during a relatively complex and critical NMES-evoked
muscle action. The experiment reported herein was conducted at the rehabilitation
gymnasium of the Department of Rehabilitation Medicine, University of Malaya Medical
Centre. The rationale for this study was to investigate the clinical relevance of the MMG
signal by studying the relationship between the signal and muscle response’s decay as
indicated by knee buckling during fatigue contractions. One important implication of this
study was to investigate the potential utility of the MMG as a muscle fatigue sensor useful
as a control signal for NMES-supported standing in persons with SCI.
The study reported in this Chapter was taken from the following submitted journal
article to the Medical and Biological Engineering and Computing under the heading:
Ibitoye, M. O., Hamzaid, N. A., Hasnan, N., Abdul Wahab, A. K., & Davis, G. M.
(2017) Quadriceps mechanomyography reflects muscle fatigue during FES-sustained
standing in adults with spinal cord injury: Case series proof of concept, under review
in Medical and Biological Engineering and Computing.

121
6.2 Literature Review
Neuromuscular fatigue is generally defined as an exercise-induced reduction in muscle
effort or ability to sustain muscle contractions (Fitts, 1994; Gandevia, 2001). During
functional applications of Neuromuscular Electrical Stimulation (NMES), such as in
upright stance, the agonist muscles are continuously under electrical stimulation-evoked
contractions. This predisposes the stimulated muscles to rapid fatigue, which is the cause
of standing failure (Brindley et al., 1979), manifested by a knee buckle.
Traditionally, muscle fatigue during functional electrical stimulation (FES)-supported
standing has been monitored by a change in knee angle (Braz et al., 2009), and it is this
decrease of knee angle that infers a reduction in the muscle’s performance. Moreover, the
phenomenon of muscle fatigue has also been investigated by monitoring changes of other
characteristics, such as electromechanical indices (Blangsted et al., 2005),
neurophysiology and metabolic responses (Levy et al., 1993). These have been often
measured because a high stimulation intensity and prolonged muscle contraction are
characterized by significant alterations in neuromuscular physiology, local muscle
oxygenation, and metabolite concentrations (Allen et al., 2008; Cady et al., 1989).
However, as “fatiguing contraction” lie within the continuum of effective muscle
contractions (Scott et al., 2006), efforts to improve standing duration warrant the
investigation of a possible proxy of muscle fatigue to directly grade muscle performance
(Dugan & Frontera, 2000). A mechanical proxy of muscle performance may be used to
titrate FES stimulation parameters in real-time for optimal task duration, such as upright
stance, especially in persons with an increased susceptibility to rapid muscle fatigue after
spinal cord injury (SCI).
Previous investigators (Bajd et al., 1982; Braz, Russold, & Davis, 2009; Ibitoye et al.,
2016) have recommended some strategies to prolong the duration of FES-supported

122
standing by delaying the onset of fatigue-failure. One traditional approach has been to
maximally stimulate the knee extensors/quadriceps muscle with manual or open-loop
FES control. Although this strategy is still popular since it can be readily deployed during
a standing task with the assistance of caregivers, the approach provides a sub-optimal
standing duration due to rapid muscle fatigue. However, more recent evidence (Braz et
al., 2009; Popović, 2014) has suggested that automatic titration of key FES parameters
based on the muscles’ response might delay fatigability and increase standing duration in
the SCI population. Based on this premise, research efforts to improve standing duration
have focused on muscle response information, an indirect measure of muscle force and
performance. However, issues such as cosmesis, reliability, and sensitivity of a muscle
response sensor continue to inhibit the clinical acceptability of this approach.
Typically, when FES activates muscle fibers, there is excitation-contraction coupling
due to depolarization of the motor nerve (Collins, 2007). The generated force, as a result
of muscle shortening, can be obtained at the joint as a twitch torque (McMillan et al.,
1990), a reduction of which characterizes muscle fatigue. Therefore, peak torque or
maximal muscle effort has been proposed as a better descriptor of muscle fatigue (Russ
et al., 2002), although impractical to measure directly during a real-time application of
FES (Popović, 2014). There have been some previous useful attempts to utilize muscle
electromyography (EMG) as an indirect indicator of muscle fatigue during surface
(Chesler & Durfee, 1997; Li et al., 2014; Mizrahi et al., 1997) and implanted stimulations
(Hayashibe et al., 2011). Unfortunately, electrical stimulation-evoked contraction is
generally characterized by high stimulation artifacts that saturate EMG circuitry, and the
option of artifact-blanking often complicates the retrieval of useful parameters of the
evoked-EMG signal (Chesler & Durfee, 1997; Popović, 2014). This suggests a clear need

123
for an alternative or complementary method to study muscle fatigue contraction,
especially, during skin-surface repetitive FES contractions.
One promising technique to quantify muscle performance is mechanomyography
(MMG) (Orizio et al., 1999). MMG signal is electrical stimulation artifact free
(Yamaguchi et al., 2012) and has been identified as a useful method to detect impairments
in excitation–contraction coupling (Søgaard et al., 2003) for muscle performance
assessments (Herzog et al., 1994) during voluntary isometric fatiguing contractions. The
MMG signal has been specifically identified as sensitive to muscle performance
decrements due to the failure of excitation-contraction coupling during muscle fatigue
(Blangsted et al., 2005). Being a mechanical counterpart of neuromuscular electrical
activity (i.e. EMG) during muscle contractions, the MMG characterizes the intrinsic
muscle mechanical properties (Shinohara et al., 1998). Thus, the MMG can reveal a
fatigue-related impairment of the muscle’s mechanical changes (Blangsted et al., 2005).
For example, during voluntary isometric fatiguing contractions, MMG amplitude has
shown a consistent decay in upper extremities muscle groups (Barry et al., 1992;
Madeleine et al., 2002). Furthermore, variations in the magnitude of MMG amplitude
have been previously associated with a parallel reduction in force production during
muscle fatigue of FES aetiology in healthy volunteers (Gobbo et al., 2006; Orizio et al.,
1996). However, apart from the healthy populations investigated in earlier studies, the
response of the MMG signal to electrical stimulation was only examined at submaximal
levels, and these findings may not infer MMG signal characteristics in critical situations
such as in prolonged standing in persons with a neurological impairment. Nevertheless,
an important proof of concept could be objectively inferred from those previous studies
that served to guide the present investigation.

124
The current study investigation was undertaken as a “proof of concept” using four case
studies of adults with chronic motor-complete SCI. We sought to test the following
hypotheses: (i) there would be an inverse relationship between MMG amplitude
characteristics and duration of FES-evoked muscle contractions during a sustained
standing-to-failure task in persons with SCI, and, (ii) the MMG amplitude would be
sensitive to the variation in the electrical stimulation frequency during a standing
challenge task. These objectives were meant to determine whether the MMG signal could
be an adequate “fatigue-failure sensor” during a prolonged standing challenge task in four
SCI case studies, to provide a justification for its potential application as a real-time
muscle fatigue sensor worthy of further investigation. The quadriceps muscle
performance during electrical stimulation was considered because it is the main agonist
of sustained standing in persons with SCI (Rabischong & Chavet, 1997). While the rate
of torque decrease remains the best index of muscle fatigue, it is often impractical to
measure this during activities of daily living, so knee angle reduction and the quadriceps
MMG amplitude response were used as proxies of muscle force diminution in relation to
the knee buckle during standing (Mulder et al., 1990).
6.3 Materials and Methods
6.3.1 Participant
Four adults (3 males and 1 female) motor complete SCI participants were drawn from
the inpatient and outpatient populations at the Department of Rehabilitation Medicine,
University of Malaya Medical Centre, Kuala Lumpur, Malaysia. Their physical
characteristics are presented in Table 6.1. Before participation, they were all screened to
exclude; (i) severe contractures that could interfere with their ankle dorsiflexion, knee or
hip extension (ii) pressure sores (iii) any other medical contraindications that might
significantly affect their standing posture. Participants were limited to those with low

125
tetraplegia and paraplegia for whom FES supported standing might be a realistic and
achievable activity of daily living goal (Jaeger, 1992).
In addition, the participants were trained FES users and had gone through FES cycling
exercise for at least 15 weeks previously (2 to 3 times per week) for muscle conditioning.
However, since they were motor “complete” SCI, none of the participants could
voluntarily produce muscle contractions to sustain standing. Although all participants
were medically stable, a physiotherapist was present during testing to monitor vital signs
throughout the duration of the study. The study was conducted based on the protocol
approved by the University of Malaya Medical Ethics Committee (MECID.NO: 20164-
2366) as detailed in Appendix B. Prior to the experiment, all participants who
volunteered, endorsed written informed consent understanding the study activities, its
risks and benefits, and had a discussion of the study protocol with the chief investigator.
Table 6.1: Participants’ characteristics.
Variables Characteristics
Age (yrs.) 41.8 (7.3)
Stature (m) 1.7 (0.04)
Body mass (Kg) 70.4 (15.4)
SCI level T1, T4, C6 and C5/C6
Time since injury (yrs.) 17.3 (5.0) Abbreviation: T – Thoracic level injury; C – Cervical level injury, (A) & (B) refer to AIS – American Spinal
Injury Association Impairment Scale [31]. Reported values are mean (standard deviation).
6.3.2 Experimental design
6.3.2.1 Familiarization
Following a few days of standing training prior to testing sessions to screen for the
possible occurrence of orthostatic hypotension and for their habituation to standing
upright (Faghri & Yount, 2002), participants attended two sessions of different FES
strategies separated by 2 days. On each visit, a particular frequency of neurostimulation
(either a low stimulation frequency (LF) or high stimulation frequency (HF)) was
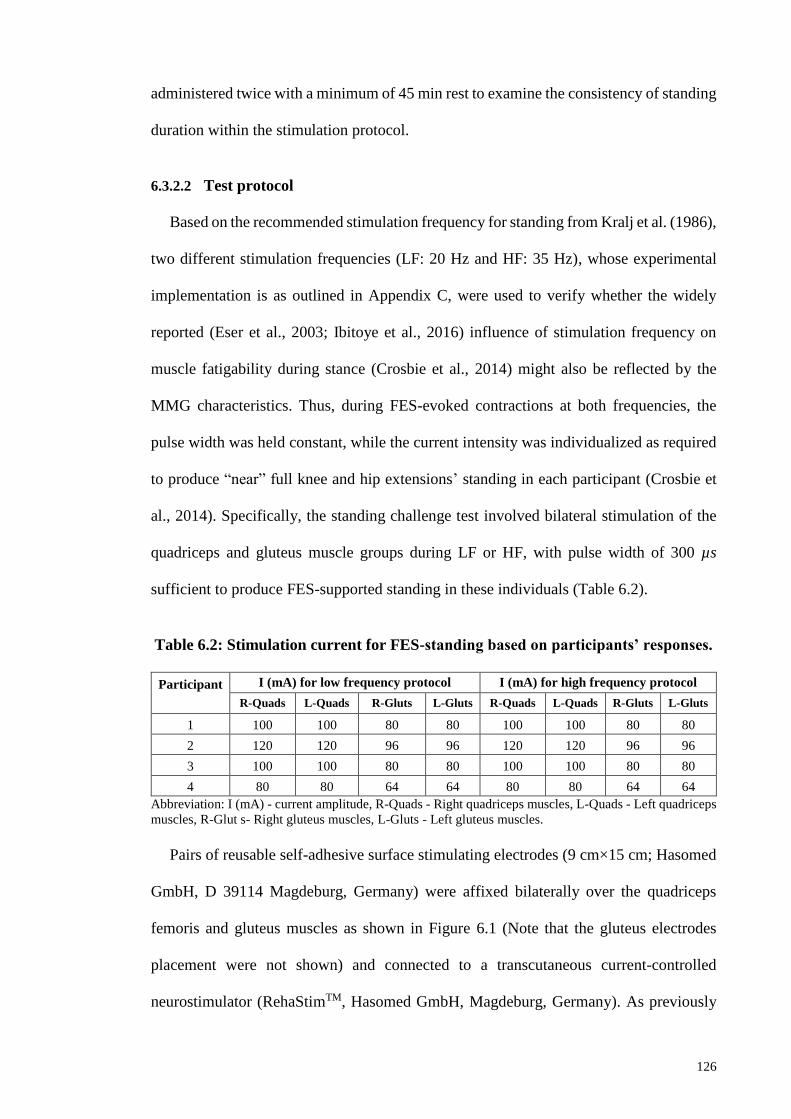
126
administered twice with a minimum of 45 min rest to examine the consistency of standing
duration within the stimulation protocol.
6.3.2.2 Test protocol
Based on the recommended stimulation frequency for standing from Kralj et al. (1986),
two different stimulation frequencies (LF: 20 Hz and HF: 35 Hz), whose experimental
implementation is as outlined in Appendix C, were used to verify whether the widely
reported (Eser et al., 2003; Ibitoye et al., 2016) influence of stimulation frequency on
muscle fatigability during stance (Crosbie et al., 2014) might also be reflected by the
MMG characteristics. Thus, during FES-evoked contractions at both frequencies, the
pulse width was held constant, while the current intensity was individualized as required
to produce “near” full knee and hip extensions’ standing in each participant (Crosbie et
al., 2014). Specifically, the standing challenge test involved bilateral stimulation of the
quadriceps and gluteus muscle groups during LF or HF, with pulse width of 300 µs
sufficient to produce FES-supported standing in these individuals (Table 6.2).
Table 6.2: Stimulation current for FES-standing based on participants’ responses.
Participant
I (mA) for low frequency protocol I (mA) for high frequency protocol
R-Quads L-Quads R-Gluts L-Gluts R-Quads L-Quads R-Gluts L-Gluts
1 100 100 80 80 100 100 80 80
2 120 120 96 96 120 120 96 96
3 100 100 80 80 100 100 80 80
4 80 80 64 64 80 80 64 64
Abbreviation: I (mA) - current amplitude, R-Quads - Right quadriceps muscles, L-Quads - Left quadriceps
muscles, R-Glut s- Right gluteus muscles, L-Gluts - Left gluteus muscles.
Pairs of reusable self-adhesive surface stimulating electrodes (9 cm×15 cm; Hasomed
GmbH, D 39114 Magdeburg, Germany) were affixed bilaterally over the quadriceps
femoris and gluteus muscles as shown in Figure 6.1 (Note that the gluteus electrodes
placement were not shown) and connected to a transcutaneous current-controlled
neurostimulator (RehaStimTM, Hasomed GmbH, Magdeburg, Germany). As previously
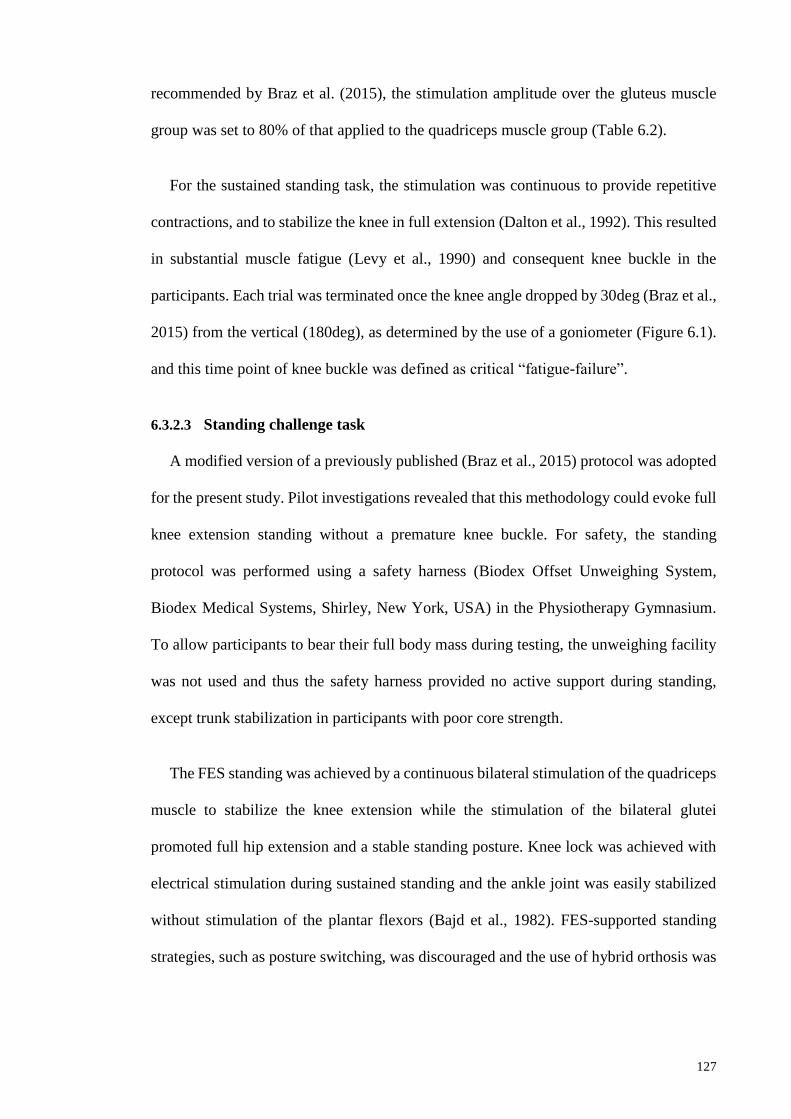
127
recommended by Braz et al. (2015), the stimulation amplitude over the gluteus muscle
group was set to 80% of that applied to the quadriceps muscle group (Table 6.2).
For the sustained standing task, the stimulation was continuous to provide repetitive
contractions, and to stabilize the knee in full extension (Dalton et al., 1992). This resulted
in substantial muscle fatigue (Levy et al., 1990) and consequent knee buckle in the
participants. Each trial was terminated once the knee angle dropped by 30deg (Braz et al.,
2015) from the vertical (180deg), as determined by the use of a goniometer (Figure 6.1).
and this time point of knee buckle was defined as critical “fatigue-failure”.
6.3.2.3 Standing challenge task
A modified version of a previously published (Braz et al., 2015) protocol was adopted
for the present study. Pilot investigations revealed that this methodology could evoke full
knee extension standing without a premature knee buckle. For safety, the standing
protocol was performed using a safety harness (Biodex Offset Unweighing System,
Biodex Medical Systems, Shirley, New York, USA) in the Physiotherapy Gymnasium.
To allow participants to bear their full body mass during testing, the unweighing facility
was not used and thus the safety harness provided no active support during standing,
except trunk stabilization in participants with poor core strength.
The FES standing was achieved by a continuous bilateral stimulation of the quadriceps
muscle to stabilize the knee extension while the stimulation of the bilateral glutei
promoted full hip extension and a stable standing posture. Knee lock was achieved with
electrical stimulation during sustained standing and the ankle joint was easily stabilized
without stimulation of the plantar flexors (Bajd et al., 1982). FES-supported standing
strategies, such as posture switching, was discouraged and the use of hybrid orthosis was

128
avoided to mimic a real-life scenario, and to allow fatigue occurrence as necessary due to
a continuous stimulation leading to fatigue-failure and knee buckling.
Figure 6.1: Experimental setup for the FES supported standing task.
Upright stance was attained and this was taken as the ability of each participant to bear
up to ≥ 95% total body weight on their legs for a period of ≥ 1min (Jaeger et al., 1989).
This was ensured by positioning the participants such that their centre of mass lay
“almost” in the same plane as their feet (Figure 6.1) to promote stability (Braz et al.,
2009). Ultimately, the stance duration was limited by rapid quadriceps muscle fatigue that
led to knee buckling.

129
Based on previous recommendations (Chesler & Durfee, 1997; Thrasher & Popovic,
2008), a 70-s minimum duration of FES-supported standing was used to study MMG
fatigue effects. In each participant, the stance time to fatigue-failure was noted to ascertain
the duration of stance and its variability between participants and stimulation frequencies.
6.3.3 Mechanomyogram
Throughout the duration of FES-supported standing, MMG signals from the
quadriceps muscle, due to its key role in “weight-bearing” during standing and walking
(Mizrahi et al., 1985), were collected with an accelerometer-based vibromyographic
sensor (Sonostics BPS-II VMG sensor on Biopac MP150 Acknowledge software
platform, Goleta, USA). The sensor was attached using double-sided adhesive tapes
(Barry, 1992) directly over the muscle belly. This was necessary to obtain the maximal
muscle surface oscillation and to secure the sensor in place to ensure a constant pressure
on the sensor-muscle interface (Bolton et al., 1989) (Figure 6.1). MMG signals were
obtained unilaterally from the quadriceps, specifically RF. It had been earlier identified
that bi-articular muscles (Jacobs & van Ingen Schenau, 1992) such as RF "have a unique
role in controlling the distribution of net moments about the joints" (Kouzaki et al., 1999).
To extract the relevant MMG characteristics, the standing challenge continued until
critical-fatigue failures, although fatiguing contractions were evident well before knee
buckle at 30deg (Figure 6.1).
6.3.4 Signal processing
The raw MMG signals were digitized by a 16-bit analogue to digital converter,
digitally band-pass filtered between 20 and 200 Hz and sampled at 2 kHz (MP150,
BIOPAC Systems, Inc., Goleta, USA). The first 1 s segment of MMG signal was
discarded due to the transient phenomenon associated with the initiation of isometric

130
contractions (Orizio et al., 2003). Also excluded were some data segments (as there were
early MMG amplitude rises in some instances) before the peak MMG amplitude was
observed to accommodate only the muscle fatigue components in curve fitting and
statistical analyses. The muscle contraction signal of the remaining segments up to the
first 70-s of contraction was analyzed in 1 s epoch intervals for the assumption of non-
stationarity to hold for the MMG signal (Beck et al., 2005). This was based on the
assumption (Chesler & Durfee, 1997; Thrasher & Popovic, 2008) that muscle fatigue is
typically evident by 60 s of sustained FES-evoked contractions, especially in persons with
long-standing SCI. The MMG-RMS amplitude for each epoch was computed from the
digitized signals in the time domain.
6.4 Data analysis
Prior to the data analyses, MMG-RMS amplitude values were normalized against their
highest value across the two frequencies of stimulation in each participant to allow
comparison between HF and LF. Based on previous recommendations by Rabischong
and Chavet (1997) and Mizrahi et al. (1997), the relationship between MMG-RMS and
time during the standing challenge were curve-fitted to a double exponential decay model
comprising four parameters, as a single exponential gave a lower quality of fit, using the
curve fitting tools available in the Matlab software (The MathWorks, Inc., Natick, MA,
USA). The MMG fatigue data modelling is governed by Equation (6.1):
𝑦 = 𝑎𝑒−𝑏𝑥 + 𝑐𝑒−𝑑𝑥 (6.1)
Whereby, 𝑦 denotes MMG-RMS % and 𝑥 represented the duration of standing
challenge to fatigue failure (s). Parameters, 𝑎, 𝑏, 𝑐 and 𝑑 are the exponential regression
model coefficients. Our selection of a case series proof of concept research design
precluded parametric statistical analyses of curve-fitting. Coefficients of determination
(R2) and root mean square errors (RMSE) values were used to assess the performance of

131
the model. As the present study’s sample size was small, comparison of the standing
duration between HF and LF strategies were examined by using a nonparametric
Wilcoxon signed-rank test in SPSS software (Version 20, IBM SPSS for Windows, NY,
USA). P≤ 0.05 was set as accepted level of statistical significance.
6.5 Results
6.5.1 MMG amplitude during muscle fatigue contractions
The mechanomyogram RMS characteristics followed an expected decline over the first
70 s of standing, coincidental with FES-induced muscle fatigue in the persons with motor
complete SCI. Table 6.4 portrays the standing time for the participants under HF and LF
stimulation protocols. In three of the cases, LF stimulation produced a longer standing
time to critical failure-fatigue by 31-246 s, although this difference between HF and LF
was not statistically significant (P>0.05).
Figure 6.2 shows the plots of MMG-RMS signal over time within the first 70 s of FES-
supported standing. In general, MMG-RMS amplitude, as a proxy of muscle force decline
over time, due to FES-evoked quadriceps fatigue, were well fit by a double exponential
decay model (Equation (6.1); Table 6.3). The relationship (𝑀𝑀𝐺 − 𝑅𝑀𝑆 % = 𝑎𝑒−𝑏∗𝑡𝑖𝑚𝑒
+ 𝑐𝑒−𝑑∗𝑡𝑖𝑚𝑒) yielded high coefficient of determination (R2) between 0.85-0.99 with low
room mean square errors (RMSE). Furthermore, “visual inspection” of Figure 6.2
revealed a close relationship between the experimental data (MMG-RMS) and the
exponential decay model fit, albeit with some variability-scatter around the curve-fits.
Although parametric statistical analyses of regression coefficients were not performed,
there was an obviously faster MMG-RMS fatigue response during HF than LF, and both
displayed a “fast” and “slow” components of MMG amplitude decline. This suggested a
greater degree of fatigue during HF stimulation in comparison to that of LF stimulation,
as detected by muscle mechanomyography.

132
Moreover, a longer standing duration during LF stimulation in comparison to HF
stimulation, that was evident in three out of four participants (Table 6.4), represented a
reasonable approximation of a practical standing task in persons with motor complete SCI
(Braz et al., 2015).
Table 6.3: Exponential muscle fatigue regression model and goodness of fit
coefficients.
Participant
Double Exponential Model
HF (a; b; c; d) R2 (RMSE) LF (a; b; c; d) R2 (RMSE)
1 154.6; -0.063; 0.011;
0.095
0.98 (4.01) -1.855e+6; -0.027;
1.856e+6; -0.027
0.99 (2.12)
2 102.7; -0.176; 9.875;
0.006
0.93 (3.88) 440.7; -0.059; -390.3; -
0.092
0.96 (6.18)
3 137.6; -0.054; 0.026;
0.088
0.97 (4.61) 71.76; -0.041; 1.571;
0.026
0.97 (2.34)
4 160.4; -0.142;
18.140; -0.011
0.97 (3.91) 101; -0.028; 0.838;
0.048
0.85 (8.10)
Abbreviation: HF- High frequency; LF- Low frequency; RMSE: Root mean square error

133
Figure 6.2: MMG-RMS amplitude versus standing time during LF and HF FES-
evoked fatiguing contractions within the first 70 s.

134
Table 6.4: Total standing time to failure during the two stimulation protocols.
The values reported for each participant represent the mean of two standing trials for
each stimulation frequency.
Participants
Standing time (s)
HF (35 Hz) LF (20 Hz) Difference (LF-HF)
1 516.5 447.5 -69
2 233.5 479.0 245.5
3 102.5 186 84.5
4 72.5 103.5 31.0
Abbreviation: HF- High stimulation frequency; LF- Low stimulation frequency. The values reported for
the HF and LF are mean values of two standing trials.
6.6 Discussion
This study investigated the manifestation of muscle fatigue in MMG amplitude
characteristics during FES-supported standing until knee buckle, in order to study its
application as a fatigue-failure proxy during a critical daily-living task in adults with
motor complete SCI. The relationship between the MMG signal decline and time to
quadriceps fatigue-failure was also explored between two disparate neurostimulation
frequencies, known to produce different standing durations in this population (Kralj et
al., 1986). In a case series of FES-trained individuals, who were capable of short-duration
(~72 s) to long-duration (~516 s) stance, MMG-RMS displayed fatigue curves similar to
those observed on a laboratory muscle torque measurement or dynamometer (Barry et al.,
1992; Levy et al., 1990; Rabischong & Chavet, 1997; Russ et al., 2002).
6.6.1 Relationship between MMG amplitude characteristic and duration of
sustained standing-to-fatigue failure
To quantify muscle performance in the present experimental context, MMG-RMS
amplitude was employed. The MMG amplitude (Gobbo et al., 2006; Orizio et al., 2003)
has been previously reported as an indicator of muscle fatigue as a change in MMG
amplitude parameter are related to the motor unit activation pattern during FES-evoked
muscle fatiguing contraction. Moreover, the MMG amplitude characteristics could reflect

135
the failure in excitation-contraction coupling due to muscle fatigue (Fitts, 1994; Søgaard
et al., 2003). In the present study, the main outcomes of muscle fatigue measurements
were the reduction in knee angle (Figure 6.1) and a decline MMG-RMS over the time
during FES-supported standing to failure. As evident from Figure 6.2, a decline of muscle
force-generating capacity was apparent as early as the first 10 s of FES-evoked muscle
contractions. Notably, the muscle fatigue profile in paralyzed quadriceps muscles could
be accurately characterized by an exponential decay model (Figure 6.2, Table 6.3). This
may suggest that denervated quadriceps muscle fatigue during standing may follow a
double exponential behavior (Mizrahi et al., 1997; Rabischong & Chavet, 1997), with
“fast” (more rapid) and “slow” (later onset) components, and that the associated knee
angle reduction could be clearly mirrored by MMG amplitude responses. Specifically,
MMG amplitude adapted quickly to the time variation in muscle responses during
fatiguing contractions. Therefore, MMG signals could potentially provide an indication
of muscle performance, and be used to monitor this during continuous repetitive
neurostimulation-evoked contractions that might be required to effect prolonged standing
in this population.
6.6.2 Effects of the stimulation frequency on the MMG response to muscle
failure
Muscle fatigue is time-varying and it affects the response of a muscle to the FES-
evoked contractions. In particular, during high-intensity repetitive application of FES for
antigravity activities (Kralj et al., 1986) such as in standing-up and sustained stance where
muscle fatigue could be manifested in about 60 s of muscle contractions (Thrasher &
Popovic, 2008).
The results obtained, of a generally longer-standing duration in LF neurostimulation
was comparable to the findings of Kralj and co-workers (1986), who identified that in
136
comparison with an HF protocol, low stimulation frequency delayed the onset of muscle
fatigue, but usually at the expense of muscle force production (Kralj et al., 1986). Our
observations on the different stimulation protocols (HF and LF) clearly indicated the same
pattern of contraction duration with a faster MMG amplitude drop in HF in comparison
with LF protocol. This may suggest a higher rate of muscle force decay in the HF curve
as mirrored by the MMG-RMS amplitude. Therefore, the present study compares
favourably with those of Kralj and colleagues (1986) who identified a higher rate of force
decay at high stimulation intensity levels while the changes of MMG-RMS as evident
from the present study has been consistently described as a good measure of muscle
fatigue (Søgaard et al., 2003).
Additionally, the shorter standing duration during HF (Table 6.4) (except for
participant 1, probably due to his uncontrollable propensity for posture switching, as there
was no special arrangement for body movement restriction to a particular plane (Jaime et
al., 2002) was probably due to the greater quadriceps contraction forces produced by a
continuous stimulation (Braz et al., 2015) at a relatively higher stimulation frequency.
This has been attributed (Chou & Binder-Macleod, 2007) to the effect of contractile speed
in relation to the frequency of stimulation. The higher the frequency, the higher the
muscle force production, but at a reduced time for muscle to fatigue especially in muscle
with predominantly fast fatigueable fibres (Ibitoye et al., 2016; Kralj et al., 1986).
Moreover, this phenomenon might be due to an increase in muscle fibres’ recruitment
and the consequent increase in quadriceps oxygen demand (Braz et al., 2015) which
suggests a reduction in muscle effort and an indication of a reduced motor activity.
The following limitations are acknowledged in the present study: based on the
experimental setting, the muscle force reduction during the standing challenge, as well as
the individual muscle power, a function of the rate of muscle force generation that is

137
responsible for standing (Crosbie et al., 2014), could not be calculated. Nevertheless, the
drop in MMG amplitude adopted in the present study to investigate muscle fatigue has
been previously correlated (Gobbo et al., 2006) with muscle force during “seated”
electrical stimulus fatigue contraction in healthy volunteers. Although the fatigue profile
with an exponential function has been described, phases of the fatigue profile could not
be identified based on our experimental data. Further studies that seek to address this
limitation and rigorously validate the generalization ability of the model in larger study
participants will be of clinical interest.
Second, although we chose to utilize a case series of SCI individuals with disparate
FES-evoked standing times in this ‘proof of concept’ study, the authors were unable to
undertake parametric statistical analyses of curve-fitting regression parameters of HF
versus LF standing times through traditional repeated-measures analyses, due to the small
sample size that we had selected.
6.6.3 Potential clinical implication
Although to date, the use of FES is commonly based on the manual control of
stimulation intensity with the associated rapid muscle fatigue, an improved efficient
control of stimulation parameters based on closed-loop modulation of FES parameters
(pulse width, frequency, and current or voltage) is a focus of various research centres.
This is partly due to the fact that other alternatives for restoration of motor function after
a SCI including stem cell therapy are not currently available (Bryson et al., 2016). A
realistic alternative is the application of a proxy of generated muscle performance in
closing the loop of FES systems in order to promote the efficacy of the technology in
clinical use. Therefore, tracking muscle fatigue pattern during FES-evoked contractions
remains an important step in ensuring an efficient FES utility to improve muscle response
as the fatigue profile has been derived by curve-fitting MMG-RMS of quadriceps

138
muscles. Thus, the present finding offers a new knowledge on the probable application of
the MMG signal as a simple fatigue tracking sensor.
Moreover, as fatigue profile modeling is vital to the optimization of skeletal muscle
performance (Dugan & Frontera, 2000), MMG, which is stimulation artifact free
(Yamaguchi et al., 2012), could be used to track muscle contraction during an FES-
evoked fatigue failure task (Blangsted et al., 2005; Søgaard et al., 2003). This is unlike
evoked-electromyography which may continue to increase with increasing motor unit
recruitment even with a reduced muscle effort/force due to fatigue (Falla & Farina, 2008).
The implication of this finding could be for the use of MMG signals in modulating the
FES parameters, at least, as to implement a binary switch for FES system as the amplitude
characteristics of MMG has been shown to change with FES-evoked fatigue contractions
as previously proposed by Gobbo and colleagues (Gobbo et al., 2006) in healthy
volunteers.
6.7 Conclusion
Although the results of the present investigation should be further verified in larger
participant size with pathological muscle conditions, the study has shown that MMG
signal could track the FES-evoked muscle fatiguing contractions. Specifically, the signal
has been shown to monitor muscle fatigue development during repetitive contractions and
over an extended contraction duration during FES-supported standing in persons with
SCI. This result provided further evidence of the potential use of MMG as a proxy of
fatigue with specific relevance in situations where an objective measure of muscle force
may be needed, such as in biofeedback control of FES-evoked contractions to prolong the
contraction duration. Furthermore, as a “known fatigue equation”, the exponential
function has been shown as a relevant paralyzed quadriceps muscle fatigue model during
FES-supported standing challenge. The MMG-RMS pattern during sustained isometric

139
contractions of the quadriceps muscle due to fatigue is of particular relevance in using the
signal as a muscle fatigue sensor in any related tasks that involved repetitive electrical
stimulation contractions.

140
CHAPTER 7: CONCLUSION AND RECOMMENDATION
This Chapter summarizes the findings from various experiments and analyses
conducted within this thesis. In addition, the relationship between each Chapter,
limitations of the study and recommendation for future works are discussed.
7.1 Conclusion
This thesis is generally focused on the experimental investigation of the potential of
mechanomyography (MMG) as a proxy of NMES-evoked muscle force/torque for NMES
control applications. The findings from this thesis may also be useful for the application
of MMG signal to monitor progress in NMES therapies or following NMES rehabilitative
exercise interventions. As mentioned in the introductory Chapter of this thesis, three
specific objectives were investigated to actualize the main objective.
To develop a hybrid procedure to demonstrate MMG signal as a proxy of NMES-
evoked muscle force in healthy volunteers.
Findings from Chapter 3 showed that the MMG signal is a promising NMES-evoked
muscle force or torque proxy. Specifically, the support vector regression (SVR)
estimation of NMES-evoked torque has been demonstrated using MMG signal in healthy
volunteers. To the author’s knowledge, the proposed methodology represented a unique
attempt to assess the knee extensor force via joint torque, though in a controlled laboratory
setting.
To deploy the developed procedure for studying the reliability of MMG signal as a
proxy of muscle force during NMES supported knee extension task in persons with
SCI.

141
Findings from Chapter 4 revealed that the MMG signal is highly correlated with the
knee extensor torque and the relationship was also reliable. An important new information
on the sensitivity of MMG signal to the muscle force modulation (i.e., incremental motor
unit recruitment) was evident. Moreover, in Chapter 5, an NMES-evoked torque
estimation model was constructed from the paralyzed quadriceps MMG signals using
SVR modelling with both gaussian and polynomial kernel functions. The finding from
the Chapter demonstrated a good predictive accuracy of the proposed SVR model with
capability for generalization. This provided further evidence for MMG signal as a proxy
of NMES-evoked torque production during isometric knee extension tasks. Therefore,
findings from Chapter 4 and 5 collectively provide an important new information with
implication for the use of muscle contractions signal (MMG) to regulate NMES
parameters.
To demonstrate the potential relevance of MMG signal as a useful parameter for
studying muscle fatigue during a critical knee buckling stress due to a sustained
NMES-supported standing to fatigue failure task.
Findings from Chapter 6 preliminarily showed that the MMG signals might track the
muscle fatigue development during a critical task such as NMES-sustained standing in
persons with motor complete SCI. The finding suggested that MMG signals may be useful
as a muscle fatigue sensor in situations where a real-time muscle force and fatigue
measurement is impractical. Therefore, the signal has an important application in
biomechanics research pertaining to the evaluation of the “potency” of muscle
contractions to sustain standing or ambulation task.
Overall, the feasibility of the muscle MMG signal as a proxy of NMES-evoked torque
in both healthy and motor complete spinally injured persons has been demonstrated, for
142
the first time, without the need to contend with the issue of stimulation artifact that often
characterizes the application of the prominent biopotential signal (i.e., electromyography)
which is used traditionally for an indirect muscle force/torque assessment. In addition,
the present finding implied that the difficulty of a reliable NMES-evoked muscle force
estimation may be resolved with a physically small sensor (MMG sensor) as compared to
the “gold standard” and laboratory-bound isokinetic dynamometer for torque
measurement. Next, the synergy between the chapters is enumerated.
(i) The critical systematic literature search conducted in Chapter 2 revealed the
limitations of the application of current NMES technologies in the routine clinical
practice. The foremost limitation established was the lack of flexibility in torque
control which a non-invasive and artifact-free muscle signal source could improve
through the application of the signal as NMES control signal. Therefore, to
promote effective NMES therapies and for a wider clinical prominence of the
NMES technologies, this thesis sought to resolve a number of issues concerning
a reliable muscle signal (MMG) as a proxy of NMES-evoked torque for feedback
applications.
(ii) The first experimental design as presented in Chapter 3 on healthy volunteers,
revealed that the MMG signal could clearly track the incremental muscle force
production or motor unit recruitment as measured by a commercial isokinetic
dynamometer. The study also justified the feasibility of the experimental setting
and allowed the conception of the adjustment required for the application of the
same protocol to persons with SCI.
(iii) Based on the results obtained from the experiment conducted in Chapter 3 and
apart from the adjustment made for the safety of the participants’ musculoskeletal
health, a similar experiment performed in persons with motor complete SCI as

143
described in Chapter 4 demonstrated a reliable muscle torque measurement with
MMG signal amplitude. Meanwhile, the frequency of MMG signal was shown to
approximate the stimulation frequency and thus, suggestive of motor unit firing
frequency.
(iv) In Chapter 5, an estimation of the torque production from MMG signal amplitude
and other related parameters that may affect the torque production was conducted
using a SVR model in persons with motor complete SCI. Being robust in handling
multivariate input parameters, the SVR modelling results demonstrated a good
torque predictive accuracy. Taken together, the results obtained from Chapters 4
and 5 showed that MMG signal (input to the model) could be successfully used to
estimate the NMES-evoked muscle torque (output of the model) as these two
variables (MMG versus torque) were found to be highly positively correlated.
(v) Based on the findings from Chapter 4 and 5, Chapter 6 demonstrated the potential
application of MMG signal as a muscle fatigue sensor during a typical clinical
critical task i.e. NMES supported standing. The preliminary results obtained in
four persons with motor complete SCI showed that the signal could be used to
track the muscle fatigue contractions. However, the advanced technique that may
have been used to measure muscle force during NMES-evoked standing, such as
inverse dynamics approach, is outside the scope of this thesis and its complexity
for force estimation is absent in the proposed MMG signal modality. Therefore,
the potential application of MMG signal to monitor muscle states during NMES-
evoked fatigue contractions is another important knowledge derived from this
study. Generally, the implication of these findings favours the implementation of
a muscle mechanical response-controlled NMES technology as a measure of
muscle activity can be used as a NMES control signal. Therefore, the present study
is a part of the current research efforts to apply MMG signal as a muscle force

144
sensor in order to facilitate the implementation of a flexible and portable NMES
systems which could be used in the routine clinical rehabilitation practice.
The following are the descriptions of the thesis’s accomplishments followed by
detailed illustrations.
7.2 Contributions
To arrive at the conclusion, the following results highlight the specific contributions
of the thesis:
(i) Findings from the first objective showed a good association between MMG signal
amplitude and NMES-evoked torque as revealed by a high coefficient of
determination (R2) with a low RMSE using gaussian kernel function of SVR
modelling. This finding suggested the legitimacy of using MMG signals as a
proxy NMES-evoked muscle force in healthy volunteers and supported further
investigation in persons with neurological conditions.
(ii) The second investigation revealed a high correlation coefficient (r) between the
MMG amplitude characteristics and stimulation/contraction intensity versus
NMES-evoked torque. This led to the study reported in Chapter 5, on torque
prediction from MMG signal using SVR modelling, conducted on a wider study
population. The study demonstrated a high R2 and low RMSE across the study’s
participants. These findings have implications in some fields including
biomechanics, rehabilitation medicine and rehabilitation engineering where
NMES technologies are used as a mode of muscle performance improvement and
rehabilitative intervention.
(iii) The implications of the aforementioned findings on the muscle fatigue tracking
by MMG signal were demonstrated in the third objective in persons with motor

145
complete SCI. Specifically, MMG signal was used to track the NMES supported
standing until fatigue failure as indicated by knee buckle. Sustained quadriceps
muscle contractions for 70 s duration between 80-120 mA stimulation intensity
level resulted in a continuous muscle fatigue as reflected by a simultaneous
decrease in MMG amplitude and the knee angle reduction over the contraction
time. Having demonstrated the use of MMG signal to track muscle fatigue
contractions, this study further supported the legitimacy of MMG signal as a
feedback signal source for muscle state responses during NMES application for
critical tasks such as in sustained standing in persons with SCI.
Collectively, these findings open the possibility of a paradigm shift in the perception
of a possible wider application of NMES technology to improve function in a wide range
of neurological disabilities. As the MMG signal has been demonstrated as a simple and
non-invasive proxy of muscle force, the signal could be further explored to impact clinical
decisions regarding NMES rehabilitation progression in clinical populations. Moreover,
the application of MMG as an NMES control signal promises to improve the efficiency
of the NMES technology and quality of life in persons with SCI. The overall results of
this thesis suggest the feasibility of the MMG modality as an NMES feedback signal
source and SVR as valid prediction algorithm.
Finally, a new method of NMES-evoked muscle force based on MMG signals has been
presented, together with the hybrid procedure on the acquisition of torque production in
both healthy and spinally injured populations. Moreover, in a selected group of SCI
population, who are good candidates for NMES supported standing, i.e. those with low
tetraplegia (C5-C8) and paraplegia (T1-T12) (Davis et al., 2001), this thesis has
demonstrated the collection of MMG signal from their quadriceps muscles during NMES-
evoked supported standing for potential application of the signal as fatigue failure sensor.

146
Therefore, it can be safely envisaged that the MMG signal as a muscle force and fatigue
sensor for feedback applications has an important role in advancing the current status of
NMES technologies, and therefore worthy of further investigations, either alone or in
combination with other methods that could be used to sense muscle contraction responses.
7.3 Study Limitations
The author acknowledges the following limitations of the thesis: the MMG response
during electrical stimulus contractions has been demonstrated using data from
participants with motor complete SCI, whether the same procedure could be used to
obtain a similar or better results in persons with other classes of neurological lesions was
not verified. Additionally, the present investigations are based on the
surface/transcutaneous electrical stimulation, the results may have limited application for
functional application such as in ambulation training. Specifically, with surface
stimulation approach, the activation of hip flexors required for an effective ambulation
(Hardin et al., 2007) may not be directly stimulated (Thrasher & Popovic, 2008).
Therefore, percutaneous or implanted stimulation approach may be of greater interest in
relating MMG signal to NMES responses as this stimulation approach is characterized by
an improved muscle selectively and ability to stimulate deeper muscles required for
effective ambulation training (Hardin et al., 2007; Kobetic et al., 1997).
Nevertheless, as the present study is based on the experimental investigation of MMG
signal as a proxy of NMES-evoked muscle force/torque, the methodology described
herein could be considered mature enough for the validity of the MMG as a control signal
for NMES systems. Therefore, this thesis provides a solid platform for the practical
realization of a closed-loop NMES systems with muscle mechanomyographic signal as a
potential feedback source.
147
7.4 Recommendation for Future Research
For more than five decades now, there have been increasing attempts on the application
of NMES technologies for the restoration of the impaired or lost neuromuscular functions
following a SCI. To date, the general principle of ensuring a safe activation of
neuromusculature as well as the methods of generating stable muscle contractions have
been established. However, integrating these commendable research efforts to provide
effective therapeutic and functional gains that are clinically significant is still challenging.
For example, open-loop NMES technologies have been more widely used, particularly
for therapeutic exercise, which is of limited clinical relevance. While the closed-loop
NMES technologies have proven to be of a better clinical relevance, their full realization
remains an interesting open research question, particularly due to the lack of a non-
invasive and reliable method of assessment of NMES-evoked muscle activities (Popović,
2014).
Based on this premise, NMES application is still perceived as an experimental
procedure rather than a routine clinical practice (Thrasher & Popovic, 2008). Therefore,
NMES technologies have been so far hesitant to fully restore the inactivity associated
with SCI, identification of a reliable proxy of the response of neuromuscular activity to
NMES-evoked muscle force has been suggested as a feedback source for NMES closed-
loop control implementation. Thus, the result of this present investigation and related
studies from other research centres will continue to be relevant to the implementation of
an effective closed-loop NMES systems for the rehabilitation of persons with
neurological conditions until the neural stem cell regenerative therapies, which has been
proposed for neuroregeneration of axons, emerge (Bryson et al., 2016). Even with that,
“NMES will still be needed to train stem cells to learn” (Popovic, 2012). Accordingly,
advancing NMES technology to significantly impact the lives of persons with SCI is

148
achievable rather than “waiting for science to find methods to regenerate axons within
the injured spinal cord” (Ragnarsson, 2007).
Towards advancing the NMES technology, the present thesis has demonstrated the
potential relevance of MMG as a biofeedback control signal for NMES feedback
applications. However, being in early stage, the findings reported herein require further
research. Specifically, in the development and implementation of MMG-based NMES
technologies. Such research should focus on identifying an appropriate strategy for
implementation, as well as determine how to optimally apply the neuromuscular
information from the MMG signal to implement a closed-loop NMES systems. Such
effort should also develop as well as integrate control algorithms that will allow an
automation of muscle performance classification and pattern recognition. Moreover, such
future studies may also elucidate the best modality for probable commercialization of this
technology.
Following an adequate clinical progress, it can be surmised that a new generation of
NMES systems will be available in the near future based on advances in MMG
measurements and processes. Such a progress is expected to offer a substantial clinical
benefit to promote the health of persons with spinal cord injury.

149
REFERENCES
Adams, G. R., Harris, R. T., Woodard, D., & Dudley, G. A. (1993). Mapping of electrical
muscle stimulation using MRI. Journal of Applied Physiology, 74(2), 532-537.
Akande, K. O., Owolabi, T. O., & Olatunji, S. O. (2015). Investigating the effect of
correlation-based feature selection on the performance of support vector machines
in reservoir characterization. Journal of Natural Gas Science and Engineering,
22, 515-522. doi:http://dx.doi.org/10.1016/j.jngse.2015.01.007
Akataki, K., Mita, K., & Itoh, Y. (1999). Relationship between mechanomyogram and
force during voluntary contractions reinvestigated using spectral decomposition.
European Journal of Applied Physiology and Occupational Physiology, 80(3),
173-179. doi:DOI 10.1007/s004210050578
Akataki, K., Mita, K., & Watakabe, M. (2004). Electromyographic and
mechanomyographic estimation of motor unit activation strategy in voluntary
force production. Electromyography and Clinical Neurophysiology, 44(8), 489-
496.
Akbani, R., Kwek, S., & Japkowicz, N. (2004). Applying Support Vector Machines to
Imbalanced Datasets. In J.-F. Boulicaut, F. Esposito, F. Giannotti, & D. Pedreschi
(Eds.), Machine Learning: ECML 2004 (Vol. 3201, pp. 39-50): Springer Berlin
Heidelberg.
Al-Majed, A. A., Neumann, C. M., Brushart, T. M., & Gordon, T. (2000). Brief Electrical
Stimulation Promotes the Speed and Accuracy of Motor Axonal Regeneration.
The Journal of Neuroscience, 20(7), 2602-2608.
Al-Mulla, M. R., Sepulveda, F., & Colley, M. (2011). A Review of Non-Invasive
Techniques to Detect and Predict Localised Muscle Fatigue. Sensors, 11(4), 3545-
3594.
Allen, D. G., Lamb, G. D., & Westerblad, H. (2008). Skeletal Muscle Fatigue: Cellular
Mechanisms. Physiological Reviews, 88(1), 287-332.
doi:10.1152/physrev.00015.2007
Alves, N., & Chau, T. (2010a). The design and testing of a novel mechanomyogram-
driven switch controlled by small eyebrow movements. Journal of
Neuroengineering and Rehabilitation, 7(1), 1-10. doi:10.1186/1743-0003-7-22
Alves, N., & Chau, T. (2010b). Uncovering patterns of forearm muscle activity using
multi-channel mechanomyography. Journal of Electromyography and
Kinesiology, 20(5), 777-786. doi:http://dx.doi.org/10.1016/j.jelekin.2009.09.003
Alves, N., Falk, T. H., & Chau, T. (2010). A novel integrated mechanomyogram-
vocalization access solution. Medical Engineering & Physics, 32(8), 940-944.
Ameri, A., Kamavuako, E. N., Scheme, E. J., Englehart, K. B., & Parker, P. A. (2014).
Support Vector Regression for Improved Real-Time, Simultaneous Myoelectric

150
Control. IEEE Transactions on Neural Systems and Rehabilitation Engineering,
22(6), 1198-1209. doi:10.1109/TNSRE.2014.2323576
Babault, N., Pousson, M., Ballay, Y., & Van Hoecke, J. (2001). Activation of human
quadriceps femoris during isometric, concentric, and eccentric contractions.
Journal of Applied Physiology, 91(6), 2628-2634.
Bajd, T., Kralj, A., Šega, J., Turk, R., Benko, H., & Strojnik, P. (1981). Use of a Two-
Channel Functional Electrical Stimulator to Stand Paraplegic Patients. Physical
Therapy, 61(4), 526-527.
Bajd, T., Kralj, A., & Turk, R. (1982). Standing-up of a healthy subject and a paraplegic
patient. Journal of Biomechanics, 15(1), 1-10.
Bajd, T., & Munih, M. (2010). Basic functional electrical stimulation (FES) of
extremities: An engineer's view. Technol. Health Care, 18(4,5), 361-369.
Bajd, T., Munih, M., & Kralj, A. (1999). Problems associated with FES-standing in
paraplegia. Technol Health Care, 7(4), 301-308.
Barry, D. T. (1987). Acoustic signals from frog skeletal muscle. Biophysical journal,
51(5), 769-773. doi:http://dx.doi.org/10.1016/S0006-3495(87)83403-3
Barry, D. T. (1992). Vibrations and sounds from evoked muscle twitches.
Electromyography and Clinical Neurophysiology, 32(1-2), 35-40.
Barry, D. T., & Cole, N. M. (1990). Muscle sounds are emitted at the resonant frequencies
of skeletal muscle. IEEE TRANSACTIONS ON BIOMEDICAL ENGINEERING,
37(5), 525-531. doi:10.1109/10.55644
Barry, D. T., Geiringer, S. R., & Ball, R. D. (1985). Acoustic myography: A noninvasive
monitor of motor unit fatigue. Muscle & Nerve, 8(3), 189-194.
doi:10.1002/mus.880080303
Barry, D. T., Hill, T., & Im, D. (1992). Muscle fatigue measured with evoked muscle
vibrations. Muscle & Nerve, 15(3), 303-309.
Barry, D. T., Leonard, J. A., Gitter, A. J., & Ball, R. D. (1986). Acoustic myography as a
control signal for an externally powered prosthesis. Archives of Physical Medicine
and Rehabilitation, 67(4), 267-269.
Basmajian, J. V., & De Luca, C. J. (1985). Muscles alive Muscles Alive: Their Functions
Revealed by Electromyography (5th ed., Vol. 278, pp. 126). Baltimore, MD:
Williams & Wilkins.
Beck, T. W., DeFreitas, J. M., & Stock, M. S. (2010). An examination of cross-talk among
surface mechanomyographic signals from the superficial quadriceps femoris
muscles during isometric muscle actions. Human Movement Science, 29(2), 165-
171. doi:http://dx.doi.org/10.1016/j.humov.2009.11.005

151
Beck, T. W., Dillon, M. A., DeFreitas, J. M., & Stock, M. S. (2009). Cross-correlation
analysis of mechanomyographic signals detected in two axes. Physiological
Measurement, 30(12), 1465.
Beck, T. W., Housh, T. J., Cramer, J. T., Weir, J. P., Johnson, G. O., Coburn, J. W., . . .
Mielke, M. (2005). Mechanomyographic amplitude and frequency responses
during dynamic muscle actions: a comprehensive review. Biomedical
Engineering Online, 4(1), 67. doi:10.1186/1475-925x-4-67
Beck, T. W., Housh, T. J., Johnson, G. O., Cramer, J. T., Weir, J. P., Coburn, J. W., &
Malek, M. H. (2007). Does the frequency content of the surface
mechanomyographic signal reflect motor unit firing rates? A brief review. Journal
of Electromyography and Kinesiology, 17(1), 1-13. doi:DOI
10.1016/j.jelekin.2005.12.002
Beck, T. W., Housh, T. J., Johnson, G. O., Weir, J. P., Cramer, J. T., Coburn, J. W., &
Malek, M. H. (2004). Mechanomyographic amplitude and mean power frequency
versus torque relationships during isokinetic and isometric muscle actions of the
biceps brachii. Journal of Electromyography and Kinesiology, 14(5), 555-564.
doi:http://dx.doi.org/10.1016/j.jelekin.2004.03.001
Ben-Hur, A., & Weston, J. (2010). A User’s Guide to Support Vector Machines. In O.
Carugo & F. Eisenhaber (Eds.), Data Mining Techniques for the Life Sciences (pp.
223-239). Totowa, NJ: Humana Press.
Bhadra, N. (2015). 2 - Physiological principles of electrical stimulation. In K. Kevin
(Ed.), Implantable Neuroprostheses for Restoring Function (pp. 13-43):
Woodhead Publishing/Elsevier.
Bickel, C. S., Gregory, C. M., & Dean, J. C. (2011). Motor unit recruitment during
neuromuscular electrical stimulation: a critical appraisal. European Journal of
Applied Physiology, 111(10), 2399-2407. doi:10.1007/s00421-011-2128-4
Bickel, C. S., Slade, J. M., VanHiel, L. R., Warren, G. L., & Dudley, G. A. (2004).
Variable-frequency-train stimulation of skeletal muscle after spinal cord injury.
Journal of Rehabilitation Research and Development, 41(1), 33-40.
Bickenbach, J., Bodine, C., Brown, D., Burns, A., Campbell, R., Cardenas, D., . . . Xiong,
X. (2013). International perspectives on spinal cord injury. (9241564660).
Geneva: World Health Organization.
Biering-Sørensen, B., Kristensen, I. B., Kjær, M., & Biering-Sørensen, F. (2009). Muscle
after spinal cord injury. Muscle & Nerve, 40(4), 499-519. doi:10.1002/mus.21391
Blair, E. A., & Erlanger, J. (1933). A comparison of the characteristics of axons through
their individual electrical responses. American Journal of Physiology -- Legacy
Content, 106(3), 524-564.
Blangsted, A. K., Sjogaard, G., Madeleine, P., Olsen, H. B., & Sogaard, K. (2005).
Voluntary low-force contraction elicits prolonged low-frequency fatigue and
changes in surface electromyography and mechanomyography. Journal of

152
Electromyography and Kinesiology, 15(2), 138-148. doi:DOI
10.1016/j.jelekin.2004.10.004
Blottner, D., & Salanova, M. (2015). Neuromuscular System The NeuroMuscular System:
From Earth to Space Life Science (1 ed., pp. 63-87): Springer.
Bogdanis, G. C. (2012). Effects of physical activity and inactivity on muscle fatigue.
Frontiers in Physiology, 3, 142. doi:10.3389/fphys.2012.00142
Bolton, C. F., Parkes, A., Thompson, T. R., Clark, M. R., & Sterne, C. J. (1989).
Recording sound from human skeletal muscle: Technical and physiological
aspects. Muscle & Nerve, 12(2), 126-134. doi:10.1002/mus.880120207
Boschen, K. A., Tonack, M., & Gargaro, J. (2003). Long-term adjustment and community
reintegration following spinal cord injury. International Journal of Rehabilitation
Research, 26(3), 157-164.
Botter, A., Oprandi, G., Lanfranco, F., Allasia, S., Maffiuletti, N. A., & Minetto, M. A.
(2011). Atlas of the muscle motor points for the lower limb: implications for
electrical stimulation procedures and electrode positioning. European Journal of
Applied Physiology, 111(10), 2461-2471. doi:10.1007/s00421-011-2093-y
Boyas, S., & Guével, A. (2011). Neuromuscular fatigue in healthy muscle: Underlying
factors and adaptation mechanisms. Annals of Physical and Rehabilitation
medicine, 54(2), 88-108. doi:http://dx.doi.org/10.1016/j.rehab.2011.01.001
Bray, M., & Han, D. (2004). Identification of support vector machines for runoff
modelling. Journal of Hydroinformatics, 6(4), 265-280.
Braz, G. P., Russold, M., & Davis, G. M. (2009). Functional electrical stimulation control
of standing and stepping after spinal cord injury: A review of technical
characteristics. Neuromodulation: Technology at the Neural Interface, 12(3), 180-
190.
Braz, G. P., Russold, M., Smith, R. M., & Davis, G. M. (2009). Efficacy and stability
performance of traditional versus motion sensor-assisted strategies for FES
standing. Journal of Biomechanics, 42(9), 1332-1338.
Braz, G. P., Russold, M. F., Fornusek, C., Hamzaid, N. A., Smith, R. M., & Davis, G. M.
(2015). Cardiorespiratory and Muscle Metabolic Responses During Conventional
Versus Motion Sensor-Assisted Strategies for Functional Electrical Stimulation
Standing After Spinal Cord Injury. Artificial Organs, 39(10), 855-862.
doi:10.1111/aor.12619
Brindley, G. S., Polkey, C. E., & Rushton, D. N. (1979). Electrical splinting of the knee
in paraplegia. Spinal Cord, 16(4), 428-435.
Brocherie, F., Babault, N., Cometti, G., Maffiuletti, N., & Chatard, J.-C. (2005).
Electrostimulation training effects on the physical performance of ice hockey
players. Medicine and Science in Sports and Exercise, 37(3), 455-460.
doi:10.1249/01.mss.0000155396.51293.9f

153
Brown, L. E., & Weir, J. P. (2001). ASEP procedures recommendation I: accurate
assessment of muscular strength and power. J Exerc Physiol, 4(3), 1-21.
Bryson, J. B., Machado, C. B., Lieberam, I., & Greensmith, L. (2016). Restoring motor
function using optogenetics and neural engraftment. Current Opinion in
Biotechnology, 40, 75-81. doi:http://dx.doi.org/10.1016/j.copbio.2016.02.016
Burden, A. (2010). How should we normalize electromyograms obtained from healthy
participants? What we have learned from over 25 years of research. Journal of
Electromyography and Kinesiology, 20(6), 1023-1035.
doi:http://dx.doi.org/10.1016/j.jelekin.2010.07.004
Burges, C. J. C. (1998). A Tutorial on Support Vector Machines for Pattern Recognition.
Data Mining and Knowledge Discovery, 2(2), 121-167.
doi:10.1023/A:1009715923555
Burnham, R., Martin, T., Stein, R., Bell, G., MacLean, I., & Steadward, R. (1997).
Skeletal muscle fibre type transformation following spinal cord injury. Spinal
Cord, 35(2), 86.
Cady, E. B., Jones, D. A., Lynn, J., & Newham, D. J. (1989). Changes in force and
intracellular metabolites during fatigue of human skeletal muscle. The Journal of
Physiology, 418(1), 311-325. doi:10.1113/jphysiol.1989.sp017842
Castellini, C., Artemiadis, P., Wininger, M., Ajoudani, A., Alimusaj, M., Bicchi, A., . . .
Scheme, E. (2014). Proceedings of the first workshop on Peripheral Machine
Interfaces: Going beyond traditional surface electromyography. Frontiers in
Neurorobotics, 8. doi:10.3389/fnbot.2014.00022
Castro, J. M., Apple Jr, F. D., Hillegass, A. E., & Dudley, A. G. (1999). Influence of
complete spinal cord injury on skeletal muscle cross-sectional area within the first
6 months of injury. European Journal of Applied Physiology and Occupational
Physiology, 80(4), 373-378. doi:10.1007/s004210050606
Cè, E., Rampichini, S., & Esposito, F. (2015). Novel insights into skeletal muscle function
by mechanomyography: from the laboratory to the field. Sport Sciences for
Health, 11(1), 1-28. doi:10.1007/s11332-015-0219-z
Cè, E., Rampichini, S., Limonta, E., & Esposito, F. (2013). Torque and mechanomyogram
correlations during muscle relaxation: Effects of fatigue and time-course of
recovery. Journal of Electromyography and Kinesiology, 23(6), 1295-1303.
Cescon, C., Farina, D., Gobbo, M., Merletti, R., & Orizio, C. (2004). Effect of
accelerometer location on mechanomyogram variables during voluntary,
constant-force contractions in three human muscles. Medical and Biological
Engineering and Computing, 42(1), 121-127.
Cescon, C., Madeleine, P., & Farina, D. (2008). Longitudinal and transverse propagation
of surface mechanomyographic waves generated by single motor unit activity.
Medical & Biological Engineering & Computing, 46(9), 871-877.

154
Cherkassky, V., & Ma, Y. (2004). Practical selection of SVM parameters and noise
estimation for SVM regression. Neural Networks, 17(1), 113-126.
doi:http://dx.doi.org/10.1016/S0893-6080(03)00169-2
Chesler, N. C., & Durfee, W. K. (1997). Surface EMG as a fatigue indicator during FES-
induced isometric muscle contractions. Journal of Electromyography and
Kinesiology, 7(1), 27-37. doi:http://dx.doi.org/10.1016/S1050-6411(96)00016-8
Chou, L.-W., & Binder-Macleod, S. A. (2007). The effects of stimulation frequency and
fatigue on the force–intensity relationship for human skeletal muscle. Clinical
Neurophysiology, 118(6), 1387-1396.
doi:http://dx.doi.org/10.1016/j.clinph.2007.02.028
Clarkson, H. M. (2000). Musculoskeletal assessment: joint range of motion and manual
muscle strength (2nd ed.). Philadelphia, PA, USA: Lippincott Williams &
Wilkins.
Coburn, J. W., Housh, T. J., Cramer, J. T., Weir, J. P., Miller, J. M., Beck, T. W., . . .
Johnson, G. O. (2004). Mechanomyographic time and frequency domain
responses of the vastus medialis muscle during submaximal to maximal isometric
and isokinetic muscle actions. Electromyography and Clinical Neurophysiology,
44(4), 247-255.
Coburn, J. W., Housh, T. J., Cramer, J. T., Weir, J. P., Miller, J. M., Beck, T. W., . . .
Johnson, G. O. (2005). Mechanomyographic and electromyographic responses of
the vastus medialis muscle during isometric and concentric muscle actions. The
Journal of Strength & Conditioning Research, 19(2), 412-420.
Collinger, J. L., Foldes, S., Bruns, T. M., Wodlinger, B., Gaunt, R., & Weber, D. J. (2013).
Neuroprosthetic technology for individuals with spinal cord injury. The Journal
of Spinal Cord Medicine, 36(4), 258-272.
doi:10.1179/2045772313Y.0000000128
Collins, D. F. (2007). Central Contributions to Contractions Evoked by Tetanic
Neuromuscular Electrical Stimulation. Exercise and Sport Sciences Reviews,
35(3), 102-109. doi:10.1097/jes.0b013e3180a0321b
Cortes, C., & Vapnik, V. (1995). Support-vector networks. Machine Learning, 20(3),
273-297. doi:10.1007/BF00994018
Courteville, A., Gharbi, T., & Cornu, J. Y. (1998). MMG measurement: a high-sensitivity
microphone-based sensor for clinical use. Biomedical Engineering, IEEE
Transactions on, 45(2), 145-150. doi:10.1109/10.661262
Crago, P. E., Peckham, P. H., & Thrope, G. B. (1980). Modulation of Muscle Force by
Recruitment During Intramuscular Stimulation. Biomedical Engineering, IEEE
Transactions on, BME-27(12), 679-684. doi:10.1109/TBME.1980.326592
Crameri, R. M., Weston, A., Climstein, M., Davis, G. M., & Sutton, J. R. (2002). Effects
of electrical stimulation-induced leg training on skeletal muscle adaptability in
155
spinal cord injury. Scandinavian Journal of Medicine & Science in Sports, 12(5),
316-322. doi:10.1034/j.1600-0838.2002.20106.x
Croce, R., Craft, A., Miller, J., Chamberlin, K., & Filipovic, D. (2015). Quadriceps
mechano- and electromyographic time-frequency responses during muscular
contractions to volitional exhaustion. Muscle & Nerve, 53(3), 452-463.
doi:10.1002/mus.24764
Crosbie, J., Russold, M., Raymond, J., Middleton, J. W., & Davis, G. M. (2009).
Functional Electrical Stimulation-Supported Interval Training Following
Sensorimotor-Complete Spinal Cord Injury: A Case Series. Neuromodulation:
Technology at the Neural Interface, 12(3), 224-231. doi:10.1111/j.1525-
1403.2009.00219.x
Crosbie, J., Tanhoffer, A. I. P., & Fornusek, C. (2014). FES assisted standing in people
with incomplete spinal cord injury: a single case design series. Spinal Cord, 52(3),
251-254.
Currier, D. P. (1984). Elements of research in physical therapy: Williams & Wilkins.
Curt, A., Keck, M. E., & Dietz, V. (1998). Functional outcome following spinal cord
injury: Significance of motor-evoked potentials and ASIA scores. Archives of
Physical Medicine and Rehabilitation, 79(1), 81-86.
doi:http://dx.doi.org/10.1016/S0003-9993(98)90213-1
Dalton, P. A., Comerford, M. J., & Stokes, M. J. (1992). Acoustic myography of the
human quadriceps muscle during intermittent fatiguing activity. J Neurol Sci,
109(1), 56-60.
Davis, G. M., Hamzaid, N. A., & Fornusek, C. (2008). Cardiorespiratory, Metabolic, and
Biomechanical Responses During Functional Electrical Stimulation Leg Exercise:
Health and Fitness Benefits. Artificial Organs, 32(8), 625-629.
doi:10.1111/j.1525-1594.2008.00622.x
Davis, J. A., Triolo, R. J., Uhlir, J., Bieri, C., Rohde, L., Lissy, D., & Kukke, S. (2001).
Preliminary performance of a surgically implanted neuroprosthesis for standing
and transfers--where do we stand? Journal of Rehabilitation Research and
Development, 38(6), 609-617.
Davis, R., Houdayer, T., Andrews, B., & Barriskill, A. (1999). Paraplegia: Prolonged
Standing Using Closed‐Loop Functional Electrical Stimulation and Andrews
Ankle‐Foot Orthosis. Artificial Organs, 23(5), 418-420.
Davoodi, R., & Andrews, B. J. (1999). Optimal control of FES-assisted standing up in
paraplegia using genetic algorithms. Medical Engineering & Physics, 21(9), 609-
617.
Decker, M. J., Griffin, L., Abraham, L. D., & Brandt, L. (2010). Alternating stimulation
of synergistic muscles during functional electrical stimulation cycling improves
endurance in persons with spinal cord injury. Journal of Electromyography and
Kinesiology, 20(6), 1163-1169.

156
Deley, G., Denuziller, J., Babault, N., & Taylor, J. A. (2015). Effects of electrical
stimulation pattern on quadriceps isometric force and fatigue in individuals with
spinal cord injury. Muscle & Nerve, 52(2), 260-264. doi:10.1002/mus.24530
Deley, G., Denuziller, J., Casillas, J.-M., & Babault, N. (2015). One year of training with
FES has impressive beneficial effects in a 36-year-old woman with spinal cord
injury. The Journal of Spinal Cord Medicine, 1-15.
doi:10.1080/10790268.2015.1117192
Diemont, B., Figini, M. M., Orizio, C., Perin, R., & Veicsteinas, A. (1988). Spectral
analysis of muscular sound at low and high contraction level. International
Journal of Bio-medical Computing, 23(3), 161-175.
Disselhorst-Klug, C., Schmitz-Rode, T., & Rau, G. (2009). Surface electromyography
and muscle force: Limits in sEMG–force relationship and new approaches for
applications. Clinical Biomechanics, 24(3), 225-235.
doi:http://dx.doi.org/10.1016/j.clinbiomech.2008.08.003
Ditunno, J. F., & Formal, C. S. (1994). Chronic Spinal Cord Injury. New England Journal
of Medicine, 330(8), 550-556. doi:doi:10.1056/NEJM199402243300808
Doucet, B. M., Lam, A., & Griffin, L. (2012). Neuromuscular electrical stimulation for
skeletal muscle function. The Yale Journal of Biology and Medicine, 85(2), 201-
215.
Dugan, S. A., & Frontera, W. R. (2000). Muscle fatigue and muscle injury. Physical
Medicine and Rehabilitation Clinics of North America, 11(2), 385-403.
Durand, D. M., Grill, W. M., & Kirsch, R. (2005). Electrical Stimulation of the
Neuromuscular System. In B. He (Ed.), Neural Engineering (pp. 157-191).
Boston, MA: Springer US.
Durfee, W. K., & Palmer, K. I. (1994). Estimation of force-activation, force-length, and
force-velocity properties in isolated, electrically stimulated muscle. Biomedical
Engineering, IEEE Transactions on, 41(3), 205-216. doi:10.1109/10.284939
Ebersole, K. T., Housh, T. J., Johnson, G. O., Evetovich, T. K., Smith, D. B., & Perry, S.
R. (1998). The effect of leg flexion angle on the mechanomyographic responses
to isometric muscle actions. European Journal of Applied Physiology and
Occupational Physiology, 78(3), 264-269. doi:10.1007/s004210050418
Edwards, R. H. (1983). Biochemical bases of fatigue in exercise performance: catastrophe
theory of muscular fatigue. In H. G. Vogel, H. G. Knuttgen, & Poortmans (Eds.),
Biochemistry of Exercise, Int Ser Sports Sci (Vol. 13, pp. 3-28). Champaign,
Illinois: Human Kinetics Publ.
Elek, J. M., & Dengler, R. (1995). Human Motor Units Studied by Intramuscular
Microstimulation. In S. Gandevia, R. Enoka, A. McComas, D. Stuart, C. Thomas,
& P. Pierce (Eds.), Fatigue (Vol. 384, pp. 161-171): Springer US.

157
Eng, J. J., Levins, S. M., Townson, A. F., Mah-Jones, D., Bremner, J., & Huston, G.
(2001). Use of Prolonged Standing for Individuals With Spinal Cord Injuries.
Physical Therapy, 81(8), 1392-1399.
Erdemir, A., McLean, S., Herzog, W., & van den Bogert, A. J. (2007). Model-based
estimation of muscle forces exerted during movements. Clinical Biomechanics,
22(2), 131-154. doi:http://dx.doi.org/10.1016/j.clinbiomech.2006.09.005
Eser, P. C., Donaldson, N., Knecht, H., & Stussi, E. (2003). Influence of different
stimulation frequencies on power output and fatigue during FES-cycling in
recently injured SCI people. Neural Systems and Rehabilitation Engineering,
IEEE Transactions on, 11(3), 236-240.
Esposito, F., Limonta, E., & Cè, E. (2011). Time course of stretching-induced changes in
mechanomyogram and force characteristics. Journal of Electromyography and
Kinesiology, 21(5), 795-802. doi:http://dx.doi.org/10.1016/j.jelekin.2011.07.012
Esposito, F., Orizio, C., & Veicsteinas, A. (1998). Electromyogram and
mechanomyogram changes in fresh and fatigued muscle during sustained
contraction in men. European Journal of Applied Physiology and Occupational
Physiology, 78(6), 494-501.
Esposito, F., Veicsteinas, A., Orizio, C., & Malgrati, D. (1996). Time and frequency
domain analysis of electromyogram and sound myogram in the elderly. European
Journal of Applied Physiology and Occupational Physiology, 73(6), 503-510.
doi:10.1007/bf00357671
Ethier, C., & Miller, L. E. (2015). Brain-controlled muscle stimulation for the restoration
of motor function. Neurobiology of Disease, 83, 180-190.
doi:http://dx.doi.org/10.1016/j.nbd.2014.10.014
Ewins, D. J., Taylor, P. N., Crook, S. E., Lipczynski, R. T., & Swain, I. D. (1988).
Practical low cost stand/sit system for midthoracic paraplegics. Journal of
Biomedical Engineering, 10(2), 184-188. doi:http://dx.doi.org/10.1016/0141-
5425(88)90098-2
Faghri, P. D., & Yount, J. (2002). Electrically induced and voluntary activation of
physiologic muscle pump: a comparison between spinal cord-injured and able-
bodied individuals. Clinical Rehabilitation, 16(8), 878-885.
Faghri, P. D., Yount, J. P., Pesce, W. J., Seetharama, S., & Votto, J. J. (2001). Circulatory
hypokinesis and functional electric stimulation during standing in persons with
spinal cord injury. Archives of Physical Medicine and Rehabilitation, 82(11),
1587-1595. doi:http://dx.doi.org/10.1053/apmr.2001.25984
Falla, D., & Farina, D. (2008). Non-uniform adaptation of motor unit discharge rates
during sustained static contraction of the upper trapezius muscle. Experimental
Brain Research, 191(3), 363-370.
Fara, S., Vikram, C. S., Gavriel, C., & Faisal, A. A. (2013). Robust, ultra low-cost mmg
system with brain-machine-interface applications. Paper presented at the Neural

158
Engineering (NER), 2013 6th International IEEE/EMBS Conference on, San
Diego, California.
Farina, D., Li, X., & Madeleine, P. (2008). Motor unit acceleration maps and interference
mechanomyographic distribution. Journal of Biomechanics, 41(13), 2843-2849.
Fawcett, J. W., Curt, A., Steeves, J. D., Coleman, W. P., Tuszynski, M. H., Lammertse,
D., . . . Short, D. (2007). Guidelines for the conduct of clinical trials for spinal
cord injury as developed by the ICCP panel: spontaneous recovery after spinal
cord injury and statistical power needed for therapeutic clinical trials. Spinal
Cord, 45(3), 190-205.
doi:http://www.nature.com/sc/journal/v45/n3/suppinfo/3102007s1.html
Fernandez, R. (1999). Predicting time series with a local support vector regression
machine. Paper presented at the ECCAI Advanced Course on Artificial
Intelligence (ACAI-1999), Chania, Greece.
Figini, M. M., & Diemont, B. (1989, 9-12 Nov 1989). Mathematics of the muscle sound.
Paper presented at the Engineering in Medicine and Biology Society, 1989.
Images of the Twenty-First Century., Proceedings of the Annual International
Conference of the IEEE Engineering in, Seattle, WA.
Fitts, R. H. (1994). Cellular mechanisms of muscle fatigue. Physiological Reviews, 74(1),
49-94.
Fouad, K., & Tetzlaff, W. (2012). Rehabilitative training and plasticity following spinal
cord injury. Experimental Neurology, 235(1), 91-99.
Frangioni, J. V., Kwan-Gett, T. S., Dobrunz, L. E., & McMahon, T. A. (1987). The
mechanism of low-frequency sound production in muscle. Biophysical Journal,
51(5), 775-783. doi:http://dx.doi.org/10.1016/S0006-3495(87)83404-5
Franken, H. M., Veltink, P. H., Tijsmans, R., Nijmeijer, H., & Boom, H. B. K. (1993).
Identification of passive knee joint and shank dynamics in paraplegics using
quadriceps stimulation. IEEE TRANSACTIONS ON REHABILITATION
ENGINEERING, 1(3), 154-164. doi:10.1109/86.279264
Fuglevand, A. J., Winter, D. A., Patla, A. E., & Stashuk, D. (1992). Detection of motor
unit action potentials with surface electrodes: influence of electrode size and
spacing. Biological Cybernetics, 67(2), 143-153.
Galea, M. P. (2012). Spinal cord injury and physical activity: preservation of the body.
Spinal Cord, 50(5), 344-351.
Galvani, M., & Volta, A. (1793). Account of Some Discoveries Made by Mr. Galvani, of
Bologna; With Experiments and Observations on Them. In Two Letters from Mr.
Alexander Volta, FRS Professor of Natural Philosophy in the University of Pavia,
to Mr. Tiberius Cavallo, FRS. Philosophical Transactions of the Royal Society of
London, 10-44.

159
Gandevia, S. C. (2001). Spinal and supraspinal factors in human muscle fatigue.
Physiological Reviews, 81(4), 1725-1789.
Garland, S. J., & Gossen, E. R. (2002). The Muscular Wisdom Hypothesis in Human
Muscle Fatigue. Exercise and Sport Sciences Reviews, 30(1), 45-49.
Gencoglu, M. T., & Uyar, M. (2009). Prediction of flashover voltage of insulators using
least squares support vector machines. Expert Systems with Applications, 36(7),
10789-10798. doi:http://dx.doi.org/10.1016/j.eswa.2009.02.021
Gerrits, K. H., Maganaris, C. N., Reeves, N. D., Sargeant, A. J., Jones, D. A., & de Haan,
A. (2005). Influence of knee joint angle on muscle properties of paralyzed and
nonparalyzed human knee extensors. Muscle & Nerve, 32(1), 73-80.
Gobbo, M., Cè, E., Diemont, B., Esposito, F., & Orizio, C. (2006). Torque and surface
mechanomyogram parallel reduction during fatiguing stimulation in human
muscles. European Journal of Applied Physiology, 97(1), 9-15.
doi:10.1007/s00421-006-0134-8
Goldenberg, M. S., Yack, H. J., Cerny, F. J., & Burton, H. W. (1991). Acoustic
myography as an indicator of force during sustained contractions of a small hand
muscle. Journal of Applied Physiology, 70(1), 87-91.
Gordon, G., & Holbourn, A. H. (1948). The sounds from single motor units in a
contracting muscle. The Journal of Physiology, 107(4), 456-464.
doi:10.1113/jphysiol.1948.sp004290
Gorgey, A. S., Caudill, C., & Khalil, R. E. (2016). Effects of once weekly NMES training
on knee extensors fatigue and body composition in a person with spinal cord
injury. The Journal of Spinal Cord Medicine, 39(1), 99-102.
doi:10.1179/2045772314Y.0000000293
Gorgey, A. S., Poarch, H. J., Dolbow, D. R., Castillo, T., & Gater, D. R. (2014). Effect
of adjusting pulse durations of functional electrical stimulation cycling on energy
expenditure and fatigue after spinal cord injury. Journal of Rehabilitation
Research & Development, 51(9), 1455-1468.
Granata, F., Gargano, R., & de Marinis, G. (2016). Support Vector Regression for
Rainfall-Runoff Modeling in Urban Drainage: A Comparison with the EPA’s
Storm Water Management Model. Water, 8(3), 69.
Graupe, D., & Kohn, K. H. (1998). Functional neuromuscular stimulator for short-
distance ambulation by certain thoracic-level spinal-cord-injured paraplegics.
Surgical Neurology, 50(3), 202-207. doi:http://dx.doi.org/10.1016/S0090-
3019(98)00074-3
Gregory, C. M., & Bickel, C. S. (2005). Recruitment patterns in human skeletal muscle
during electrical stimulation. Physical Therapy, 85(4), 358-364.
Griffin, L., Decker, M. J., Hwang, J. Y., Wang, B., Kitchen, K., Ding, Z., & Ivy, J. L.
(2009). Functional electrical stimulation cycling improves body composition,

160
metabolic and neural factors in persons with spinal cord injury. Journal of
Electromyography and Kinesiology, 19(4), 614-622.
doi:http://dx.doi.org/10.1016/j.jelekin.2008.03.002
Grill, W. M., & Kirsch, R. F. (2000). Neuroprosthetic Applications of Electrical
Stimulation. Assistive Technology, 12(1), 6-20.
doi:10.1080/10400435.2000.10132006
GÜler, N., & Koçer, S. (2005). Use of Support Vector Machines and Neural Network in
Diagnosis of Neuromuscular Disorders. Journal of Medical Systems, 29(3), 271-
284. doi:10.1007/s10916-005-5187-4
Gupta, S. M. (2007). Support vector machines based modelling of concrete strength.
World Academy of Science, Engineering and Technology, 36, 305-311.
Hamid, S., & Hayek, R. (2008). Role of electrical stimulation for rehabilitation and
regeneration after spinal cord injury: an overview. European Spine Journal, 17(9),
1256-1269.
Hamzaid, N. A., & Davis, G. M. (2009). Health and Fitness Benefits of Functional
Electrical Stimulation-Evoked Leg Exercise for Spinal Cord–Injured Individuals.
Topics in Spinal Cord Injury Rehabilitation, 14(4), 88-121.
Hardin, E., Kobetic, R., Murray, L., Corado-Ahmed, M., Pinault, G., Sakai, J., . . . Triolo,
R. J. (2007). Walking after incomplete spinal cord injury using an implanted FES
system: a case report. Journal of Rehabilitation Research and Development,
44(3), 333-346.
Hartkopp, A., Murphy, R. L., Mohr, T., Kjcer, M., & Biering-Sorensen, F. (1998). Bone
fracture during electrical stimulation of the quadriceps in a spinal cord injured
subject. Archives of Physical Medicine and Rehabilitation, 79(9), 1133-1136.
Hasnan, N., Ektas, N., Tanhoffer, A. I. P., Tanhoffer, R., Fornusek, C., Middleton, J. W.,
. . . Davis, G. M. (2013). Exercise Responses during Functional Electrical
Stimulation Cycling in Individuals with Spinal Cord Injury. Medicine & Science
in Sports & Exercise, 45(6), 1131-1138. doi:10.1249/MSS.0b013e3182805d5a
Hatsopoulos, N. G., & Donoghue, J. P. (2009). The science of neural interface systems.
Annual Review of Neuroscience, 32, 249-266.
doi:10.1146/annurev.neuro.051508.135241.
Haugland, M. K., & Sinkjaer, T. (1995). Cutaneous whole nerve recordings used for
correction of footdrop in hemiplegic man. Rehabilitation Engineering, IEEE
Transactions on, 3(4), 307-317. doi:10.1109/86.481970
Hayashibe, M., Zhang, Q., Guiraud, D., & Fattal, C. (2011). Evoked EMG-based torque
prediction under muscle fatigue in implanted neural stimulation. Journal of
Neural Engineering, 8(6), 064001.
Henneman, E. (1957). Relation between Size of Neurons and Their Susceptibility to
Discharge. Science, 126(3287), 1345-1347.

161
Henneman, E., Somjen, G., & Carpenter, D. O. (1965). Functional Significance of cell
size spinal motoneurons. Journal of Neurophysiology, 28(3), 560-580.
Hens, A. B., & Tiwari, M. K. (2012). Computational time reduction for credit scoring:
An integrated approach based on support vector machine and stratified sampling
method. Expert Systems with Applications, 39(8), 6774-6781.
doi:http://dx.doi.org/10.1016/j.eswa.2011.12.057
Herzog, W., Zhang, Y. T., Vaz, M. A., Guimaraes, A., & Janssen, C. (1994). Assessment
of muscular fatigue using vibromyography. Muscle & Nerve, 17(10), 1156-1161.
Hillegass, E. A., & Dudley, G. A. (1999). Surface electrical stimulation of skeletal muscle
after spinal cord injury. Spinal Cord, 37(4), 251-257.
Ho, C. H., Triolo, R. J., Elias, A. L., Kilgore, K. L., DiMarco, A. F., Bogie, K., . . .
Mushahwar, V. K. (2014). Functional Electrical Stimulation and Spinal Cord
Injury. Physical Medicine and Rehabilitation Clinics of North America, 25(3),
631-654. doi:http://dx.doi.org/10.1016/j.pmr.2014.05.001
Hoffer, J. A., Stein, R. B., Haugland, M. K., Sinkjaer, T., Durfee, W. K., Schwartz, A. B.,
. . . Kantor, C. (1996). Neural signals for command control and feedback in
functional neuromuscular stimulation: a review. Journal of Rehabilitation
Research and Development, 33(2), 145-157.
Hogan, N. (1985). The mechanics of multi-joint posture and movement control.
Biological Cybernetics, 52(5), 315-331. doi:10.1007/bf00355754
Hong-Bo, X., Yong-Ping, Z., & Jing-Yi, G. (2009). Classification of the
mechanomyogram signal using a wavelet packet transform and singular value
decomposition for multifunction prosthesis control. Physiological Measurement,
30(5), 441-457. doi:10.1088/0967-3334/30/5/002
Hornby, T. G., Lewek, M. D., Thompson, C. K., & Heitz, R. (2009). Repeated maximal
volitional effort contractions in human spinal cord injury: initial torque increases
and reduced fatigue. Neurorehabilitation and Neural Repair, 23(9), 928-938.
Houle, J. D., & Tessler, A. (2003). Repair of chronic spinal cord injury. Experimental
Neurology, 182(2), 247-260. doi:http://dx.doi.org/10.1016/S0014-
4886(03)00029-3
Hu, C.-H., Zhang, Q.-H., & Lin, W.-C. (2012). Sensorimotor Control for Human Motion
Generation—A Review. Journal of Neuroscience and Neuroengineering,
1(2), 161-179. doi:10.1166/jnsne.2012.1022
Hu, X. L., Tong, K. Y., & Li, L. (2007). The mechanomyography of persons after stroke
during isometric voluntary contractions. Journal of Electromyography and
Kinesiology, 17(4), 473-483. doi:http://dx.doi.org/10.1016/j.jelekin.2006.01.015
Huang, T.-M., Kecman, V., & Kopriva, I. (2006). Kernel based algorithms for mining
huge data sets: supervised, semi-supervised and unsupervised learning (Vol. 17).
Berlin, Heidelberg: Springer Verlag.
162
Hug, F., Goupille, C., Baum, D., Raiteri, B. J., Hodges, P. W., & Tucker, K. (2015).
Nature of the coupling between neural drive and force-generating capacity in the
human quadriceps muscle. Proceedings of the Royal Society of London B:
Biological Sciences, 282(1819). doi:10.1098/rspb.2015.1908
Hunter, S., White, M., & Thompson, M. (1998). Techniques to evaluate elderly human
muscle function: a physiological basis. The Journals of Gerontology Series A:
Biological Sciences and Medical Sciences, 53(3), B204-B216.
Ibitoye, M. O., Estigoni, E. H., Hamzaid, N. A., Abdul Wahab, A. K., & Davis, G. M.
(2014). The Effectiveness of FES-Evoked EMG Potentials to Assess Muscle
Force and Fatigue in Individuals with Spinal Cord Injury. Sensors, 14(7), 12598-
12622. doi:doi:10.3390/s140712598
Ibitoye, M. O., Hamzaid, N. A., Abdul Wahab, A., Hasnan, N., Olatunji, S. O., & Davis,
G. M. (2016). Estimation of Electrically-Evoked Knee Torque from
Mechanomyography Using Support Vector Regression. Sensors, 16(7), 1115.
Ibitoye, M. O., Hamzaid, N. A., Hasnan, N., Abdul Wahab, A. K., & Davis, G. M. (2016).
Strategies for Rapid Muscle Fatigue Reduction during FES Exercise in
Individuals with Spinal Cord Injury: A Systematic Review. PloS One, 11(2),
e0149024. doi:10.1371/journal.pone.0149024
Ibitoye, M. O., Hamzaid, N. A., Hasnan, N., Abdul Wahab, A. K., Islam, M. A., Kean,
V. S. P., & Davis, G. M. (2016). Torque and mechanomyogram relationships
during electrically-evoked isometric quadriceps contractions in persons with
spinal cord injury. Medical Engineering & Physics, 38(8), 767-775.
doi:http://dx.doi.org/10.1016/j.medengphy.2016.05.012
Ibitoye, M. O., Hamzaid, N. A., Zuniga, J. M., & Abdul Wahab, A. K. (2014).
Mechanomyography and Muscle Function Assessment: A Review of Current
State and Prospects. Clinical Biomechanics, 29(6), 691-704.
doi:http://dx.doi.org/10.1016/j.clinbiomech.2014.04.003
Ibitoye, M. O., Hamzaid, N. A., Zuniga, J. M., Hasnan, N., & Abdul Wahab, A. K. (2014).
Mechanomyographic Parameter Extraction Methods: An Appraisal for Clinical
Applications. Sensors, 14(12), 22940-22970.
Ibrahim, A., Lee, K. Y., Kanoo, L. L., Tan, C. H., Hamid, M. A., Hamedon, N. M. a., &
Haniff, J. (2013). Epidemiology of spinal cord injury in Hospital Kuala Lumpur.
Spine, 38(5), 419-424.
Jabre, J. F., & Spellman, N. T. (1996). The demonstration of the size principle in humans
using macro electromyography and precision decomposition. Muscle & Nerve,
19(3), 338-341. doi:10.1002/(SICI)1097-4598(199603)19:3<338::AID-
MUS9>3.0.CO;2-E
Jacobs, P. L., & Nash, M. S. (2004). Exercise Recommendations for Individuals with
Spinal Cord Injury. Sports Medicine, 34(11), 727-751. doi:10.2165/00007256-
200434110-00003

163
Jacobs, R., & van Ingen Schenau, G. J. (1992). Control of an external force in leg
extensions in humans. The Journal of Physiology, 457(1), 611-626.
doi:10.1113/jphysiol.1992.sp019397
Jaeger, R. J. (1986). Design and simulation of closed-loop electrical stimulation orthoses
for restoration of quiet standing in paraplegia. Journal of Biomechanics, 19(10),
825-835. doi:http://dx.doi.org/10.1016/0021-9290(86)90133-8
Jaeger, R. J. (1992). Lower Extremity Applications of Functional Neuromuscular
Stimulation. Assistive Technology, 4(1), 19-30.
doi:10.1080/10400435.1992.10132189
Jaeger, R. J., Yarkony, G. M., & Smith, R. M. (1989). Standing the spinal cord injured
patient by electrical stimulation: refinement of a protocol for clinical use.
Biomedical Engineering, IEEE Transactions on, 36(7), 720-728.
doi:10.1109/10.32104
Jaime, R. P., Matjacic, Z., & Hunt, K. J. (2002). Paraplegic standing supported by FES-
controlled ankle stiffness. Neural Systems and Rehabilitation Engineering, IEEE
Transactions on, 10(4), 239-248.
JDifool, & Looie496. (2009, 18 November 2009, 22:38 (UTC)). Nervous system
organization. Gross organization of the nervous system, with the peripheral
nervous system, the spinal and the cortical levels. Retrieved from
https://commons.wikimedia.org/w/index.php?curid=8484203
Jiang, H., & He, W. (2012). Grey relational grade in local support vector regression for
financial time series prediction. Expert Systems with Applications, 39(3), 2256-
2262. doi:http://dx.doi.org/10.1016/j.eswa.2011.07.100
Kagaya, H., Shimada, Y., Ebata, K., Sato, M., Sato, K., Yukawa, T., & Obinata, G.
(1995). Restoration and analysis of standing-up in complete paraplegia utilizing
functional electrical stimulation. Archives of Physical Medicine and
Rehabilitation, 76(9), 876–881.
Kantrowitz, A. (1963). Electronic Physiologic Aids. Brooklyn, NY: Maimonides Hosp.
Katsavelis, D., & Threlkeld, J. A. (2014). Quantifying thigh muscle co-activation during
isometric knee extension contractions: Within- and between-session reliability.
Journal of Electromyography and Kinesiology, 24(4), 502-507.
doi:http://dx.doi.org/10.1016/j.jelekin.2014.04.004
Kebaetse, M. B., Lee, S. C., Johnston, T. E., & Binder-Macleod, S. A. (2005). Strategies
that improve paralyzed human quadriceps femoris muscle performance during
repetitive, nonisometric contractions. Archives of Physical Medicine and
Rehabilitation, 86(11), 2157-2164.
Keidel, M., & Keidel, W.-D. (1989). The Computer-Vibromyography as a Biometric
Progress in Studying Muscle Function - Die Computer-Vibromyographie - Ein
biometrischer Ansatz zur Messung mechanischer Muskelaktivität.
164
Biomedizinische Technik/Biomedical Engineering, 34(5), 107.
doi:10.1515/bmte.1989.34.5.107
Keijzer, F., van Duijn, M., & Lyon, P. (2013). What nervous systems do: early evolution,
input–output, and the skin brain thesis. Adaptive Behavior, 21(2), 67-85.
doi:10.1177/1059712312465330
Keller, T., & Kuhn, A. (2008). Electrodes for transcutaneous (surface) electrical
stimulation. Journal of Automatic Control, 18(2), 35-45.
doi:10.2298/JAC0802035K
Kern, Hofer, Strohhofer, Mayr, Richter, & Stöhr. (1999). Standing Up with Denervated
Muscles in Humans Using Functional Electrical Stimulation. Artificial Organs,
23(5), 447-452. doi:10.1046/j.1525-1594.1999.06376.x
Kern, H., Hofer, C., Modlin, M., Mayr, W., Vindigni, V., Zampieri, S., . . . Carraro, U.
(2007). Stable muscle atrophy in long-term paraplegics with complete upper
motor neuron lesion from 3- to 20-year SCI. Spinal Cord, 46(4), 293-304.
Kern, H., Rossini, K., Carraro, U., & Mayr, W. (2005). Muscle biopsies show that FES
of denervated muscles reverses human muscle degeneration from permanent
spinal motoneuron lesion. Journal of Rehabilitation Research and Development,
42(3), 43.
Kimura, T., Hamada, T., Watanabe, T., Maeda, A., Oya, T., & Moritani, T. (2004).
Mechanomyographic responses in human biceps brachii and soleus during
sustained isometric contraction. European Journal of Applied Physiology, 92(4-
5), 533-539.
Kirshblum, S. C., Burns, S. P., Biering-Sorensen, F., Donovan, W., Graves, D. E., Jha,
A., . . . Waring, W. (2011). International standards for neurological classification
of spinal cord injury (Revised 2011). The Journal of Spinal Cord Medicine, 34(6),
535-546. doi:10.1179/204577211X13207446293695
Kluger, B. M., Krupp, L. B., & Enoka, R. M. (2013). Fatigue and fatigability in neurologic
illnesses Proposal for a unified taxonomy. Neurology, 80(4), 409-416.
Kobetic, R., & Marsolais, E. B. (1994). Synthesis of paraplegic gait with multichannel
functional neuromuscular stimulation. Rehabilitation Engineering, IEEE
Transactions on, 2(2), 66-79. doi:10.1109/86.313148
Kobetic, R., Triolo, R. J., & Marsolais, E. B. (1997). Muscle selection and walking
performance of multichannel FES systems for ambulation in paraplegia.
Rehabilitation Engineering, IEEE Transactions on, 5(1), 23-29.
doi:10.1109/86.559346
Kouzaki, M., Shinohara, M., & Fukunaga, T. (1999). Nonuniform mechanical activity of
quadriceps muscle during fatigue by repeated maximal voluntary contraction in
humans. Eur J. Applied Physiol, 80, 9-15.

165
Kralj, A., Bajd, T., Turk, R., & Benko, H. (1986). Posture switching for prolonging
functional electrical stimulation standing in paraplegic patients. Paraplegia, 24,
221-230.
Kralj, A. R., & Bajd, T. (1989). Functional electrical stimulation: standing and walking
after spinal cord injury (1 ed.). Boca Raton (FL) CRC press.
Kulig, K., Andrews, J. G., & Hay, J. G. (1984). Human strength curves. Exercise and
Sport Sciences Reviews, 12(1), 417-466.
Lala, D., Spaulding, S. J., Burke, S. M., & Houghton, P. E. (2015). Electrical stimulation
therapy for the treatment of pressure ulcers in individuals with spinal cord injury:
a systematic review and meta-analysis. International Wound Journal, n/a-n/a.
doi:10.1111/iwj.12446
Lam, T., Wolfe, D. L., Eng, J. J., & Domingo, A. (2010). Lower limb rehabilitation
following spinal cord injury. In J. J. Eng, R. W. Teasell, W. C. Miller, D. L. Wolfe,
A. F. Townson, J. T. C. Hsieh, S. J. Connolly, S. Mehta, & B. M. Sakakibara
(Eds.), Spinal Cord Injury Rehabilitation Evidence (Vol. 5, pp. 1-74). Vancouver,
Canada: ICORD.
Lammert, O., Jorgensen, F., & Einer-Jensen, N. (1976). Accelerometermyography
(AMG). I. Method for measuring mechanical vibrations from isometrically
contracted muscles. In P. V. Komi (Ed.), Biomechanics V-A (pp. 152-156).
Baltimore: University Park Press.
Lee, M., Kiernan, M. C., Macefield, V. G., Lee, B. B., & Lin, C. S.-Y. (2015). Short-term
peripheral nerve stimulation ameliorates axonal dysfunction after spinal cord
injury. Journal of Neurophysiology. doi:10.1152/jn.00839.2014
Lehman, G. J., & McGill, S. M. (1999). The importance of normalization in the
interpretation of surface electromyography: A proof of principle. Journal of
Manipulative and Physiological Therapeutics, 22(7), 444-446.
doi:http://dx.doi.org/10.1016/S0161-4754(99)70032-1
Lei, K. F., Tsai, W.-W., Lin, W.-Y., & Lee, M.-Y. (2011). MMG-torque estimation under
dynamic contractions. Paper presented at the Systems, Man, and Cybernetics
(SMC), 2011 IEEE International Conference on, Anchorage, Alaska, USA.
Levin, O., Mizrahi, J., & Isakov, E. (2000). Transcutaneous FES of the paralyzed
quadriceps:: is knee torque affected by unintended activation of the hamstrings?
Journal of Electromyography and Kinesiology, 10(1), 47-58.
doi:http://dx.doi.org/10.1016/S1050-6411(99)00016-4
Levy, M., Kushnir, T., Mizrahi, J., & Itzchak, Y. (1993). In vivo31P NMR studies of
paraplegics' muscles activated by functional electrical stimulation. Magnetic
Resonance in Medicine, 29(1), 53-58.
Levy, M., Mizrahi, J., & Susak, Z. (1990). Recruitment, force and fatigue characteristics
of quadriceps muscles of paraplegics isometrically activated by surface functional

166
electrical stimulation. Journal of Biomedical Engineering, 12(2), 150-156.
doi:http://dx.doi.org/10.1016/0141-5425(90)90136-B
Li, Z., Hayashibe, M., Fattal, C., & Guiraud, D. (2014). Muscle Fatigue Tracking with
Evoked EMG via Recurrent Neural Network: Toward Personalized
Neuroprosthetics. IEEE Computational Intelligence Magazine, 9(2), 38-46.
doi:10.1109/MCI.2014.2307224
Lin, S.-W., Ying, K.-C., Chen, S.-C., & Lee, Z.-J. (2008). Particle swarm optimization
for parameter determination and feature selection of support vector machines.
Expert Systems with Applications, 35(4), 1817-1824.
doi:http://dx.doi.org/10.1016/j.eswa.2007.08.088
Loeb, G. E., Walmsley, B., & Duysens, J. (1980). Obtaining proprioceptive information
from natural limbs: implantable transducers vs. somatosensory neuron recordings.
In M. R. Newman, D. G. Fleming, P. W. Cheung, & W. H. Ko (Eds.), Solid State
Physical Sensors for Biomedical Applications. Boca Raton, Florida: CRC.
Lynch, C. L., & Popovic, M. R. (2008). Functional Electrical Stimulation. Control
Systems, IEEE, 28(2), 40-50. doi:10.1109/MCS.2007.914689
Mackie, G. O. (1990). The Elementary Nervous System Revisited. American Zoologist,
30(4), 907-920. doi:10.1093/icb/30.4.907
Madeleine, P., & Arendt-Nielsen, L. (2005). Experimental muscle pain increases
mechanomyographic signal activity during sub-maximal isometric contractions.
Journal of Electromyography and Kinesiology, 15(1), 27-36. doi:DOI
10.1016/j.jelekin.2004.06.006
Madeleine, P., Farina, D., Merletti, R., & Arendt-Nielsen, L. (2002). Upper trapezius
muscle mechanomyographic and electromyographic activity in humans during
low force fatiguing and non-fatiguing contractions. European Journal of Applied
Physiology, 87(4-5), 327-336.
Maffiuletti, N. A. (2010). Physiological and methodological considerations for the use of
neuromuscular electrical stimulation. European Journal of Applied Physiology,
110(2), 223-234.
Mangold, S., Keller, T., Curt, A., & Dietz, V. (2004). Transcutaneous functional electrical
stimulation for grasping in subjects with cervical spinal cord injury. Spinal Cord,
43(1), 1-13.
Marek, S. M., Cramer, J. T., Fincher, A. L., Massey, L. L., Dangelmaier, S. M.,
Purkayastha, S., . . . Culbertson, J. Y. (2005). Acute Effects of Static and
Proprioceptive Neuromuscular Facilitation Stretching on Muscle Strength and
Power Output. Journal of Athletic Training, 40(2), 94-103.
Martin, R., Sadowsky, C., Obst, K., Meyer, B., & McDonald, J. (2012). Functional
electrical stimulation in spinal cord injury:: from theory to practice. Topics in
Spinal Cord Injury Rehabilitation, 18(1), 28-33. doi:10.1310/sci1801-28
167
Matheson, G. O., Maffey-Ward, L., Mooney, M., Ladly, K., Fung, T., & Zhang, Y. T.
(1997). Vibromyography as a quantitative measure of muscle force production.
Scandinavian Journal of Rehabilitation Medicine, 29(1), 29-35.
Mathiassen, S. E., Winkel, J., & Hägg, G. M. (1995). Normalization of surface EMG
amplitude from the upper trapezius muscle in ergonomic studies — A review.
Journal of Electromyography and Kinesiology, 5(4), 197-226.
doi:http://dx.doi.org/10.1016/1050-6411(94)00014-X
Maton, B., Petitjean, M., & Cnockaert, J. C. (1990). Phonomyogram and electromyogram
relationships with isometric force reinvestigated in man. European Journal of
Applied Physiology and Occupational Physiology, 60(3), 194-201.
doi:10.1007/bf00839159
McDonald, J. W., & Sadowsky, C. (2002). Spinal-cord injury. The Lancet, 359(9304),
417-425. doi:http://dx.doi.org/10.1016/S0140-6736(02)07603-1
McMillan, A. S., Sasaki, K., & Hannam, A. G. (1990). The estimation of motor unit
twitch tensions in the human masseter muscle by spike-triggered averaging.
Muscle & Nerve, 13(8), 697–703.
Merletti, R., Knaflitz, M., & De Luca, C. J. (1992). Electrically evoked myoelectric
signals. Crit Rev Biomed Eng, 19(4), 293-340.
Meyer, D., Leisch, F., & Hornik, K. (2003). The support vector machine under test.
Neurocomputing, 55(1–2), 169-186. doi:http://dx.doi.org/10.1016/S0925-
2312(03)00431-4
Mizrahi, J., Braun, Z., Najenson, T., & Graupe, D. (1985). Quantitative weightbearing
and gait evaluation of paraplegics using functional electrical stimulation. Medical
and Biological Engineering and Computing, 23(2), 101-107.
doi:10.1007/bf02456745
Mizrahi, J., Levin, O., Aviram, A., Isakov, E., & Susak, Z. (1997). Muscle fatigue in
interrupted stimulation: effect of partial recovery on force and EMG dynamics.
Journal of Electromyography and Kinesiology, 7(1), 51-65.
Mohammed, S., Poignet, P., Fraisse, P., & Guiraud, D. (2012). Toward lower limbs
movement restoration with input–output feedback linearization and model
predictive control through functional electrical stimulation. Control Engineering
Practice, 20(2), 182-195.
doi:http://dx.doi.org/10.1016/j.conengprac.2011.10.010
Mohr, T., Anderson, J. L., Biering-Sorensen, F., Galbo, H., Bangsbo, J., Wagner, A., &
Kjaer, M. (1997). Long term adaptation to electrically induced cycle training in
severe spinal cord injured individuals. Spinal Cord, 35(1), 1-16.
Mulder, A. J., Boom, H. B. K., Hermens, H. J., & Zilvold, G. (1990). Artificial-reflex
stimulation for FES-induced standing with minimum quadriceps force. Medical
and Biological Engineering and Computing, 28(5), 483-488.

168
Munro, B. H. (2005). Statistical methods for health care research (Vol. 1): Lippincott
Williams & Wilkins.
Murphy, C., Campbell, N., Caulfield, B., Ward, T., & Deegan, C. (2008). Micro electro
mechanical systems based sensor for mechanomyography. Paper presented at the
19th Biennial International EURASIP Conference (BIOSIGNAL), Brno, Czech
Republic.
Nash, M. S. (2005). Exercise as a Health‐Promoting Activity Following Spinal Cord
Injury. Journal of Neurologic Physical Therapy, 29(2), 87-103. doi:106
10.1097/01.NPT.0000282514.94093.c6
Nataraj, R., Audu, M. L., Kirsch, R. F., & Triolo, R. J. (2010). Comprehensive Joint
Feedback Control for Standing by Functional Neuromuscular Stimulation—A
Simulation Study. Neural Systems and Rehabilitation Engineering, IEEE
Transactions on, 18(6), 646-657. doi:10.1109/TNSRE.2010.2083693
Nguyen, R., Masani, K., Micera, S., Morari, M., & Popovic, M. R. (2011). Spatially
distributed sequential stimulation reduces fatigue in paralyzed triceps surae
muscles: a case study. Artificial Organs, 35(12), 1174-1180.
Niedermeyer, E., & da Silva, F. H. L. (2005). Electroencephalography: basic principles,
clinical applications, and related fields (5th ed.): Lippincott Williams & Wilkins.
Noble, W. S. (2006). What is a support vector machine? Nat Biotech, 24(12), 1565-1567.
Noreau, L., & Shephard, R. J. (1995). Spinal Cord Injury, Exercise and Quality of Life.
Sports Medicine, 20(4), 226-250. doi:10.2165/00007256-199520040-00003
Olatunji, S. O., Selamat, A., & Abdul Raheem, A. A. (2014). Improved sensitivity based
linear learning method for permeability prediction of carbonate reservoir using
interval type-2 fuzzy logic system. Applied Soft Computing, 14, Part B, 144-155.
doi:http://dx.doi.org/10.1016/j.asoc.2013.02.018
Orizio, C. (1993). Muscle sound: bases for the introduction of a mechanomyographic
signal in muscle studies. Critical Reviews in Biomedical Engineering, 21(3), 201-
243.
Orizio, C. (2004). Surface Mechanomyogram. In R. Merletti & P. A. Parker (Eds.),
Electromyography: physiology, engineering and noninvasive applications (pp.
305-322). Piscataway: IEEE Press, Wiley.
Orizio, C., Diemont, B., Esposito, F., Alfonsi, E., Parrinello, G., Moglia, A., &
Veicsteinas, A. (1999). Surface mechanomyogram reflects the changes in the
mechanical properties of muscle at fatigue. European Journal of Applied
Physiology and Occupational Physiology, 80(4), 276-284.
doi:10.1007/s004210050593
Orizio, C., Esposito, F., Paganotti, I., Marino, L., Rossi, B., & Veicsteinas, A. (1997).
Electrically-elicited surface mechanomyogram in myotonic dystrophy. The

169
Italian Journal of Neurological Sciences, 18(4), 185-190.
doi:10.1007/bf02080462
Orizio, C., Gobbo, M., Diemont, B., Esposito, F., & Veicsteinas, A. (2003). The surface
mechanomyogram as a tool to describe the influence of fatigue on biceps brachii
motor unit activation strategy. Historical basis and novel evidence. European
Journal of Applied Physiology, 90(3-4), 326-336. doi:10.1007/s00421-003-0924-
1
Orizio, C., Liberati, D., Locatelli, C., De Grandis, D., & Veicsteinas, A. (1996). Surface
mechanomyogram reflects muscle fibres twitches summation. Journal of
Biomechanics, 29(4), 475-481. doi:http://dx.doi.org/10.1016/0021-
9290(95)00063-1
Orizio, C., Perini, R., Diemont, B., Maranzana Figini, M., & Veicsteinas, A. (1990).
Spectral analysis of muscular sound during isometric contraction of biceps
brachii. Journal of Applied Physiology, 68(2), 508-512.
Orizio, C., Perini, R., Diemont, B., & Veicsteinas, A. (1992). Muscle sound and
electromyogram spectrum analysis during exhausting contractions in man.
European Journal of Applied Physiology and Occupational Physiology, 65(1), 1-
7.
Orizio, C., Perini, R., & Veicsteinas, A. (1989). Muscular sound and force relationship
during isometric contraction in man. European Journal of Applied Physiology and
Occupational Physiology, 58(5), 528-533. doi:10.1007/BF02330708
Orizio, C., Solomonow, M., Baratta, R., & Veicsteinas, A. (1992). Influence of motor
units recruitment and firing rate on the soundmyogram and EMG characteristics
in cat gastrocnemius. Journal of Electromyography and Kinesiology, 2(4), 232-
241.
Oster, G., & Jaffe, J. S. (1980). Low frequency sounds from sustained contraction of
human skeletal muscle. Biophysical Journal, 30(1), 119-127.
doi:http://dx.doi.org/10.1016/S0006-3495(80)85080-6
Osuna, E., Freund, R., & Girosi, F. (1997). Support vector machines: Training and
applications. Retrieved from Artificial Intelligence Laboratory:
Ouamer, M., Boiteux, M., Petitjean, M., Travens, L., & Salès, A. (1999). Acoustic
myography during voluntary isometric contraction reveals non-propagative lateral
vibration. Journal of Biomechanics, 32(12), 1279-1285.
Owolabi, T. O., Akande, K. O., & Olatunji, S. O. (2015). Estimation of surface energies
of hexagonal close packed metals using computational intelligence technique.
Applied Soft Computing, 31, 360-368.
doi:http://dx.doi.org/10.1016/j.asoc.2015.03.009
Pal, M., & Goel, A. (2006). Prediction of the end-depth ratio and discharge in semi-
circular and circular shaped channels using support vector machines. Flow
170
Measurement and Instrumentation, 17(1), 49-57.
doi:http://dx.doi.org/10.1016/j.flowmeasinst.2005.05.003
Panisset, M. G., Galea, M. P., & El-Ansary, D. (2016). Does early exercise attenuate
muscle atrophy or bone loss after spinal cord injury? Spinal Cord, 54(2), 84-92.
doi:10.1038/sc.2015.150
Papachristos, A. (2014). Functional Electrical Stimulation in Paraplegia. In Y.
Dionyssiotis (Ed.), Topics in Paraplegia (pp. 109-126). Rijeka, Croatia: INTECH.
Parker, M. G., Bennett, M. J., Hieb, M. A., Hollar, A. C., & Roe, A. A. (2003). Strength
Response in Human Quadriceps Femoris Muscle During 2 Neuromuscular
Electrical Stimulation Programs. Journal of Orthopaedic & Sports Physical
Therapy, 33(12), 719-726. doi:doi:10.2519/jospt.2003.33.12.719
Pasquet, B., Carpentier, A., & Duchateau, J. (2005). Change in Muscle Fascicle Length
Influences the Recruitment and Discharge Rate of Motor Units During Isometric
Contractions. Journal of Neurophysiology, 94(5), 3126-3133.
doi:10.1152/jn.00537.2005
Peckham, H., & Gorman, P. (2004). Functional Electrical Stimulation in the 21st Century.
Topics in Spinal Cord Injury Rehabilitation, 10(2), 126-150.
doi:doi:10.1310/PPJQ-CM9N-P80M-DEDQ
Peckham, P. H., & Kilgore, K. L. (2013). Challenges and Opportunities in Restoring
Function After Paralysis. IEEE TRANSACTIONS ON BIOMEDICAL
ENGINEERING, 60(3), 602-609. doi:10.1109/TBME.2013.2245128
Peckham, P. H., & Knutson, J. S. (2005). Functional Electrical Stimulation for
Neuromuscular Applications. Annual Review of Biomedical Engineering, 7(1),
327-360. doi:doi:10.1146/annurev.bioeng.6.040803.140103
Peckham, P. H., Mortimer, J. T., & Marsolais, E. B. (1976). Alteration in the force and
fatigability of skeletal muscle in quadriplegic humans following exercise induced
by chronic electrical stimulation. Clinical Orthopaedics and Related Research,
114, 326-334.
Petitjean, M., Maton, B., & Fourment, A. (1998). Summation of elementary
phonomyograms during isometric twitches in humans. European Journal of
Applied Physiology and Occupational Physiology, 77(6), 527-535.
doi:10.1007/s004210050371
Pincivero, D., Lephart, S., & Karunakara, R. (1997). Reliability and precision of
isokinetic strength and muscular endurance for the quadriceps and hamstrings.
International Journal of Sports Medicine, 18(2), 113-117.
Pochet, N. L. M. M., & Suykens, J. A. K. (2006). Support vector machines versus logistic
regression: improving prospective performance in clinical decision-making.
Ultrasound in Obstetrics and Gynecology, 27(6), 607-608. doi:10.1002/uog.2791

171
Polasek, K. H., Hoyen, H. A., Keith, M. W., Kirsch, R. F., & Tyler, D. J. (2009).
Stimulation Stability and Selectivity of Chronically Implanted Multicontact
Nerve Cuff Electrodes in the Human Upper Extremity. IEEE Transactions on
Neural Systems and Rehabilitation Engineering, 17(5), 428-437.
doi:10.1109/TNSRE.2009.2032603
Popović, D. B. (2014). Advances in functional electrical stimulation (FES). Journal of
Electromyography and Kinesiology, 24(6), 795-802.
doi:http://dx.doi.org/10.1016/j.jelekin.2014.09.008
Popovic, D. B., & Sinkjær, T. (2000). Control of Movement for the Physically Disabled:
Control for Rehabilitation Technology. The University of Michigan: Springer.
Popovic, M. R. (2012). Functional Electrical Stimulation Therapy. Canada: Rick Hansen
Institute.
Posatskiy, A. O. (2011). Design and valuation of Pressure-Based Sensors for
Mechanomyography: an Investigation of Chamber Geometry and Motion Artifact.
(MASc), University of Toronto Canada.
Purves, D., Augustine, G. J., Fitzpatrick, D., Katz, L. C., LaMantia, A.-S., McNamara, J.
O., & Williams, S. M. (2001). Neural Systems. In P. Dale, G. J. Augustine, F.
David, C. K. Lawrence, L. Anthony-Samuel, J. O. McNamara, & S. M. Williams.
(Eds.), Neuroscience (2nd ed.). Sunderland, MA: Sinauer Associates.
Qin, W., Bauman, W. A., & Cardozo, C. (2010). Bone and muscle loss after spinal cord
injury: organ interactions. Annals of the New York Academy of Sciences, 1211(1),
66-84. doi:10.1111/j.1749-6632.2010.05806.x
Rabischong, E., & Chavet, P. (1997). Regression-based indices of fatigue in paraplegics'
electrically stimulated quadriceps. Medical Engineering & Physics, 19(8), 749-
754. doi:http://dx.doi.org/10.1016/S1350-4533(97)00038-6
Ragnarsson, K. T. (2007). Functional electrical stimulation after spinal cord injury:
current use, therapeutic effects and future directions. Spinal Cord, 46(4), 255-274.
Rahal, M., Winter, J., Taylor, J., & Donaldson, N. (2000). An improved configuration for
the reduction of EMG in electrode cuff recordings: a theoretical approach. IEEE
TRANSACTIONS ON BIOMEDICAL ENGINEERING, 47(9), 1281-1284.
doi:10.1109/10.867963
Ramakrishnan, K., Chung, T. Y., Hasnan, N., & Abdullah, S. J. F. (2011). Return to work
after spinal cord injury in Malaysia. Spinal Cord, 49(7), 812-816.
Rassier, D. E., MacIntosh, B. R., & Herzog, W. (1999). Length dependence of active
force production in skeletal muscle. Journal of Applied Physiology, 86(5), 1445-
1457.
Rattay, F., Resatz, S., Lutter, P., Minassian, K., Jilge, B., & Dimitrijevic, M. R. (2003).
Mechanisms of Electrical Stimulation with Neural Prostheses. Neuromodulation:

172
Technology at the Neural Interface, 6(1), 42-56. doi:10.1046/j.1525-
1403.2003.03006.x
Reed, B. (1997). The Physiology of Neuromuscular Electrical Stimulation. Pediatric
Physical Therapy, 9(3), 96-102.
Reza, M. F., Ikoma, K., Chuma, T., & Mano, Y. (2005). Mechanomyographic response
to transcranial magnetic stimulation from biceps brachii and during
transcutaneous electrical nerve stimulation on extensor carpi radialis. Journal of
Neuroscience Methods, 149(2), 164-171.
doi:http://dx.doi.org/10.1016/j.jneumeth.2005.05.013
Richardson, R., Frank, L., & Haseler, L. (1998). Dynamic knee-extensor and cycle
exercise: functional MRI of muscular activity. International Journal of Sports
Medicine, 19(03), 182-187.
Rıza Yıldız, A. (2009). A novel hybrid immune algorithm for global optimization in
design and manufacturing. Robotics and Computer-Integrated Manufacturing,
25(2), 261-270. doi:http://dx.doi.org/10.1016/j.rcim.2007.08.002
Rohde, L. M., Bonder, B. R., & Triolo, R. J. (2012). Exploratory study of perceived
quality of life with implanted standing neuroprostheses. Journal of Rehabilitation
Research and Development, 49(2), 265-278.
Rosenbaum, D. A. (2010). Human motor control (2nd ed.). San Diego, CA: Academic
Press/Elsevier.
Round, J. M., Barr, F., Moffat, B., & Jones, D. A. (1993). Fibre areas and histochemical
fibre types in the quadriceps muscle of paraplegic subjects. Journal of the
Neurological Sciences, 116(2), 207-211.
Russ, D. W., Vandenborne, K., & Binder-Macleod, S. A. (2002). Factors in fatigue during
intermittent electrical stimulation of human skeletal muscle. Journal of Applied
Physiology, 93(2), 469-478.
Ryan, E. D., Beck, T. W., Herda, T. J., Hartman, M. J., Stout, J. R., Housh, T. J., &
Cramer, J. T. (2008). Mechanomyographic amplitude and mean power frequency
responses during isometric ramp vs. step muscle actions. Journal of Neuroscience
Methods, 168(2), 293-305.
Ryan, E. D., Cramer, J. T., Egan, A. D., Hartman, M. J., & Herda, T. J. (2008). Time and
frequency domain responses of the mechanomyogram and electromyogram
during isometric ramp contractions: a comparison of the short-time Fourier and
continuous wavelet transforms. Journal of Electromyography and Kinesiology,
18(1), 54-67.
Sabatier, M. J., Stoner, L., Mahoney, E. T., Black, C., Elder, C., Dudley, G. A., &
McCully, K. (2005). Electrically stimulated resistance training in SCI individuals
increases muscle fatigue resistance but not femoral artery size or blood flow.
Spinal Cord, 44(4), 227-233.

173
Sadowsky, C. L., Hammond, E. R., Strohl, A. B., Commean, P. K., Eby, S. A., Damiano,
D. L., . . . McDonald, J. W. (2013). Lower extremity functional electrical
stimulation cycling promotes physical and functional recovery in chronic spinal
cord injury. The Journal of Spinal Cord Medicine, 36(6), 623-631.
doi:10.1179/2045772313Y.0000000101
Sarlabous, L., Torres, A., Fiz, J. A., Morera, J., & Jané, R. (2013). Index for estimation
of muscle force from mechanomyography based on the Lempel–Ziv algorithm.
Journal of Electromyography and Kinesiology, 23(3), 548-557.
doi:http://dx.doi.org/10.1016/j.jelekin.2012.12.007
Sayenko, D. G., Nguyen, R., Hirabayashi, T., Popovic, M. R., & Masani, K. (2015).
Method to Reduce Muscle Fatigue During Transcutaneous Neuromuscular
Electrical Stimulation in Major Knee and Ankle Muscle Groups.
Neurorehabilitation and Neural Repair, 29(8), 722-733.
doi:10.1177/1545968314565463
Schölkopf, B., & Smola, A. J. (2002). Learning with kernels: support vector machines,
regularization, optimization, and beyond: MIT press.
Scott, S. H. (2004). Optimal feedback control and the neural basis of volitional motor
control. Nat Rev Neurosci, 5(7), 532-546.
Scott, W. B., Lee, S. C., Johnston, T. E., & Binder‐Macleod, S. A. (2005). Switching
stimulation patterns improves performance of paralyzed human quadriceps
muscle. Muscle & Nerve, 31(5), 581-588.
Scott, W. B., Lee, S. C. K., Johnston, T. E., Binkley, J., & Binder-Macleod, S. A. (2006).
Contractile properties and the force-frequency relationship of the paralyzed
human quadriceps femoris muscle. Physical Therapy, 86(6), 788-799.
Scott, W. B., Lee, S. C. K., Johnston, T. E., Binkley, J., & Binder‐MacLeod, S. A. (2007).
Effect of electrical stimulation pattern on the force responses of paralyzed human
quadriceps muscles. Muscle & Nerve, 35(4), 471-478.
Selkowitz, D. M. (1985). Improvement in isometric strength of the quadriceps femoris
muscle after training with electrical stimulation. Physical Therapy, 65(2), 186-
196.
Semmler, J. G. (2002). Motor Unit Synchronization and Neuromuscular Performance.
Exercise and Sport Sciences Reviews, 30(1), 8-14.
Shamshirband, S., Petkovi, D., Javidnia, H., & Gani, A. (2015). Sensor Data Fusion by
Support Vector Regression Methodology—A Comparative Study. IEEE Sensors
Journal, 15(2), 850-854. doi:10.1109/JSEN.2014.2356501
Shamshirband, S., Petković, D., Amini, A., Anuar, N. B., Nikolić, V., Ćojbašić, Ž., . . .
Gani, A. (2014). Support vector regression methodology for wind turbine reaction
torque prediction with power-split hydrostatic continuous variable transmission.
Energy, 67, 623-630. doi:http://dx.doi.org/10.1016/j.energy.2014.01.111

174
Shannon, C. E. (1949). Communication in the Presence of Noise. Proceedings of the IRE,
37(1), 10-21. doi:10.1109/JRPROC.1949.232969
Shannon, C. E. (2001). A mathematical theory of communication. SIGMOBILE Mob.
Comput. Commun. Rev., 5(1), 3-55. doi:10.1145/584091.584093
Sharma, N., Patre, P. M., Gregory, C. M., & Dixon, W. E. (2009). Nonlinear control of
NMES: Incorporating fatigue and calcium dynamics. Paper presented at the
ASME 2009 Dynamic Systems and Control Conference, Hollywood, California,
USA.
Sharma, N., Stegath, K., Gregory, C. M., & Dixon, W. E. (2009). Nonlinear
neuromuscular electrical stimulation tracking control of a human limb. Neural
Systems and Rehabilitation Engineering, IEEE Transactions on, 17(6), 576-584.
Shields, R. K. (2002). Muscular, Skeletal, and Neural Adaptations Following Spinal Cord
Injury. Journal of Orthopaedic & Sports Physical Therapy, 32(2), 65-74.
doi:doi:10.2519/jospt.2002.32.2.65
Shields, R. K., Dudley-Javoroski, S., & Cole, K. R. (2006). Feedback-controlled
stimulation enhances human paralyzed muscle performance. Journal of Applied
Physiology, 101(5), 1312-1319. doi:10.1152/japplphysiol.00385.2006
Shields, R. K., Dudley-Javoroski, S., & Littmann, A. E. (2006). Postfatigue potentiation
of the paralyzed soleus muscle: evidence for adaptation with long-term electrical
stimulation training. Journal of Applied Physiology, 101(2), 556-565.
Shin, K.-S., Lee, T. S., & Kim, H.-j. (2005). An application of support vector machines
in bankruptcy prediction model. Expert Systems with Applications, 28(1), 127-
135. doi:http://dx.doi.org/10.1016/j.eswa.2004.08.009
Shinohara, M., Kouzaki, M., Yoshihisa, T., & Fukunaga, T. (1998). Mechanomyogram
from the different heads of the quadriceps muscle during incremental knee
extension. European Journal of Applied Physiology and Occupational
Physiology, 78(4), 289-295. doi:10.1007/s004210050422
Silva, J., Heim, W., & Chau, T. (2005). A Self-Contained, Mechanomyography-Driven
Externally Powered Prosthesis. Archives of Physical Medicine and Rehabilitation,
86(10), 2066-2070. doi:http://dx.doi.org/10.1016/j.apmr.2005.03.034
Simpson, L. A., Eng, J. J., Hsieh, J. T. C., & Wolfe the Spinal Cord Injury Rehabilitation
Evidence Research Team, D., L. (2012). The health and life priorities of
individuals with spinal cord injury: a systematic review. Journal of Neurotrauma,
29(8), 1548-1555.
Sinclair, J. P., Davis, M. G., & Smith, M. R. (2006). Musculo-skeletal modelling of
NMES-evoked knee extension in spinal cord injury. Journal of Biomechanics, 39,
483-492.

175
Singer, B. (1987). Functional Electrical Stimulation of the Extremities in the Neurological
Patient: A Review. Australian Journal of Physiotherapy, 33(1), 33-42.
doi:http://dx.doi.org/10.1016/S0004-9514(14)60582-1
Singh, A., Tetreault, L., Kalsi-Ryan, S., Nouri, A., & Fehlings, M. G. (2014). Global
prevalence and incidence of traumatic spinal cord injury. Clinical Epidemiology,
6, 309-331. doi:10.2147/clep.s68889
Sinkjaer, T., Haugland, M., Inmann, A., Hansen, M., & Nielsen, K. D. (2003).
Biopotentials as command and feedback signals in functional electrical
stimulation systems. Medical Engineering & Physics, 25(1), 29-40.
Sisto, S. A., & Dyson-Hudson, T. (2007). Dynamometry testing in spinal cord injury.
Journal of Rehabilitation Research & Development, 44(1), 123-136.
Smith, T. G., & Stokes, M. J. (1993). Technical aspects of acoustic myography (AMG)
of human skeletal muscle: contact pressure and force/AMG relationships. Journal
of Neuroscience Methods, 47(1), 85-92. doi:http://dx.doi.org/10.1016/0165-
0270(93)90024-L
Smola, A. J. (1996). Regression estimation with support vector learning machines. (MSc
), Technische Universit¨at M¨unchen.
Smola, A. J., & Schölkopf, B. (2004). A tutorial on support vector regression. Statistics
and Computing, 14(3), 199-222. doi:10.1023/b:stco.0000035301.49549.88
Søgaard, K., Blangsted, A. K., Jørgensen, L. V., Madeleine, P., & Sjøgaard, G. (2003).
Evidence of long term muscle fatigue following prolonged intermittent
contractions based on mechano- and electromyograms. Journal of
Electromyography and Kinesiology, 13(5), 441-450.
doi:http://dx.doi.org/10.1016/S1050-6411(03)00075-0
Statnikov, A. R., Aliferis, C. F., Hardin, D. P., & Guyon, I. (2011). A Gentle Introduction
to Support Vector Machines in Biomedicine: Theory and methods (Vol. 1): World
Scientific.
Stokes, M. J. (1993). Acoustic myography: applications and considerations in measuring
muscle performance. Isokinetics and Exercise Science, 3(1), 4-15.
doi:10.3233/IES-1993-3101
Stokes, M. J., & Blythe, M. (2001). Muscle sounds in physiology, sports science and
clinical investigation. Applications and history of mechanomyography. Oxford
Medintel - Medical Intelligence.
Stokes, M. J., & Cooper, R. G. (1992). Muscle sounds during voluntary and stimulated
contractions of the human adductor pollicis muscle. Journal of Applied
Physiology, 72(5), 1908-1913.
Stokes, M. J., & Dalton, P. A. (1991). Acoustic myographic activity increases linearly up
to maximal voluntary isometric force in the human quadriceps muscle. Journal of
the Neurological Sciences, 101(2), 163-167.

176
Su, J., Wang, X., Liang, Y., & Chen, B. (2014). GA-Based Support Vector Machine
Model for the Prediction of Monthly Reservoir Storage. Journal of Hydrologic
Engineering, 19(7), 1430-1437. doi:doi:10.1061/(ASCE)HE.1943-5584.0000915
Sun, F. T., & Morrell, M. J. (2014). Closed-loop Neurostimulation: The Clinical
Experience. Neurotherapeutics, 11(3), 553-563. doi:10.1007/s13311-014-0280-3
Sung, D. H., Jung, J.-Y., Kim, H.-D., Ha, B. J., & Ko, Y. J. (2003). Motor branch of the
rectus femoris: anatomic location for selective motor branch block in stiff-legged
gait. Archives of Physical Medicine and Rehabilitation, 84(7), 1028-1031.
doi:10.1016/S0003-9993(03)00029-7
Szumilas, M., Lewenstein, K., & Ślubowska, E. (2015). Verification of the functionality
of device for monitoring human tremor. Biocybernetics and Biomedical
Engineering, 35(4), 240-246. doi:http://dx.doi.org/10.1016/j.bbe.2015.02.002
Tanaka, M., Ishii, A., & Watanabe, Y. (2013). Neural correlates of central inhibition
during physical fatigue. PloS One, 8(7), e70949.
Tay, F. E. H., & Cao, L. (2001). Application of support vector machines in financial time
series forecasting. Omega, 29(4), 309-317. doi:http://dx.doi.org/10.1016/S0305-
0483(01)00026-3
Thakor, N. V. (1999). Biopotentials and electrophysiology measurement. In J. G. Webster
(Ed.), The Measurement, Instrumentation, and Sensors Handbook (Vol. 74). CRC
Press LLC Boca Raton, FL, USA.
Thomas, C. K., Griffin, L., Godfrey, S., Ribot-Ciscar, E., & Butler, J. E. (2003). Fatigue
of paralyzed and control thenar muscles induced by variable or constant frequency
stimulation. Journal of Neurophysiology, 89(4), 2055-2064.
Thompson, C. K., Lewek, M. D., Jayaraman, A., & Hornby, T. G. (2011). Central
excitability contributes to supramaximal volitional contractions in human
incomplete spinal cord injury. The Journal of Physiology, 589(15), 3739-3752.
doi:10.1113/jphysiol.2011.212233
Thompson, D. M., Koppes, A. N., Hardy, J. G., & Schmidt, C. E. (2014). Electrical
Stimuli in the Central Nervous System Microenvironment. Annual Review of
Biomedical Engineering, 16(1), 397-430. doi:doi:10.1146/annurev-bioeng-
121813-120655
Thrasher, T. A., & Popovic, M. R. (2008). Functional electrical stimulation of walking:
Function, exercise and rehabilitation. Annales de Réadaptation et de Médecine
Physique, 51(6), 452-460. doi:http://dx.doi.org/10.1016/j.annrmp.2008.05.006
Triolo, R. J., & Bogie, K. (1999). Lower Extremity Applications of Functional
Neuromuscular Stimulation After Spinal Cord Injury. Topics in Spinal Cord
Injury Rehabilitation, 5(1), 44-65. doi:doi:10.1310/UXUE-5L1R-WKKV-1RGP

177
Triolo, R. J., Reilley, B. W. B., Freedman, W., & Betz, R. R. (1992). The functional
standing test; development and standardization of a clinical evaluation of standing
function. Engineering in Medicine and Biology Magazine, IEEE, 11(4), 32-34.
Valenzuela, V., Oñate, M., Hetz, C., & Court, F. A. (2016). Injury to the nervous system:
A look into the ER. Brain Research.
doi:http://dx.doi.org/10.1016/j.brainres.2016.04.053
Van Looy, S., Verplancke, T., Benoit, D., Hoste, E., Van Maele, G., De Turck, F., &
Decruyenaere, J. (2007). A novel approach for prediction of tacrolimus blood
concentration in liver transplantation patients in the intensive care unit through
support vector regression. Critical Care, 11(4), 1-7. doi:10.1186/cc6081
Vapnik, V. (1999a). Three remarks on the support vector method of function estimation.
In B. Scholkopf, C. J. C. Burges, & A. J. Smola (Eds.), Advances in Kernel
Methods—Support Vector Learning (pp. 25-42). Cambridge, MA: MIT Press.
Vapnik, V., Golowich, S. E., & Smola, A. (1997). Support vector method for function
approximation, regression estimation, and signal processing. In M. C. J. Mozer,
M. I. & T. Petsche (Eds.), Advances in Neural Information Processing Systems
(Vol. 9, pp. 281-287). Cambridge, MA, USA: The MIT Press.
Vapnik, V. N. (1995). The Nature of Statistical Learning Theory. Berlin, Germany:
Springer-Verlag.
Vapnik, V. N. (1998). Statistical learning theory. New York: Wiley & Sons, Inc.
Vapnik, V. N. (1999b). An overview of statistical learning theory. Neural Networks, IEEE
Transactions on, 10(5), 988-999. doi:10.1109/72.788640
Veltink, P. H., & Donaldson, N. (1998). A perspective on the control of FES-supported
standing. IEEE TRANSACTIONS ON REHABILITATION ENGINEERING, 6(2),
109-112.
Vodovnik, L., Bajd, T., Kralj, A., Gracanin, F., & Strojnik, P. (1981). Functional
electrical stimulation for control of locomotor systems. Critical Reviews in
Bioengineering, 6(2), 63-131.
Vogel, L. C., Betz, R. R., & Mulcahey, M. J. (2012). Spinal cord injuries in children and
adolescents. In J. Verhaagen & J. W. McDonald III (Eds.), Handbook of Clinical
Neurology (pp. 131-148): Elsevier BV.
Vøllestad, N. K. (1997). Measurement of human muscle fatigue. Journal of Neuroscience
Methods, 74(2), 219-227. doi:http://dx.doi.org/10.1016/S0165-0270(97)02251-6
Vrbová, G., Hudlicka, O., & Centofanti, S. K. (2008). Electrical Stimulation as a
Therapeutic Tool to Restore Motor Function Application of Muscle/Nerve
Stimulation in Health and Disease (pp. 55-67). Dordrecht: Springer Netherlands.
Wang, Y. M., Schultz, R. T., Constable, R. T., & Staib, L. H. (2003). Nonlinear
Estimation and Modeling of fMRI Data Using Spatio-temporal Support Vector

178
Regression. In C. Taylor & J. A. Noble (Eds.), Information Processing in Medical
Imaging: 18th International Conference, IPMI 2003, Ambleside, UK, July 20-25,
2003. Proceedings (pp. 647-659). Berlin, Heidelberg: Springer Berlin Heidelberg.
Wannstedt, G. T., & Herman, R. M. (1978). Use of augmented sensory feedback to
achieve symmetrical standing. Physical Therapy, 58(5), 553-559.
Watakabe, M., Itoh, Y., Mita, K., & Akataki, K. (1998). Technical aspects of
mechnomyography recording with piezoelectric contact sensor. Medical and
Biological Engineering and Computing, 36(5), 557-561. doi:10.1007/bf02524423
Watakabe, M., Mita, K., Akataki, K., & Ito, K. (2003). Reliability of the
mechanomyogram detected with an accelerometer during voluntary contractions.
Medical and Biological Engineering and Computing, 41(2), 198-202.
Watakabe, M., Mita, K., Akataki, K., & Itoh, Y. (2001). Mechanical behaviour of
condenser microphone in mechanomyography. Medical & Biological
Engineering & Computing, 39(2), 195-201. doi:Doi 10.1007/Bf02344804
Waters, R. L., Adkins, R. H., & Yakura, J. S. (1991). Definition of complete spinal cord
injury. Paraplegia, 29(9), 573-581.
Webb, M. R., & Trentham, D. R. (2010). Chemical Mechanism of Myosin-Catalyzed
ATP Hydrolysis Comprehensive Physiology (pp. 237–255.): John Wiley & Sons,
Inc.
Weir, J. P. (2005). Quantifying test-retest reliability using the intraclass correlation
coefficient and the SEM. The Journal of Strength & Conditioning Research,
19(1), 231-240.
Wolpaw, J. R., Birbaumer, N., Heetderks, W. J., McFarland, D. J., Peckham, P. H.,
Schalk, G., . . . Vaughan, T. M. (2000). Brain-computer interface technology: a
review of the first international meeting. Rehabilitation Engineering, IEEE
Transactions on, 8(2), 164-173. doi:10.1109/TRE.2000.847807
Wu, X., Kumar, V., Ross Quinlan, J., Ghosh, J., Yang, Q., Motoda, H., . . . Steinberg, D.
(2007). Top 10 algorithms in data mining. Knowledge and Information Systems,
14(1), 1-37. doi:10.1007/s10115-007-0114-2
Xie, H.-B., Zheng, Y.-P., Guo, J.-Y., Chen, X., & Shi, J. (2009). Estimation of wrist angle
from sonomyography using support vector machine and artificial neural network
models. Medical Engineering & Physics, 31(3), 384-391.
doi:http://dx.doi.org/10.1016/j.medengphy.2008.05.005
Xue, H., Yang, Q., & Chen, S. (2009). SVM: Support Vector Machines. In X. Wu & V.
Kumar (Eds.), The Top Ten Algorithms in Data Mining (pp. 37-59). London, Boca
Raton: Chapman & Hall, CRC.
Yamaguchi, T., Sugawara, K., Tanaka, S., Yoshida, N., Saito, K., Tanabe, S., . . . Liu, M.
(2012). Real-Time Changes in Corticospinal Excitability during Voluntary

179
Contraction with Concurrent Electrical Stimulation. PloS One, 7(9), e46122.
doi:10.1371/journal.pone.0046122
Yamamoto, T., & Takano, H. (1994). Application of muscle sound to assess muscle tonus
of the electrically stimulated muscle for FES. Paper presented at the Engineering
in Medicine and Biology Society, 1994. Engineering Advances: New
Opportunities for Biomedical Engineers. Proceedings of the 16th Annual
International Conference of the IEEE, Baltimore, MD.
Yang, H., Huang, K., King, I., & Lyu, M. R. (2009). Localized support vector regression
for time series prediction. Neurocomputing, 72(10–12), 2659-2669.
doi:http://dx.doi.org/10.1016/j.neucom.2008.09.014
Yang, R., Guo, L., Wang, P., Huang, L., Tang, Y., Wang, W., . . . Shen, H. (2014).
Epidemiology of Spinal Cord Injuries and Risk Factors for Complete Injuries in
Guangdong, China: A Retrospective Study. PloS One, 9(1), e84733.
doi:10.1371/journal.pone.0084733
Yarkony, G. M., Jaeger, R. J., Roth, E., Kralj, A. R., & Quintern, J. (1990). Functional
neuromuscular stimulation for standing after spinal cord injury. Archives of
Physical Medicine and Rehabilitation, 71(3), 201-206.
Yoshitake, Y., & Moritani, T. (1999). The muscle sound properties of different muscle
fiber types during voluntary and electrically induced contractions. Journal of
Electromyography and Kinesiology, 9(3), 209-217.
doi:http://dx.doi.org/10.1016/S1050-6411(98)00035-2
Yoshitake, Y., Shinohara, M., Ue, H., & Moritani, T. (2002). Characteristics of surface
mechanomyogram are dependent on development of fusion of motor units in
humans. Journal of Applied Physiology, 93(5), 1744-1752.
doi:10.1152/japplphysiol.00008.2002
Youn, W., & Kim, J. (2010). Estimation of elbow flexion force during isometric muscle
contraction from mechanomyography and electromyography. Medical &
Biological Engineering & Computing, 48(11), 1149-1157. doi:10.1007/s11517-
010-0641-y
Youn, W., & Kim, J. (2011). Feasibility of using an artificial neural network model to
estimate the elbow flexion force from mechanomyography. Journal of
Neuroscience Methods, 194(2), 386-393.
Young, A. E., & Murphy, G. C. (2009). Employment status after spinal cord injury (1992–
2005): a review with implications for interpretation, evaluation, further research,
and clinical practice. International Journal of Rehabilitation Research, 32(1), 1-
11. doi:10.1097/MRR.0b013e32831c8b19
Young, W. (2015). Electrical Stimulation and Motor Recovery. Cell Transplantation,
24(3), 429-446. doi:10.3727/096368915X686904

180
Yu, P.-S., Chen, S.-T., & Chang, I. F. (2006). Support vector regression for real-time
flood stage forecasting. Journal of Hydrology, 328(3–4), 704-716.
doi:http://dx.doi.org/10.1016/j.jhydrol.2006.01.021
Yu, W., Liu, T., Valdez, R., Gwinn, M., & Khoury, M. (2010). Application of support
vector machine modeling for prediction of common diseases: the case of diabetes
and pre-diabetes. BMC Medical Informatics and Decision Making, 10(1), 16.
Yuan-Ting, Z., Frank, C. B., Rangayyan, R. M., & Bell, G. D. (1992). A comparative
study of simultaneous vibromyography and electromyography with active human
quadriceps. Biomedical Engineering, IEEE Transactions on, 39(10), 1045-1052.
doi:10.1109/10.161336
Yue, G., Fuglevand, A. J., Nordstrom, M. A., & Enoka, R. M. (1995). Limitations of the
surface electromyography technique for estimating motor unit synchronization.
Biological cybernetics, 73(3), 223-233. doi:10.1007/bf00201424
Yungher, D. A., Wininger, M. T., Barr, J. B., Craelius, W., & Threlkeld, A. J. (2011).
Surface muscle pressure as a measure of active and passive behavior of muscles
during gait. Medical Engineering & Physics, 33(4), 464-471.
doi:http://dx.doi.org/10.1016/j.medengphy.2010.11.012
Zhao, W., Tao, T., & Zio, E. (2015). System reliability prediction by support vector
regression with analytic selection and genetic algorithm parameters selection.
Applied Soft Computing, 30, 792-802.
doi:http://dx.doi.org/10.1016/j.asoc.2015.02.026
Ziai, A., & Menon, C. (2011). Comparison of regression models for estimation of
isometric wrist joint torques using surface electromyography. Journal of
Neuroengineering and Rehabilitation, 8(1), 1-12. doi:10.1186/1743-0003-8-56

181
LIST OF PUBLICATIONS AND PRESENTED PAPERS
PUBLISHED JOURNAL ARTICLES
1. Ibitoye, M. O., Hamzaid, N. A., Abdul Wahab, A. K., Hasnan, N., Olatunji, S. O.; &
Davis, G. M. (2016). Estimation of Electrically-Evoked Knee Torque from
Mechanomyography Using Support Vector Regression. Sensors, 16(17), 1115.
doi:10.3390/s16071115
2. Ibitoye, M. O., Hamzaid, N. A., Hasnan, N., Abdul Wahab, A. K., Islam, M. A.,
Kean, V. S. P., & Davis, G. M. (2016). Torque and mechanomyogram relationships
during electrically-evoked isometric quadriceps contractions in persons with spinal
cord injury. Medical Engineering & Physics, 38(8), 767-775.
doi:http://dx.doi.org/10.1016/j.medengphy.2016.05.012
3. Ibitoye, M. O., Hamzaid, N. A., Hasnan, N., Abdul Wahab, A. K., & Davis, G. M.
(2016). Strategies for Rapid Muscle Fatigue Reduction during FES Exercise in
Individuals with Spinal Cord Injury: A Systematic Review. PLoS One, 11(2),
e0149024. doi:10.1371/journal.pone.0149024
4. Ibitoye, M. O., Hamzaid, N. A., Zuniga, J., Hasnan, N., & Abdul Wahab, A. K.
(2014). Mechanomyographic Parameter Extraction Methods: An Appraisal for
Clinical Applications. Sensors, 14(12), 22940-22970. doi:10.3390/s141222940
5. Ibitoye, M. O., Hamzaid, N. A., Zuniga, J. M., & Abdul Wahab, A. K. (2014).
Mechanomyography and Muscle Function Assessment: A Review of Current State
and Prospects. Clinical Biomechanics, 29(6), 691-704.
doi:http://dx.doi.org/10.1016/j.clinbiomech.2014.04.003.
6. Ibitoye, M. O., Estigoni, E. H., Hamzaid, N. A., Abdul Wahab, A. K., & Davis, G.
M. (2014). The Effectiveness of FES-Evoked EMG Potentials to Assess Muscle Force
and Fatigue in Individuals with Spinal Cord Injury. Sensors, 14(7), 12598-12622.
doi:doi:10.3390/s140712598
UNDER REVIEW AND IN PREPARATION
7. Ibitoye, M. O., Hamzaid, N. A., Abdul Wahab, A. K., Hasnan, N.; & Davis, G. M.
(2017). Quadriceps mechanomyography reflects muscle fatigue during FES-sustained
standing in adults with spinal cord injury: Case series proof of concept, Under Review
in Medical and Biological Engineering and Computing.
8. Ibitoye, M. O., Hamzaid, N. A., Abdul Wahab, A. K., Hasnan, N., Olatunji, S. O.; &
Davis, G. M. (2016). NMES-Evoked Knee Torque Estimation from Paralyzed
Quadriceps Mechanomyographic signal Using Support Vector Regression Modelling,
to be submitted to IEEE Sensors Journal.

182
CONFERENCE PAPERS
1. Ibitoye, M. O., Hamzaid, N. A., & Abdul Wahab, A. K. (2014, January): Prospects
of Mechanomyography (MMG) in Muscle Function Assessment during FES Evoked
Contraction: A Review. In The 15th International Conference on Biomedical
Engineering Volume 43 of the series IFMBE Proceedings, James Goh (eds.) 524-
526. Published by Springer International Publishing, Switzerland.
2. Ibitoye, M. O., Hamzaid, N. A., & Abdul Wahab, A. K. (2014, January): Effects of
Muscle Fatigue on FES Assisted Walking of SCI Patients: A Review. In The 15th
International Conference on Biomedical Engineering Volume 43 of the series
IFMBE Proceedings, James Goh (eds.) 476-479. Published by Springer International
Publishing, Switzerland.
3. Ibitoye, M. O, Hamzaid, N. A. (2013): Myoelectric Signal and FES-evoked Muscle
Contraction: Muscle Force and Fatigue Assessments. In 18th Functional Electrical
Stimulation Society Annual Conference (IFESS), Spain 2013, pg. 241-244.
183

184

185

186

187

188

189
APPENDICES
APPENDIX A: THE LETTER OF ETHICS APPROVAL FOR THE KNEE
EXTENSION EXPERIMENT

190

191
APPENDIX B: THE LETTER OF ETHICS APPROVAL FOR THE STANDING
EXPERIMENT

19
2
APPENDIX C: EXPERIMENTAL PROCEDURES FOR THE NMES-SUPPORTED STANDING
1:30-2:00pm 2:00-2:15pm 2:15-2:30pm 2:30-2:45pm 2:45-3:00pm 3:00-3:10pm 3:10-3:40pm 3:40-3:50pm 3:50pm-4:10pm 4:10pm
Set-up
@Lab.
Stimulation
electrode
placement
Set-up
@Physio.
Clinic
Computers,
MMG,
Stimulator,
and Harness
Set-up
@Sitting
Sensors
placement
(MMG)
Set-up
@Sit-to-
stand
Harness and
frames
arrangement.
Set-up
@Standing
Stand the
participant
and ensure
stability by
holding the
Biodex’s
handrail
HM, SB,
HZ
Test
Trial 1
@Standing
Until knee
angle reduces
by 300.
Angle
Monitoring
(Goniometer)
SB
Between
Trial
Rest
RepeatTest
Trial 2
@Standing
Until knee
angle
reduces by
300
Disconnect
@Sitting
Harness
& Sensors
End
Discharge
Participant

193
APPENDIX D: THE ORIGINAL CONSENT FORM

194
APPENDIX E: ENGLISH LANGUAGE TRANSLATION OF THE CONSENT
FORM
UNIVERISTY OF MALAYA MEDICAL CENTRE
PATIENT’S CONSENT FORM FOR CLINICAL RESEARCH
I, ……………………………………………………
Identity card No ……………………………………
(Patient's name)
Address …………………………………………………………………………………......
(House address)
agree to participate in the clinical research (clinical study / questionnaire study / medication trial) specified
below:
Research Title: ………………………………………………………………………….
whose nature and purpose were described to me by Dr.………………………………….
(Name & Position of the Translator)
Translated by……………………………………………………
(Name & Position of the Translator)
…………………… which has been translated to me with all my ability and understanding in my language
/ dialect ……………………………
I have been informed about the possible risks and complications of the basic clinical research and
methodology (according to the Patient Information Sheet). After knowing and understanding all the
possible pros and cons of this clinical research, I give my consent to participate in the clinical research
mentioned above.
I understand that I can withdraw from this clinical research at any time without giving any reasons in this
situation and will not be excluded from the treatment facilities of the attending physician.
Date: ………………. Signature / Fingerprint: ……………….
(Patients)
IN FRONT OF
Name ……………………………….)
Signature …………………………...)
(Witness to Signature of Patient)
No. K/P …………………………….)
Position …………………………….)
I confirm that I have explained to the patient the nature and purpose of clinical research mentioned above.
Date: ……………. Signature: ……………………………………………………. (Doctor in Charge)
Registration number BK-MIS-1117-EOI
Name
Gender
Age
Unit

195
APPENDIX F: SAMPLE OF HONORARIUM FORM
DEPARTMENT OF BIOMEDICAL ENGINEERING
RE: ACKNOLEDGMENT OF HONORARIUM ACCEPTANCE
I, ________________________________________ agree to accept an honorarium in
the amount of RM _____________ in return for ________________________________
______________________________________________________________________
______________________________________________________________________
______________________________________________________________________
at _____________________________________________________________________
Thank you.
Sincerely,
Signature :__________________________________
Name :__________________________________
IC No./Matric Card No./ Passport No. :__________________________________
Date :__________________________________
Certified by,
Signature :__________________________________
Name :__________________________________
IC No./Matric Card No./ Passport No. :__________________________________
Date :__________________________________

196
APPENDIX G: MATLAB SCRIPT FOR THE SVR MODELLING
______________________________________________________________________
clear all;
close all;
clc;
--------------------------------------------------------------------------------------------------------------------------- ----
%% calling a function to get data and then break it using stratifying approach for partitioning
function [depth_tr,depth_ts,x_tr,output_tr,x_ts,output_ts]=Ibitoye_get_data_for_anyvar()
depth_tr=[];depth_ts=[];
choice=.70;
[x]=xlsread('C:\Users\marufibitoye\Documents\MATLAB\SVM_Folder\SCI data- latest','SCI');
------------------------------------------------------------------------------------------------------------------------------
%% For the target class at the last column to the right
x_now=[]; %% empty vector to be used later
novar=size(x,2); %% empty vector to be used later
y=x(:,novar);
for i=1:novar-1
% for i= 2:novar %100 % 80 %105 %90 %60
x_now=[x_now,x(:,i)];
end
x=x_now;
[x_tr,output_tr,x_ts,output_ts]=breakdata(x,y,choice); depth_tr=output_tr;depth_ts=output_ts
_____________________________________________________________________________________
%% this was used to run svm after searching for the best parameter using saved dataset
clc
close all;
clear all;
clc;
-------------------------------------------------------------------------------------------------------------------------------
workbookname='C:\Users\marufibitoye\Documents\MATLAB\SVM_Folder\Results\SCI_Polynomialkernel-2ndrun';
no_of_runs=1 %%For different kernel run
-------------------------------------------------------------------------------------------------------------------------------
count=1:no_of_runs
close all
disp ('getting data and preprocessing')
load Ibitoyedata70to30_SCI_Data x_tr x_ts output_tr output_ts depth_tr depth_ts
%% starting the generic sheet name that is unique to all the methods
%% sheetname='First_run'; % this can be changed as desired.
sheetname=strcat('run',int2str(count)); %% this was feasible and can be changed as desired.
----------------------------------------------------------------------------------------------------------
%% support vector machines section
C =879; %00;1000; %198999
lambda = 2^-15; %1e-7; %125; %
epsilon = 0.1205 %0.1942; %.5; % 0.9; %0.00008%.21
kerneloption = 2; %8;
%kernel='gaussian';
kernel='poly';

197
workbookname_SVM=strcat(workbookname,'SVM');
[cc_SVM,rmse_SVM,Er_SVM,Ea_SVM,Emin_SVM,Emax_SVM,SD_SVM,conf_tr_SVM,conf_ts_SVM,TrainingTime_SVM,TestingTime_SVM,SD_rmse_SVM,SD_cc_SVM,SD_Ea_SVM]=Ibitoye_svm_func(depth_tr,depth_ts,x_tr,output_tr,x_ts,output_ts,C,lambda,epsilon,kerneloption,kernel);cc_SVM,rmse_SVM,
% pause,
actual_tr=conf_tr_SVM(:,1);predicted_tr=conf_tr_SVM(:,2);
actual_ts=conf_ts_SVM(:,1);predicted_ts=conf_ts_SVM(:,2);
[max_mre_tr_SVM, mmre_tr_SVM, pred_tr_25_SVM, pred_tr_30_SVM, sum_abs_res_tr_SVM, med_abs_res_tr_SVM, sd_abs_res_tr_SVM] = SWE_Computing_accuracy_of_prediction(actual_tr,predicted_tr);
[max_mre_ts_SVM, mmre_ts_SVM, pred_ts_25_SVM, pred_ts_30_SVM, sum_abs_res_ts_SVM, med_abs_res_ts_SVM, sd_abs_res_ts_SVM] = SWE_Computing_accuracy_of_prediction(actual_ts,predicted_ts);
fcc_SVM_tr(count)=cc_SVM.tr;
frmse_SVM_tr(count)=rmse_SVM.tr;
fEa_SVM_tr(count)=Ea_SVM.tr;
fSD_SVM_tr(count)=SD_SVM.tr;
fTrainingTime_SVM(count)=TrainingTime_SVM;
fTestingTime_SVM(count)=TestingTime_SVM;
% testing
fcc_SVM_ts(count)=cc_SVM.ts;
frmse_SVM_ts(count)=rmse_SVM.ts;
fEa_SVM_ts(count)=Ea_SVM.ts;
fSD_SVM_ts(count)=SD_SVM.ts;
fTrainingTime_SVM(count)=TrainingTime_SVM;
fTestingTime_SVM(count)=TestingTime_SVM;
-------------------------------------------------------------------------------------------------------------------------------
%% sending results of SVM to excel
%% training
avr_cc_SVM=mean(fcc_SVM_tr);
avd_rmse_SVM=mean(frmse_SVM_tr);
avg_Ea_SVM=mean(fEa_SVM_tr);
std_cc_SVM=std(fcc_SVM_tr);
std_rmse_SVM=std(frmse_SVM_tr);
std_Ea_SVM=std(fEa_SVM_tr);
min_cc_SVM=min(fcc_SVM_tr);
min_rmse_SVM=min(frmse_SVM_tr);
min_Ea_SVM=min(fEa_SVM_tr);
max_cc_SVM=max(fcc_SVM_tr);
max_rmse_SVM=max(frmse_SVM_tr);
max_Ea_SVM=max(fEa_SVM_tr);
avg_training_time=mean(fTrainingTime_SVM);
avg_testing_time=mean(fTestingTime_SVM);
%% testing
avr_cc_SVM_ts=mean(fcc_SVM_ts);
avd_rmse_SVM_ts=mean(frmse_SVM_ts);
avg_Ea_SVM_ts=mean(fEa_SVM_ts);
std_cc_SVM_ts=std(fcc_SVM_ts);
std_rmse_SVM_ts=std(frmse_SVM_ts);
std_Ea_SVM_ts=std(fEa_SVM_ts);

198
min_cc_SVM_ts=min(fcc_SVM_ts);
min_rmse_SVM_ts=min(frmse_SVM_ts);
min_Ea_SVM_ts=min(fEa_SVM_ts);
max_cc_SVM_ts=max(fcc_SVM_ts);
max_rmse_SVM_ts=max(frmse_SVM_ts);
max_Ea_SVM_ts=max(fEa_SVM_ts);
SWE_send_results_to_file_perm_outputs_inclusive(workbookname_SVM,sheetname,depth_tr,depth_ts,avr_cc_SVM,avd_rmse_SVM,avg_Ea_SVM,SD_cc_SVM.tr,SD_rmse_SVM.tr,SD_Ea_SVM.tr,min_cc_SVM,min_rmse_SVM,min_Ea_SVM,max_cc_SVM,max_rmse_SVM,max_Ea_SVM,avg_training_time,avg_testing_time,avr_cc_SVM_ts,avd_rmse_SVM_ts,avg_Ea_SVM_ts,SD_cc_SVM.ts,SD_rmse_SVM.ts,SD_Ea_SVM.ts,min_cc_SVM_ts,min_rmse_SVM_ts,min_Ea_SVM_ts,max_cc_SVM_ts,max_rmse_SVM_ts,max_Ea_SVM_ts,conf_tr_SVM,conf_ts_SVM,max_mre_tr_SVM, mmre_tr_SVM, pred_tr_25_SVM, pred_tr_30_SVM, sum_abs_res_tr_SVM, med_abs_res_tr_SVM, sd_abs_res_tr_SVM,max_mre_ts_SVM, mmre_ts_SVM, pred_ts_25_SVM, pred_ts_30_SVM, sum_abs_res_ts_SVM, med_abs_res_ts_SVM, sd_abs_res_ts_SVM)
-------------------------------------------------------------------------------------------------------------------------------
%% Support Vector machines function with all parameters pass to it
Function[cc,rmse,Er,Ea,Emin,Emax,SD,conf_tr,conf_ts,TrainingTime,TestingTime,SD_rmse,SD_cc,SD_Ea]=Ibitoye_svm_func(depth_tr,depth_ts,x_tr,output_tr,x_ts,output_ts,C,lambda,epsilon,kerneloption,kernel)
-------------------------------------------------------------------------------------------------------------------------------
TrainingTime=0; TestingTime=0;
for runs=1:1
-------------------------------------------------------------------------------------------------------------------------------
trn=x_tr;
test=x_ts;
verbose=1;
x=x_tr; y=output_tr;
TrainingTime=cputime;
[xsup,ysup,w,w0]= svmreg(x,y,C,epsilon,kernel,kerneloption,lambda,verbose);
%% to predict for the training set
xtest=x_tr; %[xtest1;xtest2]';
%% size(xsup),size(xtest),size(w),size(w0),
y0 = svmval(xtest,xsup,w,w0,kernel,kerneloption);
TrainingTime=cputime-TrainingTime;
y2 = output_tr; %yk';
[r] = corrcoef([y2,y0 ]);
fprintf('Correlation Coefficient: = %f \n',r),
diff = (y2-y0);
dbl = double(diff);
sqrd = dbl.^2;
u = mean(mean(sqrd));
% rmse = u^0.5;
% cc.tr=r(2)
% rmsef.tr=rmse;
actual_tr=output_tr;pred_tr=y0;cc_tr=r(2);
x=depth_tr;
target=actual_tr;
ypred=pred_tr;
conf_tr=[target,ypred];
[cc.tr,rmse.tr,Er.tr,Ea.tr,Emin.tr,Emax.tr,SD.tr]=errors_computing_function(target,ypred)
% rmse,

199
% rmse.tr,
% pause,
cc_tr(runs)=cc.tr;rmse_tr(runs)=rmse.tr;Ea_tr(runs)=Ea.tr;SD_tr(runs)=SD.tr;
-------------------------------------------------------------------------------------------------------------------------------
%% testing
% ys = sim(net,test');
xtest=x_ts; %[xtest1;xtest2]';
TestingTime=cputime
ys = svmval(xtest,xsup,w,w0,kernel,kerneloption);
TestingTime=cputime-TestingTime;
%yk = cos(2*test(:,1))./exp(test(:,2));
y2 = output_ts; %yk';
[r] = corrcoef([y2,ys]);
fprintf(' Correlation Coefficient: = %f \n',r),
diff = (y2-ys);
dbl = double(diff);
sqrd = dbl.^2;
u = mean(mean(sqrd));
% rmse = u^0.5;
% fprintf(' Root Mean Square Errors: = %5.5f \n',rmse),
% cc.ts=r(2)
% rmsef.ts=rmse;
actual_ts=output_ts;pred_ts=ys;cc_ts=r(2);
x=depth_ts;
target=actual_ts;
ypred=pred_ts;
conf_ts=[target,ypred];
[cc.ts,rmse.ts,Er.ts,Ea.ts,Emin.ts,Emax.ts,SD.ts]=errors_computing_function(target,ypred);
cc_ts(runs)=cc.ts;rmse_ts(runs)=rmse.ts;Ea_ts(runs)=Ea.ts;SD_ts(runs)=SD.ts;
-------------------------------------------------------------------------------------------------------------------------------
end
SD_rmse.tr=std(rmse_tr);SD_cc.tr=std(cc_tr);
SD_rmse.ts=std(rmse_ts);SD_cc.ts=std(cc_ts);
SD_Ea.tr=std(Ea_tr);SD_Ea.ts=std(Ea_ts);
cc.ts=mean(cc_ts);
cc.tr=mean(cc_tr);
Ea.tr=mean(Ea_tr);
Ea.ts=mean(Ea_ts);
rmse.tr=mean(rmse_tr);
rmse.ts=mean(rmse_ts);
disp('End of svm Networks')
_____________________________________________________________________________________