mechanism of the microtubule gtpase reaction*mechanism of the microtubule gtpase reaction* (received...
TRANSCRIPT

Vol. 265, No. 15, Issue of May 25, PP. 8935-8941,199O Printed in U.S. A.
THE JOURNAL OF BIOLOGICAL CHEMISTRY 8 1990 by The American Society for Biochemistry and Molecular Biology, Inc.
Mechanism of the Microtubule GTPase Reaction*
(Received for publication, August 1, 1989)
Michael Caplow and John Shanks From the Department of Biochemistry, University of North Carolina, Chapel Hill, North Carolina 27599-7260
The rate of GTP hydrolysis by microtubules has been measured at tubulin subunit concentrations where mi- crotubules undergo net disassembly. This was made possible by using microtubules stabilized against dis- assembly by reaction with ethylene glycol bis- (succinimidylsuccinate) (EGS) as sites for the addition of tubulin-GTP subunits. The tubulin subunit concen- tration was varied from 25 to 90% of the steady state concentration, and there was no net elongation of sta- bilized microtubule seeds. The GTPase rate with EGS microtubules was linearly proportional to the tubulin- GTP subunit concentration when this concentration was varied by dilution and by using GDP to compete with GTP for the tubulin E-site. The linear dependence of the rate is consistent with a GTP mechanism in which hydrolysis is coupled to the tubulin-GTP subunit addition to microtubule ends. It is inconsistent with reaction schemes in which: microtubules are capped by a single tubulin-GTP subunit, which hydrolyzes GTP when a tubulin-GTP subunit adds to the end; hydroly- sis occurs primarily in subunits at the interface of a tubulin-GTP cap and the tubulin-GDP microtubule core; hydrolysis is not coupled to subunit addition and occurs randomly in subunits in a tubulin-GTP cap. It was also found that GDP inhibition of the microtubule GTPase rate results from GDP competition for GTP at the tubulin subunit E-site. There is no additional effect of GDP on the GTPase rate resulting from exchange into tubulin subunits at microtubule ends.
Microtubule dynamic instability behavior has been ac- counted for by a reaction scheme in which microtubule ends are capped with tubulin subunits that have not yet hydrolyzed an associated GTP molecule (1). There is, however, no direct proof for the existence of TUT’ subunits at microtubule ends. The most convincing evidence on this question was derived from a study (2) showing that during net microtubule assem- bly, tubulin subunit flux and GTP hydrolysis have different dependences on the tubulin subunit concentration; JH(c) was
* This work was supported by National Institutes of Health Grant DE03246. The costs of publication of this article were defrayed in part by the payment of page charges. This article must therefore be hereby marked “aduertisement” in accordance with 18 U.S.C. Section 1734 solely to indicate this fact.
‘The abbreviations used are: TUT, tubulin-GTP; TuD, tubulin- GDP; JH, GTP hydrolysis; J”(c), dependence of JH on subunit con- centration; J(c), dependence of subunit flux on subunit concentration; c,,, tubulin subunit concentration at which J = 0; c,, tubulin subunit concentration above which all protofilaments at microtubule ends have an indeterminate length of TUT subunits; EGS, ethylene glycol bis(succinimidylsuccinate); EGTA, [ethylenebis(oxyethylenenitrilo)] tetraacetic acid; AMP-PNP, adenyl-5’-yl imidodiphosphate; SDS, sodium dodecyl sulfate; Pipes, 1,4-piperazinediethanesulfonic acid, Mt, microtubule; T-Mt, microtubule with a tubulin-GTP subunit at the end of each protofilament.
linear at low tubulin subunit concentration but reached a limiting value at high concentrations, and J(c), at tubulin subunit concentrations that exceed the approximately 2 pM
steady state concentration, was also biphasic with an abrupt increase in the linear slope of the J(c) plot when the subunit concentration was greater than about 7 FM (2). The observa- tion that subunit flux is concentration-dependent (i.e. above 7 PM), where GTP hydrolysis is concentration-independent, can only be accounted for by a mechanism in which assembly and hydrolysis are not coupled processes. This means that TUT subunits are incorporated into microtubules; they are most likely in a cap at microtubule ends, since subunits at the ends have had the least time to hydrolyze GTP.
This evidence for a TUT cap and linkage between the TUT cap model and dynamic instability behavior was weakened by a subsequent analysis (3) of subunit flux and ATP hydrolysis with actin, which had identical concentration dependences (4) as described for tubulin (2). In this it was demonstrated that the observed triphasic’ J(c) precludes dynamic instability behavior for actin. Since dynamic instability behavior of microtubules is clearly proven (1,5-g), we believed it valuable to obtain additional evidence concerning the subunit depend- ence of the GTPase rate. In the previous study rates were measured at subunit concentrations where there is net assem- bly. However, important information may also be derived from studies of the GTPase rate at subunit concentrations where there is no net microtubule assembly. This has been accomplished using covalently stabilized microtubules. Re- sults have allowed evaluation of models for GTP hydrolysis in assembling microtubules in which GTP hydrolysis is not tightly coupled to microtubule assembly and occurs randomly in TUT subunits in a cap or in TUT subunits at the interface of the cap and the microtubule. Also analyzed is a recently proposed mechanism (9,10) in which the TUT cap consists of a single TUT subunit at the end of each protofilament with hydrolysis of its associated GTP molecule facilitated by ad- dition to the end of another TUT subunit from solution.
EXPERIMENTAL PROCEDURES
Beef brain tubulin was purified by two cycles of assembly (11) and chromatography on phosphocellulose (12); pig brain tubulin was purified as described by-Voter and Erickson (13). Unless stated otherwise, the beef protein was used. EGS seeds and biotinvlated EGS seeds were prebared as described by Koshland et al. (14) and used within 2 days. A pellet obtained by centrifuging the seeds was sectioned and examined by electron microscopy and found to consist of 42% (213 of 506) microtubules and 58% CT- or &shaped tubulin sheets. Axonemes were isolated from Z’etrahymena, as described (15).
’ Microtubule dynamic instability has generally been accounted for by a model which predicts a biphasic dependence of flux with the two curves meeting at c,. Flux was found (2, 4) to be triphasic over the subunit concentration range starting at c = 0. It is the triphasic dependence for flux that was found (3) not consistent with dvnamic in&ability. That is, when the constants were adjusted to aliow dy- namic instability behavior (Fig. 6 in Ref. 3), the predicted J(c) was biphasic rather than triphasic.
8935
by guest on February 3, 2020http://w
ww
.jbc.org/D
ownloaded from
8936 Microtubule GTPase Mechanism
The GTPase rate was measured by reacting EGS seeds (8 pM total protein) with tuhulin subunits obtained from a steady state reaction mixture. Microtubules were formed in a 20-min incubation at 37 “C with 40 fiM tubulin, 175 pM [o-‘“P]GTP, 22% glycerol, 6 mM MgCI,, 2 mM EGTA, 1 mM AMP-PNP (to inhibit non-tubulin GTPase activity), 50 mM Pipes (pH 6.9). Assembly to a steady state gives a solution with a subunit concentration equal to c,., and this was contained in the supernatant derived by centrifugation (Airfuge, 5 min. 30 psi., 37 “C); to avoid sedimented microtubules, only the top 75% of the supernatant was taken. Electron microscopic analysis of diluted samples of the supernatant, sedimented onto a grid using the Airfuge EM90 rotor, indicated that 2.8% of the microtubules in the assembly reaction mixture were contained in the supernatant. Con- tamination probably resulted because the microtubule pellet is dis- turbed when the Airfuge rotor stops. It was demonstrated that under the conditions used to obtain tuhulin subunits a steady stat.e is attained wit.hin 20 min, and the extent of assembly is identical to that with 1.75 mM GTP. The so-derived tubulin subunits were diluted with EGS seeds and buffer containing all of the components in the microtubule assembly mixture except protein and GTP.
The number concentrat,ion of EGS seeds and microtubules in steady st.ate reaction mixtures was determined by electron microscopy after these had been diluted into a glutaraldehyde quench solution and centrifuged onto an electron microscope grid using the Airfuge EM90 rotor (16). The number of polymers sedimented was demon- strated to he proportional to the extent of dilution. The EGS seed number concentration in the GTPase reactions was 1.3 X lo-” M, and the microtubule number concentration in determination of the GTPase rate with steady state microtubules was 4 x IO-” M.
GTP hydrolysis rates were determined by quenching 5-~1 aliquots of the reaction into 1 ml of 0.29 M perchloric acid containing 10 pM Pi, a few milligrams of acid-washed charcoal, and a small amount of Celite filtering aid. Quenched reactions were kept on ice until being cent.rifuged; the supernatant was sampled for measurement of radio- activity. Immunogold staining of hiotinylated EGS seeds was done as described elsewhere (17).
Rates of tuhulin polymerization were measured as described pre- viously (18). All reactions and experimental manipulations, such as preparation of reaction mixtures and centrifugation, were done in a room maintained at 37 “C. It was especially important to maintain a constant temperature in the manipulations involved in generating tuhulin subunits at concentration c,, since microtubules undergo significant disassembly with temperature changes as small as 1 ‘C (18).
RESULTS
Characterization of EGS Seeds-We used microtubule seeds that were covalently cross-linked with EGS to study the dependence of Jn on subunit concentration at concentrations where microtubules are not stable. The cross-linkage in these seeds is probably primarily intramolecular, since the majority of protein migrated with an apparent molecular weight of approximately 55,000 in SDS gel electrophoresis (Fig. 1, lane 6). The principal intermolecular cross-linked product was seen in three protein bands with apparent molecular weights of 101,000, 115,000 and 128,000; a lighter staining band with an apparent molecular weight of 106,000 was also formed. These bands are probably tubulin dimers formed by cross- linking two CY, two 6, and an a and fl subunit. The range in molecular weight as well as our observation of four rather than three bands probably resulted because the mobilities of the various cross-linked dimers are differently influenced by cross-linking. That covalent cross-linking perturbs the appar- ent molecular weight determined by SDS electrophoresis has been demonstrated with cross-linked actin dimers, which have apparent molecular weights of 86,000 and 115,000 in SDS gel electrophoresis (19). The reaction with EGS also generated the products seen in six weakly staining bands with apparent molecular weights in the range of 158,000-211,000. These probably represent the various trimeric species generated by linking N and fi subunits.
Although the EGS seeds are stabilized by cross-linking, they are not stable to cold (14) and we found, using electron
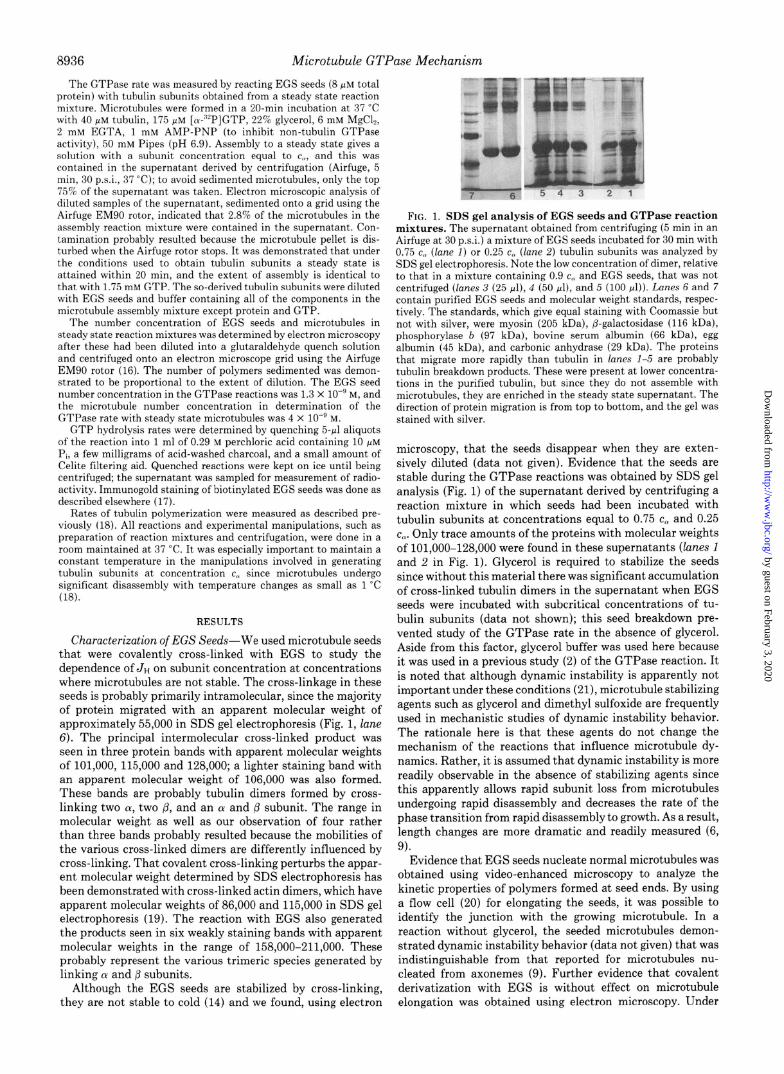
FIG. 1. SDS gel analysis of EGS seeds and GTPase reaction mixtures. The supernatant obtained from centrifuging (5 min in an Airfuge at 30 p.s.i.) a mixture of EGS seeds incubated for 30 min with 0.75 c,, (lane I) or 0.25 c., (lane 2) tuhulin subunits was analyzed by SDS gel electrophoresis. Note the low concentration of dimer, relative to that in a mixture containing 0.9 c,, and EGS seeds, that was not centrifuged (lanes 3 (25 PI), 4 (50 PI), and 5 (100 ~1)). Lanes 6 and 7 contain purified EGS seeds and molecular weight standards, respec- tively. The standards, which give equal staining wit.h Coomassie but not with silver, were myosin (205 kDa), p-galactosidase (116 kDa), phosphorylase b (97 kDa), bovine serum albumin (66 kDa), egg albumin (45 kDa), and carbonic anhydrase (29 kDa). The proteins that migrate more rapidly than tubulin in lanes 1-5 are probably t.uhulin breakdown products. These were present at lower concentra- tions in the purified tubulin, hut since they do not assemble with microtubules, they are enriched in the steady state supernatant. The direction of protein migration is from top to bottom, and the gel was stained with silver.
microscopy, that the seeds disappear when they are exten- sively diluted (data not given). Evidence that the seeds are stable during the GTPase reactions was obtained by SDS gel analysis (Fig. 1) of the supernatant derived by centrifuging a reaction mixture in which seeds had been incubated with tubulin subunits at concentrations equal to 0.75 c,, and 0.25 c,,. Only trace amounts of the proteins with molecular weights of lOl,OOO-128,000 were found in these supernatants (lanes 1 and 2 in Fig. 1). Glycerol is required to stabilize the seeds since without this material there was significant accumulation of cross-linked tubulin dimers in the supernatant when EGS seeds were incubated with subcritical concentrations of tu- bulin subunits (data not shown); this seed breakdown pre- vented study of the GTPase rate in the absence of glycerol. Aside from this factor, glycerol buffer was used here because it was used in a previous study (2) of the GTPase reaction. It is noted that although dynamic instability is apparently not important under these conditions (21), microtubule stabilizing agents such as glycerol and dimethyl sulfoxide are frequently used in mechanistic studies of dynamic instability behavior. The rationale here is that these agents do not change the mechanism of the reactions that influence microtubule dy- namics. Rather, it is assumed that dynamic instability is more readily observable in the absence of stabilizing agents since this apparently allows rapid subunit loss from microtubules undergoing rapid disassembly and decreases the rate of the phase transition from rapid disassembly to growth. As a result, length changes are more dramatic and readily measured (6, 9).
Evidence that EGS seeds nucleate normal microtubules was obtained using video-enhanced microscopy to analyze the kinetic properties of polymers formed at seed ends. By using a flow cell (20) for elongating the seeds, it was possible to identify the junction with the growing microtubule. In a reaction without glycerol, the seeded microtubules demon- strated dynamic instability behavior (data not given) that was indistinguishable from that reported for microtubules nu- cleated from axonemes (9). Further evidence that covalent derivatization with EGS is without effect on microtubule elongation was obtained using electron microscopy. Under
by guest on February 3, 2020http://w
ww
.jbc.org/D
ownloaded from

Microtubule GTPase Mechanism
conditions where self-nucleation is slow (30 ELM tubulin, no glycerol) so that the observed rapid assembly could only occur by addition to added EGS seeds, 88% of 659 polymeric struc- tures examined in sectioned pellets had a microtubule struc- ture.
GTP Hydrolysis with EGS Seeds-It has been suggested that GTP can exchange into terminal subunits in microtu- bules (22) and thus microtubule seeds might be expected to have GTPase activity without TUT subunit addition to ends. To measure this reaction, hydrolysis was studied with EGS seeds and 50 pM [“*P]GTP without added subunits. The observed hydrolysis rate (0.022 pM/min, S.E. 0.001) was 10 times the rate without seeds or subunits (0.0023 pM/min, S.E. 0.00016) but only about 5% of the rate in the presence of a 0.75 c, concentration of subunits (see below). The low hy- drolysis rate in the absence of tubulin subunits indicates that either there is only very slow nucleotide exchange into tubulin subunits at the ends of EGS seeds or that nucleotide exchange into terminal subunits is a facile process, but terminal TUT subunits do not have significant assembly-independent GTPase activity.
The GTPase rate in the presence of a constant concentra- tion (0.75 CJ of tubulin subunits was linearly related to the EGS seed concentration. We were surprised, however, that the extrapolate of the GTPase rate to zero EGS seed concen- tration was above the origin; this was equal to 0.11 (S.E. 0.03) wM/min with subunits at a concentration 0.75 c,. Since the reaction without seeds represents about 30% of the observed rate in the reaction with EGS seeds and subunits (at concen- tration 0.75 c,.), this reaction was run in all of our kinetic studies, and the observed rate was subtracted from that meas- ured with seeds.
The detectable GTPase rate with subunits in the absence of EGS seeds or microtubules is of interest, because it was previously reported (Fig. 3 in Ref. 23) that the GTPase rate is 50.02 pM/min with the supernatant derived from centri- fuging a steady state reaction mixture assembled under con- ditions similar to those used here. We believe that only about 20% of the GTPase rate that we saw in the absence of seeds resulted from a reaction with microtubules that contaminate the supernatant obtained by centrifugation. This is calculated from measurements made with an assembly reaction that was not centrifuged to remove the microtubules where the steady state GTPase rate (with subunit concentration at cn) was 0.84 pM/min. Since the supernatant obtained by centrifuging a steady state reaction mixture had an approximately 2.8% contamination with microtubules (see above), it can be cal- culated that with 0.75 c,, subunits, the rate will be about 0.02 pM/min (i.e. 0.028 X 0.84 X 0.75); this is about 20% of the rate with subunits without EGS seeds.
To determine whether the GTPase activity of pure tubulin subunits resulted from a contaminating protein, the rate was studied with two tubulin preparations that had been prepared by alternate methods and were, therefore, likely to contain different contaminants. In the absence of seeds the GTPase rate with a 0.75 c,, concentration of beef and pig brain tubulin subunits was 0.14 (S.E. 0.016) and 0.11 (S.E. 0.019) fiM/min, respectively. The pig tubulin was purified as described above for beef tubulin except that chromatography on phosphocel- lulose was followed by two cycles of glutamate-induced assem- bly and cold-induced disassembly (13). Analysis of these pro- teins by SDS gel electrophoresis revealed a trace (-0.25%) contamination by microtubule-associated proteins in the beef tubulin; with the pig tubulin, there was no detectable contam- ination in a 100~pg sample in a silver-stained gel. The fact that GTPase activity was not removed by extensive purifica-
tion suggests that tubulin subunits have GTPase activity that is independent of their reaction with microtubule ends.
We were concerned with the possible contribution of inac- tive tubulin to the GTPase activity of tubulin subunits ob- tained from centrifuging the steady state assembly reaction mixture. Measurements of the intersect on the abscissa and slope of a plot of moles of radioactive guanine nucleotide incorporated into pelleted microtubules showed that our tu- bulin preparation had a steady state subunit concentration equal to 2.83 PM (S.E. 0.33) and was 90% (S.E. 2) active with all of the inactive protein remaining soluble after assembly. As a result, the protein concentration derived from assembling 40 pM tubulin contained 2.83 PM active and 4 PM inactive tubulin; this was confirmed by measuring the protein in the supernatant from a reaction with 40 pM tubulin. To rule out the possibility that inactive protein contributed to the GTPase rate, we compared the rate with a 0.9 c, concentration of subunits from a steady state supernatant with that of 3 pM
unassembled tubulin. In these, the protein concentration was 2.55 pM active (i.e. 2.83 X 0.90) and 3.6 pM inactive (i.e. 40 X 0.1 x 0.9) with 0.9 strength steady state supernatant and 2.7 pM active (i.e. 3.0 X 0.9) and 0.3 pM inactive in the unpoly- merized tubulin. If inactive tubulin had GTPase activity, the rate with the 0.9 strength steady state supernatant was ex- pected to be substantially higher. This was not observed; the GTPase rate in the presence of EGS seeds was equal to 0.39 (S.E. 0.03) FM/min with 0.9 strength steady state supernatant and 0.36 (S.E. 0.01) pM/min with the unassembled tubulin. This equivalence of rates indicates that tubulin subunits that are inactive for assembly do not catalyze GTP hydrolysis and do not inhibit the GTPase reaction associated with the reac- tion of active TUT subunits with microtubule seeds.
Dependence of JH on Tubulin Subunit Concentration-GTP hydrolysis was studied with tubulin subunits derived from the supernatant from centrifuging 40 pM tubulin that had been assembled to a steady state. Our use of subunits from a reaction at steady state, instead of unassembled tubulin sub- units at an equivalent concentration, made it less likely that there would be net elongation of seeds during a study of the GTPase reaction. Net elongation from unassembled subunits would occur if the fraction active tubulin were not estimated correctly or if there was an error in measuring the protein concentration. Also, because the critical subunit concentra- tion may not be identical at both microtubule ends (24), there may be elongation at one end of a stable seed at tubulin subunit concentrations that are below the steady state con- centration. It was important in these studies to avoid net assembly since this assures a constant tubulin subunit con- centration during the GTPase assay. Also, we did not want to generate TUT caps at seed ends. Formation of TUT caps would make interpretation more complicated since cap for- mation has a complex dependence on the tubulin subunit concentration (see Fig. 4 in Ref. 25) so that the nature of seed ends available for reaction with TUT subunits might not be the same at different subunit concentrations.
Evidence that seeds are not elongated was obtained using electron microscopy. Nonstaining microtubule segments were not found at the ends of biotinylated EGS seeds after these had been reacted for 30 min with a 0.75 c, concentration of nonbiotinylated tubulin subunits and stained with gold-la- beled antibiotin antibody. Nonstaining microtubule segments were observed when the tubulin subunit concentration was increased to levels that exceed c, (data not shown). Further evidence that neither microtubule end is elongated was ob- tained from study of the reaction of axonemes with 0.9 c,, subunits (Fig. 2B). The absence of elongation means either
by guest on February 3, 2020http://w
ww
.jbc.org/D
ownloaded from

8938 Microtubule GTPase Mechanism
A
B
t
Frc:. 2. Product from reaction of tubulin subunits with Te- trahymena axonemes. Reactlon was for 30 min with 10 ELM tuhulin subunits (il) and wth 0.9 c,. subumts (H): the bar is 1 pm.
the critical concentrations of the two microtubule ends are both >0.9 c,, or the end with the lower critical concentration is kinetically more active so that the properties of this end pred0minat.e in determining t,he apparent critical concentra- tion.”
JH was linearly dependent on tubulin subunit concentration when this was varied from 0.25 c,, to 0.9 c,, (Fig. 3). The molecular rate constant for the GTPase reaction of EGS seeds with TUT subunits at 0.9 c,, was 2.7 (SE. 0.2) s-’ (calculated by dividing t,he observed rate by the EGS seed number con- centration). This is to he compared with a rate equal to 3.3 (S.E. 0.18) s-’ for reaction of steady state microtubules with TUT at c,,; the latter rate is about equal to the previously reported subunit addition rate at TUT concentrations near c,, (2). The similar GTPase rates with EGS seeds and microtu- bules suggest that the hydrolysis mechanism is not alt,ered by derivatization with EGS.
Inhibition of the GTPase Reaction by GDP-GDP reduced the rate of GTP hydrolysis associated with the reaction of TUT with EGS seeds (Table I). These results allowed calcu- lation of the relative binding affinities of GTP and GDP ((u = K,r/&) from the relationship: N = (GTP,,,,,,,,/GDP,,,,i,,l) x (TuD/TuT), where the fraction of tubulin subunits as TUT is determined from the observed rate relative to the rate without added GDP. From the results with 0.5 mM GDP, N was calculated t,o be 0.434 (GDP binds 43% as tightly as GTP), and from the results with 1.5 mM GDP, (Y is 0.307. We had previously found that N equals 0.357 from equilibrium binding studies (26). The reasonable agreement in CY calculated from
“To illustrate this point, when dynamic instahility is not important either because the frequency of the phase transition from growth to shrinking is low or because relative few suhunits are lost during the time that the microtuhules are in the rapidly shortening regimen. as compared with the growing regimen, the critical subunit concentra- tion is equal to the ratio of the sum of the rate constants for assembly at both ends to the sum of the rate constants for disassembly at both ends. Thus, the apparent critical concentration is primarily influ- enced by the kinetic parameters of the more reactive end; this can he either the steady state net assembly (higher critical concentration) or disassembly (lower critical concentration) end.
.
1 30 FIG. :3. Dependence of the GTPase rate with EGS seeds on
tubulin subunit concentration. Results from experiments where the subunit concentration range was 0.25-0.75 c., and 0.3-0.9 c.. are shown: a representative kinetic determination is shown in the inset. The bars indicate the standard error. The tubulin concentration represents active tubulin; this was calculated from the measured critical concentration (2.83 pM) and the extent of dilution of the steady state supernatant. The approximately 35% difference in the slope of the two reactions shown here is believed to result from variability in the seed number concentration; seeds were prepared on the day before the experiment, and these experiments were separated hv a 6-month interval.
TABLE I Inhlbltlon of the GTPase reaction by GDP
GTP hydrolysis was measured with 2.7 pM tubulm and 17.5 pM I”PlGTP.
Reaction Seeds GDP Observed SE. R’ Rate” rate
rnM p M/min !.I M/min fi hf,lmin 1 + 0 0.287 0.007 0.99 0.251 2 + 0.5 0.146 0.005 0.98 0.112 3 + 1.5 0.0924 0.004 0.97 0.0692 4 - 0 0.0368 0.006 0.69 5 - 1.5 0.0272 0.004 0.70
” Rate corrected for the reaction without EGS seeds (i e Reactions 4 and 3).
results obtained with a 3-fold range in the GDP concentration indicates that the rate is influenced by the binding of GTP to the E-site of tubulin subunits only; there is no effect of added GDP on the reactivity of EGS seed ends.
DISCUSSION
The GTPase Mechanism-We found (Fig. 3) the GTPase rate is linearly proportional to the tubulin subunit concentra- tion at concentrations that are below the steady state concen- tration. This result was confirmed in experiments in which the TUT subunit concentration was varied by having GDP competing for the tubulin subunit E-site. In this case, the relative affinities of GTP and GDP for the tubulin E-site were determined from measurements of GDP inhibition of the GTPase rate. Our observation of approximately similar relative affinities in this kinetic assay, as was observed in direct measurements of GTP and GDP binding (26), indicates that the GTPase rate is linearly proportional to the concen- tration of TUT.
The linear dependence of the GTPase rate on tuhulin subunit concentration (Fig. 3, Table I) is consistent with a GTP mechanism in which hydrolysis is tightly coupled to
by guest on February 3, 2020http://w
ww
.jbc.org/D
ownloaded from

Microtubule GTPase Mechanism 8939
TUT subunit addition to microtubule ends. Evidence support- ing this model is of interest since coupling of subunit addition and GTP hydrolysis rules out involvement of a GTP cap in accounting for microtubule dynamic instability behavior.
The linear J”(c) is not consistent with three GTPase mech- anisms. 1) Hydrolysis occurs primarily in subunits at the interface of a TUT cap and the TuD core that constitutes the bulk of the microtubule (27). Because the addition of TUT subunits acts to trap next to the TuD core TUT subunits that might otherwise dissociate without hydrolysis, this mecha- nism predicts a nonlinear Jn(c) at a TUT concentration below the critical concentration (c,) (see Fig. 2 in Ref. 28 and Table 3 in Ref. 29). 2) Hydrolysis is not coupled to subunit addition and occurs randomly in subunits in a TUT cap. According to this scheme, because the size of the TUT cap is nonlinearly dependent on TUT subunit concentration (Fig. 2 in Ref. 30), the GTPase rate has a sigmoidal dependence on tubulin subunit concentration (28, 31). This mechanism has been analyzed by a Monte Carlo simulation (Fig. 2 in Ref. 30), which showed that the rate is near zero until the subunit concentration approaches the steady state concentration (c,). Positive disproof of this mechanism would require study of the GTPase rate in the entire range from c = 0 to c,. However, as noted above, the rate observed at the highest tubulin subunit concentration (i.e. 0.9 cn) was almost equal to the hydrolysis rate with steady state microtubules reacting with TUT at c,. Therefore, it is likely that we would have observed the steep increase in rate in the concentration range near c, if the random hydrolysis mechanism were to hold. The other model that is not supported by our results is discussed next.
The “Enforced Hydrolysis” Model-Our results (Fig. 3) are not consistent with the “enforced hydrolysis” GTPase model (10) in Equation 1.
TUT + Mt + T-Mt
T-Mt + TUT + Pi + T-Mt (1)
In this scheme GTP hydrolysis occurs in a TUT subunit that is at a microtubule end (i.e. in T-Mt) in concert with the addition of another TUT subunit from solution. This model predicts under steady state or near steady state conditions microtubules will be capped with a single TUT subunit on each protofilament (32).
Testing this scheme requires study of the GTPase rate under conditions where the TUT concentration is less than the dissociation constant for addition of a TUT subunit to a microtubule end (i.e. TUT < KT, where KT = (Mt)(TuT)/(T- Mt)). Under such conditions the GTPase rate is proportional to the rate of encounter of TUT subunits with microtubules with a TUT terminal subunit; with TUT < KT the probability for such an encounter is proportional to (TUT)‘. We did not observe this predicted second order dependence of the GTPase rate on the TUT subunit concentration (Fig. 3).
That the majority of seeds as not elongated by a single TUT subunit (i.e. that TUT < KT) is indicated by our electron microscopy results4 and from considering the relationship
4 That TUT < KT is indicated from electron microscopy of biotin- ylated EGS seeds and axonemes (Fig. 2), which showed no elongation of seed ends under the conditions of our GTPase assay. If TUT were >KT, virtually all ends would be elongated. That this elongation should be observable, even though electron microscopy is unlikely to reveal a cap consisting of a very small number of TUT subunits, is suggested by a Monte Carlo simulation of the dynamic instability model. This simulation showed that in the tubulin subunit concen- tration range where there is elongation of a nucleating center, the cap length increases very rapidly with increasing subu& concentra- tion (Fig. 6 in Ref. 29). Thus, if a cap were to be present, there is essentially no concentration range where it is likely to go undetected.
between the critical subunit concentration (i.e. c,) and KT. At the c, subunit concentration the rate of the TUT subunit addition is equal to the rates of dissociation of TUT subunits from microtubules in the growing regimen and TuD subunits from microtubules in the rapidly shortening regimen. As a result, c, is larger than KT by an amount sufficient so that TuD subunits lost by rapidly disassembling microtubules are compensated for by the addition of TUT subunits. Since there is no appreciable dynamic instability behavior in glycerol buffer (21), c, is expected to be only very slightly larger than KT. Consequently, since in our GTPase studies the highest TUT concentration was only 0.75-0.9 c, (Fig. 3), we expect that this concentration is below KT. In summary, it appears that the TUT subunit concentrations used in our studies of the GTPase reaction were below KT so that a dependence of the rate on the second power of the TUT concentration should have been observed if the enforced hydrolysis mechanism (Equation 1) were to hold.
GDP Inhibition of the GTPase Rate-GDP reduced the rate of GTP hydrolysis associated with the reaction of TUT with EGS seeds (Table I). The reasonable agreement in KT/KD calculated from results obtained with a 3-fold range in the GDP concentration indicates that the rate is influenced by the binding of GTP to the E-site of tubulin subunits only; there is no effect of added GDP on the reactivity of EGS seed ends. This conflicts with a previous analysis of the effect of GDP on the GTPase reaction (33) in which it was concluded that added GDP is able to inhibit by exchange into tubulin subunits at the microtubule end as well as by displacing GTP from tubulin subunits. The mechanism here (33) is similar to the enforced hydrolysis mechanism described above (Equation 1) except that generation of the T-Mt species occurs by GTP exchange rather than TUT subunit addition.
The just described variant of the enforced hydrolysis mech- anism can be ruled out by results presented here and previ- ously (33). According to this model it is expected that GDP as well as GTP will exchange into terminal subunits in the microtubule. As a result added GDP is expected to inhibit by binding to both subunits and microtubules so that the GTPase rate will be proportional to l/(GDP)‘; this was not observed. It has been demonstrated that GDP effects on the assembly of microtubule protein can be accounted for by a mechanism in which GDP displaces GTP from tubulin subunits and that there is no need to consider modification of the reactivity of microtubule ends by GDP (34).
Analysis of a Previous Study of JH-It was previously re- ported (2) that the rate of assembly-associated GTP hydrol- ysis has a biphasic dependence on tubulin subunit concentra- tion. The limiting GTPase rate at high subunit concentrations was taken as proof of a TUT cap at microtubule ends with hydrolysis occurring primarily in the TUT subunit at the interface with the TuD core, which constitutes the bulk of the microtubule. Evidence that tubulin subunit flux has a triphasic concentration dependence was obtained. A similar concentration dependence for subunit flux and nucleotide triphosphate hydrolysis had been observed in assembly of F- actin (2, 4, 29, 35), and the mechanism proposed for this (4) was suggested to hold also with microtubules (2).
Subsequent to publication of the experimental measure- ments of subunit and nucleotide triphosphate flux with actin (4), Hill (3) presented a quantitative analysis of this mecha- nism, the conclusion being that rate and equilibrium con- stants derived for the model precluded dynamic instability behavior. Dynamic instability with F-actin was eliminated because the property of the mechanism that predicts a tri- phasic rather than biphasic concentration dependence for
by guest on February 3, 2020http://w
ww
.jbc.org/D
ownloaded from

8940 Microtubule GTPase Mechanism
b 7 0 6
,’
TUBULIN CONCENTRATION (JJM)
FIG. 4. Calculated and observed tubulin subunit concentra- tion dependence of JH. The data points are from Fig. 4 in Ref. 2. The curve (sold line) was calculated from Equation 13 in Ref. 4 using the following values from Ref. 2: kH = 35 s-l from the limiting GTPase rate in Fig. 4; k-o (the rate for loss of TuD subunits from microtu- bules) = 100 s-‘, from the intercept in Fig. 8; k, = 4.87 PM-’ s-l and kms = 21.9 s-l, from the slope and intercept of the steeper linear portion of the J(c) plot in Fig. 2. c, is 10.7 PM, from Equation 4 in Ref. 4; KIK, (where K, and K2 are, respectively, the equilibrium constants for dissociation of the first and second added TUT subunit from a microtubule end) is 5.38, from Equation 18 in Ref. 4; K, and K2 were arbitrarily set equal to 0.733 and 7.33, respectively, since with K1 < Kz (required for the proposed mechanism) the calculated JH is insensitive to the precise values assigned.
subunit flux requires that the phase transition from disassem- bly to assembly be rapid. This would result in only small length changes for polymers at and near steady state. We have used the analytical solution provided by Hill (4) and found5 that the rate and equilibrium results reported for microtubules (2) similarly would not allow significant dy- namic instability behavior with this polymer. Since microtu- bules exhibit dynamic instability, it would appear that the mechanism proposed for microtubule dynamics (2) cannot be valid.
To test the validity of the proposal that the actin model holds for microtubules we next compare the predicted and observed dependence of JH on subunit concentration. When the actin model is applied to tubulin subunit flux at subunit concentrations that are below the steady state concentration, the dependence of JH on tubulin subunit concentration is predicted to be almost perfectly linear with an extrapolate to near the origin (solid line in Fig. 4). In contrast, the experi- mental (2) JH plot appears to intersect the abscissa at a point well away from the origin (Fig. 4). Thus, the model developed to describe actin dynamics does not appear to hold with microtubules.
5 We have analyzed the previous results with microtubules (2) using the equations previously adduced for analysis of actin dynamics (3). The rate and equilibrium constants for this analysis are given in the legend to Fig. 4. Identical values were assumed for k1 and 122, as measured for kS (2). Comparable results were obtained when the rate constants that constitute K, and K2 were changed over a wide range maintaining KI < K2 (required to assure a triphasic J(c)). Results from this analysis indicate that with 2 pM tubulin, which is approxi- mately equal to c,,, 16% of the microtubules are capped with three or more TUT subunits and are growing; 84% are not growing and have zero, one, or two TUT subunits; the mean lifetime of the microtubules that are not growing is only 0.11 s, and during this time there are only 4.6 elementary transitions (subunits lost and gained and GTP molecules hydrolyzed). The fact that there are few elementary tran- sitions within each phase (growing and shortening) means that dy- namic instability behavior is insignificant (3).
6A new model has recently been proposed to account for the triphasic J(c) behavior (Fig. 8 in Ref. 36). In this, microtubule ends have rapidly dissociating TuD subunits or slowly dissociating TUT and TuD-Pi subunits. We have not been able to obtain evidence for
Comparison of our (Fig. 3) and earlier (2) results (Fig. 4) shows that these differ in extrapolation to the origin. A systematic error in rates at low subunit concentrations that made these too low would make the rate not extrapolate to the origin. Data points (2) at high subunit concentrations (lo-19 pM) fit a line that passes through the origin, suggesting that JH(c) may be linear rather than biphasic. This is impor- tant since the biphasic J”(c) had provided important evidence for the existence of a GTP cap on microtubules.
Acknowledgment-We are grateful to Harold Erickson for his helpful advice in preparing the manuscript.
REFERENCES
1. Kirschner, M., and Mitchison, T. (1986) Cell 45, 329-342 2. Carlier, M. F., Didry, D., and Pantaloni, D. (1987) Biochemistry
26,4428-4437 3. Hill, T. L. (1986) Biophys. J. 49,981-986 4. Pantaloni, D., Hill, T. L., Carlier, M. F., and Korn, E. D. (1985)
Proc. Natl. Acad. Sci. U. S. A. 82, 7207-7211 5. Cassimeris, L. U., Pryer, N. K., and Salmon, E. D. (1988) J. Cell
Biol. 107,2223-2231 6. Horio, T., and Hotani, H. (1986) Nature 321, 605-607 7. Sammak, P. J., and Borisy, G. G. (1988) Nature 322, 724-726 8. Schulze, E., and Kirschner, M. (1988) Nature 334, 356-359 9. Walker, R. A., O’Brien, E. E., Pryer, N. K., Soboeiro, M. F.,
Voter, W. A., Erickson, H. P., and Salmon, E. D. (1988) J. Cell Biol. 107,1437-1448
10. O’Brien, E. T., Voter, W. A., and Erickson, H. P. (1987) Biochm- istry 26,4148-4156
11. Zeeberg, B., Cheek, J., and Caplow, M. (1980) Anal. Biochem. 104,321-327
12. Weingarten, M. D., Lockwood, A. H., Hwo, S., and Kirschner, M. W. (1975) Proc. Natl. Acad. Sci. U. S. A. 72, 1858-1862
13. Voter, W. A., and Erickson, H. P. (1984) J. Biol. Chem. 259, 10430-10438
14. Koshland, D. E., Mitchison, T. J., and Kirschner, M. W. (1988) Nature 33 1,499-504
15. Johnson, K. A. (1986) Methods Enzymol. 134,306-317 16. Kristofferson, D., Mitchison, T., and Kirschner, M. (1986) J. Cell
Biol. 102,1007-1019 17. Schulze, E., and Kirschner, M. (1986) J. Cell Biol. 102, 1020-
1031 18. Caplow, M., Shanks, J., and Ruhlen, R. L. (1988) J. Biol. Chem.
263,10344-10352 19. Millonig, R., Salvo, H., and Aebi, U. (1988) J. Cell Biol. 106,
785-796 20. Berg, H. C., and Block, S. M. (1984) J. Gen. Microbial. 130,
2915-2920 21. Caplow, M., Shanks, J., and Brylawski, B. P. (1986) J. Biol.
Chem. 261, 16233-16240 22. Carlier, M. F., and Pantaloni, D. (1981) Biochemistry 20, 1918-
1924 23. David-Pfeuty, T., Erickson, H. P., and Pantaloni, D. (1977) Proc.
Natl. Acad. Sci. U. S. A. 74, 5372-5376 24. Margolis, R. L., and Wilson, L. (1978) Cell 13, l-8 25. Chen, Y., and Hill, T. L. (1984) Proc. Natl. Acad. Sci. U. S. A.
82,4127-4131 26. Zeeberg, B., and Caplow, M. (1979) Biochemistry 18, 3880-3886 27. Caplow, M., Shanks, J., and Brylawski, B. P. (1985) Can. J.
Biochem. Cell Biol. 63,422-429
stabilization of microtubules with TuD-Pi subunits (37). Also, it has not been established that this model allows dynamic instability be- havior. It would appear that dynamic instability behavior would be precluded for the same reason that it was in the actin model (4). That is, in the usual formulation of the dynamic instability model, with only TUT and TuD subunits, TUT addition to an end does not ordinarily rescue a microtubule undergoing rapid disassembly, since hydrolysis converts the slowly dissociating TUT subunit into a rapidly dissociating TuD subunit. In contrast, in the new model hydrolysis converts a slowly dissociating TUT subunit into a slowly dissociating TuD-Pi subunit; this will facilitate rescue and inhibit dynamic insta- bility behavior.
by guest on February 3, 2020http://w
ww
.jbc.org/D
ownloaded from

Microtubule GTPase Mechanism 8941
28. Carl&, M. F., and Pantaloni, D. (1985) Microtubules and Micro- 32. Bayley, P. M., and Martin, S. R. (1988) Biophys. J. 55, 256a tubule Inhibitors, pp. 61-69, Elsevier Science Publishers B.V., 33. Carlier, M. F., and Pantaloni, D. (1982) Biochemistry 21, 1215- Amsterdam 1224
29. Chen, Y. D., and Hill, T. L. (1985) Proc. Nutl. Acad. Sci. U. S. A. 34. Martin, S. R., and Bayley, P. M. (1987) Biophys. Chem. 27, 67- -n 82,1131-1135
30. Chen, Y., and Hill, T. L. (1983) hoc. Natl. Acad. Sci. U. S. A. 35. KLzer, T., Schiller, A., and Wegner, A. (1986) Biochemistry 25,
80,7520-7523 4899-4906
31. Carlier, M. F., Pantaloni, D., and Korn, E. D. (1987) J. Biol. 36. Carlier, M. F. (1989) Znt. Reu. Cytol. 115, 139-170
Chem.262,3052-3059 37. Caplow, M., Ruhlen, R., Shanks, J., Walker, R. A., and Salmon,
E. D. (1989) Biochemistry 28,8136-8141
by guest on February 3, 2020http://w
ww
.jbc.org/D
ownloaded from
M Caplow and J ShanksMechanism of the microtubule GTPase reaction.
1990, 265:8935-8941.J. Biol. Chem.
http://www.jbc.org/content/265/15/8935Access the most updated version of this article at
Alerts:
When a correction for this article is posted•
When this article is cited•
to choose from all of JBC's e-mail alertsClick here
http://www.jbc.org/content/265/15/8935.full.html#ref-list-1
This article cites 0 references, 0 of which can be accessed free at
by guest on February 3, 2020http://w
ww
.jbc.org/D
ownloaded from