mechanical and thermal properties of graphene random...
TRANSCRIPT

lable at ScienceDirect
Carbon 132 (2018) 766e775
Contents lists avai
Carbon
journal homepage: www.elsevier .com/locate /carbon
Mechanical and thermal properties of graphene random nanofoamsvia Molecular Dynamics simulations
Andrea Pedrielli a, b, Simone Taioli b, c, Giovanni Garberoglio b, **,Nicola Maria Pugno a, d, e, *
a Laboratory of Bio-Inspired and Graphene Nanomechanics, Department of Civil, Environmental and Mechanical Engineering, University of Trento, Italyb European Centre for Theoretical Studies in Nuclear Physics and Related Areas (ECT*-FBK), and Trento Institute for Fundamental Physics and Applications(TIFPA-INFN), Trento, Italyc Faculty of Mathematics and Physics, Charles University, Prague, Czech Republicd School of Engineering and Materials Science, Queen Mary University of London, UKe Ket Lab, Edoardi Amaldi Foundation, Italian Space Agency, Italy
a r t i c l e i n f o
Article history:Received 9 January 2018Received in revised form21 February 2018Accepted 22 February 2018Available online 27 February 2018
Keywords:Graphene foamsMolecular dynamicsPorosityStress-strain curveThermal conductivity
* Corresponding author. Laboratory of Bio-Inspmechanics, Department of Civil, Environmental and Mversity of Trento, Italy.** Corresponding author. European Centre for ThPhysics and Related Areas (ECT*-FBK), and Trento Instand Applications (TIFPA-INFN), Trento, Italy.
E-mail addresses: [email protected] (G. Garbit (N.M. Pugno).
https://doi.org/10.1016/j.carbon.2018.02.0810008-6223/© 2018 Elsevier Ltd. All rights reserved.
a b s t r a c t
Graphene foams have recently attracted a great deal of interest for their possible use in technologicalapplications, such as electrochemical storage devices, wearable electronics, and chemical sensing. In thiswork, we present computational investigations, performed by using molecular dynamics with reactivepotentials, of the mechanical and thermal properties of graphene random nanofoams. In particular, weassess the mechanical and thermal performances of four families of random foams characterized byincreasing mass density and decreasing average pore size. We find that the foams' mechanical perfor-mances under tension cannot be rationalized in terms of mass density, while they are principally relatedto their topology. Under compression, higher-density foams show the typical slope change in the stressestrain curve at 5� 10% strain, moving from linear elasticity to a buckling region. At variance, lowerdensity foams display a quasi-linear behavior up to 35% strain. Furthermore, we assess the thermalconductivity of these random foams using the GreeneKubo approach. While foam thermal conductivityis affected by both connectivity and defects, nevertheless we obtain similar values for all the investigatedfamilies, which means that topology is the critical factor affecting thermal transport in these structures.
© 2018 Elsevier Ltd. All rights reserved.
1. Introduction
Recently, an increasing interest has been paid to nanoporousmaterials. Porosity, indeed, can strongly increase the surface-to-volume ratio and enhance the specific mechanical properties,such as the specific modulus and strength, with respect to the bulkmaterial. For example, a high surface-to-volume ratio is desirablefor gas adsorption and separation [1], while improving specificmechanical properties using carbon-based porous materials is of
ired and Graphene Nano-echanical Engineering, Uni-
eoretical Studies in Nuclearitute for Fundamental Physics
eroglio), nicola.pugno@unitn.
interest for building lightweight structural components [2].Moreover, after the discovery of novel bi-dimensional materials
[3], such as the hexagonal allotrope of boron nitride (h-BN) andgraphene, several investigations have been focused onto the searchof unconventional 3D structures that inherit the outstandingelectrical [4,5], thermal and mechanical properties of their 2Dcounterpart in order to achieve specific requirements.
In particular, graphene shows excellent tensile properties, suchas fracture strength (sx 130 GPa) and Young's modulus (Ex 1 TPa)coupled with relatively low density due to its bidimensionality, andthus it is the best candidate material to be used in the synthesis offoam assemblies with superior properties. Graphene-based nano-foams can be synthesized by using Chemical Vapor Deposition(CVD) on metallic scaffold as well as nanoparticles assemblies[6e8] or chemically derived by reducing graphene oxide [9]. Inmechanical and thermal applications, critical parameters are theconcentration of defects, the topology as well as the inter-flakecontacts. Despite this technological interest, only a few
A. Pedrielli et al. / Carbon 132 (2018) 766e775 767
computational investigations have been performed to characterizetheir electronic, thermal and mechanical properties [10e12]. Inparticular, mechanical properties of porous materials at microscalecan be studied by the Ashby-Gibson theory, in which a unit cellapproach is combined with dimensional analysis [13]. While thisapproach can be useful to derive scaling laws of mechanical prop-erties with respect to density, the effective properties of porousmaterials are not often a simple function of porosity. At odds, theyusually strongly depend on features at the nanoscale, where localatomic interactions start to play a crucial role, or on the presence ofstruts and of random pores with very special shapes that destroystructural periodicity. Furthermore, deformation mechanisms atthemesoscale can be very different at the nanoscale, where the finedetails of graphene topology come into play, and a multiscaleapproach should be devised [2]. Additionally, it turns out thatcarbon-based nanoporous materials with random porosity distri-bution exhibit poor scaling of the mechanical properties withdecreasing density, even more pronounced than that of metal andpolymeric foams [14]. However, nanoporous graphene foams easilyoutperform polymeric foams at high density and can compete withtheir high-performance rivals, such as the metal foams. Thus, theinterest in studying these random porous structures for energystorage and damping devices remains high.
Moreover, the high porosity of random foams suggests a con-current application of these materials as thermal insulators. Inparticular, our goal is to assess the dependence of the thermo-physical properties on pore density and size, and to comparethermal insulation performances of graphene-based 3D structureswith other widely used carbon-based foams, such as polyurethaneand metal foams.
This work is thus aimed at shedding some light on the me-chanical and thermal properties of randomgraphene nanofoams. Inparticular, we present molecular dynamics (MD) simulations ofrandom-pore foams under tension and compression by modelingatomic interactions via reactive potentials. Several random-porefoams, characterized by different density and porosity, are pro-duced using a tailored while reproducible recipe, which consists inpreparing families of random networks to which graphene isattached. Mechanical properties are assessed by computingstressestrain curves, Young moduli, Poisson ratio, and specifictoughness for each family of random foams. Furthermore, to assessthe efficiency of our random-pore nanofoams as thermal insulatorswe report in this study the calculation of the effective phononthermal conductivity using the equilibrium Green-Kubo formalism.
2. Modeling graphene random foams
To generate our families of graphene foams, we devise anapproach composed basically of two steps [12,15]: first, wegenerate a tessellation of the surface to be decorated with grapheneby using triangles; second, we apply a Voronoi partitioning (dual-ization) of the triangulation points.
More in details, we start by filling the simulation unit cell with arandom ensemble of particles interacting via a pair-wise Lennard-Jones (LJ) potential (Fig. 1a). As a second step, the unit cell is slowlyexpanded to obtain random aggregation of particles (Fig. 1b). In thethird step we fill the simulation cell with a second type of particlesarranged into a regular grid and characterized by different LJ pa-rameters with respect to the previous ones (Fig.1c). The first type ofparticles (support particles) acts as a framework to support theparticles used in the triangulation (foam particles). The latter aredeleted if they are too close (below 0.8 nm) to the support particlesin order to avoid convergence issues during MD simulations. Thefourth step consists in the optimization of the foam particle posi-tions, performed by clamping down the framework degrees of
freedomwith a viscous damping force (Fig. 1d). The particles foundat a distance from the support particles larger than 0.32 nm weredeleted to obtain a smooth mono-layer structure (Fig. 1e). As a laststep, the Voronoi partition of the triangles tessellating the surfacewas performed to obtain pentagonal, hexagonal and heptagonalcarbon rings (Fig. 1f) (for further details on this procedure seeRef. [15]). These configurations were finally annealed by MD usingreactive potentials to optimize the carbon positions within thefoams.
By using this recipe, four families of carbon foams were pro-duced (called A, B, C, and D, see Fig. 1a, which are provided as xyzcoordinate files with this submission). Each family is characterizedby a different initial number of randomly-positioned support par-ticles while, within each family, the only difference is the initialrandom distribution of the support points (Fig. 1a). During thewhole procedure we impose periodic boundary conditions.
The LJ parameters used for the support (S) and foam (F) parti-cles, respectively, are the following: εSS ¼ 100:0 eV, sSS ¼ 0:3 nm,cutoffSS¼ 0.5 nm, εFF ¼ 0:1 eV, sFF ¼ 0:32 nm, cutoffFF¼ 0.23 nm,εSF ¼ 10:0 eV, sSFF ¼ 1:0 nm. The starting cell side length is 6.0 nm,expanded up to a length of 12.5 nm from step a) to step b) of Fig. 1.
These parameters were chosen in such a way that the typicaldistance between the support particles was smaller than theequilibrium length between the foam and the support particles. Inthis way, the support particle surface is smooth, being obtained byseveral atoms lying nearby.
The topology of the nanofoams studied here is inspired by thegraphene foams grown on nickel scaffolds (Fig. 2). However, wenote that the pore size in the experimentally synthesized samples islarger than in our computational models. The way in which ourgraphene random foams are built is substantially different fromthat one presented in Ref. [14], where three-dimensional grapheneassemblies were synthesized by starting from randomly distributedand oriented rectangular graphene flakes and spherical inclusions,and by repeating NPT-NVT cycles to obtain condensed graphenefoams.
3. Characterization of graphene foams
Five different samples for each of the four families were pre-pared by varying the initial distribution of the support particles. InFig. 3 we report representative models (3.0 nm slices) for each ofthese foam families. From A to D the foams present a decreasingaverage pore size, and an increasing mass density.
The geometrical analysis of the graphene porous foams and oftheir voids was carried out using the simulation code Zeoþþ [16].In particular, we characterize our prepared structures using thePore Size Distribution (PSD) function, which can be experimentallyobtained by adsorption/desorption measurements. PSD analysisdelivers a quantitative description of the range of pore sizes presentin a given sample.
Moreover, we perform a coordination analysis to find possiblesignature of under- or over-coordination of the carbon atomsusually forming a network of sp2 hybrid bonds. The computedquantities are reported in Table 1.
The averaged PSDs for all our graphene foam families are re-ported in Fig. 4 (continuous lines), showing the standard deviationwithin each group as a colored shaded area. By comparing thesePSDs with those obtained in the case of regular pore foams [12],reported in Fig. 5, we notice that the random foams present similaraverage pore dimension and similar mass density. Indeed, therandom foam PSDs are characterized by a maximum, representingthe most likely pore size in each case, decreasing from 2.3 nm to1.7 nm from A to D foam type. The average values of the pore sizeare reported in Table 1. These values compare reasonably well with
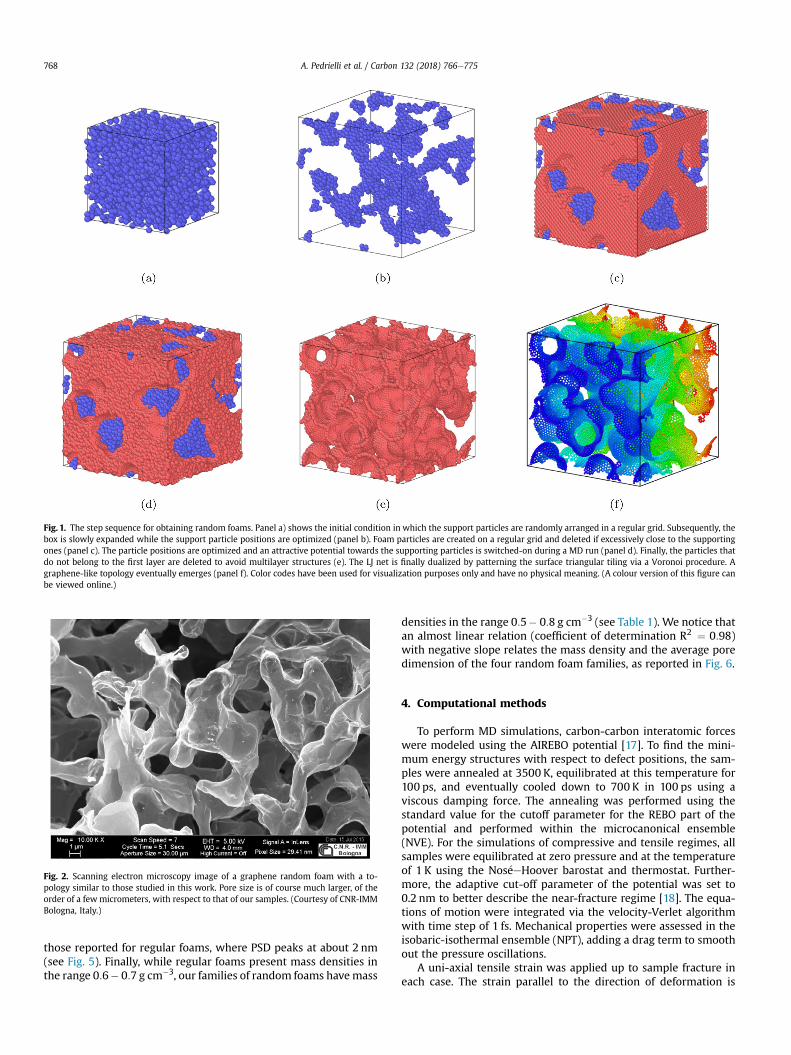
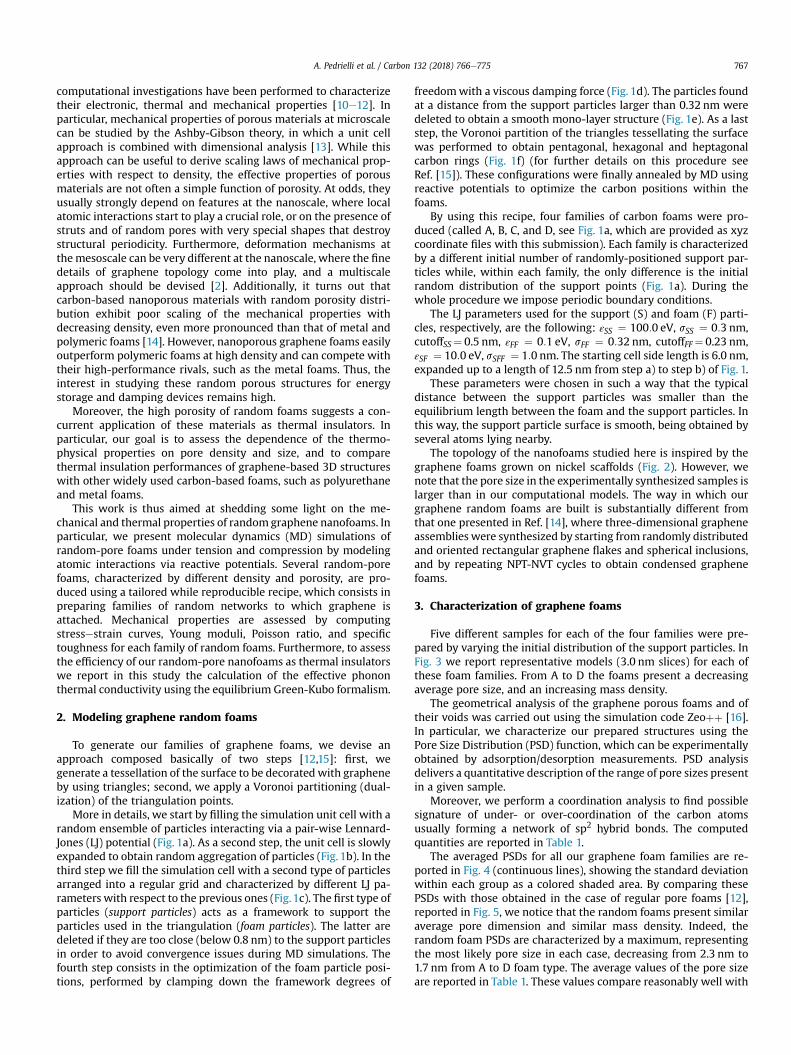
Fig. 1. The step sequence for obtaining random foams. Panel a) shows the initial condition in which the support particles are randomly arranged in a regular grid. Subsequently, thebox is slowly expanded while the support particle positions are optimized (panel b). Foam particles are created on a regular grid and deleted if excessively close to the supportingones (panel c). The particle positions are optimized and an attractive potential towards the supporting particles is switched-on during a MD run (panel d). Finally, the particles thatdo not belong to the first layer are deleted to avoid multilayer structures (e). The LJ net is finally dualized by patterning the surface triangular tiling via a Voronoi procedure. Agraphene-like topology eventually emerges (panel f). Color codes have been used for visualization purposes only and have no physical meaning. (A colour version of this figure canbe viewed online.)
Fig. 2. Scanning electron microscopy image of a graphene random foam with a to-pology similar to those studied in this work. Pore size is of course much larger, of theorder of a few micrometers, with respect to that of our samples. (Courtesy of CNR-IMMBologna, Italy.)
A. Pedrielli et al. / Carbon 132 (2018) 766e775768
those reported for regular foams, where PSD peaks at about 2 nm(see Fig. 5). Finally, while regular foams present mass densities inthe range 0:6� 0:7 g cm�3, our families of random foams havemass
densities in the range 0:5� 0:8 g cm�3 (see Table 1). We notice thatan almost linear relation (coefficient of determination R2 ¼ 0:98)with negative slope relates the mass density and the average poredimension of the four random foam families, as reported in Fig. 6.
4. Computational methods
To perform MD simulations, carbon-carbon interatomic forceswere modeled using the AIREBO potential [17]. To find the mini-mum energy structures with respect to defect positions, the sam-ples were annealed at 3500 K, equilibrated at this temperature for100 ps, and eventually cooled down to 700 K in 100 ps using aviscous damping force. The annealing was performed using thestandard value for the cutoff parameter for the REBO part of thepotential and performed within the microcanonical ensemble(NVE). For the simulations of compressive and tensile regimes, allsamples were equilibrated at zero pressure and at the temperatureof 1 K using the Nos�eeHoover barostat and thermostat. Further-more, the adaptive cut-off parameter of the potential was set to0.2 nm to better describe the near-fracture regime [18]. The equa-tions of motion were integrated via the velocity-Verlet algorithmwith time step of 1 fs. Mechanical properties were assessed in theisobaric-isothermal ensemble (NPT), adding a drag term to smoothout the pressure oscillations.
A uni-axial tensile strain was applied up to sample fracture ineach case. The strain parallel to the direction of deformation is
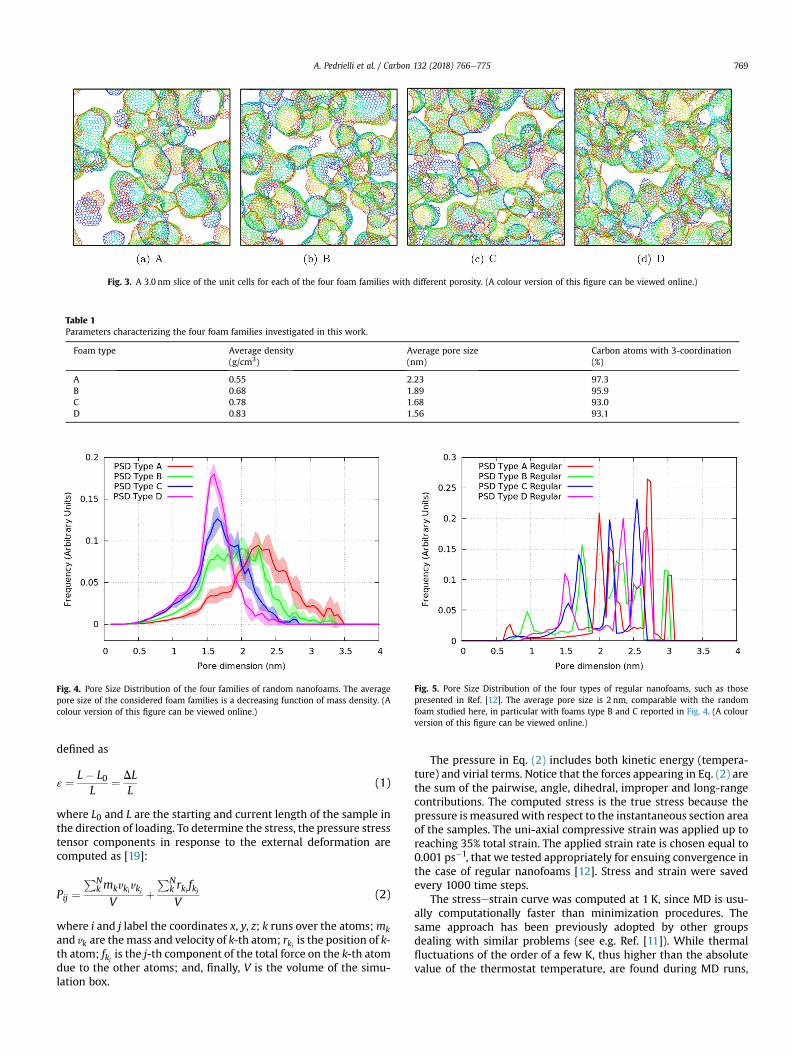
Fig. 3. A 3.0 nm slice of the unit cells for each of the four foam families with different porosity. (A colour version of this figure can be viewed online.)
Table 1Parameters characterizing the four foam families investigated in this work.
Foam type Average density(g/cm3)
Average pore size(nm)
Carbon atoms with 3-coordination(%)
A 0.55 2.23 97.3B 0.68 1.89 95.9C 0.78 1.68 93.0D 0.83 1.56 93.1
Fig. 4. Pore Size Distribution of the four families of random nanofoams. The averagepore size of the considered foam families is a decreasing function of mass density. (Acolour version of this figure can be viewed online.)
Fig. 5. Pore Size Distribution of the four types of regular nanofoams, such as thosepresented in Ref. [12]. The average pore size is 2 nm, comparable with the randomfoam studied here, in particular with foams type B and C reported in Fig. 4. (A colourversion of this figure can be viewed online.)
A. Pedrielli et al. / Carbon 132 (2018) 766e775 769
defined as
ε ¼ L� L0L
¼ DLL
(1)
where L0 and L are the starting and current length of the sample inthe direction of loading. To determine the stress, the pressure stresstensor components in response to the external deformation arecomputed as [19]:
Pij ¼PN
k mkvkivkjV
þPN
k rki fkjV
(2)
where i and j label the coordinates x, y, z; k runs over the atoms;mkand vk are themass and velocity of k-th atom; rki is the position of k-th atom; fkj is the j-th component of the total force on the k-th atomdue to the other atoms; and, finally, V is the volume of the simu-lation box.
The pressure in Eq. (2) includes both kinetic energy (tempera-ture) and virial terms. Notice that the forces appearing in Eq. (2) arethe sum of the pairwise, angle, dihedral, improper and long-rangecontributions. The computed stress is the true stress because thepressure is measuredwith respect to the instantaneous section areaof the samples. The uni-axial compressive strain was applied up toreaching 35% total strain. The applied strain rate is chosen equal to0.001 ps�1, that we tested appropriately for ensuing convergence inthe case of regular nanofoams [12]. Stress and strain were savedevery 1000 time steps.
The stressestrain curve was computed at 1 K, since MD is usu-ally computationally faster than minimization procedures. Thesame approach has been previously adopted by other groupsdealing with similar problems (see e.g. Ref. [11]). While thermalfluctuations of the order of a few K, thus higher than the absolutevalue of the thermostat temperature, are found during MD runs,
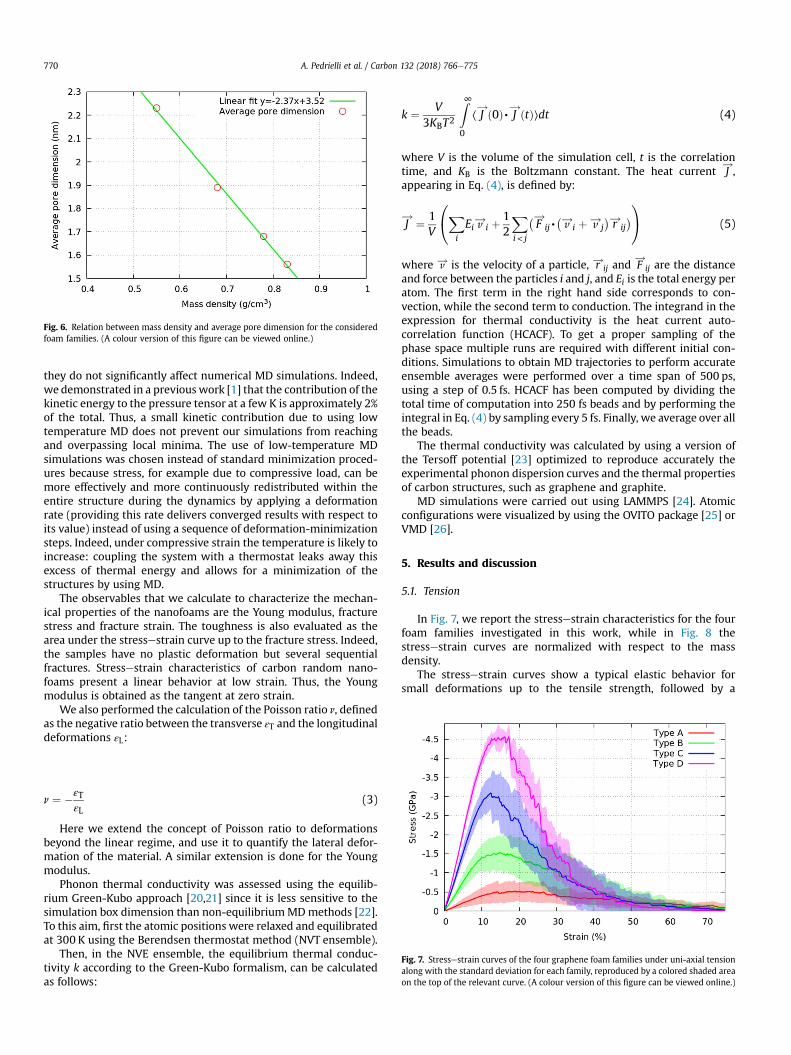
Fig. 6. Relation between mass density and average pore dimension for the consideredfoam families. (A colour version of this figure can be viewed online.)
Fig. 7. Stressestrain curves of the four graphene foam families under uni-axial tensionalong with the standard deviation for each family, reproduced by a colored shaded areaon the top of the relevant curve. (A colour version of this figure can be viewed online.)
A. Pedrielli et al. / Carbon 132 (2018) 766e775770
they do not significantly affect numerical MD simulations. Indeed,we demonstrated in a previouswork [1] that the contribution of thekinetic energy to the pressure tensor at a few K is approximately 2%of the total. Thus, a small kinetic contribution due to using lowtemperature MD does not prevent our simulations from reachingand overpassing local minima. The use of low-temperature MDsimulations was chosen instead of standard minimization proced-ures because stress, for example due to compressive load, can bemore effectively and more continuously redistributed within theentire structure during the dynamics by applying a deformationrate (providing this rate delivers converged results with respect toits value) instead of using a sequence of deformation-minimizationsteps. Indeed, under compressive strain the temperature is likely toincrease: coupling the system with a thermostat leaks away thisexcess of thermal energy and allows for a minimization of thestructures by using MD.
The observables that we calculate to characterize the mechan-ical properties of the nanofoams are the Young modulus, fracturestress and fracture strain. The toughness is also evaluated as thearea under the stressestrain curve up to the fracture stress. Indeed,the samples have no plastic deformation but several sequentialfractures. Stressestrain characteristics of carbon random nano-foams present a linear behavior at low strain. Thus, the Youngmodulus is obtained as the tangent at zero strain.
We also performed the calculation of the Poisson ratio n, definedas the negative ratio between the transverse εT and the longitudinaldeformations εL:
n ¼ �εT
εL(3)
Here we extend the concept of Poisson ratio to deformationsbeyond the linear regime, and use it to quantify the lateral defor-mation of the material. A similar extension is done for the Youngmodulus.
Phonon thermal conductivity was assessed using the equilib-rium Green-Kubo approach [20,21] since it is less sensitive to thesimulation box dimension than non-equilibriumMDmethods [22].To this aim, first the atomic positions were relaxed and equilibratedat 300 K using the Berendsen thermostat method (NVT ensemble).
Then, in the NVE ensemble, the equilibrium thermal conduc-tivity k according to the Green-Kubo formalism, can be calculatedas follows:
k ¼ V3KBT2
Z∞
0
⟨ J!ð0Þ, J
!ðtÞ⟩dt (4)
where V is the volume of the simulation cell, t is the correlationtime, and KB is the Boltzmann constant. The heat current J
!,
appearing in Eq. (4), is defined by:
J!¼ 1
V
0@X
i
Ei v!
i þ12
Xi< j
�F!
ij,�v!i þ v!j
�r!ij
�1A (5)
where v! is the velocity of a particle, r!ij and F!
ij are the distanceand force between the particles i and j, and Ei is the total energy peratom. The first term in the right hand side corresponds to con-vection, while the second term to conduction. The integrand in theexpression for thermal conductivity is the heat current auto-correlation function (HCACF). To get a proper sampling of thephase space multiple runs are required with different initial con-ditions. Simulations to obtain MD trajectories to perform accurateensemble averages were performed over a time span of 500 ps,using a step of 0.5 fs. HCACF has been computed by dividing thetotal time of computation into 250 fs beads and by performing theintegral in Eq. (4) by sampling every 5 fs. Finally, we average over allthe beads.
The thermal conductivity was calculated by using a version ofthe Tersoff potential [23] optimized to reproduce accurately theexperimental phonon dispersion curves and the thermal propertiesof carbon structures, such as graphene and graphite.
MD simulations were carried out using LAMMPS [24]. Atomicconfigurations were visualized by using the OVITO package [25] orVMD [26].
5. Results and discussion
5.1. Tension
In Fig. 7, we report the stressestrain characteristics for the fourfoam families investigated in this work, while in Fig. 8 thestressestrain curves are normalized with respect to the massdensity.
The stressestrain curves show a typical elastic behavior forsmall deformations up to the tensile strength, followed by a

Fig. 8. Stressestrain curves of the four foam families weighted by the sample massdensity under uni-axial tension along with the standard deviation for each family,reproduced by a colored shaded area on the top of the relevant curve. (A colour versionof this figure can be viewed online.)
A. Pedrielli et al. / Carbon 132 (2018) 766e775 771
decreasing tail corresponding to the sample fracture. We noticethat the stressestrain characteristics of graphene foams do notpresent a region that can be associated to a plastic deformation.Indeed, these 3D graphene structures are essentially brittle, pre-senting a comparable fracture strain with a corresponding stressspecific of the family. Notably, the same behavior is found in themass density weighted stressestrain curves (see Fig. 8). Thisfinding tells us that the different mechanical performances of thefour foam families are due basically to features other than massdensity, such as the pore size distribution or the connectivity.Indeed, if the mass density were the factor most critically affectingthe foam mechanical properties, then the normalized stress-straincurves should nearly overlap.
Moreover, we report in Table 2 the Young modulus and thetensile strength of the four foam families, and in Table 3 the specificmodulus and the specific strength (values per mass density).Furthermore, in the fifth column of Table 3 we show the specifictoughness, calculated as the total area below the stressestraincurves of Fig. 8 up to the fracture strain. Specific Young modulusand tensile strength of random foams can be compared with thosepreviously calculated for carbon nanotruss networks, studied inRef. [12]. For nanotruss networks, at 5%e8% strain the stress is inthe range 90� 130MNm kg�1, while for random foams at the samestrain the values are in the range 3:9� 36:6MNm kg�1. This makesclear that regular foams are mechanically stiffer than the randomones here studied. Graphene random foams can be also comparedto 3D graphene assemblies reported in Ref. [14]. Graphene as-semblies have a specific Young modulus of 7.65MNm kg�1 (massdensity: 0.366 g/cm3, Young modulus: 2.8 GPa), which compareswith the lowest mass density foam family studied here (seeTable 2). At variance, the specific strength of 7.4MNm kg�1 found in
Table 2Young modulus (1st column) and its standard deviation (2nd column), tensile strength (3of the four families of random foams under tension.
Foam type Young modulus(GPa)
Standard deviation(GPa)
A 3.9 2.1B 14.0 3.1C 27.3 3.7D 36.6 1.9
graphene assemblies is only slightly higher than in our randomfoams, mainly due to the higher connectivity of graphene sheetscomposing the assemblies. For completeness, we notice that themechanical tests reported in Ref. [14] have been performed at atemperature of 300 K, while our simulations are performed at 1 K.Movies of our foams under tensile load are provided with thissubmission.
5.2. Compression
In this section we present the results obtained for our samplesunder compressive load. In Fig. 9 we report the stressestrain curvesfor the four foam families. The maximum deformation reaches 35%strain for the largest compression load. Beyond 35% strain thefoams are mechanically unstable. From Fig. 9, we observe that atsmall strain foams are in the elastic regime, and the material ischaracterized by a full recovery to the original shape when the loadis removed. Subsequently, we find a region with a slope similar forall our foam families, which models the structural collapse at anearly constant stress by blucking or fracture of the building blocks.
Finally, at higher strain (not shown) one finds a steep ramp inthe stressestrain curve, representing the complete collapse of thestructures. The random foam family A, characterized by the lowestdensity, presents this ramp at 70% compressive strain. At variance,higher density random foams are not stable under compressionbefore their respective final ramps, and present a structural tran-sition from graphene ordered layers to amorphous carbon, with astrong stress decrease followed by an increase.
The most visible mechanical characteristics of our families ofrandom foams (see the stressestrain curves in Fig. 9) is that, withincreasing foam density and decreasing pore size average dimen-sion, the elastic part presents an increasing slope, while beyond 5�10% strain the slopes are very similar. This behavior suggests achange in the compression mechanism: below 5� 10% strain thestress is mainly due to the connectivity among graphene layers andthis regime is characterized by structural stability, while beyondthat the structures start collapsing with a relatively small increaseof the stress, due to the bending of the graphene sheets inside thefoams.
The foam family with the lowest mass density presents analmost linear stressestrain characteristic. This suggests that thecollapse is dominated by bending. In higher density foams the slopechange is more marked, showing that bending of graphene sheetsoccurs at higher strain.
We notice that the similarity of the slope of the stressestraincurves between 10% and 30% strain is due to a similar mechanismfor collapse. This similarity can be rationalized by observing Fig. 10,where a 2.0 nm slice of a sample from the foam families A and Dunder 12% compressive strain is reported. As by Fig. 9 this strainvalue sets the transition between the elastic regime and thecollapsing region. This transition for foams of higher porosity, suchas those belonging to the type A, is related to the closure of theinterstitial space when graphene sheets touch upon, as thosehighlighted by red circles.
rd column) and its standard deviation (4th column), and fracture strain (5th column)
Tensile strength(GPa)
Standard deviation(GPa)
Fracture strain(%)
0.5 0.3 191.5 0.5 153.1 0.4 124.6 0.3 13
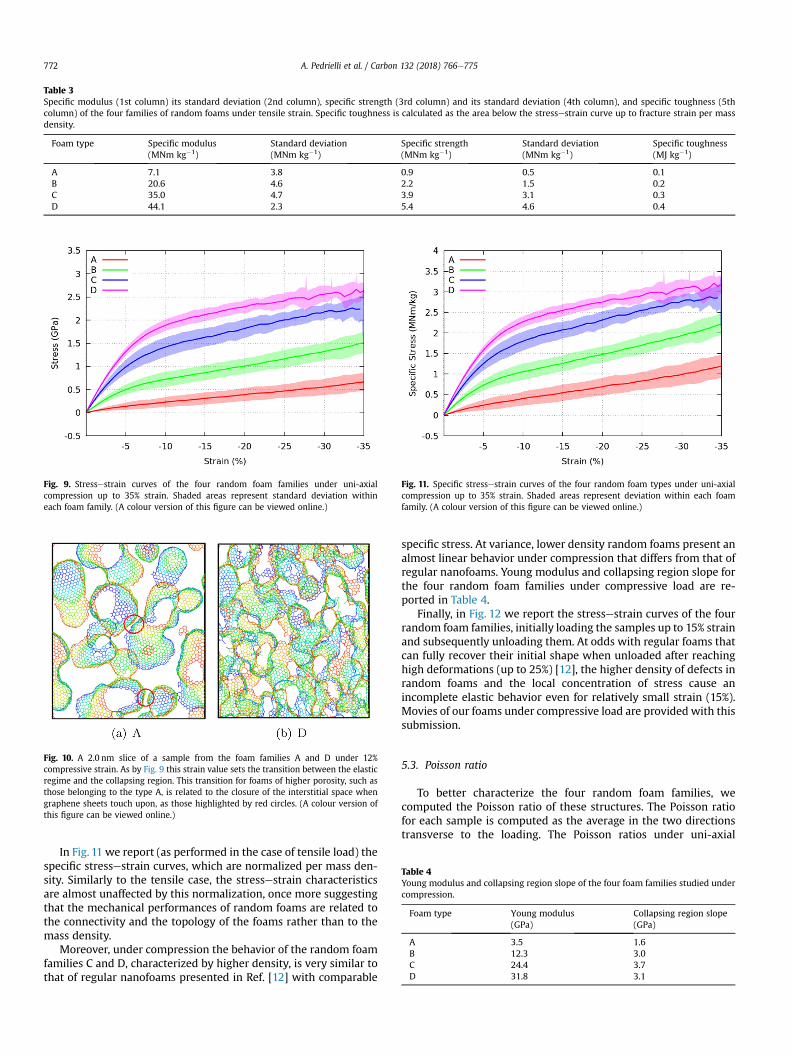
Table 3Specific modulus (1st column) its standard deviation (2nd column), specific strength (3rd column) and its standard deviation (4th column), and specific toughness (5thcolumn) of the four families of random foams under tensile strain. Specific toughness is calculated as the area below the stressestrain curve up to fracture strain per massdensity.
Foam type Specific modulus(MNm kg�1)
Standard deviation(MNm kg�1)
Specific strength(MNm kg�1)
Standard deviation(MNm kg�1)
Specific toughness(MJ kg�1)
A 7.1 3.8 0.9 0.5 0.1B 20.6 4.6 2.2 1.5 0.2C 35.0 4.7 3.9 3.1 0.3D 44.1 2.3 5.4 4.6 0.4
Fig. 9. Stressestrain curves of the four random foam families under uni-axialcompression up to 35% strain. Shaded areas represent standard deviation withineach foam family. (A colour version of this figure can be viewed online.)
Fig. 10. A 2.0 nm slice of a sample from the foam families A and D under 12%compressive strain. As by Fig. 9 this strain value sets the transition between the elasticregime and the collapsing region. This transition for foams of higher porosity, such asthose belonging to the type A, is related to the closure of the interstitial space whengraphene sheets touch upon, as those highlighted by red circles. (A colour version ofthis figure can be viewed online.)
Fig. 11. Specific stressestrain curves of the four random foam types under uni-axialcompression up to 35% strain. Shaded areas represent deviation within each foamfamily. (A colour version of this figure can be viewed online.)
Table 4Young modulus and collapsing region slope of the four foam families studied undercompression.
Foam type Young modulus(GPa)
Collapsing region slope(GPa)
A 3.5 1.6B 12.3 3.0C 24.4 3.7D 31.8 3.1
A. Pedrielli et al. / Carbon 132 (2018) 766e775772
In Fig. 11 we report (as performed in the case of tensile load) thespecific stressestrain curves, which are normalized per mass den-sity. Similarly to the tensile case, the stressestrain characteristicsare almost unaffected by this normalization, once more suggestingthat the mechanical performances of random foams are related tothe connectivity and the topology of the foams rather than to themass density.
Moreover, under compression the behavior of the random foamfamilies C and D, characterized by higher density, is very similar tothat of regular nanofoams presented in Ref. [12] with comparable
specific stress. At variance, lower density random foams present analmost linear behavior under compression that differs from that ofregular nanofoams. Young modulus and collapsing region slope forthe four random foam families under compressive load are re-ported in Table 4.
Finally, in Fig. 12 we report the stressestrain curves of the fourrandom foam families, initially loading the samples up to 15% strainand subsequently unloading them. At odds with regular foams thatcan fully recover their initial shape when unloaded after reachinghigh deformations (up to 25%) [12], the higher density of defects inrandom foams and the local concentration of stress cause anincomplete elastic behavior even for relatively small strain (15%).Movies of our foams under compressive load are provided with thissubmission.
5.3. Poisson ratio
To better characterize the four random foam families, wecomputed the Poisson ratio of these structures. The Poisson ratiofor each sample is computed as the average in the two directionstransverse to the loading. The Poisson ratios under uni-axial
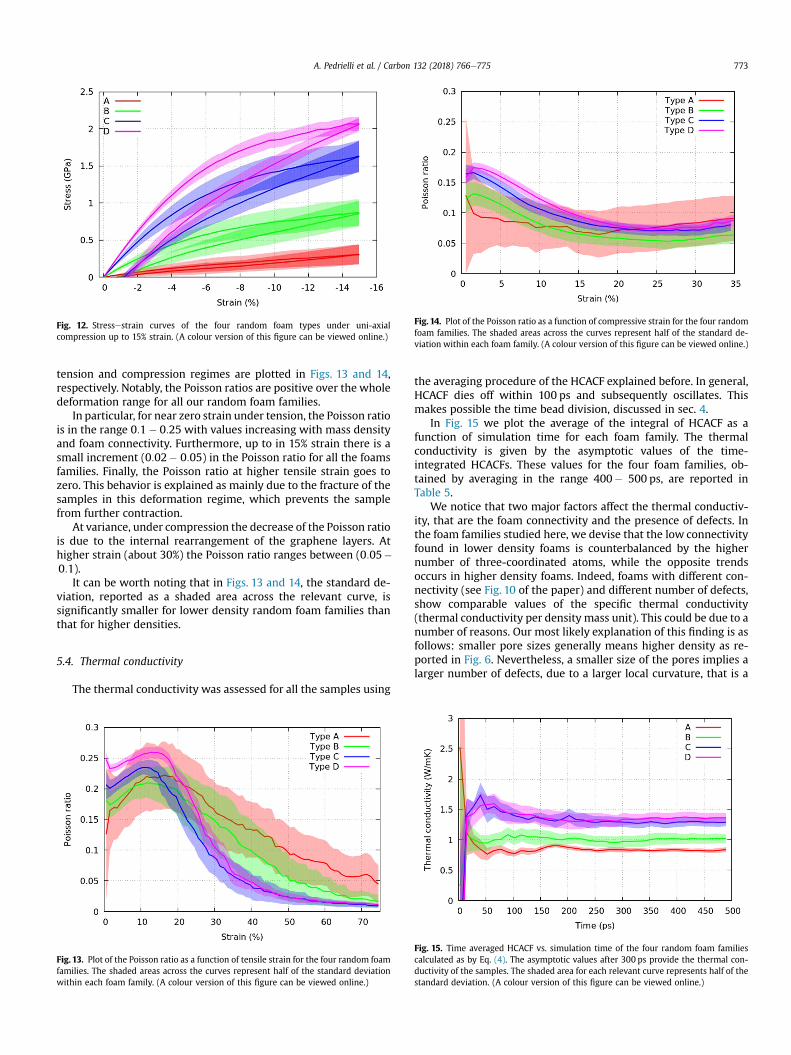
Fig. 12. Stressestrain curves of the four random foam types under uni-axialcompression up to 15% strain. (A colour version of this figure can be viewed online.)
Fig. 14. Plot of the Poisson ratio as a function of compressive strain for the four randomfoam families. The shaded areas across the curves represent half of the standard de-viation within each foam family. (A colour version of this figure can be viewed online.)
A. Pedrielli et al. / Carbon 132 (2018) 766e775 773
tension and compression regimes are plotted in Figs. 13 and 14,respectively. Notably, the Poisson ratios are positive over the wholedeformation range for all our random foam families.
In particular, for near zero strain under tension, the Poisson ratiois in the range 0:1� 0:25 with values increasing with mass densityand foam connectivity. Furthermore, up to in 15% strain there is asmall increment (0:02� 0:05) in the Poisson ratio for all the foamsfamilies. Finally, the Poisson ratio at higher tensile strain goes tozero. This behavior is explained as mainly due to the fracture of thesamples in this deformation regime, which prevents the samplefrom further contraction.
At variance, under compression the decrease of the Poisson ratiois due to the internal rearrangement of the graphene layers. Athigher strain (about 30%) the Poisson ratio ranges between (0:05�0:1).
It can be worth noting that in Figs. 13 and 14, the standard de-viation, reported as a shaded area across the relevant curve, issignificantly smaller for lower density random foam families thanthat for higher densities.
5.4. Thermal conductivity
The thermal conductivity was assessed for all the samples using
Fig. 13. Plot of the Poisson ratio as a function of tensile strain for the four random foamfamilies. The shaded areas across the curves represent half of the standard deviationwithin each foam family. (A colour version of this figure can be viewed online.)
the averaging procedure of the HCACF explained before. In general,HCACF dies off within 100 ps and subsequently oscillates. Thismakes possible the time bead division, discussed in sec. 4.
In Fig. 15 we plot the average of the integral of HCACF as afunction of simulation time for each foam family. The thermalconductivity is given by the asymptotic values of the time-integrated HCACFs. These values for the four foam families, ob-tained by averaging in the range 400� 500 ps, are reported inTable 5.
We notice that two major factors affect the thermal conductiv-ity, that are the foam connectivity and the presence of defects. Inthe foam families studied here, we devise that the low connectivityfound in lower density foams is counterbalanced by the highernumber of three-coordinated atoms, while the opposite trendsoccurs in higher density foams. Indeed, foams with different con-nectivity (see Fig. 10 of the paper) and different number of defects,show comparable values of the specific thermal conductivity(thermal conductivity per density mass unit). This could be due to anumber of reasons. Our most likely explanation of this finding is asfollows: smaller pore sizes generally means higher density as re-ported in Fig. 6. Nevertheless, a smaller size of the pores implies alarger number of defects, due to a larger local curvature, that is a
Fig. 15. Time averaged HCACF vs. simulation time of the four random foam familiescalculated as by Eq. (4). The asymptotic values after 300 ps provide the thermal con-ductivity of the samples. The shaded area for each relevant curve represents half of thestandard deviation. (A colour version of this figure can be viewed online.)
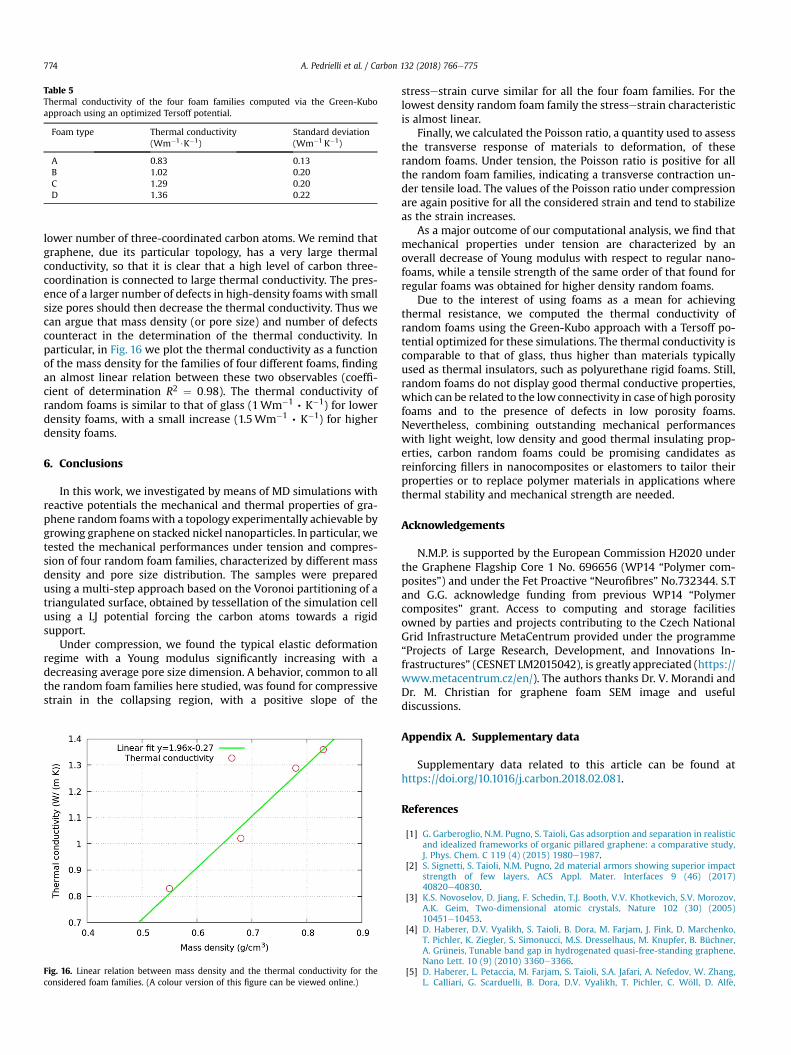
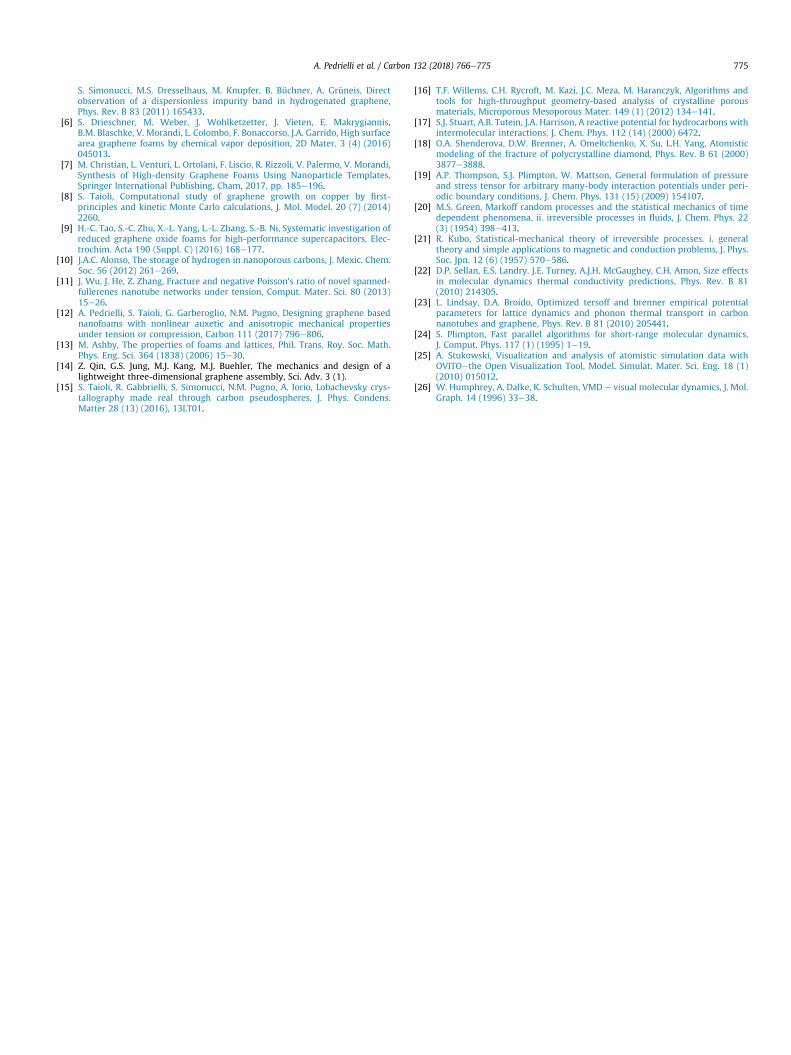
Table 5Thermal conductivity of the four foam families computed via the Green-Kuboapproach using an optimized Tersoff potential.
Foam type Thermal conductivity(Wm�1$K�1)
Standard deviation(Wm�1 K�1)
A 0.83 0.13B 1.02 0.20C 1.29 0.20D 1.36 0.22
A. Pedrielli et al. / Carbon 132 (2018) 766e775774
lower number of three-coordinated carbon atoms. We remind thatgraphene, due its particular topology, has a very large thermalconductivity, so that it is clear that a high level of carbon three-coordination is connected to large thermal conductivity. The pres-ence of a larger number of defects in high-density foams with smallsize pores should then decrease the thermal conductivity. Thus wecan argue that mass density (or pore size) and number of defectscounteract in the determination of the thermal conductivity. Inparticular, in Fig. 16 we plot the thermal conductivity as a functionof the mass density for the families of four different foams, findingan almost linear relation between these two observables (coeffi-cient of determination R2 ¼ 0:98). The thermal conductivity ofrandom foams is similar to that of glass (1Wm�1 , K�1) for lowerdensity foams, with a small increase (1.5Wm�1 , K�1) for higherdensity foams.
6. Conclusions
In this work, we investigated by means of MD simulations withreactive potentials the mechanical and thermal properties of gra-phene random foamswith a topology experimentally achievable bygrowing graphene on stacked nickel nanoparticles. In particular, wetested the mechanical performances under tension and compres-sion of four random foam families, characterized by different massdensity and pore size distribution. The samples were preparedusing a multi-step approach based on the Voronoi partitioning of atriangulated surface, obtained by tessellation of the simulation cellusing a LJ potential forcing the carbon atoms towards a rigidsupport.
Under compression, we found the typical elastic deformationregime with a Young modulus significantly increasing with adecreasing average pore size dimension. A behavior, common to allthe random foam families here studied, was found for compressivestrain in the collapsing region, with a positive slope of the
Fig. 16. Linear relation between mass density and the thermal conductivity for theconsidered foam families. (A colour version of this figure can be viewed online.)
stressestrain curve similar for all the four foam families. For thelowest density random foam family the stressestrain characteristicis almost linear.
Finally, we calculated the Poisson ratio, a quantity used to assessthe transverse response of materials to deformation, of theserandom foams. Under tension, the Poisson ratio is positive for allthe random foam families, indicating a transverse contraction un-der tensile load. The values of the Poisson ratio under compressionare again positive for all the considered strain and tend to stabilizeas the strain increases.
As a major outcome of our computational analysis, we find thatmechanical properties under tension are characterized by anoverall decrease of Young modulus with respect to regular nano-foams, while a tensile strength of the same order of that found forregular foams was obtained for higher density random foams.
Due to the interest of using foams as a mean for achievingthermal resistance, we computed the thermal conductivity ofrandom foams using the Green-Kubo approach with a Tersoff po-tential optimized for these simulations. The thermal conductivity iscomparable to that of glass, thus higher than materials typicallyused as thermal insulators, such as polyurethane rigid foams. Still,random foams do not display good thermal conductive properties,which can be related to the low connectivity in case of high porosityfoams and to the presence of defects in low porosity foams.Nevertheless, combining outstanding mechanical performanceswith light weight, low density and good thermal insulating prop-erties, carbon random foams could be promising candidates asreinforcing fillers in nanocomposites or elastomers to tailor theirproperties or to replace polymer materials in applications wherethermal stability and mechanical strength are needed.
Acknowledgements
N.M.P. is supported by the European Commission H2020 underthe Graphene Flagship Core 1 No. 696656 (WP14 “Polymer com-posites”) and under the Fet Proactive “Neurofibres” No.732344. S.Tand G.G. acknowledge funding from previous WP14 “Polymercomposites” grant. Access to computing and storage facilitiesowned by parties and projects contributing to the Czech NationalGrid Infrastructure MetaCentrum provided under the programme“Projects of Large Research, Development, and Innovations In-frastructures” (CESNET LM2015042), is greatly appreciated (https://www.metacentrum.cz/en/). The authors thanks Dr. V. Morandi andDr. M. Christian for graphene foam SEM image and usefuldiscussions.
Appendix A. Supplementary data
Supplementary data related to this article can be found athttps://doi.org/10.1016/j.carbon.2018.02.081.
References
[1] G. Garberoglio, N.M. Pugno, S. Taioli, Gas adsorption and separation in realisticand idealized frameworks of organic pillared graphene: a comparative study,J. Phys. Chem. C 119 (4) (2015) 1980e1987.
[2] S. Signetti, S. Taioli, N.M. Pugno, 2d material armors showing superior impactstrength of few layers, ACS Appl. Mater. Interfaces 9 (46) (2017)40820e40830.
[3] K.S. Novoselov, D. Jiang, F. Schedin, T.J. Booth, V.V. Khotkevich, S.V. Morozov,A.K. Geim, Two-dimensional atomic crystals, Nature 102 (30) (2005)10451e10453.
[4] D. Haberer, D.V. Vyalikh, S. Taioli, B. Dora, M. Farjam, J. Fink, D. Marchenko,T. Pichler, K. Ziegler, S. Simonucci, M.S. Dresselhaus, M. Knupfer, B. Büchner,A. Grüneis, Tunable band gap in hydrogenated quasi-free-standing graphene,Nano Lett. 10 (9) (2010) 3360e3366.
[5] D. Haberer, L. Petaccia, M. Farjam, S. Taioli, S.A. Jafari, A. Nefedov, W. Zhang,L. Calliari, G. Scarduelli, B. Dora, D.V. Vyalikh, T. Pichler, C. W€oll, D. Alf�e,
A. Pedrielli et al. / Carbon 132 (2018) 766e775 775
S. Simonucci, M.S. Dresselhaus, M. Knupfer, B. Büchner, A. Grüneis, Directobservation of a dispersionless impurity band in hydrogenated graphene,Phys. Rev. B 83 (2011) 165433.
[6] S. Drieschner, M. Weber, J. Wohlketzetter, J. Vieten, E. Makrygiannis,B.M. Blaschke, V. Morandi, L. Colombo, F. Bonaccorso, J.A. Garrido, High surfacearea graphene foams by chemical vapor deposition, 2D Mater. 3 (4) (2016)045013.
[7] M. Christian, L. Venturi, L. Ortolani, F. Liscio, R. Rizzoli, V. Palermo, V. Morandi,Synthesis of High-density Graphene Foams Using Nanoparticle Templates,Springer International Publishing, Cham, 2017, pp. 185e196.
[8] S. Taioli, Computational study of graphene growth on copper by first-principles and kinetic Monte Carlo calculations, J. Mol. Model. 20 (7) (2014)2260.
[9] H.-C. Tao, S.-C. Zhu, X.-L. Yang, L.-L. Zhang, S.-B. Ni, Systematic investigation ofreduced graphene oxide foams for high-performance supercapacitors, Elec-trochim. Acta 190 (Suppl. C) (2016) 168e177.
[10] J.A.C. Alonso, The storage of hydrogen in nanoporous carbons, J. Mexic. Chem.Soc. 56 (2012) 261e269.
[11] J. Wu, J. He, Z. Zhang, Fracture and negative Poisson's ratio of novel spanned-fullerenes nanotube networks under tension, Comput. Mater. Sci. 80 (2013)15e26.
[12] A. Pedrielli, S. Taioli, G. Garberoglio, N.M. Pugno, Designing graphene basednanofoams with nonlinear auxetic and anisotropic mechanical propertiesunder tension or compression, Carbon 111 (2017) 796e806.
[13] M. Ashby, The properties of foams and lattices, Phil. Trans. Roy. Soc. Math.Phys. Eng. Sci. 364 (1838) (2006) 15e30.
[14] Z. Qin, G.S. Jung, M.J. Kang, M.J. Buehler, The mechanics and design of alightweight three-dimensional graphene assembly, Sci. Adv. 3 (1).
[15] S. Taioli, R. Gabbrielli, S. Simonucci, N.M. Pugno, A. Iorio, Lobachevsky crys-tallography made real through carbon pseudospheres, J. Phys. Condens.Matter 28 (13) (2016), 13LT01.
[16] T.F. Willems, C.H. Rycroft, M. Kazi, J.C. Meza, M. Haranczyk, Algorithms andtools for high-throughput geometry-based analysis of crystalline porousmaterials, Microporous Mesoporous Mater. 149 (1) (2012) 134e141.
[17] S.J. Stuart, A.B. Tutein, J.A. Harrison, A reactive potential for hydrocarbons withintermolecular interactions, J. Chem. Phys. 112 (14) (2000) 6472.
[18] O.A. Shenderova, D.W. Brenner, A. Omeltchenko, X. Su, L.H. Yang, Atomisticmodeling of the fracture of polycrystalline diamond, Phys. Rev. B 61 (2000)3877e3888.
[19] A.P. Thompson, S.J. Plimpton, W. Mattson, General formulation of pressureand stress tensor for arbitrary many-body interaction potentials under peri-odic boundary conditions, J. Chem. Phys. 131 (15) (2009) 154107.
[20] M.S. Green, Markoff random processes and the statistical mechanics of timedependent phenomena. ii. irreversible processes in fluids, J. Chem. Phys. 22(3) (1954) 398e413.
[21] R. Kubo, Statistical-mechanical theory of irreversible processes. i. generaltheory and simple applications to magnetic and conduction problems, J. Phys.Soc. Jpn. 12 (6) (1957) 570e586.
[22] D.P. Sellan, E.S. Landry, J.E. Turney, A.J.H. McGaughey, C.H. Amon, Size effectsin molecular dynamics thermal conductivity predictions, Phys. Rev. B 81(2010) 214305.
[23] L. Lindsay, D.A. Broido, Optimized tersoff and brenner empirical potentialparameters for lattice dynamics and phonon thermal transport in carbonnanotubes and graphene, Phys. Rev. B 81 (2010) 205441.
[24] S. Plimpton, Fast parallel algorithms for short-range molecular dynamics,J. Comput. Phys. 117 (1) (1995) 1e19.
[25] A. Stukowski, Visualization and analysis of atomistic simulation data withOVITOethe Open Visualization Tool, Model. Simulat. Mater. Sci. Eng. 18 (1)(2010) 015012.
[26] W. Humphrey, A. Dalke, K. Schulten, VMD e visual molecular dynamics, J. Mol.Graph. 14 (1996) 33e38.