measuringvolcanicplumeandashproperties fromspace · measuringvolcanicplumeandashproperties...
TRANSCRIPT
Measuring Volcanic Plume and Ash Properties
from Space
R.G. Grainger*1, D.M. Peters1, G.E. Thomas1, A.J.A. Smith1,R. Siddans2, E. Carboni1, and A. Dudhia1
1Sub-Department of Atmospheric, Oceanic and PlanetaryPhysics, University of Oxford, Parks Road, Oxford, OX1 3PU,
England2Science and Technology Facilities Council Rutherford
Appleton Laboratory, Harwell Science and Innovation Campus,Didcot, OX11 0QX, England
*Corresponding author(email:[email protected])
Number of Words:10,416Abbreviated Title: Volcanic Plume and Ash Properties
1
Abstract: The remote sensing of volcanic ash plumes from space can pro-vide a warning of an aviation hazard and knowledge on eruption processesand radiative effects. In this paper new algorithms are presented to providevolcanic plume properties from measurements by the Michelson Interferom-eter for Passive Atmospheric Sounding (MIPAS), the Advanced Along TrackScanning Radiometer (AATSR) and Spinning Enhanced Visible and InfraredImager (SEVIRI). A challenge of remote sensing is to provide near real-timemethods to identify, and so warn, of the presence of volcanic ash. To achievethis, a singular vector decomposition method has been developed for theMIPAS instrument on board the Environmental Satellite (ENVISAT). Thismethod has been applied to observations of the ash clouds from the erup-tions of Nabro and the Puyehue-Cordon Caulle in 2011 and lead to a moresensitive volcanic signal flag which was capable of tracking changes in thevolcanic signal spectra as the plume evolved. A second challenge for remotesensing is to identify the ash plume height. This is a critical parameterfor the initialisation of algorithms that numerically model the evolution andtransport of a volcanic plume. As MIPAS is a limb sounder the identificationof ash also provides an estimate of height provided the plume is above about6 km. This is complemented by a new algorithm, Stereo Ash Plume HeightRetrieval Algorithm (SAPHRA), that identifies plume height using the par-allax between images provided by Along Track Scanning Radiometer typeinstruments. The algorithm was tested on an image taken at 14:01 GMTon 6 June 2011 of the Puyehue-Cordon Caulle eruption plume and gives aheight of 11.9 ± 1.4 km which agreed with the value derived from the loca-tion of the plume shadow (12.7 ± 1.8 km). This plume height was similarto the height observed by MIPAS (12 ± 1.5 km) at 02:56 GMT on 6 June.The quantitative use of satellite imagery and the full exploitation of highresolution spectral measurements of ash depends upon knowing the opticalproperties of the observed ash. Laboratory measurements of ash from the1993 eruption of Mt Aso, Japan have been used to determine the refractiveindices from 1 to 20 µm. These preliminary measurements have spectral fea-tures similar to ash values that have been used to date, albeit with slightlydifferent positions and strengths of the absorption bands. The refractive in-dices have been used to retrieve ash properties (plume height, optical depthand ash effective radius) from AATSR and SEVIRI instruments using twoversions of Oxford-RAL Retrieval of Aerosol and Cloud (ORAC) algorithm.For AATSR a new ash cloud type was used in ORAC for the analysis of theplume from the 2011 Eyjafjallajokull eruption. For the first ∼ 500 km of theplume ORAC gave values of plume height 2.5-6.5 km, optical depth 1-2.5and effective radius 3-7 µm which are in agreement with other observations.A weakness of the algorithm occurs when underlying cloud invalidates the
2

assumption of a single cloud layer. This is rectified in a modified version ofORAC applied to SEVIRI measurements. In this case an extra model of acloud underlying the ash plume was included in the range of applied models.In cases where the plume overlay cloud this new model worked well show-ing good agreement with correlative Cloud-Aerosol Lidar with OrthogonalPolarization (CALIOP) observations.
3
Volcanic plumes formed by explosive eruptions are mixtures of gas, quenchedand fragmented silicate material (tephra) and other aerosol particles derivedfrom both the magmatic emissions and background air (e.g. Mather et al.;2003; Durant et al.; 2010; Ilyinskaya et al.; 2010; Oppenheimer et al.; 2010).The particles created during a volcanic event are classified according to sizewith the smaller solid particles (radii < 2 mm) referred to as volcanic ash(Schmid; 1981). The effects of airborne ash include:
Aviation: Volcanic ash is a hazard to aviation (Casadevall; 1994). Be-fore March 2010 the Civil Aviation Authority did not permit civil aircraftto fly in the presence of volcanic ash. Following the 2010 Eyjafjallajokulleruption this zero-tolerance approach was changed to permit flights withinash concentrations less than 2× 10⁻³ g cm−3 (CAA; 2010).
Climate: Injection of volcanic ash into the stratosphere and troposphereinfluences the Earth’s radiation balance by interacting with both solar andthermal radiation as a function of the ash’s optical properties (Solomon et al.;2007). In the troposphere volcanic aerosols indirectly modify climate by act-ing as cloud condensation nuclei. This happens over the range of volcanicactivity from quiescent degassing (Yuan et al.; 2011) to large volcanic erup-tion plumes.
Human Health: High levels of respirable ash (particle radius < 5 µm) inthe air are not yet known to result in serious injury or disease from inhala-tion (Horwell and Baxter; 2006). However acute respiratory symptoms arecommonly reported by people during and after ash falls (Blong; 1984).
Heavy ash fall may result in the collapse of roofs under the weight of ashand this can be deadly for people within buildings. The deposition of volcanicash can increase trace metal (iron) concentrations in the local environment,especially following explosive eruptions (Martin et al.; 2009). If depositionoccurs in the ocean, this can increase the productivity of phytoplankton inareas with limited nutrients (Jones and Gislason; 2008; Gabrielli et al.; 2008).
Changes in style of activity are common during eruptions, with explosiveeruptions being particularly favoured by high (magmatic) gas content, andhigh melt viscosity (andesitic to rhyolitic magmas), or by the presence ofexternal water (e.g. Sheridan and Wohletz; 1983; Scandone et al.; 2007).Component and morphological analyses of the erupted ash, and comparisonof these data with those from other monitoring techniques, demonstrates aclear relationship between ash features and styles of explosive activity (e.g.Heiken and Wohletz; 1985; Martin et al.; 2008; Rust and Cashman; 2011;Taddeucci et al.; 2004).
Remotely sensed ash properties have the potential
• to warn of an aviation hazard,
4

• to act as the basis of a quantitative estimate of
– ash fall out,
– volcanic perturbation of the radiative field,
– climate perturbations
• to investigate the interactions between ash and the biosphere (e.g.cloud seeding, ocean fertilization),
• to quantify volcanic process involved with ash generation and plumeevolution.
Volcanic Cloud Properties
The characterization of a volcanic cloud can be broken into two scales:
• plume macrophysical properties, principally plume morphology whichis usually simply described by plume altitude and thickness,
• plume microphysical properties which characterise the ash propertiesthrough quantities such as ash shape, size and composition.
Plume Height
For Plinian eruptions plume height is determined by the rate and intensity ofthe magma discharge, the density of erupted material and the temperaturedifference of the plume with the surrounding air (Sparks; 1986). The eruptioncolumn typically overshoots the height of neutral buoyancy and relaxes backto form a layer of material whose thickness is typically a few kilometres fora tropospheric eruption. Sparks et al. (1986) observed that cloud thicknessis driven by the size of this overshoot; the ratio of umbrella cloud thick-ness to the maximum height of momentum driven ascent is typically 0.25- 0.3. While atmospheric diffusion and sedimentation will tend to thickenthe plume over time, the variation of wind with height can shear the plumeinto thin layers. For example lidar observations of plumes from the 2010Eyjafjallajokull eruption gave layer thicknesses less than 1 km (Sicard et al.;2011). Although models can calculate the dispersion of ash (Witham et al.;2007) their accuracy depends critically on source parameters, in particularthe eruption column height (Stohl et al.; 2011).
5
Ash Particle Size & Shape
Figure 1 shows an SEM image of volcanic ash collected from the 1993 eruptionof Mt Aso, Japan. The ash particles cover a wide ranges of sizes and displayshapes from the near spherical to highly complex angular shapes. In general,volcanic ash particle size distributions tend to be multimodal with the size,shape and composition being a function of the processes of formation. Themajority of particles range from nanometres to millimetres in size (Heikenand Wohletz; 1985). The volcanic ash particles within a plume can include:
• volcanic glass formed from fragments of the molten part of magma thatcooled and solidified during eruption,
• minerals or crystals that grow within the magma while it is below theearth’s surface,
• rock fragments from the walls of the magma conduit,
• particles formed from the condensation of volcanic gases.
Hence the composition, grain-size and morphology of volcanic ash particlescontains important information about the processes of magma ascent andfragmentation in volcanic eruptions (e.g. Heiken and Wohletz; 1985; Rustand Cashman; 2011). Further process alter the particle properties such as
• adsorption of species into the particle surface,
• fragmentation by the explosive expansion of volcanic gases,
• coagulation of particles,
• condensation of gases (e.g. water or sulphuric acid) to coat the particle,
• sedimentation.
The size and shape of ash particles is also critical in influencing the trans-port of ash through the atmosphere. In the absence of coagulation and ver-tical winds the process that determines the maximum life-time of a particleis sedimentation. Figure 2 shows the calculated fallout time for sphericalparticles as a function of particle size and initial height. It is suggested thatthe non-sphericity of ash particles further slows their fallout (Riley et al.;2003). Given this caveat it is apparent that particles whose radii are greaterthan about 15 µm are removed from the plume within the first day followingthe eruption. Very fine ash (radii less than ∼ 1 µm) is predicted to exist inthe atmosphere for over a year but this is contradicted by observations thatsuggest very fine ash falls out faster than fluid dynamics predicts (Rose andDurant; 2009). Further work is required to understand this anomaly.
6

Preliminary Measurements of Ash Optical Prop-
erties
An irony of remote sensing is that often properties of the target need to beknown to make full use of the remote measurement. In the case of gaseousspecies this is the molecular spectroscopy of the target gas. For aerosol orcloud, a priori information is needed on the complex refractive index, andto a lesser extent on the size and shape of the particles. For volcanic ash,a difficulty is that these assumed properties are likely to change during aneruption. The fewer a priori assumptions that are made about the target thelower is the chance of making spurious deductions caused by variations in aquantity assumed constant.
Existing measurements of volcanic ash refractive indices, as listed in Ta-ble 1, are extremely limited. There are a few more published refractive indicesof volcanic material (e.g. basalt, Pollack et al.; 1973; Egan et al.; 1975; an-desite Pollack et al.; 1973; Egan et al.; 1975; pumice, Volz; 1973; obsidian,Pollack et al.; 1973; granite, Toon et al.; 1977), these should in principle showsimilar spectral signatures to the ash. In order to exploit new instrumentssuch as high resolution spectrometers, reference refractive indices are neededfor a range of ashes and their mineral and rock components.
Transmission Measurements
Reported here are preliminary refractive indices derived from transmissionspectra of resuspended volcanic ash. Figure 3 outlines the basic configurationof the experiments undertaken. A sample of ash from the 1993 eruption ofMt Aso was collected from a bomb shelter where 1 to 2 m of ash had accumu-lated. Data on the composition of the ash will be addressed in future studies.For context, the composition of the 1989 Aso eruption scoria is reported byOno et al. (1995) as SiO2=54.71 wt%, Na2O=3.01 wt%, K2O=2.00 wt%.The ash sample was sieved to < 22.5 µm and this fraction was resuspendedand introduced into an aerosol test cell. The aerosol cell has optical windowsfitted, allowing the aerosol absorption to be measured via a Fourier Trans-form Spectrometer, FTS. The aerosol size distribution was determined usingtechniques insensitive to particle refractive index and the aerosol vented intoa fume cupboard.
All of the measurements were undertaken at the Molecular SpectroscopyFacility at the Rutherford Appleton Laboratory. The aerosol cell used hadan optical path length of 26 cm. Spectral intensity measurements were madeusing a Bruker IFS-66 FTS. Measurements of the detected spectrum were ob-
7
tained with and without the aerosol to calculate the transmission spectrum,T (λ). A correction was made to the transmission spectrum to remove waterand carbon-dioxide gas absorption lines; this was achieved via a separateretrieval of these gas species’ concentrations.
Data Analysis and Results
The refractive indices were determined from the transmission spectrum. Aerosolcell transmission relates to the physical properties of the aerosol via Bouguer’sLaw
T (λ) = e−βext(λ)x, (1)
where T (λ) is the transmission, βext the volume extinction coefficient atwavelength λ, and x the path length though the test cell. Assuming a par-ticle scattering model (Mie theory or T-matrix to deal with non-sphericalparticles) and knowing the particle size distribution allows the extinctioncoefficient to be calculated from
βext =∫
∞
0Qext(r,m(λ), λ)πr2n(r) dr, (2)
where Qext is the extinction efficiency, r is the particle radius, m the complexrefractive index and n(r)dr is the number of particles with radii between r
and r + dr.The complex refractive index wavelength dependence m(λ) is represented
by a damped harmonic oscillator model to reduce the number of model pa-rameters to less than the number of measured spectral points. Optimalestimation is then used to derive the band model parameters (and hence re-fractive index) and aerosol size distribution. The method has been describedin detail by Thomas et al. (2005).
The derived refractive index of Aso ash is shown in Figure 4. The re-fractive index is dominated by a broad absorption band situated at about9.5 µm which can be associated with the stretching vibration of Si-O. Themuch weaker and narrower band at about 3 µm is probably from O-H stretch.These are preliminary results, data at wavelengths shorter than 1 µm (notplotted) are a forward model extrapolation and should be used with caution.
Identifying Volcanic Ash
A volcanic plume perturbs the Earth’s radiation field by scattering and ab-sorbing radiation and by emitting radiation in the infrared. In the shortwavethe particle size and refractive index means a volcanic plume resembles cloud
8

from which it may only be distinguishable by the cloud’s morphology. The in-frared (IR) transmission or emission spectra of volcanic plumes show a rapidvariation with wavelength due to absorption lines from atmospheric and vol-canic gases, as well as broad-scale features principally due to particulateabsorption or emission. While the gas lines have provided important insightsinto volcanic processes (Burton et al.; 2001, 2003; Oppenheimer et al.; 2006;Edmonds et al.; 2003; Sawyer et al.; 2008) the ash features have not beenanalysed to the same extent. In the infrared, ash is detectable by its distinc-tive emission spectra. This is shown in Figure 5 where the similar amountsof material of the same size are shown to have distinct emission spectra.The spectra are presented in terms of optical depth τ defined for a plume ofthickness L as
τ =∫ L
0βext dz, (3)
while the ash size distribution is characterised by the effective radius re de-fined by
re =
∞∫
0r3 n(r)dr
∞∫
0r2 n(r)dr
. (4)
Volcanic aerosol is assumed to conform to a log-normal distribution describedby
n(r) =N0√2π
1
ln(S)
1
rexp
[
−(ln r − ln rm)
2
2 ln2(S)
]
, (5)
where N0 is the total particle number density, rm is the median of the sizedistribution and S is a parameter than controls the spread of the size distri-bution. For a log-normal distribution rm and re are related by
re = rm exp(5
2ln2 S
)
.
Figure 5 shows that between about 10 and 12 µm the optical thickness ofash and sulphuric acid decreases whereas water or ice increases. Measurementchannels centred near 11 and 12 µm are common on meteorological imaginginstruments and have been widely exploited to study volcanic ash clouds.Examples are listed in Table 2. These instruments generally report brightnesstemperatures T11, T12 at these two wavelengths rather than a radiance. Themagnitude of the brightness temperature difference has been shown to be afunction of the ash size (Prata; 1989a; Wen and Rose; 1994).
While a powerful and useful tool, there are cases where the technique isnot robust (Prata et al.; 2001). They include:
9
1. Strong temperature inversions near the surface, which can result in anegative T11 - T12 in clear sky conditions.
2. Dry soil, e.g. deserts or wind blown dust, is also often characterised bya negative T11 - T12, for the same reasons as volcanic ash.
3. Cloud tops which overshoot the tropopause can also show a negativeT11 - T12 due to the inversion of the temperature gradient in the strato-sphere.
4. Very thick volcanic ash, ash mixed with ice (quite a common occur-rence, since volcanoes generally emit large quantities of water vapour),or ash which lies below an airmass with a high water vapour content.
5. Instrument noise or collocation errors between the 11 and 12 µm chan-nels.
Use of a 3.7 µm channel and information from shortwave channels can alle-viate this problem (Ellrod et al.; 2003) as their dependence on the propertiesof volcanic ash differ from the 8− 12 µm region.
The ash signature depends on the composition and size distribution ofash particles. Figure 6 shows an example of different optical depths com-puted using the same size-distribution (with an effective radius of 2 µm) anddifferent refractive indices. The published infrared spectral refractive indicesof volcano-related ash and rock show a large variability, presumably becauseof changes in the ash composition. This is reflected in the variability of in-frared spectra measured from satellites for different volcanoes and eruptions(Clarisse et al.; 2010; Gangale et al.; 2010).
Other Volcanic Products
In addition to ash volcanic eruption can release large quantities of gas, theprinciple being H2O, CO2, CO, SO2, H2S, HCl. Of these SO2 has beenobserved from space (e.g. Read et al.; 1993; Walker et al.; 2012) and itsevolution tracked remotely. While there are several observations of ash andSO2 being collocated this is not always true. The most famous example beingthe El Chichon 1982 eruption when the ash and SO2 cloud were observed tobe spatially separated (Seftor et al.; 1997). Other examples include Hekla2000 eruption (Rose et al.; 2003) and the Eyjafjallajokull eruption of 2010(Thomas and Prata; 2011). The reason being that the SO2 and ash haddifferent altitudes of neutral buoyancy within the eruption column and asa result were separated by wind shear. Hence while SO2 may indicate thepresence of ash it should not be used as a proxy for ash.
10
Remote Sensing of Volcanic Plume and Ash
Properties
There are three distinct time regimes for remote sensing of volcanic ash.
• The identification of volcanic ash for hazard avoidance. In this case afast (real time) algorithm is needed that recognises ash with a low (lessthan once per year) false detection rate.
• The characterisation of volcanic plume properties (e.g. altitude, eruptedmass) in near real time for
– plume model initialisation and validation
– and to help quantify the immediate impact of ash on the biosphere.
• A full and detailed characterisation of volcanic ash properties to helpunderstand volcanic processes (both in the plume and potentially withinthe volcano itself).
Over twenty different satellite instruments have been used to measure vol-canogenic gases and/or particles. Earlier work is well summarised in Oppen-heimer (1998) and Francis and Rothery (2000) while Thomas and Watson(2010) provide information on more recent missions. Here we concentrate onthree instruments which have been relatively underexploited for volcanolog-ical studies.
MIPAS
The Michelson Interferometer for Passive Atmospheric Sounding (MIPAS) isa limb viewing Fourier transform spectrometer measuring from 685 cm−1 to2410 cm−1 at a spectral resolution of 0.025 cm−1. MIPAS was launched inMarch 2002 on the European Space Agency’s Environmental Satellite (EN-VISAT). The ENVISAT spacecraft is in an 800 km sun-synchronous polarorbit with a nominal repeat period of 35 days. In March 2004, MIPAS be-gan experiencing irregular motion of the scanning mirrors. To rectify thisproblem, the path length over which the mirrors moved was decreased, re-ducing the resolution of the spectra to 0.0625 cm−1. The reduced resolutionnominal scan pattern consists of 27 observations of the Earth’s limb with1.5 km spacing in the lower atmosphere. A complete scanning profile, then,takes about 65 s, resulting in over 1000 scans taken daily. There is nominally330 km horizontally between the first (highest) and last (lowest) sweeps in
11

a scan with along-track horizontal spacing between scans of 410 km. Thefield-of-view is about 3 km vertically and 30 km horizontally.
Although MIPAS has been used extensively to determine atmospherictrace gas properties (e.g. Burgess et al.; 2006; Payne et al.; 2007) and toobserve clouds (e.g. Spang et al.; 2005; Hurley et al.; 2011), to date therehave been no reports of MIPAS observations of volcanic ash.
Recognition of volcanic ash using singular vector decomposition ofMIPAS spectra.
The Oxford MIPAS retrieval of clouds (Hurley et al.; 2011) uses the contin-uum radiance from a narrow band of wavenumber ranges between 930 and965 cm−1 to retrieve a cloud effective fraction (CEF) defined as the fractionof the field-of-view that is covered by optically thick cloud. This is used tofind the highest MIPAS scan altitude at which cloud is present. The cloudtop height, cloud extinction and cloud top temperature are retrieved usingthe CEF and the continuum radiances from the scan above, at, and belowthe field-of-view at which the cloud top is found. However this approach doesnot determine cloud type. Extinction, cloud height, and cloud top temper-ature are retrieved, but any significant particulate plume can also show upin the retrievals, since the process identifies cases where the field-of-view isnot clear. The retrieval of volcanic plumes is not a problem per se. These dohave legitimate height, extinction and temperature, but it is useful to knowwhen the cloud is composed of volcanic ash, as opposed to water or ice.
Plumes can be flagged roughly by inspecting the ratio of radiances fromdifferent areas of the MIPAS continuum. For ash it was found that an ap-propriate flag was:
R(800−830 cm−1)
R(935−960 cm−1)
< 1.3, (6)
whereR is the mean continuum radiance between the lower and upper boundsof the wavenumbers indicated in the subscripts. The flag correctly identifiedmany areas where the volcanic output from Puyehue and Nabro was observ-able in MIPAS measurements. This flag is particularly good at picking outstrong signals, but in areas with less clear ash loadings, the method will notwork.
Using singular vector decomposition (SVD), it is possible to identifyplumes more definitely, picking up weaker signals, and signals which also in-clude regular clouds. A similar approach to that used by Hurley et al. (2009)is adopted (although in that case, singular vectors were obtained for a set of
12
calculated radiances, not measured atmospheric spectra). First, before a vol-cano has erupted, several days of MIPAS data at the volcano’s latitude and arange of nominal altitudes are taken as a “clean atmosphere training set” foratmosphere not containing a volcanic plume. Singular vectors, vi, are fittedusing the method given by Press et al. (1992). These vectors represent theorthogonal components of the given spectra, so that any of the training setspectral measurements, R, can be exactly reproduced by a weighted sum ofthe singular vectors, obtained through a least squares fit:
R =∑
i
λivi, (7)
where λi is the weight of the ith singular vector. Since the training setis expected to contain clear sky, and cloudy sky data, it can be used tofit measurements after the eruption where volcanic signals are not present.There are as many singular vectors as original measurements used in thetraining set, but the principal modes of variation are found only in the firstfew terms. It is therefore appropriate to truncate the sum given in Equation 7after a few terms. In this case, the first nine singular vectors were found tocontain 90 % of the variability between different measured spectra in thetraining set.
For post-volcanic measurements, the flag defined by Equation 6 is usedto provide cases where there is a strong volcanic signal. The original singularvectors are fitted to these new measurements, and the residual is that partof the spectrum that cannot be explained by our prior vectors for clean sky(and is therefore assumed to contain a volcanic signature). From several daysof data, these residuals are collected, and used to obtain a new set of singularvectors which contain the principal orthogonal signals for volcanic plumes.The volcanic singular vector is specific to the fitted ensemble as it containsinformation about aerosol composition which may vary during an eruptionand between different volcanic events.
Figure 7 shows an example of fitting the calculated singular vectors to realdata. The values of λi for the first two “clean” singular vectors and the firstvolcanic singular vector are shown. Note the much greater magnitude of thefirst two panels, which capture the strongest modes of variability for the cleansignal, the diurnal cycle, and the presence of cloud. The first volcanic singularvector, shown in the bottom panel, has almost no concentration before theeruption, but sporadically shows up post-eruption. Arrows show where theoriginal volcanic flag has been triggered. The new method identifies morescans that include ash than found using the continuum flag.
13
AATSR
The Advanced Along Track Scanning Radiometer (AATSR) is the currentoperational instrument in a series of nadir viewing radiometers (ATSR-1,ATSR-2 and AATSR commonly referenced as ATSR). AATSR, like MIPAS,is part of the payload on ENVISAT. A feature of the ATSR instruments isthat they provide two views of the same scene within ∼90 s of each other,the first centred on a viewing zenith angle of 55◦, the second at nadir. Theparallax between the two views allows for the determination of the altitudeof features by purely geometric means. For AATSR each view is made inseven spectral channels centred at 0.56, 0.66, 0.86, 1.6, 3.7, 11 and 12 µmand reported as sun-normalised reflectances in the shortwave (i.e. R0.56, R0.66,R0.86, R1.6) and brightness temperatures in the infrared (i.e. T3.7, T11, T12). Asa polar orbiting instrument, it provides a single day-time and single night-time overpass at approximately 10:30 am/pm local time. The instrumentswath width of 512 km (with a 1 km pixel size) means that it takes theinstrument three days to provide near-global coverage. Thus, for a giveneruption, AATSR will only be able to provide a measurement of the proximalplume once every three days.
Previous volcanological work using the ATSR series has included the ther-mal monitoring of volcanic hotspots (e.g. Wooster and Rothery; 1997). Prataand Grant (2001) determined ash properties from the 11 and 12 µm bright-ness temperatures in addition to plume height determined from the parallaxformed between the ATSR forward and nadir views. Here, the AATSR in-strument is used to produce volcanic cloud products from two independentmethods:
1. The stereo matching approach is used to produce an estimate of geo-metric ash cloud top height.
2. The brightness temperatures, in conjunction with knowledge of thevertical temperature structure of the atmosphere, is used to determineash cloud height using the shortwave channels to constrain the opticaldepth and microphysical properties of the cloud.
Identifying Ash in AATSR Imagery
The identification of ash in imager data has traditionally relied upon thebrightness temperature difference between 11 and 12 µm channels. In day-light scenes, the shortwave channels can also provide additional constraints- ash will typically have a low albedo compared to cloud and is also moreabsorbing in the green than the red. These features have been combined to
14

produce an AATSR volcanic ash flag, which uses thresholds on the followingquantities:
• T11 - T12
• T11 - T3.7
• R0.67
• The Normalised Difference Vegetation Index (NDVI), defined as
NDVI =R0.55 −R0.67
R0.55 +R0.67
(8)
Lean (2009) provides a test specifically for AATSR in daylight conditionswhereby a pixel which meets all four of the following conditions:
T11 − T12 < −0.1T11 − T3.7 < −20
R0.67 < 0.1NDVI < 0.1
(9)
is deemed to be ash. For night time scenes, the solar reflectance proportionof the 3.7 µm signal drops to zero, as do the shortwave channels, and thetest becomes:
T11 − T12 < −0.1T11 − T3.7 < 0
(10)
Using these tests, AATSR data can be rapidly checked for evidence of vol-canic ash. As these thresholds are instrument and calibration dependentfurther research would be needed for their use on other ATSR instruments.
Stereo Ash Plume Height Retrieval Algorithm (SAPHRA)
The SAPHRA algorithm consists of two stages:
1. The detection of possible volcanic ash plumes, based on the test spec-ified in Equations 9 during the day and Equations 10 at night.
2. The estimation of the height of detected plumes using stereo-matchingof the forward and nadir brightness temperature difference images.
Stereo matching is a well established tool for the determination of cloud andplume heights, both from ATSR instruments (Muller et al.; 2007; Prata andGrant; 2001) and NASA’s Multi-angle Imaging Spectro-Radiometer (MISR)on board the Terra satellite (Moroney et al.; 2002). The method employedhere is the simplest approach to the problem of matching features in the twoviews:
15
1. T11 − T12 is calculated for the entire scene in which ash has been de-tected, in both views.
2. The correlation between the two brightness temperature difference im-ages is calculated using a sliding window of n × n pixels; where n is∼ 3.
3. The images are offset by one pixel in the along-track direction, andstep two is repeated.
4. Step three is repeated twenty times, creating correlation images of thetwo brightness temperature difference fields for offsets of 0 - 20 pixels.
5. The offset for maximum correlation is determined for each pixel, andconverted to a geometric altitude.
The use of T11 − T12 ensures that the ash plume has a strong contrast tothe rest of the image, and gives a large change in correlation as the twoviews are aligned. Under the naive assumption that the uncertainty in theretrieved height is entirely due to the alignment, a one pixel error implies analtitude uncertainty of approximately 1.4 km. Other geometric cloud/plumeheight retrievals often use more complex pattern matching algorithms toproduce a height map, such as the Multi-point Matchers M2, M3 (Mulleret al.; 2002) and M4 (Muller et al.; 2007), which could be investigated foruse here. However, as we are interested solely in a clearly defined plume, thecorrelation method is sufficient for evaluating our approach.
SEVIRI
The Spinning Enhanced Visible and Infrared Imager (SEVIRI) is a scanningradiometer on-board the operational Meteosat Second Generation weathersatellite which is in a geostationary orbit nominally located on the Greenwichmeridian. SEVIRI provides image data of the Earth in eleven narrow bandchannels centred at 0.635, 0.81, 1.64, 3.92, 6.25, 7.35, 8.70, 9.66, 10.8, 12.0and 13.4 µm. A key feature of this instrument is its continuous imaging witha baseline repeat cycle of 15 min. The imaging sampling distance is 3 km atthe sub-satellite point. SEVIRI has been used to identify volcanic hotspots(Wooster et al.; 2000) as wells as to study lava flows at erupting volcanoes(Hirn et al.; 2009). Ash and SO2 have also been measured using the fivechannels centred at 6.25, 7.35, 8.70, 10.8, 12.0 (Prata and Kerkmann; 2007).More recently Stohl et al. (2011) used SEVIRI estimates of ash mass loadingto infer the ash emission from the Eyjafjallajokull 2010 eruption as a functionof time and altitude.
16
ORAC retrieval of ash plume height and physical properties
The Oxford-RAL Retrieval of Aerosol and Cloud (ORAC) algorithm is anoptimal estimation (OE) retrieval scheme designed to provide estimates ofaerosol optical depth and effective radius, cloud top pressure, height andtemperature, cloud particle effective radius, cloud optical depth and cloudtype (generally liquid water or ice) from multispectral imagery. The schemehas been used to produce a cloud product from the full ATSR-2 and AATSRrecord up to 2010 (Poulsen et al.; 2011; Sayer et al.; 2011). The ORACcloud scheme has been modified to determine ash cloud properties by usinga radiative forward model based on ash particles described by a lognormaldistribution (the lognormal spread is fixed at 1.77 but the effective radiusis allowed to vary in range 0.01 - 10 µm) and the Aso refractive indicesdescribed in Section 3. This principally involves creating lookup tables de-scribing reflectance and transmission of the ash plume for a range of solarand satellite geometries.
Assuming the plume is homogeneous, the integral in Equation 3 can becompleted and so the plume thickness, L, and optical depth τ are related by
τ = βextL (11)
The ash loading m [usually in g per m3] can be calculated from
m = ρ
∫∞
0
4
3πr3n(r) dr
︸ ︷︷ ︸
mass per unit volume
×τ
βext︸ ︷︷ ︸
L
=4πreρτ
∫∞
0 r3n(r) dr
3βext(12)
where ρ is the density of the ash (Wen and Rose; 1994). If the particlesize-distribution is assumed to be log-normal the column loading becomes
m =4
3
ρτ
σextπr3e exp
(
2 ln2 S)
(13)
where σext is the average extinction cross-section per particle given by
σext =βext
N0
(14)
CAA restrictions on aircraft flights are in terms of the density of ashrather than the column amount. There are three approaches to estimate thisquantity from the mass loading:
1. Use a correlative measurement of the plume thickness, L, e.g. fromlidar, then estimate the mass density through
ρ =m
L(15)
17
2. Assume a typical volume extinction coefficient to convert a plume’soptical depth into physical depth.
3. Assume the plume thickness is the same as its altitude. This thenprovides a minimum possible mass density under the assumption theplume is homogeneous.
It is worth noting that the simultaneous retrieval of all state parametersprovided by the OE method ensures that a physically consistent and numer-ically optimal estimate of the state is produced. It is clear that, althoughthermal IR channels mostly provide information on the cloud top pressure,height and temperature, the transmission and emission values of the cloudwill depend on the optical depth and effective radius, which are mostly deter-mined from the shortwave channels. Conversely, the above and below cloudtransmissions in the shortwave will be weakly (if we assume the channelsused are atmospheric window channels) dependant on the cloud height. Dueto the large differences in the optical properties of ash, water droplets andice crystals, ORAC has been proved to provide an effective way of detectingash in satellite imagery; ash clouds cannot be well fit using either water orice cloud properties and vice versa.
Here we will demonstrate an ability to determine ash properties whena plume is located above a cloud. This is particularly useful as there weremany instances of ash overlying cloud during the Eyjafjallajokull, 2010 andGrimsvotn, 2011 eruptions.
In summary, quantifying a volcanic cloud requires knowledge of ash load-ing, composition, morphology and size, as well as the physical dimensions andlocation of the ash plume. In addition, tephra from explosive volcanic erup-tions holds information about magma dynamics in the critical zone wherefragmentation occurs and eruption style is decided. In this work new al-gorithms are presented that determine plume and ash properties based onpreliminary laboratory measurements of ash optical properties.
Case Study I: The 2011 Puyehue-Cordon Caulle
Eruption
The Puyehue-Cordon Caulle volcanic complex (Singer et al.; 2008) forms partof the Andes and is located in Puyehue National Park, Chile. The eruptionbegan in June and continued through the remaining months of 2011. Asummary of the first two months of activity is summarised below.
From 27th April, seismic activity was detected. The frequency of earth-quakes increased on 2nd June and was followed, on 4th June, by an explosion
18

from Puyehue-Cordon Caulle that produced a plume of ash and gas, risingto an altitude of 12.2 km above sea level (asl) as noted by ObservatorioVolcanologico de los Andes del Sur (OVDAS)(Chile) (2011) and ServicioNacional de Geologia y Mineria scientists (Servicio Nacional de Geologia yMineria; 2011a,b,c,d). Initially, plumes drifted south at 5 km asl and driftedwest and east at an altitude of about 10 km.
From the 4th June and on the following days the ash plumes were generallytransported in the SE to NE sector. The Buenos Aires VAAC reported thaton 4th June ash plumes rose to altitudes of 10.7-13.7 km and drifted 870 kmESE (Global Volcanism Program; 2011a). On the 5th June, the ash plumewas estimated to be between 10.7-12.2 km located 1,700 km ESE of thevolcano over Atlantic Ocean. On 6th June, a new part of the plume waslocated 170 km ENE of the mountain, while the previous part of the plumecontinued to be transported ESE over the ocean. On the 7th June the ashplume was reported at heights of 5.5-9.8 km (Global Volcanism Program;2011a). Volcanic activity continued over the following days, leading to thecancellation of several flights in Argentina, Uruguay and Brazil. By 12thJune, the ash plume had reached Australia, and New Zealand. On 13thJune, a MODIS image showed a large volcanic ash plume over Argentinawhich was reported to lie between 4 and 8 km (NASA Earth Observatory;2011). From 22 June to 5th July, the eruption continued with less activityand lower plume heights in the range 2 and 4 km (Global Volcanism Program;2011a).
On 7-8th July an increase in the plume height led to the cancellation offlights in Argentina and Uruguay (France-Presse; 2011). During the followingfew days the plume altitude decreased and was reported to be 3 km (9th July)l, 2 km (17th July) and 5 km above the crater on the 18th July. Between25 July-1 August, the eruption continued with plumes rising 2-5 km abovethe crater. Eruptive processes continued through the remaining months of2011(Global Volcanism Program; 2011a).
Using AATSR to Identify the 2011 Puyehue-CordonCaulle Ash Cloud Height
SAPHRA has been used to identify the height of the ash plume from the 2011Puyehue-Cordn Caulle eruption as viewed by AATSR on the 6th of June.Figure 16 shows an image generated from red, green and blue channels ofthe MEdium Resolution Imaging Spectrometer (MERIS) which is on boardthe Envisat platform with AATSR. Superimposed on the MERIS image is avisible-near infrared false colour image from AATSR. The primary ash plume
19
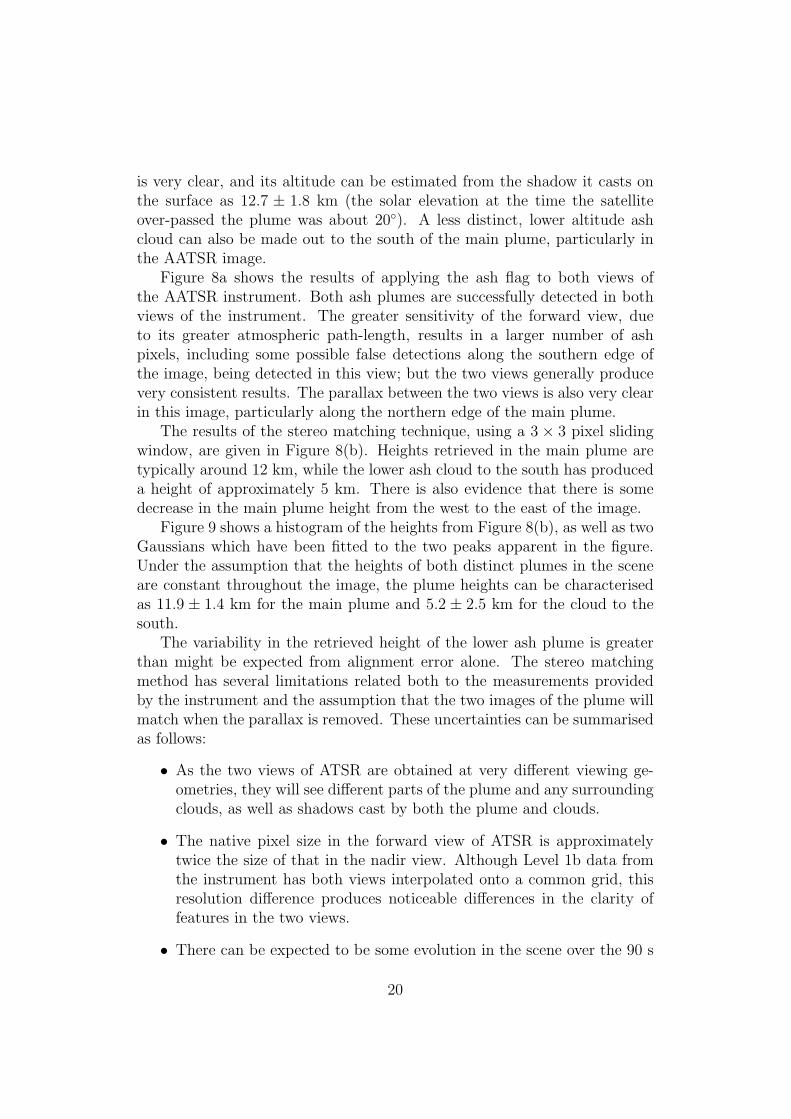
is very clear, and its altitude can be estimated from the shadow it casts onthe surface as 12.7 ± 1.8 km (the solar elevation at the time the satelliteover-passed the plume was about 20◦). A less distinct, lower altitude ashcloud can also be made out to the south of the main plume, particularly inthe AATSR image.
Figure 8a shows the results of applying the ash flag to both views ofthe AATSR instrument. Both ash plumes are successfully detected in bothviews of the instrument. The greater sensitivity of the forward view, dueto its greater atmospheric path-length, results in a larger number of ashpixels, including some possible false detections along the southern edge ofthe image, being detected in this view; but the two views generally producevery consistent results. The parallax between the two views is also very clearin this image, particularly along the northern edge of the main plume.
The results of the stereo matching technique, using a 3 × 3 pixel slidingwindow, are given in Figure 8(b). Heights retrieved in the main plume aretypically around 12 km, while the lower ash cloud to the south has produceda height of approximately 5 km. There is also evidence that there is somedecrease in the main plume height from the west to the east of the image.
Figure 9 shows a histogram of the heights from Figure 8(b), as well as twoGaussians which have been fitted to the two peaks apparent in the figure.Under the assumption that the heights of both distinct plumes in the sceneare constant throughout the image, the plume heights can be characterisedas 11.9 ± 1.4 km for the main plume and 5.2 ± 2.5 km for the cloud to thesouth.
The variability in the retrieved height of the lower ash plume is greaterthan might be expected from alignment error alone. The stereo matchingmethod has several limitations related both to the measurements providedby the instrument and the assumption that the two images of the plume willmatch when the parallax is removed. These uncertainties can be summarisedas follows:
• As the two views of ATSR are obtained at very different viewing ge-ometries, they will see different parts of the plume and any surroundingclouds, as well as shadows cast by both the plume and clouds.
• The native pixel size in the forward view of ATSR is approximatelytwice the size of that in the nadir view. Although Level 1b data fromthe instrument has both views interpolated onto a common grid, thisresolution difference produces noticeable differences in the clarity offeatures in the two views.
• There can be expected to be some evolution in the scene over the 90 s
20

gap between the forward and nadir scans of the instrument; however,for most scenes this will be insignificant on the 1 km spatial scale of aninstrument pixel.
• Stereo matching will be most successful for images with strong featuresthat lie perpendicular to the satellite track, as they will provide clearmarkers of parallax. Thus, for the greater part of an ATSR orbit,plumes which extend in an east-west direction will be better retrieved.
• ATSR have a collocation error of typically one pixel (although oftenmore) between the forward and nadir views. Thus, features at sealevel will often not coincide in the two images. This error is probablythe most serious of those listed here, as it can result in a consistentbias in the retrieved height of up to a few kilometres. However, it ispossible to correct for: in the results presented here, surface featureshave been used to align the two views by eye before applying the heightretrieval algorithm. There is also an on-going effort to produce a globalcorrection for the entire ATSR-2 and AATSR time series, which shouldsolve this problem.
All of these limitations can contribute to an uncertainty which is significantlygreater than the circa ±1.4 km error that results from the 1 km resolutionof AATSR, especially for diffuse ash clouds. However, for a well defined,favourably aligned plume, such as the main plume in this case study, thevariability in the retrieved plume height shows very good agreement withthe expected error.
Using MIPAS to Identify the 2011 Puyehue-Cordon CaulleAsh Cloud
Figure 11 shows the first volcanic singular vector calculated using flaggedspectra that were thought to contain the plume from the Puyehue eruption,viewed at an altitude of 12 km. The positive slope through the centre ofthe A-band is a well known feature to be expected, since it agrees with theempirical flag that was used to mark volcanic profiles. The SVD can be re-calculated at later times after the eruption in order to see the evolution ofthe plume’s optical properties.
The geographical coverage of the plume can be inferred by looking forareas where the least squares fit of the singular vectors to a MIPAS spectrarequires a significant contribution from the first volcanic singular vector i.e.λvolc,1. In these areas, the “clean” singular vectors could not satisfactorilyrepresent the scene. Care must be used in interpreting these areas as no effort
21
has been made to account for unobserved portions of the plume. These occurthrough MIPAS’s limited spatial sampling, by the plume being obscuredby water or ice cloud or by the plume occurring below MIPAS’s minimumsampling altitude.
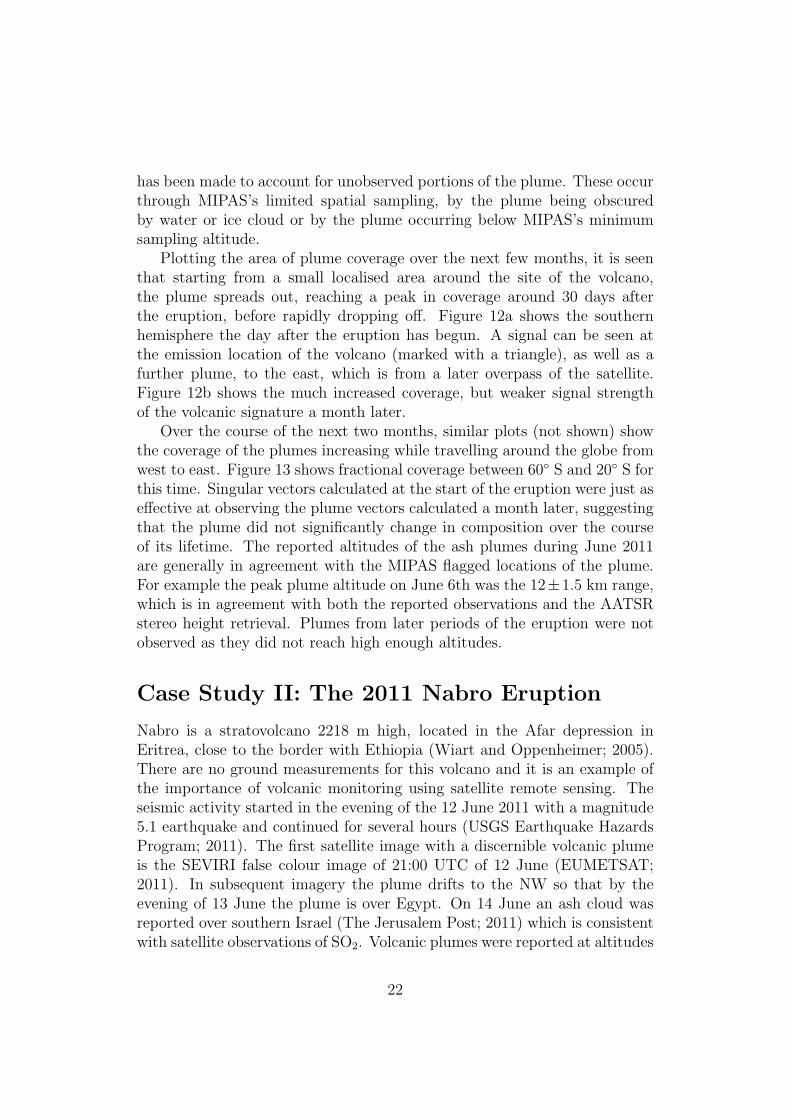
Plotting the area of plume coverage over the next few months, it is seenthat starting from a small localised area around the site of the volcano,the plume spreads out, reaching a peak in coverage around 30 days afterthe eruption, before rapidly dropping off. Figure 12a shows the southernhemisphere the day after the eruption has begun. A signal can be seen atthe emission location of the volcano (marked with a triangle), as well as afurther plume, to the east, which is from a later overpass of the satellite.Figure 12b shows the much increased coverage, but weaker signal strengthof the volcanic signature a month later.
Over the course of the next two months, similar plots (not shown) showthe coverage of the plumes increasing while travelling around the globe fromwest to east. Figure 13 shows fractional coverage between 60◦ S and 20◦ S forthis time. Singular vectors calculated at the start of the eruption were just aseffective at observing the plume vectors calculated a month later, suggestingthat the plume did not significantly change in composition over the courseof its lifetime. The reported altitudes of the ash plumes during June 2011are generally in agreement with the MIPAS flagged locations of the plume.For example the peak plume altitude on June 6th was the 12±1.5 km range,which is in agreement with both the reported observations and the AATSRstereo height retrieval. Plumes from later periods of the eruption were notobserved as they did not reach high enough altitudes.
Case Study II: The 2011 Nabro Eruption
Nabro is a stratovolcano 2218 m high, located in the Afar depression inEritrea, close to the border with Ethiopia (Wiart and Oppenheimer; 2005).There are no ground measurements for this volcano and it is an example ofthe importance of volcanic monitoring using satellite remote sensing. Theseismic activity started in the evening of the 12 June 2011 with a magnitude5.1 earthquake and continued for several hours (USGS Earthquake HazardsProgram; 2011). The first satellite image with a discernible volcanic plumeis the SEVIRI false colour image of 21:00 UTC of 12 June (EUMETSAT;2011). In subsequent imagery the plume drifts to the NW so that by theevening of 13 June the plume is over Egypt. On 14 June an ash cloud wasreported over southern Israel (The Jerusalem Post; 2011) which is consistentwith satellite observations of SO2. Volcanic plumes were reported at altitudes
22
of 9.1-13.7 km on 13th 6.1-10.7 km on 14th and 6.1-7.9 km during 15-20 June(Global Volcanism Program; 2011b).
On 15-16 June satellite measurements of SO2 by the Infrared AtmosphericSounding Interferometer (IASI) show an plume located over central Asia.The IASI measurements show two distinct filaments of SO2 over Asia, (oneat 10 km altitude and one at 15 km). The SO2 plume reached the east coastof China on 18th June. During 22-26 June large amounts of sulphur dioxidecontinued to be detected by satellite sensors. The Toulouse VAAC reportedthat during 26-27 June plumes rose to altitudes up to 6.1 km. The satelliteimages show that the SO2 signal gradually decreasing up to 28 June. Thelast ash plumes from this eruption were reported on 16 July (at an altitudeless than 5.5 km) and on 17 July (Global Volcanism Program; 2011b).
Using MIPAS to Identify the 2011 Nabro Ash Cloud
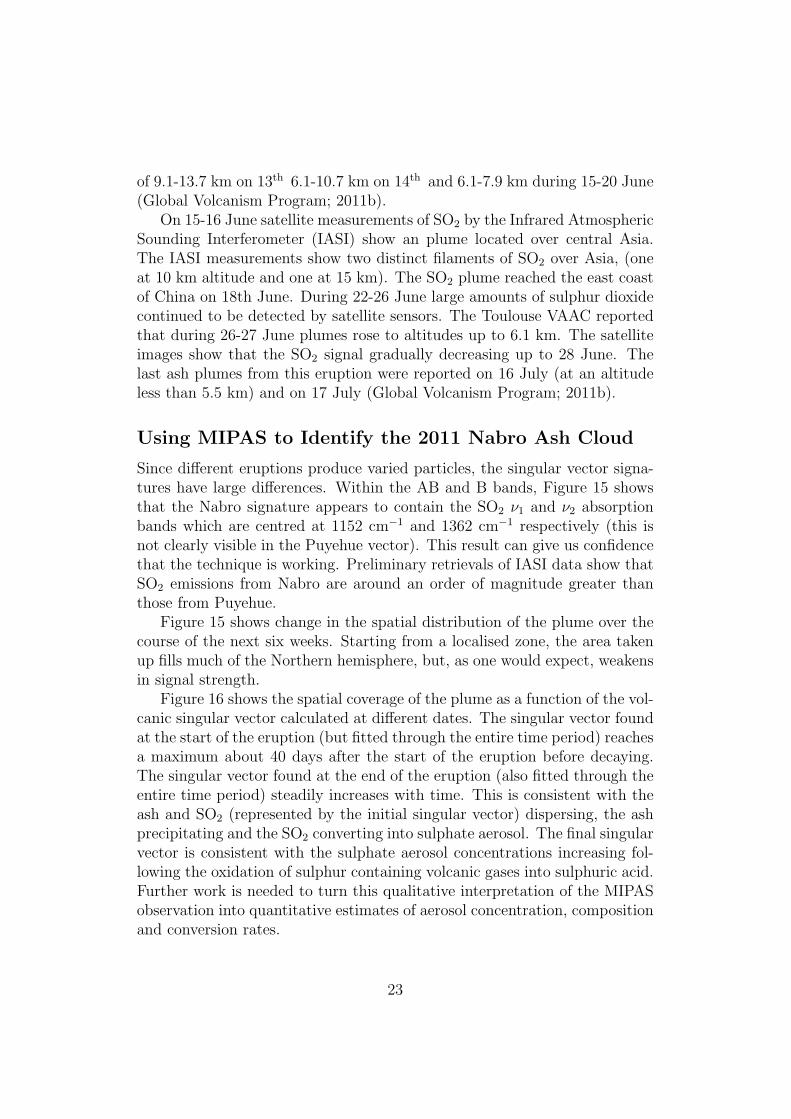
Since different eruptions produce varied particles, the singular vector signa-tures have large differences. Within the AB and B bands, Figure 15 showsthat the Nabro signature appears to contain the SO2 ν1 and ν2 absorptionbands which are centred at 1152 cm−1 and 1362 cm−1 respectively (this isnot clearly visible in the Puyehue vector). This result can give us confidencethat the technique is working. Preliminary retrievals of IASI data show thatSO2 emissions from Nabro are around an order of magnitude greater thanthose from Puyehue.
Figure 15 shows change in the spatial distribution of the plume over thecourse of the next six weeks. Starting from a localised zone, the area takenup fills much of the Northern hemisphere, but, as one would expect, weakensin signal strength.
Figure 16 shows the spatial coverage of the plume as a function of the vol-canic singular vector calculated at different dates. The singular vector foundat the start of the eruption (but fitted through the entire time period) reachesa maximum about 40 days after the start of the eruption before decaying.The singular vector found at the end of the eruption (also fitted through theentire time period) steadily increases with time. This is consistent with theash and SO2 (represented by the initial singular vector) dispersing, the ashprecipitating and the SO2 converting into sulphate aerosol. The final singularvector is consistent with the sulphate aerosol concentrations increasing fol-lowing the oxidation of sulphur containing volcanic gases into sulphuric acid.Further work is needed to turn this qualitative interpretation of the MIPASobservation into quantitative estimates of aerosol concentration, compositionand conversion rates.
23
Case Study III: The April - May 2010 Eyjaf-
jallajokull Eruption
The Eyjafjallajokull is a stratovolcano, located close to Iceland’s southerncoast (Sigmundsson et al.; 2010). As reported by Global Volcanism Program(2011c), after an initial eruptive phase (from 20 March 2010) of lava flowbut no significant ash and SO2 emission, an explosive eruptive phase of theEyjafjallajokull volcano began on the 14 April 2010. This was anticipatedby a series of earthquakes in the night between 13 and 14 April. FollowingZehner (2012), the explosive part of this eruption can be divided into threephases:
Phase I: 14 - 18 April
A phreatomagmatic eruption phase, ice and water from the ice cup above thecaldera are directly in contact with the fresh magma in the vent. This pro-duce a faster cooling of the ejected magma and large amount of ash injectedin the atmosphere, as well as steams plumes. During this period the injectionaltitude of the plume was estimated between 2 and 10 km height (Marzanoet al.; 2011; Stohl et al.; 2011) and the wind conditions transported the ashplume in a SE direction, toward Europe.
Phase II : 18 April - 4 May
From the evening of 18 April there was a magmatic eruption phase; water andice from the glacier were not inside the vent. The intensity of the eruptionwas one order of magnitude lower than phase I, and there was a reduction inthe amount of ash injected into the atmosphere. The altitude of the eruptioncolumn was between 2 and 5 km (Zehner; 2012; Stohl et al.; 2011).
Phase III: 5 May - 24 May
Between 3-5 May an increase in seismic activity was reported followed bya more intense explosive phase of the eruption. Ash production increasedand the eruption column altitude was reported between 4 and 10 km (Stohlet al.; 2011). In this period ash plumes were transported over Europe andthe Atlantic ocean.
The volcanic plumes from the eruption of Eyjafjallajokull starting in April2010 resulted in the cancellation of 100,000 flights over Europe affectingroughly 10 million passengers (European Commission; 2010). The airline
24
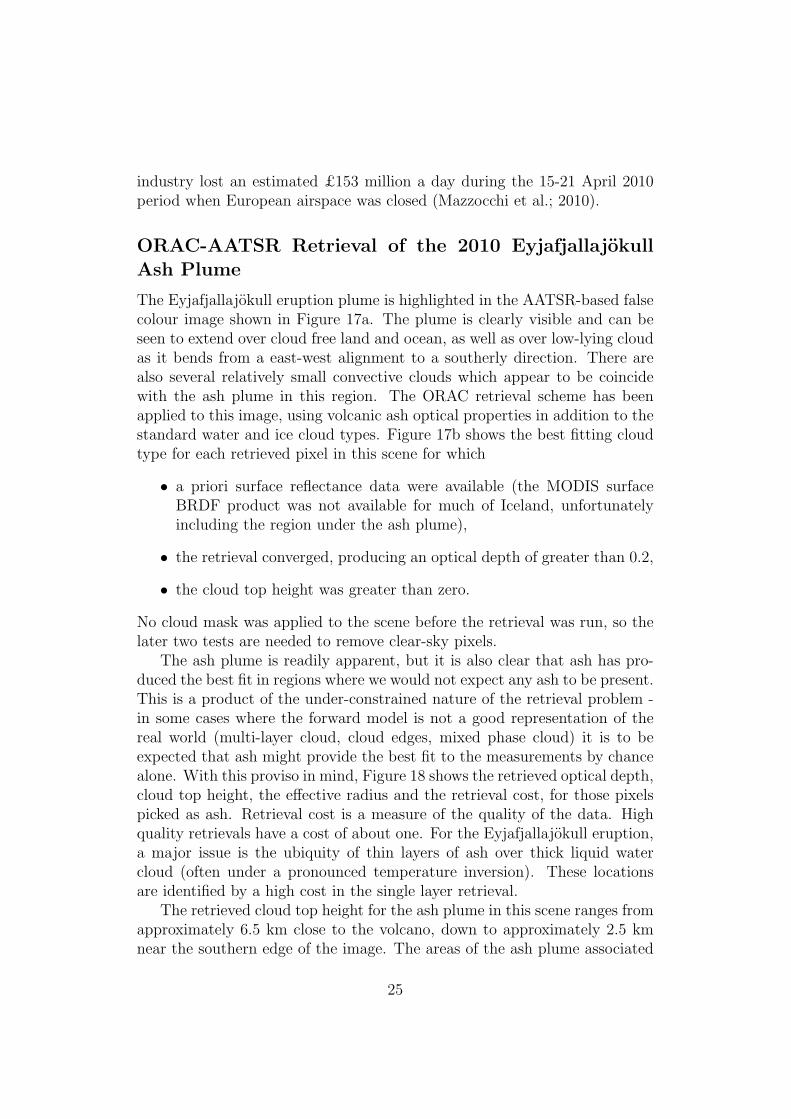
industry lost an estimated £153 million a day during the 15-21 April 2010period when European airspace was closed (Mazzocchi et al.; 2010).
ORAC-AATSR Retrieval of the 2010 EyjafjallajokullAsh Plume
The Eyjafjallajokull eruption plume is highlighted in the AATSR-based falsecolour image shown in Figure 17a. The plume is clearly visible and can beseen to extend over cloud free land and ocean, as well as over low-lying cloudas it bends from a east-west alignment to a southerly direction. There arealso several relatively small convective clouds which appear to be coincidewith the ash plume in this region. The ORAC retrieval scheme has beenapplied to this image, using volcanic ash optical properties in addition to thestandard water and ice cloud types. Figure 17b shows the best fitting cloudtype for each retrieved pixel in this scene for which
• a priori surface reflectance data were available (the MODIS surfaceBRDF product was not available for much of Iceland, unfortunatelyincluding the region under the ash plume),
• the retrieval converged, producing an optical depth of greater than 0.2,
• the cloud top height was greater than zero.
No cloud mask was applied to the scene before the retrieval was run, so thelater two tests are needed to remove clear-sky pixels.
The ash plume is readily apparent, but it is also clear that ash has pro-duced the best fit in regions where we would not expect any ash to be present.This is a product of the under-constrained nature of the retrieval problem -in some cases where the forward model is not a good representation of thereal world (multi-layer cloud, cloud edges, mixed phase cloud) it is to beexpected that ash might provide the best fit to the measurements by chancealone. With this proviso in mind, Figure 18 shows the retrieved optical depth,cloud top height, the effective radius and the retrieval cost, for those pixelspicked as ash. Retrieval cost is a measure of the quality of the data. Highquality retrievals have a cost of about one. For the Eyjafjallajokull eruption,a major issue is the ubiquity of thin layers of ash over thick liquid watercloud (often under a pronounced temperature inversion). These locationsare identified by a high cost in the single layer retrieval.
The retrieved cloud top height for the ash plume in this scene ranges fromapproximately 6.5 km close to the volcano, down to approximately 2.5 kmnear the southern edge of the image. The areas of the ash plume associated
25

with the convective clouds apparent in the false colour image show a muchhigher altitude than the surrounding plume and often have been selected asice cloud rather than ash. This seems a reasonable result, but is an example ofwhere the assumptions of the retrieval have broken down. Examination of theretrieval cost shows that the regions where the false colour image shows thatboth ash and water cloud are present have greatly elevated cost, indicatingthe retrieval did not produce a good fit to the measurements, and is probablyinaccurate - in this case the retrieved height is probably an intermediate levelbetween an ash layer and the height of underlying water cloud. In these casesthe retrieved optical depth and effective radius also show artefacts associatedwith the presence of cloud. Ignoring those retrievals whose cost is greaterthan two suggests that within the first ∼ 500 km of the plume its height wasin the range 2.5-6.5 km, the optical depth was 1-2.5 and the effective radiuswas 3-7 µm. The retrieved effective radius are typical of those reported forother eruptions given in Table 2.
An interesting feature of the plume, which is apparent in its East-Westaligned portion is the strong gradient in effective radius and cloud top heightalong its southern edge, which is associated with a distinct change in theappearance of the plume in the false colour image. The retrieval of largerparticles at a lower altitude along this edge suggests that there may havebeen a vertical wind shear acting on the plume, as larger particles wouldbe expected to be found lower in the plume due to their higher settlingvelocity, resulting in subtly different trajectories for particles of differentsizes. However, it is also possible that this feature is an artefact causedby the breakdown of the plane-parallel approximation near the edge of theplume, so no firm conclusion can be drawn from these results alone.
Figure 19 shows the ash mass density derived from the ORAC estimatesof optical depth and effective radius using Equation (13). The grey valuesare obvious cloud contamination and have values in the range of about 50 -80 gm2. The total mass in the scene is 0.83 Tg if the cloud contaminationis included and 0.24 Tg, if all the pixels with an ash density of greater than20 gm2 are ignored. Given the plume covers about 12 hours of emissions thisrepresents an emission rate of 1.8 × 10⁷ g s−1. This value is very similar tothe 6th of May 2010 emission value of 2.0× 10⁷ g s−1 reported by Stohl et al.(2011).
26
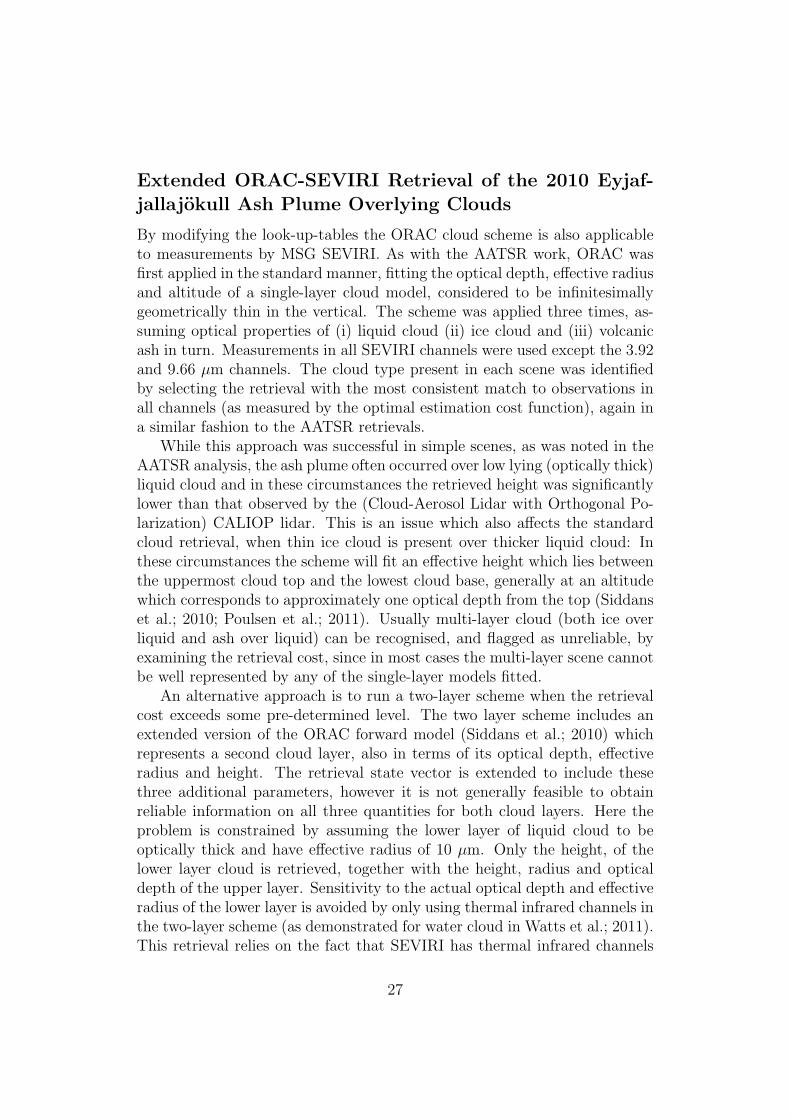
Extended ORAC-SEVIRI Retrieval of the 2010 Eyjaf-jallajokull Ash Plume Overlying Clouds
By modifying the look-up-tables the ORAC cloud scheme is also applicableto measurements by MSG SEVIRI. As with the AATSR work, ORAC wasfirst applied in the standard manner, fitting the optical depth, effective radiusand altitude of a single-layer cloud model, considered to be infinitesimallygeometrically thin in the vertical. The scheme was applied three times, as-suming optical properties of (i) liquid cloud (ii) ice cloud and (iii) volcanicash in turn. Measurements in all SEVIRI channels were used except the 3.92and 9.66 µm channels. The cloud type present in each scene was identifiedby selecting the retrieval with the most consistent match to observations inall channels (as measured by the optimal estimation cost function), again ina similar fashion to the AATSR retrievals.
While this approach was successful in simple scenes, as was noted in theAATSR analysis, the ash plume often occurred over low lying (optically thick)liquid cloud and in these circumstances the retrieved height was significantlylower than that observed by the (Cloud-Aerosol Lidar with Orthogonal Po-larization) CALIOP lidar. This is an issue which also affects the standardcloud retrieval, when thin ice cloud is present over thicker liquid cloud: Inthese circumstances the scheme will fit an effective height which lies betweenthe uppermost cloud top and the lowest cloud base, generally at an altitudewhich corresponds to approximately one optical depth from the top (Siddanset al.; 2010; Poulsen et al.; 2011). Usually multi-layer cloud (both ice overliquid and ash over liquid) can be recognised, and flagged as unreliable, byexamining the retrieval cost, since in most cases the multi-layer scene cannotbe well represented by any of the single-layer models fitted.
An alternative approach is to run a two-layer scheme when the retrievalcost exceeds some pre-determined level. The two layer scheme includes anextended version of the ORAC forward model (Siddans et al.; 2010) whichrepresents a second cloud layer, also in terms of its optical depth, effectiveradius and height. The retrieval state vector is extended to include thesethree additional parameters, however it is not generally feasible to obtainreliable information on all three quantities for both cloud layers. Here theproblem is constrained by assuming the lower layer of liquid cloud to beoptically thick and have effective radius of 10 µm. Only the height, of thelower layer cloud is retrieved, together with the height, radius and opticaldepth of the upper layer. Sensitivity to the actual optical depth and effectiveradius of the lower layer is avoided by only using thermal infrared channels inthe two-layer scheme (as demonstrated for water cloud in Watts et al.; 2011).This retrieval relies on the fact that SEVIRI has thermal infrared channels
27
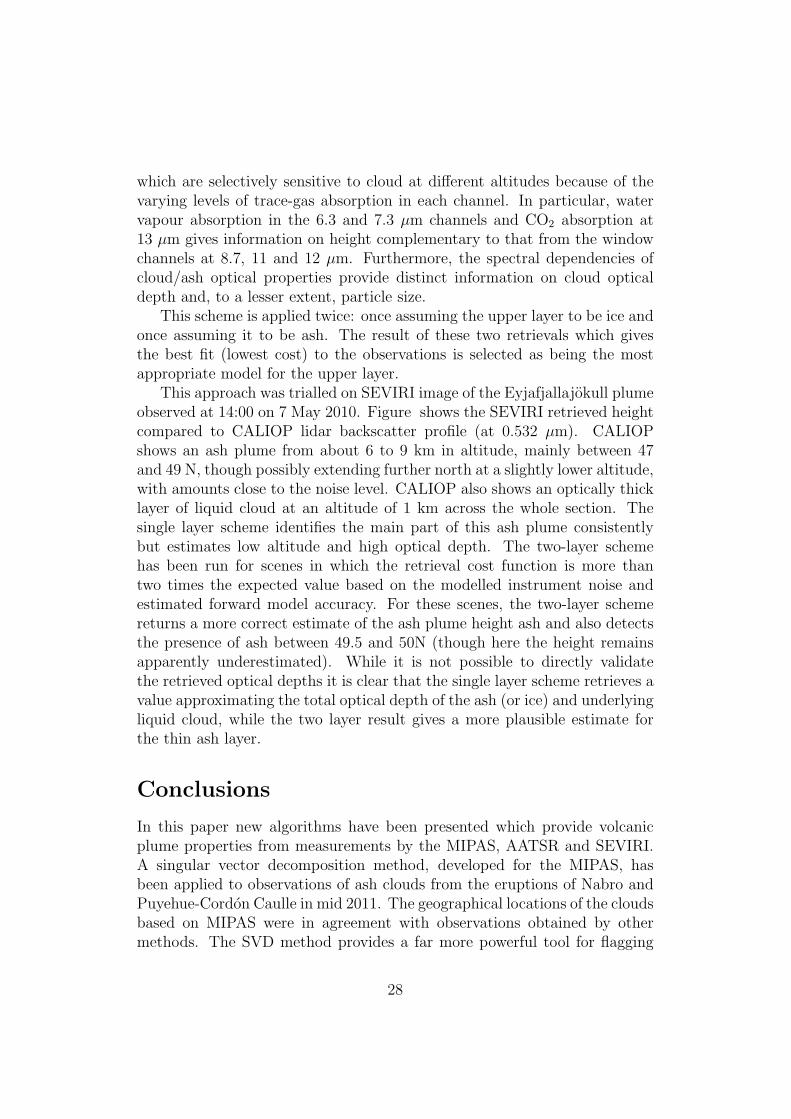
which are selectively sensitive to cloud at different altitudes because of thevarying levels of trace-gas absorption in each channel. In particular, watervapour absorption in the 6.3 and 7.3 µm channels and CO2 absorption at13 µm gives information on height complementary to that from the windowchannels at 8.7, 11 and 12 µm. Furthermore, the spectral dependencies ofcloud/ash optical properties provide distinct information on cloud opticaldepth and, to a lesser extent, particle size.
This scheme is applied twice: once assuming the upper layer to be ice andonce assuming it to be ash. The result of these two retrievals which givesthe best fit (lowest cost) to the observations is selected as being the mostappropriate model for the upper layer.
This approach was trialled on SEVIRI image of the Eyjafjallajokull plumeobserved at 14:00 on 7 May 2010. Figure shows the SEVIRI retrieved heightcompared to CALIOP lidar backscatter profile (at 0.532 µm). CALIOPshows an ash plume from about 6 to 9 km in altitude, mainly between 47and 49 N, though possibly extending further north at a slightly lower altitude,with amounts close to the noise level. CALIOP also shows an optically thicklayer of liquid cloud at an altitude of 1 km across the whole section. Thesingle layer scheme identifies the main part of this ash plume consistentlybut estimates low altitude and high optical depth. The two-layer schemehas been run for scenes in which the retrieval cost function is more thantwo times the expected value based on the modelled instrument noise andestimated forward model accuracy. For these scenes, the two-layer schemereturns a more correct estimate of the ash plume height ash and also detectsthe presence of ash between 49.5 and 50N (though here the height remainsapparently underestimated). While it is not possible to directly validatethe retrieved optical depths it is clear that the single layer scheme retrieves avalue approximating the total optical depth of the ash (or ice) and underlyingliquid cloud, while the two layer result gives a more plausible estimate forthe thin ash layer.
Conclusions
In this paper new algorithms have been presented which provide volcanicplume properties from measurements by the MIPAS, AATSR and SEVIRI.A singular vector decomposition method, developed for the MIPAS, hasbeen applied to observations of ash clouds from the eruptions of Nabro andPuyehue-Cordon Caulle in mid 2011. The geographical locations of the cloudsbased on MIPAS were in agreement with observations obtained by othermethods. The SVD method provides a far more powerful tool for flagging
28
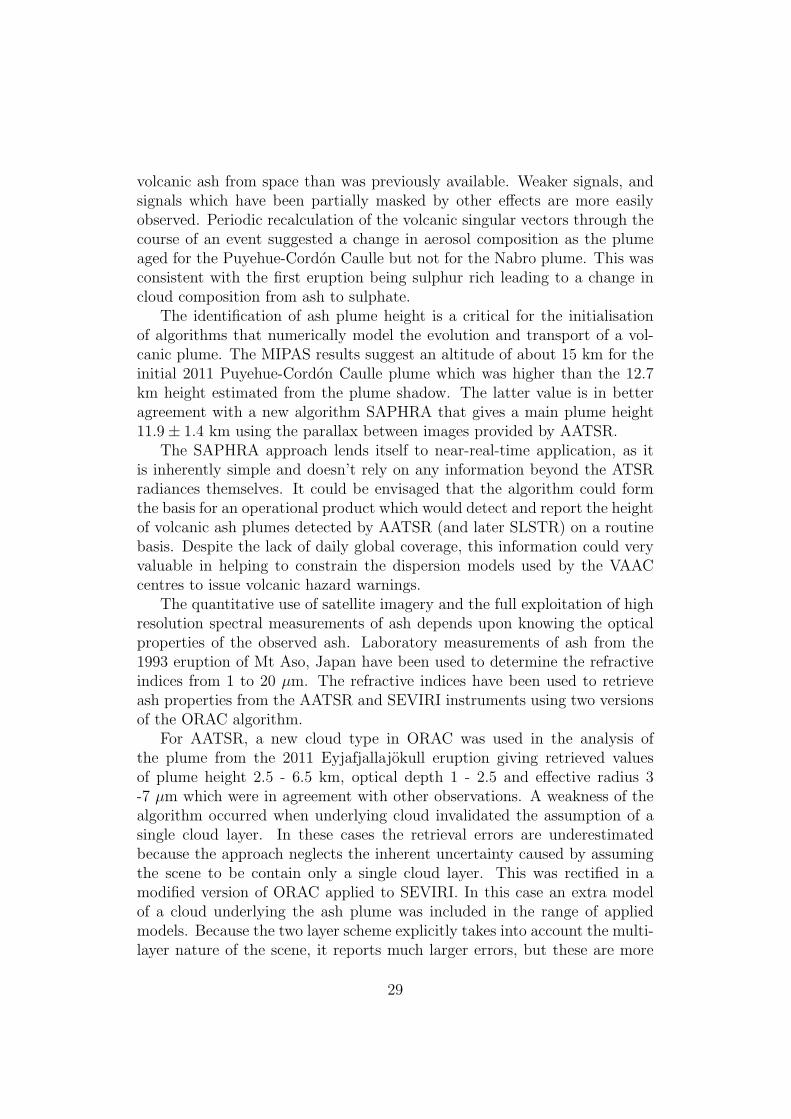
volcanic ash from space than was previously available. Weaker signals, andsignals which have been partially masked by other effects are more easilyobserved. Periodic recalculation of the volcanic singular vectors through thecourse of an event suggested a change in aerosol composition as the plumeaged for the Puyehue-Cordon Caulle but not for the Nabro plume. This wasconsistent with the first eruption being sulphur rich leading to a change incloud composition from ash to sulphate.
The identification of ash plume height is a critical for the initialisationof algorithms that numerically model the evolution and transport of a vol-canic plume. The MIPAS results suggest an altitude of about 15 km for theinitial 2011 Puyehue-Cordon Caulle plume which was higher than the 12.7km height estimated from the plume shadow. The latter value is in betteragreement with a new algorithm SAPHRA that gives a main plume height11.9± 1.4 km using the parallax between images provided by AATSR.
The SAPHRA approach lends itself to near-real-time application, as itis inherently simple and doesn’t rely on any information beyond the ATSRradiances themselves. It could be envisaged that the algorithm could formthe basis for an operational product which would detect and report the heightof volcanic ash plumes detected by AATSR (and later SLSTR) on a routinebasis. Despite the lack of daily global coverage, this information could veryvaluable in helping to constrain the dispersion models used by the VAACcentres to issue volcanic hazard warnings.
The quantitative use of satellite imagery and the full exploitation of highresolution spectral measurements of ash depends upon knowing the opticalproperties of the observed ash. Laboratory measurements of ash from the1993 eruption of Mt Aso, Japan have been used to determine the refractiveindices from 1 to 20 µm. The refractive indices have been used to retrieveash properties from the AATSR and SEVIRI instruments using two versionsof the ORAC algorithm.
For AATSR, a new cloud type in ORAC was used in the analysis ofthe plume from the 2011 Eyjafjallajokull eruption giving retrieved valuesof plume height 2.5 - 6.5 km, optical depth 1 - 2.5 and effective radius 3-7 µm which were in agreement with other observations. A weakness of thealgorithm occurred when underlying cloud invalidated the assumption of asingle cloud layer. In these cases the retrieval errors are underestimatedbecause the approach neglects the inherent uncertainty caused by assumingthe scene to be contain only a single cloud layer. This was rectified in amodified version of ORAC applied to SEVIRI. In this case an extra modelof a cloud underlying the ash plume was included in the range of appliedmodels. Because the two layer scheme explicitly takes into account the multi-layer nature of the scene, it reports much larger errors, but these are more
29
consistent with the observed discrepancies with CALIOP. In cases where theplume overlay cloud this new model worked well, showing good agreementwith correlative CALIOP observations.
It should be noted that the ORAC retrieval, as it currently stands, hasseveral weaknesses which limit its applicability to volcanic ash detection andcharacterisation, many of which it shares with other algorithms:
• ORAC assumes plane-parallel cloud in its forward model. Volcanicash plumes are often not plane-parallel (as they are typically a narrowplume). This can result in significant biases in the retrieved parameters,including height.
• As with all ash detection schemes, in cases where ash is mixing withlarge quantities of either ice or liquid water, there will come a pointwhere the ash cloud becomes indistinguishable from a normal water orice cloud. Furthermore, even if the cloud is determined to be ash, thepresence of water will alter its radiative properties and produce a biasin the retrieval.
• For optically thin ash, an accurate knowledge of the surface properties(particularly its reflectance) becomes important and the Lambertiansurface reflectance assumption can become problematic. This can beimproved through the use a forward model which includes a model ofsurface bidirectional reflectance distribution function. Such a model isbeing introduced for ORAC cloud retrievals, but the accuracy of theretrieval is still dependant on prior knowledge of the surface reflectance.
• The retrieval of multi-layer cloud systems is still experimental and thereremain obstacles to its wide spread application, not least the reliabledetection of multi-layer scenes.
• The need for knowledge of the atmospheric temperature profile andcomposition, surface reflectance and suitable ash optical properties, aswell as the computational cost of the scheme mean that ORAC is bettersuited to studying volcanic eruption plumes after the fact, rather thanas a near real-time ash detection mechanism.
Despite these provisos, ORAC applied to ATSR offers a powerful toolfor the characterisation of volcanic ash plumes, providing both an indepen-dent plume height estimate from the geometric method and estimates of theoptical depth and effective radius of the ash, which can in turn be used toestimate ash mass loading.
30
The authors acknowledge funding from the NERC National Centre forEarth Observation. The authors wish to thank Dr Tony Hurst for providingthe Aso ash sample and gratefully acknowledge the NASA Langley Atmo-spheric Science Data Centre for CALIOP data. The authors also thank F.Prata of NILU for identifying CALIOP orbits which sampled the 2010 Ey-jafjallajokull plume.
References
Blong, R. (1984). Volcanic hazards: a sourcebook on the effects of eruptions,Academic Press, Sydney Orlando, Fla.
Burgess, A., Grainger, R. G. and Dudhia, A. (2006). Zonal mean atmosphericdistribution of sulphur hexafluoride (SF6), Geophysical Research Letters33.
Burton, M., Allard, P., Mure, F. and Oppenheimer, C. (2003). FTIR remotesensing of fractional magma degassing at Mount Etna, Sicily, in C. Op-penheimer, D. M. Pyle and J. Barclay (eds), Volcanic Degassing, Vol. 213of Geological Society Special Publication, pp. 281–293.
Burton, M., Oppenheimer, C., Horrocks, L. and Francis, P. (2001). Diurnalchanges in volcanic plume chemistry observed by lunar and solar occulta-tion spectroscopy, Geophysical Research Letters 28(5): 843–846.
CAA (2010). Volcanic ash, a briefing from the Civil Aviation Authority,https://www.caa.co.uk/docs/2011/VolcanicAshBriefing.pdf. ac-cessed Dec 2011.
Casadevall, T. J. (ed.) (1994). Volcanic Ash and Aviation Safety, Proc. 1stInt. Symp. on Volcanic Ash and Aviation Safety, USGS Bulletin 2047,Washington.
Clarisse, L., Hurtmans, D., Prata, A. J., Karagulian, F., Clerbaux, C.,De Maziere, M. and Coheur, P.-F. (2010). Retrieving radius, concentration,optical depth, and mass of different types of aerosols from high-resolutioninfrared nadir spectra, Applied Optics 49(19): 3713–3722.
Corradini, S., Spinetti, C., Carboni, E., Tirelli, C., Buongiorno, M. F., Pug-naghi, S. and Gangale, G. (2008). Mt. Etna tropospheric ash retrieval andsensitivity analysis using moderate resolution imaging spectroradiometermeasurements, Journal of Applied Remote Sensing 2.
31
Durant, A. J., Bonadonna, C. and Horwell, C. J. (2010). Atmospheric andenvironmental impact of volcanic particulates, Elements 6(4): 235–240.
Edmonds, M., Herd, R., Galle, B. and Oppenheimer, C. (2003). Automated,high time-resolution measurements of so2 flux at Soufriere Hills Volcano,Montserrat, Bulletin of Volcanology 65(8): 578–586.
Egan, W., Hilgeman, T. and Pang, K. (1975). Ultraviolet complex refractive-index of Martian dust - Laboratory measurements of terrestrial analogs,Icarus 25(2): 344–355.
Ellrod, G., Connell, B. and Hillger, D. (2003). Improved detection of air-borne volcanic ash using multispectral infrared satellite data, Journal ofGeophysical Research - Atmospheres 108(D12).
EUMETSAT (2011). EUMETSAT - image gallery, http://oiswww.
eumetsat.org/IPPS/html/MSG/RGB/ASH/ETHIOPIA/index.htm. accessedJune 2011.
European Commission (2010). The Impact of the Volcanic Ash Cloud Crisison the Air Transport Industry, SEC(2010) 533, 27 April, Brussels.
Filizzola, C., Lacava, T., Marchese, F., Pergola, N., Scaffidi, I. and Tramutoli,V. (2007). Assessing RAT (Robust AVHRR Techniques) performancesfor volcanic ash cloud detection and monitoring in near real-time: The2002 eruption of Mt. Etna (Italy), Remote Sensing of the Environment107(3): 440–454.
France-Presse, A. (2011). http://ph.news.yahoo.com/
volcanic-ash-cloud-grounds-more-flights-argentina-161459262.
html. accessed Dec. 2011.
Francis, P. and Rothery, D. (2000). Remote sensing of active volcanoes,Annual Review of Earth and Planetary Sciences 28: 81–106.
Gabrielli, P., Barbante, C., Plane, J. M. C., Boutron, C. F., Jaffrezo, J. L.,Mather, T. A., Stenni, B., Gaspari, V., Cozzi, G., Ferrari, C. and Cescon,P. (2008). Siderophile metal fallout to Greenland from the 1991 wintereruption of Hekla (Iceland) and during the global atmospheric perturbationof Pinatubo, Chemical Geology 255(1-2): 78–86.
Gangale, G., Prata, A. J. and Clarisse, L. (2010). The infrared spectralsignature of volcanic ash determined from high-spectral resolution satellitemeasurements, Remote Sensing of the Environment 114(2): 414–425.
32
Global Volcanism Program (2011a). http://www.volcano.si.edu/world/
volcano.cfm?vnum=1507-15=\&volpage=weekly. accessed Dec. 2011.
Global Volcanism Program (2011b). http://www.volcano.si.edu/world/
volcano.cfm?vnum=0201-101\&volpage=weekly. accessed Dec. 2011.
Global Volcanism Program (2011c). http://www.volcano.si.edu/world/
volcano.cfm?vnum=1702-02=\&volpage=weekly. accessed Dec. 2011.
Hale, G. M. and Querry, M. R. (1973). Optical constants of water in the200-nm to 200-µm wavelength region, Applied Optics 12: 555–563.
Heiken, G. and Wohletz, K. H. (1985). Volcanic ash, University of CaliforniaPress, Berkeley.
Hirn, B., Di Bartola, C. and Ferrucci, F. (2009). Combined use of SEVIRIand MODIS for detecting, measuring, and monitoring active lava flows aterupting volcanoes, IEEE Transactions on Geoscience and Remote Sensing47(8): 2923–2930.
Horwell, C. J. and Baxter, P. J. (2006). The respiratory health hazards ofvolcanic ash: a review for volcanic risk mitigation, Bulletin of Volcanology69(1): 1–24.
Hurley, J., Dudhia, A. and Grainger, R. G. (2009). Cloud detection forMIPAS using singular vector decomposition, Atmospheric MeasurementTechniques 2(2): 533–547.
Hurley, J., Dudhia, A. and Grainger, R. G. (2011). Retrieval of macrophys-ical cloud parameters from MIPAS: algorithm description, AtmosphericMeasurement Techniques 4(4): 683–704.
Ilyinskaya, E., Oppenheimer, C., Mather, T. A., Martin, R. S. and Kyle,P. R. (2010). Size-resolved chemical composition of aerosol emitted byErebus volcano, Antarctica, Geochemistry Geophysics Geosystems 11.
Jones, M. T. and Gislason, S. R. (2008). Rapid releases of metal salts and nu-trients following the deposition of volcanic ash into aqueous environments,Geochemica et Cosmochimica Acta 72(15): 3661–3680.
Krotkov, N. A., Flittner, D. E., Krueger, A. J., Kostinski, A., Riley, C.,Rose, W. and Torres, O. (1999). Effect of particle non-sphericity on satel-lite monitoring of drifting volcanic ash clouds, Journal of QuantitativeSpectroscopy and Radiative Transfer 63(2-6): 613–630.
33
Lean, K. (2009). Empirical methods for detecting atmospheric aerosol eventsfrom satellite measurements, Technical report, Department of Physics, Uni-versity of Oxford.
Luo, B., Krieger, U. K. and Peter, T. (1996). Densities and refractive indicesof H2SO4/HNO3/H2O solutions to stratospheric temperatures, GeophysicalResearch Letters 23(25): 3707–3710.
Martin, R. S., Mather, T. A., Pyle, D. M., Power, M., Allen, A. G., Aiuppa,A., Horwell, C. J. and Ward, E. P. W. (2008). Composition-resolved sizedistributions of volcanic aerosols in the Mt. Etna plumes, Journal of Geo-physical Research 113(D17): D17211.
Martin, R. S., Watt, S. F. L., Pyle, D. M., Mather, T. A., Matthews, N. E.,Georg, R. B., Day, J. A., Fairhead, T., Witt, M. L. I. and Quayle, B. M.(2009). Environmental effects of ashfall in Argentina from the 2008 Chaitenvolcanic eruption, Journal of Volcanology and Geothermal Research 184(3-4): 462–472.
Marzano, F. S., Lamantea, M., Montopoli, M., Fabio, S. D. and Picciotti, E.(2011). The Eyjafjoll explosive volcanic eruption from a microwave weatherradar perspective, Atmospheric Chemistry and Physics 11(18): 9503–9518.
Mather, T. A., Pyle, D. M. and Oppenheimer, C. (2003). TroposphericVolcanic Aerosol, in A. Robock and C. Oppenheimer (eds), Volcanismand the Earth’s Atmosphere, AGU Geophysical Monograph 139, AmericanGeophysical Union, Washington, D.C., pp. 189–212.
Mazzocchi, M., Hansstein, F. and Ragona, M. (2010). The 2010 volcanic ashcloud and its financial impact on the European airline industry, CESifoForum 11: 92–100.
Moroney, C., Davies, R. and Muller, J. P. (2002). Operational retrieval ofcloud-top heights using misr data, IEEE Transactions on Geoscience andRemote Sensing 40: 1532–1540.
Muller, J., Mandanayake, A., Moroney, C., Davies, R., Diner, D. and Par-adise, S. (2002). MISR stereoscopic image matchers: Techniques and re-sults, IEEE Transactions on Geoscience and Remote Sensing 40(7): 1547–1559.
Muller, J. P., Denis, M. A., Dundas, R. D., Mitchell, K. L., Naud, C. andMannstein, H. (2007). Stereo cloud-top heights and cloud fraction retrievalfrom ATSR-2, International Journal of Remote Sensing 28(9): 1921–1938.
34
NASA Earth Observatory (2011). http://earthobservatory.nasa.gov/
IOTD/view.php?id=50996. accessed Dec. 2011.
National Oceanic and Atmospheric Administration, National Aeronauticsand Space Adminsitration and United States Airforce (1976). U.S. Stan-dard Atmosphere, U.S. Government Printing Office, Washington, D.C.
Observatorio Volcanologico de los Andes del Sur (OVDAS)(Chile) (2011).http://www2.sernageomin.cl/ovdas/ovdas7/ovdas66.php. accessedDec. 2011.
Ono, K., Watanabe, K., Hoshizumi, H. and ichiro Ikebe, S. (1995). Ash erup-tion of the Naka-dake crater, Aso volcano, southwestern Japan, Journal ofVolcanology and Geothermal Research 66: 137–148.
Oppenheimer, C. (1998). Volcanological applications of meteorological satel-lites, International Journal of Remote Sensing 19(15): 2829–2864.
Oppenheimer, C., Bani, P., Calkins, J. A., Burton, M. R. and Sawyer, G. M.(2006). Rapid FTIR sensing of volcanic gases released by Strombolianexplosions at Yasur volcano, Vanuatu, Applied Physics B - Lasers andOptics 85(2-3): 453–460.
Oppenheimer, C., Kyle, P., Eisele, F., Crawford, J., Huey, G., Tanner, D.,Kim, S., Mauldin, L., Blake, D., Beyersdorf, A., Buhr, M. and Davis, D.(2010). Atmospheric chemistry of an Antarctic volcanic plume, Journal ofGeophysical Research - Atmospheres 115.
Patterson, E. M. (1981). Measurements of the imaginary part of the refractiveindex between 300 and 700 nanometers for Mount St. Helens ash, Science211(4484): 836–838.
Patterson, E. M. (1994). Optical absorption coefficients of soil-aerosol par-ticles and volcanic ash between 1 and 16 µm, Proceedings of the SecondConference on Atmospheric Radiation, American Meteorological Society,pp. 177–180.
Patterson, E. M., Pollard, C. O. and Galindo, I. (1983). Optical-propertiesof the ashes from El-Chichon volcano, Geophysical Research Letters10(4): 317–320.
Payne, V. H., Noone, D., Dudhia, A., Piccolo, C. and Grainger, R. G. (2007).Global satellite measurements of HDO and implications for understandingthe transport of water vapour into the stratosphere, Quarterly Journal ofthe Royal Meteorological Society 133: 1459–1471.
35
Pollack, J. B., Toon, O. B. and Khare, B. N. (1973). Optical properties ofsome terrestrial rocks and glasses, Icarus 19(3): 372–389.
Poulsen, C. A., Watts, P., Thomas, G. E., Sayer, A. M., Siddans, R.,Grainger, R. G., Lawrence, B. N., Campmany, E., Dean, S. M. andArnold, C. (2011). Cloud retrievals from satellite data using optimal esti-mation: evaluation and application to ATSR, Atmospheric MeasurementTechniques Discussions 4: 2389–2431.
Prata, A. J. (1989a). Infrared radiative transfer calculations for volcanic ashclouds, Geophysical Research Letters 16: 1293–1296.
Prata, A. J. (1989b). Observations of volcanic ash clouds in the 10-12 µmwindow using AVHRR/2 data, International Journal of Remote Sensing10: 751–761.
Prata, A. J., Bluth, G. J. S., Rose, W. I., Schneider, D. J. and Tupper, A. C. .(2001). Comments on “Failures in detecting volcanic ash from a satellite-based technique”, Remote Sensing of the Environment 78: 341–346.
Prata, A. J. and Grant, I. F. (2001). Retrieval of microphysical and morpho-logical properties of volcanic ash plumes from satellite data: Application toMt Ruapehu, New Zealand, Quarterly Journal of the Royal MeteorologicalSociety 127: 2153–2179.
Prata, A. J. and Kerkmann, J. (2007). Simultaneous retrieval of volcanicash and SO(2) using MSG-SEVIRI measurements, Geophysical ResearchLetters 34(5).
Press, W. H., Teukolsky, S. A., Vetterling, W. T. and Flannery, B. P. (1992).Numerical Recipes in C : The Art of Scientific Computing, CambridgeUniversity Press, Cambridge Cambridgeshire New York.
Read, W., Froidevaux, L. and Waters, J. (1993). Microwave limb soundermeasurements of stratospheric SO2 from the Mt Pinatubo volcano, Journalof Geophysical Research 20: 1299–1302.
Riley, C. M., Rose, W. I. and Bluth, G. J. S. (2003). Quantitative shapemeasurements of distal volcanic ash, Journal of Geophysical Research108(B10): 2504.
Rose, W., Bluth, G. and Ernst, G. (2000). Integrating retrievals of volcaniccloud characteristics from satellite remote sensors: a summary, Philosoph-ical Transactions of the Royal Society of London Series A - MathematicalPhysical and Engineering Sciences 358(1770): 1585–1606.
36
Rose, W. I. and Durant, A. J. (2009). Fine ash content of explosive eruptions,Journal of Volcanology and Geothermal Research 186(1-2): 32–39.
Rose, W. I., Gu, Y., Watson, I. M., Yu, T., Bluth, G. J. S., Prata, A. J.,Krueger, A. J., Krotkov, N., Carn, S., Fromm, M. D., Hunton, D. E., Ernst,G. G. J., Viggiano, A. A., Miller, T. M., Ballenthin, J. O., Reeves, J. M.,Wilson, J. C., Anderson, B. E. and Flittner, D. E. (2003). The February-March 2000 eruption of Hekla, Iceland from a satellite perspective, inA. Robock and C. Oppenheimer (eds), Volcanism and Earth’s Atmosphere,AGU Geophysical Monograph 139, American Geophysical Union, Wash-ington, D.C., pp. 107–132.
Rust, A. C. and Cashman, K. V. (2011). Permeability controls on expan-sion and size distributions of pyroclasts, Journal of Geophysical Research116(B11): B11202.
Sawyer, G. M., Oppenheimer, C., Tsanev, V. I. and Yirgu, G. (2008). Mag-matic degassing at Erta ‘Ale volcano, Ethiopia, Journal of Volcanology andGeothermal Research 178(4, SI): 837–846.
Sayer, A. M., Poulsen, C. A., Arnold, C., Campmany, E., Dean, S., Ewen, G.B. L., Grainger, R. G., Lawrence, B. N., Siddans, R., Thomas, G. E. andWatts, P. D. (2011). Global retrieval of ATSR cloud parameters and evalu-ation (GRAPE): dataset assessment, Atmospheric Chemistry and Physics11(8): 3913–3936.
Scandone, R., Cashman, K. V. and Malone, S. D. (2007). Magma supply,magma ascent and the style of volcanic eruptions, Earth and PlanetaryScience Letters 253(3-4): 513–529.
Schmid, R. (1981). Descriptive nomenclature and classification of pyroclasticdeposits and fragments: Recommendations of the iugs subcommission onthe systematics of igneous rocks, Geology 9(1): 41–43.
Seftor, C. J., Hsu, N. C., Herman, J. R., Bhartia, P. K., Torres, O., Rose,W. I., Schneider, D. J. and Krotkov, N. (1997). Detection of volcanicash clouds from Nimbus 7 /total ozone mapping spectrometer, Journal ofGeophysical Research 102: 16749–16759.
Servicio Nacional de Geologia y Mineria (2011a). http://www2.
sernageomin.cl/ovdas/ovdas7/informativos2/Informes/Reportes/
RegionXIV/REAV\_N13\_Los-Rios\_27042011.pdf. accessed Dec. 2011.
37
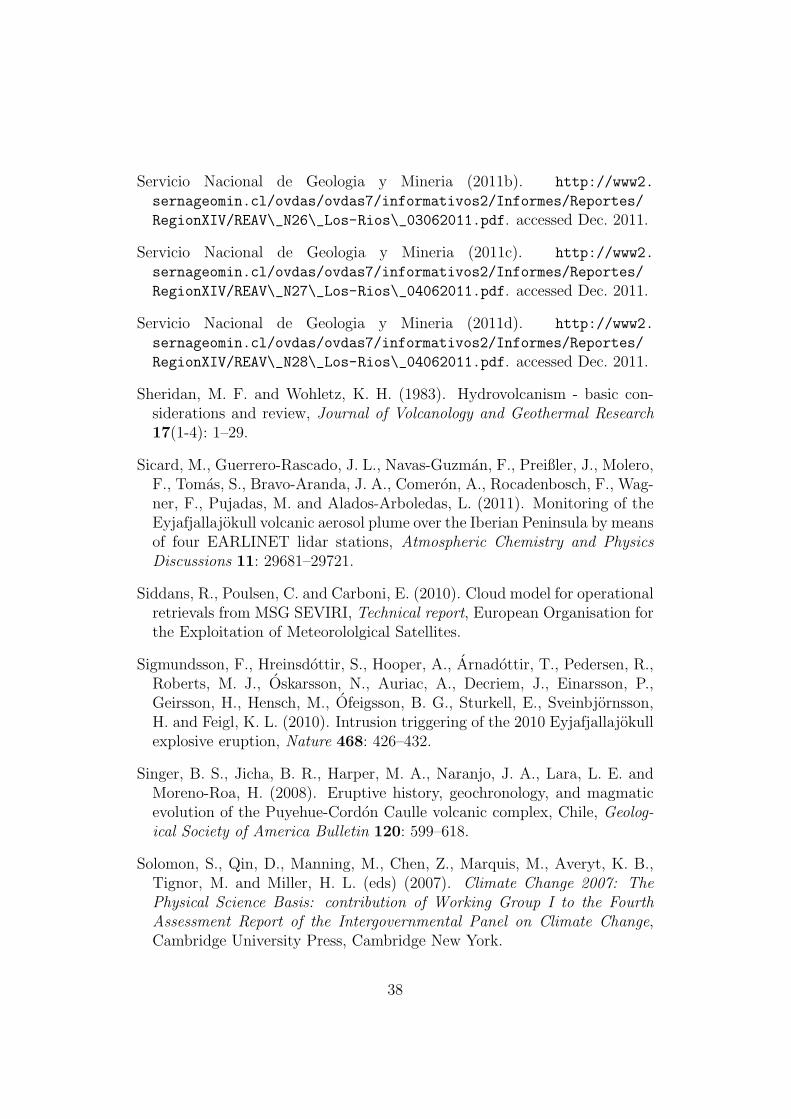
Servicio Nacional de Geologia y Mineria (2011b). http://www2.
sernageomin.cl/ovdas/ovdas7/informativos2/Informes/Reportes/
RegionXIV/REAV\_N26\_Los-Rios\_03062011.pdf. accessed Dec. 2011.
Servicio Nacional de Geologia y Mineria (2011c). http://www2.
sernageomin.cl/ovdas/ovdas7/informativos2/Informes/Reportes/
RegionXIV/REAV\_N27\_Los-Rios\_04062011.pdf. accessed Dec. 2011.
Servicio Nacional de Geologia y Mineria (2011d). http://www2.
sernageomin.cl/ovdas/ovdas7/informativos2/Informes/Reportes/
RegionXIV/REAV\_N28\_Los-Rios\_04062011.pdf. accessed Dec. 2011.
Sheridan, M. F. and Wohletz, K. H. (1983). Hydrovolcanism - basic con-siderations and review, Journal of Volcanology and Geothermal Research17(1-4): 1–29.
Sicard, M., Guerrero-Rascado, J. L., Navas-Guzman, F., Preißler, J., Molero,F., Tomas, S., Bravo-Aranda, J. A., Comeron, A., Rocadenbosch, F., Wag-ner, F., Pujadas, M. and Alados-Arboledas, L. (2011). Monitoring of theEyjafjallajokull volcanic aerosol plume over the Iberian Peninsula by meansof four EARLINET lidar stations, Atmospheric Chemistry and PhysicsDiscussions 11: 29681–29721.
Siddans, R., Poulsen, C. and Carboni, E. (2010). Cloud model for operationalretrievals from MSG SEVIRI, Technical report, European Organisation forthe Exploitation of Meteorololgical Satellites.
Sigmundsson, F., Hreinsdottir, S., Hooper, A., Arnadottir, T., Pedersen, R.,Roberts, M. J., Oskarsson, N., Auriac, A., Decriem, J., Einarsson, P.,Geirsson, H., Hensch, M., Ofeigsson, B. G., Sturkell, E., Sveinbjornsson,H. and Feigl, K. L. (2010). Intrusion triggering of the 2010 Eyjafjallajokullexplosive eruption, Nature 468: 426–432.
Singer, B. S., Jicha, B. R., Harper, M. A., Naranjo, J. A., Lara, L. E. andMoreno-Roa, H. (2008). Eruptive history, geochronology, and magmaticevolution of the Puyehue-Cordon Caulle volcanic complex, Chile, Geolog-ical Society of America Bulletin 120: 599–618.
Solomon, S., Qin, D., Manning, M., Chen, Z., Marquis, M., Averyt, K. B.,Tignor, M. and Miller, H. L. (eds) (2007). Climate Change 2007: ThePhysical Science Basis: contribution of Working Group I to the FourthAssessment Report of the Intergovernmental Panel on Climate Change,Cambridge University Press, Cambridge New York.
38
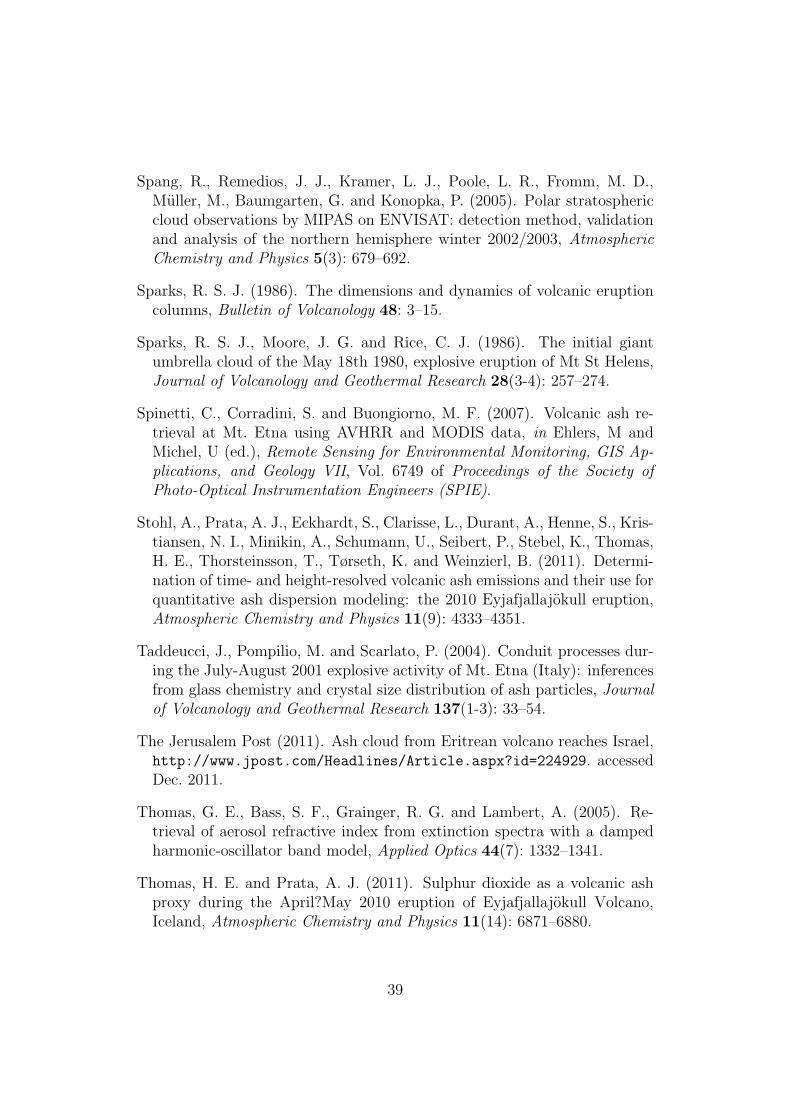
Spang, R., Remedios, J. J., Kramer, L. J., Poole, L. R., Fromm, M. D.,Muller, M., Baumgarten, G. and Konopka, P. (2005). Polar stratosphericcloud observations by MIPAS on ENVISAT: detection method, validationand analysis of the northern hemisphere winter 2002/2003, AtmosphericChemistry and Physics 5(3): 679–692.
Sparks, R. S. J. (1986). The dimensions and dynamics of volcanic eruptioncolumns, Bulletin of Volcanology 48: 3–15.
Sparks, R. S. J., Moore, J. G. and Rice, C. J. (1986). The initial giantumbrella cloud of the May 18th 1980, explosive eruption of Mt St Helens,Journal of Volcanology and Geothermal Research 28(3-4): 257–274.
Spinetti, C., Corradini, S. and Buongiorno, M. F. (2007). Volcanic ash re-trieval at Mt. Etna using AVHRR and MODIS data, in Ehlers, M andMichel, U (ed.), Remote Sensing for Environmental Monitoring, GIS Ap-plications, and Geology VII, Vol. 6749 of Proceedings of the Society ofPhoto-Optical Instrumentation Engineers (SPIE).
Stohl, A., Prata, A. J., Eckhardt, S., Clarisse, L., Durant, A., Henne, S., Kris-tiansen, N. I., Minikin, A., Schumann, U., Seibert, P., Stebel, K., Thomas,H. E., Thorsteinsson, T., Tørseth, K. and Weinzierl, B. (2011). Determi-nation of time- and height-resolved volcanic ash emissions and their use forquantitative ash dispersion modeling: the 2010 Eyjafjallajokull eruption,Atmospheric Chemistry and Physics 11(9): 4333–4351.
Taddeucci, J., Pompilio, M. and Scarlato, P. (2004). Conduit processes dur-ing the July-August 2001 explosive activity of Mt. Etna (Italy): inferencesfrom glass chemistry and crystal size distribution of ash particles, Journalof Volcanology and Geothermal Research 137(1-3): 33–54.
The Jerusalem Post (2011). Ash cloud from Eritrean volcano reaches Israel,http://www.jpost.com/Headlines/Article.aspx?id=224929. accessedDec. 2011.
Thomas, G. E., Bass, S. F., Grainger, R. G. and Lambert, A. (2005). Re-trieval of aerosol refractive index from extinction spectra with a dampedharmonic-oscillator band model, Applied Optics 44(7): 1332–1341.
Thomas, H. E. and Prata, A. J. (2011). Sulphur dioxide as a volcanic ashproxy during the April?May 2010 eruption of Eyjafjallajokull Volcano,Iceland, Atmospheric Chemistry and Physics 11(14): 6871–6880.
39

Thomas, H. E. and Watson, I. M. (2010). Observations of volcanic emissionsfrom space: current and future perspectives, Natural Hazards 54(2): 323–354.
Toon, O. B., Pollack, J. B. and Sagan, C. (1977). Physical propertiesof the particles composing the Martian dust storm of 1971-1972, Icarus30(4): 663–696.
USGS Earthquake Hazards Program (2011). http://earthquake.usgs.
gov/. accessed Dec. 2011.
Volz, F. E. (1973). Infrared optical constants of ammonium sulfate, Saharadust, volcanic pumice and flyash, Applied Optics 12: 564–568.
Walker, J. C., Carboni, E., Dudhia, A. and Grainger, R. G. (2012). Improveddetection of sulphur dioxide in volcanic plumes using satellite-based hyper-spectral infrared measurements: Application to the Eyjafjallajokull 2010eruption, Journal of Geophysical Research - Atmospheres .
Warren, S. G. and Brandt, R. E. (2008). Optical constants of ice from the ul-traviolet to the microwave: A revised compilation, Journal of GeophysicalResearch 113(D14): D14220.
Watts, P. D., Bennartz, R. and Fell, F. (2011). Retrieval of two-layer cloudproperties from multispectral observations using optimal estimation, Jour-nal of Geophysical Research 116(D16): D16203.
Wen, S. and Rose, W. I. (1994). Retrieval of sizes and total masses of particlesin volcanic clouds using AVHRR bands 4 and 5, Journal of GeophysicalResearch 99(D3): 5421–5431.
Wiart, P. and Oppenheimer, C. (2005). Large magnitude silicic volcanism innorth Afar: the Nabro volcanic range and Ma’alalta volcano, Bulletin ofVolcanology 67: 99–115.
Witham, C. S., Hort, M. C., Potts, R., Servranckx, R., Husson, P. and Bon-nardot, F. (2007). Comparison of VAAC atmospheric dispersion modelsusing the 1 November 2004 Grimsvotn eruption, Meteorological Applica-tions 14(1): 27–38.
Wooster, M. J. and Rothery, D. A. (1997). Thermal monitoring of Lascar Vol-cano, Chile, using infrared data from the along-track scanning radiometer:A 1992-1995 time series, Bulletin of Volcanology 58(7): 566–579.
40

Wooster, M., Rothery, D. A., Coltelli, M. and Buongiorno, M. F. (2000). Hightemperature thermal activity from MSG SEVIRI: volcanoes and fires, inR. A. Harris (ed.), First MSG RAO Workshop, held 17-19 May, 2000, atCNR, Bologna, Italy, European Space Agency ESASP-452.
Yu, T. X., Rose, W. I. and Prata, A. J. (2002). Atmospheric correction forsatellite-based volcanic ash mapping and retrievals using “split window” IRdata from GOES and AVHRR, Journal of Geophysical Research 107(D16).
Yuan, T., Remer, L. A. and Yu, H. (2011). Microphysical, macrophysical andradiative signatures of volcanic aerosols in trade wind cumulus observedby the A-Train, Atmospheric Chemistry and Physics 11(14): 7119–7132.
Zehner, C. (ed.) (2012). Monitoring Volcanic Ash from Space. Proceedings ofthe ESA-EUMETSAT workshop on the 14 April to 23 May 2010 eruptionat the Eyjafjoll volcano, South Iceland, ESA STM-280, European SpaceAgency.
41

Table 1: Existing measurements of volcanic ash spectral complex refractiveindices (m = n− ik).Ash Sample Refractive Index Spectral Range Reference
Component (µm)Mt. Spur n and k 0.34, 0.36, 0.38 Krotkov et al.
(1999)Mt. St. Helens k only 0.3-0.7 Patterson
(1981)Mayon k only 1-16 Patterson
(1994)El Chichon k only 0.3-0.7 Patterson
et al. (1983)
Table 2: Eruption quantified using the brightness temperature difference.Instrument Eruption re (µm) ReferenceATSR-2 Mt Ruapehu, 1996 3 - 5.1a Prata and Grant (2001)AVHRR Mt. Galunggung, July
1982Prata (1989a,b)
AVHRR El Chichon, 1982 4 - 8 Rose et al. (2000)AVHRR Cerro Hudson, 1991 6 - 9 Rose et al. (2000)AVHRR Mt Spurr, August
19922.4 - 3.15 Wen and Rose (1994)
AVHRR Mt Spurr, August1992
0.5 - 6 Yu et al. (2002)
AVHRR Mt Spurr, August1992
Krotkov et al. (1999)
AVHRR Mt Etna, November2006
Spinetti et al. (2007)
AVHRR Mt Etna, October2002
Filizzola et al. (2007)
GOES Montserrat, December1997
0.6 - 6 Yu et al. (2002)
MODIS Mt Etna, November2006
1.6 - 3.3 Spinetti et al. (2007);Corradini et al. (2008)
aParticle radii have been estimated from the reported mean radii by multiplying by
1.5; this is based on assuming a log-normal distribution with a spread of 1.5.
42
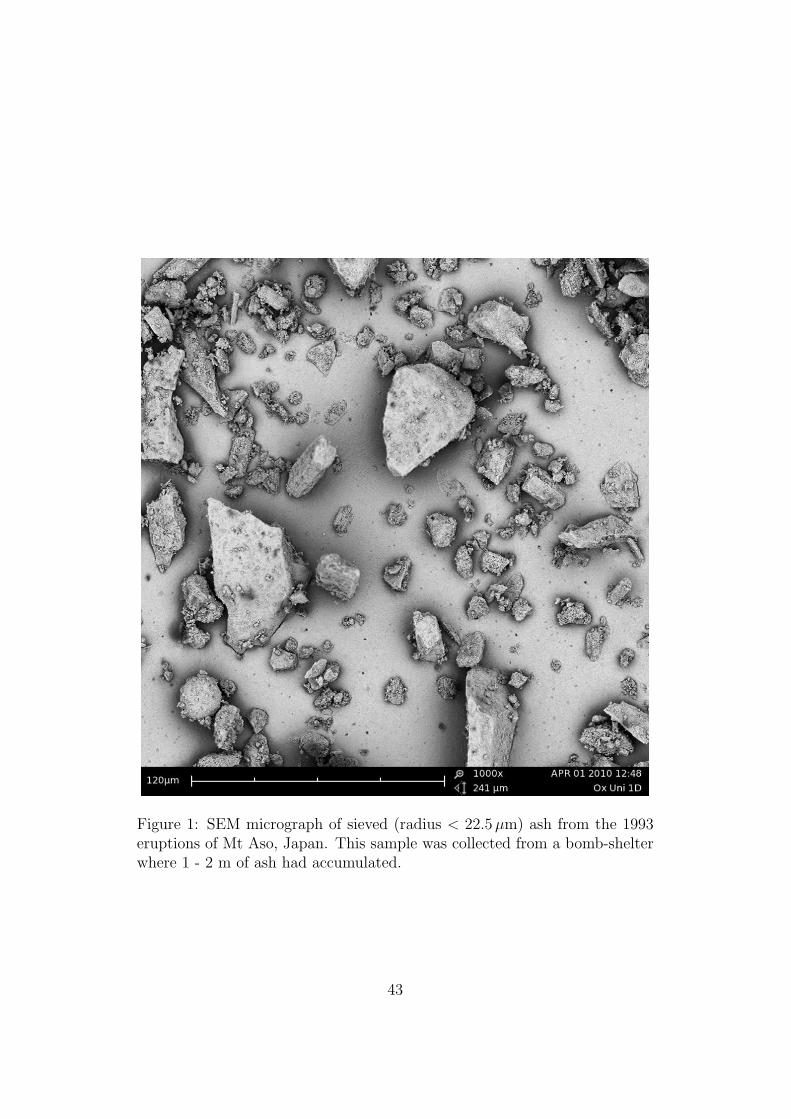
Figure 1: SEM micrograph of sieved (radius < 22.5µm) ash from the 1993eruptions of Mt Aso, Japan. This sample was collected from a bomb-shelterwhere 1 - 2 m of ash had accumulated.
43

0.1 1.0 10.0 100.0Particle radius (µm)
0
10
20
30
Alti
tude
(km
)
1 ho
ur
1 da
y
1 da
y1
wee
k
1 wee
k
1 y
ear
1 y
ear
Figure 2: Fallout time calculated for spherical particles (density of2.4 g cm−3) as a function of particle radius and injection height based onthe US Standard Atmosphere 1976 (National Oceanic and Atmospheric Ad-ministration, National Aeronautics and Space Adminsitration and UnitedStates Airforce; 1976).
Figure 3: Simplified diagram of experimental configuration.
44
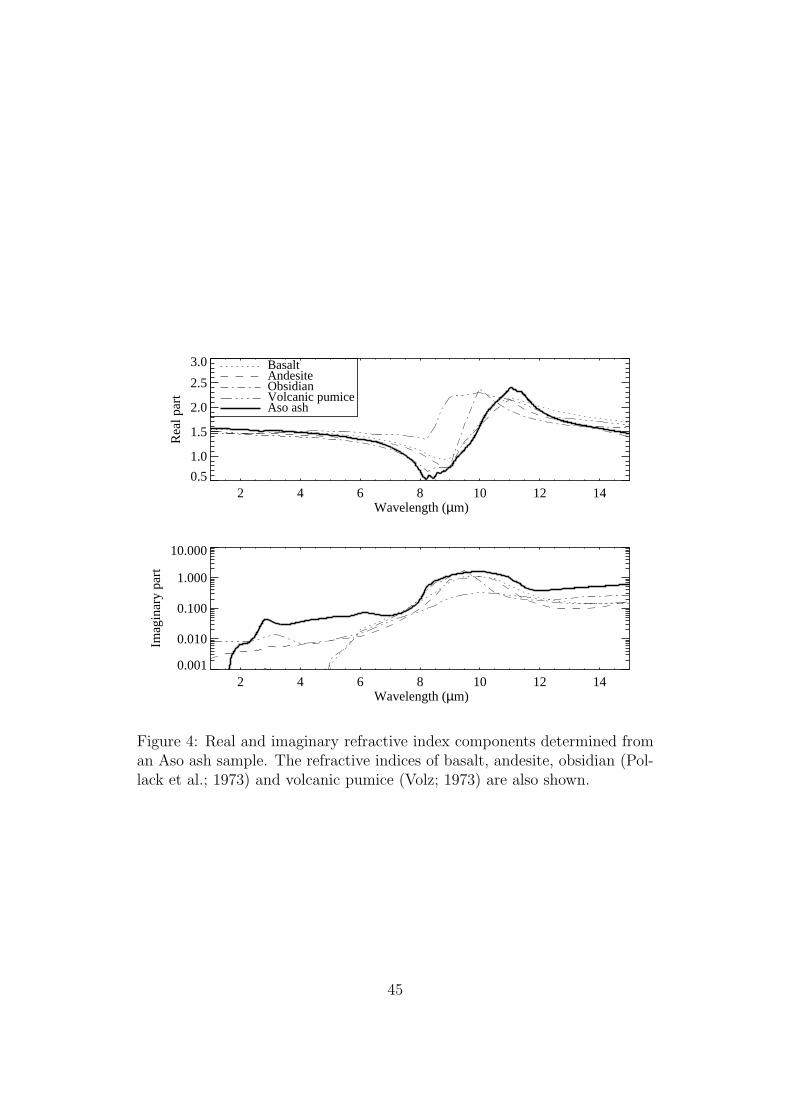
2 4 6 8 10 12 14Wavelength (µm)
0.5
1.0
1.5
2.0
2.5
3.0
Rea
l par
t
BasaltAndesiteObsidianVolcanic pumiceAso ash
2 4 6 8 10 12 14Wavelength (µm)
0.001
0.010
0.100
1.000
10.000
Imag
inar
y pa
rt
Figure 4: Real and imaginary refractive index components determined froman Aso ash sample. The refractive indices of basalt, andesite, obsidian (Pol-lack et al.; 1973) and volcanic pumice (Volz; 1973) are also shown.
45

0.0
0.1
0.2
0.3
0.4
Opt
ical
dep
th
1 2 3 4 5 6 7 Wavelength (µm)
30000 3000 Wavenumber (cm−1)
1400 1200 1000 800 600
10 15 20
AATSRSEVIRIMIPAS
− − Aso ash
− − Sulphuric acid
− − Water ice
− − Water
Figure 5: Simulated optical thickness for a 100 m thick plume consistingof a lognormal distribution ( N0 = 2 × 102 cm−3, rm = 1 µm, S = 1.7) ofspherical particles. The plume is assumed to consist of Aso ash (using thepreliminary refractive indices), sulphuric acid (refractive indices from Luoet al.; 1996), water ice (refractive indices from Warren and Brandt; 2008)and water (refractive indices from Hale and Querry; 1973). The black linesat the top of the plot indicate the AATSR and SEVIRI channels and theMIPAS spectral range.
46

0.0
0.1
0.2
0.3
0.4
Opt
ical
dep
th
1 2 3 4 5 6 7 Wavelength (µm)
30000 3000 Wavenumber (cm−1)
1400 1200 1000 800 600
10 15 20
AATSRSEVIRIMIPAS
− − Basalt
− − Andesite
− − Obsidian
− − Volcanic pumice
− − Aso ash
Figure 6: Optical depth as a function of wavenumber for a 100 m thick ashplume consisting of a lognormal distribution (N0 = 2, 102 cm−3, rm = 1 µm,S = 1.7) of spherical particles of different composition. The chosen sizedistribution and plume thickness gives a column loading of 3.7 gm−2. Re-fractive index data is from, Pollack et al. (1973) for basaltic glass, andesiteand obsidian) and from Volz (1973) for pumice. The Aso values used therefractive indices given earlier. The black lines at the top of the plot indicatethe AATSR and SEVIRI channels and the MIPAS spectral range.
47
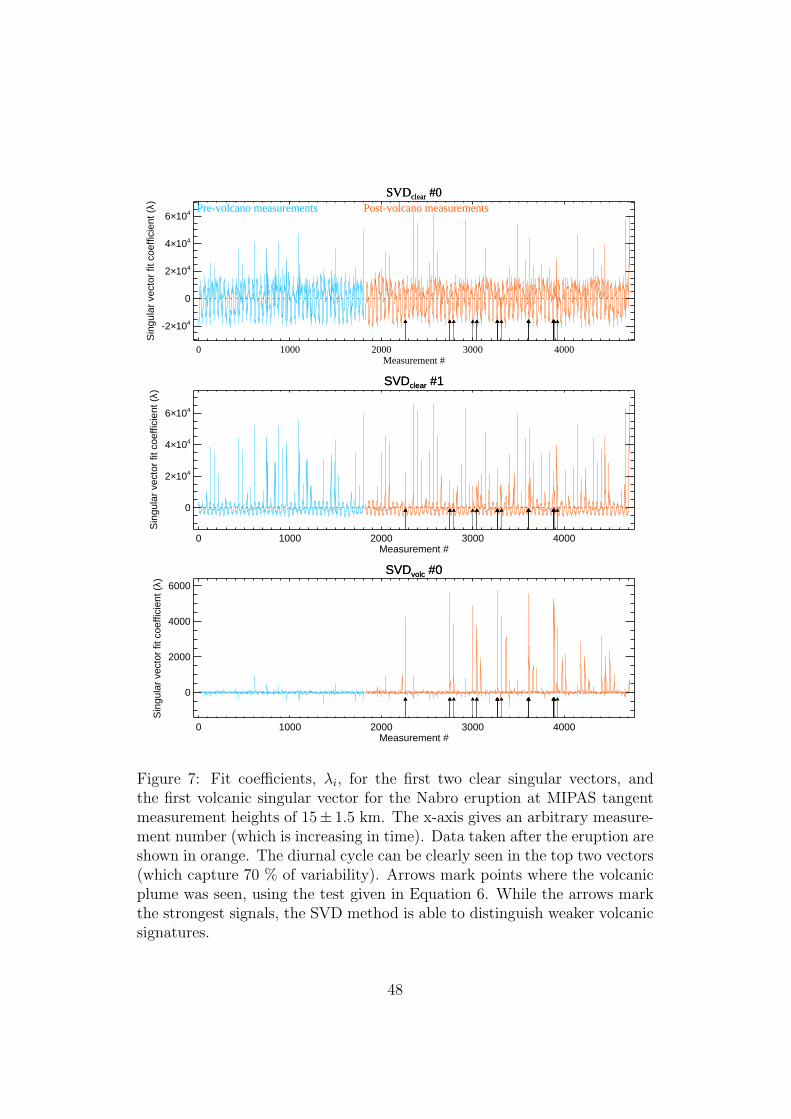
SVDclear #0Pre-volcano measurements Post-volcano measurements
SVDclear #0
0 1000 2000 3000 4000Measurement #
-2×10⁴
0
2×10⁴
4×10⁴
6×10⁴
Sin
gula
r ve
ctor
fit c
oeffi
cien
t (λ)
SVDclear #1SVDclear #1
0 1000 2000 3000 4000Measurement #
0
2×10⁴
4×10⁴
6×10⁴
Sin
gula
r ve
ctor
fit c
oeffi
cien
t (λ)
SVDvolc #0SVDvolc #0
0 1000 2000 3000 4000Measurement #
0
2000
4000
6000
Sin
gula
r ve
ctor
fit c
oeffi
cien
t (λ)
Figure 7: Fit coefficients, λi, for the first two clear singular vectors, andthe first volcanic singular vector for the Nabro eruption at MIPAS tangentmeasurement heights of 15± 1.5 km. The x-axis gives an arbitrary measure-ment number (which is increasing in time). Data taken after the eruption areshown in orange. The diurnal cycle can be clearly seen in the top two vectors(which capture 70 % of variability). Arrows mark points where the volcanicplume was seen, using the test given in Equation 6. While the arrows markthe strongest signals, the SVD method is able to distinguish weaker volcanicsignatures.
48

Figure 8: A combined AATSR-MERIS false colour image of the Puyehue-Cordn Caulle eruption plume taken at 14:01 GMT on the 6th June 2011.The central section of the image shows the AATSR nadir view, with theMERIS image providing context. The volcano itself is located in the left-hand section of the MERIS image, and the coast of Argentina is visible onthe right. North is approximately towards the top of the image.
49

Figure 9: (a) The pixels determined to be ash from the AATSR image shownin Figure 16. Red denotes pixels detected in the nadir view only, green in theforward view only and yellow in both. The parallax between the two viewsis clear in the main northern plume, but, as one would expect, it is muchless evident in the southern (much lower) plume. (b) The stereo-retrievedash height from the ash plume shown in Figure 16.
50
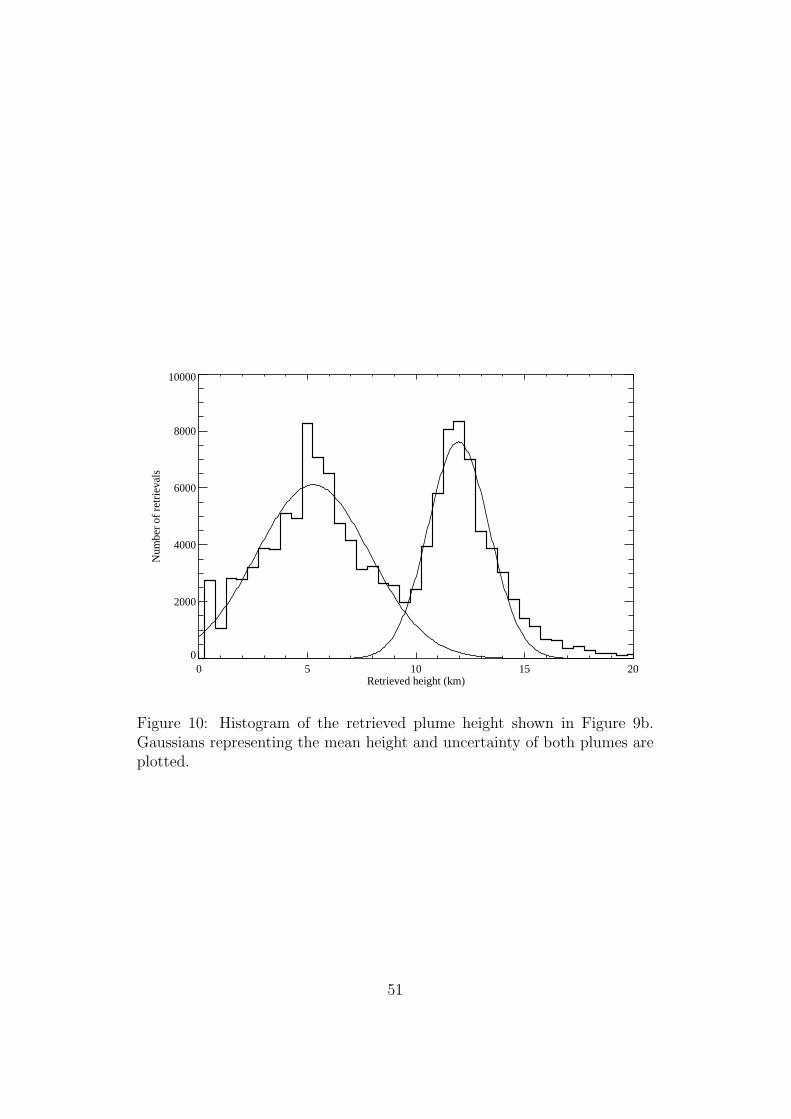
0 5 10 15 20Retrieved height (km)
0
2000
4000
6000
8000
10000
Num
ber
of r
etri
eval
s
Figure 10: Histogram of the retrieved plume height shown in Figure 9b.Gaussians representing the mean height and uncertainty of both plumes areplotted.
51
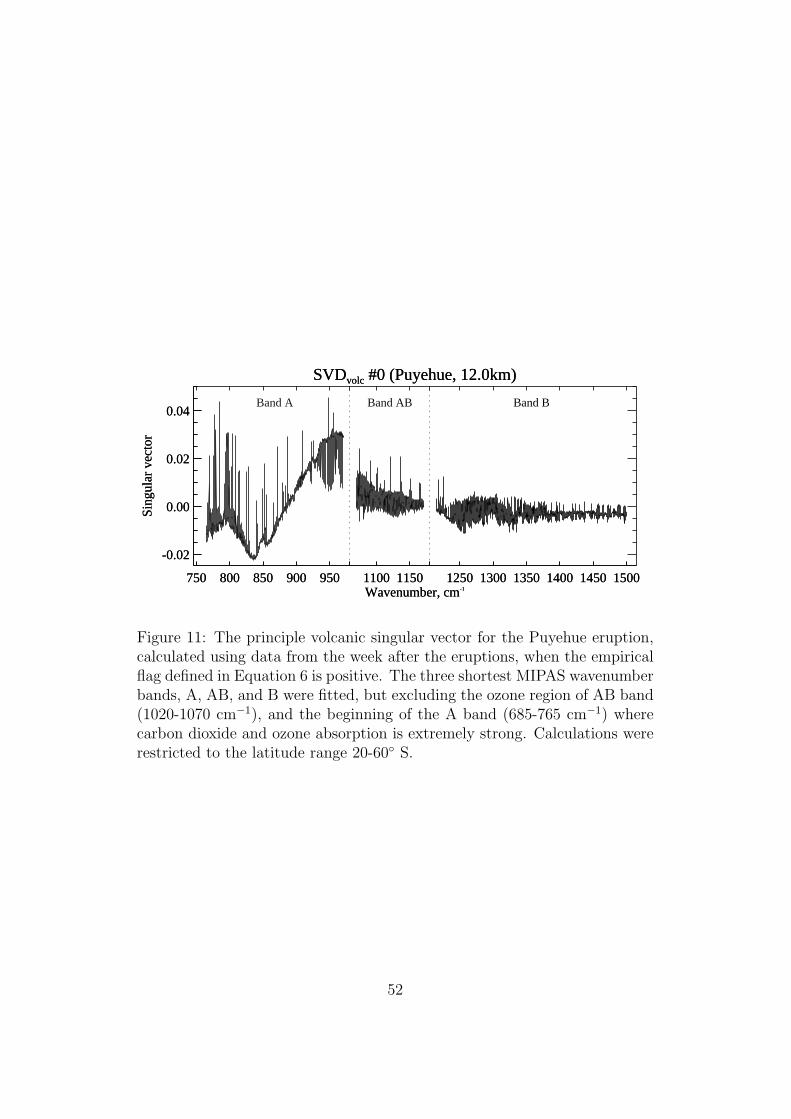
SVDvolc #0 (Puyehue, 12.0km)
750 800 850 900 950 1100 1150 1250 1300 1350 1400 1450 1500Wavenumber, cm-1
-0.02
0.00
0.02
0.04
Sing
ular
vec
tor
Band A Band AB Band B
SVDvolc #0 (Puyehue, 12.0km)
750 800 850 900 950 1100 1150 1250 1300 1350 1400 1450 1500Wavenumber, cm-1
-0.02
0.00
0.02
0.04
Sing
ular
vec
tor
Figure 11: The principle volcanic singular vector for the Puyehue eruption,calculated using data from the week after the eruptions, when the empiricalflag defined in Equation 6 is positive. The three shortest MIPAS wavenumberbands, A, AB, and B were fitted, but excluding the ozone region of AB band(1020-1070 cm−1), and the beginning of the A band (685-765 cm−1) wherecarbon dioxide and ozone absorption is extremely strong. Calculations wererestricted to the latitude range 20-60◦ S.
52
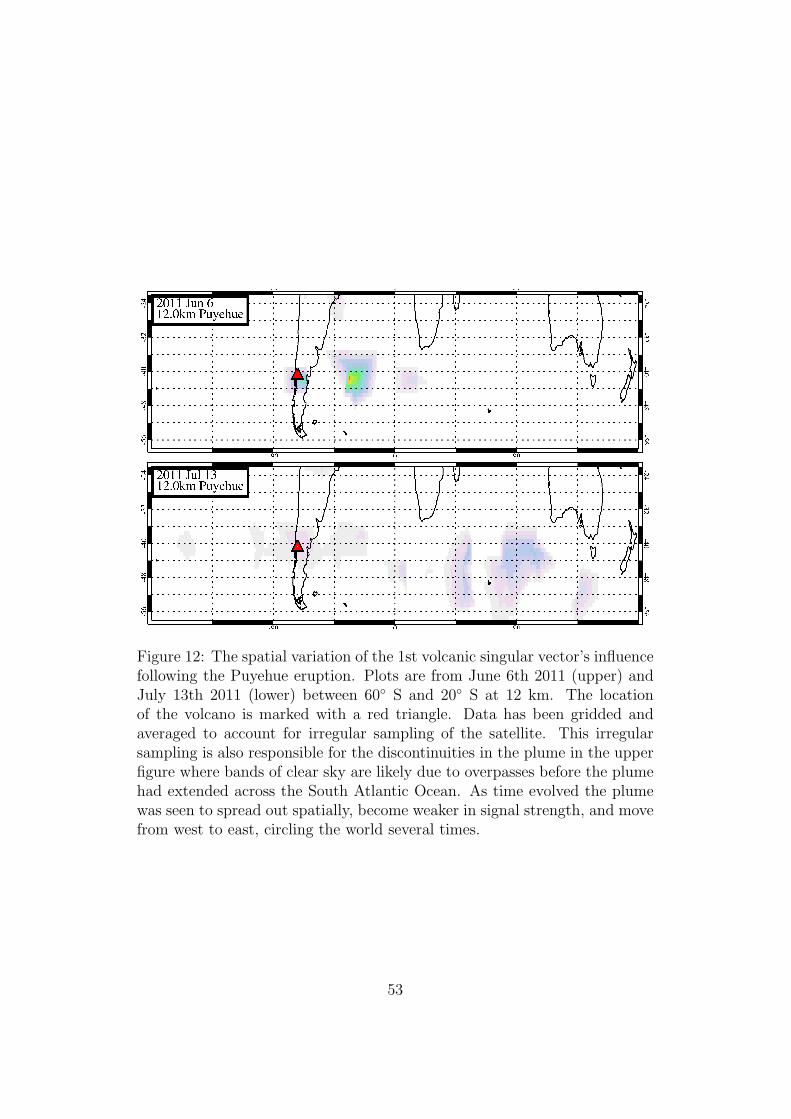
Figure 12: The spatial variation of the 1st volcanic singular vector’s influencefollowing the Puyehue eruption. Plots are from June 6th 2011 (upper) andJuly 13th 2011 (lower) between 60◦ S and 20◦ S at 12 km. The locationof the volcano is marked with a red triangle. Data has been gridded andaveraged to account for irregular sampling of the satellite. This irregularsampling is also responsible for the discontinuities in the plume in the upperfigure where bands of clear sky are likely due to overpasses before the plumehad extended across the South Atlantic Ocean. As time evolved the plumewas seen to spread out spatially, become weaker in signal strength, and movefrom west to east, circling the world several times.
53
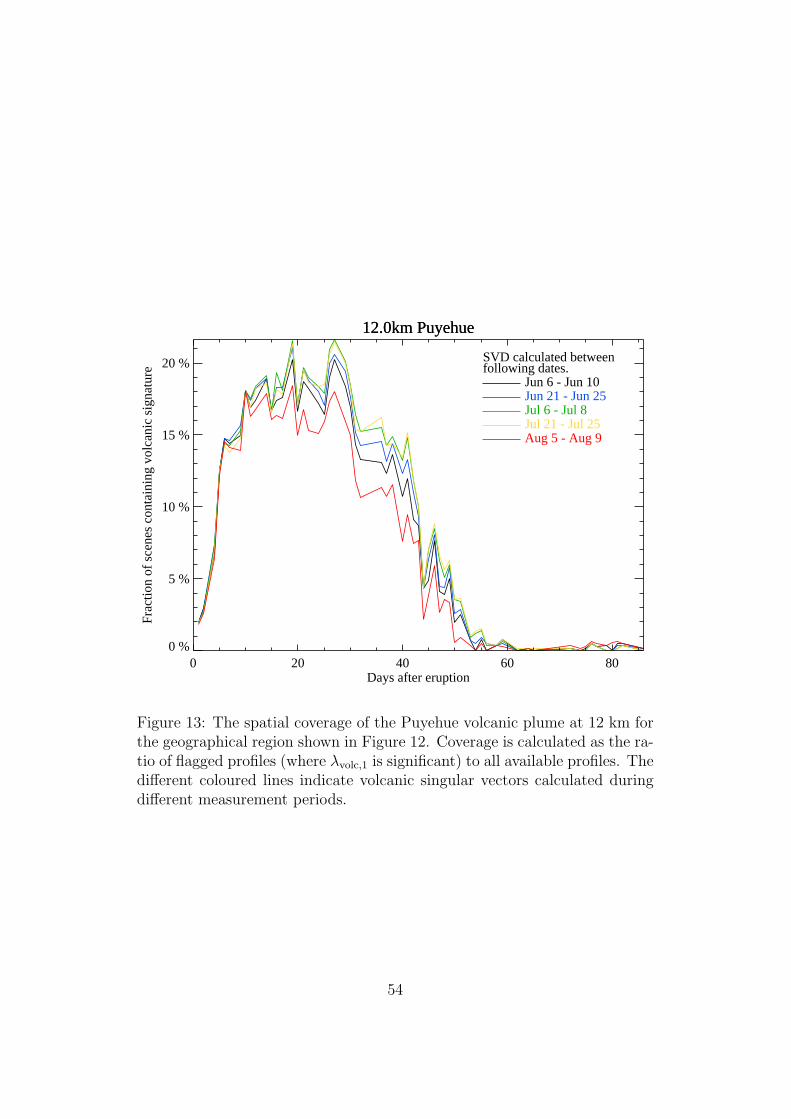
12.0km Puyehue12.0km Puyehue
0 20 40 60 80Days after eruption
0 %
5 %
10 %
15 %
20 %
Frac
tion
of s
cene
s co
ntai
ning
vol
cani
c si
gnat
ure
Jun 6 - Jun 10Jun 21 - Jun 25Jul 6 - Jul 8Jul 21 - Jul 25Aug 5 - Aug 9
SVD calculated between following dates.
Figure 13: The spatial coverage of the Puyehue volcanic plume at 12 km forthe geographical region shown in Figure 12. Coverage is calculated as the ra-tio of flagged profiles (where λvolc,1 is significant) to all available profiles. Thedifferent coloured lines indicate volcanic singular vectors calculated duringdifferent measurement periods.
54
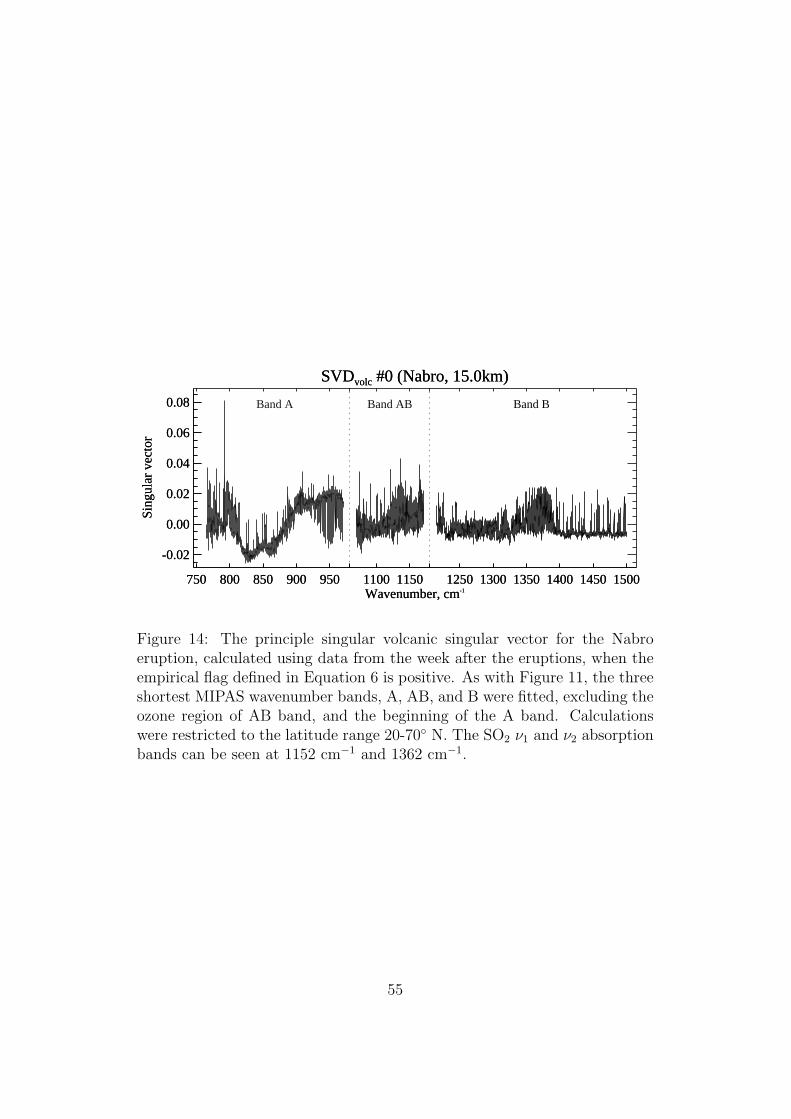
SVDvolc #0 (Nabro, 15.0km)
750 800 850 900 950 1100 1150 1250 1300 1350 1400 1450 1500Wavenumber, cm-1
-0.02
0.00
0.02
0.04
0.06
0.08
Sing
ular
vec
tor
Band A Band AB Band B
SVDvolc #0 (Nabro, 15.0km)
750 800 850 900 950 1100 1150 1250 1300 1350 1400 1450 1500Wavenumber, cm-1
-0.02
0.00
0.02
0.04
0.06
0.08
Sing
ular
vec
tor
Figure 14: The principle singular volcanic singular vector for the Nabroeruption, calculated using data from the week after the eruptions, when theempirical flag defined in Equation 6 is positive. As with Figure 11, the threeshortest MIPAS wavenumber bands, A, AB, and B were fitted, excluding theozone region of AB band, and the beginning of the A band. Calculationswere restricted to the latitude range 20-70◦ N. The SO2 ν1 and ν2 absorptionbands can be seen at 1152 cm−1 and 1362 cm−1.
55
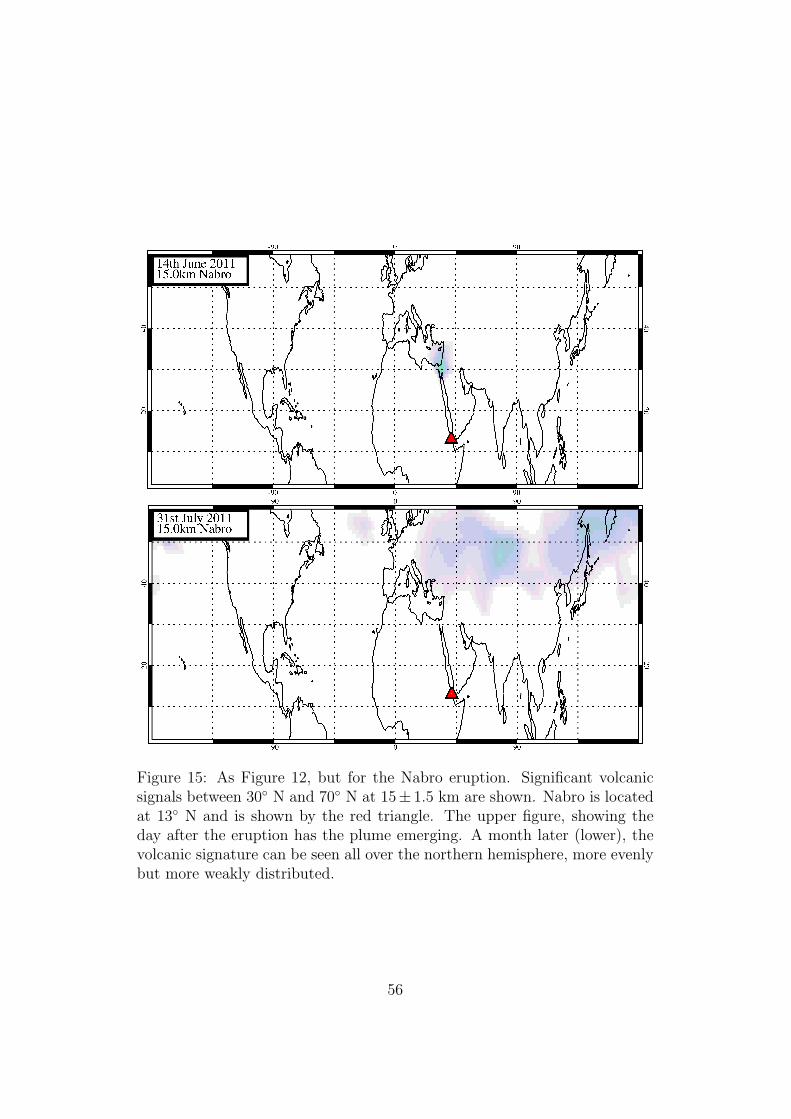
Figure 15: As Figure 12, but for the Nabro eruption. Significant volcanicsignals between 30◦ N and 70◦ N at 15± 1.5 km are shown. Nabro is locatedat 13◦ N and is shown by the red triangle. The upper figure, showing theday after the eruption has the plume emerging. A month later (lower), thevolcanic signature can be seen all over the northern hemisphere, more evenlybut more weakly distributed.
56
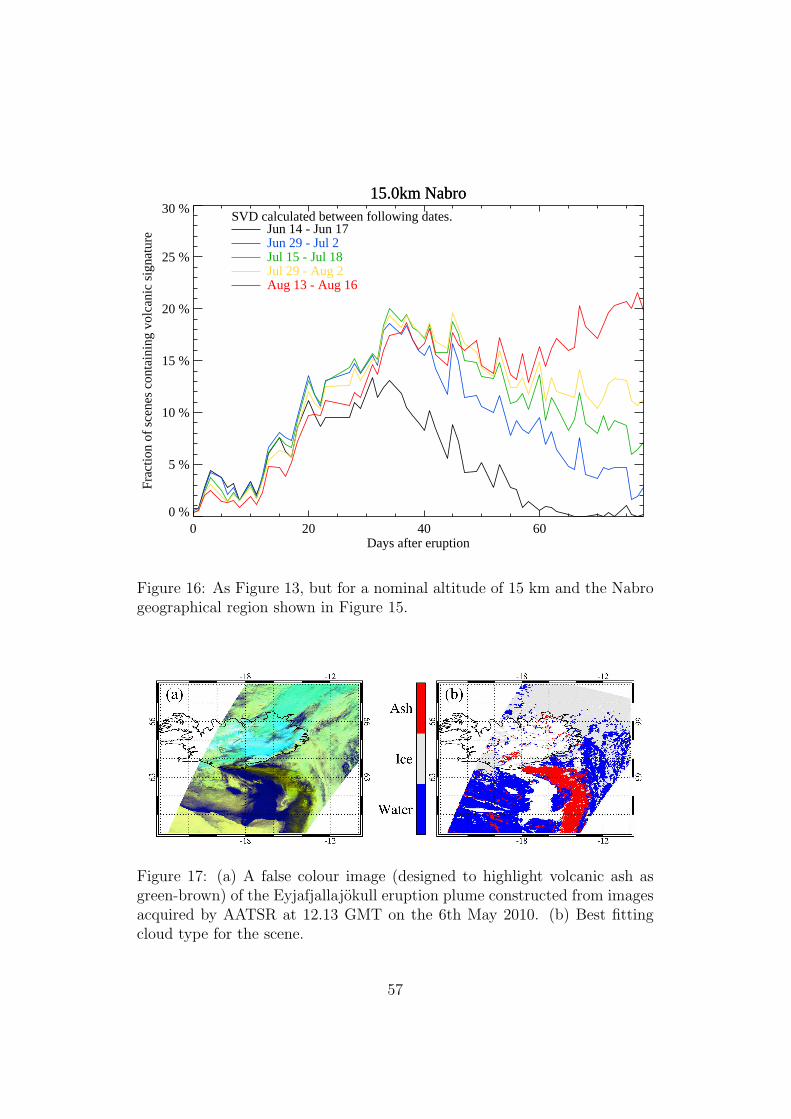
15.0km Nabro15.0km Nabro
0 20 40 60Days after eruption
0 %
5 %
10 %
15 %
20 %
25 %
30 %
Frac
tion
of s
cene
s co
ntai
ning
vol
cani
c si
gnat
ure Jun 14 - Jun 17
Jun 29 - Jul 2Jul 15 - Jul 18Jul 29 - Aug 2Aug 13 - Aug 16
SVD calculated between following dates.
Figure 16: As Figure 13, but for a nominal altitude of 15 km and the Nabrogeographical region shown in Figure 15.
Figure 17: (a) A false colour image (designed to highlight volcanic ash asgreen-brown) of the Eyjafjallajokull eruption plume constructed from imagesacquired by AATSR at 12.13 GMT on the 6th May 2010. (b) Best fittingcloud type for the scene.
57

Figure 18: The retrieved (a) optical depth, (b) cloud-top height, (c) effectiveradius and (d) retrieval cost for those pixels identified as ash.
58

-18 -12
-18 -12
6366
6366
0.0
2.5
5.0
7.5
10.0
12.5
15.0
Ash
mas
s (g
/m2 )
Figure 19: Ash mass density for the 6th May 2010.
59
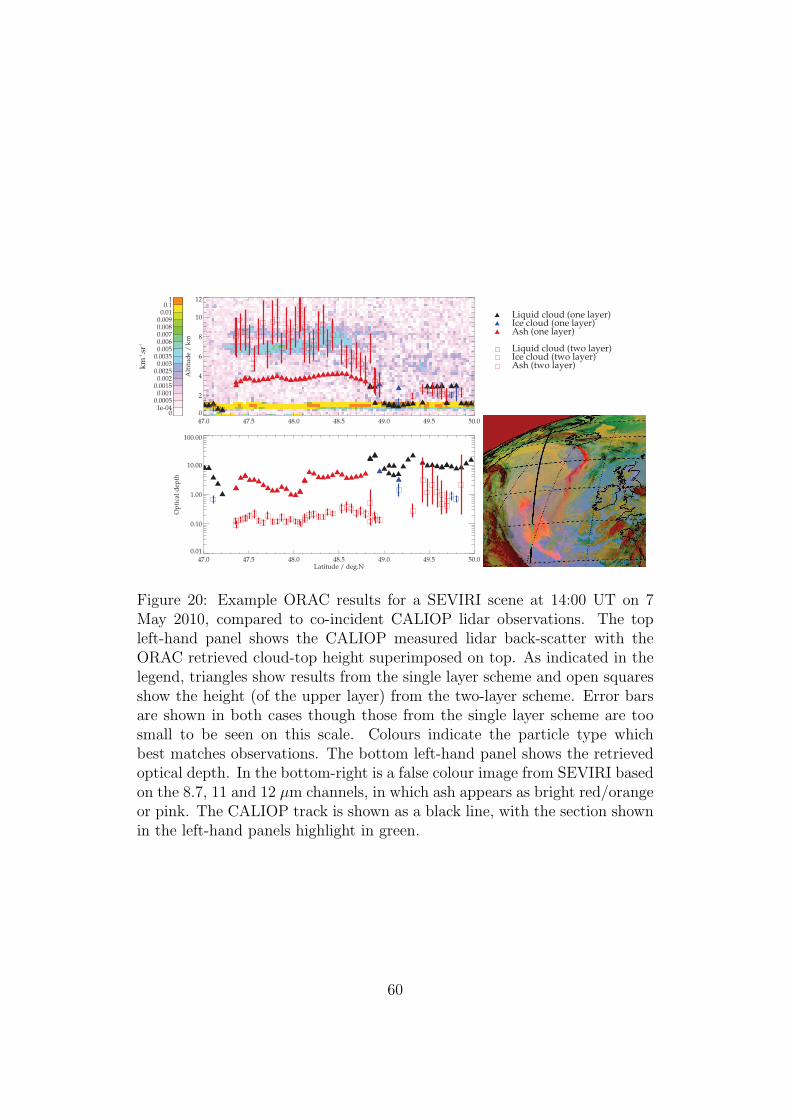
01e-04
0.00050.001
0.00150.002
0.00250.003
0.00350.0050.0060.0070.0080.0090.010.1
1
47.0 47.5 48.0 48.5 49.0 49.5 50.0
0
2
4
6
8
10
12
A
ltit
ud
e /
km
Liquid cloud (one layer)Ice cloud (one layer)Ash (one layer)
Liquid cloud (two layer)Ice cloud (two layer)Ash (two layer)k
m-1.s
r-1
47.0 47.5 48.0 48.5 49.0 49.5 50.0Latitude / deg.N
0.01
0.10
1.00
10.00
100.00
Op
tica
l d
epth
Figure 20: Example ORAC results for a SEVIRI scene at 14:00 UT on 7May 2010, compared to co-incident CALIOP lidar observations. The topleft-hand panel shows the CALIOP measured lidar back-scatter with theORAC retrieved cloud-top height superimposed on top. As indicated in thelegend, triangles show results from the single layer scheme and open squaresshow the height (of the upper layer) from the two-layer scheme. Error barsare shown in both cases though those from the single layer scheme are toosmall to be seen on this scale. Colours indicate the particle type whichbest matches observations. The bottom left-hand panel shows the retrievedoptical depth. In the bottom-right is a false colour image from SEVIRI basedon the 8.7, 11 and 12 µm channels, in which ash appears as bright red/orangeor pink. The CALIOP track is shown as a black line, with the section shownin the left-hand panels highlight in green.
60