measuring the productivity impacts of …v can gain 2.5 hours/driver, year and 0.5 hours/driver,...
TRANSCRIPT

A dissertation submitted to the Department of Environmental Sciences and Policy of
Central European University in part fulfilment of the
Degree of Doctor of Philosophy
MEASURING THE PRODUCTIVITY
IMPACTS OF ENERGY EFFICIENCY MEASURES
Supervisor: Prof. Diana Ürge-Vorsatz (CEU)
Internal member: Prof. Laszlo Pinter (CEU)
External members: Prof. Joyashree Roy,
Professor of Economics, Jadavpur University, and
Dr. Sergio Tirado-Herrero,
Marie Curie Research Fellow,
Institut de Ciència i Tecnologia Ambientals (ICTA),
Universitat Autònoma de Barcelona (UAB)
Souran CHATTERJEE
August, 2018
Budapest
CE
UeT
DC
olle
ctio
n

ii
Notes on copyright and the ownership of intellectual property rights:
[1]. Copyright in text of this thesis rests with the Author. Copies (by any process) either in
full, or of extracts, may be made only in accordance with instructions given by the
Author and lodged in the Central European University Library. Details may be obtained
from the Librarian. This page must form part of any such copies made. Further copies
(by any process) of copies made in accordance with such instructions may not be made
without the permission (in writing) of the Author.
[2]. The ownership of any intellectual property rights which may be described in this thesis
is vested in the Central European University, subject to any prior agreement to the
contrary, and may not be made available for use by third parties without the written
permission of the University, which will prescribe the terms and conditions of any such
agreement.
[3]. For bibliographic and reference purposes this thesis should be referred to as:
Chatterjee, S. 2018. “Measuring the productivity impacts of energy efficiency
measures”. Doctoral dissertation, Department of Environmental Sciences and Policy,
Central European University, Budapest.
Further information on the conditions under which disclosures and exploitation may
take place is available from the Head of Department of Environmental Sciences and
Policy.
CE
UeT
DC
olle
ctio
n

iii
Author’s declaration
No portion of the work referred to in the thesis has been submitted in support of an application
for another degree or qualification of this or any other university or other institute of learning.
Furthermore, this dissertation contains no materials previously written and/or published by
another person, except where appropriate acknowledgment is made in the form of
bibliographical reference, etc.
Souran CHATTERJEE
CE
UeT
DC
olle
ctio
n

iv
THE CENTRAL EUROPEAN UNIVERSITY
ABSTRACT OF DISSERTATION submitted by:
Souran, CHATTERJEE for the degree of Doctor of Philosophy and entitled: “Measuring
the productivity impacts of energy efficiency measures”.
Month and Year of submission: August, 2018
Sustainable energy policies do not only reduce carbon dioxide (CO2) emissions but studies
have shown that these policies can yield a wider set of multiple impacts (popularly addressed
as co-benefits) for the economy and society. However, it is often the case that these impacts
are not incorporated during the evaluation of a suitable energy assessment due to lack of mature
quantification methodology. Hence, most of the time, the potential of sustainable energy
policies are undervalued. Therefore, the aim of this research is to provide better tool and
methods to quantify multiple impacts rigorously. In order to achieve this aim, this dissertation
proposes a methodological framework and using the framework, this dissertation quantifies
productivity impact in a rigorous manner for Hungary and Germany.
Among these wide ranges of multiple impacts, productivity impacts are observed to be one of
the biggest impacts, but despite the evidence, productivity impacts are not defined clearly in
the context of multiple impacts, and hence it is also not rigorously quantified. Thus, this
dissertation defines productivity impacts by defining three key aspects of labour productivity
namely active days, workforce performance and earning ability which results from two
different improved energy efficiency measures (HVAC system with airtight building envelope
and modal shift towards active transportation):
1. The amount of active time available for productive work. This can be affected, for
instance, by being sick- more precisely absenteeism and presentism, which reduce the
amount of active time available.
2. Workforce performance within a certain time frame. Indoor air quality and thermal
comfort of tertiary buildings can improve the mental wellbeing of the entire workforce
and this can result in more productive time for work.
3. Earning ability/value added per unit of time worked. Poor indoor air quality and
thermal discomfort can affect the future earning ability of a child by disrupting
education.
The result shows that Germany and Hungary can gain 7.7 days/person and 3.21 days/person,
year by having more deep retrofit-type residential and tertiary buildings such as deeply
retrofitted buildings, passive houses, and nearly zero energy buildings. Germany and Hungary
can gain 331 million and 5 million Euros/year respectively by gaining more active days due to
more deep retrofit-type residential buildings. Similarly, by having more tertiary deep retrofit-
type buildings, Germany and Hungary can gain 332 million and 2 million Euro/year
respectively. This dissertation further shows that Germany and Hungary can gain 1870 and
3849 healthy life years/million population, year respectively by having more deep retrofit-type
residential buildings. In addition to avoided sick days, by working in deep retrofit-type tertiary
buildings, Germany and Hungary can gain around 85 million euro/year and 1.8 million
euro/year respectively by improving the mental well-being. Lastly, this dissertation results also
show that by opting for the modal shift towards active transportation, Germany and Hungary
CE
UeT
DC
olle
ctio
n

v
can gain 2.5 hours/driver, year and 0.5 hours/driver, year respectively. By quantifying
productivity impacts this dissertation shows the significance of productivity impacts of
sustainable energy policies and concluded that multiple impacts could be another incentive for
a policymaker to design a sustainable energy policy.
Key words: Multiple impacts, Productivity impacts, Energy efficiency measures, Health,
Quantification, Monetization, Well-being.
CE
UeT
DC
olle
ctio
n

vi
Acknowledgements:
First and foremost, I would like to thank my supervisor Prof. Diana Ürge-Vorsatz for her
supervision to frame and execute my research. Her insightful and visionary questions and ideas
are something which I will always remember. I am thankful to her for all the opportunities, she
has given me which helped me to grow both personally and professionally. We will stay in
touch!
I am truly grateful to my external committee member Dr. Sergio Tirado-Herrero for his detailed
feedback at crucial points and his sharp ideas to deal with different stages of PhD. Without his
support and feedback, it would not be easy for me to finish my PhD gracefully within 3 years.
Sincere gratitude to my internal member Prof. Laszlo Pinter for his time and support throughout
the PhD process.
Now, last but not the least, my external member Prof. Joyashree Roy, for all her ideas,
questions, opportunities, feedbacks and encouragement ‘thank you’ is not enough. There is no
way that I could express all my respect, love and gratitude in two words. Thus, rather I would
say- we will see each other soon. You have been my mentor and inspiration since my childhood.
Without you, I would not able to be an academic or even a better human being. I am happy and
proud to consider myself in your ‘ant bridge’.
My sincere thanks to my COMBI project partners namely, Johannes, Nora, David, Felix, Stefan
Thomas, Stefan Bouzarovski and, Johan. A special thanks to Johan for his detail data and
always helping me with answers to my queries. I am really happy to get the chance of working
with you all-it’s been a splendid experience.
My sincere gratitude to Healthvent project researcher Dr. Arja Asikainen (National Institute
for Health and Welfare, Finland (THL) for providing me the data and advises. Without your
data, this task would be more challenging.
Also, I would like to thank ABUD, Hungary for supporting my work and giving me the freedom
to work. Without the administrative support of ABUD, it would not have been possible for me
to come to Hungary and do my PhD. Moreover, I am thankful to the European Commission’s
horizon 2020 research scheme from where my PhD got funding for almost 2 and half years.
I hereby acknowledge the support and love that I receive from the department of environmental
science and policy in last 3 years. Faculty, my fellow PhD students, and staff made this journey
memorable for me. I would like to mention Prof. Alex Antypas for his great advises and ideas
to reduce mental pressure and dilemmas in the PhD process. I would also like to extend my
sincere gratitude to Prof. Alan Watt for his detail feedback and interest in my research. Also, I
would like to thank Prof. Brandon Anthony who was the first person to tell me that “it is
possible to finish PhD in 3 years-just work on the weekends as well”. The coursework in my
first year was an eye-opener and my learning started by debating with my fellow PhD peers.
My friends in the department (to name a few: Andrea, Anastasias, Erik, Csabi, Stefan, Sergi,
Neomi, Vivek, and Anna) have made my journey more memorable. I would never forget the
conversions we used to have while eating-out about our research and concerns related to our
research. My special thanks to our PhD program coordinator Gyorgyi Puruczky for always
there for me as a colleague, friend and sometimes a guide in this journey. How can I forget my
ex-flatmate and former CEU PhD student Mukesh Gupta- You have made my stay aboard
CE
UeT
DC
olle
ctio
n

vii
smooth and happening. Thank you for being a friend. I would also like to acknowledge my
friends in Budapest Orshi, little Balint, Shila da, Suparna di- I will always cherish our
conversations.
I am also thankful to the academic community especially the energy community for all the
encouragement, feedback and opportunities. I have met many people in different conferences
who have influenced my research in many ways-I am thankful to all of them.
I am extremely grateful to CEU for funding my last six months of research and also for giving
me lots of opportunities to think, learn and question. CEU will always be in my heart wherever
I go.
This acknowledgment won’t be complete without mentioning my fellow PhD student and
friend Ana Stojilovska. All my first drafts, be it my dissertation or articles/report, are read by
you. Without your critical comments, proofreading and feedback I won’t be able to provide an
improved version. Thank you for being a friend. I will miss spending time with you- taking the
walks, going out to dine, numerous conversations-everything.
I am thankful to my parents back in India for raising me up and managing everything without
me for the last three years. I am indebted to my childhood friends (namely Biru, Sidhu) in India
for taking care of my parents and always there for me. Thank you Aparajita for last moment
proofreading. I would also like to mention the contribution of my school teachers back in India
who had taught me the basics of education, especially, Mr. Somnath Banerjee for teaching me
the basics of economics and Mr. Sukanta Dutta for teaching me advance economics. Without
you two, probably I would not have pursued economics further. My sincere gratitude goes to
Kantakol Calcutta University, Department of Economics where I did the masters in Economics.
Last but not the least, the beautiful city Budapest- I will miss my walks in the chain bridge,
Normafa and near the Danube. You will always be in my heart- köszönöm Budapest.
CE
UeT
DC
olle
ctio
n

viii
Contents CHAPTER 1: BACKGROUND AND TOPIC OUTLINE ..................................................................... 1
1.1 Rationale: ................................................................................................................................ 2
1.2 Background: ............................................................................................................................ 2
1.2.1 The bigger picture: Energy and climate change ..................................................................... 2
1.2.2 Multiple impacts of energy efficiency measures ................................................................... 4
1.2.3 Introduction to productivity impact: ...................................................................................... 7
1.2.4 Motivation: challenges-related to quantification of multiple impacts ................................... 8
1.3 Research aim: ................................................................................................................................ 9
1.4 Research question: ...................................................................................................................... 10
1.5 Objective: .................................................................................................................................... 10
1.6 Scope of the research .................................................................................................................. 11
1.7 Coverage ..................................................................................................................................... 12
1.8 Context of this dissertation: ........................................................................................................ 14
1.9 Structure of the dissertation: ....................................................................................................... 15
CHAPTER 2: THEORETICAL FRAMEWORK: ENERGY EFFICIENCY, MULTIPLE IMPACTS,
PRODUCTIVITY IMPACT AND WELLBEING ............................................................................... 16
2.1 Theoretical framework: ............................................................................................................... 17
2.1.1 Introduction to energy efficiency measures: Concept and definition................................... 17
2.1.2 Definition of multiple impacts ............................................................................................. 20
2.1.2 Types of multiple impacts .................................................................................................... 24
2.1.3 Empirical evidence of multiple impacts ............................................................................... 28
2.1.4 Defining productivity impact ............................................................................................... 34
2.1.5 Importance of productivity impact: ...................................................................................... 37
2.1.6 Productivity impacts and well-being: .................................................................................. 39
2.4 Summary of the chapter: ............................................................................................................. 40
CHAPTER 3: FROM IMPROVED ENERGY EFFICIENCY TO PRODUCTIVITY ........................ 41
3.1 Energy efficiency measures ........................................................................................................ 42
3.1.1 Defining energy efficiency measures: .................................................................................. 42
3.1.2 Energy efficiency measure in building sector- improved HVAC with airtight building shell:
...................................................................................................................................................... 44
3.1.3 Type of energy renovation in building sector: ..................................................................... 45
3.1.4 Energy saving potential of transport sector .......................................................................... 52
3.2 Energy efficiency and its impact ................................................................................................. 54
3.2.1 Productivity implication of HVAC with building shell: ...................................................... 54
3.2.2 Productivity impacts of modal shift towards active transport: ............................................. 65
CE
UeT
DC
olle
ctio
n

ix
3.2.3 Relationship between health and productivity ..................................................................... 76
3.4 Significance of productivity impact resulting from energy efficiency measures:....................... 78
3.5 Summary of the chapter .............................................................................................................. 80
CHAPTER 4- METHODOLOGICAL FRAMEWORK ....................................................................... 82
4.1 Review of existing methodology: ............................................................................................... 83
4.2 Challenges related to quantification of multiple impacts ............................................................ 94
4.3 Discussing the dissertation methodological framework: ............................................................ 98
4.3.1 Impact pathway approach .................................................................................................... 99
4.3.2 Productivity indicators ....................................................................................................... 105
4.3.3 Impact pathway maps discussing the productivity indicators: ........................................... 114
4.3.4 Functional formulation of productivity indicators ............................................................. 117
4.3.5 Equations for impact quantification ................................................................................... 123
4.3.6 Scenario analysis- definition of scenarios and its assumptions: ................................. 133
4.4 Summary of the chapter: ........................................................................................................... 135
CHAPTER 5: DATA AND ASSUMPTIONS .................................................................................... 136
5.1 An overview of the data sources: .............................................................................................. 137
5.2 Parameter specific data sources: ............................................................................................... 138
5.3 Assumptions:............................................................................................................................. 150
5.3.1 Assumptions of methods: ................................................................................................... 150
5.3.2 Assumption of scenario:..................................................................................................... 151
5.4 Summary of the chapter: ........................................................................................................... 162
CHAPTER 6: QUANTIFICATION AND MONETIZATION OF THE PRODUCTIVITY IMPACTS:
PRESENTING RESULTS OF PRODUCTIVITY INDICATORS .................................................... 163
6.1 Quantification and monetization of active days resulting from improved energy efficiency
measures: ........................................................................................................................................ 164
6.2 Quantification and monetization of workforce performance resulting from energy efficiency
measure: .......................................................................................................................................... 182
6.3 Summary of results: .................................................................................................................. 185
6.4 Sensitivity analysis: .................................................................................................................. 186
6.4.1 Uncertainties and limitations: ............................................................................................ 186
6.4.2 Test of parameters: ............................................................................................................. 187
6.5 Summary of the chapter ............................................................................................................ 197
CHAPTER 7: ANALYSIS OF THE POTENTIAL OF THE PRODUCTIVITY IMPACTS OF
IMPROVED ENERGY EFFICIENCY MEASURES ........................................................................ 198
7.1 Discussion about the importance of multiple impacts: ............................................................. 199
7.2 Productivity impacts in the context of well-being: ................................................................... 201
7.3 Discussion on data and methodological challenges: ................................................................. 209
CE
UeT
DC
olle
ctio
n

x
7.4 Policy relevance ........................................................................................................................ 212
7.5 Original contribution: ................................................................................................................ 214
7.6 Future research avenues: ........................................................................................................... 216
Conclusion: ......................................................................................................................................... 218
References ........................................................................................................................................... 221
CE
UeT
DC
olle
ctio
n

xi
List of figures:
Figure 1: Additional effects of energy efficiency policy ........................................................................ 6
Figure 2: The possible multiple impacts of energy efficiency measures .............................................. 24
Figure 3: Ventilation system in passive houses .................................................................................... 50
Figure 4: Relation between air exchange rate and indoor air pollutant concentration. X axis shows the
air exchange rate, per hour (ach, h-1) which is the rate of ventilation and Y axis shows the relative
concentration of indoor pollutants ........................................................................................................ 56
Figure 5: Total burden of disease as DALY/million population from indoor exposures in European
countries ................................................................................................................................................ 59
Figure 6: Impact pathway map used in Extern project ....................................................................... 100
Figure 7: Impact pathway for building sector implementing building related energy efficiency
measure ............................................................................................................................................... 103
Figure 8: Impact pathway for transport sector implementing building related energy efficiency
measure ............................................................................................................................................... 104
Figure 9: Impact pathway map of HVAC energy efficiency measure in building sector specifying
productivity indicator .......................................................................................................................... 114
Figure 10: Impact pathway map of modal shift towards active transportation specifying productivity
indicator .............................................................................................................................................. 115
Figure 11: Schematic diagram of research steps with different data sources and own calculations ... 162
Figure 12: Avoided sick days/Active days gain in the year 2030/per person who has shifted to deep
retrofit type residential buildings ........................................................................................................ 166
Figure 13: Avoided sick days/Active days gain in the year 2030/per person who has shifted to deep
retrofit type tertiary buildings ............................................................................................................. 167
Figure 14: Disease specific active days gain for each country in the year 2030 after installing energy
efficiency measure in residential and tertiary buildings ..................................................................... 171
Figure 15: Disability adjusted life years saved in the year 2030/million population who have shifted to
deep retrofitted type residential buildings ........................................................................................... 175
Figure 16: Disability adjusted life years saved /million population who have shifted to deep retrofitted
type residential buildings, year from each diseases ............................................................................ 176
Figure 17: Active time saved in hours from road congestion in the year 2030/per driver .................. 179
Figure 18: Active days gain in Germany and Hungary in the year 2030 by installing energy efficiency
measure in the residential building sector in three different scenarios ............................................... 190
Figure 19: Active days gain in Germany and Hungary in the year 2030 by installing energy efficiency
measure in the tertiary building sector in three different scenarios .................................................... 191
Figure 20: Healthy life years gain in Germany and Hungary by installing energy efficiency measure in
the residential building sector in three different scenarios.................................................................. 192
Figure 21: Work hours gain/per person in the year 2030 by installing HVAC system in the tertiary
building sector ..................................................................................................................................... 195
Figure 22: Traffic time saved per driver in the year 2030 for Germany and Hungary ....................... 196
CE
UeT
DC
olle
ctio
n

xii
List of tables:
Table 1: Definition of co-benefits ......................................................................................................... 21
Table 2: Typology of benefits of energy efficiency in the buildings sector and examples ................... 25
Table 3: Results of a few empirical studies on energy efficiency impacts summarized ....................... 29
Table 4: Definitions of productivity...................................................................................................... 34
Table 5: share of population living in single and multi-family buildings. ............................................ 48
Table 6: Sources of indoor air pollutants and disease associated with it .............................................. 64
Table 7: Sources of outdoor air pollutants and disease associated with it ............................................ 64
Table 8: Number of deaths per age category per billion passenger kilometers by cycling and by car
usage in Netherlands in 2008. ............................................................................................................... 71
Table 9: Magnitude of productivity impact of active transportation .................................................... 72
Table 10: Definitions of traffic congestion ........................................................................................... 74
Table 11: Productivity impact estimates from existing study-related building sector .......................... 79
Table 12: Summary of the most common methodologies used to assess multiple impacts .................. 90
Table 13: Few quantification challenges and proposed solutions ......................................................... 97
Table 14: Productivity indicators and their relevant sectors ............................................................... 124
Table 15: Absenteeism data and their sources .................................................................................... 139
Table 16: Presenteeism data and their sources .................................................................................... 140
Table 17: Percentage of absenteeism and presenteeism for different diseases ................................... 142
Table 18: Values of burden of diseases from Healthvent project ....................................................... 143
Table 19: Percentage reduction of burden of diseases under different scenario ................................. 144
Table 20: Working population living in different type of buildings in different scenarios in the year
2030 .................................................................................................................................................... 146
Table 21: population working in different type of tertiary buildings in different scenarios in the year
2030 .................................................................................................................................................... 147
Table 22: Workforce performance data and their sources .................................................................. 148
Table 23: Time saved from congestion data requirement ................................................................... 149
Table 24: Key data for calculation of time saved for congestion metric ............................................ 149
Table 25: Percentage of different retrofitted residential and tertiary buildings in Germany in the year
2030 .................................................................................................................................................... 156
Table 26: Percentage of different retrofitted residential and tertiary buildings in Hungary in the year
2030 .................................................................................................................................................... 160
Table 27: Sick days in different scenarios due to residential building-related illness ........................ 166
Table 28: Sick days in different scenarios due to tertiary building-related illness ............................. 167
Table 29 : Disability adjusted life years in different scenario ............................................................ 176
Table 30: Traffic congestion time loss during peak hours in different scenario ................................. 180
Table 31: Labour input in actual hours working in two scenarios ...................................................... 183
Table 32: summary of results .............................................................................................................. 185
Table 33: Disease specific reduction rate under different scenarios ................................................... 193
CE
UeT
DC
olle
ctio
n

xiii
List of abbreviations:
AR Assessment report
COMBI Calculating and Operationalising the
Multiple Benefits of Energy Efficiency in
Europe
CO2 Carbon dioxide
CO Carbon Monoxide
COPD Chronic obstructive pulmonary disease
DALY Disability adjusted life years
GJ Gigajoule
Gt Gigatonnes
GHG Greenhouse gas
GDP Gross domestic product
HVAC Heating ventilation and air conditioning
IPCC Intergovernmental Panel on Climate Change
IEA International energy Agency
KM Kilometer
kWh/m²a kilowatt hour/ per square meter and year
ug/m3 Micrograms/cubic meter air
MTOE Million tonnes of oil equivalent
MI Multiple impacts
NZ$ New Zealand dollar
NOx Nitrogen oxides
O3 Ozone
PM Particulate matter
PJ Petajoule
SO2 Sulphur dioxide
OECD The Organisation for Economic Co-
operation and Development
VOLY Value of a life year
VOC Volatile organic compound
WHO World Health Organization
CE
UeT
DC
olle
ctio
n

1
CHAPTER 1: BACKGROUND AND TOPIC OUTLINE
“Where words come out from the depth of truth
Where tireless striving stretches its arms towards perfection
Where the clear stream of reason has not lost its way
Into the dreary desert sand of dead habit”
Rabindranath Tagore. Where The Mind Is Without Fear
CE
UeT
DC
olle
ctio
n

2
1.1 Rationale:
The importance of energy conservation and energy efficiency are well-documented but we
often forget the rationale behind it. The primary objective of energy conservation is to save
energy. But, energy conservation has additional effects as well. For instance, saving energy
does not only reduce its impact on the environment but also reduces the cost of living and/or
improves the health condition by improved air quality.
As Nobel laureate physicist Steven Chu wrote in his letter on 1 February 2013, to the Energy
Department employees “as the saying goes, the Stone Age did not end because we ran out of
stones; we transitioned to better solutions. The same opportunity lies before us with energy
efficiency and clean energy”. With different conservation techniques, in other words, with
different low carbon techniques, we can not only mitigate adverse environmental impacts, but
also there is an opportunity to augment social welfare through the co-benefits of various low-
carbon techniques.
1.2 Background:
1.2.1 The bigger picture: Energy and climate change
Access to energy services is a key component in the twenty first century in order to meet social
and economic development needs and improve human welfare (IPCC 2007). The most
common way to produce energy is to use and process fossil fuels such as coal, oil and natural
gas. The use of fossil fuels does not only produce energy but it also produces waste gases such
as carbon dioxide (CO2). This contributes to about 78% of the total greenhouse gas (GHG)
emission increase (IPCC 2014). The effect of GHG emissions on climate is one of the most
significant environmental impacts of the present decade (IPCC 2014). Moreover, the GHG
emissions are one of the key factors to accelerate climate change (Emberson et al. 2012). It is
concluded in Intergovernmental Panel on Climate Change’s (IPCC) fourth assessment report
CE
UeT
DC
olle
ctio
n

3
(AR 4) that “most of the observed increase in global average temperature since the mid-20th
century is very likely due to the observed increase in anthropogenic greenhouse gas
concentrations”. Thus, the use of fossil fuels should be reduced not only to save the natural
fossil fuel stock but also to mitigate climate change impacts.
The significance of climate change is unquestionable today. It is scientifically proven that
climate change is exposing individuals, societies, economic sectors and our ecosystems to risk
(where risk is defined in the IPCC 2014 report as the potential for consequences when
something of value is at stake and the outcome is uncertain). These risks from climate change
impacts arise from the interaction between ‘hazard’ (an event or trend related to climate
change), vulnerability (vulnerability to harm), and exposure (people, assets or ecosystems at
risk) (IPCC 2014). The risks of climate change can be caused from many reasons, but among
these reasons, peak resource especially energy extraction have been identified as a key factor
which is exposing human civilization to risk (IPCC 2007). More precisely, energy production
and use emit two-thirds of the GHG emission (IEA 2015). In addition to contributing to
anthropogenic climate change, fossil fuel-based energy systems emit other atmospheric
pollutants such as particulate matter (PM), nitrogen oxides (NOx), sulphur dioxide (SO2) which
degrade the air quality and ecosystem (via the processes such as acidification, eutrophication
and formation of ground level ozone) (Emberson et al. 2012). Hence, to mitigate these risk
factors, energy production and use need to be reduced. However, energy is an important
component of our daily life and also it is a key input to enhance the development of a nation.
For instance, energy services such as electricity, fuels, mechanical power helps in meeting the
essentials of modern day life and access to electricity is a key indicator for a developed nation.
Thus, to mitigate these risk factors without disrupting the services, energy efficiency is the first
option in the short to mid-term period because with the help of energy efficiency measure one
can have the same amount of service by consuming less energy. The International energy
CE
UeT
DC
olle
ctio
n
4
Agency (IEA) 2015 report shows that energy efficiency improvement measures in IEA
countries1 since 1990 have avoided “a cumulative 10.2 billion tons of CO2 emissions, helping
to make the 2 degree warming goal more achievable”. Without energy efficiency improvement
measures “the world would have used 12% more energy than it did in 2016” (IEA 2017).
Energy efficiency can be defined as “using less energy to produce the same amount of services
or useful output” and energy efficiency measures can be defined as "actions to improve the
energy efficiency of existing technologies, or to replace conventional technologies with new,
more efficient ones, are called measures" (Patterson 1996; Couder 2015). Thus, improved
energy efficiency measure is an instrument to achieve an improvement in energy efficiency i.e.
less energy use for the same services. Therefore, energy efficiency measures can be considered
as a tool to mitigate climate change by reducing energy production and use.
1.2.2 Multiple impacts of energy efficiency measures
Sustainable energy policies do not only reduce carbon dioxide (CO2) emissions but recent
studies (see (GEA 2012; Ryan and Campbell 2012; IPCC 2014; Ürge-Vorsatz et al. 2014; IEA
2015) have shown that these policies can yield a wider set of additional benefits for the
economy and society. Some studies (see (Worrell et al. 2003; Ürge-Vorsatz et al. 2009; Ryan
and Campbell 2012) even suggest that these non-climate benefits such as job creation, GDP
growth, enhanced productivity, increase of energy security, positive impacts on health, may
have a higher value than the direct energy saving benefit. Thus, to develop more cost-effective
sustainable energy policies keeping long-term economic goals in mind, additional
benefits/multiple non-climatic benefits have to be accounted more comprehensively in the
future assessment (Ürge-Vorsatz et al. 2016). There are several terms used to address the
1 The IEA is made up of 30 member countries namely Australia, Austria, Belgium, Canada, Czech Republic,
Denmark, Estonia, Finland, France, Germany, Greece, Hungary, Ireland, Italy, Japan, Korea, Luxembourg,
Mexico, The Netherlands, New Zealand, Norway, Poland, Portugal, Slovak Republic, Spain, Sweden,
Switzerland, Turkey, United Kingdom, and United States (https://www.iea.org/countries/membercountries/)
CE
UeT
DC
olle
ctio
n

5
additional effects of energy efficiency measures. Among these terms, the most popular
terminology is co-benefit. Apart from the co-benefit, there are other terms used such as
additional effect, ancillary benefit, non-climatic benefit, non-energy benefit, multiple benefits,
and co-impact.
Initially non-energy benefits due to energy efficiency measures were used to categorize into
two benefits i.e. co-benefits and ancillary benefits. The AR4 defines the ancillary benefits as
side effects of policies aimed exclusively at CO2 emission mitigation (IPCC 2007). The IPCC
AR4 report has also defined co-benefits as the benefits of policies which are implemented for
various reasons, including climate change mitigation as one of them. Apart from mitigation,
these policies may also have other objectives, such as economic and social development,
sustainability etc. The term co-benefit was first used in 1990 and then the IPCC AR3 report
distinguished co-benefit or intended positive side effect from an unintended positive side effect
(namely ancillary benefits) of a policy (Miyatsuka and Zusman 2010). Co-benefits have
immediate welfare effects and these are mostly enjoyed by present generation unlike climate
benefits which are mostly enjoyed by future generations (Markandya and Rubbelke 2003;
Ürge-Vorsatz et al. 2014). The IEA 2011 report mentioned a new term ‘multiple benefits’ to
capture all these additional positive effects of energy efficiency measures (Heffner and
Campbell 2011). The term ‘multiple benefits’ captures both the intended and unintended
benefits of sustainable energy policies (IEA 2014).
These terms such as co-benefits, multiple benefits, non-energy benefits and ancillary benefits
only address the positive effects of a policy whereas there could be some negative effects as
well. For example, people may lose their jobs in the energy supplying sector due to increasing
demand for energy efficiency or transaction cost also considered as a co-cost does not belong
to benefit. These negative effects of a climate change policy have referred as adverse side
effects, co-costs, disbenefits, and risks (Ürge-Vorsatz et al. 2014). These adverse side effects
CE
UeT
DC
olle
ctio
n

6
of an energy efficiency policy also need to be considered in the policy evaluation in order to
provide an unbiased evaluation. Figure 1 below organizes all the terms used to address both
positive and negative effects of energy policies.
Figure 1: Additional effects of energy efficiency policy
Source: (Ürge-Vorsatz et al. 2014)
Figure 1 shows different effects of an energy policy where these effects are divided into two
main categories i.e. co-benefit and co-cost. Ürge-Vorsatz et al 2014 used the term ‘co-impact’
to address these cost and benefit together.
In this dissertation, the term ‘multiple impacts’ is used to avoid further confusion. The term
‘multiple impacts’ was first used in Urge-Vorsatz et al 2016 study. Use of this comprehensive
term promises a fair ground for research. More precisely, when we are using the term co-
CE
UeT
DC
olle
ctio
n

7
impact, there is an underlying meaning which says that there is a ‘main’ impact. Suppose all
the effects of sustainable energy policies are side effects and energy savings are the main effects
then probably we can use the term co-impact without any confusion. But, the literature shows
that many times the value of co-benefits/co-impact is much higher than planned benefit (for
example, energy savings). For instance, Urge-Vorstaz et al 2015 study shows that the ratio of
co-benefits to energy saving is between 0.22-3.21 and the value of health benefits are 1.4 higher
in monetary unit than direct energy cost savings which confirms the claim that co-benefits may
have higher value than direct energy savings (Ürge-Vorsatz et al. 2015). Thus, mathematically
energy savings cannot be considered as ‘main’ benefit compared to the other benefits of energy
efficiency policy. Therefore, the term ‘multiple impacts’ captures all the additional impacts of
sustainable energy policies without any confusion and here the term impact covers both
positive and adverse effects of an energy efficiency policy.
1.2.3 Introduction to productivity impact:
Productivity impacts are one of the key multiple impacts of energy efficiency measures. In
general, productivity is defined broadly as a relation between input and output. However, the
definition of productivity can vary as per the perspectives, such as measurement, labour
relations, training and development, management, budget, finance, and sectors (like industry,
transport etc.) (Quinn 1978).
There are two key productivity measures that define productivity broadly. These two measures
are single factor productivity (ratio between output and a single input) and multi-factor
productivity (ratio between output and more than one inputs). Among single factor productivity
measure, there are various measures of productivity which includes capital productivity, labour
productivity, profitability, and total output productivity (Sauian Sahar 2002). Among all these
measures labour productivity and capital productivity are the two most used measures. This
dissertation only consider labour productivity which is a well-established indicator for several
CE
UeT
DC
olle
ctio
n

8
economic aspects such as economic growth, competitiveness, and living standards in an
economy (OECD 2008). Broadly, labour productivity can be defined as the ratio output and
labour input. In other words, labour productivity can be measured as the ratio between outputs
produced within an economy in a year and total numbers of hours worked by the employees
(OECD 2008). This dissertation shows and quantifies how having improved energy efficiency
measures can result in productivity gain. A detail analysis of the productivity impact is given
in chapter 3 and chapter 4.
1.2.4 Motivation: challenges-related to quantification of multiple impacts
It is often the case that these additional effects are not incorporated while assessing a
sustainable energy policy. One of the reason behind not incorporating the impacts are their
complexities in quantification methods compared to the direct impact evaluation such as direct
energy cost or emission reduction (Ürge-Vorsatz et al. 2016). However, it is important to note
that to develop cost-effective sustainable energy policies and optimized long-term strategies,
multiple non-energy benefits have to be accounted more comprehensively in the decision
making analysis (Ürge-Vorsatz et al. 2014). In most cases, there are two key reasons behind
not incorporating the non-climate related impacts into a decision making analysis:
1) The wide impacts of sustainable energy policies or energy efficiency policies are often
not completely identified.
2) Even if many of the impacts are identified, they are often not quantified and thus not
attributed to an energy policy.
Furthermore, many of these benefits are non‐marketable, indirect, thus difficult to be quantified
and monetized. Thus, it is difficult to understand the net effect of a sustainable energy policy.
Productivity being one of the important multiple impacts, also has these challenges in regard
to quantification. In addition to these challenges, most of the studies have not clearly defined
CE
UeT
DC
olle
ctio
n

9
productivity impact as one of the multiple impacts of energy efficiency despite the fact that
sustainable energy measures such as improved energy efficiency measures, have a positive
effect on labour productivity (by improving health and well-being) as well as on industrial
productivity (by improving input efficiency) (Fisk 2009; Worrell et al. 2003). Also, the
outcome of the studies (see (Fisk, & Rosenfeld 1997; Fisk 2000; Worrell et al. 2003; Chapman
et al. 2009) conducted on productivity impact varies largely since the outcomes are sector
specific and these studies have major gaps in the context of geographical and/or technical
coverage. These gaps and disperse findings make the consideration of productivity impact in
energy related policy making and policy evaluation difficult today (Ürge-Vorsatz et al. 2015).
However, by not quantifying them, we can easily underestimate the potential of a sustainable
energy policy. In addition, it needs to be noted that this lack of methodology to quantify
productivity impact as well as the other multiple impacts, certainly does not make them any
less significant but the failure to estimate the impacts, especially the benefits, results in less
investment in sustainable energy measures. The IEA 2012 report expresses the same concern
quoting “these foregone benefits represent the opportunity cost of failing to adequately evaluate
and prioritize energy efficiency investments and this opportunity cost may be very large, and
in particular in the context of increasing global demand, stress on resources, and climate
concerns, they may represent a cost that we cannot afford to bear”. Thus, there is a need to
provide a broader quantitative understanding of multiple impacts especially productivity
impacts in relation to improved energy efficiency measures in order to fill in these gaps.
1.3 Research aim:
The key research aim of my dissertation is to provide a better tool and methods to quantify
multiple impacts of sustainable climate policies. As discussed in section 1.2.4, in order to
provide a better tool and methods of quantification, first the multiple impacts of sustainable
CE
UeT
DC
olle
ctio
n

10
climate policies need to be identified then they have to be quantified (if not monetized) to
understand the magnitude of multiple impacts as well as the importance of climate policies.
1.4 Research question:
To achieve the research aim mentioned in section 1.3, the following research question need to
be answered:
o How to quantify the multiple impacts especially productivity impact of improved
energy efficiency measures in a theoretically and methodologically rigorous manner?
1.5 Objective:
To achieve my research aim, this dissertation is taking productivity impact as a representative
of multiple impacts to develop a rigorous methodological framework. Thus, keeping in mind
the research aim and research question the following objectives have been defined:
o Objective 1: Clearly define productivity impacts in the context of multiple impacts of
sustainable climate policies.
o Objective 2: Provide the methodological framework to quantify productivity impact.
Sub-objective 1: Identify the pathways from implementing energy efficiency
measure to productivity impact.
Sub-objective 2: Develop context specific equations to quantify productivity
impacts. Here, context implies both sector and specific sustainable energy measure.
o Objective 3: Quantify productivity impact for a few specific cases.
Sub-objective 1: Productivity impact would be measured for specific
sustainable energy measures in two different scenarios at national level in the
year 2030.
Scenario one would estimate the productivity impact of energy efficiency measures if
no further sustainable energy actions are taken i.e. reference scenario in the year 2030.
CE
UeT
DC
olle
ctio
n

11
The second scenario would estimate productivity impact of sustainable energy
measures in the year 2030 if energy efficiency measures are taken i.e. efficient
scenario.
The year 2030 is taken in order to estimate the potential of sustainable energy policies,
keeping the EU 2030 framework for climate and energy in mind. Also, 2030 is the
target date for delivering on the sustainable development goals.
o Objective 4: Assess the significance of productivity impact for two specific cases.
Multiple impact assessment results are better compared across different energy efficient
options for implementation or scenarios rather than across assessment methods (Ürge-Vorsatz
et al. 2016). Therefore, in this dissertation, two different scenarios are used in order to
understand the extent of productivity impact.
1.6 Scope of the research
This dissertation is framed within the following boundaries which define the scope of the
research:
Methodological framework: This dissertation provides a theoretically consistent
methodological framework to rigorously quantify multiple impacts especially productivity
impacts. This study uses scenario analysis to understand the magnitude of productivity impact
by using this methodological framework.
Productivity indicators: By using this methodological framework, this study proposes a few
indicators to measure productivity impact. However, by using this framework any other impact
can also be measured. In this study, productivity impact is taken as an example to show how
the methodology works.
CE
UeT
DC
olle
ctio
n

12
Timeframe: The analysis of productivity impact through its indicators is estimated for the year
2030. As discussed in section 1.5, the year 2030 is selected considering the EU 2030 framework
for climate and energy.
Energy end-use sectors and improved sustainable energy measures: Two end-use sectors
namely building and transport sector have been selected. In building sector both residential and
tertiary sector have been considered. For these two end-use sectors, two different energy
efficiency measures are considered. More precisely, for building sector, improved Heating
ventilation and air- conditioning (HVAC) system with airtight building shell has been
considered and for transport sector modal shift towards active transportation has been
considered.
Geographical: This study estimates productivity impact of improved energy efficiency
measures for two European countries namely Hungary and Germany.
1.7 Coverage
This study takes Hungary and Germany as case studies to understand the significance of
productivity impact of improved energy efficiency measures. The objective of taking two
countries is not to compare between themselves but rather to show how substantial productivity
impact can be in two different countries. In the following section the reasons behind selecting
these two countries are discussed in brief.
Hungary: Hungary can be considered as a representative case of Eastern Europe. Post 1989
reforms in Hungary were accompanied by high inflation rate, increase in unemployment rate,
and decrease in per capita income (Kremer, Sziklai, and Tausz 2002). Post reforms period
affects energy prices as well (due to withdraw in price subsidy) and the consequences of
reforms were higher for the lower income households (Kocsis 2004). With the lasting impacts
of the reforms along with other factors, Hungary still has a very low per capita income level
CE
UeT
DC
olle
ctio
n

13
among European member states (OECD 2016). In addition, in the year 2011, Hungarian
constitution recognized the right for healthy living and working environment (annex XVII)
also it acknowledges the need for decent housing and public services. These articles of the
fundamental constitution of Hungary provide a legal ground to have a healthy work and living
environment.
However, despite these articles, Hungary is performing poorly compared to the OECD average
by having poor housing conditions, poor health conditions and low self-reported well-being
(UN 2015; OECD 2016). Furthermore, it is important to remember that Hungary is an energy
import dependent country. Hungary’s energy supply heavily depends on natural gas and crude
oil import. As per Embassy of Hungary’s (London) fact sheet, 80% of the natural gas is
imported from the Russian Federation.
Therefore, in order to improve the economic well-being, energy efficiency can play an
important role by improving labour productivity through improving health condition which can
accelerate income and well-being (OECD 2016). Thus, the role of sustainable energy measures
and productivity impact becomes crucial for Hungary, which makes Hungary a suitable study
ground to showcase the significance of multiple impacts related to sustainable energy
measures.
Germany: Germany can be considered as a representative of the more economically powerful
and politically stable Western Europe. The German economic growth has been stable over the
past years. In 2014 the real GDP growth was 1.6% and in 2015 it became 1.7% (European
Comission 2016). Furthermore, Germany’s unemployment rate is the lowest in European
Union and income inequality is quite low compared to other OECD countries (OECD 2016).
That is why Germany is considered to be as one of the most developed economy in the world.
CE
UeT
DC
olle
ctio
n

14
Despite all these positive aspects, Germany’s labour productivity growth is not satisfactory
compared to other OECD countries. In fact, overall productivity growth of Germany is
weakened compared to other OECD countries and maintaining a steady productivity growth is
crucial in order to achieve a long-run sustainable growth (OECD 2016). Thus, labour
productivity can certainly play a crucial role in accelerating the economic productivity (OECD
2016).
Germany and Hungary make a suitable study ground to research the potential of productivity
impact of improved energy efficiency measures in the context of well-being, welfare, and
quality of life and as well as their potential to improve the building and transport sector. More
precisely, Hungary is still undergoing a socio-economic transition as many other post-
communist EU countries, and thus these two case studies enable a diverse opportunity to study
the role of energy efficiency in achieving a higher well-being through labour productivity in
the EU context.
1.8 Context of this dissertation:
This dissertation is a part of the Calculating and Operationalising the Multiple Benefits of
Energy Efficiency in Europe (COMBI) project (COMBI 2015). The COMBI project is a part
of the European Union’s Horizon 2020 research and innovation programme under grant
agreement No 649724. The COMBI project aims at calculating the energy and non-energy
impacts of energy efficiency measures for all European Union member states and then develop
an online- visualization tool to show different impacts of energy efficiency. I am working as a
researcher in the COMBI project where I am responsible for quantifying productivity impact
of energy efficiency measure and also for developing a synthesis methodology to aggregate
multiple impacts. The COMBI project mainly focuses on creating a user-friendly tool which
can be used by the policy maker to see the significance of mainly five type of multiple impacts
namely health, social welfare, resources, macro-economic impacts and energy security. Within
CE
UeT
DC
olle
ctio
n

15
the broader context of the COMBI project, my dissertation’s main aim is to contribute to the
methodological advancement of multiple impact quantification by using two case studies of
productivity impact quantification in two different countries.
1.9 Structure of the dissertation:
This dissertation is structured in seven chapters. This first chapter introduces the context,
research problem, objectives, scope and justification of the study. Chapter 2 first introduces
the concept of energy efficiency, multiple impacts and productivity impact. Then it discusses
how multiple impacts and energy efficiency can achieve a higher well-being. Chapter 3
describes the technical details of energy efficiency measures and then it talks about how
different energy efficiency measures can influence productivity impacts.
Chapter 4, 5 and 6 describe the contributions of this dissertation where chapter 4 talks about
this dissertation’s methodology and how this methodology can deal with challenges related
multiple impacts evaluation. Moreover, chapter 4 provides a review of existing methodology
and identifies the need of a new methodological framework. Chapter 5 lists down all the data
used as input and the relevant assumptions of the methodological framework. Chapter 6
presents the results which are estimated by using the methodology described in chapter 4. Also,
it provides some reasoning of the results. A sensitivity analysis is conducted in chapter 6 to
strengthen the contribution of this dissertation. Lastly, chapter 7 discusses productivity impacts
and multiple impacts further in the context of well-being. Finally, this chapter states the
limitation of the study and after discussion on the limitations, this dissertation ends with
concluding all the concepts, methodology, results, and its possible use.
CE
UeT
DC
olle
ctio
n

16
CHAPTER 2: THEORETICAL FRAMEWORK: ENERGY
EFFICIENCY, MULTIPLE IMPACTS, PRODUCTIVITY IMPACT
AND WELLBEING
“It is theory that decides what can be observed”.
Albert Einstein
CE
UeT
DC
olle
ctio
n

17
2.1 Theoretical framework:
2.1.1 Introduction to energy efficiency measures: Concept and definition
Reduction of energy use without disrupting the development and standard of living is a key
challenge of the twenty first century. Moreover, the world population have been constantly
increasing over time which result in increase in the total demand for energy which is mostly
supplied via fossil fuel based energy system. The fossil fuel based energy system contributes
to the anthropogenic climate change by emitting carbon dioxide (CO2) and other greenhouse
gases (Wei et al. 2007). There are mainly two key global threat of increasing energy demand
and use:
1. Most of the energy systems globally are carbon intensive and thus emission of
greenhouse gases (GHG) also increases along with energy use and production. With
the increase of GHG emission, the adverse effects of climate change are also increasing
over time globally (Davis et al. 2010; IPCC 2014).
2. The fossil fuel stock is limited as it is a natural resource. Thus, excessive use of fossil
fuel would convert them as scare commodity (Shafiee & Topal 2009).
With challenges like the above mentioned ones, the possible solution is to use the alternative
energy approach (such as solar, wind etc.). However, the alternative energies are not yet
developed enough to meet the global energy demand. Therefore, efficient use of energy
becomes necessary to reduce GHG emission without disrupting the standard of living. The
efficient use of energy is obtained mainly by two key ways:
1. By technological improvement- Technological improvement basically reduces the
input use to produce the same output level. In other words, by having technological
improvement, same amount of energy services can be obtained by using less energy.
CE
UeT
DC
olle
ctio
n

18
2. By behavioral/lifestyle change- Behavioral change or lifestyle change is another
approach to reduce energy use where individuals who are the energy users change their
behavior to reduce energy use.
Both technological improvement and behavioral/lifestyle change can be considered as
instruments to save energy (Roy et al. 2012).
Energy efficiency in general can be defined as using less energy input to produce the same or
higher amount of energy services (Patterson 1996). More precisely, energy efficiency can be
defined as “energy services provided per unit of energy input” (Asif & Muneer 2007).
However, both of these definitions indicate an efficient use of energy input. Thus, the most
popular indicator of energy efficiency is ‘energy intensity’ which can be defined as “the amount
of energy used per unit of gross domestic product (GDP)” (IEA 2016). As per IEA 2017 study,
12% energy use was avoided globally in 2016 due to the fall in energy intensity which means
more GDP can be produced for each unit of energy consumed. This improvement (means
decline in per energy input used) in energy intensity results from implementation of energy
efficiency measures globally (IEA 2017). This decline in energy use would not only result in
less GHG emission but also saving energy results in improved energy security (Jansen and
Seebregts 2010). However, it is important to note that the energy intensity varies across
different sectors, such as industry, transport, building, agriculture etc. For instance, as per IEA
2017 market report, industrial final energy use has declined by 0.9% annually on an average
between 2000 and 2014 annually in OECD countries. On the other hand, energy intensity in
the transport sector increases by 15% globally due to growing demand for personal vehicles
mostly in non-OECD countries (IEA 2017).
Although energy efficiency can play a crucial role in saving energy and thus, in mitigation of
climate change, the effects of energy efficiency measures are not restricted only to climate
CE
UeT
DC
olle
ctio
n

19
change mitigation. Rather, it goes beyond economic and environmental aim. In the next section,
it is discussed how energy efficiency and its measures go beyond economic and environmental
goal.
2.1.1.1 Energy efficiency and well-being:
Challenges, such as climate change and air pollution, include further aspects such as equity and
morality which are rarely included in the modern energy planning and analysis process (Bolla
et al. 2011). These challenges can be expressed as ‘energy related externality’ (Bolla et al.
2011; Stern 2006) . To tackle these challenges, energy efficiency is often seen as a mitigation
option.
There are mainly two key aims behind every energy efficiency measure implementation:
1) Environmental aim: Reduction in energy consumption would result in less natural
resource extraction, less waste generation which ultimately reduces CO2 emission.
2) Economic aim: Reduction in cost of operations and reduced cost of energy services
(Bolla, et al. 2011).
By achieving these two key aims, energy efficiency measures can achieve a higher well-being.
It is often the case that the term welfare is used as a synonym of well-being because both
welfare and well-being refer to overall standard of living in financial and material ways
(Liberty Fund 2012). However, there is a difference between welfare and well-being. Well-
being is a much broader concept and welfare or as economists refers economic well-beings is
a key component of well-being (Lequiller and Blades 2014). Welfare describes how well-off a
person is i.e. the material living conditions whereas well-being describes how well a person is
(Lequiller and Blades 2014). Welfare or economic well-being indicates only the material well-
being and that is why economists and statisticians sometimes refer welfare as economic well-
being. However, economic well-being is alone not sufficient to measure overall well-being as
CE
UeT
DC
olle
ctio
n

20
there are other aspects of human life such as jobs and earnings, housing, health, work and life
balance, education etc. which are equally important to being well-off. Thus, Lequiller and
Blades 2014 study disaggregates well-being into two key domain: 1) welfare (or economic
well-being, and 2) quality of life.
Energy efficiency by achieving environmental aim, can improve the standard of living by
having less outdoor pollution and hence improved health condition (Lean, & Smyth 2010).
Improvement of standard of living implies improved welfare. Furthermore, by using energy
efficiency measures, one can enjoy same energy related services with less energy use. In other
words, it can be said that the affordability of an individual would go up after installing an
energy efficiency measure. For instance, energy efficiency measures result in decrease in
energy prices ‘triggered by the efficiency gain’ and expenditure savings through energy savings
(Nässén, & Holmberg 2009). Thus, a higher economic well-being can be achieved. Also, the
energy cost savings increase other energy-consuming goods and services which are not
affordable previously which also implies improve in standard of living hence improvement of
well-being (Ürge-Vorsatz and Tirado-Herrero 2012). To conclude, energy efficiency can not
only save energy cost savings, but also achieve a higher economic well-being and improved
quality of life, it results in higher well-being in general.
2.1.2 Definition of multiple impacts
As discussed in chapter 1, there are many terms which are used to address the non-energy
benefits of climate change policies. Most of these terms are synonymous (for example, co-
benefits, mutual benefits, collateral benefit, secondary benefits, externalities etc.) but in some
cases these terms have a slightly different meaning (Floater et al 2016). For example, the IPCC
third and fourth assessment reports define co-benefits and ancillary benefits as benefits
intended by policy and unintended benefits by policy respectively. Though co-benefit is the
most popular term to address the non-energy effects of climate change policy, but there are
CE
UeT
DC
olle
ctio
n

21
some concerns about using this term as co-benefits only imply the benefits of a policy rather
than the whole effects including the negative ones (Ürge-Vorsatz et al. 2014). More precisely,
using the term co-benefit may bias the research as it includes only the benefits of the policy.
This bias may lead to overvaluation of a policy. Thus, in this study, to address all the effects
and also considering the significance of the additional effects of energy policies compared to
energy savings, the term ‘multiple impacts’ is used. In order to understand the term ‘multiple
impacts’ more deeply, we need to explore the existing definitions of co-benefits/ancillary
benefits. Thus, with the help of table 1 below, the definition and concepts of co-benefits which
are used in literature until now, are discussed:
Table 1: Definition of co-benefits
Definition of co-benefits/additional effects of climate
change policies
Study
Co-benefits can be defined as the benefit for the local
environment as a climate mitigation/adaptation policy
(Hamilton, Kirk, Akbar 2010)
“Co-benefits are the win-win strategy aimed at capturing
both development and climate benefits in a single policy or
measure”
(Miyatsuka and Zusman
2010)
“The potential developmental benefits of climate change
mitigation actions in areas other than GHG mitigation”
(Santucci et al 2014)
“For GHG mitigation policies, co-benefits can be defined as
effects that are additional to direct reductions of GHG and
impacts of climate change and have estimated to be large,
relative to the costs of mitigation (e.g. anywhere from 30%
to over 100% of abatement costs)”
Defined by OECD 2015
quoted at (Floater et al 2016,
p: 14)
Co-benefit is an intended approach to capture both
development and climate benefits in a single policy or
measure
(ACP 2016)
Co-benefit is a positive outcome of an intervention to
mitigate/adopt climate change
(Doll & Oliveira 2017)
Source: Own elaboration
CE
UeT
DC
olle
ctio
n

22
In table 1, the definition provided by IPCC AR3 and AR4 reports are not included as they are
already discussed in the beginning of section 2.1.1. From table 1, it can be seen that some
studies are using the term ‘co-benefits’ and ‘ancillary benefits’ interchangeably. Also, from
these definitions two analyses become clear:
1. Co-benefits are seen as a separate benefit-mostly to the local environment in addition
to global climate change mitigation/adaptation effort.
2. A climate change policy can result in local non-energy benefits which can be realized
within short time period. Thus, to realize the immediate local benefit a local government
may push for global climate change policies irrespective of the result of the policy is
intended or unintended.
To avoid these ‘intended’ and ‘unintended’ confusion, IEA 2012 and 2014 studies use the word
‘multiple benefits’ to capture all the effects of a climate change policy considering the multi
objective framework of IEA countries.
This analysis also shows that the additional effects of any climate change policy are perceived
as positive. However, it may not be the case. For instance, due to energy efficiency measures
energy demand may reduce which may cause some job loss at the energy producing sector or
a person shifting from motorised to non-motorized mode, such as cycling would expose to
more air pollution and hence more related health effects (De Hartog et al. 2010; Ürge-Vorsatz
et al. 2016). Thus, considering only the positive effects i.e. the co-benefits would bias an
evaluation or in other words over valuate a policy. Urge-Vorstaz et al. 2014 study uses the term
‘co-impact’ to avoid this bias in the evaluation. However, as discussed in chapter 1- section
1.2.2, the additional effects of policy could be higher than the main effect of the policy. In
addition, a local government may prioritize their objective based on the problems they are
facing. For instance, if a nation has poor air quality then it may want to implement a global
CE
UeT
DC
olle
ctio
n

23
climate change policy to improve the air quality. Thus, addressing an effect of climate change
policy as ‘co’ may not always be right.
Therefore, this dissertation uses the word ‘multiple impacts‘ to denote both the positive and
adverse effects of a sustainable energy policy and also to acknowledge the multi objective
framework of European Union.
The climate change polies can yield a wider set of benefits for the economy and society such
as job creation, GDP growth, productivity, increase of energy security, positive impacts on
health, as well as ecosystems improvements (Sauter and Volkery 2013; GEA 2014; IPCC 2014;
Ürge-Vorsatz et al. 2014). Although the multiple impacts (MI) are discussed mostly in the
context of energy efficiency, it has prominence in the broader energy and climate change
context as well (Ürge-Vorsatz et al. 2016). The discourse of multiple impacts in the context of
energy efficiency gains attention after the IEA works in 2012 and 2014 (Ürge-Vorsatz et al.
2016). More precisely, IEA works in 2012 and in 2014 are the first to show how the additional
effects of energy efficiency improvements contribute to maximize the welfare and well-being
of a society (IEA 2014). For instance, improved energy efficiency measures would reduce
energy use which also implies energy cost/utility cost savings. These cost savings increase the
disposable income. Additionally, energy savings would also reduce energy production related
to air pollution which results in outdoor pollution emission. Less outdoor pollution would
further result into improvement in health and productivity. There are other dimensions of
energy savings such as reduction in energy consumption which would reduce scarcities in
energy resources and ultimately would result in reduction of social inequities (Ürge-Vorsatz et
al. 2016).
CE
UeT
DC
olle
ctio
n

24
Figure 2 shows some of the possible co-benefits (also termed as multiple benefits) of a
successful energy efficiency measure which can help us understand the vast potential of
sustainable energy policy to some extent:
Figure 2: The possible multiple impacts of energy efficiency measures
Source: (IEA 2014)
Figure 2 shows these multiple impacts of sustainable energy policy which go beyond the well-
established main aim of any sustainable energy policy i.e. energy savings and greenhouse gas
reduction.
2.1.2 Types of multiple impacts
The multiple impacts of energy efficiency are typically experienced at local level whereas the
reduction in GHG emission yields a national/global impact (Metz et al. 2007). Thus, the
economic policies concerning local development should definitely consider the multiple
CE
UeT
DC
olle
ctio
n

25
impacts of improved energy efficiency measures. However, depending on the size and
magnitude of the multiple impacts, the overall effect of energy efficient measure could be
understood i.e. whether the policy would be beneficial for the society/individual or not it
depends on the size and magnitude of the impacts. The scale and magnitude of the impact
would vary as per the sector and sector specific energy efficiency measures. For example,
building related energy efficiency measures would result in certain impacts for example, energy
poverty alleviation which would not be seen from the energy efficiency measures in industry
sector. Furthermore, sector specific sustainable energy policies can result in an array of
multiple impacts. Few studies try to organize this array of impacts into different categories. For
example, the building sector-related energy efficiency policies can be categorized into five key
broader categories namely health, ecological effects, social effects, economic effects and
service provision benefits (Ürge-Vorsatz et al. 2009). To explain this further, table 2 shows
different categories of impacts in building sector with an example:
Table 2: Typology of benefits of energy efficiency in the buildings sector and examples
Category Sub-category of the
impacts
Examples and supporting
literature
Health effects Reduced mortality and
morbidity
Reduced mortality and
morbidity due to improved
indoor quality and through
reduced thermal stress in
better buildings (Howden-
Chapman et al. 2009).
Social effect Energy poverty The intensity of energy
poverty can be minimised by
saving utility bills; level of
reduced fuel / electricity
debt; improved state of
health (Healy 2003;
Schuessler 2014).
Ecological effect Effects
on ecosystem
Less acidification and
eutrophication due to
improvement in outdoor air
quality. For instance, after
CE
UeT
DC
olle
ctio
n

26
Category Sub-category of the
impacts
Examples and supporting
literature
installing energy efficient
hot water boilers, less
energy would be consumed
and due to which pollutant
emission would be reduced
to some extent which
ultimately results in less
acidification and
eutrophication (Scheuer et
al. 2003).
Economic effects Productivity impact,
employment effect, public
budget and energy security
Due to improved indoor air
quality more work
opportunities arise.
Furthermore, for retrofit
purpose more labour is
required which reduces the
unemployment rate. Also,
due to reduced dependence
on imported energy,
government expenditure
reduces (Fisk 2000;Ürge-
Vorsatz et al. 2010).
Service provision benefits Transmission and
distribution loss reduction
and utilities insurance
savings
Energy savings due to
implementation of energy
efficiency measures, results
in a smaller amount of
energy (e.g, electricity, gas)
transported to the
household; hence the
elimination of energy losses.
In addition, Insurance cost
would reduce as a result of
more compact services such
as fewer gas leakages
(Schweitzer and Tonn
2002).
Source: Adapted from (Ürge-Vorsatz et al. 2009)
A substantial potential of improved energy efficiency measures can be seen by identifying a
broad range of categories (health, economic, ecological, social and service provider impacts)
CE
UeT
DC
olle
ctio
n

27
which are beyond the traditional focus on energy demand reduction, but many of the categories
are interconnected (for example health and social impacts) (Ürge-Vorsatz et al. 2009). This
categorization would not help in identifying all the interactions among impacts, because
categorizing and then quantifying the impacts according to their category may lead to double
counting.
Another crucial aspect of identifying impacts is sector specific energy efficiency measure -
which means different energy efficiency measures in different sectors may result in different
impacts which may fall in different category. For example, due to implementation of energy
efficiency measures in the industrial sector there could be many impacts, such as improved
equipment performance, minimization of waste etc. which can belong to a completely new
category. Wornell et al 2003 study categorizes multiple impacts of industrial sector into six
broader category, namely waste (for example, reduce water waste), emissions (for example
reduced Sulphur di oxide), operation and maintenance (eg: increased facility reliability),
production (eg: increase output), working environment (eg; reduce the need of personal
protective requirement) and other (eg: decrease liability) (Worrell et al. 2003). Similarly, for
transport sector or agriculture sector, the related multiple impacts can also be categorized.
Studies mostly evaluate sector specific single impact (refer to table 2) and even evaluation of
these single impacts can also be proven to be larger than the main benefit of an energy
efficiency measure i.e. reduction in energy consumption. For instance, Ürge-Vorsatz et al. 2009
found out that some of the impacts of improved energy efficiency can deliver 2.5 times the
value of the energy demand reduction.
Due to these interlinkages between categories, it would not be helpful for quantification of
impacts to identify impacts as per their category because due to these interlinkages double
counting error may occur. Therefore, it can be safely said that categorization of impacts cannot
CE
UeT
DC
olle
ctio
n

28
help in enabling all the interaction and thus quantification, but however it can provide a good
understanding of sector specific multiple impacts.
2.1.3 Empirical evidence of multiple impacts
From the discussions so far, it is evident that a different range of multiple impacts results from
energy policies. However, if these impacts are not quantified then they cannot be incorporated
into a policy evaluation. In other words, not incorporating impacts would lead to
undervaluation of a policy. For instance, Urge-Vorsatz et al 2014 study argues the inclusion of
additional non-energy benefits into policy assessment can significantly change the final
outcome. According to this paper, without the proper integration framework, the assessment of
even single impact seems impossible. Stechow et al in their paper ‘Integrating Global Climate
Change Mitigation Goals with Other Sustainability Objectives: A Synthesis reviews and
analyses the IPCC WGIII AR5 results’ reveals that the impacts are difficult to quantify because
of the incommensurability and uncertainties of the quantification results. The authors have
suggested the following in the quantification methodology: 1) shifts the perspective from local
to economy wide and global, 2) multiple objectives of a policy should be taken into account
during the analysis, and 3) expresses the quantification results in economic term precisely in
monetary term, rather than nonmonetary terms (Stechow et al. 2015).
Quantification and monetization of these impacts are not easy and hence there are a limited
number of case studies conducted about the magnitude of multiple impacts. Table 3 below
shows some of the case studies conducted on multiple impact quantification for different
energy efficiency measures in different sectors. These studies mentioned in table 3, have
estimated multiple impacts mostly based on small sample survey. Thus, the coverage only
shows the study area and not the sample size.
CE
UeT
DC
olle
ctio
n

29
Table 3: Results of a few empirical studies on energy efficiency impacts summarized
Impacts Energy efficiency
technique used
Magnitude of the
impacts
Ratio
between
multiple
impacts
and direct
savings2
Coverage
of the
study
study Study description
Health benefit,
CO2 reduction
and effect on
ecosystem
Metering and
regulation; minimum
standards for the
insulation in new
buildings; energy
efficiency labelling of
household appliances;
energy savings
awareness raising and
education; Energy
Saving Credit
Programme
Health benefit of 370
mill. US $- 1170 mill.
US $ can be gained; 30-
35 mill. US $ can be
gained by avoiding the
building maintenance
cost; and 86-222 mill
US $ can be gained by
reducing the CO2
emission.
2.43 Hungary (Aunan, and
Seip 2000)
This paper assesses the cost and
benefits of the implementation of a
few specific energy efficiency
program in Hungary.
Productivity
impact
Energy efficiency
improvements in iron
and steel industry
Nearly 170 PJ of
potential energy savings
per year for the entire
sector.
2 US (Laitner, Ruth,
& Worrell
2001)
This study shows that the inclusion of
the productivity benefits in the cost
calculations improves the potential of
energy efficiency for the entire sector.
2 Ratio is calculated by diving the monetary value or physical value of multiple impacts and direct savings i.e. energy cost savings. In some cases, the physical values and
energy savings are in same unit, hence division is possible.
CE
UeT
DC
olle
ctio
n

30
Impacts Energy efficiency
technique used
Magnitude of the
impacts
Ratio
between
multiple
impacts
and direct
savings2
Coverage
of the
study
study Study description
Health and
comfort
benefits
Household renovation The overall value of MI
is calculated 4723
million Euro over 31
years at a 5% discount
rate.
1.7 Ireland (Clinch and
Healy 2001)
This study provides a template for ex-
ante economic evaluation of domestic
energy efficiency measures by taking
Ireland household as a case study.
Ratepayer
benefits,
Household
benefits,
Societal
benefits
Weatherization
assistance program for
low income homes in
the US
$3346 (in 2001 $ per
household)
1.05 USA (Schweitzer
and Tonn
2002)
This project summarizes findings
attributable to the weatherizing
program. The study finds that the
overall, societal benefits are estimated
to be substantially larger than the
ratepayer and household benefits.
Economic and
social benefits
CO2 emissions
abatement policies in
residential sector
A reduction of 5953 kt
CO2 could be achieved
0.45 Greece (Mirasgedis et
al. 2003)
This paper proposes a methodological
framework to evaluate the economic
value of CO2 emissions abatement
policies in residential sector,
considering both economic and social
cost/benefits.
Health benefits Retrofitting of
household with
insulation
The total benefits
account for $1.3 billion
per year from health
improvements and $5.9
billion per year from
energy cost savings by
0.22 USA (Levy, and
Spengler
2003)
This paper proposes a risk-based
model to estimate the health benefits
from marginal energy usage
reductions.
CE
UeT
DC
olle
ctio
n

31
Impacts Energy efficiency
technique used
Magnitude of the
impacts
Ratio
between
multiple
impacts
and direct
savings2
Coverage
of the
study
study Study description
insulating 46 million
homes in the USA
Ancillary
savings and
production
benefits
Industrial energy
efficiency measure
such as equipment
replacement,
technological upgrades
and reconfiguration of
existing equipment
The total cost sums up
to $68.2 million and the
payback including
ancillary savings is
slightly less than one
year.
0.44 USA (Lung et al.
2005)
This study examines the importance
of ancillary benefits by evaluating
ancillary savings and production
benefits of industrial energy
efficiency measures.
Health and
environmental
benefits
Retrofitting of
household with
insulation
The total benefits would
be NZ$ 3374 per
household at 5%
discount rate
1.87 New
Zealand
(Chapman et
al. 2009)
This study shows the benefits of
housing insulation in New Zealand by
quantifying health and environmental
benefits.
CO2 and other
pollutant
savings
Residential sector
(improved insulation,
high efficiency boilers
and heating controls )
and small-business
sectors efficiency
measures
710 million Euro by
2030 and total energy
savings by 2030 is 5340
GWh
1.23 Ireland (Scheer and
Motherway
2011)
This paper presents an economic
evaluation of energy efficiency
improvements made in the residential
and small-business sectors in 2009-
2030.
Health benefits Building retrofitting
with higher insulation
1266 million NZ$ over
30 years at 4% discount
rate
83 New
Zealand
(Grimes et al.
2012)
This study summarises the cost-
benefit analysis of the warm up New
Zealand program.
CE
UeT
DC
olle
ctio
n

32
Impacts Energy efficiency
technique used
Magnitude of the
impacts
Ratio
between
multiple
impacts
and direct
savings2
Coverage
of the
study
study Study description
and installing clean
heating
Environment
and health
effects
China’s national
energy conservation
policy
3 $/t CO2 to 39 $/t CO2
at the national level can
be achieved
- China (Yang et al.
2013)
This study analyses the impact of
environmental and health-related
impacts of the climate policy and
mitigation technology assessment of
the cement sector in China.
Health benefit Energy saving
technique in the
cement industry
The estimated monetary
gain due to health
improvement in S1
would be around
$11.9/person, which is
equivalent to 0.73% of
GDP in 2010, and the
value of monetary gain
in S2 due to health
improvement would be
$23.6, which is 1.45%
of GDP in 2010.
- China (Hasanbeigi, et
al. 2013)
This Study estimated health impact
due to reduction in SO2 and PM2.5 in
Shanghai province in China through
scenario analysis.
Source: Adapted from (Ürge-Vorsatz et al. 2015; Ürge-Vorsatz et al. 2016)
CE
UeT
DC
olle
ctio
n

33
In table 3, 12 case studies are presented and all of them show multiple impacts have a
significant importance compare to energy cost savings. The ratio between multiple impacts and
direct savings lies between 0.45-2.43. Grimes et al. 2012 study’s result is an outlier hence not
considered in this range. Apart from these 12 case studies, there are other studies as well some
of which are mentioned in later chapters and some of the studies have not quantified the direct
savings hence are not incorporated in this list. However, the purpose of this table is not to list-
down all the case studies on impact quantification but, rather show the magnitude of impacts
compares to energy cost savings benefit. By seeing the magnitude of impacts compare to
energy cost savings, it gets clear how much a policy can be undervalued, if multiple impacts
are not incorporated. Another important point from table 3 is the type of impacts covered in
studies. More precisely, most of the studies presented in table 3, quantified health benefits. The
magnitude of health impacts also varies across different studies. Lastly, it can be concluded
from table 3 that the multiple impacts have a significant effect and considering the monetized
value of the impacts, if the impacts are incorporated into decision making analysis then they
can have a significant effect on policy design.
CE
UeT
DC
olle
ctio
n

34
2.1.4 Defining productivity impact
Productivity impact is one of the crucial multiple impacts of improved energy efficiency
measure (Fisk 2002;Chatterjee and Urge-Vorsatz 2017). In fact, many studies (see (Porter &
Van der Linde 1995; Boyd & Joseph 2000) argue that productivity impact is equal or greater
than energy cost savings.
Productivity can be broadly defined as the “ratio of a volume measure of output to a volume
measure of input use”(OECD 2001). However, the definition of productivity varies as per the
perspectives (such as measurement, labour relations, training and development, management,
budget, and finance) and sectors (such as building, industry, transport etc.)(Quinn 1978). Table
4 shows the key existing definitions of productivity measurement. These definitions clarify the
concept of productivity or being productive.
Table 4: Definitions of productivity
Reference Definition
(Quinn 1978) Defined productivity from two different perspective; economic and
industrial engineer defines productivity as input-output ratio with
quality of the output and administrator defines productivity as “better
performance”.
(Koss and Lewis
1993)
“Quality or state of bringing forth, of generating, of causing to exist, of
yielding large result or yielding abundantly”
(Rogers 1998) “Ratio of output to input for a specific production situation”.
(Leaman and
Bordass 1999)
"The ability of people to enhance their work output through increases
in the quantity and/or quality of the product or service they deliver"
(Al-Darrab 2000) Productivity =( Output/ Input) x Quality factor
(Boyd & Joseph
2000)
"Output per unit of non-energy input(s) increase because of a project
identified to increase output per unit of energy"
(Tangen 2002) Relation between input and output which can be applied at different
levels of aggregation in the economy.
CE
UeT
DC
olle
ctio
n

35
Reference Definition
(SPRING 2011) Measures effectiveness and efficiency of an organization in generating
output with the resources available
(Atkinson 2013) Economic output per unit of input.
Source: Own elaboration
All these definitions mentioned in table 4, reflects the broader definition of productivity i.e. the
relation between input used and output. In addition to output and input use, these definitions
also indicates another aspect of production namely quality. However, measuring quality of an
input is difficult and often it does not get quantified.
Though productivity is a well-used term in academic and industry circles but despite its
frequent use, productivity is often get confused with the term ‘performance’. Performance can
be defined as “a metric used to quantify the efficiency and/or effectiveness of an action”
(Tangen 2004). Another close concept to ‘productivity’ and ‘performance’ is efficiency which
can be defined as using less input to produce same or more volume of output (Tangen 2004).
Conceptually, performance and efficiency are measuring the same thing i.e. input efficiency
which improves the ratio between volume of output and volume of input use. In other words,
input efficiency improves productivity. More precisely, increase in input efficiency means less
input use per output, and then productivity improves (i.e. growth of productivity). Hence, input
efficiency can be considered as an indicator of measuring productivity. Therefore, since both
performance and efficiency measure input efficiency, they are considered as indicators of
measuring productivity.
Until now there is a limited number of studies (such as, (Fisk 2000; Fisk 2002; Howden-
Chapman et al. 2009) which measure productivity impact of sustainable energy policies by
measuring only a few handful aspects of productivity, such as absence from work or work
CE
UeT
DC
olle
ctio
n

36
performance. Both work performance and absence from work measure productivity through
input efficiency/inefficiency-more precisely, labour input efficiency/inefficiency. Literature
have defined labour productivity mostly in three ways:
1. Productivity improvement due to improved indoor air quality: Studies (Fisk and
Rosenfeld 1997; Wargocki, et al. 1999; Wargocki, et al. 2000; Wyon 2004) have shown
that improved indoor air quality enhances the performance of an employee. Poor air
quality affects productivity due to ‘sick building syndrome’ which results in loss of
work opportunity (Burge 2004). The quality of indoor air can be improved significantly
by climate change polices and the effect of improvement on productivity and health
could be quite vast. For instance, Chapman et al 2009 study find that as a result of
building retrofitting, benefit from health and productivity would be around 2488 New
Zealand dollar (NZ$) per household.
2. Productivity improvement due to thermal comfort: The link between thermal comfort
and productivity is well-established in academic literature. Studies show that if
temperature of a workplace is controlled to provide comfort then employee’s
performance can improve significantly (McCartney, and Humphreys 2002; Witterseh,
Wyon, and Clausen 2004; Akimoto,Tanabe, Yanai, and Sasaki 2010). If the optimum
thermal comfort level could not be maintained then productivity decreases
significantly. For instance, Seppanen et al 2004 study finds that an average of 2%
decrease in work performance per degree Celsius has been established when the
temperature is above 25°C.
3. Decline in absenteeism due to improvement in indoor air quality: Poor indoor air quality
does not only affect work performance but it affects quantity of labour input directly
through the absenteeism of employees (Joshi 2008). Several diseases such as
respiratory diseases, allergies etc. caused due to poor indoor air quality, can result in
CE
UeT
DC
olle
ctio
n

37
absenteeism (Milton, Glencross, & Walters 2000; Fisk 2002; Seppänen,& Fisk 2005).
Mendall et al. 2002 study estimated that by reducing indoor air quality induced
absenteeism, US economy can gain more than $6 billion.
These aspects of labour productivity are defined in the context of building sector, more
precisely tertiary building sector. However, there could be other aspects of labour productivity
resulting from energy policies which have not been discussed in the literature. Similar to
building sector, transport sector specific sustainable energy policies can result in productivity
gain by avoiding activity-restriction days (Trubka et al. 2010; Mueller et al. 2015). However,
the effect on labour productivity in transport sector related sustainable energy policies, are not
widely researched. Again similar to building sector, there could be other aspects of labour
productivity which are further discussed in chapter 3 further.
Apart from labour productivity, climate change policies can result in other type of productivity
as well such as crop productivity in agricultural sector, input efficiency for industrial sector
(Olesen, & Bindi, 2002; Worrell, et al. 2003). These productivity improvement are also equally
significant and relevant to explore the full potential of climate change policies. For instance,
Worrell et al 2003 study shows that without including productivity benefits, the potential for
energy savings drops by half from 3.8 GJ of steel to 1.9 GJ. However, since the scope of this
dissertation is only limited to labour productivity, industrial and agricultural productivity have
not been discussed here.
2.1.5 Importance of productivity impact:
Productivity is one of the most important drivers of economic growth and sustainability and
also depends on the availability of the inputs. Despite its importance, many studies have argued
that “productivity has been relegated to the second rank and it is ignored” (Singh, Motwani and
Kumar 2000). However, due to increasing global economic competence, it would be difficult
CE
UeT
DC
olle
ctio
n

38
to ignore labour productivity in the long-run. Thus, to regain the importance of productivity, a
precise identification of different aspects of labour productivity is required to quantify it
rigorously. As already discussed in chapter 1, section 1.2.3, this dissertation only measures
labour productivity-more precisely, labour input efficiency. Improvement in labour
productivity results in a steep rise in output which results in overall productivity growth and
productivity growth is considered as an index for economic growth (Steindel, and Stiroh 2001;
OECD 2011). This dissertation measures labour productivity mostly due to improvement in
health and from table 3, it can be seen that health and productivity benefits are the largest
multiple impacts. The review in table 3 also confirms that health benefits are the most studied
impact. Furthermore, Urge-Vorsatz et al. 2015 study shows that magnitude wise, health and
productivity impacts are the most important impacts of all other impacts of sustainable energy
policies.
Apart from the magnitude of productivity impacts, this dissertation selects productivity impact
among many other impacts due to the following reasons:
1. Relevance: The relevance of productivity is of equal importance for both individuals,
society and investors. Productivity improvement for individuals implies higher standard
of living which is beneficial at the societal level as well (Brynjolfsson 1998). On the
other hand, for an investor productivity improvement implies input efficiency which
leads to profit maximization (Sauian Sahar 2002).
2. Entry point for a policy maker: Considering the magnitude of productivity (refer to
table 3) of improved energy efficiency measure, a policy maker can design a sustainable
energy policy by seeing the effects of energy efficiency measures on productivity. In
long-run the importance of productivity is more crucial compared to short-run. That is
why to explain the significance of productivity Nobel laureate economists Paul
Krugman said “Productivity isn’t everything, but in the long run it is almost everything.
CE
UeT
DC
olle
ctio
n
39
A country's ability to improve its standard of living over time depends almost entirely
on its ability to raise its output per worker”.
3. Goes beyond economics: Productivity improvement in the context of this study context
also refers to improvement in living standards and state of health which have an ethical
ground as well. More precisely, in this dissertation improvement in productivity is
obtained by utilizing the labour inputs at optimum level which is ‘the right thing to do’
(Bowman and Williams 2004). Hence, in this dissertation productivity and ethics are
reciprocally integral because ethics is about ‘doing the right thing’ and productivity is
about ‘doing things right’ and installing energy efficiency measures results in
productivity improvement which means ‘doing right things right’ (Fisk 2000; Bowman
and Williams 2004).
Moreover, productivity impacts of improved energy efficiency measures are not measured
rigorously so far. Also, there are gaps in methodology to quantify productivity in the context
of energy efficiency, hence research on productivity impact has a great potential to contribute
to the knowledge pool. Thus, considering all these reasons, I chose productivity impact among
all the multiple impacts.
2.1.6 Productivity impacts and well-being:
This dissertation postulates two layer framework where national well-being is explained by
individual well-being with respect to more work time opportunity and improved quality of life
through improvement in the state of health and less time spent in road congestion. On one hand,
travel time saving from congestion may not only be spent in work but, it can be spent in leisure
as well. However, time spent in leisure also improves quality of life and hence it improves
overall well-being (Lequiller and Blades 2014). On the other hand, healthy life implies more
productive years and hence, healthy life also indicates enhanced earning opportunity (Van
CE
UeT
DC
olle
ctio
n

40
Praag et al. 2003). By following similar logic, productivity impact through health improvement
has a positive effect on economic well-being because health reflects the constituent of well-
being which means improvement in health would result in more earning opportunities because
health is a key component of well-being (Dasgupta, and Weale 1992). Thus, by improving the
state of health and by saving travel time, productivity improvement can achieve a higher well-
being by achieving a higher economic well-being and improved quality of life. The details of
each indictor of productivity studied in this dissertation are mentioned in chapter 4.
2.4 Summary of the chapter:
To summarise, this chapter discusses the need for efficient use of energy and furthermore, it
discusses how sustainable energy policies can achieve a higher wellbeing. This chapter starts
with defining the different concepts used for energy efficiency and their multiple impacts.
Based on these concepts and definitions, this chapter proposes to use the term multiple impacts
to address all the additional effects of energy efficiency measures. The empirical evidence of
the different type of multiple impacts is presented by reviewing existing studies to show the
importance of multiple impacts. Lastly, this chapter highlights the importance of productivity
impact and also discusses how productivity can lead towards social welfare/economic
wellbeing.
CE
UeT
DC
olle
ctio
n

41
CHAPTER 3: FROM IMPROVED ENERGY EFFICIENCY TO
PRODUCTIVITY
“On climate change, we often don’t fully appreciate that
it is a problem. We think it is a problem waiting to happen.”
Kofi Annan
CE
UeT
DC
olle
ctio
n

42
3.1 Energy efficiency measures
3.1.1 Defining energy efficiency measures:
As discussed in chapter 1, section 1.2.1, energy efficiency measure is an instrument to achieve
an efficient use of energy i.e. using less energy for the same services. This study takes two such
key energy efficiency improvement measures across two different sectors namely:
1. Improved heating, ventilation, and air-conditioning (HVAC) system with an airtight
building envelope in residential and tertiary buildings, and
2. The modal shift towards active transportation in transport sector.
The modal shift towards active transportation is a non-technical measure and as per the
technical definition of energy efficiency, it should not be considered as energy efficiency
measure. However, a behavioural change such as modal shift can reduce energy use and hence
these behavioural changes can be considered as ‘energy efficient’(Roy et al. 2012).
Behavioural change such as modal shift can have a significant implication on energy
consumption and thus, along with technical measures, behavioural measures should also be
seen as an instrument of reducing energy use (Wilhite et al. 2000; Roy et al. 2012). The modal
shift towards active transportation can improve the efficiency of the transport sector. The
European transport policies to foster sustainability and reduced environmental impacts have
been emphasizing modal shift towards active transportation as an energy efficient transport
(Ntovantzi et al. 2015). The energy efficiency potential of modal shift is quite high, but still, it
needs to be researched in order to understand its full potential as an energy efficiency measure
(Faberi et al. 2015). The shift from car to slow mode of transports such as walking, cycling and
also to public transports such as rail, metro, buses, are considered as energy efficiency
improvements (Faberi et al. 2015). Therefore, in this study, the modal shift towards active
transportation is treated as an energy efficiency context.
CE
UeT
DC
olle
ctio
n

43
In building sector, this dissertation accounts for residential building sector and tertiary building
sector where residential building means where people reside and on the other hand, tertiary
building sector covers hotels and restaurants (food), healthcare (hospitals etc.), education
(schools, universities etc.), private and public offices, “trade” (wholesale and retail), and other
(mainly sports facilities, entertainment). Tertiary buildings or buildings in the service sector do
not include buildings in industry or agriculture.
These two energy efficiency improvement measures are selected from the COMBI project
action list (http://combi-project.eu/- WP 2). COMBI project is a part of the European Union’s
Horizon 2020 research and innovation programme under grant agreement No 649724. From
COMBI’s list of 21 improved energy efficiency actions of COMBI, this dissertation selected
two improved energy efficiency measures in two different sectors on the basis of the three
following criteria:
The biggest energy savings potential action in the building sector is selected. To be
precise, improvement in HVAC system with an airtight building envelope has around
68% energy savings potentiality (Couder 2015).
The relevance of energy efficiency measure to health and productivity is also another
key criterion for the inclusion of these measures.
To see the significance of behavioral change in terms of its multiple impacts especially
productivity impacts.
In the following sections, each of the two energy efficiency improvement measures is
discussed.
CE
UeT
DC
olle
ctio
n

44
3.1.2 Energy efficiency measure in building sector- improved HVAC with airtight building
shell:
As per IPCC AR5 report, the building sector contributes "32% of total global final energy use
and 19% of energy-related GHG emissions, in 2010" (IPCC 2014). According to major studies
such as (IPCC 2007; Ürge-Vorsatz and Tirado-Herrero 2012), building end-use sector has the
major potential to offer cost-effective mitigation potential. Thus, installing energy efficiency
measures in the building sector would not only reduce energy consumption but it would also
mitigate GHG emissions. Additionally, building-related energy efficiency measures have
multiple impacts which make them crucial in the context of policy evaluation.
As per Urge-Vorstaz et al. 2012 report, a significant share of building sector related GHG
emission can be avoided by improving the following elements:
Building envelopes
Heating and cooling system
Hot water heating
Lighting
Appliances
Among the above-mentioned list of Urge-Vorstaz et al. 2012 study, building envelope and
space heating have the largest share of energy use in both residential and tertiary building
sector. Installing HVAC system in an airtight building can save up to 60% energy consumption
in the residential building sector and 55% in the tertiary building sector by the year 2030
(Couder 2015). In addition to energy savings, the HVAC system dilutes more than 80% of the
indoor air exposure mainly aerosols which results in the improvement of indoor air quality
(Bonetta et al. 2010). Indoor air condition is dependent on some time-dependent factors such
as humidity, indoor air temperature, indoor air velocity etc. and most of these factors can be
CE
UeT
DC
olle
ctio
n

45
controlled by an energy efficient HVAC system (Atthajariyakul and Leephakpreeda 2004).
Hence, it is safe to say that an energy efficient HVAC system can obtain acceptable indoor air
quality with efficient energy consumption.
Buildings without airtightness consume more heat because outdoor air comes indoor through
building leakages across building shells (Liu, and Nazaroff 2001; Urge-Vorsatz et al. 2012).
Even buildings with HVAC system can have the same issue if they have a leaked building
envelope (Urge-Vorsatz et al. 2012). In addition, faulty design and installation can also cause
discomfort and fewer energy savings. In fact, microbiological growth may take place inside an
HVAC system equipped with “low-efficiency filters, humidifiers that use water recycling or in
areas in which water condensation remains stagnant and large recirculation of the air is present”
(Bonetta et al. 2010). These microorganisms inside HVAC can spread in the indoor air which
may cause several respiratory diseases. Thus, while installing an HVAC system, it is important
to make sure that the system especially the ducts have been designed and installed properly.
Most of the HVAC system is designed for extreme conditions and since most of the time key
operations such as occupancy, ambient temperature etc. keep on changing, the system can
become unstable without having a control system. Thus, the control system is another key
component in the HVAC system. Control system mainly controls temperature (thermostat
control) and time (programmable timer). These control systems ensure heating and cooling
operation only when it is required which saves energy along with maintaining thermal comfort
(Eskom 2015).
3.1.3 Type of energy renovation in building sector:
People spent 90% of their time in indoor and if the indoor air quality is not healthy then health
risk would increase rapidly. The two key issues with indoor quality in Europe as per WHO
2010 report are 1) Biological indoor air pollutants such as dampness and mould, 2) Chemical
CE
UeT
DC
olle
ctio
n

46
indoor pollutants such as radon, carbon monoxide etc. To improve the indoor air, adequate air
circulation is mandatory and as discussed air circulation through ventilation should be
maintained in an airtight building. Thus, renovation of the old building is a requirement not
only to reduce energy use, but also in order to improve the indoor environment.
There are many types of renovation or retrofits option available for buildings such as
stabilization strategy (STA) (where only incremental intervention happens without changing
the appearance or substance of the buildings), the substitution strategy (SUB) (where certain
elements of the buildings are changed completely) and the double-skin façade strategy (DSF)
(where partially stabilizing the existing façade takes place with adding an new glass skin) (Rey
2004). However, it is important to note that these building elements have a limited span which
varies considerably. Generally, the duration of a retrofit cycle would be around 25-30 years
(Rey 2004).
The main objective of energy retrofit measures is to reduce the energy consumption while these
measures need to be cost-effective as well. However, studies show that the most efficient
retrofit measures are not always the most cost-effective energy saving options (Doyoon 2010;
Chidiac, Catania, and Morofsky 2011). For instance, improvement in the thermal efficiency of
the window can result in the largest energy savings, but also the investment in the window
efficiency is quite high. On the contrary, improvement in walls brings not only energy savings
but the investment for this is lower than that for the window (Chidiac, Catania, and Morofsky
2011). Hence it is not always the case that measures with the largest energy savings potential
are the most cost-effective option as well.
Furthermore, the standard retrofit measures such as building shell upgrades can be combined
with more radical measures to utilize the natural light and also to use solar energy for heating
and cooling (Ürge-Vorsatz et al. 2007). Therefore, depending on the renovation, there are
CE
UeT
DC
olle
ctio
n
47
different types such as light retrofitting, medium retrofitting and deep retrofitting. The standard
types of retrofitting also varies as per the climatic condition. For example, light type of
retrofitting means 5 cm external insulation added to the wall in a building in Rome. However,
the same light type of retrofit scheme, in Helsinki is 10 cm external insulation added to the wall
(Boneta 2014; COMBI 2018).
In order to retrofit a building the following conditions need to be installed/maintained as per
Couder 2015 study:
1) A high level of insulation needs to be installed on the building envelope
particularly in the roof and wall.
2) Energy efficient windows should be installed which includes insulating
windows with double low-e glazing and low conductive frames.
3) Optimal fenestration for (passive) solar gains and daylighting, for new
construction.
4) Minimum thermal bridging. No (new construction) or reduced (retrofits)
thermal bridges.
5) High level of air tightness or air sealing. Restrict the (uncontrolled) passage of
air through the building envelope, with air changes per hour (ACH) ≤ 3.0 for
retrofits; and ≤ 0.5 with mechanical ventilation including efficient heat recovery
for new construction (Couder 2015).
6) The right size of the heating system in order to provide the adequate heating.
7) Opting for the right heating systems that can operate efficiently at part load. For
example, install a variable capacity boiler systems (Couder 2015).
In general, different buildings are categorized based on many other factors such as location
(urban, rural, slum), building type (single-family, multifamily, commercial and public
CE
UeT
DC
olle
ctio
n

48
buildings), and building vintage (existing non-retrofitted, new, light retrofitted, medium
retrofitted and deep retrofitted) (Urge-Vorsatz et al. 2012). Furthermore, the urban residential
buildings can be classified further into single family and multi-family based on the population
living in each type of building. Table 5 shows the share of the population living in different
classified buildings across 4 regions.
Table 5: share of population living in single and multi-family buildings.
Location Single family type
buildings
Multifamily type buildings
US 72% 28%
EU-27 41% 59%
China 3% 97%
India 25% 75%
Source: (Urge-Vorsatz et al. 2012)
Table 5 shows that majority of the population in Europe lives in multi-family buildings (more
levels, terraced, etc.) , while in the US the scenario is opposite i.e. more people are living in
single-family type buildings (detached or attached). However, in China and India, majority of
the people are living in multi-family type buildings and one of the reasons behind this scenario
could be the huge population of these two countries. Now, these different types of retrofit
require maintaining specific criteria to renovate building envelope and as discussed, these
criteria vary across different building types and different countries (mainly because of the
difference in temperature).
3.1.3.1 Passive houses and NZEB buildings
Apart from different types of retrofitting, there are few energy efficient building types which
ensure optimal energy savings with the healthy indoor environment. There are few relatively
new concepts of these kinds of buildings namely passive houses and nearly zero buildings
CE
UeT
DC
olle
ctio
n

49
(NZEBs) which can be both residential and tertiary types. Both passive house and NZEBs type
of buildings are discussed below in detail:
Passive houses: The concept of the passive house refers to certain construction standard which
helps in meeting the criteria of low energy house standard. These construction standards can
be met by using different energy-saving technologies, sustainable design and materials
(Schnieders and Hermelink 2006). There are three basic components of passive houses namely
superinsulation, heat recovery and passive solar gain (Schnieders and Hermelink 2006). In
addition, passive houses have a continuous supply of fresh air through a mechanical HVAC
system. The airflow is regulated to deliver optimum health and comfort benefit (Audenaert, De
Cleyn, and Vankerckhove 2008).
Studies show that in winter time the mean temperature of passive houses remains between 21-
22 degree and in summertime the mean temperature lies within 27 degrees (Schnieders and
Hermelink 2006). The ventilation system in passive houses is generally driven by highly energy
efficient motors which consume an average 0.4 W/(m3/h) or less energy (Schnieders and
Hermelink 2006). Figure 3 below shows the ventilation system in passive houses.
CE
UeT
DC
olle
ctio
n

50
Figure 3: Ventilation system in passive houses
Source: (Passipedia 2017)
Similar to the normal mechanical ventilation system, the ventilation system in passive houses
follows the same principle i.e. it removes the used air from the bedroom, kitchen, bathroom,
toilet and in return fresh air from outside replaces the indoor air. As per Passipedia website
“ventilation can also take place if a simple exhaust air system and external air inlets are used.
The external air inlets let fresh (cold) air in the required amounts into the rooms. However, for
the Passive House, the ventilation heat losses that would be caused by the disposal of the
unused extract air would be much too high. It would only be possible to adjust the energy
balance with a high heating output”. Thus, the heat recovery system is a crucial component in
the passive house design. Heat recovery system recovers the heat from the exhaust air and by
using a heat exchanger, it transfers the heat back into the supply air without mixing the air
CE
UeT
DC
olle
ctio
n

51
flows. The modern ventilation technology allows a heat recovery rate up to 95 % (Passipedia
2017). Moreover, heat recovery systems help in recovering the heat in the following way:
The used polluted heated air flows through a duct and transfers its heat to the plates above and
below. Then, it cools down and exits from the other side of the duct. Outdoor fresh air comes
through the other side of the ducts and on the other side of the plates. Then, the used fresh air
takes up the heat and becomes warm (but still fresh). Then it is ready for supply air.
Nearly zero energy buildings: Nearly zero-energy building (NZEB) refers to a building which
requires a low amount of energy and this requirement should be covered from renewable
sources, including energy from renewable sources produced on-site or nearby (Kurnitski et al.
2011). The building sector is responsible for 36% CO2 emission in Europe, and hence the
importance of the new concepts such as nearly zero buildings is growing as a mitigation tool
for greenhouse gas reduction (BPIE 2011).
Furthermore, the recast Directive on the energy performance of buildings (EPBD) stipulates
that “by 31 December 2020, all new buildings are nearly zero energy buildings and after 31
December 2018, new buildings occupied and owned by public authorities are nearly zero-
energy buildings” (EU DIRECTIVE 2010). This means that in less than one decade, all new
buildings would have a high energy performance and their energy needs would cover by
renewable energy sources. In order to have a low energy demand, buildings would need to have
a high level of insulation, energy efficient windows, mechanical heating, and ventilation system
with heat recovery along with other equipment similar to the passive house and deep retrofitted
buildings (BPIE 2011). However, the technical requirement of NZEB would vary as per the
country’s national, regional or local conditions (EU DIRECTIVE 2010). The difference
between a passive house and NZEB mostly concerns with total primary energy input and
annual heating demand. More precisely, in passive houses, the annual heating energy
CE
UeT
DC
olle
ctio
n

52
requirement must not exceed 15 kWh/m²a and the total primary energy input must not exceed
120 kWh/m²a (Schulze Darup, et al. 2015). Whereas, in NEBs, there exists no such stringent
mandates regarding heating demand and primary energy input. However, the energy source for
NZEB should be covered from the renewable energy source and for the passive house, there is
no such requirement.
3.1.4 Energy saving potential of transport sector
The transport sector is gaining importance in modern urbanization. As per IPCC AR 4 report,
the biggest concern in the transport sector is associated with road accidents, air pollution, traffic
congestion, and petroleum dependence (IPCC 2007). In addition, oil is the most used natural
resource for road transport which accounts for 81% of total energy use (Chapman 2007). Over
53% of global oil consumption is used to meet 94% of total transport energy demand and rest
of the energy demand were met by electricity, natural gas and other fuels (IEA 2012; Sims et
al. 2014). As per IPCC AR5 report, the transport sector is responsible for 23% of total energy-
related CO2 emissions (6.7 Gt CO2) (Sims et al. 2014). The transport sector is crucial since it
is not only used for communication but for delivery of goods and services too. Furthermore,
transport has become a major industry in itself. Passive mode of transport such as car usage is
responsible for several GHG emissions. Fuglestvedt, et al. 2008 study summarizes the four
main ways by which emissions from this mode of transport can affect climate:
1) Emission of direct GHG mostly CO2,
2) Emission of indirect GHG such as ozone (O3), nitrogen oxides (NOx), carbon
monoxide (CO), and Volatile organic compound (VOC),
3) The direct effect of emission of aerosols such as black carbon, organic carbon, and
sulfur compounds, and
4) The indirect effect of aerosol emission which changes the distribution and properties of
clouds.
CE
UeT
DC
olle
ctio
n

53
Furthermore, it was believed that increasing travel demand can be satisfied by having more
motorways. However, this assumption is proven wrong by the rise in congestion time. It is
realized that increase in cars and motorways can have other side-effects such as air pollution,
traffic congestion, noise and road accidents along with excessive use of fossil fuel which is a
non-renewable energy source (Greene and Wegener 1997). Therefore, the modal shift towards
active transportation such as walking, cycling etc. could be an optimum solution to these
problems (Cuenot, Fulton, and Staub 2012). The modal shift in passenger transport do not only
reduce traffic congestion but it also has a potential for EU 27 countries to save 9% of energy
use which is equivalent to 14 MTOE by 2030 (Couder 2015).
3.1.4.1 Modal shift towards active transportation:
The modal shift towards active transportation could potentially contribute towards the
transition to a more energy-efficient transport sector because modal shift can help in achieving
the 60% GHG emission reduction target by 2050 set in the 2011 White Paper (Faberi et al.
2015). The active form of transportations includes walking, cycling and use of public transport.
These are called active because to use these modes of transport some kind of physical activity
is required. Even public transport falls into this category since it requires some walking or
cycling at either end of the journey (Shannon et al. 2006). The choice of mode of transport
depends on several factors such as the type of journey, service performance, flexibility and
comfort etc. (Kuppam, and Pendyala 1999; Cools et al. 2009).
The rate of active transportation per country is taken from COMBI input data which calculates
the rate of modal shift by considering the use of active transportation in 2015. For example,
the share of slow modes such as cycling and walking during peak hours in Hungary was 19.2%
in 2015 and in Germany, the share of slow mode during peak hours was 34.4% in 2015
(COMBI 2018). It is worth noting that as per the COMBI assumption, the mode of transport
CE
UeT
DC
olle
ctio
n
54
reported here is during peak hours (6:00-10:00 and 16:00-20:00) only when most of the people
commute. Further details of modal shift effects are discussed in section 3.2.2.
3.2 Energy efficiency and its impact
Different energy efficiency measures yield different impacts. Thus, this dissertation considers
two specific energy efficiency measures namely heating-ventilation and air-conditioning
system (HVAC system) with proper building shell and modal shift towards active
transportation. By installing these energy efficiency measures indoor exposure can be reduced.
As a result of modal shift measure, more time can be gained by avoiding road congestion and
outdoor exposure. The impact on productivity by adopting these two energy efficiency
measures is discussed in the sections below.
3.2.1 Productivity implication of HVAC with building shell:
As discussed in section 3.1.2, installing an energy efficient HVAC system in an airtight
building can save up to 60% energy consumption in residential building sector and 55% in
tertiary building sector. In addition to energy savings, the HVAC system dilutes more than 80%
of the indoor air exposure mainly aerosols via constant adequate air exchange rate (Bonetta, et
al. 2010; Couder 2015). Simultaneously, an airtight building shell would reduce the infiltration
of outdoor air pollutants which also result in improvement of indoor air quality. This
improvement in indoor air quality ultimately improves productivity by reducing indoor
exposure-related disease.
In most cases, building sector related energy efficiency measures have an effect on productivity
via the lens of indoor air quality. For example, due to the implementation of energy efficiency
measure such as installing the HVAC system with proper building shell stimulates the indoor
air exchange rate which reduces the pollutant concentration. Source of these pollutants could
be both from indoor and outdoor. Outdoor pollutants infiltrate indoor through building cracks
CE
UeT
DC
olle
ctio
n

55
and ventilation (Asikainen et al. 2016). These pollutants can be a cause for not only many
diseases but it also can affect the performance of a worker. For instance, Hepm 2004 study
shows that when pollen concentration increases labour productivity decreases and vice-versa.
Indoor air quality plays an important role in the general state of health as people spend most
of their time indoors i.e. either at work or at home or school (WHO 2006). WHO 2006
guidelines for indoor air quality identify three specific issues which are affecting indoor air
quality and human health. These three key issues are:
1) Biological indoor air pollutants such as dampness and mould,
2) Chemical indoor pollutants such as radon, CO etc., and
3) Pollutants from indoor combustion of fuels.
Studies show that sufficient air exchange rate is one of the key tools in order to remove
humidity, carbon dioxide, bioeffluents and other pollutants of indoor air (WHO 2006;
Asikainen et al. 2016). Despite this fact, presently, ventilation standards in nonindustrial
buildings are seen to meet the comfort requirements of occupants or to control the intensity of
odour presence (Hänninen, and Asikainen 2013). Thus, ventilation related health benefits are
ignored so far. Although studies have shown that thermal comfort improves the performance
of an individual, it has little to do with eradicating diseases related to indoor air quality
(Wargocki et al. 2002; Asikainen, et al. 2016). Ventilation exchanges indoor air (polluted) with
outdoor air (presumably fresh and clean air, but contains some outdoor pollutants) in order to
provide an optimum condition to live healthy in the indoor environment (Wargocki et al. 2002).
Ventilation does not only provide fresh air for breathing but it also reduces moisture and dilute
indoor pollutant exposure which ultimately improves human health (Wargocki et al. 2002).
There exists an inverse relationship between the indoor air pollutant concentration and the rate
of ventilation. This means the higher rate of ventilation, the lower the corresponding indoor
CE
UeT
DC
olle
ctio
n

56
concentration, the later however never reaches zero (Atkinson 2013). Figure 4 shows this
relationship between the rate of ventilation and indoor pollutant concentration.
Figure 4: Relation between air exchange rate and indoor air pollutant concentration. X axis shows the air exchange rate,
per hour (ach, h-1) which is the rate of ventilation and Y axis shows the relative concentration of indoor pollutants
Source: Hänninen and Asikainen 2013
Several studies argue on the appropriate amount of ventilation rate “but the common conclusion
was increasing the ventilation rate from 10 l/s per person up to 20 l/s per person may further
reduce sick building symptoms” (Wargocki et al. 2002). In tertiary buildings, higher ventilation
rate up to about 25 l/s per person is associated with reduced prevalence of indoor air quality
related diseases (Hänninen and Asikainen 2013; Asikainen, et al. 2016). Any rate below 10 l/s
per person ventilation rate, would lead to high indoor humidity, and moisture on building
structure (Wargocki et al. 2002; Fernandes et al. 2009). High indoor humidity and moisture
result in high dust mites presence and higher microbial growth which could be a source of
building-related disease (Fisk, and Rosenfeld 1997; Jones 1999; Fernandes et al. 2009).
Ventilation process involves airflow between the rooms by either natural forces such as thermal
CE
UeT
DC
olle
ctio
n

57
buoyancy and wind or by mechanical processes such as air-conditioning. This air circulation
inside the buildings does not only reduce moisture but it also improves thermal comfort level
which ultimately has an impact on work performance (Wargocki et al. 2002; Li 2007).
Ventilation plays a dual role by reducing indoor air pollutant concentration and on the other
hand by infiltrating outdoor pollutants such as particulate matter, particulates of biological
origin (microorganisms, pollen, etc.), NOx, Ozone (O3) etc. (Asikainen et al. 2016). In
buildings with the HVAC system installed, it is possible to reduce the concentrations of certain
outdoor pollutants indoor by installing an efficient filter (Fernandes et al. 2009). However, if
HVAC system is not properly maintained then it can be a source of pollutants (such as VOC)
itself (Wargocki et al. 2002). Thus, it is crucial to maintain the HVAC system. More precisely,
it is necessary to clean the component and surface of the HVAC system which includes
changing the cooler coil, humidifier and cleaning the duct frequently (Fernandes, et al. 2009).
Furthermore, if HVAC system is installed in a non-airtight building then the effect of installing
HVAC system will be minimized since outdoor air pollutants would enter the building through
the envelope (wall, roof) cracks (Asikainen et al. 2016). The building envelope is the physical
border which separates the building interior and exterior. By improving the conditions of a
building envelope, a building would not only consume less energy for heating, cooling, lighting
but also the outdoor pollutants infiltration would be less (Chwieduk 2003; Sadineni, Madala,
and Boehm 2011). Thus, it can be said that a good quality building envelope does not only save
energy but it also improves the building's indoor air quality. Therefore, it is important to make
the building airtight before installing an HVAC system otherwise the effects of HVAC system
would be minimized due to the presence of outdoor air pollutants.
3.2.1.1 Building related diseases which are affecting productivity
The burden of disease includes many diseases such as asthma, cardiovascular disease, cold and
flu, cancer and many unknown symptoms which may be caused by poor indoor building
CE
UeT
DC
olle
ctio
n

58
conditions (Jones 1999; Hänninen and Asikainen 2013; Asikainen et al. 2016). Mainly two key
terms are used to define these diseases and symptoms related to poor building conditions.
Among these two terms, the most popular term to define this situation is called ‘sick building
syndrome’ (SBM). Redlich et al 1997 study describes ‘sick building syndrome’ as “non-
specific complaints, including upper-respiratory irritative symptoms, headaches, fatigue, and
rash, which are usually associated with a particular building by their temporal pattern of
occurrence and clustering among inhabitants or colleagues”. The other term used to define
the situation is building related-illness (BRI). BRI is caused by specific pollutant exposures in
indoor environments (Redlich 1997). Cross 2001 study describes BRI as diseases occurring at
schools or commercial buildings. However, studies have confirmed that building related illness
depends on building environment and not on building types (Redlich 1997; Kreiss 2005; Crook,
and Burton 2010). Though, it is true that for some contagious diseases such as cold and flu,
eye infection etc. the intensity of BRI could be much higher at office buildings, but still these
type of illnesses have nothing to do with the type of buildings, but rather they depend on
occupancy rate (Kreiss 2005; Crook, and Burton 2010).
The burden of diseases due to indoor exposure to pollutants could be as high as 10,000
disability adjusted life years loss (DALY) per million (Hänninen and Asikainen 2013). Figure
5 below shows the intensity of indoor air pollution exposure.
CE
UeT
DC
olle
ctio
n

59
Figure 5: Total burden of disease as DALY/million population from indoor exposures in European countries
Source: (Hänninen and Asikainen 2013)
Figure 5 shows not only the effects of indoor air pollutants but also the effects of outdoor air
pollutants infiltrating indoor.
The section below discusses these indoor and outdoor air pollutant concentration-caused or
building related-diseases and mental well-being related effects one by one.
Asthma: Poor ventilation and absence of filtration in buildings can cause lower respiratory i.e.
asthma and acute COPD diseases (Jones 1999; Fisk 2000; Guarnieri, and Balmes 2014). As
per global asthma network (GAN) 2014 report, asthma can be defined as "disease of the
bronchial tubes in the lungs (the airways) and people with asthma typically experience
wheezing, a high-pitched whistling sound heard during breathing, especially when breathing
out" (GAN 2014).
CE
UeT
DC
olle
ctio
n

60
Exposure-related to building dampness, house dust mites, moulds and bacteria lead towards
lower-respiratory diseases (Norbäck et al. 1999). Among the indoor air pollutants, exposure to
mould is a major concern for human health. Mould augmentation largely depends on several
in-house characteristics such as house surface, humidity, and temperature (Rylander and Lin
2000). As per Fisk's study, exposure to mould in a building is associated with 100% increases
in asthma (Rylander, and Lin 2000; Fisk 2002). On the other hand, exposure to particulate
matter (PM), ozone, nitrogen dioxide and other air pollutants which are generated mainly from
traffic and power generation, can cause asthma and other respiratory diseases (Guarnieri and
Balmes. 2014). These outdoor air pollutants infiltrate indoor through the cracks in building
envelopes.
The effect of asthma and allergy would vary as per the age and their effect on productivity
would also be different. For example, if a child misses too many school days due to asthma
then it would have an impact on the parent’s income and it would have an impact on the future
earning ability of the child (Chatterjee and Ürge-Vorsatz 2017). In fact, too many school days
loss may disrupt a child's learning and could be one of the causes for dropping out of school
and it has been observed that children who have asthma, are more absent from school compared
to their healthy classmates (Moonie et al. 2006). More details are explained in chapter 4, section
4.3.2.
In addition, there are several outdoor air pollutants such as nitrogen dioxide, particles, and
sulphur dioxide which cause asthma. The key source of these air pollutants is fuel combustion
from industry and transport (Schwartz, and Morris 1995; Ürge-Vorsatz et al. 2014; Guarnieri,
and Balmes. 2014).
Cardiovascular disease: Airborne particle and sulphur dioxide concentrations can cause
cardiovascular disease especially ischemic heart disease (Schwartz and Morris 1995). Brook et
CE
UeT
DC
olle
ctio
n

61
al 2010 study shows that "a 10-ug/m3 increase in mean 24-hour PM2.5 concentration increases
the relative risk (RR) for daily cardiovascular mortality by approximately 0.4% to 1.0%"
(Brook et al. 2010). Cardiovascular disease causes the majority of the burden of diseases from
air pollution. Among the total burden of diseases in Europe, 57% is contributed by
cardiovascular diseases (Asikainen et al. 2016). Asikainen et al 2016 study shows how much
various air pollutant cause diseases in the total burden of diseases and “cardiovascular diseases
are followed by asthma (total of 12%) and lung cancer (23%)”. The rest of the burden (8%)
comes from different upper and lower respiratory symptoms and conditions (Asikainen et al.
2016).
Apart from air pollution, another key reason behind the risk of having cardiovascular diseases
is physical inactivity. Physical inactivity is responsible for 30% of cardiovascular disease
especially ischemic heart disease (WHO 2010). In this study, the modal shift towards active
transportation is one of the most important energy efficiency measures and through the modal
shift, there can be a positive impact on health as well by being physically active. Similar to
asthma, cardiovascular diseases also affect different aspects of productivity (Brunekreef, and
Holgate. 2002).
Cold and flu: Diseases such as cold and flu occur mainly due to inhalation of airborne
infectious aerosols and aerosols exposure increases by lack of filtration, low air exchange rate,
high occupancy rate, air temperature and humidity (Fisk 2000). These infectious aerosols
contribute substantially to the common colds and influenza-related respiratory disease
(Husman 1996). The key cause of the infection is usually common respiratory pathogens,
viruses causing common cold and flu (Miller 1992; Husman 1996). Indoor environmental
conditions such as exposure to mould and humidity contribute to higher aerosol exposure (Fisk
2000). Thus, buildings with low ventilation rate would have substantially higher respiratory
diseases.
CE
UeT
DC
olle
ctio
n

62
Apart from common cold and flu and asthma, there are several other respiratory diseases such
as bronchiolitis, pneumonia which are partially caused by damp and mould (Asikainen et al.
2016). These circulatory diseases cause 40% of excess winter deaths (Marmot Review 2011).
Thus, cold, and flu-related productivity loss could be huge.
Cancer: Cancer is a disease which causes “a proliferation of mesothelial cells” (Jones 1999).
It is one of the most serious health hazards from indoor exposure. Exposure to both indoor and
outdoor air pollutants such as radon, asbestos, formaldehyde, micro-organisms, sulphate, and
particulate matter cause cancer especially lung cancer (Jones 1999; Brunekreef, and Holgate.
2002; Boffetta 2006; Hamra et al. 2014). Among these pollutants, particulate air pollutants
(equal to or less than 2.5 µm) are the largest threat since they can be breathed deeply into the
lung which may cause lung cancer (Pope et al. 1995). These fine particulate matters are mostly
derived from combustion of fossil fuels in processes such as transportation, manufacturing, and
power generation (Pope et al. 1995; Pope et al. 2002). Pollutants which are derived outside,
infiltrate indoor and since people spend most of their time indoors, the exposure period
becomes higher inside (Atkinson 2013).
Ability to concentrate and mental well-being: Ability to concentrate depends on work and
home atmosphere. One may get disrupted by certain symptoms such as eye irritation (eye tears
and eye blinking), skin irritation (Mølhave, Bach, and Pedersen 1986). These irritations may
occur due to the presence of fungi and moulds at the workplace or at home. Exposure to moulds
and the fungi (especially black fungi) and their spores have certain effects on skin and eye.
Mould and fungi growth can be reduced by improving the building shell and by implementing
stringent air filtration (Singh 2005). Apart from mould and fungi, indoor CO2 concentration
can hamper a person’s concentration by causing several health obstacles such as a headache,
fatigue, eye symptoms, nasal symptoms etc. (Apte, Fisk, and Daisey 2000).
CE
UeT
DC
olle
ctio
n

63
On the other hand, studies (see (Shortt, and Rugkåsa 2007; Howden-Chapman et al. 2007;
Bond et al. 2012; Liddell and Guiney 2015) have shown that there exists a positive correlation
between mental well-being and indoor environment. Mental well-being refers to two
dimensions namely mental health and mental disorder. WHO 2013 report defines mental health
as “a state of well-being in which the individual realizes his or her own abilities, can cope with
the normal stresses of life, can work productively and fruitfully, and is able to make a
contribution to his or her community” (WHO 2013). Whereas mental disorder is defined as “a
syndrome characterized by a clinically significant disturbance in an individual’s cognition,
emotion regulation, or behaviour that reflects a dysfunction in the psychological, biological, or
developmental processes underlying mental functioning”(American Psychiatric Association
2013; Liddell, and Guiney 2015). Mental health includes positive outcomes such as greater
productivity, an increased resilience to adversity, better physical health and longer lifespan
whereas mental disorder includes stress, anxiety, discomfort and depression (Liddell and
Guiney 2015). Both mental health and mental disorder are associated with poor housing
condition (Howden-Chapman, et al. 2007; Bond, et al. 2012). For example, households with
poor thermal comfort are associated with psychosocial stress which deteriorates the mental
well-being (Gilbertson, Grimsley, and Green 2012). Another aspect of having mental stress
comes from affordability. To be precise, for instance, when people experiencing accumulative
sources of stress such as thermal discomfort from a cold and damp house combined with
financial worries caused because of high energy price, their mental vulnerability increases
exponentially (Liddell and Guiney 2015).
As it is discussed in the above paragraphs, different pollutants can cause different diseases. The
pollutant-specific diseases and their sources are shown with the help of table 6 and 7 which
summarize the sources of all indoor and outdoor air pollutants. Furthermore, these two tables
show not only the sources of these pollutants but also what diseases they can cause.
CE
UeT
DC
olle
ctio
n

64
Table 6: Sources of indoor air pollutants and disease associated with it
Pollutants Source Affected health aspect
Allergens Indoor dust, domestic
animals, and insects
Respiratory disease, skin
and eye irritation
Asbestos Fire retardant material and
insulation
Lung and kidney cancer
Formaldehyde Particleboard, insulation,
furnishings
Cancer, skin and eye
irritation
Micro-organisms People, animals, plants, air
conditioning systems
Cancer and heart disease
Pollens Outdoor air, trees, grass,
weeds, plants
Respiratory disease
Dampness and mould Structural moisture,
humidity
Respiratory disease
Radon Soil, building construction
materials (concrete, stone)
Lung cancer
Fungal spores Soil, plants, foodstuffs,
internal surfaces
Respiratory disease
Source: Own elaboration (data extracted from (Jones 1999; Fisk 2000; Katsouyanni 2003;
Sundell 2004; Fisk 2009; Hänninen, and Asikainen 2013)
Table 6 shows the indoor air pollutant sources and their consequences on the human health.
Here, for radon especially one point needs to be noted that radon infiltrates mainly from the
soil below the buildings (Stoulos, Manolopoulou, and Papastefanou 2003). Furthermore, the
infiltration of radon may increase at a higher rate of ventilation (Atkinson 2013).
Table 7: Sources of outdoor air pollutants and disease associated with it
Pollutants Source Affected health aspect
Nitrogen dioxide Outdoor air, fuel burning,
motor vehicles in garages
Respiratory and
cardiovascular disease
Particulate matter Tobacco smoke, combustion
products
Respiratory ,cardiovascular
disease, cancer
Polycyclic aromatic
hydrocarbons
Fuel combustion, tobacco
smoke
Cancer
CE
UeT
DC
olle
ctio
n

65
Pollutants Source Affected health aspect
Sulphur dioxide Fuel combustion Respiratory disease
Ozone Fuel combustion Respiratory disease
Carbon monoxide Fuel combustion Headache, dizzy feeling
which affects productivity
Source: Own elaboration (data extracted from (Schwartz, and Morris 1995; Jones 1999;
Brook 2004; EPA 2015)
Similar to radon exposure, carbon monoxide exposure may increase at a higher rate of
ventilation. Thus, it is important to assume a “mass-balance for a constant source term” for any
quantitative burden of disease calculation (Atkinson 2013).
To summarise, this section describes the extent of the burden of diseases from indoor exposure
in Europe by discussing indoor exposure-related diseases. Each of these diseases and
conditions is explained in detail to provide an overview of the extent of indoor exposure. Also,
there could be few symptoms such as a headache, eye and skin irritation, as well as mental
health-related issues which cannot be considered as diseases. Hence, these are discussed from
concentration ability and mental well-being perspective. By enabling these details, this section
also shows how indoor exposure affects productivity through different diseases and mental
well-being.
Installing energy efficiency measures such as improved heating, ventilation and air
conditioning system in an airtight building, improves indoor air quality which in turn improves
health and improvement in health implies an improvement in productivity (Koopman et al.
2002).
3.2.2 Productivity impacts of modal shift towards active transport:
Energy efficiency measures in the transport sector can be crucial as final energy consumption
in the transport sector depends on two factors namely 1) specific energy consumption and 2)
CE
UeT
DC
olle
ctio
n

66
mobility (Usón et al. 2011). Thus, energy efficiency measure such as modal shift helps saving
energy without disrupting mobility. European Commission’s 2011 white paper sets the target
of reducing 20% of GHG emission from the transport sector by 2030 compared to emissions
in 2008 (European Comission 2016). Along with GHG emission, another major issue with the
transport sector is its increasing traffic. The increased traffic/road congestion level reduces
mobility which is an economic loss to the society (Quddus, Wang, and Ison 2009; Usón et al.
2011). Thus, energy efficiency measure like modal shift towards active transportation can play
a crucial role by not only reducing the energy consumption but also by reducing the road
congestion.
The use of car has been increasing due to a variety of reasons such as urban sprawl, intrinsic
appeal of automobiles, a certain change in the labour market in terms of flexibility and mobility
(Greene and Wegener 1997; Cools, et al. 2009). Within the European Union, passenger cars
accounted for 83.2% of inland passenger transport in 2013 (Eurostat 2016). Studies show that
this dominant car dependence may lead to several adverse socio-economic and environmental
impacts (Cools et al. 2009; Cuenot, Fulton, and Staub 2012). The range of adverse impacts is
the following:
1. Environmental damages- GHG gasses such as CO2, methane, NOx emit from car fuel
which causes serious trouble for the environment.
2. Economic loss: Due to use of excessive non-renewable energy sources for cars, the
stock of renewable source decreases which also diminishes the value of an economy
(Cools, et al. 2009). In Europe, most of the countries use petrol powered engines
(Eurostat 2016). For example, in Hungary, around 2.3 million cars run on petrol
whereas, in Germany, there are 29.8 million petrol powered cars on the road (Eurostat
2016). These figures show the intensity of dependence on petrol powered engine cars.
Moreover, due to excessive car use, the road congestion increases which causes work
CE
UeT
DC
olle
ctio
n

67
time opportunity loss and hence productivity loss. This has further implications on the
economy (Cools, et al. 2009).
3. Societal loss: Due to excessive passive commute, there could be several health impacts
such as traffic casualties, respiratory and cardiovascular diseases and loss of community
space (Cools, et al. 2009).
Despite the technological advancements in transport to make cars more eco-friendly still, most
of the countries use petrol powered engines in Europe (Cools, et al. 2009; Eurostat 2016).
Therefore, policymakers have to put more focus on reducing the car usage.
Lately, many of the European countries are promoting active transportation through their
policies such as low-cost rental service of by-cycles, making new and broader cycle and
walking ways etc. (De Hartog et al. 2010). However, this attempt for the modal shift is not easy
since car is also considered as a social status symbol and this is one of the reasons why people
being aware of the adverse impact of cars, are still using them (Cools et al. 2009).
The choice of mode of transport depends on several factors such as the type of journey, service
performance, flexibility and comfort etc. (Kuppam, and Pendyala 1999; Cools et al. 2009). For
instance, the car users often claim to choose a car as their mode of transport because of its
speed, flexibility, convenience and perceived joy of driving (Bamberg 2003; Anable 2005).
However, Steg (2005) conducted a case study in the Netherlands and found out that the
‘symbolic and affective functions’ such as superiority, power, feeling of sensation are also
playing a crucial role in determining the choice of transport. Thus, it is safe to conclude that
the choice of mode of transport involves many other factors beyond speed, flexibility, and
comfort. In this dissertation, however, the choice of transport is beyond the scope of research.
More precisely this study quantifies the effects of modal shift towards active transportation,
which implies that the choice of transportation is given. The rate of active transportation per
CE
UeT
DC
olle
ctio
n

68
country is taken from COMBI input data that calculates the rate of modal shift by considering
the use of active transportation in 2015.
Usage of cars mainly have two key effects (apart from energy savings) namely health effects
and effects on road congestion. Each of these effects are described below:
3.2.2.1 Health Effects:
The modal shift towards active transportation has two types of health impact: 1) negative health
impacts and 2) positive health impacts. Positive health impact includes improvement in health
by avoiding outdoor air pollution and noise position, improvement in health by being
physically active. On the flip side, negative health impact includes road accidents, more
exposure to outdoor pollutants for the individual who has opted for active transportation.
Both of these health effects are discussed in the section below:
1) Positive health effects:
Reduction in air pollution: Usage of motor vehicles can affect the state of health by emitting
health hazard pollutants and the emission from the transport sector happens mainly in two
ways:
1. Direct CO2 emission from motor vehicle usage: Burning of fuels emits more than 99%
of the carbon in a fuel (EPA 2014). Along with CO2 burning of fossil fuel also emits
nitrogen dioxide (NO2), hydrocarbons and PM. Exposure to these pollutants can cause
several diseases such as lung cancer, respiratory disease (Xia et al. 2015). Among these
pollutants, the suspended particulate matter of different sizes and composition can
shorten the lifespan significantly (Pearce 1996; Krzyżanowski, and Kuna-Dibbert
2005).
2. Indirect emission from congestion: Due to road congestion GHG emission increases.
More precisely, if the speed of a vehicle reduces than the moderate speed (40-60 mph)
CE
UeT
DC
olle
ctio
n

69
then GHG emission increases exponentially (Woensel, and Creten 2001; Barth 2009).
In other words, if the vehicles spend more time on the road then CO2 from transport
sector increases. Thus, again exposure to these pollutants result in diseases such as
cardiorespiratory disease, respiratory disease and lung cancer (Woodcock et al. 2009).
Both these direct and indirect air pollutions can cause many health impacts such as chronic
obstructive pulmonary disease (COPD), respiratory disease, cardiovascular diseases and lung
cancer (Lelieveld et al. 2015). These diseases affect human lifespan as well. Thus, by reducing
car usage, air pollution can be mitigated to a significant level. For instance, Dhondt et al. 2013
study shows that active transportation can gain 530 life years by avoiding air pollution.
Similarly, Woodcock et al. 2009 study shows that active transportation can reduce 10-19%
chances of ischemic heart disease in London and 11-25% chances of ischemic heart disease in
Delhi, in a year.
Noise pollution: Exposure to excessive traffic noise (more than 60 decibels) may induce
hearing loss and hence, can negatively impact mental and cardiovascular health (James et al.
2014). People who are staying near the highway lane are more exposed to traffic noise
compared to the other population. Thus, by reducing cars travels, noise exposure can also get
reduced. For instance, Rabl, and de Nazelle, 2012 study estimated active transportation can
gain 69.6 million Euros/year in Paris by avoiding noise pollution.
Physical activity: Apart from outdoor pollutant exposure related health impacts, physical
inactivity is another major public health challenge. Physical inactivity is a well-established risk
factor for the chronic diseases such as coronary heart disease, stroke, and depression (Sallis et
al. 2004). Studies show (for example see (Frank et al. 2006; Bassett et al. 2008; De Hartog et
al. 2010) that by using active mode of transportation a person can be physically active which
reduces the likelihood of these diseases. Usually, a 5 kilometers (KMs) of cycling or 2.5 KMs
CE
UeT
DC
olle
ctio
n

70
of walking 5days/week are considered to meet the physical activity standard (Rabl, and De
Nazelle 2012). Few of the modes of active transport such as walking and cycling are associated
with some psychological and social factors such as bike lens, aesthetic qualities of
neighbourhoods etc. (Sallis et al. 2004; Rabl and De Nazelle 2012). The biggest impact of
modal shift would be on individual health for being physically active. The estimated life
expectancy gain per person can be 3 to 14 months by being physically active which outweighs
the risks of modal shift from outdoor exposure (life expectancy loss ranges from 0.8–40 days)
(Hu et al. 2004; de Hartog et al. 2010). Another study (see (Rojas- Rueda et al 2012) estimates
that by shifting 40% trips from car to the active mode of transportation mainly cycling, the
travellers in Barcelona city can avoid 67.46 deaths annually by being physically active.
2) Negative health effects:
The modal shift towards active transport may involve some risks at the individual level. For
instance, the air pollution exposure would be greater when a person is walking or cycling
instead of driving a car (Bergh 2004; Rojas-Rueda et al. 2012). However, the individual
exposure level of traffic-related air pollutants would be higher, although at the societal level
the exposure would be less as total air pollutant emission would be less due to the modal shift
(De Hartog et al. 2010). Furthermore, for an individual, the risk of being involved in a traffic
related accident is higher when a person uses an active mode of transportation especially
cycling (Marshall, Brauer, and Frank 2009). However, De Hartog et al. 2010 study argued that
traffic accidents related to active transportation are dependent on which age-group is opting for
active transportation. To discuss this in detail, table 8 below shows the number of deaths per
age-category per billion passenger KMs by cycling and by car usage in the Netherlands.
CE
UeT
DC
olle
ctio
n

71
Table 8: Number of deaths per age category per billion passenger kilometers by cycling and by car usage in Netherlands in
2008.
Age category Bicycle related
traffic deaths
Car related traffic
deaths
Ratio
<15 4.9 0.6 8.6
15-20 5.4 7.4 0.7
20-30 4.2 4.6 0.9
30-40 3.9 2.0 2.0
40-50 6.6 1.0 6.9
50-60 9.6 1.2 7.9
60-70 18.6 1.6 11.9
70-80 117.6 7.6 15.4
>80 139.6 8.1 17.1
Total average 12.2 2.2 5.5
Source: (De Hartog et al. 2010)
Data shows that people within the age-group of 18-49 are prone to more traffic-related
accidents while driving a car and the opposite is true for people within the age-group of 50
plus. The study by De Hartog et al. 2010 estimates that within the age of 18 to 64 year-old
individuals, “the risk of a fatal traffic accident while cycling is about 4.3 times higher compared
with the same distance by car driving”. However, it is crucial to note that the number of road
accidents also depends on the age-group of people who are opting for the modal shift. Table
10 shows that if the average people within average age-group opt for modal shift then the
impact would be practically zero and if young drivers shift to cycling then the impact would
be negative i.e. there would be less traffic-related accidents (De Hartog et al. 2010).
Studies have used different techniques to estimate these health aspects of active transportation.
Table 9 shows below the magnitude of productivity by presenting some studies which have
quantified different effects of active transportation which leads to productivity impact:
CE
UeT
DC
olle
ctio
n
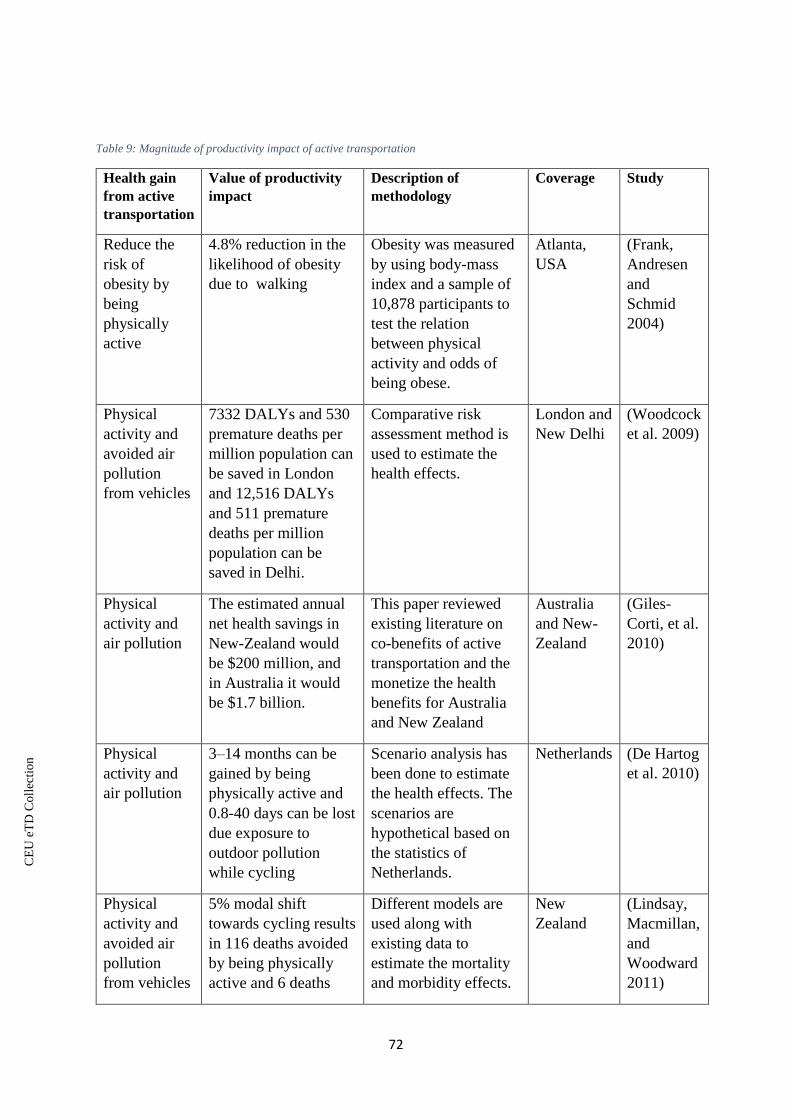
72
Table 9: Magnitude of productivity impact of active transportation
Health gain
from active
transportation
Value of productivity
impact
Description of
methodology
Coverage Study
Reduce the
risk of
obesity by
being
physically
active
4.8% reduction in the
likelihood of obesity
due to walking
Obesity was measured
by using body-mass
index and a sample of
10,878 participants to
test the relation
between physical
activity and odds of
being obese.
Atlanta,
USA
(Frank,
Andresen
and
Schmid
2004)
Physical
activity and
avoided air
pollution
from vehicles
7332 DALYs and 530
premature deaths per
million population can
be saved in London
and 12,516 DALYs
and 511 premature
deaths per million
population can be
saved in Delhi.
Comparative risk
assessment method is
used to estimate the
health effects.
London and
New Delhi
(Woodcock
et al. 2009)
Physical
activity and
air pollution
The estimated annual
net health savings in
New-Zealand would
be $200 million, and
in Australia it would
be $1.7 billion.
This paper reviewed
existing literature on
co-benefits of active
transportation and the
monetize the health
benefits for Australia
and New Zealand
Australia
and New-
Zealand
(Giles-
Corti, et al.
2010)
Physical
activity and
air pollution
3–14 months can be
gained by being
physically active and
0.8-40 days can be lost
due exposure to
outdoor pollution
while cycling
Scenario analysis has
been done to estimate
the health effects. The
scenarios are
hypothetical based on
the statistics of
Netherlands.
Netherlands (De Hartog
et al. 2010)
Physical
activity and
avoided air
pollution
from vehicles
5% modal shift
towards cycling results
in 116 deaths avoided
by being physically
active and 6 deaths
Different models are
used along with
existing data to
estimate the mortality
and morbidity effects.
New
Zealand
(Lindsay,
Macmillan,
and
Woodward
2011)
CE
UeT
DC
olle
ctio
n

73
Health gain
from active
transportation
Value of productivity
impact
Description of
methodology
Coverage Study
avoided by avoiding
air pollution
Physical
activity and
avoided air
pollution
from vehicles
Health benefit by
switching cars to
cycling and walking is
worth around 1300
Euro/year and
reduction of air
pollution is worth
around 30 Euro/year in
large European cities.
For air pollution
ExterE project
methodology is used
and for physical
activity related health
benefits WHO
methodology is used
(i.e. relative risk
reduction potential)
Seven large
European
cities
(Rabl and
De Nazelle
2012)
Source: Own elaboration
There are not many studies who have tried to quantify the net health impact of active
transportation. From table 9, it can be observed that studies quantifying different health aspect
of modal shift use different quantification methods. Studies have used mostly a dose-response
based risk reduction models. However, the magnitude of the health impact varies across all
these studies due to the use of different methodologies and different geographical coverage.
The noteworthy point is that the magnitude of the net health impact is positive in every study
described in table 9.
3.2.2.2 Road congestion:
Road congestion is broadly defined as a condition of delay in the road due to excessive number
of vehicles using the road, than the design capacity of the road traffic network (Weisbrod 2010;
Olawale, Adebambo, and Boye 2015). However, the definition of traffic congestion may vary
from perspective to perspective. Broadly, there are three groups of definition for traffic/road
congestion i.e. 1) demand capacity related, 2) delay-travel time related, and 3) cost related
(Aftabuzzaman 2007). Table 10 provides below a list of definitions of road congestion for these
three categories:
CE
UeT
DC
olle
ctio
n

74
Table 10: Definitions of traffic congestion
Categories Definition Reference
Demand
capacity
related
definitions
Number of vehicles on road i.e. travel
demand exceeds the road capacity.
(Rosenbloom 1978)
Congestion can be referred as a condition
which is caused due to more people travel at
a given time than the capacity of the
transportation system. More precisely, when
number of passengers exceeds the limit of
accommodate capacity of transportation
system, congestion takes place.
The Institute of Civil
Engineers, 1989 cited in
(Miller, and Li 1994)
Congestion can be defined as a state which is
characterized by high vehicle densities and
low speeds, compare to the reference state
which is characterized with low densities and
high speeds.
(Bovy, and Salomon
2002)
When input volume exceeds the output
capacity of the road.
(Stopher 2004)
Delay- travel
time related
definitions
Traffic congestion defined as travel time
delay compared to free-flow travel
conditions.
(Lomax et al. 1997)
Traffic congestion refers to as a condition of
traffic delay because of the excess number of
vehicles which exceeds the traffic network
capacity.
(Weisbrod, Vary, and
Treyz 2001)
Congestion occurs in the situation when
traffic is moving at speeds below the
designed capacity of a roadway.
(Downs 2004)
Cost related
definition
“Traffic congestion refers to the incremental
costs resulting from interference among road
users”.
(VTPI 2005)
Source: Adapted from (Aftabuzzaman 2007)
Congestion also represents the tendency of overutilization of a facility. Also, as number of
vehicle on road increases, the density of traffic increases and here density is defined as the
CE
UeT
DC
olle
ctio
n

75
number of vehicles per lane per kilometre (Stopher 2004). With the increase in density, vehicle
speed decreases. However, there is a limit to how much the density can increase. If the vehicles
are very close to each other i.e. “bumper-to-bumper” then speed drops to zero. This
phenomenon is called traffic jam (Stopher 2004). In this dissertation, road congestion includes
both traffic jam i.e. when the vehicles are stopped moving or moving very slowly and there is
a delay in travel time compared to a free flow travel condition.
In cities with a lot of congestion, the active mode especially bicycle can be faster than travelling
by car particularly on short distances (Buis, and Wittink 2000). Thus, opting for the active
mode would not only save time spent in congestion but also it would be faster and thus result
in having more time in work/leisure. Of course, it is subject to the local circumstances. The
effect of road congestion goes beyond time consumption. Studies (see (UNCHS 1995;
Johansson 1997; Treiber, Kesting, and Thiemann 2008) show that fuel consumption increases
due to congestion and this extra consumption can be costly. For example, in Bangkok city, the
cost of extra fuel consumption due to congestion was 1.5 billion US$ per year (Buis, and
Wittink 2000). Additionally, this extra fuel usage due to congestion increases pollutants such
as carbon monoxide (CO) and hydrocarbons emission are around 50% higher compared to
normal traffic flow (Buis, and Wittink 2000). These pollutants have further health related
implications such as headaches, cardiovascular diseases, coughing, irritation of eyes
etc.(Schwartz, and Morris 1995; Jones 1999; Brook 2004).
Apart from the above mentioned three aspects of labour productivity, the modal shift towards
active transportation also results in 1) cost savings by avoiding fuel cost, 2) lower
implementation and operational cost, 3) higher use of public transit which increases public
revenue, and 4) greater environmental awareness (Cavill et al. 2008; Shaheen,Guzman, and
Zhang 2010).
CE
UeT
DC
olle
ctio
n

76
Therefore, considering both the health effects and road congestion effects, the modal shift
towards active transportation can have an effect on productivity mainly in four ways:
1) By reducing energy use in the transport sector, there would be less outdoor pollution
and henceforth less exposure-related disease. This would result in productivity
improvement.
2) By saving time spent in traffic, more productive time is available. Here, the saved time
from traffic can be spent both in work and in leisure.
3) Being physically active and having less outdoor pollution, healthy life years can be
gained.
4) Negative health impacts hence, decrease in productivity due to higher accident rate and
more exposure to the pollutants.
3.2.3 Relationship between health and productivity
It is crucial to define the relationship between health and productivity. In this study, as it is
discussed earlier, only labour productivity is measured in the context of multiple impacts and
labour productivity is positively correlated with indoor and outdoor air quality. Energy
efficiency measures such as improved HVAC system with airtight building envelope and
modal shift towards active transportation can improve indoor air quality and outdoor air quality
by minimizing exposure to the pollutants (De Hartog et al. 2010; Bonetta et al. 2010).This
improvement in indoor and outdoor air quality would improve the state of health and hence
labour productivity by increasing work days and better work output per unit of time (Fisk 2000;
Brook 2004). This relationship between health and productivity implies that health is an input
factor of labour productivity thus improvement in health means an improvement in
productivity. Studies have discussed how health effects such as absenteeism (being absent from
work), presenteeism (present at work despite being sick) and mental stress can affect labour
productivity by reducing labour input (O’Donnell 2000; Boles et al. 2004; Kirsten 2010). Thus,
CE
UeT
DC
olle
ctio
n
77
to summarise, this study quantifies the productivity effects resulting from avoiding pollution
exposure-related health impacts and these pollution exposures can be avoided or at least can
be minimised by installing (or adopting in case of modal shift) improved energy efficiency
measures.
It is important to note that the term labour productivity usually refers to the input efficiency of
working-aged people who are in the labour market. However, exposure to pollutants affects
non-working aged/retired or children in a similar way, if not more. Children still can be
considered as a future resource of a nation and thus any diseases affecting children health can
be considered as future resource loss, but in case of aged people and housewives, both mortality
and morbidity effects due to pollutant-related exposure are often not accounted in the literature.
Most of the studies (for example see (Fisk & Rosenfeld, 1997; Goetzel et al. 2003; Miller et al.
2009) related to productivity ignore the fact that the aged population and housewives play an
important role in the society by taking care of the family/friends, household work, doing
informal work/non-paid. These kinds of work efficiency are referred to as ‘social productivity’
(Siegrist et al. 2004). Social productivity can be defined as “any activity that generates goods
or services which are socially or economically valued by the recipient, whether, or not based
upon a formal contract” (Siegrist et al. 2004; Wahrendorf et al. 2008) . In other words,
participation to the “care economy” (household work, taking care of the family friends, doing
his daily duties etc.) can also be considered as being socially productive (Wahrendorf et al.
2006).
Thus, from the above discussions, two concepts become clearer:
1) Improvement in health improves productivity by avoiding sick days and sick time loss.
2) People who are not in the labour market, get affected by the pollution exposure in the
same way as the working population. However, since they are not in any ‘economic
CE
UeT
DC
olle
ctio
n

78
contract’, the economic concept of labour productivity does not hold true for them,
rather the concept of social productivity is more relevant and important for them as well
as the society.
From these above two concepts, one dilemma arises here: people who are in the labour market,
not necessarily would work all the days saved by avoiding health damages. In other words,
avoiding a sick day or sick time does not necessarily mean that the day would be a workday
entirely. In that case, this dissertation argues that even if a person who is in the labour market
is not working on the saved day, but the person may be socially productive by spending time
his/her family or taking part in a caring economy. Thus, in other words, the person may be
socially productive while she/he is not working. Moreover, studies have argued that leisure
time is as important as time spent in work for the economy since an employee allocates his
time in both leisure and work in order to maximise utility (Abbott, and Ashenfelter 1976;
Lloyd, and Auld 2002). Considering the significance of social productivity, this dissertation
makes an attempt to quantify social productivity as well as details of which are discussed in
chapter 4.
3.4 Significance of productivity impact resulting from energy efficiency measures:
Productivity impact of energy efficiency measures is mainly studied at the individual level
focusing mostly on single buildings (for example, see ( Howden-Chapman et al. 2009; Chidiac
et al. 2011) etc.). However, from those single building case studies, productivity impact is
clearly visible. Productivity improvement due to energy efficiency measures does not only
imply less sick days i.e. more work days but it also includes other key aspects such as
performance improvement or improvement in future earning ability.
Table 11 shows few of the similar estimates of productivity impact of energy efficiency
measure from existing studies:
CE
UeT
DC
olle
ctio
n

79
Table 11: Productivity impact estimates from existing study-related building sector
Study Energy
efficiency
action
Value of
productivity
impact
Ratio
*productivity
impact3/direct
benefit
Coverage
(Fisk 2000) Improvement in
indoor air
quality
$17-$48 billion 0.26 USA
(Aunan et al.
2000)
Minimum
standards for
the insulation
of new
buildings;
energy
efficiency
labelling of
household
appliances
$370-$1170
million
annually
1.73 Hungary
(Clinch and
Healy 2001)
Retrofitting of
buildings
€4723 million
over 31 years at
a 5% discount
rate
1.7 Ireland
(Levy et al.
2003)
Retrofitting of
buildings
$5.9 billion per
year
.22 US
(Howden-
Chapman et al.
2009)
Retrofitting of
buildings
NZ$2652 per
household at
5% discount
rate over 30
years
3.37 New Zealand
(Joyce et al.
2013)
Retrofitting of
buildings
€42–88 bn per
year
1.02 EU
Source: Own elaboration
Table 11 provides evidence on the relative importance of productivity impact of energy
efficiency measures compared to the direct benefit i.e. energy cost savings from energy
3 Most of the productivity impact is occurring from improvement in health. Hence for some of the studies improvement in health value is taken while calculating the ratio. Here, direct benefit refer to the energy cost saving benefit.
CE
UeT
DC
olle
ctio
n

80
efficiency measure. In the studies reviewed, the ratio of productivity impact to energy savings
is between 0.22-3.37. This confirms the fact that productivity impact is a key impact of energy
efficiency measure. The range of all multiple impacts to direct benefit lies between 0.45-2.43
as discussed in chapter 2, section 2.1.3. If the average ratio is calculated from these two ranges
then it can be seen that productivity impact to direct energy savings is higher compared to
multiple impacts to direct benefits. Empirically the midrange4 of productivity impacts to direct
energy benefits is higher (1.8) compared to the midrange (1.4) of all multiple impacts to direct
benefits. Therefore, empirically also, it can be concluded that productivity impacts are one of
the key impacts in terms of their magnitude.
Unlike building sector-related energy efficiency measure, active transportation mainly walking
and cycling saves almost full energy use compared to vehicle mode of transport. Thus,
calculating the ratio between productivity and the direct benefit is not an option here.
3.5 Summary of the chapter
In this chapter, the energy efficiency measures studied in this dissertation are discussed. As it
is described in chapter 1, the main goal of this dissertation is to provide a systematic
methodology to quantify multiple impacts of energy efficiency. Hence this dissertation does
not focus too much on the technicalities of energy efficiency measures rather it focuses more
on the effects of improved energy efficiency measure. Energy efficiency measures are the
starting point in this dissertation’s methodology which is discussed in detail in the next chapter.
In this chapter, first two specific energy efficiency measures (HVAC system with airtight
building envelope and modal shift towards active transportation) are discussed and then how
these two measures results in productivity improvements, are discussed. By discussing the
4 The midrange is defined as the mean of the highest and lowest values i.e. (Maximum + Minimum) / 2.
Midrange is a type of average which provides an understanding about a magnitude of a particular dataset.
CE
UeT
DC
olle
ctio
n

81
interaction between energy efficiency measure and its productivity impact, the different
indicators of productivity would be defined in the next chapter.
CE
UeT
DC
olle
ctio
n

82
CHAPTER 4- METHODOLOGICAL FRAMEWORK
“The true price of anything you do is the amount of time you exchange for it”
Henry David Thoreau
CE
UeT
DC
olle
ctio
n

83
4.1 Review of existing methodology:
The process of assessing multiple impacts is quite complex since, for different impacts,
different quantification methods are used (Ürge-Vorsatz et al. 2015). For instance, for non-
marketable impacts, different valuation techniques such as contingent valuation or hedonic
pricing can be used and for macroeconomic effects mostly methods such as computable general
equilibrium method (CGE) or input-output models are used (Söderholm and Sundqvist 2003;
Ürge-Vorsatz et al. 2016). However, these methods have their own limitations due to which
impacts cannot be rigorously quantified. There are mainly two types of methods: 1) methods
for decision and 2) methods for quantification. In the following section each of these different
types of methods are discussed:
1) Methods for decision: Decision methods are used to decide whether a policy is
profitable or loss-making. In other words, decision methods help to decide policy by
comparing the cost with benefits. In order to conduct a decision method, first, the
impacts need to get quantified. Thus, decision methods are considered to be the last
step of deciding a policy based on the negative and positive effects of the policy. There
are mostly three decision methods: cost-benefit analysis, marginal abatement cost
curve, and multi-criteria analysis.
Cost-benefit analysis: Cost-benefit analysis or CBA method generally uses to see the net value
of a particular action (Bergh 2004). There are two main purposes of using CBA:
1. To determine the feasibility of investment, for instance, if benefits outweigh cost then
the investment is economically feasible.
2. To provide a basis for comparing different options.
In CBA all costs and benefits are expressed in a monetary unit and it is adjusted as per ‘the
time value for money’. A value of an investment option in CBA is usually expressed in the net
CE
UeT
DC
olle
ctio
n

84
present form i.e. total cost and total benefit of an investment are adjusted for time value and
presented in net form. Thus, CBA is a good measure for integration of all the costs and benefits
of an energy efficiency policy but in order to conduct a CBA, one needs to have the monetary
values for each of the costs and benefits. Cost-benefit analysis is a decision making analysis
and it can be conducted only after the quantification and monetization of an impact are ready.
There are other similar approaches, such as cost-effectiveness analysis (CEA), benefit-cost
analysis (BCA), cost-benefit ratio (CBR), and benefit-cost ratio (BCR) which are conducted in
a similar fashion like CBA. Since the comparison between cost and benefit are beyond the
scope of this dissertation, details of these similar cost-benefit approaches are not discussed.
Multi-criteria analysis: Multi-criteria analysis (MCA) helps in establishing a preference
between options by referring to an explicit set of objectives (Dodgson et al. 2009). Each option
has its measurable criteria to assess and these criteria are set by the decision making body in
accordance with the policy objectives (Dodgson et al. 2009). MCA is usually performed by
assigning scores to each option and then numerical weights are assigned to define each
criterion. The preferred options score higher on the scale, and less preferred options score
lower. In practice, scales extending from 0 to 100 are often used, where 0 represents a real or
hypothetical least preferred option, and 100 is associated with a real or hypothetical most
preferred option (Dodgson et al. 2009). One of the biggest controversies around the valuation
technique of MCA is that the scoring technique method is subjective hence uncertain (Davis,
Krupnick, and McGlynn 2000).
Marginal abatement cost curve: “A [marginal abatement cost] MAC curve is defined as a
graph that indicates the marginal cost (the cost of the last unit) of emission abatement for
varying amounts of emission reduction.” (Ekins, Kesicki, and Smith 2011). The purpose of
using a MAC curve is to understand the significance of each possible option of reducing
CE
UeT
DC
olle
ctio
n

85
emissions. Moreover, the MAC curves can help in deciding for the most preferred option by
showing the relative importance of different options in different regions and sectors (Kesicki
2011). MAC curve can be of two types, i.e. expert-based and model-derived curves. Expert-
based ECS/MAC curves which are also referred as technology cost curves, can assess the cost
and reduction potential of technological mitigation options based on information about
technological costs. On the contrary, the model-derived curves are based on the calculation of
energy models. The expert-based curves often treat different technological options entirely
independently due to difficulties in analysing their interactions – this implies that the different
technologies can be applied in any combination, and their impacts are independent of each
other. This is often not the case in reality (Urge-Vorsatz et al. 2015). Model derived curves are
basically oriented towards economy based top-down model, engineering-orientated bottom-up
models or hybrid energy-economy models. In all cases, conservation supply or abatement
curves are generated by determining the marginal energy or CO2 prices resulting from with
different energy supplies or emission limits or by determining the energy savings, energy
supplies or emission levels resulting from different energy or CO2 prices.
To summarize, each evaluation technique has its own limitations and uncertainties and some
of them are too serious to deal with. Also, not all the methodologies such as CBA or MCA, can
quantify individual impact. They can be used for aggregation of quantified individual impacts.
2) Methods for quantification: Methods for quantification are the first steps to evaluate
a policy. The sole purpose of these types of methods is to quantify the cost or benefit
of a policy and then these costs or benefits can be incorporated into a decision type
method. Some of the most used methods are described in the following section:
Willingness to Pay (WTP) and Willingness to Accept (WTA): Many of the impacts (such
as health, ecosystem, clean air etc.) of energy efficiency measures are non-marketable and
CE
UeT
DC
olle
ctio
n

86
hence market prices do not exist for such impacts. However, this does not mean that these
impacts are devoid of values. There are some alternative approaches to assign a value for such
impacts to enable their potential.
There are mainly two approaches to determine the value for non-marketed impacts:
1. Market based approach, and
2. Stated preference approach
For market-based approaches, such as contingent valuation and hedonic pricing technique are
used to evaluate the impact. On the contrary, in the stated preference approach, the consumers
are directly asked questions to reveal their preferable amount for a particular good or service.
For example, to save a species how much a person is willing to pay. Both WTA and WTP
directly represent a person’s wiliness to pay or willingness to accept for the environmental
damage and hence they can be treated as a value for that environmental damage in the absence
of market-price. In both of these methods, the consumer reveals their preferences in terms of
WTP or WTA (Söderholm and Sundqvist 2003).
Market based approach is based on “direct observable market interactions” (Gundimeda 2005).
For example, how much people are willing to pay in order to avoid any health hazards from air
pollution. Health has no direct market value and hence here the valuation is done based on
people’s WTP or WTA. WTP is generally used when the benefit is measured and WTA is used
when certain valuation is done based on compensation. For example, building an industry may
pollute the local air hence the local people may claim how much compensation they expect for
the air pollution. This compensation amount can be treated as a proxy value for local air
pollution. In cases where it is not possible to use any market based information then people are
asked questions
CE
UeT
DC
olle
ctio
n

87
One of the biggest criticism of WTP and WTA approach is that they often contain respondent
biasness and hence the value of WTP or WTA may not has a proper representation (Phillips et
al. 1997). More precisely, individual biasness such as less information about an event (for
example, how much air pollution can harm health) may lead to undervalue a particular impact.
Cost of illness method (COI): Cost of illness method measure the disease specific healthcare
expenditure of people. COI is used as a proxy for getting the monetize value for any disease.
There are two types of cost: 1) total disease cost and 2) incremental disease cost. Total disease
cost provides estimate for the disease specific total health care cost and incremental disease
cost provide the estimate of the increase in cost that is attributable solely to the presence of the
disease (Akobundu, et al. 2006). The most concise critic of this method is that the COI
estimates provide higher value for the diseases which are already costly (Koopmanschap 1998).
For example, cancer has a higher treatment cost compared to asthma but this does not mean
that life loss due to asthma is less painful than life loss due to cancer. The estimation method
of COI is criticized on another ground that COI method tends to underestimate health cost
(Rice 2000). For instance, in this method pre-mature life loss is estimated using market
earnings thus, is using low values for children and retired elderly (Rice 2000).
Dose response model: One of the well-used model in epidemiological studies to estimate
health related damages is dose-response model. Dose-response model basically estimates the
effect in an organism at different exposure levels (Calabrese and Baldwin 2003). Dose response
model is also known as exposure-response model. However, dose and exposure have different
implication in the model. For instance, dose implies amount of dose or dosage of a particular
biological or chemical object which is being exposed to a person or population whereas
exposure implies time dependent concentration of a particular biological or chemical object.
The primary criteria to conduct a dose-response model is the determination of the cause-effect
relationship (WHO 2008). If the cause-effect relationship exists then only a dose-response
CE
UeT
DC
olle
ctio
n
88
model can be used. The dose – response relationship usually depends on the exposure time and
exposure route (for instance, inhalation, dietary intake etc.) (Yadav 2013). The results from the
dose-response type of models can be used in estimating the risk. More precisely, results of
dose-response model estimate the risk of going above the safety level (i.e. magnitude and type
of health impacts) (Yadav 2013). Thus, while using a dose-response model, it is always
advisable to know about the ‘safety level’ in order to correctly interpret the data. However,
sometimes the ‘response’ to the amount of same ‘dose’ may vary across different persons. In
other words, the dose-response model may not be always linear (Aune et al. 2011).
Modelling techniques of MI: There is no specific modelling technique for multiple impacts.
Most of the modelling techniques estimate energy consumptions and energy system-related
GHG emission. However, some of these modelling techniques can be used to measure some of
the impacts as well. Modelling techniques for energy consumption are mainly divided into two
types: top-down models and bottom-up models. This division of model classes is mainly based
on the data inputs of energy systems and the comprehensiveness of endogenous market
adjustment (Böhringer, and Rutherford 2008). Top-down models take an economy-wide
perspective which assumes imperfect market, spill over effect and income effects among
different agents such as household and government (Böhringer, and Rutherford 2008). Thus,
top-down economic models such as Input-Output analysis, partial or Computable General
Equilibrium (CGE) models are generally used to assess macro-economic impacts such as GDP,
public budget etc. (Ürge-Vorsatz et al. 2015). For instance, input-output modelling mainly
depicts the inter-industry relationship within an economy i.e. quantifying how much output of
an industry is used as an input to other industry (Ürge-Vorsatz et al. 2015). The input-output
table can be extended with environmental impacts as well but it cannot monetize or quantify
itself (Miller and Blair 2009). Moreover, input-output models are more basic than CGE models
as they cannot address the substitution effect or the additionality (Ürge-Vorsatz et al. 2015). It
CE
UeT
DC
olle
ctio
n

89
is important to note that the macroeconomic impacts are different in nature compared to the
health and productivity benefits and hence, macro-economic models, such as computable
general equilibrium (CGE) or partial equilibrium models are not a good choice to evaluate
productivity impact.
The bottom-up engineering modelling features a large number of energy techniques to estimate
the partial effect of energy policies on the economy (Böhringer & Rutherford 2008). However,
this kind of modelling does not consider macroeconomic impacts. Bottom-up models, such as
long range energy alternative planning (LEAP) modelling is widely used for assessment of
impacts. LEAP is rather an engineering model than an economic model. LEAP usually follows
partially equilibrium modelling which means it usually focuses on a single sector (Ürge-
Vorsatz et al. 2015). Furthermore, LEAP model does not have the facility to evaluate
productivity impact of energy efficiency measure.
Apart from the top-down and bottom-up models, there are two other types of modelling
approaches: hybrid modelling and integrated models or integrated assessment modelling
(IAM). The hybrid models although incorporate the responsiveness of bottom-up models and
the technological richness of top-down models, they are not yet fully equipped to incorporate
all the responses of energy efficiency measures, such as indoor air quality etc., which make
them less relevant in the context of this dissertation. Similarly, though IAMs incorporate both
socio-economic and scientific aspects of climate change policies but IAM models have mostly
focused on the supply side. Thus, IAM can be used to evaluate the environmental impact of
energy efficiency policies but they are not suited for productivity quantification.
Thus to summarize, in this section the most used methods to quantify the multiple impacts are
discussed. These methods have their own limitations due to which there exists a gap for a
CE
UeT
DC
olle
ctio
n

90
systematic method to quantify any impact of energy efficiency measures. Table 12 lists the
limitations of these methods below:
Table 12: Summary of the most common methodologies used to assess multiple impacts
Name of method Limitations
Cost-Benefit Analysis and cost
effectiveness analysis
Monetization of impacts is not always
possible and if an impact is not monetised
then it would not be incorporated in a CBA
or CEA.
Energy Conservation Supply Curve or
Marginal Abatement Cost Curve
Mostly calculated for direct cost savings
and GHG reduction cost.
Multi-criteria Analysis Subjectivity of weighting (if done) with no
real scientific/disciplinary basis
Integrated Assessment Models Highly simplified
Computable General Equilibrium models Mainly focus on market
Input-Output models No behavioural characteristics of agents
Partial equilibrium analysis Lack of focus on macroeconomic
interactions
Cost of illness The extent of health loss is determined on
the basis of treatment cost of the disease.
Thus, it is often the case that COI method
underestimate/overestimate the value of
health loss.
Dose/exposure-response model Requires many micro data which may not
hold true at the population level. In addition
for many of the diseases, the exposure and
response extent are not yet clear.
Source: Adapted from (Ürge-Vorsatz et al. 2015)
In addition to the points mentioned in table 12, also these methods (except dose-response
method) are not able to capture the overlaps between the impacts and without understanding
the overlaps, a quantification of impacts may lead to double counting
Ideally, a decision on energy-related investment or policy should be taken based on potential
full cost and benefits (both anticipated and unanticipated) associated with the policy or
CE
UeT
DC
olle
ctio
n

91
investment, but this practically never takes place due to the absence of mature methodology
(Ürge-Vorsatz et al. 2014). As discussed in the beginning of section 4.2, cost benefit or cost
effectiveness analysis only typically includes direct cost and benefit. There are few studies
which estimated single impact by using various methodologies such as conservation cost
curves, control group survey etc. Few of the studies with different quantification methodologies
are described below to explain the other methodological challenges related to quantification of
impacts. For instance, Worrell et al 2003 study evaluate the relationship between energy
efficiency measures and productivity by reviewing over 70 case studies in the industrial sector.
The authors have proposed a suitable method to incorporate productivity benefits of energy
efficiency measures into an economic assessment. This paper explores the implications of
including input/raw material productivity benefits into the economic assessment with the help
of a study on the iron and steel industry in the US. In this study the evaluation of impact is done
based on investor’s perspective which followed the steps below:
1. Identify the input/raw material productivity benefits.
2. Quantify productivity benefits as much as possible in the most direct terms.
3. Make rational assumptions to translate the benefits into cost impacts.
4. Calculate cost impacts of productivity benefits.
5. Lastly, incorporate the cost value into the cost calculations by using bottom-up energy
conservation supply curves (CSCs).
By following these above mentioned steps, these authors demonstrates that including
productivity benefits into economic assessment can result in double benefit, compared to the
analysis excluding productivity impact. Though in this study the authors argued about proper
identification of benefits but it lacks to provide a systematic methodology to identify the
benefits of energy policies. Also this study only quantifies the direct productivity benefits. This
CE
UeT
DC
olle
ctio
n
92
study shows that even with direct productivity benefits, a systematic identification is required.
Worrnell et al 2003 study identifies the benefits by reviewing other literature.
Literature review is probably the most popular way to establish a relationship between energy
efficiency measures and their effects. However, another way of finding the linkages between
energy efficiency measures and their impacts is to conduct a control group survey. Through
the control group survey the identification of impacts becomes evident and afterwards the value
of impacts needs to be estimated. For example, Fisk and Rosenfeld 1997 study shows the
economic incentives in investing in buildings. They provide quantitative evidence on how
indoor environment can significantly influence labour productivity. For the US, the authors
have estimated “potential annual savings and productivity gains of $6 billion to $19 billion
from reduced respiratory disease respectively and $1 billion to $4 billion from reduced allergies
and asthma”. This proves the significance of the indoor air quality effect on worker’s
productivity. In fact, Fisk and Rosenfeld monetize the direct productivity gains due to
investment in building operation and as per their case study, $12 billion to $125 billion can be
gained from direct improvements in worker performance which are unrelated to health (Fisk,
and Rosenfeld 1997).
Both Wornell et al and Fisk et al studies are sector specific studies where two different
techniques were used to identify the effects of energy efficiency measure. Fisk et al 1997 study
evaluates labour productivity by assessing few aspects of productivity, such as absenteeism
and health care cost, whereas Wornell et al 2003 study reviews the existing literature and
estimated input productivity by using CSC method. Thus, these methodologies could not be
used for any sector other than the specified sector. However, both of these studies have a
common first step to start with, which is the identification of the impact pathways.
CE
UeT
DC
olle
ctio
n
93
Urge-Vorstaz et al 2016 paper talks about the general challenges of quantification of impacts.
All three studies mentioned above provide a direction in assessment of multiple impacts but
before doing the assessment of impact, it is important to clarify whether the impacts are worth
enough to be assessed or in other words, the magnitude of the impacts need to be understood
before assessment. The magnitude in this dissertation can be understood by reviewing literature
where the impacts are already quantified.
The existing literature as described in chapter 2, 3, and in the beginning of chapter 4, suggest
two key rationales behind not including all the benefits:
1. Most of the consequences of energy efficiency measures are not well-understood and
thus, most of the times they are not incorporated into any kind of modelling or decision-
making analysis such as cost-benefit analysis. Even majority of the models are not
technically equipped enough to quantify all the impacts specially health and
productivity impacts.
2. Even if there is a sufficient research on the different indirect benefits of sustainable
energy policy, it is often the case that not all the indirect benefits can be quantified and
hence they are usually not included in a decision making policy. The partial reason
behind not quantifying all the impacts is a lack of methodology.
This lack of methodology to quantify and identify the multiple impacts would underestimate
any energy efficiency policy. Even though few of the individual impacts have been estimated
in few of the studies (for example, see (Fisk, and Rosenfeld 1997; Schweitzer and Tonn
2002),but these studies do not discuss the challenges of quantifying and integrating the
individually estimated impacts into a total value (Urge-Vorstaz et al. 2016). One of the biggest
challenges in the estimation of impacts is its interaction with other impacts. More precisely,
some of the multiple impacts of energy efficiency measure overlap with each other which may
CE
UeT
DC
olle
ctio
n

94
cause double counting error. Thus, special care must be taken while quantifying these impacts
in order to avoid double counting; otherwise, it may overestimate or underestimate the results.
In addition to the risk of double counting, there is another risk of partial counting of an impact
which results in biases. More precisely, if only a part of the multiple impacts is assessed then
it may result in biases (Urge-Vorsatz et al. 2016). For example, only assessing positive effects
and avoiding negative effects (such as adverse side effect, transaction cost, hidden cost etc. of
a policy) would mislead us. However, as it is mentioned in Urge-Vorsatz et al. 2016 paper “a
comprehensive identification of the multiple impacts needs a systematic approach” and as it is
discussed in the methodological review in section 4.2, the existing methodologies such as cost
of illness, MCA models are not suitable to assess productivity impact.
4.2 Challenges related to quantification of multiple impacts
Apart from identification of impact pathways, there are other challenges in quantifying the
impacts. In order to accurately quantify the multiple impacts of energy efficiency, the
challenges related to quantification need to be identified. Urge-Vorsatz et al 2016 study
identifies few such key challenges (namely additionality, baseline, perspective, context
dependency, perspective, scale and distributional impact) to the evaluation of the impacts of
energy efficiency measures and also proposes possible solutions to address these challenges.
The key problem identified in this dissertation is the lack of a comprehensive methodology
which shows all the interactions and overlaps among impacts. In addition to the absence of a
systematic methodology, there are few key factors as discussed above which make
quantification of multiple impacts more difficult. These challenges are discussed in the
following section:
1. Additionality and baseline: It is important to understand that the impact or the portion
of impact quantified and accounted in a decision-making analysis is additional
CE
UeT
DC
olle
ctio
n

95
compared to the baseline. For policy design, it is necessary to account only the
additional impact in order to avoid over-estimation since the size of the impact would
depend on the factors like additionality and baseline. An appropriate selection of
baseline is the first step and then only the additional value needs to be taken into
account. The value of impact depends on selection of type of baseline. There are two
types of baselines: static and dynamic. The degree to which a baseline is static or
dynamic, would have implications in terms of which impacts can be considered
additional in order to avoid over-estimation. Also, it needs to be seen whether energy
efficiency policy is itself additional compared to the baseline. In order to check that,
one needs to constantly check whether the impact meets any of the three layers of
additionality:
i. Additionality of the clean energy action/policy: Sometimes the energy
efficiency measure is itself an additionality compared to the baseline and thus
any effects of that policy would be automatically considered as additional.
ii. Additionality of the impact: Impacts only additional to the baseline should be
considered during policy evaluation. The values of impacts should be compared
with alternative ways to achieve the same impact.
iii. Additionality compared to alternatives: Any impact of energy efficiency
investment needs to be compared to all the potential alternative investments.
Thus, before impact evaluation the baseline needs to be selected and then impact should meet
one of these with these layers of additionality. Then only accurate evaluation of the impact is
possible.
2. Double counting: As it is discussed in the previous section, multiple impacts are not
distinct and independent in nature and often they may overlap with each other. Without
understanding these overlaps if quantification is done then there is a possibility to
CE
UeT
DC
olle
ctio
n

96
commit a double count of impacts. This double counting of impact would overestimate
the policy. The double counting of impact is more prone to occur during impact
aggregation. However, impacts such as labour productivity which has several aspects
may lead to double accounting if not defined clearly (Chatterjee and Urge-Vorstaz
2018). Thus, a careful assessment is required to evaluate impacts.
The issue of double counting mostly arises when different impacts are aggregated.
However, it may also arise when a single impact has several aspects (for example
productivity) and each of the aspects needs to be aggregated in order to get a complete
figure of the impact. Therefore, even with single impact a thorough identification is
required in order to avoid double counting.
3. Perspective: Evaluation of impacts may vary as per the evaluation perspective. For
instance, an impact may have a different value when it is calculated keeping societal
perspective than evaluating from investors perspective. For investor, the crucial issue
is whether the impact can maximize the revenue/profit whereas for society, societal
welfare is important. The impact value may differ depending on the perspective. That
is why a ‘standing' is important while doing a cost-benefit analysis of any policy.
4. Context dependency: Context can be broadly defined as the variables which provide
background of a particular policy (Ürge-Vorsatz et al. 2016). These contexts are not
directly related to the aim of the policy but they influence the policy outcome. For
example, Urge-Vorsatz et al. 2010 study found that deep renovation programs in
buildings would have intense employment effect only if external (EU) funds were used
to pay for the retrofits. If the source of funding comes from loan then employment
impact is much smaller from these programs. These kind of contexts need to be
identified and understood during the policy and impact evaluation.
CE
UeT
DC
olle
ctio
n

97
5. Distributional impact: The value of total impact not necessarily shows the effect on
society or economy. For instance, any decision making analysis, such as cost-benefit
analysis does not consider the difference between marginal utilities of income across
different income groups, but only considers the total value. More precisely, due to
retrofitting at a local level, less energy is required than pre-retrofitting condition, thus,
less energy would be produced which would result in less energy import. This chain
effect is not bounded by local level but it goes at the national scale and benefits the
country.
6. Scale: Multiple impact assessment depends also on the scale of the impact-meaning,
the size of the impact may also depend on the geographic scope of the impact. The
impact also concerns on whose benefits should be counted. The appropriate scale of
analysis depends on the type of multiple impacts assessed (Chatterjee et al. 2018). In
other words, it can be said that the scale of analysis is context dependent. Thus, it is
recommended that both geographical and temporal unit of analysis are precisely chosen
in order to conduct a non-bias analysis.
Table 13 summarizes these challenges and possible solutions.
Table 13: Few quantification challenges and proposed solutions
Methodological challenges to
the assessment of multiple
impacts
Recommended line of action
Baseline,
additionality
and context
dependency
The baseline needs to be as dynamic as possible in order to
accurately quantify the incremental value of the impact.
Moreover, as much as possible variables needs to be
considered in the baseline and in the impact pathway maps as
well as in the scenarios. A dynamic baseline would tackle the
issue of additionality and a careful assessment of impact
identification would tackle the issue of context dependency.
Distributional aspects The distributional effects would be addressed very precisely
especially by explain the pre-existing inequalities, and then
the role of impact addressing these pre-existing inequalities.
As per the identification of inequalities, quantification
CE
UeT
DC
olle
ctio
n

98
Methodological challenges to
the assessment of multiple
impacts
Recommended line of action
methods would address them through some adjustment
factors.
Perspectives Perspectives depends on priorities and the decision maker
who is deciding the priorities such as investors/end-users or
government. In social studies or for a national policy maker,
the societal perspective would be prioritised.
Scale Evaluate the impacts at national level first then analyze the
possibility of transboundary issue
Source: Adapted from Ürge -Vorsatz et al 2016
4.3 Discussing the dissertation methodological framework:
To deal with these critical challenges of quantification of impact and also to address the
shortcomings of methodology (discussed in section 4.1) as much as possible, this PhD
dissertation proposes the following steps:
1. Identify the sequence chain of impacts explicitly- i.e. how the improved energy
efficiency measure results in productivity change,
2. Identify the causal effects of an impact i.e. whether the impact results in another impact,
3. Quantify each of the effects on productivity in a physical unit,
4. Scenario analysis i.e. defining scenarios as per research design and then quantify the
impact for all the scenarios, and
5. Monetize the incremental physical value which shows the effect of installing energy
efficiency measure specifically.
As it can be seen from literature review and discussions throughout this dissertation that
identification of impact pathway towards productivity is really crucial and without a systemic
identification, impact can be undervalued hence it produces less significant results. Thus, in
order to identify the pathway of the impacts from an improved energy efficiency measure, this
methodological framework uses impact pathway approach. This approach decomposes all the
CE
UeT
DC
olle
ctio
n

99
chains of the effects starting from implementing an energy efficiency policy. In the following
sub-section details of impact pathway approach are discussed:
4.3.1 Impact pathway approach
The concept of impact pathway is first proposed in ExternE project and then it is demonstrated
in the context of multiple impacts, in Ürge-Vorsatz et al.’s 2014 paper “Measuring the Co-
Benefits of Climate Change Mitigation”. Previously, impact pathway approach has been
applied for multiple purposes such as doing analysis of the influence of biofuel production in
global markets, finding the environmental impact of large dams or investigating the links
between health performance indicator and globalization (Brismar 2004; Cornia, Rosignoli, and
Tiberti 2008; Huang et al. 2012; Ürge-Vorsatz et al. 2016).
ExternE project defines impact pathway as “the sequence of events linking a 'burden' to an
'impact” (European Commission 1995). In other words, impact pathway methodology follows
a sequential path towards the impact. Impact pathway is a bottom-up approach where benefits
and costs are estimated by following the pathway from the sequential causal chain (European
Commission 1995). The first illustration of impact pathway done in the ExternE project was
based on the source pollutant emissions via quality changes of air, soil and water (ExternE
1995). Figure 6 shows the first impact pathway derivation done in the ExternE project.
CE
UeT
DC
olle
ctio
n

100
Figure 6: Impact pathway map used in Extern project
Source: (ExternE 2014).
However, we need an elaborate impact pathway map which is only dedicated to productivity
assessment. This way the micro interactions of productivity assessment can be enabled.
4.3.1.1 Characteristics of impact pathway approach
There are three key strengths of using this approach namely transparency, consistency and
marginal analysis (European Commission 1995). Each of these advantages is discussed
individually below in the context of my dissertation context:
1. Transparency: Impact pathway approach precisely shows the impacts and their casual
chain. Hence, it provides transparency in the time of calculation. Furthermore,
uncertainties associated with impacts and their results can also be understood from the
impact pathway.
CE
UeT
DC
olle
ctio
n

101
In the context of multiple impacts of energy efficiency there could be mainly three kinds of
uncertainties found, i.e. a) few of the impacts and their sequential chain may not yet be fully
understood or acknowledged, b) As stated in Urge-Vorsatz et al 2014 paper “for analytical
purpose, when operating with distinct individual impact may hide complex relation. For
example, renewables and energy efficiency reduce air pollution, which decreases health care
costs versus a baseline and may release public resources that can be invested or spent on
alternative uses and further enhance employment or gross domestic product levels”, c) for few
of the impacts the quantification methodology is not yet ready hence it cannot be incorporated
into a decision making analysis such as cost-benefit analysis. Through impact pathway
approach these uncertainties can be identified easily while drawing the impact pathway maps.
2. Consistency: This approach allows valid comparison between different impacts by
considering all the context dependency and distributional aspects. Details of these
factors are discussed in the beginning of section 4.2.
3. Marginal analysis: Impact pathway approach analyses the impacts on a marginal basis
hence, only the incremental effects of energy efficiency are considered in this approach.
The impact pathway maps are designed to see the effects which can be resulted due to
the implementing efficiency measures. This marginal analysis of effects tests the
additionality criteria and hence ensures the inclusion of only incremental effects. Thus,
this approach also avoids the chances of any biasness as well.
4.3.1.2 Impact pathway map for building sector:
As discussed in the previous section, impact pathway map decomposes the chain of effects
which starts at implementing an energy efficiency measure/action and it ends at the “impact
receptor or welfare endpoint, i.e. the impact that directly affects utility” (Ürge-Vorsatz et al.
2016). The key aim of impact pathway approach is to explicitly identify the causal chain of
CE
UeT
DC
olle
ctio
n

102
impacts and detect the factors which enable or hamper the impact occurrence (Ürge-Vorsatz et
al. 2014; Ürge-Vorsatz et al. 2016)
For building sector, only one energy efficiency measure is considered i.e. HVAC system with
proper building shell as discussed in chapter 3. In deep retrofit type buildings i.e. deep
retrofitted buildings, passive houses and nearly zero energy buildings, mechanical HVAC
system is always installed along with heat-recovery system and high insulation level. The deep
retrofit type buildings have by definition airtight building envelope.
In this section, it is shown that if improved HVAC system installed in a full airtight building
(here building means both kinds of building sectors i.e. residential and tertiary) then how it is
leading towards labour productivity. Each of these pathways such as how better ventilation
improves health etc. is already discussed in chapter 3 with scientific references. Now for further
steps towards quantification, these impact pathways of productivity impacts are shown through
impact pathway map:
CE
UeT
DC
olle
ctio
n

103
Figure 7: Impact pathway for building sector implementing building related energy efficiency measure
Source: (Chatterjee , and Urge-Vorsatz 2018)
Figure 7 decomposes the chain of effects of the building sector. For example, when improved
HVAC system is installed with airtight building envelope then there are three primary
consequences: better ventilation and filtering in the building, mould reduction, and comfort
level enhancement where comfort includes all kinds of comforts such as thermal comfort and
acoustic comfort. These three impacts (ventilation, mould, and comfort) have further
consequences mainly related to indoor air quality. For instance, due to improved ventilation
and filtering, the concentration of indoor air pollutants, mainly bio-aerosols such as particulate,
spores etc. reduces inside the building atmosphere. Reduction in indoor air pollutant
concentration improves indoor air quality. The improved indoor air quality transfers into health
impact i.e. less allergy and respiratory related diseases. These health impacts ultimately lead to
productivity improvement by avoiding sick days and increasing work performance. Here, one
point needs to be noted that mould reduction is not significantly correlated with air exchange
rate i.e. there would be a minimum health gain from mould exposure reduction by having an
HVAC system. However, further mould growth can be prevented by installing HVAC system
but for the pre-existing mould, the only option is to remove it.
Here, the macroeconomic impacts such as public budget and disposable income are mentioned
in the impact pathway to indicate the fact that productivity impacts would further lead to other
impacts. All the other impacts resulting from productivity are not within the scope of this study
and hence not discussed. There could be other impacts as well apart from productivity impact,
but this impact pathway map (figure 7) is designed to enable the pathway towards productivity,
hence other impacts resulting from HVAC with airtight building envelope or other impacts
resulting from productivity are not discussed here.
CE
UeT
DC
olle
ctio
n

104
4.3.1.3 Impact pathway map for transport sector:
For transport sector, this study is considering only one energy efficiency measure i.e. modal
shift towards active transportation. Similar to figure 7, each of these pathways of modal shift
towards active transportation is already discussed in chapter 3 with scientific references. Now
for further steps towards quantification, the impact pathway map decomposes the chain of
effects of opting for modal shift towards active transportation.
Figure 8: Impact pathway for transport sector implementing building related energy efficiency measure
Source: (Chatterjee & Urge-Vorstaz 2018)
Similar to figure 7, figure 8 also decomposes the chain of effects for transport related energy
efficiency measure. After implementation of relevant energy efficiency actions, the primary
consequences, such as reduced energy consumption, physical activity have been translated into
CE
UeT
DC
olle
ctio
n

105
productivity through saved travel time, outdoor air quality and health (Künzli et al. 2000;
Katsouyanni 2003). For example, due to modal shift towards the active transportation, the
primary consequences are physical activity, % kilometre travelled, physical activity and
number of accidents. These consequences have further effects on productivity through health.
Some are being physically active what leads to increased productivity and having less outdoor
exposure leading to improvement in health. Some of the impacts are directly translating
productivity, such as avoided congestion. Due to shift in active transportation, there would be
less traffic congestion and hence traffic time can be saved. Then, saved traffic time can be spent
by working and/or on other activities (Graham 2006).
Similar to the building sector, the macroeconomic impacts, such as public budget and
disposable income are mentioned in figure 8 to indicate the fact that productivity impacts would
further lead to other impacts. This impact pathway map (figure 8) is designed to enable the
pathway towards productivity, hence other impacts resulting from modal shift towards active
transportation or other impacts resulting from productivity are not discussed here.
4.3.2 Productivity indicators
Impact pathway maps identify (refer to figure 7 and 8) all the interactions between all the
impacts and also explain the causal effects of energy efficiency measure. However, since labour
productivity incorporates many aspects, it needs to be specified which aspect of labour
productivity is influenced by improved energy efficiency measure in order to estimate
productivity impacts precisely. Studies have been using different indicators to measure labour
productivity loss but as Sennett’s 2002 study rightly mentioned that “productivity is
particularly difficult to calculate, due in part to the lack of standard metrics”. Thus, a set of
indicators/metrics is required which define different aspects of labour productivity relevant to
energy efficiency measure. This dissertation defines three indicators of productivity namely:
change in active days, workforce performance improvement and improved earning ability.
CE
UeT
DC
olle
ctio
n

106
4.3.2.1 Change in active days:
Active days can be affected by being sick. In other words, sick days result in reduction in active
days. Sick day is a linear combination of absenteeism (absent from work due to BRI) and
presenteeism where presenteeism can be defined as working with illness or working despite
being ill (Caverley, Cunningham, and MacGregor 2007; Mattke et al. 2007). For instance, a
person might work slower than usual with respiratory diseases or make mistakes in work while
suffering from the symptoms of his illness. In this dissertation, both absenteeism and
presenteeism refer to the loss of productivity resulting from indoor exposure-related health
problems such as asthma, cardiovascular diseases and mental well-being. These diseases affect
both quantity and quality of work (Paul 2004). Both absenteeism and presenteeism estimate
the morbidity of working population i.e. number of days of suffering from building-related
illness (BRI) by the working population. However, many of the BRI affect mortality of the
whole population. Mortality cannot be measured through sick days. Thus, the DALY indicator
is used to estimate both mortality as well as morbidity along with sick days to provide a
complete understanding of the severity of indoor exposure to the pollutants. The time saved
from road congestion is calculated to measure the effects related to modal shift towards active
transportation. In the following section each of these aspects of active days are described:
4.3.2.1.1 Avoided sick days
Absenteeism
Absenteeism due to illness is a rising concern for both the employees and as well as the
employers. Many work days get wasted due to BRI (Fisk, and Rosenfeld 1997; Jones 1999;
Arnetz et al. 2003). Most of the studies (see (Fisk 2002; Chapman, et al. 2009) etc.) estimated
the cost of indoor exposure by measuring the absenteeism and health care expenditure but
among these two, only absenteeism indicates productivity loss. The intensity of absenteeism
CE
UeT
DC
olle
ctio
n

107
due to BRI could be huge. For instance, the study by Fisk 2000 estimated that the cost of annual
lost days due to sick building syndrome in the US would be as high as $34 billion (Fisk 2000).
Absenteeism days have been used as an indicator for many other types of research as well such
as to evaluate health promotion programs, to evaluate vaccination programs etc. (Golaszewski,
et al. 1992; Milton et al. 2000). In this study, absenteeism gain is used as an indicator of
productivity gain from energy efficiency measures. As it is discussed in the previous section,
one of the key reason behind this poor indoor air quality is inadequate air exchange rate inside
the building and lack of filtration system (Asikainen et al. 2016). Installing an efficient HVAC
system with filtration in an air tight building can reduce up to 58% of global burden of disease
at EU-26 level (Hänninen and Asikainen 2013). Studies suggest that proper ventilation rate i.e.
more than 12 L/s per person can reduce sick days by 1.2-1.9 days per person per year (Milton
et al. 2000; Mudarri, and Fisk 2007). Thus, this reduction of sick days of 1.2 to 1.9 days per
person per year can be considered as productivity gain per person per year due to the energy
efficiency action.
There could be other factors as well for absenteeism days apart from indoor air quality, such
as factors like job demand, shift work, work environment etc. are found to be correlated with
absenteeism days (Aguirre, and Foret 1994; Milton et al. 2000). In this dissertation, I would
estimate absenteeism only due to indoor exposure.
Presenteeism
As discussed in the beginning of section 4.2.2, presenteeism can be defined as working through
illness (Dew, Keefe, and Small 2005). The loss of productivity through presenteeism is not
small compare to absenteeism. For instance, according to a report by the Institute for
Employment (2016), in Europe the average days of presenteeism are 3.1 per person per year
(Garrow 2016). Lamb et al 2006 estimated the productivity loss of 3.2 hours due to
presenteeism in an 8 hours work day. Chang et al. 2016 study estimated that prevention of
CE
UeT
DC
olle
ctio
n

108
outdoor pollutant infiltration can save $19.5 billion in labour cost by avoiding presenteeism in
a packing company in the USA. Diseases such as allergic rhinitis or common cold have found
to be associated with presenteeism and these diseases can be caused due to poor indoor air
quality (Beer 2014). However, presenteeism can be resulted due to other diseases as well. In
addition to the disease induced presenteeism, presenteeism due to illness may increase the risk
of having an ill health because inadequate recuperation may lead to further acute health
problems (McEwen 1998).
Similar to absenteeism, there could be several other factors such as unemployment in the
country, personal factors (family issues, physical disability etc.), job security, nature of the job,
along with illness affecting an employee’s presenteeism but in this study only estimate
presenteeism due to BRI (Aronsson, and Gustafsson 2005; Hafner et al. 2015).
4.3.2.1.2 Disability adjusted life years (DALY) gain
Absenteeism and presenteeism indicators both measure morbidity of the working population.
These indicators mostly measure acute diseases whereas there are many chronic diseases
caused by poor indoor environment. For instance, 23% of lung cancer is caused due to indoor
exposure to pollutants (Hänninen and Asikainen 2013). Due to lack of absenteeism and
presenteeism data for this particular disease, the number of active days gain/loss cannot be
measured. In addition to this data unavailability, diseases such as lung cancer and
cardiovascular disease caused by indoor exposure have an impact on the human life span i.e.
these diseases do not only affect working days but also affect life expectancy. Absenteeism and
presenteeism can only be measured for the working population. This implies the necessity for
another indicator to be able to measure not only the acute diseases, but also chronic diseases as
well for the whole population exposed to the indoor exposures because, the indoor exposure to
pollutants affects the nonworking population in the same extent if not more. For example,
people such as senior citizens or even children whose immunity level is lower compare to the
CE
UeT
DC
olle
ctio
n

109
young population, the effect of indoor exposure would be at least same if not higher. By
definition, productivity is measured only for people who are in the labour force but, as
discussed earlier section 3.2.3, the health risks from indoor exposure to pollutants would affect
the social productivity for the non-working population. Thus, this dissertation includes
disability adjusted life years (DALY) to measure the health impact for the whole population.
DALY was first proposed in 1990 in the global burden of disease study to measure the overall
disease burden in different countries (Murray, et al. 2013). DALY calculates both mortality
and morbidity of the entire population. To be precise, DALY measures premature mortality
and disability for people who are living in health states less than the ideal health (WHO 2017).
Mathematically it can be expressed as
DALY= YLL+YLD
where YLL represents years of life lost due to premature mortality and YLD represents years
of life lost due to disability. YLL can be expressed mathematically as
YLL=N×L
The mathematical equation of YLD can be written as
YLD=P×DW
N= Number of deaths
L=Standard life
expectancy at age of
death in years.
P=Number of
prevalent cases
DW=disability
weight expectancy at
age of death in years.
YLL=Years of life
lost due to premature
mortality
YLD=Years of life
lost due to disability
CE
UeT
DC
olle
ctio
n

110
where P is the number of prevalent cases and DW is disability weight (WHO 2017). The
disability weight reflects the severity of a disease on a scale from 0 (perfect health) to
1(equivalent to death).
4.3.2.1.3 Time saved from road congestion/active time
Most of the countries in Europe have experienced a substantial increase in car ownership and
as a consequence to this, road congestion has been increasing. Thus, policy makers are
exploring options to reduce road congestion, with modal shift towards non-motorized transport
as one option. Studies (see (Dixon, 1996; Litman, and Colman, 2001; Bovy and Salomon,
2002;Sælensminde, 2004;Davis, 2010) show that the modal shift towards active transportation
such as walking, cycling and public transport have the potential to reduce road congestion
during peak hours.
The time spent in traffic can result in work time loss which affects productivity. But active
modes of transportation do not only reduce traffic congestion but also have other important
benefits related to health and safety. Several studies have shown that greater use of motor
vehicles may have negative health impact due to road accident, exposure to air pollution and
physical inactivity (see (Elvik 2009; Fuller et al. 2013; Strauss et al. 2014). Physical inactivity
is one of the key risk factors for global mortality because it may cause several diseases such as
cardiovascular disease, obesity etc (WHO 2010). Walking and cycling would increase the
physical metabolism of a person by reducing the risk of diseases such as obesity and
cardiovascular disease. Exposure to outdoor air polution emitted from cars, and physical
inactivity can result in both absenteeism and presenteeism days (Trubka et al. 2010). In this
study, the modal shift towards active transportation related impacts are analyzed from three
standpoints:
1. Modal shift towards active transportation can reduce road congestion for the existing
drivers during peak hours. In other words, travel time can be saved which is often
CE
UeT
DC
olle
ctio
n

111
claimed as the greatest benefit of transport projects and saved travel time may result in
enhanced earning opportunity (Litman 2015).
2. Individuals who are opting for the modal shift would gain health related benefits by
being physically active. Also, there could be some negative health effects for the active
transporter due to excess exposure of the outdoor pollutants.
3. Society as a whole would have less air and noise pollution after the modal shift.
The health impacts of active transporation can be measured through absenteeism, presenteeism
and DALY, but for the congestion-related time saving, we need a separate equation.
This study also acknowledges the fact that a person can spend their saved travel time from
traffic by not working but being socially productive, for instance, taking care of family and
friends and/or being involved in other socially productive activities.
4.3.2.2 Workforce performance improvement:
Workforce performance can be defined as labour input by the entire workforce by per unit of
time and workforce can be defined as an total working population at the workplace. We
estimate the workforce performance gain mainly through the quantity of labour input but poor
indoor air quality can also affect the quality of work (Wargocki, et al. 2000). Several case
studies (such as (Seppänen et al. 1999; Wargocki et al. 2000; Singh 2005) show how indoor air
quality and thermal comfort can influence a person’s performance. By working in deep
retrofitted buildings, employees have a better work performance compared to working in non-
retrofitted buildings (Wargocki, et al. 2000;Singh 2005;Singh et al 2010). This improvement
in performance does not only benefit the employees but also the employer by improving the
labour input efficiency which maximizes the profit.
There are mainly three reasons behind this improvement in performance which are discussed
below:
CE
UeT
DC
olle
ctio
n

112
1. Reduction in mental disorder: Improvement in indoor air quality helps reducing
mental stress which results in more labour input. Singh et al (2010) show that workers
after moving into an energy efficient building gained additional 2.02 work hours
annually per person because workers were feeling less mental stress. These additional
working hours can certainly be considered as productivity gain per person. One of the
possible reason behind feeling less mental stress could be that a worker is constantly
exposed to the fresh air which replenishes attention and boosts up the energy to work
(Singh et al. 2010; Ryan et al. 2010).
2. Improvement in mental health conditions: Thermal comfort helps improving a
person’s concentration ability which improves the work performance (Wargocki, et al.
2000). Wargocki et al 2000 estimated 1.7% improvement in productivity (mainly
quality of work) after controlling the room temperature within 21-25˚C. In deep retrofit
type buildings, an adequate temperature is always maintained throughout the day with
the help of mechanical ventilation systems, airtight envelope and temperature control
system (Eskom 2015).
3. Better concentration ability: As discussed in chapter 3, concentration ability may be
hindered by certain symptoms such as eye irritation (eye tears and eye blinking), skin
irritation and thus affects the work performance (Mølhave, Bach, and Pedersen 1986).
Mould and fungi growth can be stopped by improving the building shell and by
implementing stringent air filtration (Singh 2005). In the deep retrofit type buildings
with HVAC system, constant fresh air intake is ensured which prevents further mould
and fungi growth and during building shell improvement the existing moulds are being
removed as a part of the retrofitting process (Bonetta, et al. 2010).
These three factors are related to mental well-being or better concentration ability.
Improvement in any of these three factors would enhance the work performance.
CE
UeT
DC
olle
ctio
n

113
4.3.2.3 Earning ability
Earning ability consists of two aspects, future income earning ability and present earning
opportunity. The future income ability may be affected by the lack of education (Caroli,
Greenan, and Guellec 2001). Number of years of schooling determines the type of jobs in the
future and thus, if a child misses school days due to illness then it would impact his/her future
earning ability (Acemoglu, 1996). In fact, as discussed earlier in chapter 3, that excessive
absence from school may disrupt a child's learning process and could be one of the causes for
dropping out from school eventually. It is seen that children who have asthma, are more absent
from school compared to their healthy classmates (Moonie et al. 2006). Studies (see (Garrett
et al. 1999; Kolarik, et al. 2008) show that children who are exposed to air pollutants, are prone
to have several respiratory diseases and allergies. Thus, it is safe to claim that the children
living in poor building conditions would have more respiratory diseases and allergies compared
to other children living in good building conditions.
The caring need for sick children at home also affects the present earning ability of the parents,
taking days off from work. Even, if the parents go to work despite their child being sick then
there could be a chance of presenteeism i.e. productivity loss despite being present at work due
to anxiousness about their sick child. Lamb et al 2006 estimated that employees, who cared for
their ill child, were absent for 3.68 days/year and were unproductive for 3.55 hours in an 8
hours work day.
To summarize, this indicator of productivity is mainly concerned with two issues:
1. Impact on future earning ability due to loss of school days because of building related
disease.
2. Parents absenteeism due to taking care of their sick child and presenteeism due to
mental anxiety. As discussed above, mental anxiety here only accounts anxiety due to
thinking about sickness of the child.
CE
UeT
DC
olle
ctio
n

114
Presenteeism and absenteeism are measured in active days but the active days measure
presenteeism and absenteeism due to own illness. The earning ability indicator measures these
two due to taking care of their sick child. Also, similar to other indicators in this study, the
earning ability would be measured only due to building-related illness.
4.3.3 Impact pathway maps discussing the productivity indicators:
Previously in section 4.3.1, impact pathway maps (refer to figure 7 and 8) describe the linkages
between energy efficiency measure and productivity. Both of the impact pathway maps show
how energy efficiency measures stimulate productivity but in order to measure productivity,
we need to understand how the energy efficiency measures stimulate different aspects of
productivity. By knowing that, it would be easier to determine the productivity measure. Since
different indicators of productivity have already been discussed in the previous section, we can
now redraw the impact pathway maps specifying different productivity indicators.
Figure 9: Impact pathway map of HVAC energy efficiency measure in building sector specifying productivity indicator
CE
UeT
DC
olle
ctio
n

115
Source: (Chatterjee & Urge-Vorstaz 2018)
Similar to figure 7, figure 9 shows how energy efficiency measure leads towards different
aspect of productivity. For instance, after HVAC system installation with proper building shell,
there are three primary consequences such as better ventilation, mould reduction and comfort
level enhancement. These three impacts have further consequences on indoor air quality. It
means that the indoor air quality improves and the improved indoor air transfers into health
impact. This improved indoor air quality reduces allergy and respiratory related diseases. This
health impacts ultimately lead to productivity impact by gaining more active work days, higher
work performance and earning ability by avoiding building related disease and also by having
a better building condition.
Similarly, for modal shift towards active transportation measure, an impact map can be redone
specifying the productivity indicators.
Figure 10: Impact pathway map of modal shift towards active transportation specifying productivity indicator
Source: (Chatterjee & Urge-Vorstaz 2018)
CE
UeT
DC
olle
ctio
n

116
Similar to figure 8, figure 10 decomposes the chain of effects for transport sector energy
efficiency measure leading towards different aspect of productivity. After opting for modal
shift, the primary consequences are fewer kilometers traveled by transportation mode, being
more physically active, and fewer number of accidents. These effects further translate into other
effects such as less outdoor pollution and less road congestion. These effects then result in
productivity gain by gaining more active days and more active time. Active days result of
having less outdoor exposure and active time is a result of having less road congestion.
4.3.3.1 Strengths of systematic identification:
Figure 11 and 12 depict a systematic causal relation of productivity starting from implementing
an energy efficiency measure. The rationale behind using impact pathway approach is to clearly
understand the interactions among impacts. Urge-Vorstaz et al 2016 paper analyses impact
pathway approach and as per the authors, impact pathway methodology framework enables “a)
a systematic accounting for the various multiple impacts and thus it reduces the risk of
excluding any impacts, b) a systematic and precise calculation of the multiple impacts through
the identification of the detailed steps and distinct effects; (c) the minimization of over- and
undercounting”. These three key advantages analyzed in Urge-Vorstaz et al 2016 paper have
further implications from estimation of impact perspective. For instance, ‘systematic
accounting’ also helps us to understand the causal relationship between the impacts and it gives
an idea on what portion of impact should be considered during the impact evaluation. For
example, if someone wants to see the effects of energy efficiency measures from
macroeconomic perspective then one needs to consider only the effects of productivity
improvement on public budget via disposable income (refer to figure 7 and 8) and calculate the
effect of import dependency reduction due to energy savings from energy efficiency measure.
Each arrow of impact pathway map indicates a distinct effect of impact which also somehow
clarifies the valuation methodology (Ürge-Vorsatz, et al. 2016). For example, the arrow from
CE
UeT
DC
olle
ctio
n

117
congestion to active time loss represents opportunity to work loss which requires a separate
valuation methodology (refer to figure 12). Furthermore, this systematic approach gives a
detailed view of impacts by disaggregating the impacts and their interactions. For instance, air
quality is disaggregated into several air pollutants that actually cause several diseases. Different
air pollutants causes different diseases and affect productivity. For example, air pollutants like
allergens and fungi cause diseases, such as asthma, cold and flu, allergy and air pollutants like
radon and formaldehyde cause diseases like lung and liver cancer. These micro interactions are
systematically illustrated through impact maps which help us to understand the diverse effects
of the energy efficiency measures.
To summarize, the following benefits can be obtained by using impact pathway approach:
1. Impact pathway method enables a more systematic accounting and thus it reduces the
risk of not accounting any impacts/sub-impacts.
2. This method identifies the detailed steps and distinct effects of the impacts which help
to have a precise calculation.
3. Systematic accounting and detailed identification of impacts reduce the risk of over
or under estimation of the impacts. For instance, increase in comfort level improves
mental well-being which improves the workforce productivity. But, increase in
comfort level has no interacting with active days or earning ability. Thus, the effects
of comfort level can only be measured through the workforce performance indicator.
4.3.4 Functional formulation of productivity indicators
As discussed in chapter 2, the productivity of energy efficiency measures results in
wellbeing/welfare enhancement. Most of the productivity indicators studied here are enhancing
well-being by improving health condition and well-being often refer to overall standard of
living in financial and material ways (Liberty Fund 2012). Cross-national studies show that
CE
UeT
DC
olle
ctio
n

118
“more encompassing welfare states, aiming for more social and gender equality, almost always
perform better across a range of well-being measures” (Heins, and Deeming 2015).
As discussed in section 2.1.6, this dissertation postulates a two layer framework where national
well-being is explained by individual subjective well-being with respect to more work time
opportunity through improvement in health and less time spent in road congestion. Healthy life
implies more productive years and hence, healthy life also indicates enhanced earning
opportunity (Van Praag, Frijters, and Ferrer-i-Carbonell 2003). By following similar logic, the
three basic indicators of productivity impact of this study namely active days, workforce
performance and earning ability are mostly related to human health. Health improvement has
positive effect on economic well-being because health reflects the constituent of well-being
(Dasgupta and & Weale 1992). Alternatively, active time loss from road congestion has a direct
impact on economic well-being since active time loss implies loss of working opportunity
which further implies loss of economic well-being. However, time saved from congestion
would not be considered within the health economics framework. Time saved from congestion
basically follows the time allocation principle of economics. In the time allocation principle,
utility maximization is subject to time constraint which implies that time is given or constant
and utility can be maximized subject to time.
As discussed in chapter three, there are four key indicators of productivity studied in this
research i.e. active days, workforce performance, earning ability and active time. For each of
these indicators the theoretical framework is discussed below:
Functional formulation of change in active days:
As discussed, the number of avoided active days lost is a linear combination of days with
avoided absenteeism and days with avoided presenteeism. Both absenteeism and presenteeism
have a positive correlation with indoor exposure. Indoor air quality deteriorates not only due
CE
UeT
DC
olle
ctio
n

119
to the presence of indoor air pollutants but, also when outdoor air pollutants contaminate indoor
air (Jones 1999; Fisk 2000). Outdoor air pollutants (such as, PM2.5, pollen and VOC) infiltrate
in the indoor atmosphere mainly through the building envelope leakages and through
ventilation (Hänninen and Asikainen 2013). This dual presence of indoor and outdoor
pollutants can cause several diseases such as asthma, cold, flu, cardiovascular disease and
cancer (Jones 1999; Fisk 2000; Hänninen and Asikainen 2013).
Thus, Absenteeism (similarly for Presenteeism Pr so not shown separately) Ab can be
expressed as a function of indoor air pollutant (P1), outdoor air pollutants (P2) i.e.
Ab = Ab (P1,P2) Equation 1
Indoor air pollutant concentration depends mainly on the air circulation rate. Air circulation is
basically determined by the ventilation rate (Hänninen and Asikainen 2013). In other words, if
air circulation rate increases then indoor pollutant concentration decreases. Thus, indoor air
pollutant can be expressed as a function of rate of ventilation i.e.
P1= P1 (V) Equation 2
where, V is the rate of ventilation and ΔP1/ΔV<0, which implies that if the rate of ventilation
rises then indoor air pollutant concentration would fall and vice versa.
Alternatively, outdoor air pollutant concentration in indoor environment mainly depends on
the building filtration system (Asikainen, et al. 2012; Hänninen and Asikainen 2013). Outdoor
pollutants infiltrate indoor through cracks and ventilation. Thus, outdoor air pollutant
infiltration can be expressed as a function of building filtration installation i.e.
P2= P2(F) Equation 3
where, F represent filter installation andΔP2/ΔF<0, which means that if there is filter installed
in a building then outdoor air concentration in indoor environment would decrease.
CE
UeT
DC
olle
ctio
n

120
On the contrary, both ventilation and filtration installing may have negative health effects if
the buildings are not completely airtight. For complete airtightness certain level of building
envelope criteria needs to be maintained. Thus, airtightness is mandatory before installing
HVAC system in order to gain health benefits. The country specific technical details of airtight
building envelope are discussed in chapter 5.
Similar to absenteeism, both presenteeism and healthy life years of life loss are also a function
of P1 and P2 because of the same logic discussed above.
Therefore, given the definition of active days (AD), we can write
AD =AD (P1 (V), P2(F) ) Equation 4
i.e. active days loss depends on the rate of ventilation and filtration system of a building.
Also, ΔAD/ΔV<0, ΔAD/ΔF<0 which implies that an increase in the rate of ventilation and
installation of filtration system, active days loss would decrease and vice versa. In order to
estimate the value of an active day impact due to change in ventilation rate and filtration
installation, the values of ΔAD/ΔV and ΔAD/ΔF need to be known. These figures would show
how much health gain and hence productivity gain can be achieved by installing ventilation
and filtration with deep building retrofitting. Deep renovation is required in order to not only
to save energy but also to remove the existing mould which cannot be removed by ventilation
or filtration. Furthermore, deep renovation ensures complete airtightness which prevents
infiltration of outdoor air pollutants. Therefore, along with installation of improved HVAC
system and filtration system, deep renovation/retrofit of the building is required in order to
minimize the adverse health impacts and hence productivity impact due BRI.
Ideally, it is important to know the functional form for equations (1, 2 and 4) and also
information on 1) change in ventilation and filtration of buildings, 2).P1, 3).P2 , 4) disease
specific AD (i.e. presenteeism and absenteeism data ) to carry out a regression analysis to
CE
UeT
DC
olle
ctio
n

121
derive ΔAD/ΔV and ΔAD/ΔF. Since functional forms need more physical measurement data
this remains outside the purview of this study. Thus, instead, the value of ΔAD/ΔV can be
found from literature. These disease specific values found in literature are mostly in DALY
form i.e. after installing of ventilation and filtration how many healthy life years can be saved.
As discussed in chapter 3, DALY measures years of healthy life years loss due to disability
which is basically a health impact measure (Murray and Acharya 1997). Thus, in this
dissertation the values of equation 1, 2 and 3 are taken from Hanninen et al study (2013) as a
proxy figure which estimate change in DALY due to change in ventilation and filtration.
Functional formulation of workforce performance:
Studies have shown that the workforce performance have improved at a significant rate in an
energy efficient workplace compare to a non-energy efficient/non-retrofit commercial building
and the key reasons for this improvement in performance are thermal comfort and ventilation
rate (Wargocki et al. 2000; Singh 2005). Workforce performance does not only depend on
health condition but it also depends on thermal comfort and ventilation rate. Thus, it can be
functionally expressed as
WKP= WKP (TC, V) Equation 5
Also, 𝛥𝑊𝐾𝑃
𝛥𝑇𝐶> 0,
𝛥𝑊𝐾𝑃
𝛥𝑉> 0, which implies if thermal comfort and ventilation rate increases
then workforce performance would also increase and vice versa. These factors have a joint
effect on workforce performance. These rates of change in performance due to change in
thermal comfort and ventilation rate show how much performance gain and hence productivity
gain can be achieved by commercial building retrofitting. The thermal comfort level maximizes
with the temperature from 21 to 25 degree, temperature more than 25 degree may reduce the
performance level (Wargocki, et al. 1999). Hence, mathematically 𝛥𝑊𝐾𝑃
𝛥𝑇𝐶> 0 up to 25 degree
C. For temperature above 25 degree C this equation does not hold true.
CE
UeT
DC
olle
ctio
n

122
Functional formulation of earning ability:
As discussed in chapter two, earning ability refers to the future earning ability of the children
and present earning ability of the parent of the sick child. Studies show that the children who
have asthma, are more absent from school compared to their healthy (with no asthma)
classmates and more absenteeism in school may have an impact on future earning ability
(Bloom, Canning, and Sevilla 2001; Moonie et al. 2006).
Thus, similar to active days loss earning ability depends on indoor and outdoor air pollutants.
Therefore, functionally we can express this dependence as;
EAF= EAF(SCH) and EAP = EAP (SCH) Equation 6
where EAF and EAP represent earning ability in future and earning ability in present
respectively. SCH denotes the number of school days loss. EAF should be measured for the
children’s future earning ability whereas EAP should be measured for the parent’s present
earning ability due to child care.
Also, ΔEAF/ΔSCH < 0, ΔEAP/ΔSCH < 0 which implies that a decrease in number of missing
school days, both future and present earning ability would increase and vice versa. Here, the
number of school days missed is related to the rate of ventilation and filtration.
In order to estimate the value of earning ability impact due to change in number of school days,
the values of ΔEAF /ΔSCH and ΔEAP/ΔSCH need to be known. These figures would show
how much health gain can be achieved for children by building retrofitting.
Functional formulation of time saved from congestion:
Studies show that traffic congestion affects working time which ultimately impacts on a
person’s productive time (Brownstone et al. 2003; Tavasszy, and Meijeren 2011). This
CE
UeT
DC
olle
ctio
n

123
dissertation also acknowledges the fact that a person can spend their saved travel time by not
working.
In this dissertation, only modal shift towards active transportation is considered an energy
efficiency measure in the transport sector. Modal shift towards active transportation results in
less road congestion and by avoiding road congestion, travel time can be saved which is often
claimed as the greatest benefit of transport projects (Litman 2015). The other aspect of active
transportation is health improvement.
Therefore, active time loss (ATL) can be expressed functionally as
ATL = ATL (TSC) Equation 7
where ∆𝐴𝑇𝐿
∆𝑇𝑆𝐶> 0 which implies less time spent in congestion results in less active time loss and
vice versa. In addition, active transportation results in physical activity which improves the
health condition. Here, TSC represents total time spent in congestion. The modal shift towards
active transportation also improves the health condition by being physically active and hence
by reducing the risk of obesity and cardiovascular diseases.
Thus to summarise, each of the functional form of the indicators explains the key influencing
factors and the basic data needed for each indicator. This functional form can thus, be further
developed into concrete equations in order to quantify the effect on productivity due to
implementing improved energy efficiency measures. The functional form of indicators provide
a fair understanding of the basis of the productivity indicators and hence, it provides the basis
of the equations of the indicators. In the following section, equations of each of the productivity
aspects are discussed.
4.3.5 Equations for impact quantification
Exposure to indoor air pollutants can cause several building-related diseases such as asthma,
cold and flu, cancer, cardiovascular diseases and these diseases affect productivity. To quantify
CE
UeT
DC
olle
ctio
n

124
the productivity indicators due to these building-related diseases and the modal shift, we need
to understand the interactions between productivity indicators and all other impacts as per the
impact pathway maps. Each arrow in the impact pathway maps represent a distinct effect and
thus a distinct calculation. Therefore, for each of these arrows towards productivity indicators,
we would need a distinct method/equation to quantify them.
In order to compare the magnitudes of outcomes, a common metric such as monetization is
required. Monetization is a popular way of converting different units into a uniform unit i.e.
money. However, monetization is criticised conceptually on many grounds such as valuing
different impacts which are considered as ‘priceless’ or the monetary values are dependent on
monetization techniques (Luck, et al., 2012). In addition, for many impacts, such as health and
ecosystem, controversial methodologies for monetization are applied. Many decisions are
made based on the trade-off between non-market benefits, such as health, eco-system against
other benefits or costs (Stiglitz, Sen, and Fitoussi, 2009; Ürge-Vorsatz et al. 2016). Thus, to
mitigate the concerns and uncertainties regarding monetization of impacts, this study presents
the physical values as well as the monetized values for all the indicators.
As discussed in section 4.3.2, the three key aspects of labour productivity measure are: active
days, workforce performance and earning ability. These three indicators are sector specific and
also energy efficiency action specific which means not all the impacts can be calculated for all
the sectors. Thus, table 14 below shows the productivity indicators with their relevant sectors:
Table 14: Productivity indicators and their relevant sectors
Productivity indicators Sector
Active days gain Residential building, tertiary building,
Transport sector
Workforce performance gains Tertiary buildings,
Earning ability Residential buildings, tertiary building
(mainly schools)
Source: Own elaboration
CE
UeT
DC
olle
ctio
n

125
As discussed earlier, all of these three indicators intend to measure productivity but these
indicators are measuring different aspects of productivity. The method to quantify each of these
components of productivity is defined below.
4.3.5.1 Equations to measure change in active day
Active days consist of the four following indicators:
1. Absenteeism
2. Presenteeism
3. DALY
4. Time saved from road congestion/Active time
Among the above-mentioned four indicators, absenteeism and presenteeism measure the acute
disease-related immediate effects. Sick days can be mathematically expressed as
SD= Ab+Pr, where SD implies sick days, Ab is absenteeism and Pr is presenteeism.
Mathematically avoided absenteeism (Ab) can be expressed as
∑ ∑ 𝑨𝒃𝑿𝒗𝒓𝒊𝒑
𝒊=𝟎 = ∑ ∑ {(𝑨𝑽𝑺 × 𝒓𝒊) × 𝑿𝒗}𝒑𝒊=𝟎
𝟒𝒗=𝟎
𝟒𝑽=𝟏 ……………………Equation 8
where i determines types of retrofitting and v determines types of diseases.
Here, ri represents working population who live in type i residential buildings. For example, r0
is the working population living in non-retrofitted buildings, r1 is the population living in low
retrofitted buildings, 𝑟2 is the population living in medium retrofitted buildings ,𝑟3 is the
i determines type of retrofits
v determines type of disease
ri= working population lives in type
i residential buildings
AVS= Average sick leave taken per
person in a year due to illness
Xv= Percentage of sick leave taken
due to disease v in a year
CE
UeT
DC
olle
ctio
n

126
population living in deep retrofitted buildings, 𝑟4 is the population living in new nearly zero
energy buildings and 𝑟𝑝 is the population living in passive houses . Xv is the percentage of sick
leave taken due to disease v in a year. Here the value of v determines types of diseases. For
example, X0 represents asthma, X1 represents cold and flu, X2 represents cardiovascular disease,
X3 represents allergy disease and X4 represents cancer. AVS shows average sick leave taken per
person in a year due to illness.
Similarly, avoided absenteeism can be calculated for tertiary buildings i.e.
∑ ∑ 𝑨𝒃𝑿𝒗𝒕𝒊𝒑
𝒊=𝟎𝟒𝒗=𝟏 = ∑ ∑ {(𝑨𝑽𝑺
𝒑𝒊=𝟎 × 𝒕𝒊) × 𝑿𝒗}𝟒
𝒗=𝟏 ………………………. Equation 9
where ti represents population working in type i tertiary buildings.
Avoided presenteeism (Pr) can be expressed mathematically as
∑ ∑ 𝑷𝒓𝑿𝒗𝒓𝒊𝒑
𝒊=𝟎𝟒𝒗=𝟎 = ∑ ∑ {(𝑨𝑽𝑷
𝒑𝒊=𝟎 × 𝒓𝒊) × 𝑷𝒗 × µ𝒗}𝟒
𝒗=𝟎 ………………. Equation 10
Ab=Absenteeism days
AVS= Average sick leave taken
per person in a year due to
illness
ti = population working in type i
tertiary buildings
Xv= Percentage of sick leave
taken due to disease v in a year
Pr= Presenteeism days
AVP= Average number of
presenteeism days taken per
person per year
µv= Value productivity loss
at work due to specific
diseases
Pv=Percentage of
presenteeism days due to v
type of disease in a year
CE
UeT
DC
olle
ctio
n

127
Here, AVP represents the average number of presenteeism days taken per person per year and
µv represents the value productivity loss at work due to specific diseases. Again, v determines
types of diseases and Pv is the percentage of presenteeism days due to v type of disease in a
year. For instance, µ0 represents productivity loss due to asthma, µ1 represents cold and flu,
µ2 represents cardiovascular disease, µ3 represents allergy and µ4 represents cancer.
In order to calculate sick days due to different building related diseases, we need to know total
sick days taken due to different diseases. For example, if we want to know sick days due to
asthma in a country, we need to know total sick leaves taken from work due to asthma and total
days present at work with asthma in a country. However, the data on total sick leaves due to
specific diseases are not readily available. Therefore, we have to calculate total sick leaves
taken for different diseases per country by using the absenteeism and presenteeism equations.
Using the equations below, total avoided sick days taken per country per year can be calculated.
∑ ∑ 𝑨𝑫𝑿𝒗𝒓𝒊𝒕𝒊 = ∑ ∑ [{𝑺𝑫𝑿𝒗
𝒓𝒊𝒕𝒊 × (𝟏 − 𝑪𝑭𝒗𝒊)} × 𝑻𝑺𝑭𝒕𝒑𝒊=𝟎
𝟒𝒗=𝟏
𝒑𝒊=𝟎
𝟒𝒗=𝟎 ] …………… Equation 11
where i determines the type of retrofitting and v determines the types of diseases. Here, r
represents residential building sector and t represents tertiary building sector. 𝑨𝑫𝑿𝒗𝒓𝒊𝒕𝒊 represents
𝑨𝑫𝑿𝒗𝒓𝒊𝒕𝒊=Active days loss due to
building related-illness per year of
working adult population of each
type of retrofitted buildings.
𝑆𝐷𝑋𝑣𝑟𝑖𝑡𝑖= Sick days taken due to
illness per year of the working adult
population
CFvi= Diseases specific conversion
factor shows how much health
gain/loss can be achieved from each
retrofit types of buildings
TSFt= Time spent factor in tertiary
buildings CE
UeT
DC
olle
ctio
n

128
active days loss due to building related-illness per year of working adult population of each
type of retrofitted buildings.
𝑆𝐷𝑋𝑣𝑟𝑖𝑡𝑖 represents sick days taken due to illness per year of the working adult population. For
instance, r0 is the working population living in non-retrofitted buildings, r1 is the population
living in low retrofitted buildings, 𝑟2 is the population living in medium retrofitted buildings
,𝑟3 is the population living in deep retrofitted buildings and 𝑟𝑝 is the population living in passive
houses. Similarly, t0 is the population working in non-retrofitted buildings and so on.
Conversion factor shows how much health gain/loss can be achieved from each retrofit types
of buildings for different building-related diseases. For a few retrofit types such as for zero,
low, light and medium retrofitted type of buildings, the overall health impact can be even
negative i.e. loss of health since these type of retrofitted buildings do not have complete
airtightness and mechanical ventilation systems (as per COMBI input data assumptions).
Initially, these type of buildings may provide some sort of thermal comfort and health benefits
(as suggested in Chapman et al 2009 study) due to higher insulation level compare to its
previous state, but in the long run, the high insulation level can cause mould growth and also
increase the radon exposure level due to which the overall health state can get affected. We
need evidence to show how much negative impact can be caused by residing or working in
these type of buildings. In other words, we need the value of conversion factor for these type
of buildings which is not found in any literature. Thus, for these types of buildings, in this study
I have assumed that the value of conversion factor would be zero i.e. neither the positive nor
the negative health impact is assumed. Alternatively, the deep retrofit type buildings ensure
complete airtightness with proper air exchange rate and thus, in these types of buildings, there
would be health related benefits. Therefore, for these types of buildings, the value of conversion
factor would be positive.
CE
UeT
DC
olle
ctio
n

129
TSFt is time spent factor i.e. time spent in tertiary buildings. Personal exposure to indoor
pollutants is largely determined by the time spent indoor (Schweizer, et al., 2007). On an
average, both in the USA and Canada, a person spent 16.1 hours/day at home, though this
indoor time varies across location and age-group (Brasche, and Bischof 2005). The Healthvent
project only gives us the health gain factor from residential buildings. However, this time spent
factor does not only determine the extent of indoor exposure but it also helps estimate the
building sector specific health gains. For example, a person may work in a non-retrofitted
tertiary building but lives in a retrofitted residential building. In that case, maximum health
benefits would not be achieved from retrofitting as the person would still be exposed to poor
indoor air quality at their workplace. Therefore, it is crucial to have an exposure time factor in
order to calculate residential and tertiary sector specific productivity gain. In this study, TSF is
used to provide an estimate of health gain from installing energy efficiency measures in both
residential and tertiary sectors. In this study, the value of TSFt is estimated on the assumption
that an employed person would spend 8 hours/day at workplace which is 33% time of a day.
Thus the value of TSFt would be 33%. Only for cold and flu disease TSFt is assumed to be
50% due to the contagious nature of cold and flu. Since there is no other way to estimate the
sector specific effect of productivity of an improved energy efficiency measure, this study has
assumed the values of TSF based on rough calculation of average time spent at tertiary building
per person.
Therefore, DALY gain in this study can be expressed mathematically as;
∑ ∑ 𝑨𝑫𝑿𝒗𝒓𝒊 = ∑ ∑ (𝑫𝑨𝑳𝒀𝑿𝒗
𝒓𝒊 × (𝟏 − 𝑪𝑭𝒗))𝒑𝒊=𝟎
𝟒𝒗=𝟏
𝒑𝒊=𝟎
𝟒𝒗=𝟎 ] …………….. Equation 12
where AD is active days loss due to BRI per year in i type of retrofitted buildings.
CF implies conversion factor.
The value for conversion factor is derived from Hanninen et al 2013 study.
CE
UeT
DC
olle
ctio
n

130
Time saved from congestion and transport-related outdoor pollution induced active days loss:
Mathematically active days can be expressed as:
𝑨𝑫𝑪 = [(𝑻𝑻𝑳 × 𝑹𝒊) − {(𝑻𝑻𝑳 × 𝑹𝒊) × 𝑻𝑺}] ……………………. Equation 13
where ADc defines active days gain by avoiding congestion, 𝑇𝑇𝐿 represents travel time loss
due to traffic congestion per driver in a year and Ri is the average number of drivers stuck in
traffic congestion during peak hours per year. TS is the travel time saved factor due to the modal
shift towards active transportation. The value of TS is calculated from De Hartog, Boogaard,
et al. 2010 study where the rate of modal shift towards active transportation is equal to road
congestion reduction rate and from COMBI input data, the rate of modal shift can be calculated.
For example, in Hungary the modal shift percentage in the efficient scenario is 4.1% compared
to the reference scenario. Thus, the value of TS for Hungary would be 4.1%.
The other part of active days of transport sector come from health gain aspect by being
physically active and also by avoiding outdoor pollution. This aspect of active days can be
mathematically expressed as:
∑ 𝐴𝐷𝑋𝑣𝑐 = ∑ (𝐷𝐴𝐿𝑌𝑋𝑣 × (1 − 𝐶𝐹𝑣))4
𝑣=04𝑣=0 ………………………….. Equation 14
here ADcXv is the gain in active days by avoiding outdoor pollution or being physically active
and v is the type of diseases as mentioned in the previous section. The outdoor pollution
induced type of diseases are same as indoor pollution induced type of disease. Hence, Xv holds
ADc=Active time gain from
congestion
TTL= Travel time loss due to
traffic congestion per driver in a
year
Ri= average number of drivers
stuck in traffic congestion during
peak hours per year
TS= travel time saved factor due
to modal shift towards active
transportation
CE
UeT
DC
olle
ctio
n

131
the same meaning like building sector related disease. Conversion factor shows how much
health gain can be achieved by opting for modal shift towards active transportation.
Also, the sick days aspect of outdoor air pollution from transport sector can be measured by
using the equation below:
∑ 𝐴𝐷𝑋𝑣𝑐 = ∑ {𝑆𝐷𝑋𝑣
𝑐 × (1 − 𝐶𝐹𝑣)}4𝑣=0
4𝑣=0 ……………………………. Equation 15
where, ADcXv is the active days from transport and v is the type of diseases.
The health aspect of modal shift could not be measured in this dissertation due to data and
methodological constraints. Further details are discussed in chapter 7.
4.3.5.2 Equation to measure workforce performance:
In this study, workforce performance measures the enhancement of performance due to better
work environment and comfort level. This measurement excludes performance loss due to
illness, hence the chances of double counting the productivity indicators are minimised. By
using the following equation, workforce performance can be measured:
∑ 𝑾𝑲𝑷𝒕𝒊𝒑𝒊=𝟎 = ∑ {
𝒑𝒊=𝟎 (𝑨𝑽𝑯 × 𝒕𝒊) + ((𝑨𝑽𝑯 × 𝒕𝒊) × 𝑷𝑰)} …………………………….. Equation 16
Where, 𝑊𝐾𝑃𝑡𝑖 represents workforce performance in different types of tertiary retrofitted
buildings, AVH represents average annual hours actually worked per worker and ti represents
working population in different types of tertiary retrofitted buildings. Similar to 𝐴𝐷𝑡𝑖 , t0 is the
𝑊𝐾𝑃𝑡𝑖= Workforce performance in
different types of tertiary retrofitted
buildings
AVH= Average annual hours
actually worked per worker
ti= working population in different
types of tertiary retrofitted buildings.
PI= implies productivity
improvement per hour in a year due
to improvement in mental well-being
CE
UeT
DC
olle
ctio
n

132
population working in tertiary non-retrofitted buildings𝑡1 is the population working in tertiary
low retrofitted buildings, 𝑡2 is the population working in medium retrofitted buildings , 𝑡3 is
the population working in deep retrofitted buildings, 𝑡4 is the population working in nearly zero
energy buildings and 𝑡𝑝 is the population working in passive-houses. PI implies productivity
improvement per hour in a year due to improvement in mental well-being.
4.3.5.3 Equation to measure earning ability
Children’s health related effects due to indoor exposure can be measured through active days
indicator specifically through DALY. However, DALY does not measure future earning ability
due to indoor exposure related health impacts and absenteeism and presenteeism of a parent
due to child’s illness. The earning ability indicator estimates these two specific aspects.
Earning ability from loss of school days can be mathematically expressed as:
EA= ∑(𝑷𝑨𝑰 × 𝑺𝑳) ……………………. Equation 17
where EA implies future earning ability, PAI implies present average income of an individual
in a year and SL is the skill loss factor due to loss of school days. Skill loss mainly occurs by
having less education that is obtained by not attending school.
The other aspect of earning ability is loss of work days of parents due to care-giving of their
sick child. Mathematically this aspect can be expressed as similar to the active days formulae
i.e.
∑ ∑ 𝑨𝑫𝑿𝒗𝒓𝒊𝒕𝒊 = ∑ ∑ [{𝑺𝑪𝑯𝑿𝒗
𝒓𝒊𝒕𝒊 × (𝟏 − 𝑪𝑭𝒗𝒊)} × 𝑻𝑺𝑭𝒕𝒑𝒊=𝟎
𝟒𝒗=𝟏
𝒑𝒊=𝟎
𝟒𝒗=𝟎 ] ………….. Equation 18
SCH= Sick days taken
by the child from school
due to illness
CFvi= Value of health
gain factor
TSFi = Time spent factor
CE
UeT
DC
olle
ctio
n

133
Where SCH implies sick days taken by the child from school due to illness and ti would imply
specifically school buildings.
Due to data and methodological issues, earning ability could not be calculated in this
dissertation. The further details are discussed in chapter 7.
4.3.6 Scenario analysis- definition of scenarios and its assumptions:
Multiple impacts are better compared across different scenarios than assessment models (Ürge-
Vorsatz, et al. 2016). Quantification of impacts in different scenarios can provide useful
insights which can be helpful in designing a sustainable energy policy. More precisely, scenario
analysis provides a good understanding of the future trends based on present data. However,
the objective of scenario analysis is not to predict the future accurately rather to provide a
description of future subject to some underlying assumptions related to social and
environmental processes (UNEP 2004) . By following similar logic, this dissertation estimates
productivity impact with the help of two different scenarios to understand its magnitude. This
dissertation takes two scenarios: reference and efficient scenario and both of these scenarios
are defined according to the COMBI project. The reference scenario is derived from a baseline
scenario which is based on existing EU legislation. In other words, reference scenario assumes
the same growth rate and policies in 2030 as it is in 2015. The efficiency scenario is assumed
to be consisted of ambitious assumptions on technology implementation following more
ambitious policies till 2030. The COMBI efficiency scenario is quite similar to EUCO+33
scenario in EU’s energy efficiency directive (COMBI 2018).
The building sector scenarios are defined on a basis of a decomposition approach. There are
three factors which have defined these scenarios: activity levels, structural shifts and energy
efficiency measure. Activity level refers to the number of buildings for the residential building
sector, value added or square meter floor area in the tertiary building sectors and vehicle-
CE
UeT
DC
olle
ctio
n

134
kilometres for transport sector (COMBI D2.2 report, 2018). Structural determinants are
consists of shares of building types (single, multi-family, high-rise) in the residential sector,
the activity shares of the different subsectors (offices, health care, education etc.) in the tertiary
sector; and the share of private versus public transport (COMBI D2.2 report, 2018). For
building sector, the population for the base year for each country are obtained from
EUROSTAT and population and number of different type of buildings projection are made
based on PRIME reference scenario (COMBI 2.3 Annex report). In COMBI scenarios, a
distinction is made in case of new buildings by differentiating current building standards (until
2020), nearly zero buildings NZEBs (from 2020 onwards as per EU rule) and passive houses
(Couder 2018). Furthermore, different types of retrofitted buildings are classified as low,
medium, and deep. These types of new buildings and retrofitted buildings determine the
magnitude of productivity impact hence, different annual share of these types of buildings in
reference and efficient scenarios actually determines the magnitude of the impact. In COMBI
as well as in this dissertation, annual retrofit rates are assumed to be 2.5% in 2030 in the
reference scenario and 3.0% in the efficiency scenario. More building sector-related
assumptions are discussed in chapter 5, section 5.3.2.
For transport sector, the scenarios are based on a decomposition analysis which incorporates
changes in activity levels, structural shifts and energy efficiency measures (COMBI, D2.3
report, annex). For this study, the most important factor is structural shift (or in other words
modal shift) related assumptions. The scenarios distinguish between slow mode of transport
such as walking, cycling and also motorised mode such as motorized two-wheelers (moped,
motorcycle), cars and public transport. Public transport includes bus or coach, two separate
modes of rail transport (light rail and passenger train) (COMBI, D2.3 report, annex). The rate
of modal shift is assumed by having different growth levels for different transport modes.
CE
UeT
DC
olle
ctio
n

135
Similar to building sector, more transport sector specific assumptions are discussed in chapter
5, section 5.3.2.
4.4 Summary of the chapter:
The methodological framework of this dissertation has four key components:
Identification of the chain of impacts (see sections 4.3.1 and 4.3.3) - Identification of
impacts resulting from specific improved energy efficiency measures needs to be
explicit to not only to have the complete overview but also to understand the causal
effects of an impact i.e. whether the impact results in another impact.
Definition of metrics to quantify productivity impact (see section 4.3.2) - After
identification of causal effects leading to productivity impact, each of the metrics
needs to be defined accordingly in order to quantify productivity impact rigorously.
Quantification of productivity impact (see section 4.3.4, 4.3.5, and 4.3.6) - Equations
for each of the metrics need to be developed to quantify productivity impact resulting
from specific energy efficiency measure. The results of these metrics would be
considered in physical unit (non-monetized unit).
Monetization of impact (see section 4.3.5) - As per the physical value, monetization
of each of the metrics would be done.
For each of the components mentioned above a specific method is used in this dissertation. The
need for a new methodological framework comes from the lack of a mature methodology to
quantify productivity or any other impacts rigorously. In other words, different existing
methods need to be studied in order to understand the need of a new methodological
framework. Each of the methods has its own limitations. Moreover, the challenges of the
impact quantification need to be discussed thoroughly before discussing the modelling needs.
CE
UeT
DC
olle
ctio
n

136
CHAPTER 5: DATA AND ASSUMPTIONS
“It is a capital mistake to theorize before one has data”
Arthur Conan Doyle
CE
UeT
DC
olle
ctio
n

137
5.1 An overview of the data sources:
This chapter discusses the data required for the dissertation methodology and sources of the
data. Listing both the data and data requirement provide a more in-depth understanding of the
methodology. However, along with the data requirement and data sources, this chapter also
provides the methodological and data-related assumptions of this dissertation. This chapter
plays a crucial role by providing an in-depth understanding of the methodology which also
helps in achieving the research objective.
This dissertation’s methodology requires intensive data and most of the time, these data are not
easily found. In addition, data requirement of this dissertation is such that no single source can
provide the entire data needed for the methodology. Hence, this dissertation has relied mainly
on five key data sources. Each of these data sources is discussed below briefly to provide an
understanding of the intensive data needs of this dissertation:
COMBI project: As discussed in chapter 1 and 4, COMBI project input data (see project
report D2.1, annex: https://combi-project.eu/downloads/project-reports) is a major data source
of this dissertation. Mainly three types of data are used from the COMBI project:
1) Scenario description and their assumptions;
2) Country-specific population data in the different scenario- more precisely, number of
people living and working in the different type of buildings in two scenarios (reference
and efficiency scenario);
3) The number of people using a different mode of transportation in two different
scenarios in both of the countries.
The population in two different scenarios and number of different retrofit type buildings are
estimated in COMBI based on the PRIME scenario. These types of scenario data are not
available in EUROSTAT or any other open sources. PRIME is an EU system model which is
CE
UeT
DC
olle
ctio
n

138
widely used for defining scenarios. The more detail parameter specific data sources are
discussed in section 5.3.
HealthVent project: This dissertation uses Healthvent project data for mainly one parameter
i.e. the health gain value of staying in deep retrofitted buildings. Similar to COMBI, healthvent
project is also an EU project under the EU health programme (https://www.rehva.eu/eu-
projects/completed-projects/healthvent.html).
Organisation for Economic Co-operation and Development (OECD) data source: This
study has relied on OECD data for mainly country-specific sick leave data and actual labour
input data. These OECD data sources data are available online (https://data.oecd.org/).
EUROSTAT: This dissertation uses EUROSTAT data mainly for country-specific daily wage
data and also to strengthen some of the arguments of this dissertation.
Apart from the above mention sources, this dissertation also uses various scientific literature
for some key data points. By intensive review of relevant literature, this dissertation uses many
components of the dissertation model from various literature. Parameter specific literature
source is discussed in section 5.3. Apart from the methodological framework, the scientific
literature is widely cited throughout this dissertation for several purposes for example, to
understand the concept of co-benefits, to understand the methodological gap in estimating of
co-benefits etc.
5.2 Parameter specific data sources:
As discussed in chapter 4, section 4.3.5, each and every equation has different data
requirements and since these data needs vary from one equation to another, it is not possible to
have these data from a single source. Thus, it is important to list down these different data
sources as per the parameter.
CE
UeT
DC
olle
ctio
n

139
Data sources for absenteeism and presenteeism: In Chapter 4-section 4.3.5.1, the equations
for absenteeism and presenteeism are described. In order to calculate absenteeism the following
data are required and, the data sources are mentioned with the data points in the table below:
Table 15: Absenteeism data and their sources
Absenteeism data Data Source
Average sick days taken per person per
year per country
OECD,2017 (Database: Absence from work
due to illness, URL:
http://stats.oecd.org/index.aspx?queryid=30123)
Number of working population who live
in non-retrofitted buildings per year per
country (𝒓𝟎 ) and number of workers
working in non-retrofitted tertiary
buildings (𝑡0 )
COMBI 2018, D2.3 Annex report
Number of working population who live
in low retrofitted buildings per year per
country (𝒓𝟏 ) and number of working
population who work in low retrofitted
buildings per year per country (𝒕𝟏 )
COMBI 2018, D2.3 Annex report
Number of working population who live
in medium retrofitted buildings per year
per country (𝒓𝟐 ) and number of working
population who work in medium
retrofitted buildings per year per country
(𝒕𝟐 )
COMBI 2018, D2.3 Annex report
Number of working population who live
in deep retrofitted buildings per year per
country (𝒓𝟑 ) and number of working
population who work in deep retrofitted
buildings per year per country (𝒕𝟑 )
COMBI 2018, D2.3 Annex report
Number of working population who live
in new nearly zero energy buildings per
year per country (𝒓𝟒) and number of
working population who work in new
nearly zero energy buildings per year per
country (𝒕𝟒 )
COMBI 2018, D2.3 Annex report
Number of working population who live
in
COMBI 2018, D2.3 Annex report
CE
UeT
DC
olle
ctio
n

140
Absenteeism data Data Source
passive houses per year per country (𝒓𝒑 )
and number of working population who
work in passive houses per year per
country (𝒕𝒑 )
Percentage of sick leave taken due to
asthma among total sick leave taken by
working population per year
(Alexopoulos, and Burdorf 2001) –It is a
Europe based study with sample size of around
400 workers (both blue and white collar
workers)
Percentage of sick leave taken due to
cold and flu among total sick leave taken
by working population per year
(Alexopoulos, and Burdorf 2001)
Percentage of sick leave taken due to
allergies among total sick leave taken by
working population per year
(Lamb et al. 2006)- It is a US based study with
the sample size of 8267 employees to calculate
the economies losses due to presenteeism and
absenteeism.
Percentage of sick leave taken due to
cardiovascular disease among total sick
leave taken by working population per
year
(Price 2004)- This study has reviewed literature
on the effects of heart diseases on working
population.
Similarly, in order to calculate presenteeism the following data are required and also the data
sources are mentioned with the data points in the table below:
Table 16: Presenteeism data and their sources
Presenteeism data Data Source
Average number of presenteeism
days taken per person per year in
Europe
(Garrow 2016)- It is a Europe based study on
presenteeism. This report is obtained
http://www.employment-
studies.co.uk/system/files/resources/files/507_0.pdf
Percentage of presenteeism days
taken due to disease asthma (Pv)
(Johns 2010)- This study reviews literature on
presenteeism to conduct a meta-analysis to show
the significance of presentism at workplace.
Percentage of presenteeism days
taken due to disease cold and flu (Pv)
(Johns 2010)
CE
UeT
DC
olle
ctio
n

141
Percentage of presenteeism days
taken due to disease allergies (Pv)
(Lamb, et al. 2006)
Value of µ i.e. the productivity loss
factor due to disease V
(Lamb, et al. 2006)
Source: Own elaboration
For presenteeism since the country-specific figures could not be found, the average
presenteeism days within Europe i.e. 3.1 days/person, year is used for both the countries
(Garrow 2016). However, for absenteeism, country-specific sick leave data are available. Here,
one noteworthy point is that not every disease is caused by indoor or outdoor pollution. There
could be some sick leaves which are taken due to other reasons than pollution such as due to
muscular pain or due to an accident. Thus, this dissertation only considers diseases which can
be caused due to indoor pollution, outdoor pollution and dampness. One issue arises during
this course of research, that is disease-specific sick leaves and presenteeism data are not readily
available. Therefore, different literature is reviewed in order to find out the usual percentage of
sick leave taken due to the diseases caused by indoor pollution, outdoor pollution, and
dampness as discussed in chapter 3, section 3.2.1.1. Table 17 shows below these data:
CE
UeT
DC
olle
ctio
n

142
Table 17: Percentage of absenteeism and presenteeism for different diseases
Percentage of
Absenteeism
Source of the
absenteeism
data
Percentage of
Presenteeism
Source of the
presenteeism
data
Asthma 14% (Alexopoulos
and
Burdorf ,2001)
17% (Johns 2010)
Allergy 20% (Lamb, et al.
2006)
(Lamb, et al.
2006)
Cold and flu 19% (Alexopoulos
and
Burdorf ,2001)
17% (Johns 2010)
Cardiovascular
diseases
6% (Price 2004) 10% (Price 2004)
Total 59% 44%
Source: Own elaboration (data extracted from different literature)
As it can be seen from table 17, the total percentage of absenteeism and presenteeism is not
adding up to 100% which shows that there are other diseases due to which absenteeism and
presenteeism can occur. For allergy and asthma the presenteeism percentage is merged because
it is reported that 17% presenteeism days are due to allergy and asthma together (Lamb, et al.
2006). The diseases mentioned in table 17 can be caused by some other reasons apart from
indoor exposure to pollutants. Thus, the conversion factor of this dissertation’s methodology
would make sure that this dissertation only accounts for the diseases caused due to indoor
exposure.
Moreover, this dissertation acknowledges the fact that presenteeism days do not mean the loss
of entire work day. In other words, 1 day of presenteeism does not mean 1 day of work loss.
Thus, for asthma, cold and flu the presenteeism time is assumed 2.3 hours a work day which is
8 hours (Lamb, et al. 2006). This implies 29% of productivity loss due to presenteeism for
asthma, cold and flu.
CE
UeT
DC
olle
ctio
n

143
Both avoided sick days and healthy life years saved are the outcomes of installing an improved
HVAC system with airtight building envelope and both of them are calculated based on how
many diseases specific disability would reduce due to improved HVAC installation and
airtightness. The disease-specific disability reduction rate is taken from the healthvent project
which assumes a 90% reduction in radon, carbon monoxide and secondhand smoke, 50%
reduction in VOC and dampness exposure, and 25% reduction in particulate matter (PM2.5)
due to ventilation installation and controlling VOC and particulate matter exposure (Hanninen
et al 2013). More precisely, based on these pollutant reduction rates, the disability rate is
calculated in the healthvent project. The healthvent project estimates disease-specific health
gain factor for each type of scenarios and those scenarios can be compared with the retrofit
scenarios. The health gain factors are given in the form of the percentage of reduction in DALY
due to change in ventilation, filtration and pollutant source control. Table 18 shows the values
of health gain under different scenarios as per the healthvent project.
Table 18: Values of burden of diseases from Healthvent project
Diseases Baseline
DALY (Total DALY /
million pop)
Scenario 1
ventilation
only
Scenario 2
filtration
only
Scenario 3
optimal
control
Germany
Asthma and
allergies
467 402 333 201
Cardiovascular
diseases
2298 869 1263 1280
Lung (trachea &
Bronchus) cancer
838 1648 679 387
COPD 462 323 259 254
Hungary
Asthma and
allergies
271 215 175 129
Cardiovascular
diseases
5376 3691 2718 3352
Lung (trachea &
Bronchus) cancer
2571 2882 2165 1142
COPD 768 530 406 467
Source: Healthvent project
CE
UeT
DC
olle
ctio
n
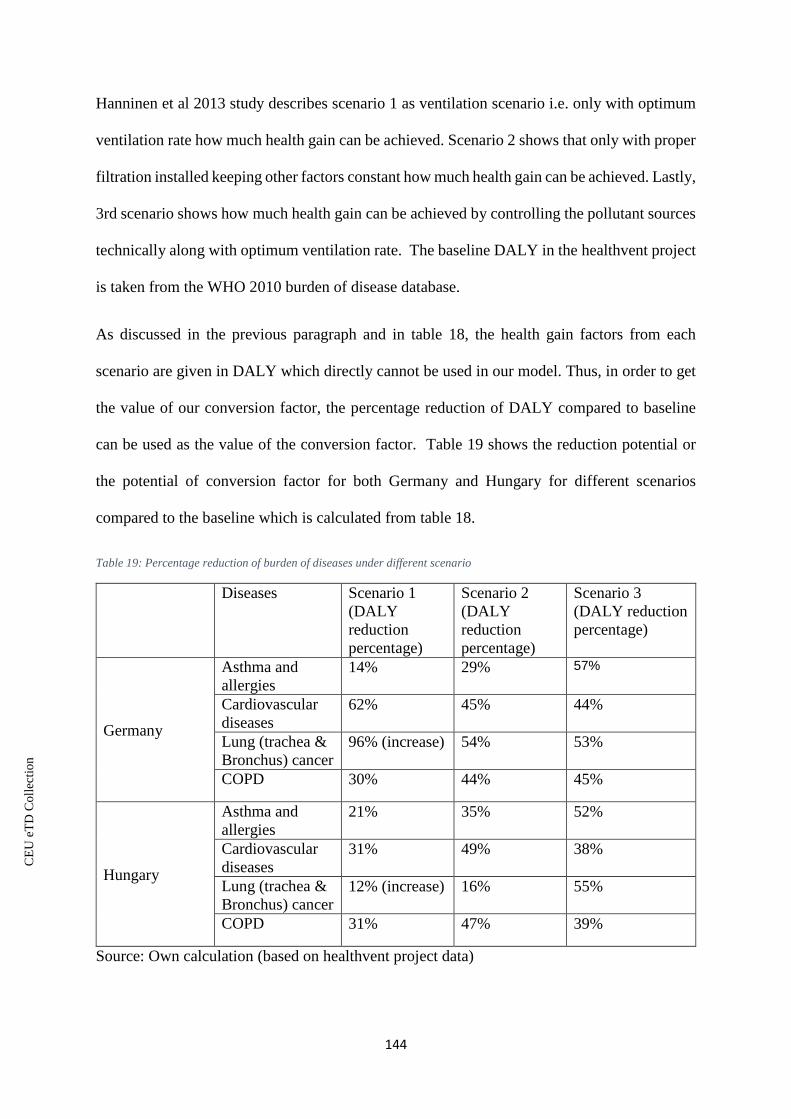
144
Hanninen et al 2013 study describes scenario 1 as ventilation scenario i.e. only with optimum
ventilation rate how much health gain can be achieved. Scenario 2 shows that only with proper
filtration installed keeping other factors constant how much health gain can be achieved. Lastly,
3rd scenario shows how much health gain can be achieved by controlling the pollutant sources
technically along with optimum ventilation rate. The baseline DALY in the healthvent project
is taken from the WHO 2010 burden of disease database.
As discussed in the previous paragraph and in table 18, the health gain factors from each
scenario are given in DALY which directly cannot be used in our model. Thus, in order to get
the value of our conversion factor, the percentage reduction of DALY compared to baseline
can be used as the value of the conversion factor. Table 19 shows the reduction potential or
the potential of conversion factor for both Germany and Hungary for different scenarios
compared to the baseline which is calculated from table 18.
Table 19: Percentage reduction of burden of diseases under different scenario
Diseases Scenario 1
(DALY
reduction
percentage)
Scenario 2
(DALY
reduction
percentage)
Scenario 3
(DALY reduction
percentage)
Germany
Asthma and
allergies
14% 29% 57%
Cardiovascular
diseases
62% 45% 44%
Lung (trachea &
Bronchus) cancer
96% (increase) 54% 53%
COPD 30% 44% 45%
Hungary
Asthma and
allergies
21% 35% 52%
Cardiovascular
diseases
31% 49% 38%
Lung (trachea &
Bronchus) cancer
12% (increase) 16% 55%
COPD 31% 47% 39%
Source: Own calculation (based on healthvent project data)
CE
UeT
DC
olle
ctio
n

145
For this dissertation, scenario 3 i.e. source control with optimum ventilation rate results are
used as a value of conversion factor. The source control scenario shows health gain from
optimum ventilation rate in a full airtight building with sources of pollutants (such as VOC,
radon, PM 2.5, CO, and dampness) controlled using technical measures such as removing
existing building shell, using CO sensor alarm system etc. These results of percentage reduction
in DALY from source control scenario are used for certain types of buildings such as deep
retrofit, zero energy buildings, and passive houses where deep renovations of buildings ensure
full airtightness. Hence minimum infiltration of outdoor pollutants and presence of mechanical
HVAC system ensures constant air supply.
This dissertation assumes the same reduction percentage for cold and flu disease like asthma
and allergy since no reduction percentage data is available for cold and flu. However, in order
to be theoretically consistent- meaning considering the contagious nature of cold and flu
disease, the value of TSF is higher in the tertiary buildings for cold and flu disease. In tertiary
buildings, the possibility of getting a cold and flu is more compared to the residential building
due to the higher population presence in tertiary buildings. Thus, for the residential sector, the
reduction rate of cold and flu is assumed to be half of the reduction rate of asthma and allergy.
As it can be seen from table 17 and 18 that the main source of population data is Coulder 2018
study and to provide a more in-depth picture, table 20 and 21 presents all the population data
for both residential building sector as well as for the tertiary building sector:
CE
UeT
DC
olle
ctio
n
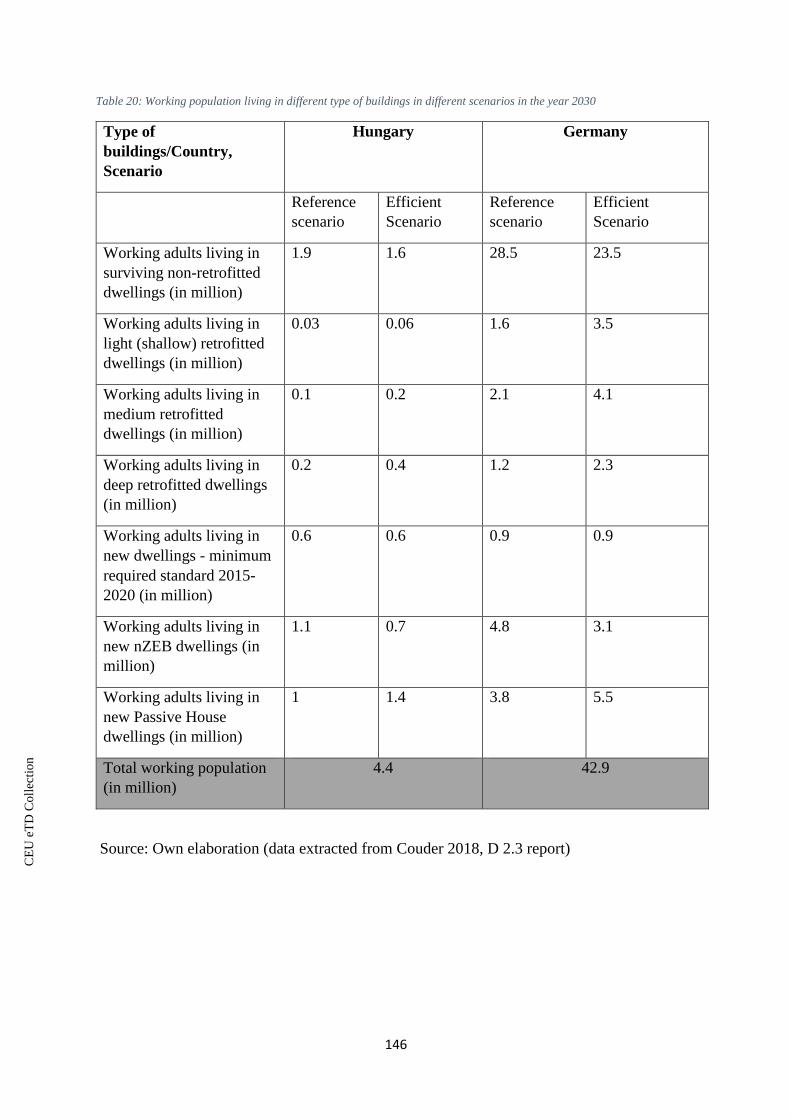
146
Table 20: Working population living in different type of buildings in different scenarios in the year 2030
Type of
buildings/Country,
Scenario
Hungary Germany
Reference
scenario
Efficient
Scenario
Reference
scenario
Efficient
Scenario
Working adults living in
surviving non-retrofitted
dwellings (in million)
1.9 1.6 28.5 23.5
Working adults living in
light (shallow) retrofitted
dwellings (in million)
0.03 0.06 1.6 3.5
Working adults living in
medium retrofitted
dwellings (in million)
0.1 0.2 2.1 4.1
Working adults living in
deep retrofitted dwellings
(in million)
0.2 0.4 1.2 2.3
Working adults living in
new dwellings - minimum
required standard 2015-
2020 (in million)
0.6 0.6 0.9 0.9
Working adults living in
new nZEB dwellings (in
million)
1.1 0.7 4.8 3.1
Working adults living in
new Passive House
dwellings (in million)
1 1.4 3.8 5.5
Total working population
(in million)
4.4 42.9
Source: Own elaboration (data extracted from Couder 2018, D 2.3 report)
CE
UeT
DC
olle
ctio
n

147
Table 21: population working in different type of tertiary buildings in different scenarios in the year 2030
Type of
buildings/Country,
Scenario
Hungary Germany
Reference
scenario
Efficient
Scenario
Reference
scenario
Efficient
Scenario
Working adults in
surviving non-retrofitted
dwellings (in million)
2.3 1.9 24.7 21.9
Working adults in light
(shallow) retrofitted
dwellings (in million)
0.25 0.42 1.4 1.7
Working adults in medium
retrofitted dwellings (in
million)
0.91 0.14 0.50 0.64
Working adults in deep
retrofitted dwellings (in
million)
0.11 0.30 0.38 2.8
Working adults in new
dwellings - minimum
required standard 2015-
2020 (in million)
0.66 0.66 0.68 0.68
Working adults in new
nZEB dwellings (in
million)
0.57 0.35 6 3.8
Working adults in new
Passive House dwellings
(in million)
0.10 0.32 1.1 3.4
Total working population
(in million)
3.5 34.8
Source: Own elaboration (data extracted from Couder 2018, D 2.3 report)
From table 21 and 22, it can be seen that for both tertiary and residential buildings, the stock
of NZEB is less in the efficient scenario. The reason behind it is that from 2020 onward, there
are two alternatives: NZEB buildings or Passive House (PH) buildings, where Passive House
buildings are assumed to be more energy efficient than NZEBs because of higher insulation
CE
UeT
DC
olle
ctio
n

148
standards. Thus, in the efficiency scenario, COMBI building stock model assumes that more
NZEB buildings are converting into passive houses.
Data and their sources for workforce performance: As discussed in chapter 4, section
4.3.5.2, for workforce productivity the following data are gathered from different sources:
Table 22: Workforce performance data and their sources
Data Data Source
Average annual hours
actually worked per worker
per country
OECD 2017 (Database: Actual hours of work data, URL:
https://stats.oecd.org/Index.aspx?DataSetCode=AVE_HRS)
Number of people who
work in t1 buildings per
year per country
COMBI 2018, D2.3 Annex report
Number of people who
work in t2 buildings per
year per country
COMBI 2018, D2.3 Annex report
Number of people who
work in t3 buildings per
year per country
COMBI 2018, D2.3 Annex report
Value of productivity
improvement factor
(Singh et al. 2010) - It is a US (in Lansing, Michigan) based
study with 262 sample size on effects of green office
buildings on employee’s health and productivity.
Source: Own elaboration
For workforce performance metric there are three key data point: 1) population data working
in the different type of tertiary buildings, 2) performance enhancement factor due to improved
building condition and 3) actual annual hours worked per worker. The average annual hours
actually worked per worker data is basically derived by dividing the total number of hours
worked over the year with the average number of people in employment (OECD 2017).These
three data are collected from three different sources as discussed in table 22 above. The
population data is already presented in table 21 and the other two data points are presented in
chapter 6, section 6.4.
CE
UeT
DC
olle
ctio
n

149
Data and their sources for time saved from congestion: For active time metric or time saved
from congestion metric, data requirement are the given below:
Table 23: Time saved from congestion data requirement
Data Data Source
Number of drivers stuck in
traffic during peak hours
per country per year
COMBI 2018- D2.3 Annex report
Average Hours wasted in
traffic in 2015
(INRIX 2017), Traffic scorecard report- INRIX scorecard is
used to conduct research on urban mobility and this report
reported global congestion situations
(URL:http://inrix.com/scorecard/)
Travel saved factor (De Hartog et al. 2010; COMBI 2018)
Source: Own elaboration
As it can be seen from table 23 that for time saved from congestion metric, there are three key
data points and similar to workforce performance, these three key data points come from three
different sources. As discussed in chapter 4, the travel saved factor is calculated from the modal
shift rate towards active transportation. Hence, in the table below data for these key variables
are presented:
Table 24: Key data for calculation of time saved for congestion metric
Germany Hungary Data source
Average wasted
hours in
traffic/driver, year
38 5 INRIX 2017,Traffic
scorecard report,
(URL:http://inrix.com/sco
recard/)
Passengers stuck in
peak hours traffic
using cars in the year
2030
19,351 1,074 COMBI 2018- D2.3
Annex report
Modal shift rate
towards active
transportation
2.7% 3.9% COMBI 2018- D2.3
Annex report
CE
UeT
DC
olle
ctio
n

150
To summarize, this section lists-down all the data required for the productivity metrics
mentioned in chapter 4, section 4.3.2. Some of the data are taken from literature, while some
of them are taken from project COMBI. This section shows how data-intensive productivity
impact is. This could be one of the reasons why productivity impact has not been measured so
rigorously till now. Along with the methodology and its data, like any empirical study, this
dissertation has also some key assumptions which are discussed in the next section.
5.3 Assumptions:
5.3.1 Assumptions of methods:
Like every empirical study, this study also has to assume a certain number of things to simplify
the study in view of the time and resource constraints:
1. Ceteris paribus prevails. Without ceteris paribus, it would be too complex to calculate
the productivity impact of improved energy efficiency measure as there could be other
factors which can influence productivity.
2. The HVAC system needs to be properly maintained. Otherwise, the health effect would
be minimal since then HVAC could itself be a source of indoor air pollutants.
3. HVAC system would be installed with a few other system control measures such as
temperature control, and sensors etc. to monitor the indoor air quality properly.
4. Radon safe constructions are assumed in radon-prone areas.
5. Since this study projects the productivity gain values in the year 2030, the average sick
leave data/ per person and presenteeism data are assumed to remain the same as for
2014/2015 data. For instance, the average sick leave taken in Hungary in the year 2015
was 7.9 days/per person and it is assumed that in the year 2030 also the average sick
leave taken would be the same. For presenteeism days since country-specific
presenteeism days are not available, the average presenteeism days for Europe are taken
CE
UeT
DC
olle
ctio
n

151
for both the countries. Also, the average presenteeism days are considered to be the
same for 2015.
6. The health gain factor is calculated from the healthvent study's source control scenario.
This scenario controls the exposure by several technical measures such as a sensor,
removal of existing building shell etc. This study also talks about HVAC system
installation with system control which includes a sensor and thermostat etc. Thus, the
result of source control scenario of the healthvent project is close to this study and hence
it is used as a conversion factor.
7. As discussed in chapter 4, section 4.3.5.1, the value of TSF is assume to be 33% in
order to be theoretically consistent. More precisely, people spent 8 hours a day at work
place, and indoor exposure to pollutants depends on the amount of time expose to the
pollutants. Thus, to calculate the effects of improved energy efficiency measure in
tertiary building sectors, the value of TSF is assumed to be 33%.
8. Before modal shift towards active transportation, there are some pre-requirements
which are assumed to be maintained. Pre-requirements such as proper cycling and
walking on road need to be there while cyclers are maintaining proper safety measures
etc.
9. The marginal utility of leisure is equal to the marginal utility of income. This
assumption is made for monetization of active time loss due to road congestion.
10. For monetization of impacts especially active days, it is assumed that the number of
working days is 22 days in a month in order to calculate the daily wage.
5.3.2 Assumption of scenario:
As discussed in chapter 4, methodology of this dissertation consists of two scenarios: reference
and efficient and as per the scenario the number of different type of buildings varies. There
are mainly four types of retrofitted residential buildings i.e. non-retrofitted, light retrofitted,
CE
UeT
DC
olle
ctio
n

152
medium retrofitted and deep retrofitted. Apart from retrofitting types, there are also passive
houses and nearly zero energy buildings (NZEB), which give equivalent benefits compared to
deep retrofitted buildings. In efficient scenario, the number of deep retrofit type buildings such
as passive houses, NZEB, and deep retrofit type buildings is assumed to be higher compared
to the number of buildings in reference scenario. However, in this dissertation, the population
residing or working in these type of buildings are more important than the number of buildings.
However, the basic understanding of assumptions is required to understand how these different
type of retrofit levels are determined. Thus, in the section below for each country a different
retrofit specification-related assumption is discussed:
5.3.2.1 Types of retrofits of residential building sector in Germany
In Germany, different types of retrofitting require different classifications. Below
classifications details are discussed for each type of residential retrofitted buildings in
Germany. These classification details are from the COMBI project building classification data
(COMBI 2018). Also, these retrofit types are defined taking Berlin as an example for the whole
Germany.
Light retrofit:
1) Light envelop: Building envelope light retrofitting consist of 10 cm external insulation
in the wall, 16 cm of added roof insulation and 5 cm of basement insulation. In the
basement insulation, 5 cm of thermal insulation needs to be added below the slab in
contact with the basement. For roof insulation, the 15 cm of external thermal insulation
needs to be added over the last slab in contact with unconditional space.
2) Light windows: In case of light retrofitting of windows triple glass with argon cavity
(16mm) and a low-e glass need to be installed.
3) Light cooling: Solar shading external window blinds - fixed slat angle - manual control
(setpoint 500W/m2 in summer) night cooling and natural extra ventilation in summer
CE
UeT
DC
olle
ctio
n

153
(automatic control to open windows) - automatic control through differential
temperature.
4) Heat recovery and ventilation: Heat recovery and mechanical ventilation system are
not present. For ventilation, instead of mechanical, natural ventilation is used.
Medium retrofit:
1) Medium envelope: Medium retrofit consists of 15cm wall insulation along with
external insulation, 20cm roof insulation along with a thermal insulation layer over
the last slab in contact with unconditioned space, 10 cm basement insulation and
lastly, installation of a layer of thermal insulation below the slab in contact with the
basement.
2) Medium windows: Triple glass with argon cavity (16mm) and a low-e glass are
installed in medium retrofit.
3) Medium cooling: Solar shading External window blinds - fixed slat angle - manual
control (setpoint 500W/m2 in summer). Night cooling Natural extra ventilation in
summer (automatic control to open windows) - automatic control through
differential temperature.
4) Heat recovery and ventilation: Heat recovery and mechanical ventilation system
are not present. For ventilation, instead of mechanical, natural ventilation is used.
Deep retrofitting:
1) Deep envelope: Deep envelope retrofit consists of 20cm wall insulation -
external insulation (EIFS System) with 30cm roof insulation, an additional
thermal insulation layer over the last slab in contact with unconditioned space,
15cm basement insulation along with a layer of thermal insulation below the
slab in contact with the basement.
CE
UeT
DC
olle
ctio
n

154
2) Deep windows: Triple glass with argon cavity (18mm) and a low-e glass.
3) Deep cooling: Solar shading with external window blinds is present in deep
cooling. Also, fixed slat angle with manual control and night cooling with
natural extra ventilation in summer (automatic control to open windows) -
automatic control through differential temperature is present.
4) Deep heat recovery: Heat recovery and mechanical ventilation are present.
5.3.2.3.2 Types of retrofits of tertiary building sector in Germany
For tertiary buildings, the retrofitting specifications vary since the population density is much
higher in commercial buildings compared to residential buildings. In addition, tertiary
buildings are usually larger than residential buildings, which requires a greater safety and
structural construction (Architecture lab 2014).
Therefore, in the section below, specifications of different types of retrofit are discussed for
tertiary buildings of Hungary and Germany as per COMBI project data.
For tertiary buildings in Germany, the retrofit types are defined as follows:
Light retrofit:
Light envelope: Light envelope includes wall External insulation (EIFS System): 10 cm of
roof insulation, 10 cm of insulation basement layer and 5 cm insulation in the inner of the floor
slabs or frameworks is installed.
Light windows: External/internal window blinds - fixed slat angle - automation control is
present.
Light cooling: External window blinds - block beam solar - automation control.
Heat recovery and ventilation: Heat recovery and mechanical ventilation system are not
present. For ventilation, instead of mechanical, natural ventilation is used.
CE
UeT
DC
olle
ctio
n

155
Medium retrofit:
Medium envelope: Medium envelope includes Wall External insulation (EIFS System): 30
cm of roof insulation, 30 cm of insulation basement layer and 15 cm of insulation in the inner
of the floor slabs or frameworks is installed.
Medium windows: External/internal window blinds, fixed slat angle and automation control
are present.
Medium cooling: External window blinds - block beam solar - automation control is present.
Heat recovery and ventilation: Heat recovery and mechanical ventilation system are not
present. For ventilation, instead of mechanical, natural ventilation is used.
Deep retrofit
Deep envelope: Deep envelope involves wall External insulation (EIFS System), 30 cm roof
insulation, 30 cm of an insulation layer on the basement, and 15 cm insulation in the inner of
the floor slabs or frameworks is installed.
Deep windows; External/internal window blinds, fixed slat angle, and automation control are
present.
Deep cooling: External window blinds, block beam solar, and automation control are present.
Deep heat recovery: Heat recovery and mechanical ventilation are present.
The above description of assumptions of different retrofit levels is taken from COMBI 2018
study. Most of the description of assumptions holds true for the German tertiary buildings as
well. The only difference in the tertiary building assumptions is that the insulation level is more
CE
UeT
DC
olle
ctio
n

156
in deep-retrofitted buildings compared to the residential deep-retrofitted buildings. For
instance, for tertiary building sector, 30cm of external insulation is assumed along with 30cm
of roof insulation. Whereas for the residential building sector the external insulation level is
assumed to be 20cm.
As discussed at the beginning of this section, the building stocks are not important or required
for the methodology. However, as per these descriptions of assumptions, building stock
percentage would provide an in-depth picture of the scenarios. Thus, table 25 below shows the
percentages of different type of retrofitted residential and tertiary buildings in Germany in the
year 2030:
Table 25: Percentage of different retrofitted residential and tertiary buildings in Germany in the year 2030
Residential building stock Tertiary building stock
Reference
scenario Efficiency
scenario Reference
scenario
Efficiency
scenario
Percentage of non-
retrofitted dwellings
66% 55% 71%
63%
Percentage of light
retrofitted dwellings
4% 8% 4% 5%
Percentage of medium
retrofitted dwellings
5% 10% 1%
2%
Percentage of deep
retrofitted dwellings
3% 5% 1%
8%
Percentage of new
dwellings minimum
required standard 2015-
2020
2% 2% 2%
2%
Percentage of NZEB
dwellings
11% 7% 17%
11%
Percentage of Passive
House dwellings
9% 13% 3% 10%
CE
UeT
DC
olle
ctio
n

157
Total building stock (in
million)
48.8 0.65
Source: Own elaboration (data calculated from COMBI 2018, D2.4 annex report)
5.3.2.2 Types of retrofits of residential building sector in Hungary
Similar to Germany, the assumptions of different retrofit types are defined for Hungary
considering Budapest as an example for retrofit classification. In the paragraph below, details
of retrofitting in Hungary are given;
Light retrofitting:
1) Light envelope: Light retrofit envelope consists of 10cm wall insulation, external
insulation (EIFS System), 15cm roof insulation with an additional thermal insulation
layer over the last slab in contact with unconditioned space, and 5cm basement
insulation along with a layer of thermal insulation installed below the slab in contact
with the basement.
2) Light windows: Double glass with air cavity (16mm) and a low-e glass are installed.
3) Light cooling: Solar shading with external window blinds is installed with manual
control (setpoint 500W/m2 in summer). Night cooling and night ventilation are absent.
4) Heat recovery and ventilation: Heat recovery and mechanical ventilation system are
not present. For ventilation, instead of mechanical, natural ventilation is used.
Medium retrofit:
1) Medium envelope: Medium building envelope consists of 20cm wall insulation
with external insulation (EIFS System), 30cm roof insulation with an additional
thermal insulation layer over the last slab in contact with unconditioned space, and
15cm basement insulation. Lastly, a layer of thermal insulation below the slab in
contact with the basement is installed.
CE
UeT
DC
olle
ctio
n

158
2) Medium windows: Double glass with air cavity (16mm) and a low-e glass are
installed.
3) Medium cooling: Solar shading with external window blinds is installed with
manual control (setpoint 500W/m2 in summer). Night cooling and night ventilation
are absent.
4) Heat recovery and ventilation: Heat recovery and mechanical ventilation system
are not present. For ventilation, instead of mechanical, natural ventilation is used.
Deep retrofit:
1) Deep envelope: Deep envelope consists of 20cm wall insulation with external
insulation (EIFS System), 30cm roof insulation with an additional thermal insulation
layer over the last slab in contact with unconditioned space and 15cm basement
insulation. Lastly, a layer of thermal insulation below the slab in contact with the
basement is installed.
2) Deep windows: Triple glass with argon cavity (16mm) and a low-e glass.
3) Deep cooling: Solar shading, external and window blinds with manual control (set
point 500W/m2 in summer) are in place.
4) Deep heat recovery: Heat recovery and mechanical ventilation system are present.
5.3.2.3 Types of retrofits of tertiary building sector in Hungary
Similarly, for Hungary the classifications for different types of retrofits in tertiary buildings are
defined as:
Light retrofitting:
Light envelope: Light envelope involves wall renovation of the exterior layer, roof renovation
of the exterior layer but no renovation to the basement.
Light windows: Replace old window with new one.
CE
UeT
DC
olle
ctio
n

159
Light cooling: Solar shading and external/internal window blinds with automation control is
present. Night cooling and night ventilation are present.
Heat recovery and ventilation: Heat recovery and mechanical ventilation system are not
present. For ventilation, instead of mechanical, natural ventilation is used.
Medium retrofit:
Medium envelope: Medium envelopes include wall external insulation (EIFS System), 5 cm
roof of insulation, 10 cm of insulation layer on the basement, and 5 cm insulation in the outer
of the floor slabs or frameworks is installed.
Medium windows: External/internal window blinds, fixed slat angle, and automation control
are present.
Medium cooling: External window blinds - block beam solar, and automation control are
present.
Medium heat recovery: Heat recovery and mechanical ventilation are present.
Deep retrofit:
Deep envelope: Deep envelope includes wall insulation (EIFS System), 25 cm roof insulation,
30 cm of insulation layer on the basement, and 15 cm insulation in the outer of the floor slabs
or frameworks is installed.
Deep windows: External/internal window blinds - fixed slat angle - automation control are
present.
Deep cooling: External window blinds - block beam solar - automation control are present.
Deep heat recovery: Heat recovery and mechanical ventilation are present.
CE
UeT
DC
olle
ctio
n

160
Similar to German tertiary sector, Hungarian tertiary sector has also more tight insulation level
compared to the residential sector. More precisely, the wall insulation is 25cm in deep retrofit
type tertiary buildings whereas in case of deep-retrofit type residential building, the wall
insulation is 20cm. Within the table below, the percentages of different type of retrofitted
residential and tertiary buildings in Hungary in the year 2030 are shown:
Table 26: Percentage of different retrofitted residential and tertiary buildings in Hungary in the year 2030
Residential building stock Tertiary building stock
Reference
scenario Efficiency
scenario Reference
scenario
Efficiency
scenario
Percentage of non-
retrofitted dwellings
43% 36% 66%
54%
Percentage of light
retrofitted dwellings
1% 1% 7% 12%
Percentage of medium
retrofitted dwellings
3% 5% 3%
4%
Percentage of deep
retrofitted dwellings
4% 9% 3%
9%
Percentage of new
dwellings minimum
required standard 2015-
2020
1% 1% 2%
2%
Percentage of NZEB
dwellings
25% 15% 16%
10%
Percentage of Passive
House dwellings
23% 33% 3%
9%
Total building stock (in
million)
7.1 0.04
Source: Own elaboration (data calculated from COMBI 2018, D2.4 annex report)
With various data sources and research steps discussed so far in this chapter, it is best to present
all these different research design of productivity quantification through a schematic diagram.
CE
UeT
DC
olle
ctio
n

161
COMBI data with
assumptions
Data from other
sources
Working population
living in different
type of retrofitted
building
Working population
working in different
type of retrofitted
building
Number of cars and
passengers stuck in
peak hour’s traffic
Number of sick
leave taken per
person/year
Actual hours
worked/person,
year
Percentage of sick
leaves/presenteeism
days due to different
diseases
Presenteeism
days/person, year
Traffic time
reported/driver, year
Modal shift rate
Sick leave taken due
to different diseases
Presenteeism days
due to different
diseases
Percentage of
disease
reduction rate
Congestion
reduction rate
Improvement
factor due to
mental well-
being
Active days gain
Workforce
performance gain
Time saved from
congestion
Productivity
impacts
Vehicle kilometre
travelled by different
modes
Total population
living in different
type of retrofitted
buildings Healthily life years
loss due to different
diseases
Data with assumption
from COMBI project
Data with assumption from
other project and literature
Intermediate calculations-Own calculations
Output-Own calculations
Index
CE
UeT
DC
olle
ctio
n

162
Figure 11: Schematic diagram of research steps with different data sources and own calculations
The schematic diagram above does not only present different research steps and their data
sources, but it also shows this dissertation’s novelty in terms of intermediate calculations and
in calculating the outputs. As it can be seen from the schematic diagram, the methodology of
this dissertation is quite data intensive and most of the data are not readily available. Thus,
some of the data are calculated (for example, sick leave taken due to different diseases) from
various data sources. All these intermediate calculations and the final output are the novelty of
this dissertation.
5.4 Summary of the chapter:
This chapter presented all the input data and intermediate calculations used in this dissertation.
Input data are taken from different sources namely COMBI project data, healthvent project
data, scientific literature, Eurostat, and OECD. The methodology of this dissertation is quite
data intensive and hence, not all the data can be found readily. Thus, in some cases, proxy data
are used with certain assumptions. Like every empirical study, this dissertation also has to
assume certain points both for methods as well as for scenarios. Last but not the least, in order
to provide a complete picture, a schematic diagram is developed to show the different data
sources used and also the novelty of this dissertation.
CE
UeT
DC
olle
ctio
n

163
CHAPTER 6: QUANTIFICATION AND MONETIZATION OF
THE PRODUCTIVITY IMPACTS: PRESENTING RESULTS OF
PRODUCTIVITY INDICATORS
“The alchemists in their search for gold discovered many other things of greater value.”
Arthur Schopenhauer
CE
UeT
DC
olle
ctio
n

164
6.1 Quantification and monetization of active days resulting from improved energy
efficiency measures:
This chapter provides the evidence to fulfil the empirical research gap. It presents the value for
each of the productivity indicators discussed in chapter 4. These indicators are calculated by
using the scenario analysis. To be precise, by comparing the results from two scenarios, the
magnitude of productivity impact of energy efficiency measure is calculated. Particularly, the
difference between the efficient scenario and reference scenario is presented as productivity
gain. The objective of this dissertation is not to provide precise estimates of productivity but to
offer a general idea of the magnitude of productivity impact as an additional effect of energy
efficiency measure.
As discussed in chapter 4, active days have three aspects which are resulted from the two
analysed efficiency measures. Each of these aspects is calculated for both reference and
efficient scenarios, and the difference between these two scenarios is presented as active days
gain. For example, in case of avoided sick days, the total days loss is calculated for both the
scenarios. Since in the efficient scenario, the number of days loss would be less due to more
people living or working in deep retrofit-type buildings compared to the reference scenario, the
difference between these two scenarios would basically show the number of days gain due to
having more deep retrofitted buildings i.e. active days gain resulted from energy efficiency
measure.
Results-avoided sick days: The number of avoided sick days is one of the key indicators of
active days and it is calculated for both the residential and tertiary building sectors separately.
More precisely, the effects of the HVAC system with an airtight building envelope on sick days
are calculated separately for the tertiary and residential building sectors. In order to calculate
the avoided sick days, equations 8, 9, 10 and 11 are used (refer to chapter 4, section 4.3.5.1).
To explain it further, first, the disease-specific absenteeism and presenteeism (equation 8 and
CE
UeT
DC
olle
ctio
n
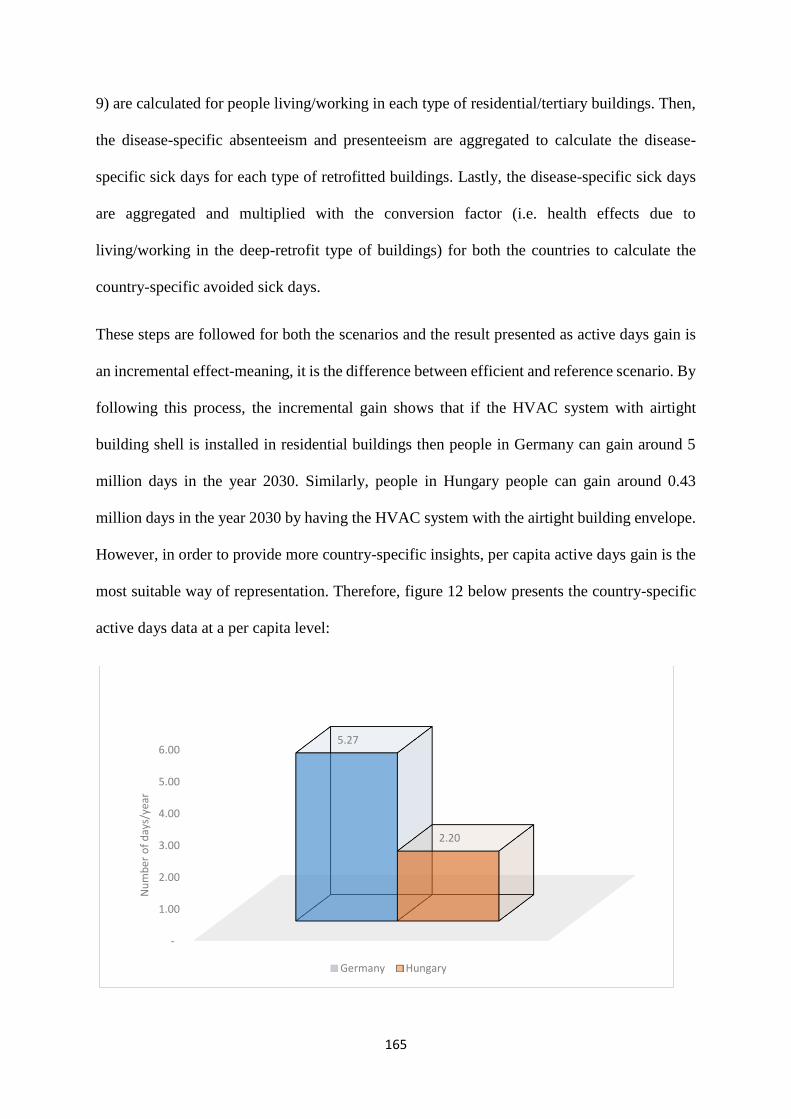
165
9) are calculated for people living/working in each type of residential/tertiary buildings. Then,
the disease-specific absenteeism and presenteeism are aggregated to calculate the disease-
specific sick days for each type of retrofitted buildings. Lastly, the disease-specific sick days
are aggregated and multiplied with the conversion factor (i.e. health effects due to
living/working in the deep-retrofit type of buildings) for both the countries to calculate the
country-specific avoided sick days.
These steps are followed for both the scenarios and the result presented as active days gain is
an incremental effect-meaning, it is the difference between efficient and reference scenario. By
following this process, the incremental gain shows that if the HVAC system with airtight
building shell is installed in residential buildings then people in Germany can gain around 5
million days in the year 2030. Similarly, people in Hungary people can gain around 0.43
million days in the year 2030 by having the HVAC system with the airtight building envelope.
However, in order to provide more country-specific insights, per capita active days gain is the
most suitable way of representation. Therefore, figure 12 below presents the country-specific
active days data at a per capita level:
-
1.00
2.00
3.00
4.00
5.00
6.005.27
2.20
Nu
mb
er o
f d
ays/
year
Germany Hungary
CE
UeT
DC
olle
ctio
n

166
Figure 12: Avoided sick days/Active days gain in the year 2030/per person who has shifted to deep retrofit type residential
buildings
Source: Own elaboration (dissertation data)
It is important to note that active days gain data are presented at per person scale in figure 12,
where only those people are included who have shifted to deep retrofit type residential
buildings as they are the only one who would enjoy the gain. Instead, dividing the total avoided
sick days by total working population would have underestimated the per capita scale. Thus,
the use of per capita scale in this dissertation only includes people who have shifted to deep
retrofit type residential buildings.
The total number of sick days loss and active days gain by avoided sick days is presented in
table 27 below for both of the scenarios:
Table 27: Sick days in different scenarios due to residential building-related illness
Active days loss
in reference
scenario
(in million)
Active days
loss in efficient
scenario
(in million)
Active
(difference
between two
scenarios) days
gain (in million)
Active days
gain/Per
person
(number of
days)
Germany 357.9 352.1 5.8 5.2
Hungary 14.4 13.9 0.4 2.2
Source: Own elaboration (dissertation data)
Similar to residential buildings, if tertiary buildings also have the HVAC system with airtight
building envelope then Germany can gain around 5 million days in the year 2030 and Hungary
can gain 0.20 million days in the year 2030. As it is discussed in the above paragraph that data
are best represented at per capita level. Hence, figure 13 below shows the country-specific per
capita active days gain by installing HVAC system with proper building shell in tertiary
building sector:
CE
UeT
DC
olle
ctio
n

167
Figure 13: Avoided sick days/Active days gain in the year 2030/per person who has shifted to deep retrofit type tertiary
buildings
The total number of sick days loss and active days gain by avoided sick days are presented in
table 28 below for both scenarios:
Table 28: Sick days in different scenarios due to tertiary building-related illness
Active days loss
in reference
scenario
(in million)
Active days
loss in efficient
scenario
(in million)
Active
(difference
between two
scenarios) days
gain
(in million)
Active days
gain/Per
person
(number of
days)
Germany 133.9 128.2 5.8 2.4
Hungary 6.3 6.1 0.2 1.0
Source: Own elaboration (dissertation data)
Monetization of sick days: Monetization of any health effect is greatly debated and its
methods have certain shortfalls (Luck et al 2012). For instance, most of the ecosystem-related
impacts are monetized using the “willingness to pay” (WTP) approach which basically reflects
people’s preference for environmental goods and services (Söderholm and Sundqvist 2003).
However, the use of the WTP approach can cause an underestimation because people may be
-
0.50
1.00
1.50
2.00
2.50
2.43
1.01
Nu
mb
er o
f d
ays/
year
Germany Hungary
CE
UeT
DC
olle
ctio
n
168
unaware of the actual costs of the damage. The details of these methodologies are already
discussed in chapter 4, section 4.2. In this dissertation, however, avoided sick days are
calculated only for the working population and it is calculated based on the sick leaves and
presenteeism days. Thus, this study uses country-specific daily net wage as a proxy value to
monetize the avoided sick days.
The monetization of active days gain is calculated by multiplying avoided sick days with daily
wage and daily net income is calculated by dividing monthly net income with the number of
working days in a month i.e. 22 days. The daily net income is not readily available for both the
countries but the monthly net income data is available for both countries. The country-specific
monthly net income data is extracted from Eurostat database (Eurostats-
http://appsso.eurostat.ec.europa.eu). As per Eurostat 2014 net monthly income database, the
monthly net income for Germany and Hungary are 3045 and 811 Euro respectively. Calculated
from the net monthly income, the net daily income would be 138 and 37 Euro for Germany
and Hungary respectively.
Thus using these monetary units, Germany and Hungary have a potential of gaining 331 million
and 5 million Euros/year respectively, by having airtight residential buildings with HVAC
system. These monetary gains are calculated assuming that the wage in 2030 of these two
countries would remain the same as in 2015, and thus these monetary figures are somewhat
undervalued as they do not incorporate the rate of inflation. Similar to the residential sector,
the tertiary building related active days gain can also be calculated by following the same
process i.e. the number of active days gains multiplied by daily net income and daily net income
is calculated by dividing monthly net income with the number of working days in a month i.e.
22 days. Germany and Hungary can gain 332 million and 2 million Euro/year respectively by
having more airtight tertiary buildings with HVAC system and proper building shell. At per
capita scale, Germany and Hungary can gain around 730 and 81 Euro/ year respectively by
CE
UeT
DC
olle
ctio
n

169
having more deep retrofit-type residential buildings. Similarly, for tertiary building sector at
per capita scale, Germany and Hungary can gain 337 and 37 Euro/ year respectively.
Analysis of the result of avoided sick days gain: The active days gain is bigger in Germany
compared to Hungary because Germany has taken more sick leaves compared to Hungary. In
Germany, the average sick leaves taken annually were 18.3 days/person which are also quite
high above the average EU sick leaves. The average sick leave taken within EU-28 is of around
10.62 days/per person annually (OECD database of compensated sick leave). Whereas, in
Hungary, the annual sick leaves are 7.9 days/person. These sick leave data are compensated
sick leave data- meaning sick leaves which are compensated by the government, or the
employer. Similar to Germany, for Hungary also compensated sick leave data is used to
calculate avoided sick leaves. One key reason behind Germany’s high sick leaves is probably
a well-design social security system for the employees. As per the German labour law, in case
of sick leaves, the employer is obliged to pay the full wage for up to six weeks under the act
on the continuing of remuneration (Entgeltfortzahlungsgesetz, EntgFG) and after six weeks,
the health insurance covers 70% of one‘s gross salary in case of long-term sickness (Kraemer
2017). Moreover, termination of employment contract while an employee is on sick leave is
prohibited unless an unlawful conduct is detected (Kraemer 2017). Thus, employees take sick
leaves in case of sickness without worrying about financial security or job security. On the
contrary, the Hungarian labour code dictates to pay 70% salary in case of a sick leave (Kiss et
al. 2017). Thus, compared to Germany, the compensated sick leave taken in Hungary is lower
due to the finacial insecurity.
However, the concern here is that irrespective of the strength of the social security systems,
both Hungary and Germany are losing many days because of sickness. One possible reason for
the high number of sick days could be that 95% of the German residential buildings were non-
retrofitted until 2015 and a similar trend can be seen for tertiary building sector i.e. 97% of the
CE
UeT
DC
olle
ctio
n
170
German tertiary buildings were non-retrofitted (COMBI 2018, D2.3 annex report). In Hungary,
97% of the residential buildings and 96% of the tertiary buildings were non-retrofitted until
2015 (COMBI 2018, D2.3 annex report). This high number of non-retrofitted buildings might
have resulted in poor indoor air quality and thus more frequent sickness.
Thus, health effects due to the installation of energy efficiency measure has become significant.
Instead of absolute gain, if the relative gain is considered then the results look more significant
for both the countries:
Before the implementation of energy efficiency measure, the active days loss
(combination of absenteeism and presenteeism) in Germany was 21.4 days,
person/year. However, after implementation of energy efficiency measures i.e. HVAC
system with airtight building envelopes in both residential as well as in the tertiary
sector, total active days gain is 7.7 days, including active days gain in both residential
and tertiary building sector. This gain accounts for around 36% savings of active days
loss, that is, 36% active days can be gained by implementing energy efficiency
measures in both residential and tertiary building sector in Germany.
Similarly, in Hungary, the active days loss (combination of absenteeism and
presenteeism) was 11 days/person/year and among these days total 3.21 active days are
saved by implementing energy efficiency measures in the building sector which
accounts for around 29% of active days savings. Thus, in relative terms as well,
Germany is gaining more active days compared to Hungary. Though in absolute terms,
per capita days saved in Hungary do not look big but in relative terms, 29% seems quite
significant considering the fact that not all the sick leaves are taken due to indoor
exposure to pollutants.
CE
UeT
DC
olle
ctio
n

171
Now, in order to have an in-depth analysis, the disease-specific avoided days should be
considered. Figure 14 below presents the percentages of sick days saved from three diseases
after installing energy efficiency measures in both residential and tertiary building sector:
Figure 14: Disease specific active days gain for each country in the year 2030 after installing energy efficiency measure in
residential and tertiary buildings
Source: Own elaboration (dissertation calculation)
69% 68%
20% 19%
11% 13%
0%
10%
20%
30%
40%
50%
60%
70%
80%
90%
100%
Germany Hungary
Per
cen
tage
of
dis
eaes
e d
ays
save
d/p
erso
n,y
ear
Chart A: Percentage of sick days saved from different diseases due to living in energy efficient residential buildings
Asthma and Allergy Cold and flu CV
50% 48%
43% 42%
8% 9%
0%
10%
20%
30%
40%
50%
60%
70%
80%
90%
100%
Germany Hungary
Per
cen
tage
of
dis
eaes
e d
ays
save
d/p
erso
n,y
ear
Chart B: Percentage of sick days saved from different diseases due to working in energy efficient tertiary buildings
Asthma and Allergy Cold and flu CV
CE
UeT
DC
olle
ctio
n

172
Both charts A and B in figure 14 represent 100% as the total sick days saved from installing
improved HVAC system with airtight building envelope-meaning, 5.2 days for Germany and
2.2 days for Hungary in the residential building sector and 2.4 for Germany and 1.0 for Hungary
in the tertiary building sector. The sick days savings from cold and flu is actually higher for
both Germany and Hungary compared to their cold and flu-related gain from the residential
building sector. There are mainly two reasons behind this:
Cold and flu disease can be contagious and there is a higher possibility to spread from
tertiary buildings since more people work there. Thus, considering the contagious
nature of this disease, the TSF is assumed to be higher for cold and flu as discussed in
chapter 4, section 4.3.5, compared to other diseases. For diseases apart from cold and
flu, the TSF factor is minimizing the effect as per the time spent in the tertiary buildings.
More people shift to the deep retrofit-type tertiary buildings compared to the residential
buildings. For instance, in Germany around 2 million more working people are moving
to the deep retrofit type of buildings in the efficiency scenario, whereas in the residential
sector, 1 million more working population are moving to the deep retrofit type
residential buildings (COMBI 2018, D2.3 Annex report). Thus, the incremental gain is
much higher in the tertiary sector. In Hungary, almost 0.19 million more people are
working as well as residing in the deep retrofit type tertiary buildings and residential
buildings respectively. Though in Hungary, the population shifts in the deep retrofit-
type buildings are almost the same for the residential and tertiary building sectors, but
due to the higher value of TSF for cold and flu disease, Hungary’s percentage of saved
sick days from cold and flu is higher for the tertiary sector compared to its residential
sector.
From table 28 and figures 12 and 13, it is clear that Germany is gaining more active days
compared to Hungary. Though this dissertation’s objective is not to compare between these
CE
UeT
DC
olle
ctio
n

173
two countries but to provide an analysis of the results, it offers few more possible explanation
of this higher active days gain in Germany. One of the reasons behind Germany’s high active
days gain is already explained at the beginning of this section i.e. use of compensated sick
leave. Apart from using compensated sick leave, there are other explanations as well behind
this gain, such as:
1. In Germany, the reduction rate of asthma and allergy due to the installation of HVAC
system with airtight building shell is 57% and the reduction rate of cardiovascular
diseases reduction rate is 44% (refer to table 19, chapter 5). Both of these reduction
rates are above the average compared to EU-26 reduction potential (Healthvent project
data). The average reduction potential at the EU- 26 is 40% for cardiovascular diseases
and 55% for asthma and allergy (healthvent project data). Whereas in Hungary, the
reduction rate of asthma and allergy due to installation of HVAC system with proper
building shell is 52% and the same for cardiovascular diseases reduction rate is 38%
(Healthvent project data). These reduction factors are calculated based on the
assumption that HVAC system with airtight building envelope can result in 90%
reduction in radon, carbon monoxide and second-hand smoke, 50% reduction in VOC
and dampness exposure, and 25% reduction in particulate matter (PM2.5) (Asikainen,
et al. 2016). These reduction rates of pollutants are assumed the same for both Germany
and Hungary.
2. In the efficiency scenario, 17% and 7% more German residential buildings and tertiary
buildings respectively are retrofitted in the deep retrofit type or passive house standard
compared to the reference scenario. Whereas, in Hungary, 9% and 5% of the residential
and tertiary buildings respectively are retrofitted in the deep retrofit type or passive
house standard compared to the reference scenario. Thus, it is quite natural that more
CE
UeT
DC
olle
ctio
n

174
people would gain productivity in Germany compared to Hungary, since fewer
buildings are retrofitted in the deep retrofit type/passive house standard in Hungary.
3. Since country-specific presenteeism data is not available, the average presenteeism data
which is 3.1 days/person annually, is used for both the countries. As a result, a country
with a higher population tends to gain higher active days. Since the social security
system in Hungary is not as good as the system in Germany, it is possible that
presenteeism days are much higher in Hungary. Thus, country-specific survey is
required to find out the presenteeism days for Hungary.
Results- healthy life years gain: As discussed in chapter 3 and 4, there could be other diseases
- both chronic and acute - which can be caused due to indoor exposure. Moreover, avoided sick
days are calculated only for the working population and DALY calculates healthy life years for
the entire population including people who are not in the labour market. Equation 12 is used
(see chapter 4, section 4.3.5.1) to calculate DALY saving or healthy life years gained by
installing improved energy efficiency measures. The result shows that if the improved HVAC
system with an airtight building envelope is installed in the residential building sector then
Germany and Hungary could gain 1870 and 3849 healthy life years/million population in a
year, respectively.
CE
UeT
DC
olle
ctio
n

175
Figure 15: Disability adjusted life years saved in the year 2030/million population who have shifted to deep retrofitted type
residential buildings
Source: Own elaboration (dissertation calculation)
From the DALY gain figure (see figure 15) it is observed that Hungary is having higher health
benefits compared to Germany after moving to the deep retrofit-type residential buildings. In
case of avoiding sick days, Germany has been the highest gainer compared to Hungary but
when diseases such as lung cancer, chronic obstructive pulmonary disease (COPD) and
cardiovascular disease-related mortalities are included, Hungary becomes the highest gainer.
Figure 16 below presents the disease-specific life years saved for both the countries.
1,870
3,849
-
500
1,000
1,500
2,000
2,500
3,000
3,500
4,000
4,500H
ealt
ly li
fe y
ears
sav
ed/m
illio
n,y
ear
Germany Hungary
CE
UeT
DC
olle
ctio
n

176
Figure 16: Disability adjusted life years saved /million population who have shifted to deep retrofitted type residential
buildings, year from each diseases
From figure 16 it can be observed that apart from asthma and allergy, for all the other diseases
Hungary gains more life years compared to Germany. The values of DALY in two scenarios
are presented in the table below:
Table 29 : Disability adjusted life years in different scenario
Country Total DALY in
reference
scenario (in
years)
Total DALY in
reference
scenario (in
years)
Total DALY
gain (avoided
DALY) (in
years)
Percapita
DALY gain
(in years)
Germany 295,592 291,530 4,062 1,870
Hungary 65,898 64,241 1,657 3,849
Source: Own elaboration (dissertation calculation)
Monetization of DALY: The monetization of health impact is not easy and is controversial by
nature. In case of avoided sick days, the sick days are monetized by multiplying with the daily
wage. The critics of the monetization of DALY suggest that “human life is the ultimate example
of a value that is not a commodity and does not have a price“ (Ackerman, and Heinzerling
- 500 1,000 1,500 2,000 2,500
Asthma and allergy
Lung (trachea & Bronchus) cancer
CV-diseases
COPD, DALY total
Healtly life years saved/million,year
Hungary Germany
CE
UeT
DC
olle
ctio
n

177
2002). However, it needs to be understood that monetization of health indicators such as the
value of statistical life (VSL) or DALY does not value an actual life, rather it values the amount
of money that can be spent or the amount of money received/saved to avoid a certain type of
health risks (Fiúza et al. 2006). If the health benefits are not quantified then these health benefits
would simply be out of the cost-benefit accounting. Thus, to have accounts of the health
benefits, such as DALY gain, one should monetize it.
This dissertation monetizes DALY by using the value of a life year (VOLY) estimates. Since
healthy life years saved accounts life-saving of the senior age citizens as well, it is better to use
the “value of a life year (VOLY) estimates per (avoided) death assuming that the group affected
would have lived at least one more year“ (Mzavanadze et al. 2018). The country-specific
VOLY values are taken from the COMBI work package 5 report (https://combi-project.eu/wp-
content/uploads/D5.4). The VOLY for Germany and Hungary are around 0.15 million and 34
thousand Euro respectively (Mzavanadze et al. 2018).
Therefore, multiplying these VOLY figures with years of life saved accounts for around 602
million Euro and 57 million Euro for Germany and Hungary respectively. At per capita level,
Germany and Hungary can gain around 277 million Euro and 134 million Euro respectively.
Analysis of the result- Healthy life years saved: The possible explanations for this result are
the following:
Compared to Germany, one of the key reasons behind Hungary’s high life years gain is
the higher outdoor pollution concentration (mainly PM2.5) in Hungary (Hänninen and
Asikainen 2013), (WHO 2016). More precisely, the PM 2.5 concentration in Hungary
is 21 micrograms per cubic meter (ug/m3) annually which is the second highest in the
European member states following Bulgaria, whereas in Germany the PM 2.5
concentration is 14 (ug/m3) annually (WHO 2016). Here, the DALY gain for Hungary
CE
UeT
DC
olle
ctio
n
178
has primarily resulted by avoiding indoor exposure-related lung cancer and
cardiovascular diseases (as it can be seen in figure 16). By having an airtight building
envelope, pollutants such as PM, VOC would infiltrate less in indoor and thus, cause
less exposure to pollutants in indoor, result in higher DALY gain.
As per the world cancer research Fund data, Hungary has the highest number of lung
cancer cases in Europe (World Cancer Research International 2012). Thus, it is justified
that Hungary has the higher per capita DALY gain mainly through savings of healthy
life years from lung cancer by having more airtight buildings which prevents infiltration
of the pollutants, mainly PM 2.5 along with VOC and radon exposure up to some extent.
In Hungary, the cancer reduction percentage by avoiding these above mentioned
pollutants is 55%, whereas the same in Germany is 53%.
The baseline healthy life years lost due to lung cancer (lung cancer from indoor
exposure to pollutants) are 838 years/million population and 2571 years/million
population for Germany and Hungary respectively (Healthvent project data). The
healthy life years lost due to cardiovascular diseases (cardiovascular diseases due to
indoor exposure to pollutants) are 2298 years/million population and 5376
years/million population for Germany and Hungary respectively (Healthvent project
data). These baseline data shows that both cancer and cardiovascular disease-related
healthy life years loss are already higher in Hungary compared to Germany and thus, a
reduction in disease risk is resulting in a higher gain (at the per capita level) in healthy
life years for Hungary compared to Germany.
Results- time saved from congestion: Time saved from congestion is calculated based on the
rate of modal shift. As discussed in the assumption section in chapter 5, the infrastructure (such
as cycling and walking lane, public transport availability and connectivity etc.) for the modal
shift is a pre-requisite for modal shift. In order to evaluate, equation 13 (refer to chapter 4,
CE
UeT
DC
olle
ctio
n

179
section 4.3.5.1) is used to calculate the time saved from congestion due to modal shift towards
active transportation. The result shows that by opting for the modal shift towards active
transportation, Germany can save 2.5 hours annually, per driver and Hungary can save 0.5
hours annually, per driver during the peak congestion. These traffic time saved figures reflect
only time saved only during peaked congestion as discussed in Chapter 3, section 3.2.2.2.
Figure 17 below shows per-capita hours saved from congestion after modal shift towards active
transportation:
Figure 17: Active time saved in hours from road congestion in the year 2030/per driver
In absolute terms, these figures for both the countries are not high. The active days results in
the different scenario are presented in table 30:
2.5
0.5
0 0.5 1 1.5 2 2.5 3
Germany
Hungary
Hours saved from congestion/driver,year
CE
UeT
DC
olle
ctio
n

180
Table 30: Traffic congestion time loss during peak hours in different scenario
Country Congestion time
reported/per
driver,year(hour)
Total time
spent in
congestion
in the
reference
scenario
(in hours)
Total time
spent in
congestion
in the
efficient
scenario(in
hours)
Active
time
(Hours/year)
Active
time /Driver,
(Hours/year)
Germany 38 763,139 715,516 47,623 2.5
Hungary 5 5,745 5,162 583 0.5
Source: Own elaboration (dissertation calculation, except congestion time reported data)
As discussed in chapter 5, the congestion time reported/per country data is collected from
INRIX traffic scorecard and the rest of the data in table 30 are calculated using this
dissertation’s equation.
Monetization of time saved from congestion: Active time gain from congestion can be
monetized as well by multiplying hours saved from congestion with the hourly wage. The mean
hourly wage data is extracted from the Eurostat mean hourly wage database
(http://ec.europa.eu/eurostat/web/labour-market/earnings/database). The mean hourly wage
for Germany and Hungary are around 18 and 5 Euro respectively. By multiplying this wage
with hours save, Germany and Hungary can save annually up to 0.8 million Euro and around
2.5 thousand Euro respectively, year by saving traffic time due to the modal shift.
Although it could be a case that all the drivers stuck in traffic jam may not be a worker or going
to work thus, may not be accurate to use the hourly national wage to monetize. But, here the
main objective to monetize the hours saved is to provide an estimate of the magnitude of the
modal shift-related effect on congestion. A person though may not go to work or coming back
from work even during peak hours, but with the saved travel time, the person can be socially
productive. However, as these traffic hours include only the peak time data, it is highly likely
CE
UeT
DC
olle
ctio
n
181
that the majority of the passengers are office goers. Thus, hourly wage here is used as a proxy
value to monetize the impact on all the drivers.
Analysis of the result –time saved from congestion: Congestion is not an issue for all the
countries within the EU member states and thus, the time saved from congestion can be
estimated only for those countries where congestion data is reported. Both Germany and
Hungary reported their congestion time and hence their time gains are estimated in this
dissertation. Although in absolute terms, the time savings is not much intuitive, but in relative
terms, it can be quite significant. For instance, Hungary reported 5 hours/driver traffic time
annually (INRIX traffic scorecard data-refer to chapter 5) and with the modal shift towards
active transportation, Hungary can save 0.5 hours/driver annually. Thus, Hungary saves 11%
of the congestion time by opting for modal shift. Similarly, Germany is reported to have 38
hours of traffic time/driver annually (INRIX traffic scorecard data-refer to chapter 5) and
Germany saves 6% of the congestion time by opting for modal shift. Although in absolute
figures, Germany is saving more hours compared to Hungary but Germany’s reported
congestion is also higher compared to Hungary. Thus, it is always recommended to see the
relative savings than absolute savings since absolute savings depend on the country size. That
means congestion time depends positively on a country’s population of car drivers and higher
number of car drivers would result in high congestion. Behind these relative high savings of
congestion time, the possible reason could be that the modal shift incremental rate in Hungary
would be 3.9% in 2030. That means 3.9% more trips are shifted towards active transportation
in the efficiency scenario compared to the reference scenario. In Germany, the incremental rate
would be 2.9% (COMBI 2018).Thus, due to this higher rate of modal shift in Hungary, the
country is gaining more time from traffic relatively compared to Germany. Unfortunately, the
different rates of modal shift rate in Germany and Hungary cannot be explained, since the
COMBI modal shift model uses many external models to derive the modal shift scenarios.
CE
UeT
DC
olle
ctio
n

182
These multiple models used (such as PRIME, EUCO, ITRAN and ASTRA) make the analysis
of different modal shift rates difficult.
6.2 Quantification and monetization of workforce performance resulting from energy
efficiency measure:
Working in a deep-retrofit type of building would not only reduce sick days but it also would
have a positive impact on employee’s performance. As discussed in chapter 4, workforce
performance is a tertiary sector specific indicator which accounts for the additional gain in
performance by having better mental well-being. Workforce performance does not consider
absenteeism or presenteeism related workhour loss.
Results –workforce performance: Workforce performance is calculated by using equation 16
(refer to chapter 4, section 4.3.5.2). The result shows that by moving into deep retrofit-type of
tertiary buildings, Hungary and Germany can gain annually around 0.4 million and 4 million
working hours respectively. Workforce performance calculates the number of actual hours
worked before and after the implementation of tertiary sector-specific energy efficiency
measure. To present this data in a reader-friendly way, the actual hours of work are converted
into the number of working days. Figure 17 shows the annual workforce performance
improvements in working days in a country.
CE
UeT
DC
olle
ctio
n

183
Figure 17: Number of working days gained/per (equivalent to workhours) country by improving mental well-being in the
year 2030
These days gains are only due to only improvement in mental well-being. The workforce
performance data or in other words, the labour input data in different scenarios are presented
below:
Table 31: Labour input in actual hours working in two scenarios
Country Actual hours
workings
(Hours/per
person,year)
Total Actual
hours workings
in reference
scenario
(In billion)
Total Actual
hours workings
in efficient
scenario
(In billion)
Total work
hours gain/year
(In million)
Germany 1,363 46 46 4
Hungary 1,761 6 6 0.4
Source: Own elaboration (Dissertation data, except for actual hours working data)
As discussed in chapter 5, the actual hours working data for each country is sourced from the
OECD database and the rest of the data are calculated by using the equations discussed in
chapter 4, section 4.3.5.3.
604
49
0 100 200 300 400 500 600 700
GermanyHungary
Number of working days gain/year
Thousands
CE
UeT
DC
olle
ctio
n

184
Analysis of the result- workforce performance: In the case of workforce performance, since
no country-specific data is available, I use a single productivity gain factor for both countries.
My model requires a specific productivity gain factor i.e. what would be the effect on mental
well-being due to the HVAC installation in complete airtight buildings. In this study, I
estimated the actual hours of working in 2030 for each country after implementing the energy
efficiency measure. Since the data I found is per worker’s incremental work hour/year after
shifting into `green buildings`. The performance enhancement factor is unique here as this
factor only reflects the performance enhancement from improved mental well-being which is
an addition to the presenteeism days avoided. This additional factor of performance
enhancement is added with actual hours working values for each the countries. Thus, a country
with higher workforce working in deep retrofit type buildings would have higher workforce
performance gain. For instance, Germany has 7% more passive house standard tertiary
buildings in the efficiency scenario compared to its reference scenario and also 7% more
German workforce work in the deep-retrofit type of buildings compared to the reference
scenario. Whereas in Hungary, there are 5% more passive house standard tertiary buildings in
the efficiency scenario compared to its reference scenario and 6% more Hungarian workforce
work in the deep-retrofit type buildings compared to the reference scenario. Thus, Germany
would gain a higher workforce performance compared to Hungary after implementing an
energy efficiency measure.
Monitization of workforce performance: Working days gain is simply calculated by dividing
work hours gain from energy efficiency measure in the tertiary sector with usual working hours
i.e. 8 hours. The work hours (days) gain by shifting into the deep retrofit type of tertiary
buildings is presented here as work days gain to provide a more insightful overview of
workforce performance impact. The workforce productivity gain can also be monetized by
multiplying the number of annual working days gained/ year (equivalent to work hours) with
CE
UeT
DC
olle
ctio
n

185
daily wage similar to avoided sick days. To provide the potential for mental well-being,
presentation of the monetary values of workforce performance is essential. Thus, by
monetizing the workforce performance, the results show that Germany and Hungary can gain
annually 34 million Euro/year and 0.60 million Euro/year respectively by gaining more
productive work hours from improved mental well-being.
6.3 Summary of results:
Productivity is measured in this dissertation by quantifying different aspects of productivity
which are resulted from sustainable energy measures. This study quantifies three indicators of
labour productivity which are resulted from two sustainable energy measures namely: the
improved HVAC system with an airtight building envelope and the modal shift towards active
transportation. The three indicators are active days, workforce performance and earning ability.
The earning ability could not be quantified due to the data constraints. The active days have
three further aspects: avoided sick days, healthy life years gain and time saved from congestion.
Table 32 summarises the results and present both physical and monetary values of each
productivity indicators for both Hungary and Germany:
Table 32: summary of results
Indicator Germany Hungary
Avoided sick days/year from
residential building sector
(In million days)
5.8 0.43
Per capita-avoided sick days
gain/year from residential
building sector
5.27 2.20
Avoided sick days in Euro
(In million Euro/year)
802.6 15.9
Avoided sick days /year
from tertiary building sector
(In million days)
5.8 0.20
CE
UeT
DC
olle
ctio
n

186
Indicator Germany Hungary
Per capita- avoided sick
days from tertiary building
sector
2.43 1.01
Avoided sick days in Euro
(In million Euro/year)
805.5 7.2
Healthly life years gain (in
years)
4062 1657
Per capita (per million)
healthly life years gain (in
years)
1,870 3,849
Monetization of total
healthly life years (in
million Euro)
602 57
Monetization of per capita
healthly life years (in
million Euro)
277 134
Workforce performance
(Hours/year) (in million
hours)
4.8 0.40
Workforce performance
(equivalent to work
days/year)
603,971 48,781
Monetary values (In million
Euro/year)
85.9 1.8
Active time (Hours/year) 47,623 583
Active time gain/driver
(Hours/year)
2.46 0.54
Monetary value (Euro/year) 846,735 2,706
Source: Own elaboration (dissertation calculation)
6.4 Sensitivity analysis:
6.4.1 Uncertainties and limitations:
Like any quantitative study, this study also has a certain number of uncertainties and
limitations. The key uncertainties and limitations of this study are discussed here:
1) Technical optimization: In this dissertation, technical optimization plays a crucial role
to estimate productivity impact. For example, as discussed in chapter 3 if the HVAC
CE
UeT
DC
olle
ctio
n

187
system is not properly installed or properly maintained then it could be a source of
pollutant itself. In this study, it is assumed that all the technical measures such as HVAC
system are properly installed and maintained.
2) National average versus individual cases: The model used in this study estimate
productivity by using national average data. However, it could be the case that
individual case is higher/lower than average data. For instance, the reaction towards
particulate matter exposure would vary among different individuals.
3) Value of conversion factor: In our model, the disease-specific DALY reduction
percentage is used as a conversion factor or health gain factor to estimate active days
gain indicator. However, the DALY reduction percentage may include both mortality
and morbidity factors. These DALY reduction percentage data are taken from the
Healthvent project and it is not clear what the proportion of mortality and morbidity
factors in the DALY reduction percentage is. Thus, we have to assume the whole
DALY reduction percentage as our conversion factor. However, since the active days
gain indicator only consider acute diseases, the DALY reduction percentage would
mostly contribute to morbidity.
4) The scenario analysis consists of a certain level of uncertainty for any future forecast.
We may not be aware of all the effects of the system on human health and also any of
the future economic conditions are unpredictable. Thus, we must rely on the
assumption.
6.4.2 Test of parameters:
There are few important variables in this study whose values are subject to uncertainty. Thus,
a sensitivity analysis is required to estimate the uncertainty range of this model. For sensitivity
analysis, three key parameters namely conversion factor, performance improvement factor and
CE
UeT
DC
olle
ctio
n

188
traffic time saved factor which have a larger influence on the final results, are tested. Each of
these parameters are discussed in the section below:
Conversion factor: As discussed earlier, the conversion factor shows how much health
gain/loss can be achieved from each retrofit type of buildings. Health improvement only takes
place if the buildings are completely airtight and HVAC systems with sensors are installed and
maintained properly. If the HVAC system is not properly installed and/or not maintained
properly then the intensity of health gains would vary.
In order to provide some sensitivity analysis to estimate the impact of unmaintained or poorly
installed HVAC system, a different scenario with lower impact is estimated. This scenario is
referred to as low scenario. If HVAC system is properly installed with proper sensors in an
airtight building then people living/working in the building would gain a higher health benefits
from this measure. Thus, another scenario with the highest impact is estimated. This
dissertation refers to it as high scenario. Apart from these two scenarios impact, there is also
my model scenario where the health benefits from a properly installed HVAC system in an
airtight building is assumed with moderate impact. This scenario refers to it as the dissertation
scenario. Comparing these three scenarios would provide an uncertainty range of values. These
three scenarios discussed above are the same for avoided sick days, and healthy life years gain.
The high scenario is assumed with a reduction of 100% radon, 75% reduction in carbon
monoxide and second-hand smoke, and also 75% reduction rate in volatile organic compound
(VOC) and dampness exposure. The low scenario is assumed with reduction of 80% radon
exposure, 25% reduction in carbon monoxide and second-hand smoke, and 25% reduction in
volatile organic compound (VOC) and dampness. Whereas the dissertation scenario assumes a
90% reduction in radon, carbon monoxide and second-hand smoke, 50% reduction in VOC and
dampness exposure, and 25% reduction in particulate matter (PM2.5) (Asikainen et al. 2016).
CE
UeT
DC
olle
ctio
n

189
Figure 18 below shows the Germany and Hungary’s active days gain/ person who have shifted
to deep retrofit type buildings in the year 2030 by installing HVAC system with airtight
building envelope (energy efficiency measure-EE measure) in the residential building sector in
these two countries.
6.66
4.35
5.27
-
1.00
2.00
3.00
4.00
5.00
6.00
7.00
Nu
mb
er o
f d
ays/
year
Chart A: Active days gain from residential sector improved EE measure in different scenarios-Germany
High Scenario Low Scenario Dissertation Scenario
CE
UeT
DC
olle
ctio
n

190
Figure 18: Active days gain in Germany and Hungary in the year 2030 by installing energy efficiency measure in the
residential building sector in three different scenarios
As it can be seen from figure 18 that even the lowest possible impact of HVAC system has a
significant productivity gain. The data for these three scenario’s data are taken from the
Healthvent project. Assuming these three scenarios, the range of productivity gain by avoiding
sick days for Germany would be between 4.35-6.66 days/per person annually and for Hungary
the same would be between 1.87-2.71 days/person, year. These ranges are valid for the
residential building sector. Similarly, the uncertainty range can be seen in the tertiary building
sector by comparing these three scenarios. Figure 19 shows below the range of uncertainties in
the tertiary building sector by installing HVAC measure in both Germany and Hungary:
2.71
1.87
2.20
-
0.50
1.00
1.50
2.00
2.50
3.00
Nu
mb
er o
f d
ays/
Year
Chart B: Active days gain from residential sector improved EE measure in different scenarios- Hungary
High Scenario
Low Scenario
Dissertation Scenario
CE
UeT
DC
olle
ctio
n
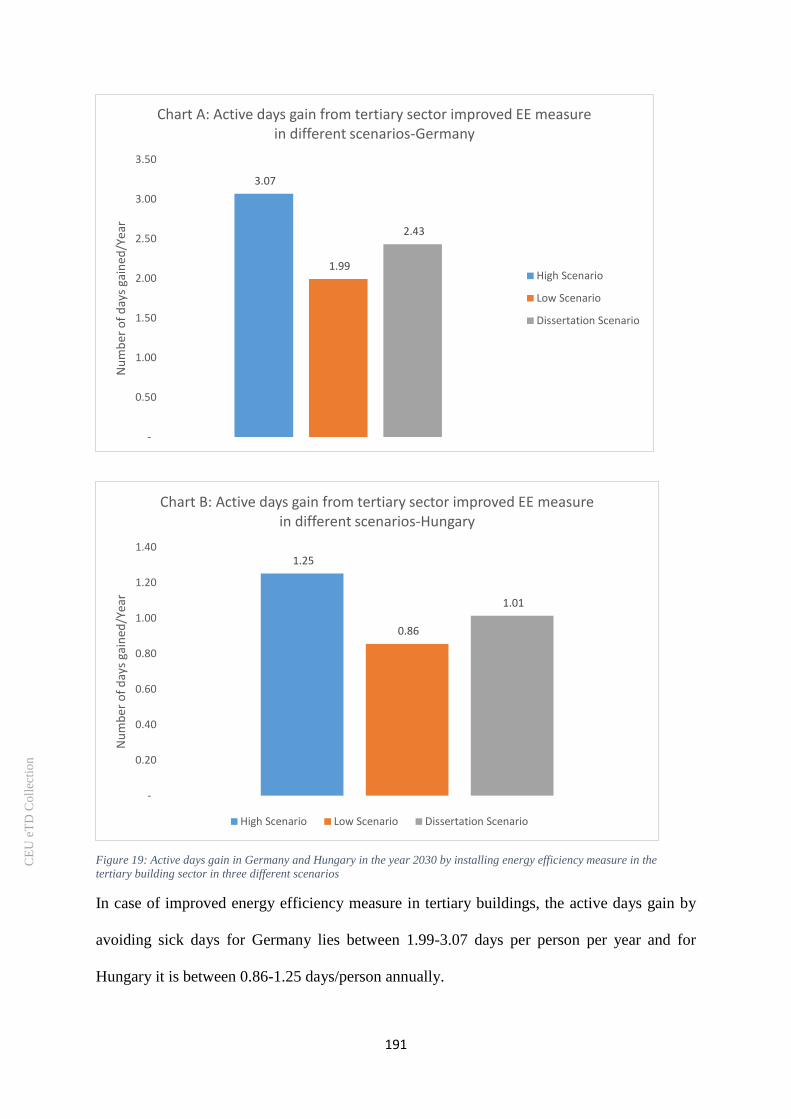
191
Figure 19: Active days gain in Germany and Hungary in the year 2030 by installing energy efficiency measure in the
tertiary building sector in three different scenarios
In case of improved energy efficiency measure in tertiary buildings, the active days gain by
avoiding sick days for Germany lies between 1.99-3.07 days per person per year and for
Hungary it is between 0.86-1.25 days/person annually.
3.07
1.99
2.43
-
0.50
1.00
1.50
2.00
2.50
3.00
3.50
Nu
mb
er o
f d
ays
gain
ed/Y
ear
Chart A: Active days gain from tertiary sector improved EE measure in different scenarios-Germany
High Scenario
Low Scenario
Dissertation Scenario
1.25
0.86
1.01
-
0.20
0.40
0.60
0.80
1.00
1.20
1.40
Nu
mb
er o
f d
ays
gain
ed/Y
ear
Chart B: Active days gain from tertiary sector improved EE measure in different scenarios-Hungary
High Scenario Low Scenario Dissertation Scenario
CE
UeT
DC
olle
ctio
n

192
Similarly, also for DALY a sensitivity analysis can be conducted considering the same scenario
definitions.
Figure 20: Healthy life years gain in Germany and Hungary by installing energy efficiency measure in the residential
building sector in three different scenarios
2454
1,737 1,870
0
500
1000
1500
2000
2500
3000
High Scenario Low Scenario Dissertation Scenario
Hea
lth
ly li
fe y
ears
gai
n/M
illio
n p
op
ula
tio
n
Chart A: Healthly life years gain/million population,year by installing improved EE measure-Germany
4761
3,595 3,849
0
500
1000
1500
2000
2500
3000
3500
4000
4500
5000
High Scenario Low Scenario Dissertation Scenario
Hea
lth
ly li
fe y
ears
gai
n/M
illio
n p
op
ula
tio
n
Chart B: Healthly life years gain/million population,year by installing improved EE measure-Hungary
CE
UeT
DC
olle
ctio
n

193
As it can be seen that the healthy life years gain for Hungary is higher (lies between 4761- 3849
years/per million population) compared to Germany (lies between 2454- 1870 years/per million
population).
The reduction rates of different diseases would be different under these three scenarios. For a
better understanding, different reduction rates are presented in table 33:
Table 33: Disease specific reduction rate under different scenarios
Germany Hungary
High
Scenario
Low
scenario
Dissertation
scenario
High
Scenario
Low
scenario
Dissertation
scenario
Asthma &
allergy
72% 46% 57% 64% 43% 52%
Lung (trachea
& Bronchus)
cancer
70% 47%
54% 68% 48% 56%
COPD 60% 42% 45% 50% 37% 39%
Cardiovascular
diseases
58% 43% 44% 47% 37% 38%
Source: Own elaboration (data extracted from the Healthvent project)
The disease reduction rate in the dissertation scenario is previously discussed and presented in
section 6.1. These disease reduction rate data are taken from the Healthvent project where a
dose-response model is used to calculate these reduction rates. These reduction rates show that
even with the low scenario, the HVAC system with airtight building envelope can play a
significant role in the improvement of health.
Performance improvement factor: As discussed, performance may enhance by reducing
mental stress and anxiety. These reduction rates would vary as per the nature of the work. The
uncertainty analysis for performance improvement factor mostly reflects this nature of job that
impacts on productivity. More precisely, if the nature of the job is repetitive, such as
proofreading, typing etc., then productivity gain would be much higher by working in a deep
retrofit type of buildings. In this study, since we are calculating the workforce performance at
CE
UeT
DC
olle
ctio
n

194
the national level, it is difficult to consider the nature of the job. Hence, we have considered a
factor for our model which is kind of mix of all kind of jobs such as managerial where the
nature of the job is mostly not repetitive and support staffs where the jobs may be repetitive.
However, if we consider mainly repetitive tasks then productivity gain would be much higher
than 2.02 hours/per person annually. We call it to be dissertation scenario. Thus, as per
Wargocki et al 2000 study, adequate ventilation rate at the workplace would improve the work
performance by 1.4%. In this study, I use this factor as our source to find uncertainty range of
workforce performance factor. We call it as high scenario. Figure 21 shows the productive
hours gain by avoiding mental stress and disorder for both Germany and Hungary:
19.08
2.02
0.00
5.00
10.00
15.00
20.00
25.00
High Scenario Dissertation Scenario
Nu
mb
er o
f h
ou
rs g
ain
ed/p
er
per
son
/yea
r
Chart A: Number of work hours gain/per worker by improving mental well-being-Germany
CE
UeT
DC
olle
ctio
n

195
Figure 21: Work hours gain/per person in the year 2030 by installing HVAC system in the tertiary building sector
For both Germany and Hungary, the same performance improvement factor is used. The
performance improvement factor’s uncertainty range is presented here to show the range. The
significant difference between these two scenarios mainly occurs due to the nature of the job
and sample size. In the high scenario, the nature of the job is repetitive and requires less skill.
In these kinds of jobs such as proofreading, logical reasoning etc. there remains a higher
potential to enhance performance. Additionally, the sample size of Wargocki et al 2000 study
was quite low- more precisely it was only 30, whereas in Singh et al 2010 study’s sample size
was 142. Despite this difference in sample size, this uncertainty analysis sheds a light on the
huge potential for performance improvement through improving mental well-being by
installing the HVAC system in an airtight tertiary building. Unfortunately, there is no data
available for any other range of performance improvement by improving mental well-being
through the HVAC system.
Traffic time saved factor: As discussed earlier in chapter 3 and 4, the value of TS is calculated
from De Hartog et al. 2010 study where the rate of modal shift towards active transportation is
equal to road congestion reduction rate and from COMBI input data, the rate of modal shift
can be calculated. Hence, in this study, the rate of modal shift is equivalent to the rate of traffic
24.65
2.02
0.00
5.00
10.00
15.00
20.00
25.00
30.00
High Scenario Dissertation ScenarioNu
mb
er o
f h
ou
rs g
ain
ed/p
er p
erso
n/y
ear
Chart B: Number of work hours gain/per worker by improving mental well-being-Hungary
CE
UeT
DC
olle
ctio
n

196
congestion rate. Thus, in other words, traffic time saved factor would vary as per the country-
specific modal shift towards active transportation rate. However, Cairns, et al 2004 study
assumes a reduction rate of traffic congestion due to active transportation. This study found
that 11% reduction in all traffic can be achieved nationwide by reducing car use in the UK.
Thus, considering this traffic time saved factor referred here as the high scenario, it can be
compared with the dissertation model’s result which is referred to as dissertation scenario.
Figure 22: Traffic time saved per driver in the year 2030 for Germany and Hungary
In the case of high scenario, the UK’s rate of congestion reduction is used for both Germany
and Hungary. In the dissertation scenario, the country-specific traffic time saved factor is
calculated from the modal shift towards active transportation rate. Thus, there remains
difference between these two scenarios, which also shows the range of uncertainty. For
instance, in Germany this range is between 2.5- 5.6 hours/ per driver and in Hungary the range
is in between 0.5-0.9 hours/per driver on an average in the year 2030.
Thus, from this section, it can be concluded that even with low-performance range, there can
be a significant impact of energy efficiency measure on productivity. The purpose of this
5.61
0.90
2.46
0.55
0.00
1.00
2.00
3.00
4.00
5.00
6.00
Germany Hungary
Traf
fic
ho
urs
sav
ed/p
er d
rive
r
High Scenario Dissertation Scenario
CE
UeT
DC
olle
ctio
n

197
dissertation is not to evaluate productivity impact accurately rather provide a magnitude of the
impact, which can be obtained from implementing energy efficiency measure. With the help
of the uncertainty analysis, this dissertation shows that even considering all the obstacles, the
energy efficiency measures have a significantly positive effect on productivity. This positive
magnitude of the energy efficiency measures also reflects what we were missing so far by not
incorporating these multiple impacts of energy efficiency.
6.5 Summary of the chapter
The results for all the indicators of productivity impacts are presented and analyzed in this
chapter. The results of this study are already summarized in table 31 and thus, in this section,
the summary of results has not been presented. Like most of the empirical research, this study
has also some uncertainties due to which a sensitivity analysis is conducted to show the
sensitivity range. The sensitivity analysis shows that even with the lower range of data, the
magnitude of productivity impacts is positive. In the next chapter, it can be discussed that how
productivity impacts and why these impacts are important from a broader perspective.
CE
UeT
DC
olle
ctio
n

198
CHAPTER 7: ANALYSIS OF THE POTENTIAL OF THE
PRODUCTIVITY IMPACTS OF IMPROVED ENERGY
EFFICIENCY MEASURES
“The aim of argument, or of discussion, should not be victory, but progress”
Joseph Joubert
CE
UeT
DC
olle
ctio
n
199
7.1 Discussion about the importance of multiple impacts:
The benefits of sustainable energy policies go beyond energy cost savings. The benefits range
from energy cost savings to improvement in health, productivity or even macroeconomic
impacts (Ryan and Campbell 2012). However, these multiple impacts of energy policies do not
get incorporated into a policy evaluation analysis. One of the key reason for not incorporating
these impacts is the lack of a mature methodology to quantify these impacts (Ürge-Vorsatz et
al. 2016). Thus, in order to fill this knowledge gap regarding quantification methodology, the
aim of this study is to provide better tools and methods to quantify multiple impacts of
sustainable climate policies which can assist to the discussion of the science of multiple impacts
quantification.
Quantification of impacts is crucial not only to sell energy efficiency policies, but also the
multiple impacts would be one of the outcomes of these policies. The inclusion of impacts into
policy evaluation would make a stronger case for energy policies. Thus, not measuring the
impacts would mean undervaluation of the natural potential of a policy. For instance, this
dissertation takes two energy efficiency measures which lead to the productivity impact. Both
of these measures have an immense potentiality to save energy usage and at the same time,
they have an almost a direct impact on health and productivity. Therefore, implementing (or
adopting) improved energy efficiency measures would not only mitigate climate change
globally but at an individual level or at a societal level, it can be beneficial via the multiple
impacts, for example, health and productivity impacts.
The research question of this study is how to quantify multiple impacts especially productivity
impacts rigorously and by answering the research question, one of the key contributions of this
dissertation is to provide a methodological framework to rigorously quantify multiple impacts.
The methodological framework as discussed in chapter 4, has four key components:
CE
UeT
DC
olle
ctio
n

200
1) Identification,
2) Quantification in diffrent scenarios,
3) Monetization, and
4) Assesssment of quantification.
Each of these components has contributed to the knowledge of impact quantification
methodology. For instance, in order to conduct a systematic identification of the pathway to
productivity, each step needs to be understood from implementing improved energy efficiency
measures to productivity. Thus, for identification purpose, this dissertation uses an impact
pathway approach which enables all the pathways leading towards productivity impacts.
Similarly, for quantification purpose, this dissertation develops equations to quantify different
aspects of productivity. These equations and their respective data are quite intense in nature as
discussed in chapter 4 and 5. Each of these equations is contributing to the methods of labour
productivity quantification. Finally, the assessment discusses the reasons behind the results and
by doing so, the assessment shows the potential of productivity impacts.
With the methodological framework, it is easier to discuss the significance of multiple impacts
especially the productivity impacts. Though labour productivity is mostly seen as an incentive
to the investors only, this dissertation argues that productivity can go beyond the economic
benefits. Moreover, since health is an input factor to productivity, there is an ethical
responsibility for the policymaker to design sustainable energy policies through which state of
health would also improve. Sustainable energy policies are mostly perceived as climate change
mitigation techniques but this dissertation argues and also shows that the inclusion of multiple
impacts can provide a multi-objective framework for the sustainable energy policies. Thus, the
overall contribution of this research does not only limit itself to quantification, but it goes
further representing the various economic as well as ethical side of these energy efficiency
measures.
CE
UeT
DC
olle
ctio
n

201
7.2 Productivity impacts in the context of well-being:
Productivity impact is one of the biggest multiple impacts as it can be seen in table 3 and table
11. However, so far only a few handful aspects of productivity is measured and productivity
impacts are mostly seen as an incentive to the investors. This dissertation shows through
numbers that productivity can be equally beneficial for the individual, especially when it
involves health risks. More precisely, since health aspects are involved, productivity impacts
are equally if not more lucrative for the individual as well as for the investors. For instance, as
it is discussed in chapter 6, Hungary and Germany save/gain 29% and 36% of active days by
avoiding sick days. These sick days savings would not only be beneficial for the investors but
also for the individual who avoids certain health risks. Thus, these days gain lead to
improvement in welfare and well-being.
Discussion of active days in the context of well-being: The scope of improved efficiency
measures is quite big in European member states not only in terms of energy savings, but also
in terms of labour productivity improvement. For instance, in Hungary, 70% of the burden of
diseases due to indoor exposure can be caused due to outdoor pollutant exposure indoor
(Hänninen, and Asikainen 2013). Whereas in Germany 64% of the burden of due to indoor
exposure can be caused due to outdoor pollutant exposure indoor (Hänninen, and Asikainen
2013). Thus, installing improved energy efficiency measure in the building sector can save
many healthy life years by mitigating indoor pollutants concentration and preventing outdoor
pollutant infiltration inside. In this dissertation, although the HVAC system with an airtight
building envelope helps in reducing exposure induced diseases by avoiding outdoor exposure,
improved HVAC with an airtight building envelope does not directly mitigate outdoor
pollution. However, installing energy efficiency measures indirectly save a significant amount
of energy use which reduces the outdoor pollution concentration (Ürge-Vorsatz et al. 2007).
CE
UeT
DC
olle
ctio
n

202
How much outdoor pollutant can be reduced that is beyond the scope of this dissertation but
for future research endeavor, this topic should be explored in detail.
The results of active days gain by avoiding indoor exposure to pollutants may not be directly
compared with other studies as there are methodological and geographical gap across different
studies. For instance, Milton et al. 2000 study showed that proper rate of ventilation can save
up to 1.2 to 1.9 days annually which accumulates to around 35% savings of sick leaves.
However, this figure is only for office buildings in Massachusetts, USA, and this figure
considers only ventilation rate related absenteeism. Whereas, this dissertation concerns both
absenteeism and presenteeism resulting from indoor exposure at the national level.
Furthermore, Milton et al. 2000 study analysed the sick leave savings based on 1994 US sick
leave data which is different from what is used in this dissertation (compensated sick leave for
each country). However, for both Hungary and Germany, the active days gain from tertiary
building sector data are within the range of 1.0-2.5 days annual savings/per person which is
more or less similar to Milton et al. 2000 study. However, one point needs to be mentioned that
in this dissertation, active days incorporate both absenteeism and presenteeism whereas Milton
et al 2000 study considers only absenteeism. The difference could be due to different
geographical boundary and surely due to the difference in methodological approach. This
dissertation uses the time spent factor to distinguish between residential and tertiary building
effects. No literature is found on residential building-related per person active days gain. This
dissertation makes the first attempt to estimate the active days due to residential sector
renovation. Thus, to compare this dissertation‘s results on how many sick days can be saved,
more control group field study needs to be conducted in both tertiary as well as in the residential
building sector.
Apart from sick days, active days are also measured through DALY gain. Hänninen and
Asikainen 2013 study (from healthvent project) measures DALY due to indoor exposure as
CE
UeT
DC
olle
ctio
n

203
well. As per Hänninen and Asikainen 2013 study, Germany and Hungary can save 1920 and
3960 DALY/million population respectively which is really close to the result of this
dissertation. As per dissertation research, Germany and Hungary can save 1870 and 3849
DALY/ million population respectively. The figures may look quite close but actually, they are
not since this dissertation refers per capita population as the population who have shifted to
deep-retrofit type buildings. The difference between these two studies is due to the difference
in methodology. More precisely, Hänninen and Asikainen 2013 study uses a dose-response
model by assuming a certain percentage of the population exposed to the pollutants to calculate
the DALY. Whereas this dissertation uses population in 2030 living in the different type of
retrofitted buildings and then uses the reduction potential to the population. The reduction
percentage or the health gain is assumed to be obtained only for people living in deep- retrofit
type of buildings. Thus, normally, compared to whole population estimation, the population
living in deep-retrofit type buildings would give a small number. However, due to a more detail
scenario used in this dissertation compared to healthvent project, the contribution of this study
is still significant.
Therefore to conclude, the active days either through avoided sick days or healthy life years
gain, achieve a higher well-being by attaining both higher welfare and improved quality of life.
More work days are available by avoiding sick days. By working more days, one can earn more
and thus, achieve a higher welfare/economic well-being. Moreover, sick days avoidance is
resulted from avoiding a certain type of diseases which improves the overall state of health and
hence, quality of life improves.
Discussion of workforce performance in the context of well-being: As discussed in chapter
6, workforce performance improvement of a country mainly depends on how many people
have shifted to the deep retrofit type of tertiary buildings. Here one of the concerns could have
been the population factor. More precisely, the concern questions whether countries with
CE
UeT
DC
olle
ctio
n

204
higher population could have higher workforce performance gain since country-specific per
capita gain is not available. However, from the dissertation data, it can be seen that 7% of the
working population has shifted in the deep-retrofit type tertiary buildings in Germany and 6%
of the working population has shifted in Hungary. Thus, despite having a huge difference in
population between these two countries, the shift in population percentage is not relatively as
high as the difference in total population. Here, the point is that only population may not play
a crucial role but factors such as unemployment rate, retrofitting rate and overall growth of the
economy can influence the result of this dissertation model. Thus, these factors apart from
retrofit rate, are considered to be the same as 2015 for both of the countries.
Another key issue with the performance indicator is that it is not showing a significant amount-
meaning gaining per person 2.02 hours annually may not be considered as significant. However
if this dissertation shows that even with a small figure like 2.02 hours can prove to be a
significant gain country wise. There are a couple of challenges to find performance
enhancement indicators in this dissertation which are discussed below:
Performance enhancement value should only have resulted from improved mental
well-being. This figure should not consist of any effect due to presenteeism as it is
already considered in the model through avoided sick days. Thus, finding value only
due to improved mental well-being was not easy.
The value of performance enhancement factor also depends on the nature of the job
and since this dissertation is estimating performance at a national level, nature of the
job has to be mixed- meaning all repetitive and non-repetitive jobs need to be
considered. Otherwise, the results for this indicator could be biased. A detailed
explanation with sensitivity analysis is provided earlier in chapter 6, section 6.4.2.
CE
UeT
DC
olle
ctio
n

205
Considering these factors discussed above, no other studies could be found to compare this
dissertation results. However, there is Wargocki et al 2000 study which showed a 1.4%
increase in the work performance after shifting into a good retrofitted building. Thus,
considering this result, a sensitivity analysis is conducted in chapter 6. The importance of
the performance improvement indicator is crucial because it indicates that mental well-
being is correlated with work performance and despite being physically fit, a poor mental
well-being can cause lower performance. This study refers mental well-being
improvement resulted from improved indoor air quality and building condition. Thus,
improved mental well-being by improving building conditions can certainly improve the
mental health and hence the quality of life.
Discussion of time saved from congestion in the context of well-being: Active time gain
from congestion mainly depends on three factors:
1. Number of car users in peak hours
2. Number of people (in percentage) opting for modal shift towards active transportation
3. Time spent in traffic during peak hours
From the above mentioned three factors, number of car users and time spent in traffic are
positively correlated i.e. if one of these goes up the other factor also moves in the same
direction. Thus, the deciding factor of active time gain here is the number of people opting for
the modal shift towards active transportation. In other words, modal shift percentage is the key
deciding factor of active time gain. Thus, Hungary having 3.9% of modal shift rate towards
active transportation achieves 11% reduction in congestion time during peak hours, while
Germany having 2.7% of modal shift rate towards active transportation achieves 6% reduction
in congestion time during peak hours. Therefore, this dissertation confirms the previous
literature conclusion (see (Buis, and Wittink 2000; De Hartog et al. 2010) that a modal shift
towards active transportation can reduce congestion significantly.
CE
UeT
DC
olle
ctio
n

206
Time saved from congestion in this study only measures the time gain from peak hour’s
congestion. The car users’ data is also for peak hours only. Active time only shows the savings
from peak hours traffic time. However, the total time spent in transportation may remain the
same over the year. One of the key reasons behind this could be the stability of annual travel
time. More precisely, studies show that the time used in transportation is more or less stable
per person (Petersen et al. 2009; Fleischer, and Tir 2016). One of the possible reasons behind
this phenomenon is that people travel to a long destination for vacation, leisure etc. and thus,
saved time from daily commute may not be spent in transport only (Fleischer and Tir 2016).
Thus, it is important to note that this dissertation’s intention is not to provide a magnitude on
how much total travel time can be saved annually, rather it provides a magnitude of how much
time spent in congestion can be saved during peak hours of traffic due to modal shift towards
active transportation. Time-saving from congestion does not only result in less travel time and
hence, more time for work/leisure, but it also reduces the disutility out of displeasure of being
stuck in traffic. These saved time and reduced disutility improves the overall well-being of a
person.
Modal shift towards active transportation has certain health effects as discussed in chapter 3.
By using equations 14 and 15, the health effects of the modal shift towards active transportation
can be measured. To measure the avoided sick days and healthy life years gain due to modal
shift towards active transportation, the following data are required:
1. Country and disease-specific values of conversion factor which show the health gain
factor by being physically active and by avoiding outdoor pollution for different
diseases. This conversion factor of disease specific health gain should reflect both
positive and negative health effects as discussed in chapter 3.
2. Number of people who have opted for modal shift towards active transportation. More
precisely, country-specific modal shift percentage.
CE
UeT
DC
olle
ctio
n

207
3. Age distribution of people who have opted for the modal shift in order to calculate the
risk of accidents.
4. Disease-specific DALY, absenteeism and presenteeism data which are caused due to
outdoor exposure.
The absenteeism and presenteeism data can still be calculated, but the other two data points i.e.
the value of disease-specific conversion factor and age distribution of the people who have
opted for the modal shift could not be found because the conversion factors need to be linked
with the rate of modal shift. Since the value of conversion factors is not available, this
dissertation would not be able to measure the health aspect of active transportation. However,
in future, if the conversion factor data and age distribution data can be found, the health effects
of active transportation can be measured easily by using the proposed equations. The health
effects have a direct link with both the components of well-being. More precisely, if the net
health condition improves then a person would be more productive and hence, achieve a higher
welfare and, also health improvement further leads to achieving a higher quality of life
(Lequiller and Blades 2014). The productivity aspect of modal shift has not been discussed in
any other study this comprehensively yet. Thus, this dissertation starts this discussion on
productivity aspects due to the modal shift towards active transportation by defining all the
relevant aspects of labour productivity.
Discussion of earning ability in the context of well-being: Earning ability indicator can be
measured by using equations 17 and 18 as discussed in chapter 4. However, in order to estimate
earning ability, the following data are required:
1. Data on disease-specific school days loss for each member states
2. The value of SL i.e. percentage value of skill loss due to being absent from school in a
year,
3. Country-specific average future income,
CE
UeT
DC
olle
ctio
n

208
4. Value of health gain factor (CFvi) after retrofitting home /school
Since these data are not readily available, the earning ability indicator cannot be estimated. In
order to estimate the earning ability gain, an econometric modelling needs to be used to
determine the value of SL. Thus, for future research purpose, calculating earning ability can be
a really good option. Although earning ability indicator could not be measured due to data and
methodological constraints, the significance of earning ability is not less compared to the other
indicators of productivity. To explain it further, one of the components of earning ability is the
loss of future income opportunity of children due to illness. Any kind of health risk to children
should be avoided not only because of there is an ethical side attached to it, but in addition,
school days missed due to sickness also results in loss of human capital (Sachs and Malaney
2002). Thus, apart from improving quality of life, another aspect of accumulating human
capital is attached to children’s school days loss due to BRI. Moreover, by saving parent’s
absenteeism and presenteeism due to child care, acts similarly like active days achieving a
higher well-being.
Further steps towards cost-benefit analysis (CBA): Now since productivity impact is
quantified, the value of productivity can be incorporated into CBA. However, in order to
conduct a CBA, the investment costs along with other values of impacts are required.
Otherwise, the energy improvement measure would be undervalued. Thus, in order to evaluate
an energy efficiency measure, other impacts resulting from it, need to be rigorously quantified
as well and then only it can be incorporated into CBA. Partial analysis such as only
incorporating productivity impact along with the investment cost i.e. cost for implementing the
improved energy efficiency measure would not evaluate the full potential of the measure.
While conducting a CBA, one needs to be very careful with the time period analysis. For
example, if this dissertation results are incorporated into a CBA then, the cost of
implementation of energy efficiency measure should be annual i.e. in a year as the benefits in
CE
UeT
DC
olle
ctio
n

209
this study is for a year. Otherwise, the comparison between cost and benefits would not fair.
Another option would be to multiply the benefits with lifetime of the technology in order to
have a valid comparison, For instance, the energy efficiency measures of the building sector
has a life time of 25-30, then benefits from this study should be multiplied by life time of the
energy efficiency measure in order to have a valid comparison.
7.3 Discussion on data and methodological challenges:
Like every quantitative study, this dissertation also has certain methodological limitations
which are discussed in detail in chapter 5. As discussed in the methodological framework, the
quantification of impacts needs to conducted in a careful and rigorous manner to avoid any
kind of biases (i.e. incorporate both positive and negative impacts). However, the rigorous
evaluation of impact is quite data intensive. In some cases, due to data unavailability, the impact
cannot get quantified (e.g earning ability). On the contrary, in some cases, proxy data are used
to calculate the impacts. For instance, in order to calculate avoided sick days, country-specific
absenteeism data are taken from OECD portal named compensated sick leaves which actually
underestimates the total sick leave taken. Another sick leave data is available at OECD portal
named self-reported sick leaves. Theoretically, self-reported sick leave data should have been
higher than compensated sick leave but this is not the case for Hungary. For Germany, self-
reported sick leave data is not even available at the portal. Furthermore, in the year 2003, the
annual per capita self-reported sick leaves for Hungary were 9.5 days and suddenly in 2009
they went down to 5.5 days and in 2014 they further went down to 3.2 days (OECD dataset of
compensated sick leaves). The years in between 2003,2009 and 2014 data are missing. This
kind of sudden drop in per-capita sick leave is suspicious and no significant rationale can be
found to justify this sudden drop. Hence, self-reported sick leave data carries a bit of suspicion.
Thus, to be on a safe side, compensated sick leave data is taken as a proxy data for actual sick
leave taken which would be much higher because not all the sick leaves are compensated.
CE
UeT
DC
olle
ctio
n

210
Similarly, proxy data are used for monetization techniques. Thus, by using proxy data where
‘real data‘ is unavailable, the science of multiple impact evaluation develops significantly
further.
For methodological challenges as discussed in chapter 4, section 4.3, this dissertation
methodology deals with these challenges (baseline, context, and distributional impact) to
quantify productivity impacts rigorously. In the section below a few examples of the solutions
are discussed:
Context Dependency: Context can be referred to as some variables which provide a
background for a particular policy or action, also influence the outcome of the policy or action
(Urge-Vorstaz et al. 2016). Context dependencies usually include broader socio-economic
settings such as cultural and behavioural attributes, environmental conditions, market
conditions and much more. Since the focus of this dissertation is on actions rather than on
policies, the wider policy context dependencies are out of the scope. For productivity research,
we have identified the following context dependencies:
1. Road congestion is context dependent. More precisely, road congestion is a typical
urban problem and in this dissertation, productivity impacts are estimated at a national
level. Many of the countries do not have congestion. In productivity research, the
country-specific road congestion data (congestion data is extracted from INRIX
scorecard) is calculated from city level road congestion.
2. Outdoor air pollution level across countries causes several diseases such as
cardiovascular diseases and cancer. These outdoor pollutants infiltrate indoor and hence
countries with higher outdoor pollution would have more such diseases such as cancer
or cardiovascular disease. That is why there is a strong need for filtration. For
CE
UeT
DC
olle
ctio
n

211
productivity research, the data used in this study is from the healthvent project has
already incorporated these outdoor pollutant factors.
Definition of system boundaries and distributional aspects: In any quantification method,
it is a big challenge to find the appropriate system boundaries and to tackle the spill over effect
because the evaluation of impacts depends on the scale and unit of analysis. For instance, to
measure productivity impacts, it is important to know whether the productivity varies from
rural to urban or whether some of the productivity impacts go beyond country boundaries. Also,
the additional income due to productivity improvement would vary across different income
groups.
However, due to data and resource constraints, distributional effects cannot be quantified.
Productivity gain by shifting into deep retrofit type buildings can gain more work days and can
save money from spending in medical expenditure. These savings utility would be different
across different income groups because people in lower income group have a higher marginal
utility of income. In other words, the utility of one additional income is more in lower income
group compared to the higher income group. In order to estimate productivity impact at lower
income group, we would need the following data:
1. How many people in the lower income group are shifting to deep retrofit type buildings
(both residential and tertiary buildings)?
2. What are the different income levels and elasticities across different income groups?
If these above-mentioned data are available then in future it is possible to run a scenario
analysis model to estimate the distributional impact.
Baseline: As it is discussed in chapter 4, selecting a dynamic baseline is really crucial for
impact quantification. This dissertation uses project COMBI scenarios to evaluate impact and
COMBI uses a detailed bottom-up stock model to calculate the reference scenario and
CE
UeT
DC
olle
ctio
n

212
efficiency scenario. COMBI uses this stock model by extrapolations of past developments and
accounting for current policies (reference/baseline) and additional policies (efficiency)
scenario (Chatterjee et al. 2018). Thus, it is safe to say that COMBI uses a dynamic baseline
that incorporates existing EU policies. This also implies that substantial energy efficiency
improvements are already incorporated in the baseline (Chatterjee et al. 2018).
7.4 Policy relevance
The main aim of this dissertation is to provide a methodology by using which multiple impacts
can be quantified and hence can be taken into account in policy evaluation. The main purpose
of this study is not to recommend any policy directly but rather to provide an idea about the
magnitude of multiple impacts of improved energy efficiency measures. However, this study
shows the importance of multiple impacts by taking productivity impact as an example and
while doing so, this study also indicates the potentiality of any sustainable energy policy. The
evaluation of any sustainable energy policy would be an under estimation without their
impacts. For instance, the results of this dissertation show the significance of productivity
impact and incorporating productivity impact into any decision-making analysis such as cost-
benefit analysis or cost-effectiveness analysis or multi-criteria analysis would change the
importance of energy policy. The common goal of any sustainable energy policy is to reduce
the energy use and it has been the entry point for any policymaker. However, this study shows
that even only the impacts can be an entry point for any policymaker to design a sustainable
energy policy. In other words, sustainable energy policies are a well-fit in the European
commission’s multi-framework policy goal by considering all the impacts of the policies. By
using this dissertation’s proposed methodology, a policymaker can be able to quantify all the
additional effects of a sustainable energy policy and incorporate them in a decision making the
analysis. This would certainly change the evaluation overview of any sustainable energy
policy. The evidence of this dissertation translates into a series of recommendations:
CE
UeT
DC
olle
ctio
n

213
1. Existing sustainable energy policies and measures should be reassessed by
incorporating all the additional effects especially productivity-related effects of any
low-carbon techniques. Then a proper cost-benefit analysis could be done which would
not underestimate the potentiality of the energy policy.
2. By seeing only the productivity values for both Hungary and Germany, it can be
recommended to have more deep energy efficiency programs (like efficient scenario).
Deep energy efficiency scenario results in reduction of the burden of diseases which
has an ethical side attached to it since it is also related to health. More precisely, years
of healthy life can be saved by opting for deep energy efficiency programs and health
is a priority for every government.
3. In order to reduce the productivity loss results from presenteeism, the social leave
policy for Hungary needs to be improved. Hungary can follow the social leave policy
framework of Germany. The presenteeism days are not reported hence, the employer
does not know how much work hours is actually lost. One possible example could be
the actual work hours data for Germany and Hungary. As discussed in chapter 6, the
annual work hours reported data per worker is less in Germany compared to Hungary.
However, the per capita gross domestic product (GDP) in purchasing power standard
is higher in Germany compared to Hungary (Eurostat data 2017).One possible reason
behind having high work hours and still low per capita GDP could be presenteeism.
Thus, a detailed study on country-specific presenteeism days should be conducted to
understand the magnitude of presenteeism and hence productivity loss, which in turn
would help the government to formulate an improved social policy.
4. As it is discussed during explaining distributional effects, the lower income group is
also exposed to negative health effects from the buildings (due to the poor condition of
buildings) and thus, having a deep energy efficiency measure can avoid such risk. The
CE
UeT
DC
olle
ctio
n

214
gain of energy efficiency measure would be more among the lower income group due
to the higher marginal utility of income among lower income group. However, the
implementation cost of such energy efficiency measure in lower income group could
be a barrier and thus, some welfare schemes are needed to uplift their living condition.
5. Adequate data and resources are required to quantify the net health impact of modal
shift. Also, from the discussion of modal shift, it can also be said that policies promoting
active transportation should be aggregative because the lower rate of active
transportation may result in some negative health impact. The effect of modal shift
towards active transportation on congestion time is quite significant, thus, for future
research, the net health impact of active transportation needs to be calculated to get the
complete picture.
7.5 Original contribution:
This dissertation has produced the following original contributions in the research field of co-
benefit/multiple impacts of climate change mitigation policies:
In terms of evaluation methodology of multiple impacts, this dissertation offers:
A systematic methodological framework which enables the causal relationship of
different impacts leading towards productivity and by seeing the nature of the
interaction, different aspects of labour productivity are defined.
A set of indicators to measure labour productivity of improved energy efficiency
measures. These indicators include several aspects such as presenteeism, future earning
ability as well as time saved from road congestion which have not been incorporated
before in any study in this comprehensive manner to measure the effect of an energy
efficiency measure.
CE
UeT
DC
olle
ctio
n

215
Precise equations of productivity indicators fill-up the gap related to productivity of
energy efficiency measure. Also, these equations advance the methodological
knowledge of multiple impacts.
Challenges-related to methodology such as double counting, additionality, scale,
distributional effect are identified and solution or a set of solutions are proposed with
the help of productivity impact to tackles these challenges.
In terms of geographical coverage, this dissertation contributes:
So far no study has measured labour productivity impact of energy efficiency
measures at national level this comprehensively. This dissertation measures
different aspects of productivity for two specific European countries i.e. Hungary
and Germany.
An assessment behind this potentiality is given for both of these countries.
In terms of current knowledge and concept about multiple impacts and energy efficiency
measures, it offers:
Providing a comprehensive understanding of the role of energy efficiency measures,
specifically the role of air tightness and ventilation in building sector and the role of
active transportation in transport sector.
The first ever evidence provided of labour productivity impacts at national level with a
detailed assessment which shows the significance of energy efficiency measures.
However, the scale/intensity of the measures may vary between these two countries.
Nevertheless this dissertation shows a positive magnitude of productivity impacts.
A concrete theoretical basis is described for the methodology as well as the
productivity. In other words, this dissertation paints a broader picture with its
theoretical background for the policy makers.
CE
UeT
DC
olle
ctio
n

216
7.6 Future research avenues:
There are few aspects of this topic which cannot be studied in this dissertation due to resource
constraints. These aspects can be divided into two broad categories: 1) Theoretical future
research avenues, and 2) Methodological future research avenues. In the section below each of
these categories is mentioned regarding potential future research on a priority basis:
1) Theoretical future research avenues:
Labour productivity improves welfare and well-being. However, for future
research, more details of ethics, economic well-being, welfare and productivity
should be explored.
More epidemic case studies are required to understand the relationship between
indoor exposure and health in non-European as well as European countries so that
it can be compared and well understood in details.
Most of the results of this dissertation are based on single study data. Although this
study does a sensitivity analysis, but more studies on quantification of productivity
impact should be done in order to compare the results of different studies.
2) Methodological future research avenues:
A countrywide workplace/household survey is required to understand the extent of
presenteeism. This survey should also classify the different types of retrofitted
buildings. Survey on presenteeism could fill in the data gap which further enables the
potential of building related energy efficiency measures.
This dissertation defines workforce performance quite extensively but due to data
unavailability of performance enhancement factor, this dissertation uses a proxy value
for this factor. Thus, a control group survey is required to measure at least the self-
perceived performance improvement in terms of quantity of work.
CE
UeT
DC
olle
ctio
n

217
The intensity of indoor exposure on the children would be much more intense.
However, since children’s sick leave data are unavailable, this dissertation could not
measure the earning ability aspect. Thus, a thorough survey on effect of indoor
exposure on children needs to be conducted. On the other hand, country-wise
econometric modelling study needs to be conducted to understand the effect of
children’s future income who are losing school days due to building-related illness.
Active transportation can avoid a certain amount of outdoor exposure. However, there
is no disease specific case study available which quantifies the net health impact (more
precisely, how many sick days can be saved due to modal shift towards active
transportation) in different scenarios. Thus, few disease specific case studies need to
be conducted to contribute to the knowledge gap.
CE
UeT
DC
olle
ctio
n

218
Conclusion:
The multiple impacts are often not considered in the policy evaluation due to the lack of mature
quantification methodology, but this lack of methodology to quantify the impacts does not
make them any less significant. Climate change policies do not only mitigate climate change
but with the wide range of multiple impacts, it benefits the society and economy as well.
Multiple impacts especially productivity impact of climate change policies can achieve a higher
well-being by improving the standard of living and quality of life. Thus, climate change
policies can fit in well in the multi-objective policy framework by mitigating climate change
as well as by improving well-being.
Climate change policies such as sustainable energy policies can result in significant
productivity improvement. A rigorous quantification of productivity impact can show the
potential of sustainable energy policy. This dissertation’s aim is to provide better methods to
quantify multiple impacts rigorously. However, for a rigorous quantifying purpose, the
pathway from a policy to its productivity impact needs to be understood with all the
interactions. A detailed identification of impact resulting from the policy is the first step
towards quantification. The different aspects of productivity have several stages and in order
to understand and define them accurately, there is a need to understand the different aspects of
productivity resulting from sustainable policy implementation. The quantification process
consists of further methodological challenges such as additionality, baseline, context
dependency and distributional effects. These challenges are important to be taken into account
during an impact evaluation if not quantitatively then at least qualitatively.
This dissertation shows that the productivity impacts is a significant impact of energy
efficiency measures. For instance, in Hungary and Germany, 3.21 and 7.7 days/person, year
respectively can be gained by having more deep-retrofit type residential and tertiary buildings
CE
UeT
DC
olle
ctio
n

219
such as deep retrofitted buildings, passive houses, and nearly zero energy buildings. In addition,
by improving the mental well-being Germany and Hungary can gain around 85 million
euro/year and 1.8 million euro/year respectively. Moreover, 1870 and 3849 healthy life
years/per million population can be gained/year in Germany and Hungary respectively by
avoiding indoor exposure to pollutants. Last but not the least, this study also shows that by
opting for modal shift, Germany and Hungary can gain 2.5 and 0.5 hours respectively from
avoiding traffic congestion in a year. Therefore, this dissertation has concluded that labour
productivity is economically and since, health is an input factor to productivity, it is also an
ethically important impact to consider. The value of productivity impact would be greater if
the sustainable policies are much more ambitious.
This dissertation contributes to the knowledge gap by defining productivity beyond work
performance and hence by estimating productivity in a comprehensive way. This quantification
of productivity impact would not only help the policymaker to include productivity in the
decision making analysis while evaluating a policy, but also the quantification of productivity
impact is so significant that it would provide an entry point apart from energy savings for the
policymaker to design a sustainable energy policy. Moreover, while developing the
methodological framework, this dissertation identifies several data and methods-related
limitations which can be used as a future research agenda. However, even with the limitations
of this methodological framework, the science of multiple impacts quantification progresses
by identifying the data and method-related gaps. In regard to the quantification methodology,
this dissertation has recommended that more impact specific studies should be conducted and
keeping in mind the data-intensiveness of these kinds of methods, more case studies should be
conducted.
Overall this dissertation concludes that all possible impacts of climate change policies should
be quantified rigorously and should get incorporated in the policy decision making analysis in
CE
UeT
DC
olle
ctio
n

220
to order to analyse the potential of the policy accurately. The rigorous quantification of impacts
is necessary in order to conclude the importance of the impact. Despite, the data and
methodological issues, we have an improved methodological framework proposed by this
dissertation which can quantify impacts. The limitations along with data gaps can be explored
further as future research avenues.
CE
UeT
DC
olle
ctio
n

221
References Abbott, M., & Ashenfelter, O. 1976. “Labour Supply, Commodity Demand and the Allocation of
Time.” The Review of Economic Studies 43 (3): 389–411.
Ackerman, F., & Heinzerling, L. 2002. “Pricing the Priceless: Cost-Benefit Analysis of Environmental Protection.” University of Pennsylvania Law Review 150 (5): 1553–84.
ACP. 2016. “Putting Co-Beneϔits into Practice: Case Studies from Asia.”
Aftabuzzaman, M. 2007. “Measuring Traffic Congestion-A Critical Review.”
Agency, International Energy. 2017. “Energy Efficiency 2017.” doi:10.1787/9789264284234-en.
Aguirre, A., & Foret, J. 1994. “Irregularity of Working Hours in Railway Workers and Types of Complaints.” International Archives of Occupational and Environmental Health, 367–371.
Akimoto, T., Tanabe, S. I., Yanai, T., & Sasaki, M. 2010. “Thermal Comfort and Productivity-Evaluation of Workplace Environment in a Task Conditioned Office.” Building and Environment 45 (1): 45–50.
Al-Darrab, I. 2000. “Relationships between Productivity, Efficiency, Utilisation, and Quality.” Work Study 49 (3): 97–103.
Alexopoulos, E. C., and A. & Burdorf. 2001. “Prognostic Factors for Respiratory Sickness Absence and Return to Work among Blue Collar Workers and Office Personnel.” Occupational and Environmental Medicine 58 (4): 246–52.
Ambrus Kiss, Pál Belyó, Annamária Kunert, Máté Komiljovics and Károly György. 2017. “Living and Working in Hungary.” https://www.eurofound.europa.eu/printpdf/country/hungary?section=2.
Anable, J. 2005. “Complacent Car Addicts’ or ‘Aspiring Environmentalists’? Identifying Travel Behaviour Segments Using Attitude Theory.” Transport Policy 12 (1): 65–78.
Apte, M. G., Fisk, W. J., & Daisey, J. M. 2000. “Associations Between Indoor CO 2 Concentrations and Sick Building Syndrome Symptoms in U. S. Office Buildings: An Analysis of the 1994-1996 BASE Study Data.” Indoor Air 10 (4): 246–57.
Architecture lab. 2014. “The Design Process: Residential vs. Commercial. 29 June.”
Arnetz, B. B., Sjögren, B., Rydéhn, B., & Meisel, R. 2003. “Early Workplace Intervention for Employees with Musculoskeletal-Related Absenteeism: A Prospective Controlled Intervention Study.” Journal of Occupational and Environmental Medicine 45 (5): 499–506.
Aronsson, G., & & Gustafsson, K. 2005. “Sickness Presenteeism: Prevalence, Attendance-Pressure Factors, and an Outline of a Model for Research.” Journal of Occupational and Environmental Medicine 47 (9): 958–966.
Asif, M., & Muneer, T. 2007. “Energy Supply, Its Demand and Security Issues for Developed and Emerging Economies.” Renewable and Sustainable Energy Reviews 11 (7): 1388–1413.
Asikainen, A., Carrer, P., Kephalopoulos, S., Fernandes, E. d., Wargocki, P., & Hänninen, O. 2016. “Reducing Burden of Disease from Residential Indoor Air Exposures in Europe (HEALTHVENT Project).” Environmental Health 15.
Association., American Psychiatric. 2013. “Diagnostic and Statistical Manual of Mental Disorders. 5th Ed. Arlington.”
CE
UeT
DC
olle
ctio
n
222
Atkinson, Robert. 2013. “Competitiveness,Innovation and Productivity.”
Atthajariyakul, S., and T. & Leephakpreeda. 2004. “Real-Time Determination of Optimal Indoor-Air Condition for Thermal Comfort, Air Quality and Efficient Energy Usage.” Energy and Buildings 36 (7): 720–33.
Audenaert, A., S. H. De Cleyn, and B. & Vankerckhove. 2008. “Economic Analysis of Passive Houses and Low-Energy Houses Compared with Standard Houses.” Energy Policy 36 (1): 47–55.
Aunan, K., A. Aaheim, and H. M. Seip. 2000. “Reduced Damage to Health and Environment from Energy Saving in Hungary.” Ancillary Benefits and Costs of Greenhouse Gas Mitigation. doi:10.1787/9789264188129-en.
Aune, D., Greenwood, D. C., Chan, D. S. M., Vieira, R., Vieira, A. R., Navarro Rosenblatt, D. A., ... & Norat, T. 2011. “Body Mass Index, Abdominal Fatness and Pancreatic Cancer Risk: A Systematic Review and Non-Linear Dose–response Meta-Analysis of Prospective Studies.” Annals of Oncology 23 (4): 843–52.
Bamberg, S., and P. Schmidt. 2003. “Incentives, Morality, or Habit? Predicting Students’ Car Use for University Routes with the Models of Ajzen, Schwartz, and Triandis.” Environment and Behavior 35 (2): 264–85.
Barth, Matthew, and Kanok Boriboonsomsin. 2009. “Traffic Congestion and Greenhouse Gases.” Access Magazine.
Bassett, D. R., J. Pucher Jr, R. Buehler, D. L. Thompson, and S. E. & Crouter. 2008. “Walking, Cycling, and Obesity Rates in Europe, North America, and Australia.” Journal of Physical Activity and Health 5 (6): 795–814.
Bergh, C. v. 2004. “Optimal Climate Policy Is a Utopia: From Quantitative to Qualitative Cost-Benefit Analysis.” Ecological Economics 48 (4): 385 – 393.
Bloom, David, David Canning, and Jaypee Sevilla. 2001. “THE EFFECT OF HEALTH ON ECONOMIC GROWTH: THEORY AND EVIDENCE.” NATIONAL BUREAU OF ECONOMIC RESEARCH.
Boffetta, P. 2006. “Human Cancer from Environmental Pollutants: The Epidemiological Evidence.” Mutation Research/Genetic Toxicology and Environmental Mutagenesis 608 (2): 157–62.
Böhringer, C., & Rutherford, T. F. 2008. “Combining Bottom-up and Top-Down.” Energy Economics 30 (2): 574–96.
Boles, M., Pelletier, B., & Lynch, W. 2004. “The Relationship between Health Risks and Work Productivity.” Journal of Occupational and Environmental Medicine 46 (7): 737–45.
Bolla, R., R. Bruschi, F. Davoli, and F. & Cucchietti. 2011. “Energy Efficiency in the Future Internet: A Survey of Existing Approaches and Trends in Energy-Aware Fixed Network Infrastructures.” IEEE Communications Surveys & Tutorials 13 (2): 223–44.
Bond, L., Kearns, A., Mason, P., Tannahill, C., Egan, M., & & Whitely, E. 2012. “Exploring the Relationships between Housing, Neighbourhoods and Mental Wellbeing for Residents of Deprived Areas.” BMC Public Health 12 (1): 48.
Boneta, M.F. 2014. “Database of EE and RES Technologies: Energy/Cost Matrices.”
Bonetta, S., Bonetta, ·. S., Mosso, S., Sampò, S., & Carraro, ·. E. 2010. “Assessment of Microbiological Indoor Air Quality in an Italian Office Building Equipped with an HVAC System.” Environmental Monitoring and Assessment 161 (1–4): 473–83.
CE
UeT
DC
olle
ctio
n

223
Bovy, P.H.L., and I. Salomon. 2002. “Congestion in Europe: Measurements, Patterns and Policies, in E. Stern, I. Salomon and P.H.L. Bovy (Eds.), . Travel Behaviour: Spatial Patterns, Congestion and Modelling, Cheltenham: Edward Elgar.”
Bowman, J. S, and R. L. Williams. 2004. “Productivity and Ethic.”
Boyd, G. A., & Joseph X., P. 2000. “Estimating the Linkage between Energy Efficiency and Productivity.” Energy Policy 28 (5): 289–96.
BPIE. 2011. “Principles for Nearly Zero-Energy Buildings.”
Brasche, S., and W. & Bischof. 2005. “Daily time spent indoors in German homes–baseline data for
the assessment of indoor exposure of German occupants.” International journal of hygiene
and environmental health 2008 (4): 247-253.
Brismar, A. 2004. “Attention to Impact Pathways in EISs of Large Dam Projects.” Environ Impact Assess Rev 24: 59–87. doi:10.1016/S0195-9255(03)00162-8.
Brook, Robert D., Sanjay Rajagopalan, C. Arden Pope, Jeffrey R. Brook, Aruni Bhatnagar, Ana V. Diez-Roux, and Fernando Holguin et al. 2010. “Particulate Matter Air Pollution and Cardiovascular Disease an Update to the Scientific Statement from the American Heart Association.” Circulation 121 (21): 2331–78.
Brook, R. D. 2004. “Air Pollution and Cardiovascular Disease A Statement for Healthcare Professionals from the Expert Panel on Population and Prevention Science of the American Heart Association.” Circulation 109 (21): 2655–71.
Brunekreef, B., & Holgate., S. T. 2002. “Air Pollution and Health.” The Lancet 360 (9341): 1233–42.
Buis, J., & Wittink, a. R. 2000. “The Economic Significance of Cycling." A Study to Illustrate the Costs and Benefits of Cycling Policy.”
Burge, P. S. 2004. “Sick Building Syndrome.” Occupational and Environmental Medicine 61 (2): 185–90.
Caroli, E., N. Greenan, and D. & Guellec. 2001. “Organizational Change and Skill Accumulation.” Industrial and Corporate Change, 481–506.
Caverley, N., Cunningham, J. B., & MacGregor, J. N. 2007. “Sickness Presenteeism, Sickness Absenteeism, and Health Following Restructuring in a Public Service Organization.” Journal of Management Studies 44 (2): 304–19.
Cavill, N., Kahlmeier, S., Rutter, H., Racioppi, F.,& Oja, P. 2008. “Economic Analyses of Transport Infrastructure and Policies Including Health Effects Related to Cycling and Walking: A Systematic Review.” Transport Policy 15 (5): 291–304.
Chapman, L. 2007. “Transport and Climate Change: A Review.” Journal of Transport Geography (Journal of Transport Geography) 15 (5): 354–67.
Chapman, R, P Howden-Chapman, H Viggers, D O’Dea, and M Kennedy. 2009. “Retrofitting Houses with Insulation: A Cost-Benefit Analysis of a Randomised Community Trial.” Journal of Epidemiology and Community Health 63 (4): 271–77. doi:10.1136/jech.2007.070037.
Chatterjee, Souran; Diana Ürge-Vorsatz;Johannes Thema;Ágnes Kelemen. 2018. “Synthesis Methodology-D2.4.”
Chatterjee, Souran;Diana Ürge-Vorsatz. 2017. “Productivity Impact from Multiple Impact Perspective.” In ECEEE SUMMER STUDY PROCEEDINGS, 1841–48.
CE
UeT
DC
olle
ctio
n

224
Chatterjee, Souran;Diana Ürge-Vorsatz. 2018. “Quantification of Productivity Impacts-D5.4a Final Report,COMBI Project.”
Chidiac, S. E., E. J. C. Catania, E. Morofsky, and S. & Foo. 2011. “Effectiveness of Single and Multiple Energy Retrofit Measures on the Energy Consumption of Office Buildings.” Energy 36 (8): 5037–52.
Chwieduk, D. 2003. “Towards Sustainable-Energy Buildings.” Applied Energy 76 (1): 211–17.
Clinch, J.P., and J. D. Healy. 2001. “Cost-Benefit Analysis of Domestic Energy Efficiency.” Energy Policy 29 (2): 113–24. doi:10.1016/S0301-4215(00)00110-5.
COMBI. 2018. “Overview of COMBI Scenarios and How They Were Constructed.”
Cools, M., Moons, E., Janssens, B., & & Wets, G. 2009. “Shifting towards Environment-Friendly Modes: Profiling Travelers Using Q-Methodology.” Transportation 36 (4): 437–53.
Cornia, Giovanni Andrea, Stefano Rosignoli, and Luca Tiberti. 2008. WIDER Research Paper 2008/74 Globalization and Health: Impact Pathways and Recent Evidence.
Couder, J. 2015. “Description of End-Use Energy Efficiency Improvement Actions in the Residential, Tertiary, Transport and Industry Sectors. COMBI.”
Couder, Johan. 2015. “Description of End-Use Energy Efficiency Improvement Actions in the Residential, Tertiary, Transport and Industry Sectors. COMBI.”
Crook, B., & Burton, N. C. 2010. “Indoor Moulds, Sick Building Syndrome and Building Related Illness.” Fungal Biology Reviews 24 (3): 106–13.
Cuenot, F., Fulton, L., & & Staub, J. 2012. “The Prospect for Modal Shifts in Passenger Transport Worldwide and Impacts on Energy Use and CO 2.” Energy Policy 41: 98–106.
Dasgupta, P., and M. & Weale. 1992. “On Measuring the Quality of Life.” World Development 20 (1): 119–31.
Davis, S. J., Caldeira, K., & Matthews, H. D. 2010. “Future CO2 Emissions and Climate Change from Existing Energy Infrastructure.” Science 329 (5997): 1330–33.
Davis, D. L., A. Krupnick, and G. McGlynn. 2000. “Ancillary Benefits and Costs of Greenhouse Gas Mitigation. An Overview.” Ancillary Benefits and Costs of Greenhouse Gas Mitigation. Proceedings of an IPCC Co-Sponsored Workshop. OECD, 2000., 397–412. doi:10.1787/9789264188129-en.
de Beer, L. T. 2014. “The Effect of Presenteeism-Related Health Conditions on Employee Work Engagement Levels: A Comparison between Groups.” SA Journal of Human Resource Management 12 (1): 8.
De Hartog, J. J., Boogaard, H., Nijland, H., & & Hoek, G. 2010. “Do the Health Benefits of Cycling Outweigh the Risks?” Environmental Health Perspectives, 1109–16.
de Hartog, Jeroen Johan, Hanna Boogaard, Hans Nijland, and Gerard Hoek. 2010. “Do the Health Benefits of Cycling Outweigh the Risks?” Environmental Health Perspectives 118 (8): 1109–16. doi:10.1289/ehp.0901747.
Dew, K., V. Keefe, and K Small. 2005. “Choosing’to Work When Sick: Workplace Presenteeism.” Social Science & Medicine 60 (10): 2273–82.
DIRECTIVE, EU. 2010. “DIRECTIVE 2010/31/EU OF THE EUROPEAN PARLIAMENT AND OF THE COUNCIL on the Energy Performance of Buildings(Recast).”
CE
UeT
DC
olle
ctio
n

225
Dodgson, J. S., Spackman, M., Pearman, A., & Phillips, L. D. 2009. “Multi-Criteria Analysis: A Manual.”
Doll, C. N., & de Oliveira, J. A. P. 2017. “Climate Co-Benefits in Urban Areas.” In Urbanization and Climate Co-Benefits.Routledge, 1–23.
Doyoon, Kim. 2010. “Optimizing Cost Effective Energy Conservation Measures for Building Envelope.” Energy Engineering 107 (3): 70–80.
Ekins, P, F Kesicki, and Z P Smith. 2011. “Marginal Abatement Cost Curves: A Call for Caution.” London.
Elvik, Rune. 2009. “The Non-Linearity of Risk and the Promotion of Environmentally Sustainable Transport.” Accident Analysis and Prevention 41 (4): 849–55. doi:10.1016/j.aap.2009.04.009.
Emberson, L., K. He, Rockström J., Amann M., Barron J., Corell R, Feresu S, et al. 2012. “Chapter 3 - Energy and Environment. In Global Energy Assessment - Toward a Sustainable Future.”
EPA. 2014. “Greenhouse Gas Emissions from a Typical Passenger Vehicle.”
EPA. 2015. “Implementation of the 2015 Primary Ozone NAAQS: Issues Associated with Background Ozone.”
Eskom. 2015. “Heating, Ventilation and Air Conditioning (HVAC) Systems: Energy-Efficient Usage and Technologies.”
European Comission. 2016. “The Implementation of the 2011 White Paper on Transport ‘Roadmap to a Single European Transport Area – towards a Competitive and Resource-Efficient Transport System’ Five Years after Its Publication: Achievements and Challenges.” Brussels.
European Commission. 1995. “E. ExternE: Externalities of Energy. Vol. 2: Methodology. Method for Estimation of Physical Impacts and Monetary Valuation for Priority Impact Pathways.” Luxembourg.
eurostat. 2017. “GDP per Capita, Consumption per Capita and Price Level Indices.” http://ec.europa.eu/eurostat/statistics-explained/index.php/GDP_per_capita,_consumption_per_capita_and_price_level_indices.
Eurostat. 2016. “Passenger Transport Statistics.”
ExternE: Externalities of Energy:: [Studies]. Vol. 2: Methodology: [Method for Estimation of Physical Impacts and Monetary Valuation for Priority Impact Pathways]. 1995. EUR. Luxembourg: Off. for Official Publ. of the Eur. Communities.
Fernandes, E., Jantunen, M., Carrer, P., Seppänen, O., Harrison, P., & Kephalopoulos, S. 2009. “Co-Ordination Action on Indoor Air Quality and Health Effects.”
Fisk, W. J., & Rosenfeld, A. H. 1997. “Estimates of Improved Productivity and Health from Better Indoor Environments.” Indoor Air 7: 158–72.
Fisk, W. J. 2000. “Health and Productivity Gains from Better Indoor Environments and the Relationship with Building Energy Efficiency.” Annual Review of Energy and the Environment 25 (1): 537–566.
Fisk, W. J. 2009. “Quantitative Relationship of Sick Building Syndrome Symptoms with Ventilation Rates.” Indoor Air 19 (2): 159–65.
Fisk, William J. 2002. “How IEQ Affects Health, Productivity.” ASHRAE Journal 44 (5): 56.
Fiúza, C., Teixeira, R., & Domingos, T. 2006. “Assessing the Direct and Environmental Costs of an
CE
UeT
DC
olle
ctio
n

226
Activity: Price Painting with DALY.” In Conference: 2nd AERNA Spanish-Portuguese Association of Natural Resource and Environmental Economics Conference.
Fleischer, T., and M Tir. 2016. “The Transport in Our Time-Budget.” Regional Statistics 6 (2): 54–94.
Frank, L. D., J. F. Sallis, T. L. Conway, J. E. Chapman, B. E. Saelens, and W. Bachman. 2006. “Many Pathways from Land Use to Health: Associations between Neighborhood Walkability and Active Transportation, Body Mass Index, and Air Quality.” Journal of the American Planning Association 72 (1): 75–87.
Fuller, Daniel, Lise Gauvin, Yan Kestens, Patrick Morency, and Louis Drouin. 2013. “The Potential Modal Shift and Health Benefits of Implementing a Public Bicycle Share Program in Montreal, Canada.” The International Journal of Behavioral Nutrition and Physical Activity 10: 66. doi:10.1186/1479-5868-10-66.
GAN. 2014. “The Global Asthma Report.” Auckland.
Garrow, V. 2016. “Presenteeism A Review of Current Thinking.”
GEA. 2012. “Summaries.” Global Energy Assessment: Toward a Sustainable Future, 3–93. doi:10.1017/CBO9780511793677.
GEA. 2014. “The Global Energy Assessment-Toward a Sustainable Future.”
Gilbertson, J., Grimsley, M., & Green, G. 2012. “Psychosocial Routes from Housing Investment to Health: Evidence from England’s Home Energy Efficiency Scheme.” Energy Policy, 122–33.
Golaszewski, T., Snow, D., Lynch, W., Yen, L., & Solomita. 1992. “A Benefit-to-Cost Analysis of a Work-Site Health Promotion Program.” Journal of Occupational Medicine, 1164–1172.
Graham Floater, Catarina Heeckt, Matthew Ulterino, Lisa Mackie, Thomas Philipp Rode, Ankit Bhardwaj, Maria Carvalho, Darren Gill, and Rachel Huxley Bailey. 2016. “Co-Benefits of Urban Climate Action : A Framework for Cities.”
Greene, D. L., & & Wegener, M. 1997. “Sustainable Transport.” Journal of Transport Geography 5 (3): 177–90.
Grimes, Arthur, Tim Denne, Philippa Howden-chapman, Richard Arnold, Lucy Telfar-barnard, Nicholas Preval, and Chris Young. 2012. “Cost Benefit Analysis of the Warm Up New Zealand : Heat Smart Programme Ministry of Economic Development,” no. June: 26.
Guarnieri, M., & Balmes., J. R. 2014. “Outdoor Air Pollution and Asthma.” The Lancet 383: 1581–92.
Gundimeda, H. 2005. “Hedonic Price Method-A Concept Note.”
Hafner, M., Stolk, v., Saunders, C., Krapels, J., & Baruch, B. 2015. “Health, Wellbeing and Productivity in the Workplace.”
Hamilton, Kirk, Akbar, Sameer. 2010. “Assessing the Environmental Co-Benefits of Climate Change Actions.”
Hamra, G. B., Guha, N., Cohen, A., Laden, F., & Ole Raaschou-Nielsen, J. M. 2014. “Outdoor Particulate Matter Exposure and Lung Cancer: A Systematic Review and Meta-Analysis.” Environmental Health Perspectives 122.
Hänninen, O., & Asikainen, A. 2013. “Efficient Reduction of Indoor Exposures- Health Benefits from Optimizing Ventilation, Filtration and Indoor Source Controls.”
Hasanbeigi, A., Lobscheid, A., Lu, H., Price, L., & Dai, Y. 2013. “Quantifying the Co-Benefits of Energy-
CE
UeT
DC
olle
ctio
n
227
Efficiency Policies: A Case Study of the Cement Industry in Shandong Province, China.” Science of the Total Environment 458: 624–36.
Healy, J. D. 2003. “Excess Winter Mortality in Europe: A Cross Country Analysis Identifying Key Risk Factors.” Journal of Epidemiology & Community Health 57 (10): 784–89.
Heffner, G, and N Campbell. n.d. “Evaluating the Co-Benefits of Low-Income Energy-Efficiency Programmes. Results of the Dublin Workshop.”
Heins, Elke, and Chris Deeming. 2015. “Welfare and Well-Being – Inextricably Linked.”
Howden-Chapman, P., Matheson, A., Crane, J., Viggers, H., Cunningham, M., Blakely, T., et al. 2007. “Effect of Insulating Existing Houses on Health Inequality: Cluster Randomised Study in the Community.” Bmj 334 (7591): 460.
Howden-Chapman, P., H. Viggers, R. Chapman, D. O’Dea, S. Free, and K. O’Sullivan. 2009. “Warm Homes: Drivers of the Demand for Heating in the Residential Sector in New Zealand.” Energy Policy 37 (9): 3387–99. doi:10.1016/j.enpol.2008.12.023.
Howden-Chapman, Philippa, Helen Viggers, Ralph Chapman, Des O’Dea, Sarah Free, and Kimberley O’Sullivan. 2009. “Warm Homes: Drivers of the Demand for Heating in the Residential Sector in New Zealand.” Energy Policy 37 (9): 3387–99. doi:10.1016/j.enpol.2008.12.023.
Hu, G., Eriksson, J., Barengo, N., Lakka, T., Valle, T., & Nissinen, A. 2004. “Occupational, Commuting, and Leisure-Time Physical Activity in Relation to Total and Cardiovascular Mortality among Finnish Subjects with Type 2 Diabetes.” Circulation, 666–73.
Huang, Jikun, Jun Yang, Siwa Msangi, Scott Rozelle, and Alfons Weersink. 2012. “Biofuels and the Poor: Global Impact Pathways of Biofuels on Agricultural Markets.” Food Policy 37 (4). Elsevier Ltd: 439–51. doi:10.1016/j.foodpol.2012.04.004.
Husman, T. 1996. “Health Effects of Indoor-Air Microorganisms.” Scandinavian Journal of Work, Environment & Health, 5–13.
IEA. 2012. “World Energy Outlook 2012 (B).”
IEA. 2014. “Capturing the Multiple Benefits of Energy Efficiency: Executive Summary.” Capturing the Multiple Benefits of Energy Efficiency. doi:10.1787/9789264220720-en.
IEA. 2015. “ENERGY EFFICIENCY -Market Report. Paris Cedex: International Energy Agency.”
IEA. 2016. “ENERGY EFFICIENCY Market Report.”
INRIX. 2017. “Stuttgart Is Experiencing the Highest Increase in Traffic Congestion in Europe and Overtakes Cologne as Germany’s Busiest City.” http://inrix.com/press-releases/scorecard-de/.
International, World cancer research fund. 2012. “Lung Cancer Statistics.” http://www.wcrf.org/int/cancer-facts-figures/data-specific-cancers/lung-cancer-statistics.
IPCC. 2007. “Contribution of Working Group II to the Fourth Assessment Report of the Intergovernmental Panel on Climate Change.”
IPCC. 2014. “Climate Change 2014: Mitigation of Climate Change.” New York.
IPCC. 2014. “Mitigation of Climate Change: Working Group III Contribution to the Fifth Assessment Report of the Intergovernmental Panel on Climate Change.” New York.
James, P., Ito, K., Buonocore, J. J., Levy, J. I., & Arcaya, M. C. 2014. “A Health Impact Assessment of Proposed Public Transportation Service Cuts and Fare Increases in Boston, Massachusetts
CE
UeT
DC
olle
ctio
n

228
(USA).” International Journal of Environmental Research and Public Health 11 (8): 8010–24.
Jansen, J. C., & Seebregts, A. J. 2010. “Long-Term Energy Services Security: What Is It and How Can It Be Measured and Valued?” Energy Policy 38 (4): 1654–64.
Jochem, Eberhard and Madlener, Reinhard. 2003. “The Forgotten Benefits of Climate Change Mitigation: Innovation, Technological Leapfrogging, Employment, and Sustainable Development.”
Johansson, O. 1997. “Optimal Road-Pricing: Simultaneous Treatment of Time Losses, Increased Fuel Consumption, and Emissions.” Transportation Research Part D: Transport and Environment 2 (2): 77–87.
Johns, G. 2010. “Presenteeism in the Workplace: A Review and Research Agenda.” Journal of Organizational Behavior 31 (4): 519–42.
Jones, A. 1999. “Indoor Air Quality and Health.” Atmospheric Environment 33 (28): 4535–4564.
Joshi, S. M. 2008. “The Sick Building Syndrome.” Indian Journal of Occupational and Environmental Medicine 12 (2): 61.
Joyce, A., M. B. Hansen, and S. Naes-Schmidt. 2013. “Monetising the Multiple Benefits of Energy Efficient Renovations of the Buildings of the EU.” Belambra Les Criques, Toulon/Hyères, France.
Katsouyanni, K. 2003. “Ambient Air Pollution and Health.” British Medical Bulletin 68: 143–15.
Kesicki, F. 2011. “Marginal Abatement Cost Curves for Policy Making – Expert-Based vs. Model-Derived Curves.” In 33rd IAEE International Conference. Rio de Janeiro: UCL Energy Institute.
Kirsten, W. 2010. “Making the Link between Health and Productivity at the Workplace―A Global Perspective.” Industrial Health 48 (3): 251–55.
Kocsis, J. B. 2004. “The Housing Poor in Budapest, Hungary: Situation and Perspectives. TOO POOR TO MOVE, TOO POOR TO STAY.”
Koopman, Cheryl, Kenneth R. Pelletier, James F. Murray, Claire E. Sharda, Marc L. Berger, Robin S. Turpin, Paul Hackleman, Pamela Gibson, Danielle M. Holmes, and Talor Bendel. 2002. “Stanford Presenteeism Scale: Health Status and Employee Productivity.” Journal of Occupational and Environmental Medicine 44 (1): 14–20.
Koss, E., and D.A. Lewis. 1993. “Productivity or Efficiency – Measuring What We Really Want.” National Productivity Review 12 (2): 273–95.
Kraemer, Birgit. 2017. “Living and Working in Germany.”
Kreiss, K. 2005. “Building-Related Illness.” Preventing Occupational Diseases and Injury 34.
Kremer, B., Sziklai, I., & Tausz, K. 2002. “The Impact of Decentralization on Social Policy in Hungary.” The Impact of Decentralization on Social Policy, 89–131.
Krzyżanowski, M., Kuna-Dibbert B., and J Schneider. 2005. “Health Effects of Transport-Related Air Pollution.”
Künzli, N., Kaiser, R., Medina, S., Studnicka, M., Chanel, O., Filliger, P., et al. 2000. “Public-Health Impact of Outdoor and Traffic-Related Air Pollution: A European Assessment.” The Lancet 9232: 795–801.
Kuppam, A., R. Pendyala, and S. Rahman. 1999. “Analysis of the Role of Traveler Attitudes and Perceptions in Explaining Mode-Choice Behavior.” Journal of the Transportation Research
CE
UeT
DC
olle
ctio
n

229
Board, 68–76.
Kurnitski, J., Allard, F., D. Braham, G. Goeders, P. Heiselberg, and L., ... & Seppänen, O. Jagemar. 2011. “How to Define Nearly Net Zero Energy Buildings NZEB.” Rehva Journal 48 (3): 6–12.
Laitner, J. A., Ruth, M., & Worrell, E. 2001. “Incorporating the Productivity Benefits into the Assessment of Cost Effective Energy Savings Potential Using Conservation Supply Curves.”
Lamb, Charles E, Paul Ratner, Clarion Johnson, Ambarish Ambegaonkar, Ashish Joshi, David Day, Najah Sampson, and Benjamin Eng. 2006. “Economic Impact of Workplace Productivity Losses Due to Allergic Rhinitis Compared with Select Medical Conditions in the United States from an Employer Perspective.”
Leaman, A., and B Bordass. 1999. “Productivity in Buildings: The ‘Killer’Variables.” Building Research & Information 27 (1): 4–19.
Lean, H. H., & Smyth, R. 2010. “CO2 Emissions, Electricity Consumption and Output in ASEAN.” Applied Energy 87 (6): 1858–64.
Lelieveld, J., J. S. Evans, M. Fnais, D. Giannadaki, and A. Pozzer. 2015. “The Contribution of Outdoor Air Pollution Sources to Premature Mortality on a Global Scale.” Nature 525 (7569): 367.
Lequiller, F. and D. Blades. 2014. “Understanding National Accounts: Second Edition, OECD Publishing.”
Levy, Jonathan I, Yurika Nishioka, and John D Spengler. 2003. “The Public Health Benefits of Insulation Retrofits in Existing Housing in the United States.” Environmental Health : A Global Access Science Source 2 (1): 4. doi:10.1186/1476-069X-2-4.
Liberty Fund. 2012. “Wellbeing and Welfare.”
Liddell, C., & & Guiney, C. 2015. “Living in a Cold and Damp Home: Frameworks for Understanding Impacts on Mental Well-Being.” Public Health 129 (3): 191–99.
Litman, Todd Alexander. 2015. “Evaluating Public Transit Benefits and Costs Best Practices Guidebook.”
Liu, D. L., and W. W. & Nazaroff. 2001. “Modeling Pollutant Penetration across Building Envelopes.” Atmospheric Environment 35 (26): 4451–62.
Lloyd, K. M., & Auld, C. J. 2002. “The Role of Leisure in Determining Quality of Life: Issues of Content and Measurement.” Social Indicators Research 57 (1): 43–71.
Lung, Robert Bruce, Aimee Mckane, Robert Leach, and Donald Marsh. 2005. “Ancillary Savings and Production Benefits in the Evaluation of Industrial Energy Efficiency Measures,” 103–14.
Maria Ntovantzi, Paolo Bertoldi, Marina Economidou Silvia Rivas Calvete, and Craig Lee Morton Serrenho, Albana Kona & Tiago. 2015. “Do We Have Effective Energy Efficiency Policies for the Transport Sector? Results and Recommendations from an Analysis of the National and Sustainable Energy Action Plans.” In ECEEE SUMMER STUDY PROCEEDINGS, 895–905.
Markandya, A, and DTG. Rubbelke. 2003. “Ancillary Benefits of Climate Policy.” J. Econ. Stat. Jahrb¨ucher F¨ur, 488–503.
Marmot Review. 2011. “The Health Impacts of Cold Homes and Fuel Poverty The Health Impacts of Cold Homes and Fuel Poverty.”
Marshall, J., Brauer, M., & Frank, L. 2009. “Healthy Neighborhoods:Walkability and Air Pollution.” Environ Health Perspect, 1752–59.
CE
UeT
DC
olle
ctio
n

230
Mattke, S., Balakrishnan, A., Bergamo, G., & Newberry, S. J. 2007. “A Review of Methods to Measure Health-Related Productivity Loss.” American Journal of Managed Care 13 (4): 211.
McCartney, K. J., & Humphreys, M. A. 2002. “Thermal Comfort and Productivity.” Proceedings of Indoor Air, 822–27.
McEwen, B. S. 1998. “Protective and Damaging Effects of Stress Mediators.” New England Journal of Medicine 338 (3): 171–79.
Metz, B., O.R. Davidson, P.R. Bosch, R. Dave, and L.A. Meyer (eds). 2007. “Contribution of Working Group III to the Fourth Assessment Report of the Intergovernmental Panel on Climate Change.” Cambridge, United Kingdom and New York, NY, USA.: Cambridge University.
Miller, M.A., and K. Li. 1994. “An Investigation of the Costs of Roadway Traffic Congestion: A Preparatory Step for IVHS Benefits Evaluation.”
Miller, J. D. 1992. “Fungi as Contaminants in Indoor Air. Atmospheric Environment Part A.” General Topics 26 (12): 2163–72.
Milton, D. K., Glencross, P. M., & Walters, M. D. 2000. “Risk of Sick Leave Associated with Outdoor Air Supply Rate, Humidification, and Occupant Complaints.” Indoor Air 10 (4): 212–21.
Mirasgedis, S., Georgopoulou, E., Sarafidis, Y., Balaras, C., Gaglia, A., & Lalas, D. 2003. “CO2 Emission Reduction Policies in the Greek Residential Sector: A Methodological Framework for Their Economic Evaluation.” Energy Conversion and Management.
Miyatsuka, Akiko, and Eric Zusman. 2010. “What Are Co-Benefits?”
Mølhave, L., Bach, B., & Pedersen, O. F. 1986. “Human Reactions to Low Concentrations of Volatile Organic Compounds.” Environment International 12 (1): 167–75.
Moonie, S. A., Sterling, D. A., Figgs, L., & Castro, M. 2006. “Asthma Status and Severity Affects Missed School Days.” Journal of School Health 76 (1): 18–24.
Mudarri, D., & Fisk, W. 2007. “Public Health and Economic Impact of Dampness and Mold.” Indoor Air, 226–35.
Mueller, N., Rojas-Rueda, D., Cole-Hunter, T., de Nazelle, A., Dons, E., Gerike, R., ... & Nieuwenhuijsen, M. 2015. “Health Impact Assessment of Active Transportation: A Systematic Review.” Preventive Medicine 76: 103–14.
Mzavanadze;, Nora;Stefan Bouzarovski;Sergio Tirado Herrero. 2018. “Final Report: Quantifying Energy Povertyrelated Health Impacts of Energy Efficiency.”
Nässén, J., & Holmberg, J. 2009. “Quantifying the Rebound Effects of Energy Efficiency Improvements and Energy Conserving Behaviour in Sweden.” Energy Efficiency 2 (3): 221–31.
Norbäck, D., Björnsson, E., Janson, C., Palmgren, U., & Boman, G. 1999. “Current Asthma and Biochemical Signs of Inflammation in Relation to Building Dampness in Dwellings.” The International Journal of Tuberculosis and Lung Disease 3 (5): 368–76.
O’Donnell, M. P. 2000. “Health and Productivity Management: The Concept, Impact, and Opportunity: Commentary to Goetzel and Ozminkowski.” American Journal of Health Promotion 14 (4): 215–17.
Oecd. 2001. “Measuring Productivity MEASUREMENT OF AGGREGATE AND INDUSTRY-LEVEL PRODUCTIVITY GROWTH. OECD Manual.”
OECD. 2008. “LABOUR PRODUCTIVITY INDICATORS. OECD Statistics Directorate.”
CE
UeT
DC
olle
ctio
n

231
OECD. 2011. “Towards Green Growth: Monitoring Progress: OECD Indicators.” Innovation, 1–143. doi:10.1787/9789264111318-en.
OECD. 2016. “Economic Surveys-Hungary.”
OECD. 2016. “Economic Surveys Germany.”
Olawale, Fadare, Somuyiwa Adebambo, and Ayantoyinbo Boye. 2015. “Correlates of Road Traffic Congestion and Workers Performance in Lagos Metropolis.” European Journal of Business and Management.
Olesen, Jørgen E., and Marco Bindi. 2002. “Consequences of Climate Change for European Agricultural Productivity, Land Use and Policy.” European Journal of Agronomy 16 (4): 239–62.
Passipedia. 2017. “Passipedia- the Passive House Resorce. 09 1.”
Patterson, M. G. 1996. “What Is Energy Efficiency?: Concepts, Indicators and Methodological Issues.” Energy Policy 24 (5): 377–90.
Paul, H. 2004. “Presenteeism: At Work-but out of It.” Harvard Business Review 82 (10): 49–58.
Pearce, D., and T. Crowards. 1996. “Particulate Matter and Human Health in the United Kingdom.” Energy Policy 24 (7): 609–19.
Petersen, Morten Steen, Carlo Sessa, Riccardo Enei, Andreu Ulied, Efrain Larrea, Oriol Obisco, Paul Timms, and Christian Hansen. 2009. “TRANSvisions-Contract A2/78-2007: Report on Transport Scenarios with a 20 and 40 Year Horizon.”
Phillips, K. A., Homan, R. K., Luft, H. S., Hiatt, P. H., Olson, K. R., Kearney, T. E., & Heard, S. E. 1997. “Willingness to Pay for Poison Control Centers.” Journal of Health Economics 16 (3): 343–57.
Pope, C. A., Burnett, R. T., Thun, M. J., Calle, E. E., Krewski, D., Ito, K., et al. 2002. “Lung Cancer, Cardiopulmonary Mortality, and Long-Term Exposure to Fine Particulate Air Pollution.” Jama 287 (9): 1132–41.
Pope, C. A., Thun, M. J., Namboodiri, M. M., Dockery, D. W., Evans, J. S., Speizer, F. E., et al. 1995. “Particulate Air Pollution as a Predictor of Mortality in a Prospective Study of US Adults.” American Journal of Respiratory and Critical Care Medicine 151 (3): 669–74.
Porter, M. E., & Van der Linde, C. 1995. “Green and Competitive.” Harvard. Harvard Business Review, 120–34.
Price, A. E. 2004. “Heart Disease and Work.” Heart 90 (9): 1077–84.
Quddus, M. A., Wang, C., & & Ison, S. G. 2009. “Road Traffic Congestion and Crash Severity: Econometric Analysis Using Ordered Response Models.” Journal of Transportation Engineering 136 (5): 424–35.
Quinn, R. 1978. “Productivity and the Process of Organizational Improvement: Why We Cannot Talk to Each Other.” Public Administration Review 38: 41–45.
Rabl, A., and A. De Nazelle. 2012. “Benefits of Shift from Car to Active Transport.” Transport Policy 19 (1): 121–31.
Redlich, C. A. 1997. “Sick-Building Syndrome.” The Lancet 349 (9057): 1013–16.
Rey, E. 2004. “Office Building Retrofitting Strategies: Multicriteria Approach of an Architectural and Technical Issue.” Energy and Buildings 36 (4): 367–72.
Rogers, Mark. 1998. “The Definition and Measurement of Productivity.” In Melbourne Institute
CE
UeT
DC
olle
ctio
n

232
Working Paper No. 9/98.
Rojas-Rueda, D., De Nazelle, A., Teixidó, O., & Nieuwenhuijsen, M. J.. 2012. “Replacing Car Trips by Increasing Bike and Public Transport in the Greater Barcelona Metropolitan Area: A Health Impact Assessment Study.” Environment International 49: 100–109.
Rosenbloom, S. 1978. “Peak-Period Traffic Congestion: A State-of-Art Analysis and Evaluation of Effective Solution.” Transportation 7 (2): 167–91.
Roy, J., A.-M. Dowd, Muller, A, S Pal, and N Prata. 2012. “Chapter 21 - Lifestyles, Well-Being and Energy. In Global Energy Assessment - Toward a Sustainable Future.”
Ryan, R. M., N. Weinstein, J. Bernstein, K. W. Brown, L. Mistretta, and M. & Gagne. 2010. “Vitalizing Effects of Being Outdoors and in Nature.” Journal of Environmental Psychology 30 (2): 159–68.
Ryan, Lisa, and Nina Campbell. 2012. “Spreading the Net: The Multiple Benefits of Energy Efficiency Improvements.” International Energy Agency, no. May. doi:10.1787/5k9crzjbpkkc-en.
Rylander, R., & Lin, R.-H. 2000. “(1→ 3)-β-d-Glucan—relationship to Indoor Air-Related Symptoms, Allergy and Asthma.” Toxicology 152 (1): 47–52.
Sadineni, S. B., Madala, S., & & Boehm, R. F. 2011. “Passive Building Energy Savings: A Review of Building Envelope Components.” Renewable and Sustainable Energy Reviews 15 (8): 3617–31.
Sallis, J. F., L. D. Frank, B. E. Saelens, and M. K. Kraft. 2004. “Active Transportation and Physical Activity: Opportunities for Collaboration on Transportation and Public Health Research.” Transportation Research Part A: Policy and Practice 38 (4): 249–68.
Santucci, Lorenzo, Puhl, Ingo, Sinha, Maqsood, Enayetullah, Iftekhar, Agyemang-Bonsu, William Kojo. 2014. “Valuing the Sustainable Development Co-Benefits of Climate Change Mitigation Actions: The Case of the Waste Sector and Recommendations for the Design of Nationally Appropriate Mitigation Actions (NAMAs).”
Sauian Sahar, M. 2002. “Labour Productivity: An Important Business Strategy in Manufacturing.” Integrated Manufacturing Systems 13 (6): 435–38.
Sauter, R, and A Volkery. 2013. “Review of Costs and Benefits of Energy Savings. : Institute For.” Brussels.
Scheer, J, and B. Motherway. 2011. “Economic Analysis of Residential and Small-Business Energy Efficiency Improvements, Sustainable Energy Authority of Ireland (SEAI).”
Scheuer, C., Keoleian, G. A., & Reppe, P. 2003. “Life Cycle Energy and Environmental Performance of a New University Building: Modeling Challenges and Design Implications.” Energy and Buildings 35 (10): 1049–64.
Schnieders, J., and A. & Hermelink. 2006. “CEPHEUS Results: Measurements and Occupants’ Satisfaction Provide Evidence for Passive Houses Being an Option for Sustainable Building.” Energy Policy 34 (2): 151–71.
Schuessler, R. 2014. “Energy Poverty Indicators: Conceptual Issues-Part I: The Ten-Percent-Rule and Double Median/Mean Indicators.”
Schulze Darup, Burkhard ;Zwiauer, Katharina;Prokupek, Stefan. 2015. “Energy-Efficient Buildings (Passive and Nearly Zero-Energy Buildings).”
Schwartz, J., & Morris, R. 1995. “Air Pollution and Hospital Admissions for Cardiovascular Disease in Detroit, Michigan.” American Journal of Epidemiology 142 (1): 23–35.
CE
UeT
DC
olle
ctio
n

233
Schweitzer, Martin, and B Tonn. 2002a. “Non Energy Benefits from the Weatherization Assistance Program: A Summary of Findings from the Recent Literature.”
Schweizer, C., R. D. Edwards, L. Bayer-Oglesby, W. J. Gauderman, V. Ilacqua, M. J. Jantunen, and N. ...
& Künzli. 2007. “Indoor time-microenvironment-activity patterns in seven regions of
Europe.” Journal of Exposure Science and Environmental Epidemiology 17 (2): 170.
Schweitzer, Martin, and Bruce Tonn. 2002b. Non-Energy Benefits from the Weatherization Assistance Program : A Summary of Findings from the Recent Literature.
Seppänen, O., & Fisk, W. J. 2005. “A Model to Estimate the Cost-Effectiveness of Improving Office Work through Indoor Environmental Control.” ASHRAE Transactions 111 (2).
Seppänen, O. A., Fisk, W. J., & Mendell, M. J. 1999. “Association of Ventilation Rates and CO2 Concentrations with Health Andother Responses in Commercial and Institutional Buildings.” Indoor Air 9 (4): 226–52.
Shafiee, S., & Topal, E. 2009. “When Will Fossil Fuel Reserves Be Diminished?” Energy Policy 37 (1): 181–89.
Shaheen, S., Guzman, S., & Zhang, H. 2010. “Bikesharing in Europe, the Americas, and Asia: Past, Present, and Future. Transportation Research Record.” Journal of the Transportation Research Board, 159–67.
Shannon, T., B. Giles-Corti, T. Pikora, M. Bulsara, T. Shilton, and F. Bull. 2006. “Active Commuting in a University Setting: Assessing Commuting Habits and Potential for Modal Change.” Transport Policy 13(3) (3): 240–53.
Shortt, N., & & Rugkåsa, J. 2007. “"The Walls Were so Damp and Cold” Fuel Poverty and Ill Health in Northern Ireland: Results from a Housing Intervention.” Health & Place 13 (1): 99–110.
Siegrist, J., Von dem Knesebeck, O., & Pollack, C. E. 2004. “Social Productivity and Well-Being of Older People: A Sociological Exploration.” Social Theory & Health 2 (1): 1–17.
Sims R., R, F. Schaeffer, X Creutzig, M. Cruz-Núñez, D. D’Agosto, M.J. Dimitriu, L. Figueroa Meza, S. Fulton, and O. Kobayashi. 2014. “Transport. In: Climate Change 2014: Mitigation of Climate Change. Contribution of Working Group III to the Fifth Assessme.”
Singh, A., Syal, M., Grady, S. C., & Korkmaz, S. 2010. “Effects of Green Buildings on Employee Health and Productivity.” American Journal of Public Health 100 (9): 1665–68.
Singh, Harinder, Jaideep Motwani, and Ashok Kumar. 2000. “A Review and Analysis of the State of the Art Research on Productivity Measurement.” Industrial Management and Data Systems 100 (5): 234–41.
Singh, J. 2005. “Toxic Moulds and Indoor Air Quality.” Indoor and Built Environment 14 (3–4): 229–34.
Söderholm, P, and T Sundqvist. 2003. “Pricing Environmental Externalities in the Power Sector: Ethical Limits and Implications for Social Choice.” Ecol Econ 46: 333–50. doi:10.1016/S0921-8009(03)00185-X.
SPRING. 2011. “A Guide to Productivity Measurement.” Singapore.
Stechow, Christoph Von, Detlef P Van Vuuren, Edgar G. Hertwich, Massimo Tavoni, Ottmar Edenhofer, Yacob Mulugetta, David McCollum, et al. 2015. “Integrating Global Climate Change Mitigation Goals with Other Sustainability Objectives: A Synthesis.” ANNUAL REVIEW OF ENVIRONMENT AND RESOURCES 40: 363–39.
CE
UeT
DC
olle
ctio
n

234
Stefano Faberi, Loriana Paolucci, and Karine Pollier Bruno Lapillonne. 2015. “Trends and Policies for Energy Savings and Emissions in Transport.”
Steindel, C., & Stiroh, K. J. 2001. “Productivity: What Is It, and Why Do We Care about It?.”
Stern, N. 2006. “Stern Review Report on the Economics of Climate Change.”
Stoulos, S., Manolopoulou, M., & Papastefanou, C. 2003. “Assessment of Natural Radiation Exposure and Radon Exhalation from Building Materials in Greece.” Journal of Environmental Radioactivity 69 (3): 225–40.
Strauss, Jillian, Luis F. Miranda-Moreno, and and Patrick Morency. 2014. “Multimodal Injury Risk Analysis of Road Users at Signalized and Non-Signalized Intersections.” Accident Analysis & Prevention 71: 201–9.
Sundell, J. 2004. “On the History of Indoor Air Quality and Health.” Indoor Air 14 (s7): 51–58.
Tangen, S. 2004. “Performance Measurement: From Philosophy to Practice.” International Journal of Productivity and Performance Management 53 (8): 726–37.
Tangen, Stefan. 2002. “Understanding the Concept of Productivity.” In In Proceedings of the 7th Asia-Pacific Industrial Engineering and Management Systems Conference, 18–20. Taipei.
Treiber, M., Kesting, A., & Thiemann, C. 2008. “How Much Does Traffic Congestion Increase Fuel Consumption and Emissions? Applying a Fuel Consumption Model to the NGSIM Trajectory Data.” Washington, DC.
Trubka, R., Newman, P., & Bilsborough, D. 2010. “The Costs of Urban Sprawl–physical Activity Links to Healthcare Costs and Productivity.” Environment Design Guide, 1–13.
UN. 2015. “Sustainable Development Goals.” ” www.un.org/sustainabledevelopment/sustainabledevelopment-goals/.
UNCHS. 1995. “Economic Instruments and Regulatory Measures for the Demand Management of Urban Transport.” Nairobi.
Ürge-Vorsatz, D., L. D. Danny Harvey, S. Mirasgedis, and M. D. & Levine. 2007. “Mitigating CO2 Emissions from Energy Use in the World’s Buildings.” Building Research & Information 35 (4): 379–98.
Urge-Vorsatz, Diana, Ksenia Petrichenko, Miklos Antal, Maja, Labelle, Michael Staniec, Eren Ozden, and Elena Labzina. 2012. “Best Practice Policies for Low Energy and Carbon Buildings. A Scenario Analysis.” Budapest.
Ürge-Vorsatz, D., A. Kelemen, M. Gupta, S. Chatterjee, M. Egyed, and A. Reith. 2015. “Literature Review on Multiple Impact Quantification Methodologies, COMBI D2.1 Report.”
Ürge-Vorsatz, D., A. Novikova, and M. Sharmina. 2009. “Counting Good: Quantifying the Co-Benefits of Improved Efficiency in Buildings. ECEEE 2009 Summer Study.”
Ürge-Vorsatz, Diana (Ceu), Daniele Arena, Sergio Tirado Herrero, Andrew Butcher, and Tamás (Bute) Csoknyai. 2010. “Employment Impacts of a Large-Scale Deep Building Energy Retrofit Programme in Hungary,” 158.
Ürge-Vorsatz, Diana, Sergio Tirado Herrero, Navroz K. Dubash, and Franck Lecocq. 2014. “Measuring the Co-Benefits of Climate Change Mitigation.” Annual Review of Environment and Resources 39 (October): 549–82. doi:10.1146/annurev-environ-031312-125456.
Ürge-Vorsatz, Diana, Agnes Kelemen, Sergio Tirado-Herrero, Stefan Thomas, Johannes Thema, Nora
CE
UeT
DC
olle
ctio
n

235
Mzavanadze, Dorothea Hauptstock, et al. 2016. “Measuring Multiple Impacts of Low-Carbon Energy Options in a Green Economy Context.” Applied Energy 179 (July): 1409–26. doi:10.1016/j.apenergy.2016.07.027.
Ürge-Vorsatz, Diana, and Sergio Tirado Herrero. 2012. “Building Synergies between Climate Change Mitigation and Energy Poverty Alleviation.” Energy Policy 49 (October): 83–90. doi:10.1016/j.enpol.2011.11.093.
Usón, A. A., Capilla, A. V., Bribián, I. Z., Scarpellini, S., &Sastresa, E. L. 2011. “Energy Efficiency in Transport and Mobility from an Eco-Efficiency Viewpoint.” Energy 36 (4): 1916–1923.
Van Praag, B. M., P. Frijters, and A. & Ferrer-i-Carbonell. 2003. “The Anatomy of Subjective Well-Being.” Journal of Economic Behavior & Organization 51 (1): 29–49.
Wahrendorf, M., Ribet, C., Zins, M., & Siegrist, J. 2008. “Social Productivity and Depressive Symptoms in Early Old Age–results from the GAZEL Study.” Aging and Mental Health 12 (3): 310–16.
Wargocki, P., Sundell, J., Bischof, W., & G. Brundrett, P. O. 2002. “Ventilation and Health in Non‐industrial Indoor Environments: Report from a European Multidisciplinary Scientific Consensus Meeting (EUROVEN).” Indoor Air 12 (2): 113–28.
Wargocki, P., Wyon, D. P., Baik, Y. K., Clausen, G., & Fanger, P. O. 1999. “Perceived Air Quality, Sick Building Syndrome (SBS) Symptoms and Productivity in an Office with Two Different Pollution Loads.” Indoor Air 9 (3): 165–79.
Wargocki, P., Wyon, D. P., Sundell, J., Clausen, G., & Fanger, P. O. 2000. “The Effects of Outdoor Air Supply Rate in an Office on Perceived Air Quality, Sick Building Syndrome (SBS) Symptoms and Productivity.” Indoor Air 10 (4): 222–36.
Wei, Y. M., Liu, L. C., Fan, Y., & Wu, G. 2007. “The Impact of Lifestyle on Energy Use and CO2 Emission: An Empirical Analysis of China’s Residents.” Energy Policy 35 (1): 247–57.
Weisbrod, G. 2010. “The Connection between Public Transportation & Economic Development in Chicago.”
WHO. 2006. “Development of WHO Guidelines for Indoor Air Quality . World Health Organization.” Bonn, Germany.
WHO. 2008. “PRINCIPLES AND METHODS FOR THE RISK ASSESSMENT OF CHEMICALS IN FOOD-CHAPTER 5: DOSE–RESPONSE ASSESSMENT.” http://www.who.int/foodsafety/chem/dose_response.pdf.
WHO. 2010. “Global Recommendations on Physical Activity for Health.”
WHO. 2013. “Mental Health Action Plan 2013-2020.”
WHO. 2016. “Ambient Air Pollution: A Global Assessment of Exposure and Burden of Diseaes.”
WHO. 2017. “Health Statistics and Information Systems.”
Wilhite, H., E. Shove, L. Lutzenhiser, and W. & Kempton. 2000. “The Legacy of Twenty Years of Energy Demand Management: We Know More about Individual Behaviour but next to Nothing about Demand.” Society, Behaviour, and Climate Change Mitigation, 109–26.
Witterseh, T., Wyon, D. P., & Clausen, G. 2004. “The Effects of Moderate Heat Stress and Open‐plan Office Noise Distraction on SBS Symptoms and on the Performance of Office Work.” Indoor Air 14 (s8): 30–40.
CE
UeT
DC
olle
ctio
n

236
Woensel, T. O. M, R. Creten, and N. & Vandaele. 2001. “Managing the Environmental Externalities of Traffic Logistics.” Production and Operations Management 10 (2): 207–23.
Woodcock, J., P. Edwards, C. Tonne, B. G. Armstrong, O. Ashiru, and D., ... & Franco, O. H. Banister. 2009. “Public Health Benefits of Strategies to Reduce Greenhouse-Gas Emissions: Urban Land Transport.” The Lancet 374 (9705): 1930–43.
Worrell, Ernst, John A Laitner, Michael Ruth, and Hodayah Finman. 2003. “Productivity Benefits of Industrial Energy Efficiency Measures.” Energy 28: 1081–1098.
Wyon, D. P. 2004. “The Effects of Indoor Air Quality on Performance and Productivity.” Indoor Air 14 (s7): 92–101.
Xia, T., M. Nitschke, Y. Zhang, P. Shah, S. Crabb, and A. & Hansen. 2015. “Traffic-Related Air Pollution and Health Co-Benefits of Alternative Transport in Adelaide, South Australia.” Environment International, 281–90.
Yadav, Surendra Kumar. 2013. “Dose – Response Models to Understand Toxicodynamics for Pollutants in Ecosystems.” International Journal of Environmental Science: Development and Monitoring (IJESDM) 4 (3): 77–80.
Yang, Xi, Fei Teng, and Gehua Wang. 2013. “Incorporating Environmental Co-Benefits into Climate Policies: A Regional Study of the Cement Industry in China.” Applied Energy 112 (x). Elsevier Ltd: 1446–53. doi:10.1016/j.apenergy.2013.03.040.
CE
UeT
DC
olle
ctio
n