measuring the price elasticity of import demand in the ... · 3 market power of italian exporters...
TRANSCRIPT

Measuring the price elasticity of import demandin the destination markets of Italian exports
Alberto Felettigh Stefano Federico
Banca d’Italia
November 24, 2009
Measuring the price elasticity of import demand (Alberto Felettigh, Stefano Federico) 1

Outline
Motivation and related literature
Basic idea
Methodology
Main results
Sectoral and geographical decomposition
Measuring the price elasticity of import demand (Alberto Felettigh, Stefano Federico) 2
Motivation
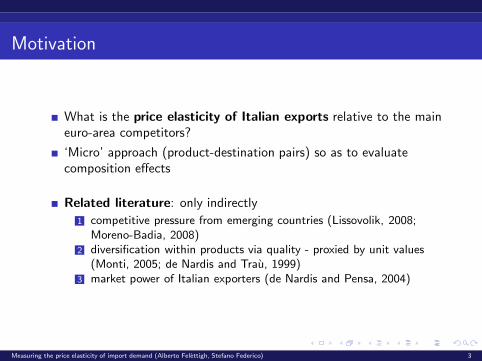
What is the price elasticity of Italian exports relative to the maineuro-area competitors?
‘Micro’ approach (product-destination pairs) so as to evaluatecomposition effects
Related literature: only indirectly
1 competitive pressure from emerging countries (Lissovolik, 2008;Moreno-Badia, 2008)
2 diversification within products via quality - proxied by unit values(Monti, 2005; de Nardis and Trau, 1999)
3 market power of Italian exporters (de Nardis and Pensa, 2004)
Measuring the price elasticity of import demand (Alberto Felettigh, Stefano Federico) 3
Basic idea - 1
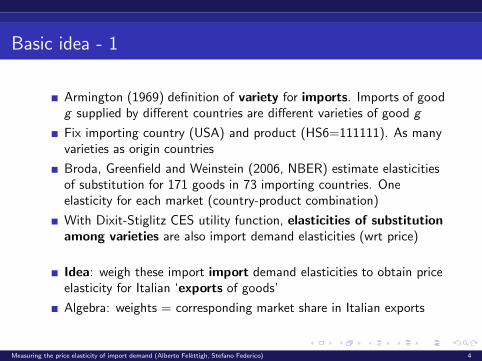
Armington (1969) definition of variety for imports. Imports of goodg supplied by different countries are different varieties of good g
Fix importing country (USA) and product (HS6=111111). As manyvarieties as origin countries
Broda, Greenfield and Weinstein (2006, NBER) estimate elasticitiesof substitution for 171 goods in 73 importing countries. Oneelasticity for each market (country-product combination)
With Dixit-Stiglitz CES utility function, elasticities of substitutionamong varieties are also import demand elasticities (wrt price)
Idea: weigh these import import demand elasticities to obtain priceelasticity for Italian ‘exports of goods’
Algebra: weights = corresponding market share in Italian exports
Measuring the price elasticity of import demand (Alberto Felettigh, Stefano Federico) 4
Basic idea - 2
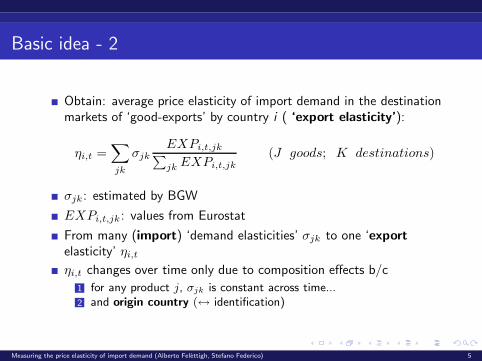
Obtain: average price elasticity of import demand in the destinationmarkets of ‘good-exports’ by country i ( ‘export elasticity’):
ηi,t =∑jk
σjkEXPi,t,jk∑jk EXPi,t,jk
(J goods; K destinations)
σjk: estimated by BGW
EXPi,t,jk: values from Eurostat
From many (import) ‘demand elasticities’ σjk to one ‘exportelasticity’ ηi,t
ηi,t changes over time only due to composition effects b/c
1 for any product j, σjk is constant across time...2 and origin country (↔ identification)
Measuring the price elasticity of import demand (Alberto Felettigh, Stefano Federico) 5
Preview of main findings
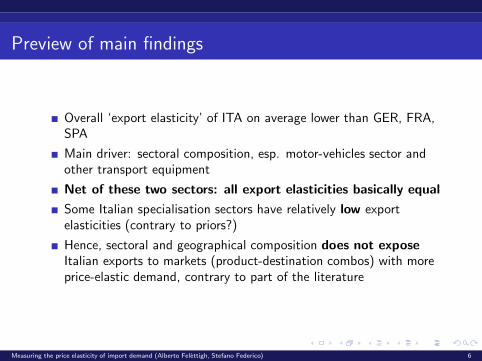
Overall ‘export elasticity’ of ITA on average lower than GER, FRA,SPA
Main driver: sectoral composition, esp. motor-vehicles sector andother transport equipment
Net of these two sectors: all export elasticities basically equal
Some Italian specialisation sectors have relatively low exportelasticities (contrary to priors?)
Hence, sectoral and geographical composition does not exposeItalian exports to markets (product-destination combos) with moreprice-elastic demand, contrary to part of the literature
Measuring the price elasticity of import demand (Alberto Felettigh, Stefano Federico) 6
Methodology: summary
Select importing country and pick one good at a time (all varietiesshare the same elasticity of substitution)
Utility from consuming imported good j is a CES function →demand function
Supply equation. From gravity models, not necessarily flat: elasticityconstant across supplying countries
Equilibrium: reduced-form equation
Feenstra (1994): use panel dimension of trade data to estimate.Between estimation, no need for IV (or, IVs are origin-countrydummy variables)
Consistency if demand and supply shocks are independent.Heteroskedasticity: weigh data
BGW: if estimated σj is not feasible (< 1), GMM usingorthogonality condition between error terms (grid-search procedure).Different weighting for heteroskedasticity
Measuring the price elasticity of import demand (Alberto Felettigh, Stefano Federico) 7
Data
σjk: estimated by BGW (‘something of an industry standard’ -Hummels et al., 2009)
1 Products defined at HS6 levels, but assumed that same σ withinsame HS3. 171 HS3’s
2 UN COMTRADE annual data 1994-2003. 73 countries. Value sharesand ‘prices’ (USD per ton)
Caveat: no intermediate products!? Add CES production function.Each good uniquely identified as final/intermediate provided HS3 orfiner
We trim σ’s to 30 (same results with 50). Mohler (2009)
Measuring the price elasticity of import demand (Alberto Felettigh, Stefano Federico) 8
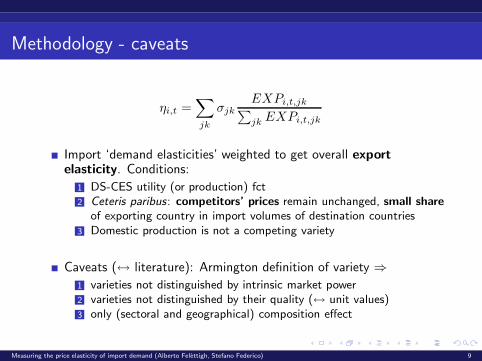
Methodology - caveats
ηi,t =∑jk
σjkEXPi,t,jk∑jk EXPi,t,jk
Import ‘demand elasticities’ weighted to get overall exportelasticity. Conditions:
1 DS-CES utility (or production) fct2 Ceteris paribus: competitors’ prices remain unchanged, small share
of exporting country in import volumes of destination countries3 Domestic production is not a competing variety
Caveats (↔ literature): Armington definition of variety ⇒1 varieties not distinguished by intrinsic market power2 varieties not distinguished by their quality (↔ unit values)3 only (sectoral and geographical) composition effect
Measuring the price elasticity of import demand (Alberto Felettigh, Stefano Federico) 9
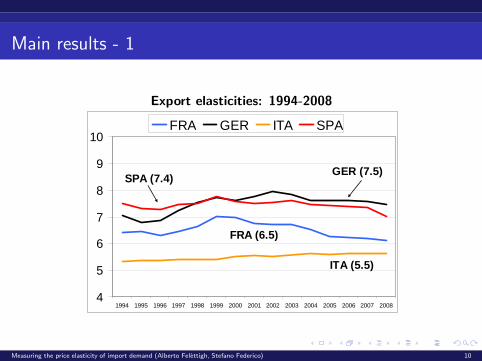
Main results - 1
Export elasticities: 1994-2008
FRA (6.5)
GER (7.5)
ITA (5.5)
SPA (7.4)
4
5
6
7
8
9
10
1994 1995 1996 1997 1998 1999 2000 2001 2002 2003 2004 2005 2006 2007 2008
FRA GER ITA SPA
Measuring the price elasticity of import demand (Alberto Felettigh, Stefano Federico) 10

Main results - 2
Italy is the country with the lowest export elasticity (5.5 onaverage in 1994-2008)
Very slight upward trend for Italy (from 5.3 in 1994 to 5.6 in 2008) -dynamics is only due to the varying composition of exports
Economic interpretation: price elasticity equal to 5.6 (Italy in 2008)implies a 22% mark-up over marginal costs
Consistent with evidence from INVIND (later...)
Measuring the price elasticity of import demand (Alberto Felettigh, Stefano Federico) 11
Sectoral and geographical decomposition
Contribution of sectors and destination countries to the overallexport elasticity
Time average 1994-2008
Sectoral elasticities: 171 HS3 products ⇒ 17 sectors (sectors inworld exports)
Geographical elasticities: 72 destination countries (no disaggregationby sector)
Measuring the price elasticity of import demand (Alberto Felettigh, Stefano Federico) 12
Sectoral decomposition - 1
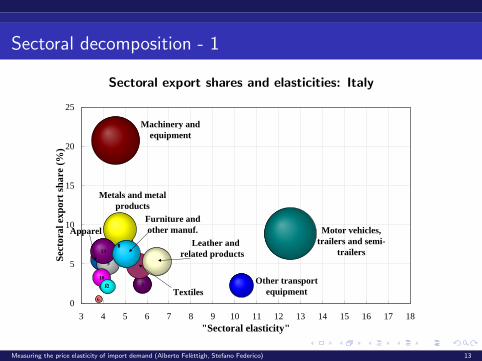
Sectoral export shares and elasticities: Italy
2
9
10
131
Textiles
Apparel Leather and
related products
6
7
8
Metals and metal products
12
Machinery and equipment
Motor vehicles, trailers and semi-
trailers
Other transport equipment
Furniture and other manuf.
0
5
10
15
20
25
3 4 5 6 7 8 9 10 11 12 13 14 15 16 17 18"Sectoral elasticity"
Sect
oral
exp
ort s
hare
(%)
Measuring the price elasticity of import demand (Alberto Felettigh, Stefano Federico) 13

Sectoral decomposition - 2
Sectoral export shares
% share on total exports
FRA GER ITA SPA
Agricultural, food, beverages and tobacco 10.8 5.1 7.3 15.4Textiles 1.9 1.9 4.7 2.4 Wearing apparel 1.8 1.5 5.6 2.1 Leather and related products 1.2 0.6 5.3 2.4 Chemical and pharmaceutical products 12.0 9.3 7.3 8.4Rubber and plastic products 4.6 4.9 5.0 5.3 Metals and metal products 7.0 8.4 9.4 8.7Electrical equipment 9.6 11.1 6.6 7.0 Machinery and equipment 14.0 19.7 20.7 9.1Motor vehicles, trailers and semi-trailers 12.5 21.4 8.8 23.7Furniture and other manufacturing 2.2 2.5 6.3 2.5 … … … … … TOTAL 100.0 100.0 100.0 100.0
Measuring the price elasticity of import demand (Alberto Felettigh, Stefano Federico) 14
Sectoral decomposition - 3
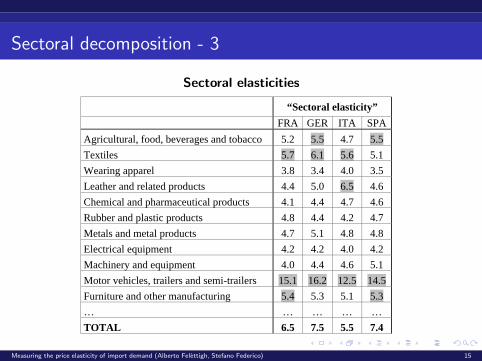
Sectoral elasticities
“Sectoral elasticity”
FRA GER ITA SPA
Agricultural, food, beverages and tobacco 5.2 5.5 4.7 5.5Textiles 5.7 6.1 5.6 5.1 Wearing apparel 3.8 3.4 4.0 3.5 Leather and related products 4.4 5.0 6.5 4.6 Chemical and pharmaceutical products 4.1 4.4 4.7 4.6 Rubber and plastic products 4.8 4.4 4.2 4.7 Metals and metal products 4.7 5.1 4.8 4.8 Electrical equipment 4.2 4.2 4.0 4.2 Machinery and equipment 4.0 4.4 4.6 5.1 Motor vehicles, trailers and semi-trailers 15.1 16.2 12.5 14.5Furniture and other manufacturing 5.4 5.3 5.1 5.3… … … … … TOTAL 6.5 7.5 5.5 7.4
Measuring the price elasticity of import demand (Alberto Felettigh, Stefano Federico) 15
Sectoral decomposition - 4
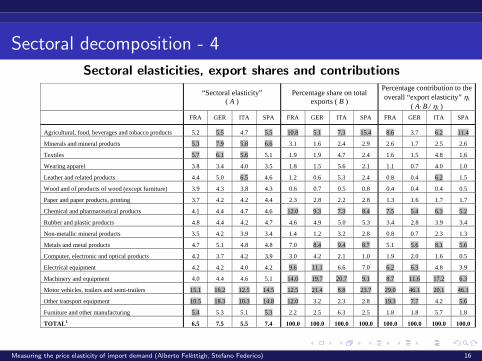
Sectoral elasticities, export shares and contributions
“Sectoral elasticity” ( A )
Percentage share on total exports ( B )
Percentage contribution to the overall “export elasticity” i
( A B / i )FRA GER ITA SPA FRA GER ITA SPA FRA GER ITA SPA
Agricultural, food, beverages and tobacco products 5.2 5.5 4.7 5.5 10.8 5.1 7.3 15.4 8.6 3.7 6.2 11.4
Minerals and mineral products 5.3 7.9 5.8 6.6 3.1 1.6 2.4 2.9 2.6 1.7 2.5 2.6
Textiles 5.7 6.1 5.6 5.1 1.9 1.9 4.7 2.4 1.6 1.5 4.8 1.6
Wearing apparel 3.8 3.4 4.0 3.5 1.8 1.5 5.6 2.1 1.1 0.7 4.0 1.0
Leather and related products 4.4 5.0 6.5 4.6 1.2 0.6 5.3 2.4 0.8 0.4 6.2 1.5
Wood and of products of wood (except furniture) 3.9 4.3 3.8 4.3 0.6 0.7 0.5 0.8 0.4 0.4 0.4 0.5
Paper and paper products, printing 3.7 4.2 4.2 4.4 2.3 2.8 2.2 2.8 1.3 1.6 1.7 1.7
Chemical and pharmaceutical products 4.1 4.4 4.7 4.6 12.0 9.3 7.3 8.4 7.5 5.4 6.3 5.2
Rubber and plastic products 4.8 4.4 4.2 4.7 4.6 4.9 5.0 5.3 3.4 2.8 3.9 3.4
Non-metallic mineral products 3.5 4.2 3.9 3.4 1.4 1.2 3.2 2.8 0.8 0.7 2.3 1.3
Metals and metal products 4.7 5.1 4.8 4.8 7.0 8.4 9.4 8.7 5.1 5.6 8.1 5.6
Computer, electronic and optical products 4.2 3.7 4.2 3.9 3.0 4.2 2.1 1.0 1.9 2.0 1.6 0.5
Electrical equipment 4.2 4.2 4.0 4.2 9.6 11.1 6.6 7.0 6.2 6.3 4.8 3.9
Machinery and equipment 4.0 4.4 4.6 5.1 14.0 19.7 20.7 9.1 8.7 11.6 17.2 6.3
Motor vehicles, trailers and semi-trailers 15.1 16.2 12.5 14.5 12.5 21.4 8.8 23.7 29.0 46.1 20.1 46.1
Other transport equipment 10.5 18.3 10.3 14.8 12.0 3.2 2.3 2.8 19.3 7.7 4.2 5.6
Furniture and other manufacturing 5.4 5.3 5.1 5.3 2.2 2.5 6.3 2.5 1.8 1.8 5.7 1.8
TOTAL1 6.5 7.5 5.5 7.4 100.0 100.0 100.0 100.0 100.0 100.0 100.0 100.0
Measuring the price elasticity of import demand (Alberto Felettigh, Stefano Federico) 16

Sectoral decomposition - 5
High elasticities for motor vehicles and other transport equipment
Technological intensity not clearly correlated with elasticities
Some of Italian specialisation industries show low elasticities
Consider overall export elasticity net of motor vehicles and othertransport equipment (4.7)
1 Above: leather product (6.5), textiles (5.6), furniture (5.1)2 Middle: machinery (4.6)3 Below: wearing apparel (4.0) and non-metallic mineral products
(tiles...; 3.9)
Broadly consistent with priors
Measuring the price elasticity of import demand (Alberto Felettigh, Stefano Federico) 17
Sectoral decomposition - 6
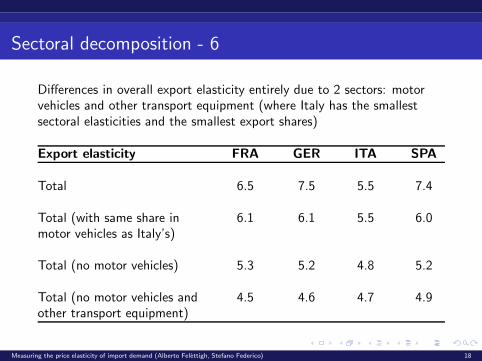
Differences in overall export elasticity entirely due to 2 sectors: motorvehicles and other transport equipment (where Italy has the smallestsectoral elasticities and the smallest export shares)
Export elasticity FRA GER ITA SPA
Total 6.5 7.5 5.5 7.4
Total (with same share in 6.1 6.1 5.5 6.0motor vehicles as Italy’s)
Total (no motor vehicles) 5.3 5.2 4.8 5.2
Total (no motor vehicles and 4.5 4.6 4.7 4.9other transport equipment)
Measuring the price elasticity of import demand (Alberto Felettigh, Stefano Federico) 18
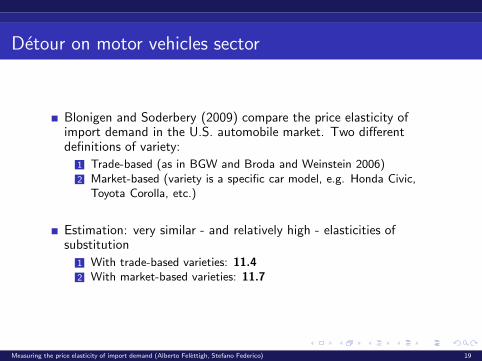
Detour on motor vehicles sector
Blonigen and Soderbery (2009) compare the price elasticity ofimport demand in the U.S. automobile market. Two differentdefinitions of variety:
1 Trade-based (as in BGW and Broda and Weinstein 2006)2 Market-based (variety is a specific car model, e.g. Honda Civic,
Toyota Corolla, etc.)
Estimation: very similar - and relatively high - elasticities ofsubstitution
1 With trade-based varieties: 11.42 With market-based varieties: 11.7
Measuring the price elasticity of import demand (Alberto Felettigh, Stefano Federico) 19
Detour: perceived elasticity (INVIND firms)
Measuring the price elasticity of import demand (Alberto Felettigh, Stefano Federico) 20

Detour on perceived elasticity - 1
In two waves of INVIND survey (1996 and 2007), firms were askedto report the (perceived) price elasticity of demand for their products
Hypothetically, assuming your firm raised its prices by 10% today,what percentage change would there be in turnover in nominalterms [...]?
Answers by about 900 firms in each year
Caveats:
1 Elasticity refers to total demand, i.e. the sum of foreign demand(exports) and domestic demand
2 Sample includes only firms with 50 employees or more3 Misreporting issues (sales increase by more than 10% in few cases)4 Sectors only available with a different aggregation wrt our analysis
Measuring the price elasticity of import demand (Alberto Felettigh, Stefano Federico) 21
Detour on perceived elasticity - 2
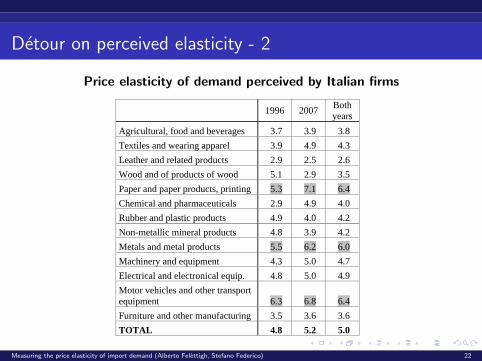
Price elasticity of demand perceived by Italian firms
1996 2007 Bothyears
Agricultural, food and beverages 3.7 3.9 3.8
Textiles and wearing apparel 3.9 4.9 4.3
Leather and related products 2.9 2.5 2.6
Wood and of products of wood 5.1 2.9 3.5
Paper and paper products, printing 5.3 7.1 6.4
Chemical and pharmaceuticals 2.9 4.9 4.0
Rubber and plastic products 4.9 4.0 4.2
Non-metallic mineral products 4.8 3.9 4.2
Metals and metal products 5.5 6.2 6.0
Machinery and equipment 4.3 5.0 4.7
Electrical and electronical equip. 4.8 5.0 4.9
Motor vehicles and other transport equipment 6.3 6.8 6.4
Furniture and other manufacturing 3.5 3.6 3.6
TOTAL 4.8 5.2 5.0
Measuring the price elasticity of import demand (Alberto Felettigh, Stefano Federico) 22
End of detour - Back to geographical elasticities
Measuring the price elasticity of import demand (Alberto Felettigh, Stefano Federico) 23
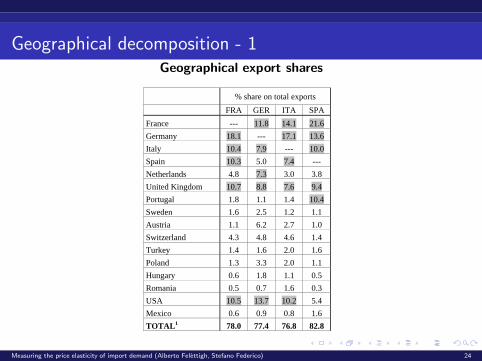
Geographical decomposition - 1Geographical export shares
% share on total exports
FRA GER ITA SPA
France --- 11.8 14.1 21.6
Germany 18.1 --- 17.1 13.6
Italy 10.4 7.9 --- 10.0
Spain 10.3 5.0 7.4 ---
Netherlands 4.8 7.3 3.0 3.8
United Kingdom 10.7 8.8 7.6 9.4
Portugal 1.8 1.1 1.4 10.4
Sweden 1.6 2.5 1.2 1.1
Austria 1.1 6.2 2.7 1.0
Switzerland 4.3 4.8 4.6 1.4
Turkey 1.4 1.6 2.0 1.6
Poland 1.3 3.3 2.0 1.1
Hungary 0.6 1.8 1.1 0.5
Romania 0.5 0.7 1.6 0.3
USA 10.5 13.7 10.2 5.4
Mexico 0.6 0.9 0.8 1.6
TOTAL1 78.0 77.4 76.8 82.8
Measuring the price elasticity of import demand (Alberto Felettigh, Stefano Federico) 24
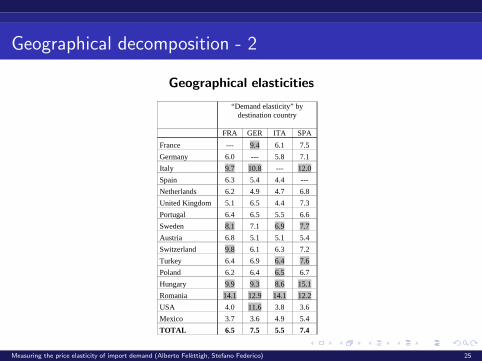
Geographical decomposition - 2
Geographical elasticities
“Demand elasticity” by destination country
FRA GER ITA SPA
France --- 9.4 6.1 7.5
Germany 6.0 --- 5.8 7.1
Italy 9.7 10.8 --- 12.0
Spain 6.3 5.4 4.4 ---
Netherlands 6.2 4.9 4.7 6.8
United Kingdom 5.1 6.5 4.4 7.3
Portugal 6.4 6.5 5.5 6.6
Sweden 8.1 7.1 6.9 7.7
Austria 6.8 5.1 5.1 5.4
Switzerland 9.8 6.1 6.3 7.2
Turkey 6.4 6.9 6.4 7.6
Poland 6.2 6.4 6.5 6.7
Hungary 9.9 9.3 8.6 15.1
Romania 14.1 12.9 14.1 12.2
USA 4.0 11.6 3.8 3.6
Mexico 3.7 3.6 4.9 5.4
TOTAL 6.5 7.5 5.5 7.4
Measuring the price elasticity of import demand (Alberto Felettigh, Stefano Federico) 25

Geographical decomposition - 3
Geographical elasticities, export shares and contributions
“Demand elasticity” by destination country
(A)
Percentage share on total exports ( B )
Percentage contribution to the overall “export
elasticity” i( A B / i )
FRA GER ITA SPA FRA GER ITA SPA FRA GER ITA SPA
France --- 9.4 6.1 7.5 --- 11.8 14.1 21.6 --- 14.8 15.7 21.8
Germany 6.0 --- 5.8 7.1 18.1 --- 17.1 13.6 16.7 --- 18.0 12.9
Italy 9.7 10.8 --- 12.0 10.4 7.9 --- 10.0 15.6 11.3 --- 16.1
Spain 6.3 5.4 4.4 --- 10.3 5.0 7.4 --- 10.0 3.6 5.9 ---
Netherlands 6.2 4.9 4.7 6.8 4.8 7.3 3.0 3.8 4.5 4.7 2.5 3.5
United Kingdom 5.1 6.5 4.4 7.3 10.7 8.8 7.6 9.4 8.4 7.6 6.0 9.2
Portugal 6.4 6.5 5.5 6.6 1.8 1.1 1.4 10.4 1.7 0.9 1.4 9.3
Sweden 8.1 7.1 6.9 7.7 1.6 2.5 1.2 1.1 1.9 2.3 1.5 1.1
Austria 6.8 5.1 5.1 5.4 1.1 6.2 2.7 1.0 1.2 4.2 2.5 0.7
Switzerland 9.8 6.1 6.3 7.2 4.3 4.8 4.6 1.4 6.5 3.9 5.3 1.3
Turkey 6.4 6.9 6.4 7.6 1.4 1.6 2.0 1.6 1.4 1.5 2.3 1.6
Poland 6.2 6.4 6.5 6.7 1.3 3.3 2.0 1.1 1.3 2.8 2.4 1.0
Hungary 9.9 9.3 8.6 15.1 0.6 1.8 1.1 0.5 0.9 2.2 1.7 1.1
Romania 14.1 12.9 14.1 12.2 0.5 0.7 1.6 0.3 1.1 1.3 4.0 0.5
USA 4.0 11.6 3.8 3.6 10.5 13.7 10.2 5.4 6.4 21.0 6.9 2.6
Mexico 3.7 3.6 4.9 5.4 0.6 0.9 0.8 1.6 0.3 0.4 0.7 1.2
TOTAL1 6.5 7.5 5.5 7.4 78.0 77.4 76.8 82.8 77.9 82.5 76.8 83.9
Measuring the price elasticity of import demand (Alberto Felettigh, Stefano Federico) 26
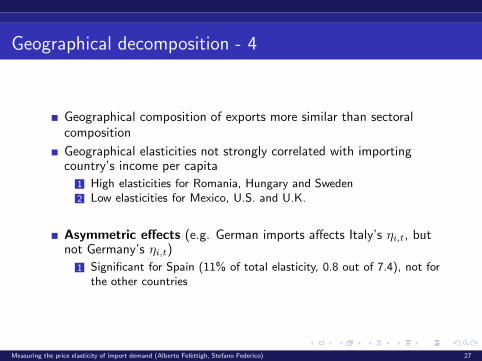
Geographical decomposition - 4
Geographical composition of exports more similar than sectoralcomposition
Geographical elasticities not strongly correlated with importingcountry’s income per capita
1 High elasticities for Romania, Hungary and Sweden2 Low elasticities for Mexico, U.S. and U.K.
Asymmetric effects (e.g. German imports affects Italy’s ηi,t, butnot Germany’s ηi,t)
1 Significant for Spain (11% of total elasticity, 0.8 out of 7.4), not forthe other countries
Measuring the price elasticity of import demand (Alberto Felettigh, Stefano Federico) 27
Conclusions
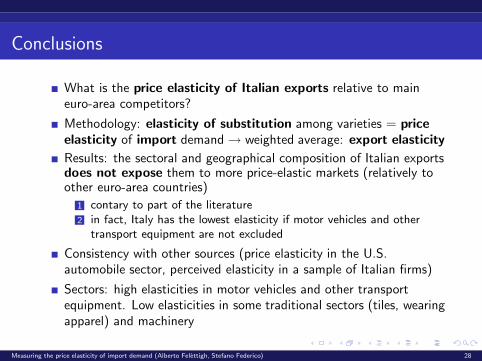
What is the price elasticity of Italian exports relative to maineuro-area competitors?
Methodology: elasticity of substitution among varieties = priceelasticity of import demand → weighted average: export elasticity
Results: the sectoral and geographical composition of Italian exportsdoes not expose them to more price-elastic markets (relatively toother euro-area countries)
1 contary to part of the literature2 in fact, Italy has the lowest elasticity if motor vehicles and other
transport equipment are not excluded
Consistency with other sources (price elasticity in the U.S.automobile sector, perceived elasticity in a sample of Italian firms)
Sectors: high elasticities in motor vehicles and other transportequipment. Low elasticities in some traditional sectors (tiles, wearingapparel) and machinery
Measuring the price elasticity of import demand (Alberto Felettigh, Stefano Federico) 28

Thank you for your attention
Measuring the price elasticity of import demand (Alberto Felettigh, Stefano Federico) 29

Extra slides in case of need
Extra slides in case of need
Measuring the price elasticity of import demand (Alberto Felettigh, Stefano Federico) 30

Methodology - estimating the σ’s - 1
Utility from consuming imported good j is a CES function of d(taste parameter) and m (imports of variety c of good j)
Mjt =
(∑c∈C
d1
σj
jctm
σj−1σj
jct
) σjσj−1
Demand equation for imports of variety c of good j (in nominalterms):
Δ ln sjct = ϕjt − (σj − 1)Δ ln pjct + εjct
Supply equation. From gravity models, not necessarily flat (ωj > 0,but constant across supplying countries):
Δ ln pjct = ψjt +ωj
1 + ωjΔ ln sjct + δjct
Measuring the price elasticity of import demand (Alberto Felettigh, Stefano Federico) 31
Methodology - estimating the σ’s - 2
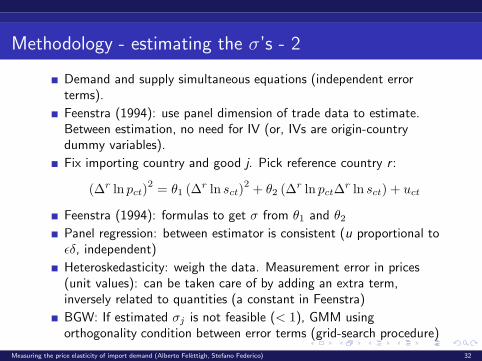
Demand and supply simultaneous equations (independent errorterms).
Feenstra (1994): use panel dimension of trade data to estimate.Between estimation, no need for IV (or, IVs are origin-countrydummy variables).
Fix importing country and good j. Pick reference country r :
(Δr ln pct)2 = θ1 (Δr ln sct)
2 + θ2 (Δr ln pctΔr ln sct) + uct
Feenstra (1994): formulas to get σ from θ1 and θ2Panel regression: between estimator is consistent (u proportional toεδ, independent)
Heteroskedasticity: weigh the data. Measurement error in prices(unit values): can be taken care of by adding an extra term,inversely related to quantities (a constant in Feenstra)
BGW: If estimated σj is not feasible (< 1), GMM usingorthogonality condition between error terms (grid-search procedure)
Measuring the price elasticity of import demand (Alberto Felettigh, Stefano Federico) 32
Robustness - 1
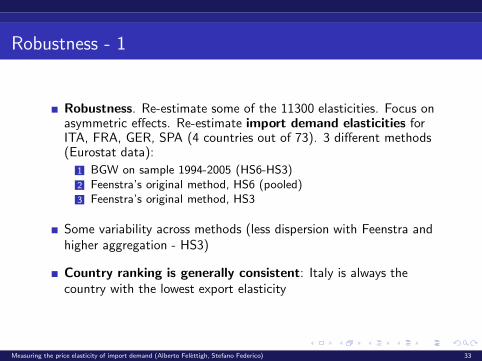
Robustness. Re-estimate some of the 11300 elasticities. Focus onasymmetric effects. Re-estimate import demand elasticities forITA, FRA, GER, SPA (4 countries out of 73). 3 different methods(Eurostat data):
1 BGW on sample 1994-2005 (HS6-HS3)2 Feenstra’s original method, HS6 (pooled)3 Feenstra’s original method, HS3
Some variability across methods (less dispersion with Feenstra andhigher aggregation - HS3)
Country ranking is generally consistent: Italy is always thecountry with the lowest export elasticity
Measuring the price elasticity of import demand (Alberto Felettigh, Stefano Federico) 33

Robustness - 2
Export elasticities: 1994-20081.A : BGW elasticities
4
5
6
7
8
9
10
1994 1995 1996 1997 1998 1999 2000 2001 2002 2003 2004 2005 2006 2007 2008
FRA GER ITA SPA
1.B : BGW_9405 elasticities
4
5
6
7
8
9
10
1994 1995 1996 1997 1998 1999 2000 2001 2002 2003 2004 2005 2006 2007 2008
FRA GER ITA SPA
1.C : Feenstra_HS6 elasticities
4
5
6
7
8
9
10
1994 1995 1996 1997 1998 1999 2000 2001 2002 2003 2004 2005 2006 2007 2008
FRA GER ITA SPA
1.D : Feenstra_HS3 elasticities
4
5
6
7
8
9
10
1994 1995 1996 1997 1998 1999 2000 2001 2002 2003 2004 2005 2006 2007 2008
FRA GER ITA SPA
Measuring the price elasticity of import demand (Alberto Felettigh, Stefano Federico) 34
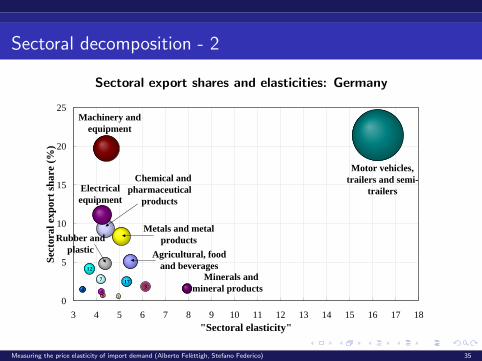
Sectoral decomposition - 2
Sectoral export shares and elasticities: Germany
4 10
12
17
Agricultural, food and beverages
Minerals and mineral products3
56
7
Chemical and pharmaceutical
products
Rubber and plastic
Metals and metal products
Electricalequipment
Machinery and equipment
Motor vehicles, trailers and semi-
trailers
0
5
10
15
20
25
3 4 5 6 7 8 9 10 11 12 13 14 15 16 17 18"Sectoral elasticity"
Sect
oral
exp
ort s
hare
(%)
Measuring the price elasticity of import demand (Alberto Felettigh, Stefano Federico) 35