measuring the invisible - world resources...
TRANSCRIPT

Measuring the invisibleQuantifying eMissions reductions
froM transport solutions
porto alegre case study
Authors Maria cordeiro bianca focante
March 2008
Center forSustainable Transport

WRI: MeasuRIng the InvIsIble
ii
Joan o’callaghanEDItor
hyacinth billingsPuBLICAtIoNs DIrECtor
Maggie poWellLAYout
each World Resources Institute report represents a timely, scholarly treatment of a subject of public concern. WRI takes responsibility for choosing the study topics and guaranteeing its authors and researchers freedom of inquiry. It also solicits and
responds to the guidance of advisory panels and expert reviewers. unless otherwise stated, however, all the interpretation and findings set forth in WRI publications are those of the authors.
Copyright © 2008 World Resources Institute. all rights reserved.

WRI: MeasuRIng the InvIsIble
iii
table of contents
acknowledgments ..................................................................................................... iv
executive summary .................................................................................................... 1
1. Introduction ........................................................................................................... 3
2. Porto alegre: setting the stage ............................................................................. 4Location, population, and economy ......................................................................... 4
Environmental management ................................................................................... 4
transportation management ................................................................................... 7
3. study Methodology .............................................................................................. 11transport scenarios ................................................................................................ 11
Emission factors..................................................................................................... 12
4. Results: environmental Performance of transport solutions .......................... 14Improving the transport system ............................................................................. 14
Alternative-fuel, vehicle, and emission control technologies ................................... 17
5. Conclusions.......................................................................................................... 21
appendix: emissions Data from scenario analysis ........................................... 22
References ................................................................................................................. 25
WRI, EMBARQ and CTS-brasil .......................................................................... 26

WRI: MeasuRIng the InvIsIble
iv
acknoWledgMents
this study was made possible by the generous sup-port of the american people through the united states agency for International Development
(usaID). this study also received support from the neth-erlands Ministry of Foreign affairs. the contents are the responsibility of the authors and do not necessarily reflect the views of usaID or the united states government or the netherlands Ministry of Foreign affairs.
this study greatly benefited from the valuable collabo-ration of various participants. eMbaRQ worked closely with the Center for sustainable transport of brazil and south america (Cts-brasil); received information sup-port from Porto alegre’s Public Corporation for transpor-tation and transit (ePtC - empresa Pública de transporte e Circulação); Rio grande do sul state Foundation for environment Protection (FePaM - Fundação estadual de Proteção ambiental henrique luís Roessler); Porto alegre’s Municipal secretariat of the administration
(sMa - secretaria Municipal de administração); and são Paulo’s Company for technology and environment sani-tation (Cetesb - Companhia de tecnologia de sanea-mento ambiental).
the authors are grateful for the reviews and valuable input from lee schipper (eMbaRQ,WRI/berkeley); taryn Fransen (ghg Protocol Initiative, WRI); Madhav Pai (eMbaRQ, WRI); hilda Martínez (Cts-Mexico). We would also like to acknowledge the work of allen hammond and Jennie hommel for overseeing and coordinating the review process, respectively; Joan O’Callaghan for editing and Maggie Powell for provid-ing the layout of this report. the authors dedicate a special thank you to toni lindau and Daniela Facchini (Cts-brasil), Dario hidalgo and adriana lacerda (eM-baRQ, WRI), for their support throughout this study; and to tim herzog and lauriane boisrobert (WRI) for their valuable contributions.
WRI: MeasuRIng the InvIsIble
1
executive suMMary
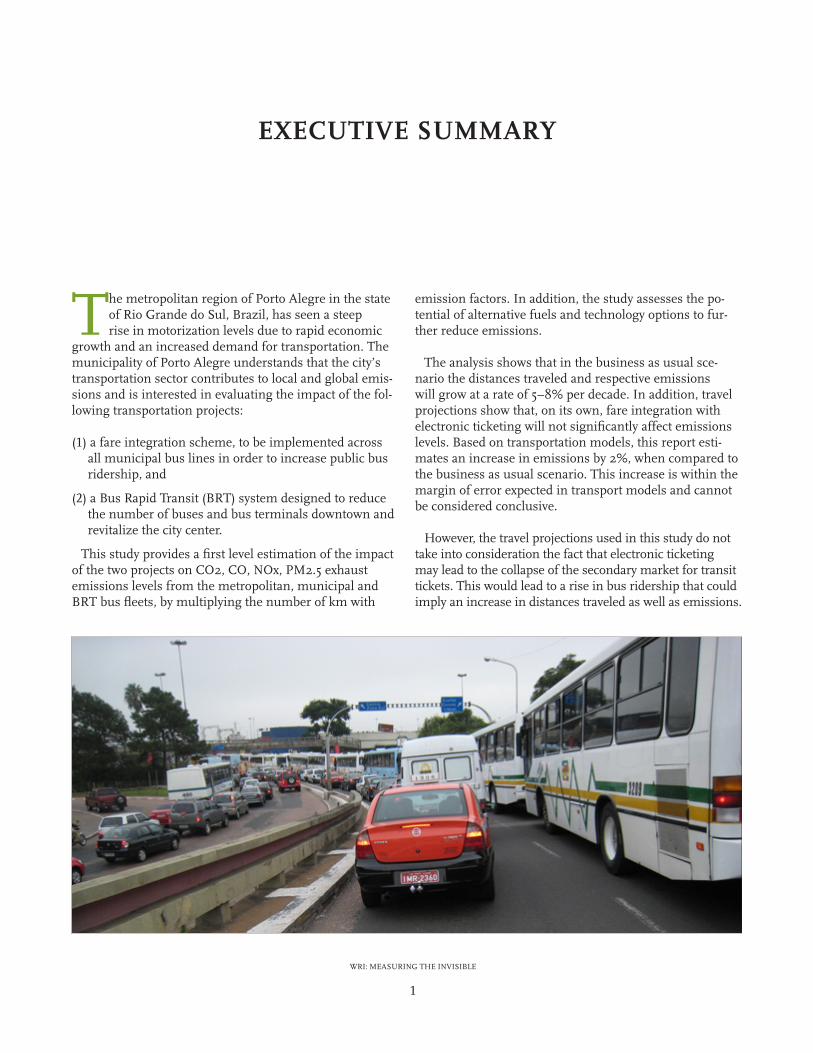
the metropolitan region of Porto alegre in the state of Rio grande do sul, brazil, has seen a steep rise in motorization levels due to rapid economic
growth and an increased demand for transportation. the municipality of Porto alegre understands that the city’s transportation sector contributes to local and global emis-sions and is interested in evaluating the impact of the fol-lowing transportation projects:
(1) a fare integration scheme, to be implemented across all municipal bus lines in order to increase public bus ridership, and
(2) a bus Rapid transit (bRt) system designed to reduce the number of buses and bus terminals downtown and revitalize the city center.
this study provides a first level estimation of the impact of the two projects on CO2, CO, nOx, PM2.5 exhaust emissions levels from the metropolitan, municipal and bRt bus fleets, by multiplying the number of km with
emission factors. In addition, the study assesses the po-tential of alternative fuels and technology options to fur-ther reduce emissions.
the analysis shows that in the business as usual sce-nario the distances traveled and respective emissions will grow at a rate of 5–8% per decade. In addition, travel projections show that, on its own, fare integration with electronic ticketing will not significantly affect emissions levels. based on transportation models, this report esti-mates an increase in emissions by 2%, when compared to the business as usual scenario. this increase is within the margin of error expected in transport models and cannot be considered conclusive.
however, the travel projections used in this study do not take into consideration the fact that electronic ticketing may lead to the collapse of the secondary market for transit tickets. this would lead to a rise in bus ridership that could imply an increase in distances traveled as well as emissions.

WRI: MeasuRIng the InvIsIble
2
In any event, the integration of the fare system in Porto alegre has been claimed to be an essential step towards bus service improvements such as the bRt.
this study shows that the bRt planned for Porto alegre will reduce emissions by cutting the distances traveled and improving the fleet’s driving cycle. CO2 emissions will de-crease by 8–9%, or 25,129–31,529 tons per year, in compari-son to the business as usual scenario with fare integration.
We should note that there is a link between the imple-mentation of the bRt system with fare integration and a reduction in walking times, indicating a modal shift from walking to bus use. this suggests that measures should be implemented to enhance the attractiveness of non-motor-ized transportation, such as improving public spaces for pedestrians and integrating the bus system with bicycling networks.
there is no information on the expected modal shift from cars to the bus system. a brief analysis shows that if 1% of the bus passengers previously traveled by car, an additional 710– 836 kg of CO2 emissions per year could be avoided as a result. this, together with the need to ad-dress the increasing rate of motorization, is a good reason for implementing traffic demand management measures, such as parking restrictions, congestion charging, that en-courage modal shift from cars to buses.
Diesel oxidation catalysts (DOCs) can operate with fuel of higher sulphur content, but reduce particulate matter to a lesser extent than DPFs. DOCs reduce smoke and odor, as well as some toxic pollutants, but cannot remove the fine particles that pose severe health threats.
to reduce bus emissions further there are a number of alternative fuels, as well as vehicle and emission control technologies that are commercially available and that can be combined to maximize benefits.
Increasing the emission standards of the vehicles is an effective way to reduce local pollutant emissions from bus fleets. there is opportunity for upgrading Porto alegre’s municipal bus fleet that currently portrays euro 0 to euro 3 vehicles. hybrid vehicles can also be considered as they are particularly efficient in city environments.
In addition, new heavy-duty diesel vehicles can be dra-matically cleaner when using a combination of ultra-low-sulfur diesel and particle filters (DPFs). Currently, the diesel available in Porto alegre contains 500 parts per mil-lion (ppm) of sulfur. the situation is expected to change in 2009, with the introduction of diesel with 50ppm sulfur content in the fuel mix as result of resolution 315/02 and federal law 8.723/93.
biofuels receive mixed reviews on their potential to re-duce ghg emissions due to the carbon debt from land use changes associated with their production. In fact, they score higher points when analyzing their impact on local pollution at the point of consumption.
the use of compressed natural gas reduces carbon monoxide, nitrogen oxides, and particulate emissions, while significantly increasing hydrocarbon emissions and, depending on the system’s leakage levels, ghg emissions.
this study concludes that bRt is an effective solution to reduce both local and global pollutant emissions from Porto alegre’s transport system while the implementation of the fare integration, with electronic ticketing, may on its own increase emission levels. the benefits from these interventions can be enhanced if complemented with measures that promote modal shift from private cars to buses and that encourage the use of non-motorized trans-portation. this study recommends the development of a cost-benefit analysis and feasibility study for the use of cleaner fuels, vehicle and emission control technologies, to further reduce emissions.
WRI: MeasuRIng the InvIsIble
3
1
introduction
all over the world, transportation projects are chang-ing how people and goods move, with direct and indirect impacts on global and local air pollutant
emissions. an increasing body of evidence points to the significance of the adverse effects of transportation emis-sions on air quality, human health, and climate change. to mitigate the adverse impacts from the transportation sector, transport and environment government officials, investors, and other stakeholders need information on the magnitude of emissions from transport interventions. In many cases, this quantification has become a requirement to obtain political, financial, and public support for trans-portation projects.
the rapid economic growth and increase in transporta-tion demand in the metropolitan region of Porto alegre, in the state of Rio grande do sul, brazil, have led to a steep rise in motorization levels. the environment of Porto alegre’s city center and health of its citizens are compromised by the numerous bus terminals along im-portant arterials, where buses are kept idling in confined areas surrounded by tall buildings. the municipality of Porto alegre is planning to increase bus ridership by im-plementing fare integration in the metropolitan and urban lines system, and to reduce the number of buses and ter-minals downtown by implementing a bRt system.
the interest of the government authorities in reducing local and global emissions through transport measures has been mounting. With the goal of empowering stake-holders with the necessary information to incorporate en-vironmental and health considerations into the decision-making process, the present study provides a first level estimation of the impact of the planned interventions. In addition, it looks at current literature to assess the poten-tial of alternative fuel and technology options for reducing emissions. this analysis supplements other information sources and analyses, such as air quality monitoring net-works, emissions inventories, exposure assessments, life-cycle assessments, and cost-benefit analyses.
this study examines the direct impacts from changes in centrally managed fleets and it does not include indirect emissions resulting from effects on cars or modal shift. the focus of this study is on emissions from fuel combus-tion processes, and does not include evaporative losses or the full life-cycle impacts of vehicles, fuels, and infra-structure. the analysis covers the most significant criteria pollutants and greenhouse gases emitted from on-road mobile sources: nitrogen oxides (nOx), carbon monoxide (CO), particulate matter (PM); and carbon dioxide (CO2).
this report is organized as follows:
section 1 – introduction. this section provides the background, objectives, and scope for this project.
section 2 – porto alegre: setting the stage. this section describes the current situation and trends in demography, economy, transport, and air quality in the region and municipality of Porto alegre.
section 3 – study Methodology. this section presents the transport interventions planned for Porto alegre and describes the methods, assumptions, and data sources used to estimate their impacts on local and global emissions.
section 4 – results: environmental performance of transport solutions. this section presents and discusses the results from this study, providing a comparison of the impacts on emissions of the fare integration, bRt system, and introduction of cleaner fuels and technologies.
section 5 – conclusions. this section presents the conclusions and recommendations for decision making in Porto alegre.
WRI: MeasuRIng the InvIsIble
4
2
porto alegre: setting the stage
location, population, and econoMy
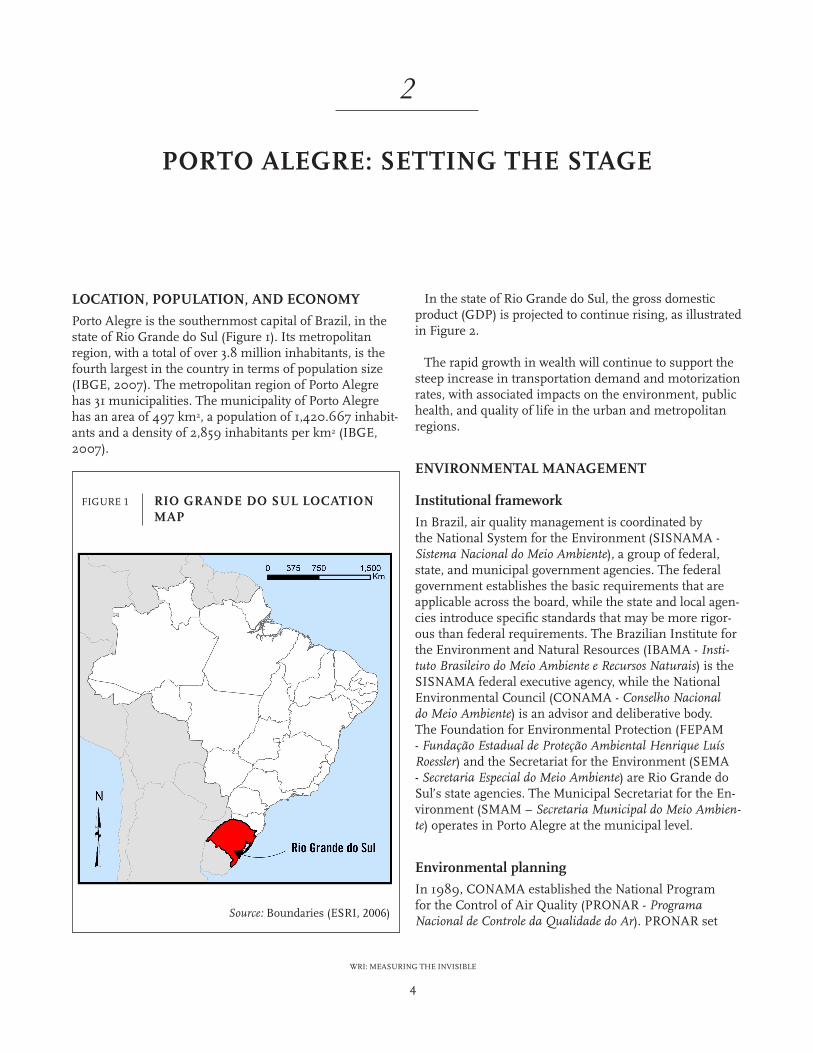
Porto alegre is the southernmost capital of brazil, in the state of Rio grande do sul (Figure 1). Its metropolitan region, with a total of over 3.8 million inhabitants, is the fourth largest in the country in terms of population size (Ibge, 2007). the metropolitan region of Porto alegre has 31 municipalities. the municipality of Porto alegre has an area of 497 km2, a population of 1,420.667 inhabit-ants and a density of 2,859 inhabitants per km2 (Ibge, 2007).
In the state of Rio grande do sul, the gross domestic product (gDP) is projected to continue rising, as illustrated in Figure 2.
the rapid growth in wealth will continue to support the steep increase in transportation demand and motorization rates, with associated impacts on the environment, public health, and quality of life in the urban and metropolitan regions.
environMental ManageMent
institutional framework
In brazil, air quality management is coordinated by the national system for the environment (sIsnaMa - sistema Nacional do Meio Ambiente), a group of federal, state, and municipal government agencies. the federal government establishes the basic requirements that are applicable across the board, while the state and local agen-cies introduce specific standards that may be more rigor-ous than federal requirements. the brazilian Institute for the environment and natural Resources (IbaMa - Insti-tuto Brasileiro do Meio Ambiente e recursos Naturais) is the sIsnaMa federal executive agency, while the national environmental Council (COnaMa - Conselho Nacional do Meio Ambiente) is an advisor and deliberative body. the Foundation for environmental Protection (FePaM - Fundação Estadual de Proteção Ambiental henrique Luís roessler) and the secretariat for the environment (seMa - secretaria Especial do Meio Ambiente) are Rio grande do sul’s state agencies. the Municipal secretariat for the en-vironment (sMaM – secretaria Municipal do Meio Ambien-te) operates in Porto alegre at the municipal level.
environmental planning
In 1989, COnaMa established the national Program for the Control of air Quality (PROnaR - Programa Nacional de Controle da Qualidade do Ar). PROnaR set

WRI: MeasuRIng the InvIsIble
5
maximum emission limits for stationary sources, based on area usage, and set nation air quality standards (pri-mary standards - maximum tolerable concentration levels; and secondary standards - below which the impact is minimum) to reduce the negative effects of atmospheric pollution nationwide. In 1990, COnaMa issued new air pollutant emission standards (resolution 003/1990) and determined that states are responsible for establishing air monitoring programs, air quality standards, and emer-gency plans for critical episodes of air pollution.
In 1986, COnaMa established the Program for the Control of air Pollution from Mobile sources (PRO-COnve - Programa de Controle de Poluição do Ar por Veículos Automotores), which defines maximum emission limits for light-duty passenger and commercial vehicles and for heavy-duty vehicles (buses and trucks). emission limits and certification test cycles in brazil are based on european union regulations. PROCOnve had several implementation phases. the first set of vehicle emission regulations, adopted in 1993 (COnaMa 8/93), was based on euro 0/2 standards. the second set of emission stan-dards, adopted in 2002 with implementation dates over 2006–2009 (Resolution 315, October 29, 2002), are based on euro 3/4 standards.
PROCOnve is focused on reducing emissions from new vehicles, affecting manufacturers and importers only.
Manufacturers provide instructions to consumers on how to maintain low levels of emissions from their vehicles. however, there is no assurance that the vehicle owners fol-low those instructions. With that in mind, COnaMa has defined general guidelines for implementing inspection and maintenance (I/M) programs by state and municipal environment agencies. the new brazilian national transit code, once fully implemented, requires that vehicles be li-censed only if approved in I/M programs that verify pollut-ant emissions and noise levels. In 1992, vehicle manufac-turers added catalytic converters to new vehicles; in 1997, vehicle manufacturers added electronic fuel injections and exhaust gas recirculation valves, oxygen sensors, high-en-ergy ignition, secondary-air injection, and canisters. even though PROCOnve has been a very successful program, the growth of the vehicle fleet has made transportation the main contributor of emissions in brazil’s metropolitan regions.
Climate change is being addressed at the national level by the national Plan for Climate Change (Plano Nacional de Mudanças Climáticas), pending its inauguration in 2009. In October 2007, the municipality of Porto alegre approved the Program for Reduction of Carbon Dioxide emissions (Programa de Prevenção, redução e Compensação de emissões de Dióxido de Carbono), which includes provi-sions for improving passenger public transportation.
WRI: MeasuRIng the InvIsIble
6
air quality monitoring
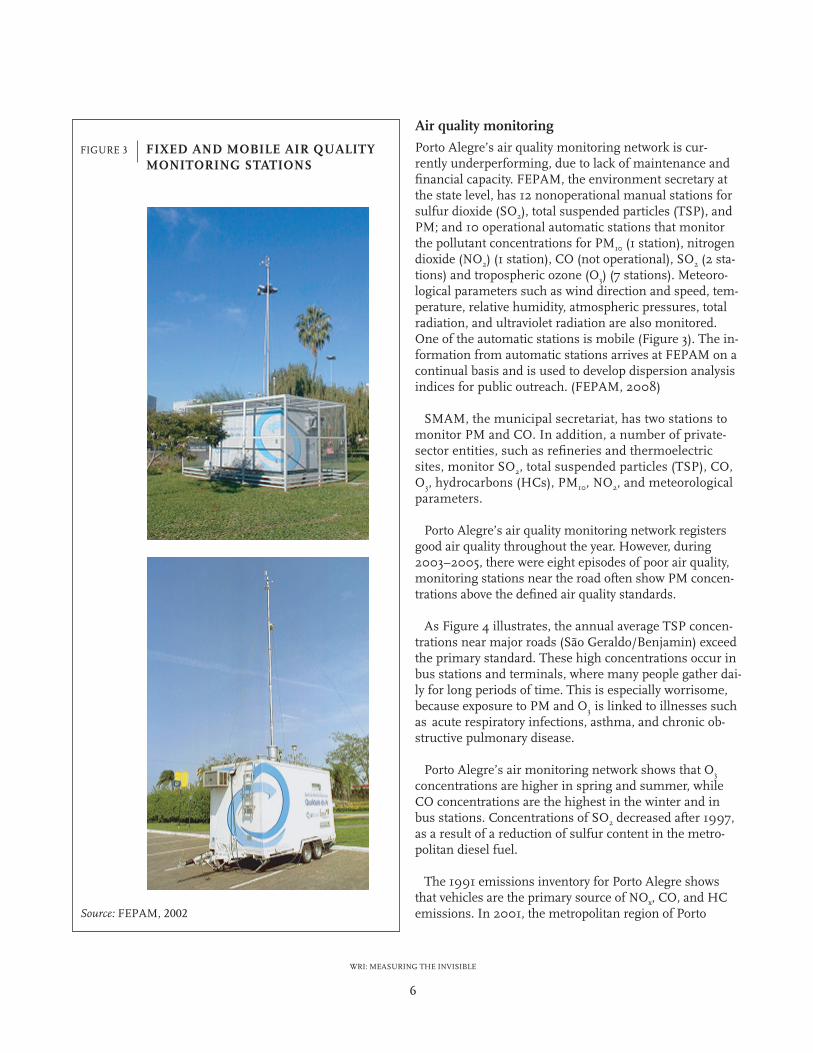
Porto alegre’s air quality monitoring network is cur-rently underperforming, due to lack of maintenance and financial capacity. FePaM, the environment secretary at the state level, has 12 nonoperational manual stations for sulfur dioxide (sO2), total suspended particles (tsP), and PM; and 10 operational automatic stations that monitor the pollutant concentrations for PM10 (1 station), nitrogen dioxide (nO2) (1 station), CO (not operational), sO2 (2 sta-tions) and tropospheric ozone (O3) (7 stations). Meteoro-logical parameters such as wind direction and speed, tem-perature, relative humidity, atmospheric pressures, total radiation, and ultraviolet radiation are also monitored. One of the automatic stations is mobile (Figure 3). the in-formation from automatic stations arrives at FePaM on a continual basis and is used to develop dispersion analysis indices for public outreach. (FePaM, 2008)
sMaM, the municipal secretariat, has two stations to monitor PM and CO. In addition, a number of private-sector entities, such as refineries and thermoelectric sites, monitor sO2, total suspended particles (tsP), CO, O3, hydrocarbons (hCs), PM10, nO2, and meteorological parameters.
Porto alegre’s air quality monitoring network registers good air quality throughout the year. however, during 2003–2005, there were eight episodes of poor air quality, monitoring stations near the road often show PM concen-trations above the defined air quality standards.
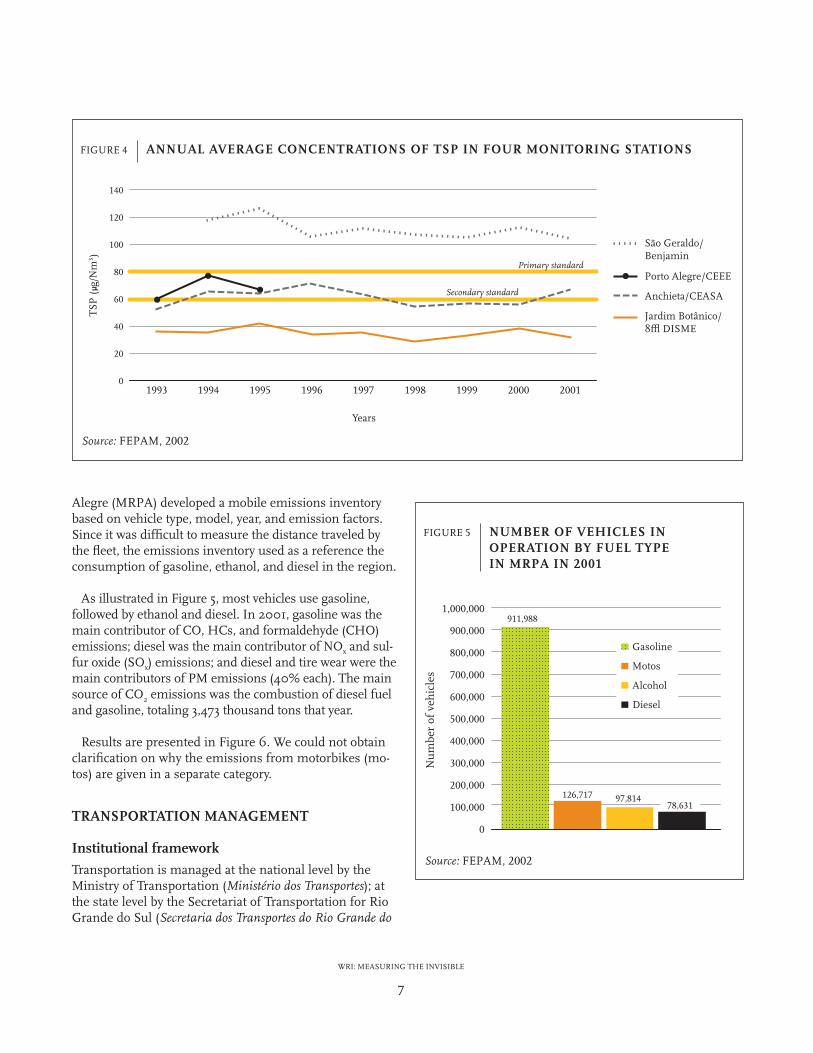
as Figure 4 illustrates, the annual average tsP concen-trations near major roads (são geraldo/benjamin) exceed the primary standard. these high concentrations occur in bus stations and terminals, where many people gather dai-ly for long periods of time. this is especially worrisome, because exposure to PM and O3 is linked to illnesses such as acute respiratory infections, asthma, and chronic ob-structive pulmonary disease.
Porto alegre’s air monitoring network shows that O3 concentrations are higher in spring and summer, while CO concentrations are the highest in the winter and in bus stations. Concentrations of sO2 decreased after 1997, as a result of a reduction of sulfur content in the metro-politan diesel fuel.
the 1991 emissions inventory for Porto alegre shows that vehicles are the primary source of nOx, CO, and hC emissions. In 2001, the metropolitan region of Porto
WRI: MeasuRIng the InvIsIble
7
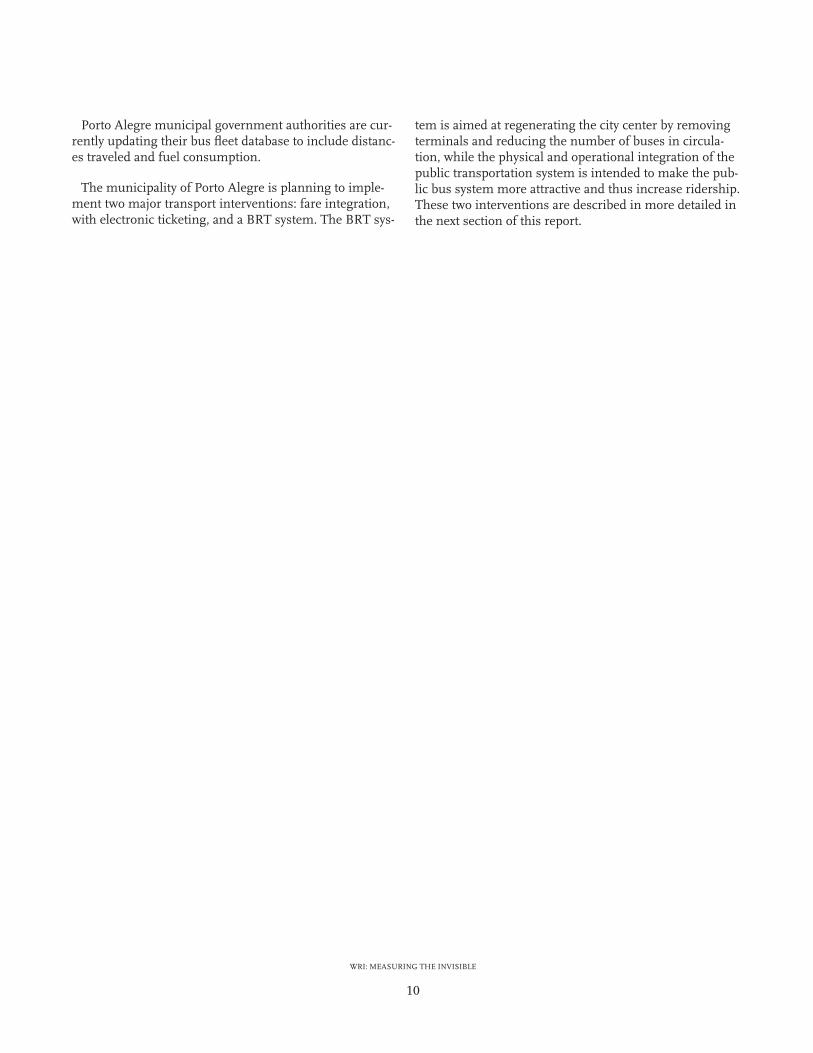
alegre (MRPa) developed a mobile emissions inventory based on vehicle type, model, year, and emission factors. since it was difficult to measure the distance traveled by the fleet, the emissions inventory used as a reference the consumption of gasoline, ethanol, and diesel in the region.
as illustrated in Figure 5, most vehicles use gasoline, followed by ethanol and diesel. In 2001, gasoline was the main contributor of CO, hCs, and formaldehyde (ChO) emissions; diesel was the main contributor of nOx and sul-fur oxide (sOx) emissions; and diesel and tire wear were the main contributors of PM emissions (40% each). the main source of CO2 emissions was the combustion of diesel fuel and gasoline, totaling 3,473 thousand tons that year.
Results are presented in Figure 6. We could not obtain clarification on why the emissions from motorbikes (mo-tos) are given in a separate category.
transportation ManageMent
institutional framework
transportation is managed at the national level by the Ministry of transportation (Ministério dos transportes); at the state level by the secretariat of transportation for Rio grande do sul (secretaria dos transportes do rio Grande do

WRI: MeasuRIng the InvIsIble
8
sul); at the metropolitan level by the Foundation for Met-ropolitan and Regional Planning (Metroplan - Fundação Estadual de Planejamento Metropolitano e regional); and at municipal level by the Public Corporation for transporta-tion and transit (ePtC - Empresa Pública de transportes e Circulação).
transportation planning
the national Plan for transport and logistics (Pnlt - Plano nacional de logística e transportes 2008-2013), released in april 2007, provides the strategic direction at national level for the transportation sector. the Pnlt es-tablishes the goal of increasing rail transport from 25% to 32% and maritime transport from 13% to 29%, in 15–20 years. Road freight would be reduced from the current 58% to 33%.
several plans influence the transport system in Porto alegre. the Public transportation Master Plan of 2000 (PDstC - Plano Diretor setorial de transporte Coletivo) calls for the expansion of the transversal bus network and the physical and operational integration of the public trans-portation system, through terminals and electronic pay-ment of tariffs.
the Integrated Plan for transportation and urban Mo-bility of Porto alegre Metropolitan Region (PItMurb – Plano Integrado de transporte e Mobilidade urbana da Região Metropolitana de Porto alegre) proposes the devel-opment of an integrated transit network in the Metropoli-tan Region of Porto alegre, by 2033. the integrated transit network planned is comprised of a circular metro line with 37,4km length (extending northwards the existing suburban train line by 9,3km), and of bus corridors with 199,5km length. Furthermore, the plan foresees the use of an electronic fare system, of stations with integrated trans-port modes (8 metro/bus and 7 bus/bus) and of a rational-ized operational system.
transportation demand and supply
In 2002, 3.4 million motor vehicles were registered in the state of Rio grande do sul. this number has been grow-ing at an average rate of 5% per year. based on this trend, the fleet is expected to grow to approximately 5 million vehicles by 2010. the Metropolitan Region of Porto alegre comprises 40% of these vehicles. table 1 provides an over-view of Porto alegre’s vehicle fleets.

WRI: MeasuRIng the InvIsIble
9
the 2004 home-based Origin-Destination survey re-vealed that 71% of all trips in Porto alegre are motorized (Figure 7). the municipal bus fleet has an average age of 5 years and should have a maximum age of 10 years. In-
TABlE 1 overvieW of porto alegre’s transportation fleets
fleets details
suburban Rail One line, six stations, 33.8 km long 170,000 passengers per day 8,268 km per day
Metropolitan buses
561 lines, 1,500 vehicles, operated by 20 companies 37,000 passengers per day 240,000 km per day
Municipal buses
318 lines, 1,590 vehicles 953,000 passengers per day 9,318,000 km per month
Municipal Minibuses
29 lines, 403 vehicles 70,000 passengers per day 78,000 km per day
Other Motor vehicles
627 school buses serving 294 schools 3,915 taxis with an average age of 5 years 521,283 private cars (2.6 inhabitants/vehicle) Motorcycles (data not found)
source: ePtC, PMPa, sMt, 2003
centives exist for operators to keep the fleet relatively new. Figure 8 shows the age and euro standards of the munici-pality bus fleet in 2007.
WRI: MeasuRIng the InvIsIble
10
Porto alegre municipal government authorities are cur-rently updating their bus fleet database to include distanc-es traveled and fuel consumption.
the municipality of Porto alegre is planning to imple-ment two major transport interventions: fare integration, with electronic ticketing, and a bRt system. the bRt sys-
tem is aimed at regenerating the city center by removing terminals and reducing the number of buses in circula-tion, while the physical and operational integration of the public transportation system is intended to make the pub-lic bus system more attractive and thus increase ridership. these two interventions are described in more detailed in the next section of this report.

WRI: MeasuRIng the InvIsIble
11
3
study Methodology
of azenha and Cairu and end in the city center, while the municipal bRt line connects these two stations. short routes with an itinerary near the corridors were kept operating to avoid passenger transfers. similarly, circular and transversal routes kept the same operation as in scenario Int. the fare system is the same as in scenario Int, with two additions: passengers can make free transfers between the traditional municipal bus lines and the municipal bRt and between the traditional metropolitan lines and the metropolitan bRt.
n scenario int brt 2 - phase 2 of brt system
scenario Int bRt 2 considers the expansion of the bRt system as far as terminal triangulo, with the creation of an urban bRt line between triangulo and azenha and the creation of a metropolitan bRt line between triangulo and the city center. the point of integration between urban and metropolitan lines becomes triangulo, instead of Cairu. the fare system is the same as in scenario Int bRt 1.
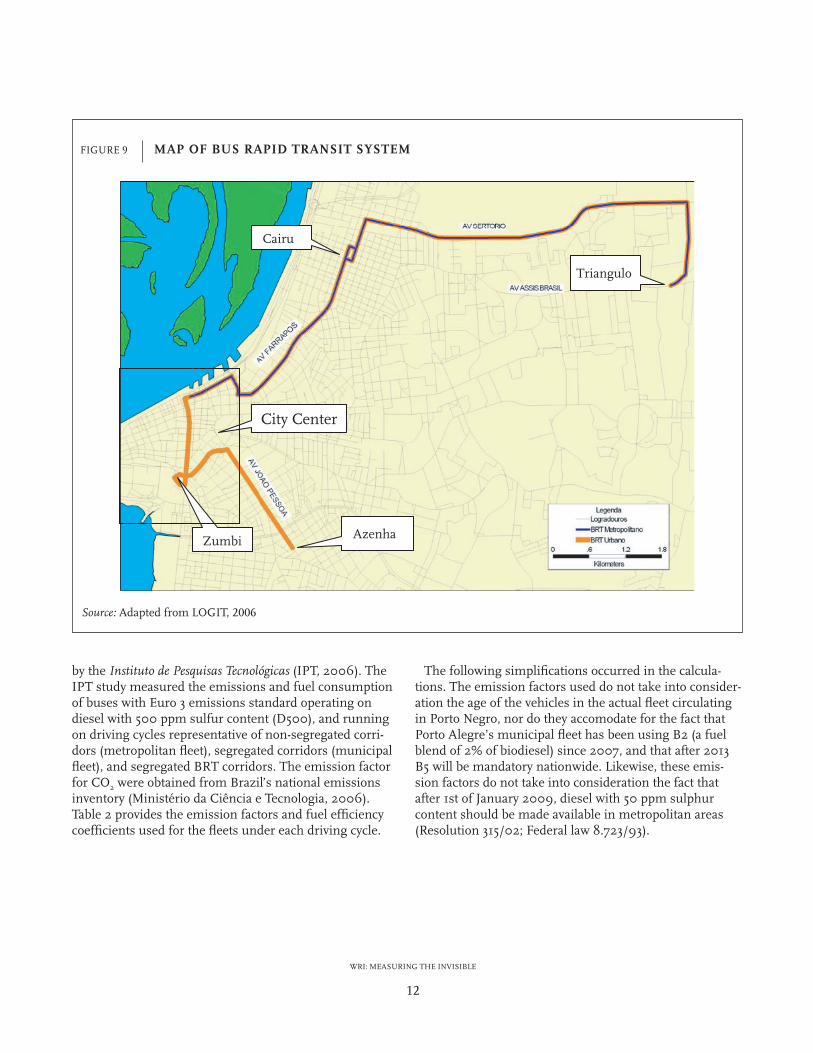
Figure 9 presents a map of the bRt system.
the comparison of the four transport scenarios was based on modeled projections of transport demand and supply for 2005 (base year), 2015, and 2025 (lOgIt, 2006). this study used modeled projections for the base year, as opposed to real observations, because real data were only available for the municipal fleet. In addition, models are simplified representations of reality, and even when the model is calibrated, the results between reality and simulation may not be identical. If we had compared future simulations with current real observations it would have been difficult to understand whether the variations resulted from modifications in the situation or from sim-plifications and imperfections of the models used.
eMission factors
the emission factors for CO, nOx, PM2.5 and the fuel consumption coefficients were drawn from a study led
this study estimates the emissions levels of CO2, CO, nOx, and PM2.5 of four transportation scenar-ios being considered for the city of Porto alegre.
this study uses a distance-based approach that consists in multiplying the annual distances traveled by the mu-nicipal, metropolitan and bRt fleets with emission factors characteristic of the fleet and driving conditions.
the calculations do not include secondary effects such as one-off traffic disruptions due to new terminal con-struction; upstream impacts related to how fuels are pro-duced, downstream impacts related to changes in traffic outside the project boundary.
transport scenarios
the government authorities of Porto alegre are consider-ing four scenarios for the public bus transport system:
n scenario bau - business as usual
this scenario is constructed based on the municipal routes that were operating in 2005 and metropolitan routes that were operating in 2002.
n scenario int - implementation of fare integration in the urban system
this scenario has the physical and operational conditions of scenario bau and considers the implementation of electronic ticketing and fare integration in the municipal bus lines. In this scenario, the passenger will be charged 50% of the fare price when buying a second bus ticket (50% discount on transfers).
n scenario int brt 1 - phase 1 of brt system
this scenario considers the implementation of three bRt lines: two for the metropolitan system passengers and one for the municipal system passengers. the metropolitan bRt lines start at the transfer stations
WRI: MeasuRIng the InvIsIble
12
by the Instituto de Pesquisas tecnológicas (IPt, 2006). the IPt study measured the emissions and fuel consumption of buses with euro 3 emissions standard operating on diesel with 500 ppm sulfur content (D500), and running on driving cycles representative of non-segregated corri-dors (metropolitan fleet), segregated corridors (municipal fleet), and segregated bRt corridors. the emission factor for CO2 were obtained from brazil’s national emissions inventory (Ministério da Ciência e tecnologia, 2006). table 2 provides the emission factors and fuel efficiency coefficients used for the fleets under each driving cycle.
the following simplifications occurred in the calcula-tions. the emission factors used do not take into consider-ation the age of the vehicles in the actual fleet circulating in Porto negro, nor do they accomodate for the fact that Porto alegre’s municipal fleet has been using b2 (a fuel blend of 2% of biodiesel) since 2007, and that after 2013 b5 will be mandatory nationwide. likewise, these emis-sion factors do not take into consideration the fact that after 1st of January 2009, diesel with 50 ppm sulphur content should be made available in metropolitan areas (Resolution 315/02; Federal law 8.723/93).
WRI: MeasuRIng the InvIsIble
13
technologies, driving conditions, etc. nevertheless, the results provide an indication of the likely impacts to expect in Porto alegre.
the emission factors used for the comparison of DPFs and DOCs are presented in table 3. these show some dis-crepancy from the values presented in table 2 for the mu-nicipal fleet due to the use of different vehicle technology.
note that during the measurement campaign the DOC was not adjusted to the sulfur content in the fuel, leading to abnormally high PM levels.
With the goal of evaluating the environmental perfor-mance of suitable fuel and technology alternatives, this study draws on available literature. It should be noted that the results presented here do not provide exact es-timations of the impacts of alternative options for Porto alegre’s fleets, since they are based on different vehicle
TABlE 2 eMission factors and fuel efficiency coefficients
paraMeterbrt fleet
(segregated)Municipal fleet
(segregated)Metropolitan fleet
(non segregated) source
Fuel (km/l) 3.44 2.06 ± 0.11 1.66 ± 0.21 IPT, 2006*
CO2 (g/l) 2,799 2,799 2,799 Ministério, 2006
CO2 (g/km) 814 1,359 1,686 Calculated
CO (g/km) 1.33 ± 2.81 3.23 ± 0.49 5.16 ± 1.44 IPT, 2006*
nOx (g/km) 7.55 ± 3.31 13 ± 0.7 17.07 ± 0.9 IPT, 2006*
PM2.5 (g/km) 0.167 ± 0.018 0.215 ± 0.033 0.385 ± 0.220 IPT, 2006*
* volkswagen volksbus 17-260 operating on D500, engine MWM 6.12 tCae euro 3 (6 cil. e 7,2 l.), 191 kW @ 2,500 rpm e 900 nm @ 1,300 rpm, manual transmission eaton Fs-6406b, axis busscar urbanus Plus, length 13,3 m and weight 11.000 kg, passengers: 37 seats, 39 standing.
TABlE 3 eMission factors for ect and cleaner fuels
paraMeter d500
d500 doc d50 d50 dpf
Fuel (km/l) 1.68 1.76 1.7 1.75
CO (g/km) 11.5 7.08 10.3 1.61
nOx (g/km) 12.8 11.9 12.4 10.1
PM2.5 (g/km) 0.171 0.33 0.68 0.015
Mercedes-benz O500 ua 2836, motor OM 457 la euro 3 (6 cil. and 12 liters), 260 kW @2000 rpm and 1600 nm @1100rpm, automatic transmissions voith Diwa 864.3e, axis Induscar Caio Millennium, length 18,5 m and weight 18.180 kg, 36 seats, 83 standingsource: IPt, 2006
WRI: MeasuRIng the InvIsIble
14
4
results: environMental perforMance of transport solutions
local transport experts foresee that, as electronic ticket-ing and travel cards are instituted, the secondary market for travel tokens will collapse. this will increase bus rider-ship, distances traveled and emissions levels. the extent of this effect is not possible to evaluate through conven-tional transportation planning models. thus the simulat-ed forecast of distances traveled and of the impact of fare integration presented in this study may be significantly underestimated.
iMproving the transport systeM
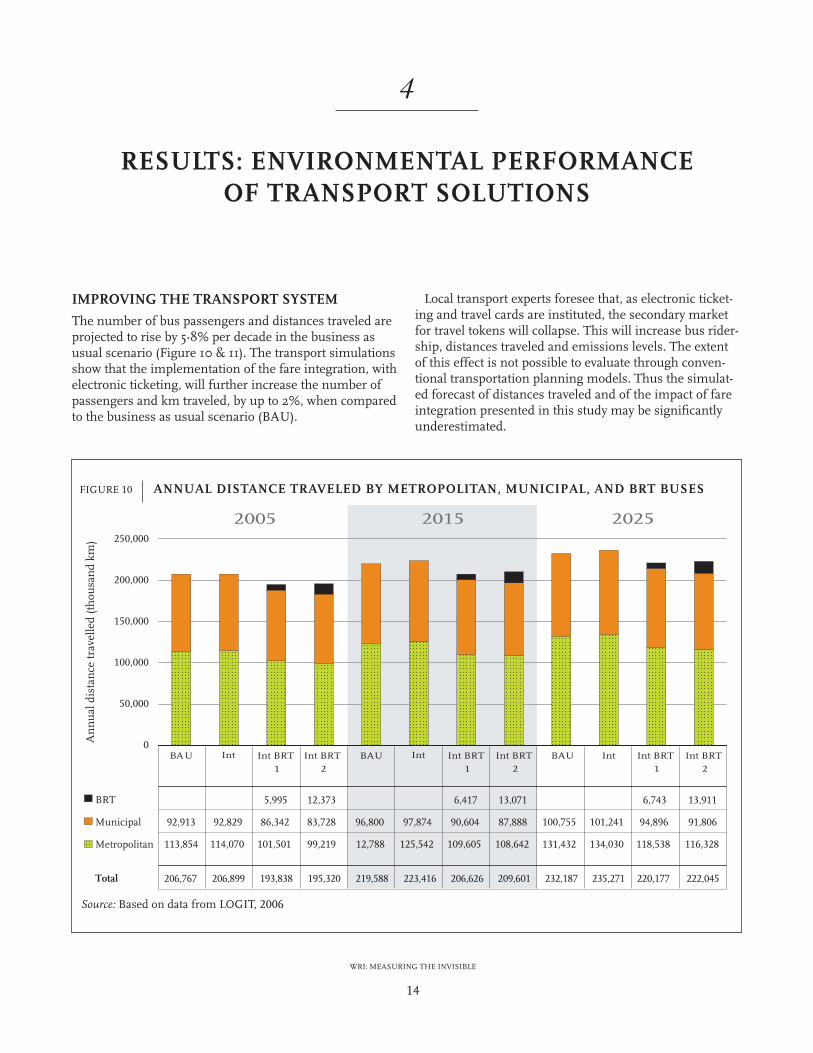
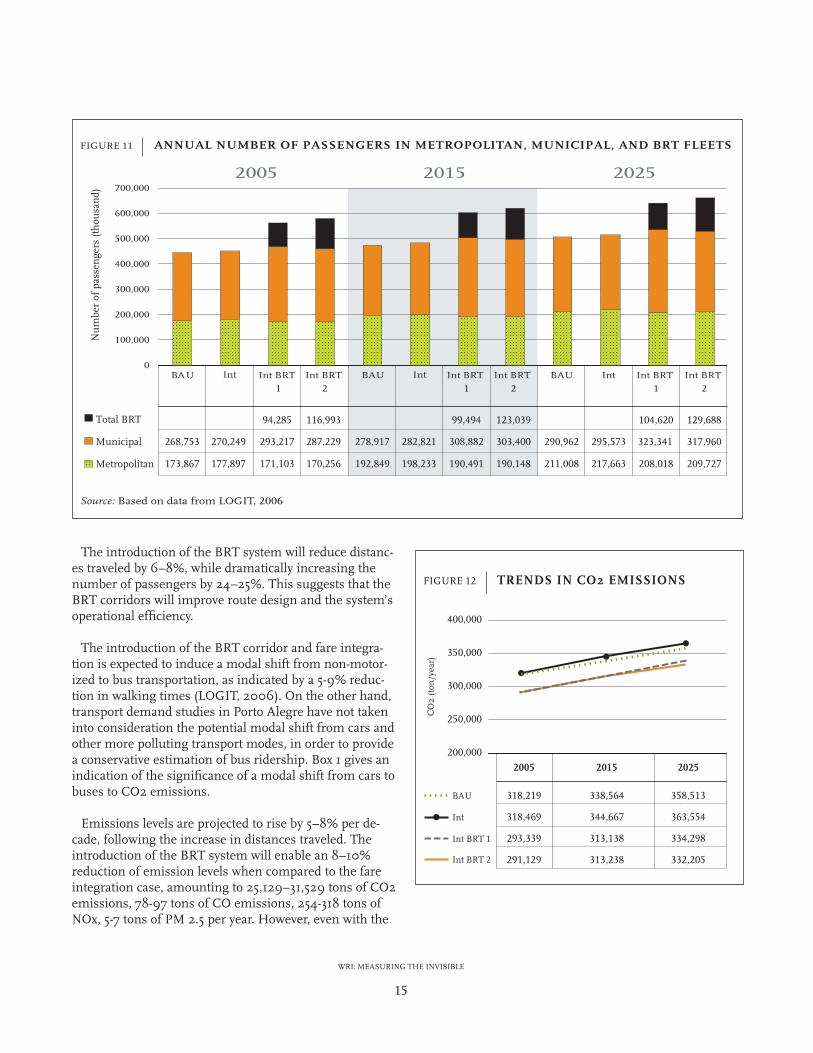
the number of bus passengers and distances traveled are projected to rise by 5-8% per decade in the business as usual scenario (Figure 10 & 11). the transport simulations show that the implementation of the fare integration, with electronic ticketing, will further increase the number of passengers and km traveled, by up to 2%, when compared to the business as usual scenario (bau).
WRI: MeasuRIng the InvIsIble
15
the introduction of the bRt system will reduce distanc-es traveled by 6–8%, while dramatically increasing the number of passengers by 24–25%. this suggests that the bRt corridors will improve route design and the system’s operational efficiency.
the introduction of the bRt corridor and fare integra-tion is expected to induce a modal shift from non-motor-ized to bus transportation, as indicated by a 5-9% reduc-tion in walking times (lOgIt, 2006). On the other hand, transport demand studies in Porto alegre have not taken into consideration the potential modal shift from cars and other more polluting transport modes, in order to provide a conservative estimation of bus ridership. box 1 gives an indication of the significance of a modal shift from cars to buses to CO2 emissions.
emissions levels are projected to rise by 5–8% per de-cade, following the increase in distances traveled. the introduction of the bRt system will enable an 8–10% reduction of emission levels when compared to the fare integration case, amounting to 25,129–31,529 tons of CO2 emissions, 78-97 tons of CO emissions, 254-318 tons of nOx, 5-7 tons of PM 2.5 per year. however, even with the

WRI: MeasuRIng the InvIsIble
16
as illustrated in table 4 below, buses are 3–7 times less fuel efficient than cars, per vehicle; but are 6–13 times more fuel efficient than cars, per passenger. buses emit 4–9 times more CO2 emissions than cars, per vehicle; but 5–10 times less CO2 emissions than cars, per passenger. here again, we can feel the impact of the different driving cycles for mixed traffic, segregated, and bRt corridors.
assuming that 1% of the bus passengers previously trav-eled by car, we estimate that the implementation of the fare integration and bRt corridors will reduce CO2 emis-sions by 710,423–836,037 grams per year due to modal shift, as illustrated in Figure 13.
Policies that encourage modal shift, such as conges-tion charges, fuel and vehicle property taxes, and park-ing management, increase the potential of reducing emissions from cars, as has been observed in bogotá and México City.
Box 1 coMparing co2 eMissions froM cars and buses per unit of travel
TABlE 4 fuel efficiency and co 2 eMissions per travel unit
paraMeterbus
on brt
bus on segregated
corridor
bus on Mixed
traffic
fue
l e
ffic
ien
cy
Per bus (veh.km/l)1
3.44 2.06 1.66
Per car (veh.km/l)2
12 12 12
Per bus passenger (pax.km/l)3
172 103 83
Per car passenger (pax.km/l)4
13.68 13.68 13.68
5 co
2 e
Mis
sio
ns
Per bus (veh.g/km)6
814 1,359 1,686
Per car (veh.g/km)7
181 181 181
Per bus passenger (g/km)3
16 27 34
Per car passenger (g/km) 4
159 159 159
Notesg = gram; km = kilometer; pax = passenger; veh = vehicle.
1. IPt, 2006.
2. FePaM, 2002. note: lee schipper believes that 12 km/l fuel efficiency for a car is high and expects this to be 10 km/l.
3. 50 passengers per bus (private communication with lOgIt, March 2008).
4. 1.14 passengers per car (u.s. DOt 2003).
5. CO2 emission factors are for euro3 buses operating on D500, and for cars operating on gasoline.
6. Ministerio de Ciência e technologia, 2006.
7. IPCC, 2006

WRI: MeasuRIng the InvIsIble
17
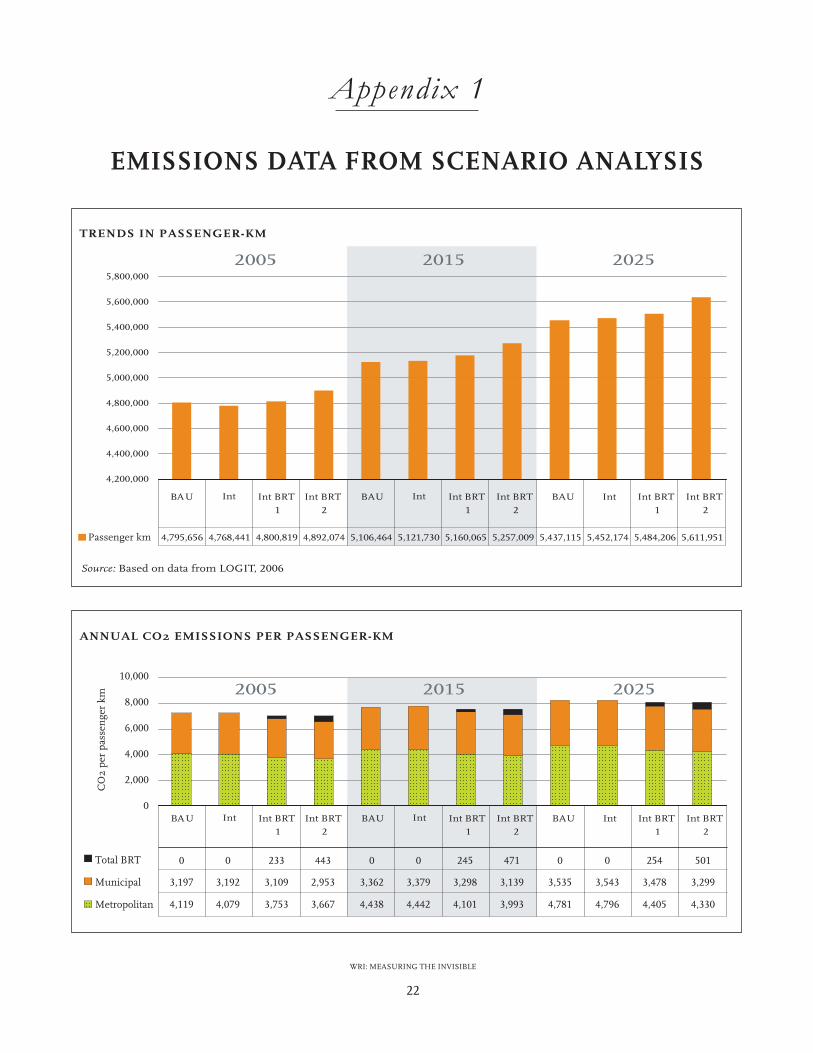
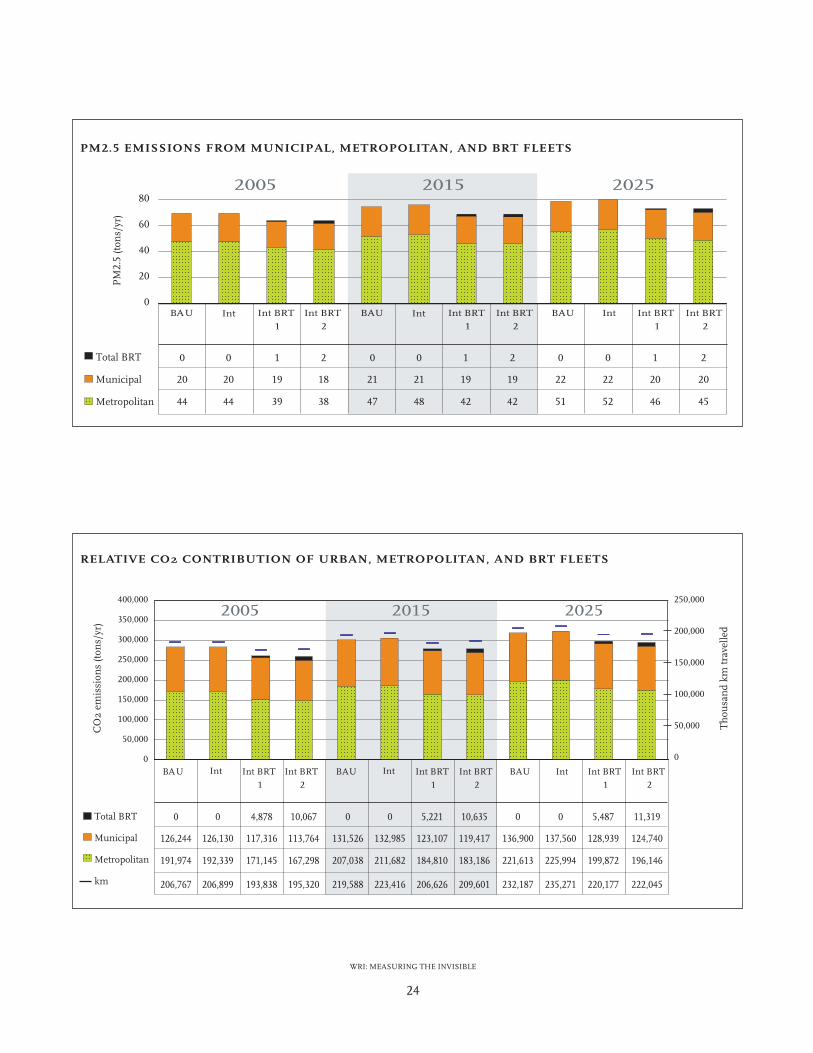
introduction of the bRt system, by 2025 emission levels will have surpassed the 2005 bau case. these trends are illustrated in Figure 12 for CO2 emissions. additional graphs and tables, presenting the emission levels for CO2, CO, nOx and PM 2.5, are provided in appendix 1.
alternative-fuel, vehicle, and eMission control technologies
this study considers the environmental performance of al-ternative-fuels, vehicle, and emission control technologies for Porto alegre’s bus fleets, based on analysis presented in available literature. We introduce here the potential emission impacts of vehicle emission standards, emission control technologies, biodiesel, cleaner diesel, compressed natural gas (Cng), and hybrid buses.
shifting to cleaner diesel fuel
the shift from diesel with 500ppm sulfur content (D500) to cleaner diesel (D50 and D15) is expected to lead to a re-duction of 56% of PM, 10% of CO, and 5% of nOx per km traveled. these results were obtained for articulated euro 3 buses, without any tailpipe treatment technology. these reductions are due to both the lower sulfur and the higher cetane content of the cleaner fuels (IPt, 2006).
retrofitting with dpfs while using cleaner diesel fuel
the application of diesel particle filters (DPFs) and D50 enables a reduction of CO by 85%, hC by 90%, PM by 80%, and nOx by 20% per km traveled, when compared to emissions from buses running on D500. these results were obtained for articulated euro 3 buses.
Figures 14 and 15 illustrate the impacts of cleaner diesel and emission control technologies (eCts) on CO emissions when applied to Porto alegre’s bRt and municipal fleets, respectively. It can be seen that the emission reductions are higher when retrofitting the municipal fleet. this is easily explained by the fact that the municipal fleet runs longer distances. In both cases, the fuel-technology option that of-fers the lowest emissions is the use of D50 with DPFs.
similar impacts were observed in test-campaigns per-formed in Mexico City, demonstrating that catalyst-based DPF technology can remove virtually all diesel engine-generated solid elemental carbon particles from diesel ex-haust - including 99% or more of the solid particles (sMa, 2006).
the upstream oxidation catalyst converts nitrogen mon-oxide (nO) in the exhaust to nO2, which then transfers oxygen to the collected soot, oxidizing it to gaseous CO or CO2. this mechanism provides for the regeneration of the particulate filter and promotes the oxidation of unburned hCs and CO (schipper et al., 2006).

WRI: MeasuRIng the InvIsIble
18
note that the performance of DPFs is very sensitive to sulfur content. a study by nRel shows that fuel sulfur levels lower than 150ppm are required to achieve reduc-tions in total PM. DPFs reduced PM emissions by 95% when using 3-ppm sulfur fuel, by 73% when using 30-ppm sulfur fuel, and by nearly 0% when tested with 150-ppm sulfur fuel. With 350ppm sulfur fuel, PM levels increased by more than 100% (nRel, 2001).
Retrofitting the municipal fleet with DPFs while using D50 provides 39% greater CO emission reductions and 17% greater PM2.5 emission reductions than implement-ing Phase 1 of bRt system (Figures 16 and 17). note that the emission factors used were from the 2006 Instituto de Pesquisas tecnológicas study, and are for articulated buses operating on the municipal driving cycle. this creates a discrepancy with the absolute emission levels presented in earlier figures. nevertheless, this comparative analysis still facilitates the understanding of the impacts of using cleaner fuels and alternative emission control technologies in the municipal fleet.
It should be noted that emission control technologies have a negligible impact on fuel consumption and respec-tive CO2 emissions. a u.s. Department of energy nation-al Renewable energy laboratory (nRel) study shows that the installation of the DPF may cause a nearly 2% fuel economy penalty (nRel, 2006).
using biodiesel in bus fleets
a study by the u.s. environmental Protection agency (ePa) shows that the amount of biodiesel used in fuel blends has a non-linear benefit (ePa, 2002). soybean oil represents over 95% of present vegetable oil production in brazil. the use of soybean-based b20 (20% biodiesel blend) can reduce total unburned hC emissions by 20%, and CO and PM concentrations by 12%, but can increase nOx emissions by 2% (a contributing factor in the forma-tion of smog and ozone). the study also shows that b20 reduces polycyclic aromatic hydrocarbons (Pahs) and nitrated polycyclic aromatic hydrocarbons (nPahs) by 13% and 50%, respectively — very, important for reducing health risks (ePa, 2002).

WRI: MeasuRIng the InvIsIble
19
the CO2 benefits attributable to biodiesel are a result of the renewability of the biodiesel itself, and are not based on comparative exhaust CO2 emissions. literature provides mixed results on the life-cycle impacts from biodiesel. Concerns are raised over the carbon dept from direct and indirect land use changes associated with the production of biofuels (Fargione, 2008).
retrofitting with dpfs while using biodiesel blends
a study performed by nRel suggests that using biodiesel blends in engines equipped with DPFs can yield signifi-cant benefits. biodiesel causes a significant increase in filter regeneration rates, and the use of b20 with the DPF produced an additional PM reduction of 67%, as com-pared to a petro diesel plus DPF configuration. however, the use of b20 caused a 2.9% increase in fuel consump-tion, consistent with the lower energy content of this fuel; and the installation of the DPF caused a nearly 2% fuel economy penalty for both ultra-low-sulfur diesel and b20 (nRel, 2006).
retrofitting with docs
Diesel oxidation catalysts (DOCs) remove gaseous hCs (in-cluding a portion of toxic and odor-causing hydrocarbons), CO, and a portion of particulate emissions termed the soluble organic fraction (sOF). DOCs remove virtually no solid particles, including elemental carbon particles (black soot), inorganic metals (lube oil ash), and adsorbed heavy Pahs that remain entrained as particles when they pass through the DOCs’ channels. Measurement campaigns performed in Mexico City found that DOCs, together with diesel with 15 ppm sulfur content (D15), can reduce PM by 13–44%, CO by 43–77%, and nOx by 5–14%, when com-pared to the reference scenarios of 1991 vehicles operating on diesel with 350-ppm sulfur content (D350) (Cts, 2006).
DOCs are more sulfur tolerant than DPFs. however, if the sulfur content is high, the concentration of precious metals in the catalyst needs to be reduced, to prevent the conver-sion of sO2 into sulfur trioxide (sO3). Otherwise, sO2 will
react with the humidity of the exhaust gas and generate sul-furic acid, which corrodes the exhaust system, contributes to acid rain, and increases PM levels. a nRel study shows that fuel sulfur content ranging from 3ppm to 350ppm did not affect emissions of PM soluble organic fraction or the suppression efficiency of the DOC. although there is some statistical evidence that sulfate emissions increased with higher-sulfur fuel, the resulting impact on PM was negli-gible and not statistically significant (nRel, 2001).
Interestingly, when comparing the implementation of Phase 1 of the bRt system and fare integration with retro-fitting the municipal fleet with DOCs it can be seen that the latter offers a 12% greater CO emissions reduction (Figure 17) but a 6% lower nOx reduction (Figure 18).
DOCs typically do not adversely impact fuel consump-tion and do not affect the level of CO2 emissions (Western Regional air Partnership, 2005)
raising the fleet’s emission standards
It is clear from the literature that vehicle emission standards have an important impact on emissions of local pollut-ants. When comparing emissions from heavy-duty vehicle engines running on a test bench, the move from euro 1 to euro 2 reduces PM10 by 63%; from euro 2 to euro 3, by 33%; and from euro 3 to euro 4, by 78%. except for nOx, that shows a clear reduction, no impact is found when moving from euro 4 to euro 5. euro vehicle emission standards have no effect on CO2 emissions. (nylund and erkkilä, 2005).
switching diesel to cng
natural gas makes an ideal fuel for vehicle combustion en-gines because of its high octane rating and low volatile or-ganic compounds. being a gas, it mixes easily with air prior to combustion, offering lower idling speeds, better perfor-mance, easier cold starting, and a more complete combus-tion, which all help to reduce tailpipe emissions (Cleaner vehicles task Force, 2000). When compared to diesel with

WRI: MeasuRIng the InvIsIble
20
360ppm sulfur content, the emission reductions for a bus operating on Cng are around 52% for CO, 86% for nOx, and 68% for particulates. Cng emissions have very low levels of sOx and do not contain benzene or 1,3-butadiene (Cleaner vehicles task Force, 2000). however, Cng emits higher levels of total hydrocarbons (hC); over 80% of which are composed of methane with low potential to react in the atmosphere to create ground-level ozone. For heavy-duty vehicles (> 3.5 tonnes) total ghgs from Cng are comparable or slightly increased when compared to diesel operation (Cleaner vehicles task Force, 2000).
replacing the fleet with hybrid buses with docs
transit agencies have reported that hybrid buses offer fuel economy improvements on the order of 10–50%, depend-ing on such variables as series or parallel hybrid design, system optimizations, and the type of bus route (hybrid Center, 2007). the IPt study indicates that electra hybrid buses reduce nOx by 11% and PM2.5 by 46% (with a high level of statistical uncertainty), while increasing emissions of CO by 21%, hC by 54%, and fuel consumption (and respective CO2 emissions) by 51%. When electra hybrid buses operate with DOCs and with optimized operation through adjustments in the control system, it is possible to reduce fuel consumption by 20% and CO and hC emissions by 21% and 37%, respectively, comparatively to the original electra hybrid buses. In contrast, nOx and PM emissions increase by 2% and 63%, respectively, but within the uncertainty boundary (IPt, 2007).

WRI: MeasuRIng the InvIsIble
21
5
conclusions
the Porto alegre Case study provides revealing con-clusions for sustainable transportation.
the proposed bus Rapid transit system (bRt) is projected to reduce CO2 and local pollutant emissions from bus fleets, through improvements in route design and efficiency of operations.
the first step for the implementation of the bRt is the integration of fares across the bus networks and the im-plementation of electronic ticketing. simulations of travel demand reveal that this initial step on its own may eventu-ally increase CO2 and local pollutant emissions.
the reduction in bus transfer costs encourages pas-sengers to reduce walking times and use the bus for short trips. In addition, local transport experts foresee the col-lapse of the secondary market for travel tokens, which would attract pedestrians to the bus system.
We infer that benefits could be generated by comple-menting the fare integration and bRt interventions with measures that improve the attractiveness of non-motorized transportation and with measures that encourage modal shift from more polluting transport modes such as cars.
Furthermore, the analysis shows that cleaner fuels and emission control technologies can have a significant impact when applied to fleets of high mileage. In fact, nu-merous fuel and technology options can be applied to the bus fleets to further reduce transportation emissions.
to validate the comparison between vehicle and fuel alternatives for the specific case of Porto alegre, the au-thors recommend the development of cost-benefit analysis and feasibility studies for introducing vehicles with higher emissions standards; retrofitting the fleet with diesel oxidation catalysts, or diesel particle filters while using ultra-low-sulfur diesel or biodiesel blends; switching from diesel to Cng; and replacing buses with hybrid vehicles.
WRI: MeasuRIng the InvIsIble
22
Appendix 1
eMissions data froM scenario analysis

WRI: MeasuRIng the InvIsIble
23
WRI: MeasuRIng the InvIsIble
24
WRI: MeasuRIng the InvIsIble
25
references
IPt (Instituto de Pesquisas tecnológicas), Diretoria de Operações e negócios; Ensaios Comparativos de Ônibus urbanos; Relatório técnico no. 91.377-205; 2006.
lOgIt Mercosul Consultoria ltda.; Bus rapid transit de Porto Alegre—simulação de Cenários Futuros, 2006.
Ministério da Ciência e tecnologia, Emissões de Gases deEfeito Estufa por Fontes Móveis no setor Energético, 2006.
nRel (national Renewable energy laboratory); Biodiesel Effects on Diesel Particle Filter Performance: Milestone report; nRel/tP-540-39606; March 2006.
nRel (national Renewable energy laboratory); Integrated Environmental strategies—Program for Control of Air Pollution from Mobile sources (ProCoNVE) Analysis; February 2003.
nRel (national Renewable energy laboratory); Diesel Emission Control—sulfur Effects (DECsE) Program: Final report for Diesel oxidation Catalysts and Lean-Nox Catalysts; June 2001.
nRel (national Renewable energy laboratory); Diesel Emission Control—sulfur Effects (DECsE) Program: summary of reports; June 2001.
nylund n.O., and K. erkkilä; Bus Emission Evaluation: 2002–2004 summary report; Research Report PRO3/P3015/05, 25.4.2005; Finland: vtt Processes, 2005.
schipper, l., et al.; “Cleaner buses for Mexico City, Mexico: From talk to Reality;” in Air Quality 2006; transportation Research board; Washington, DC; 2006.
sPM (secretaria do Planejamento Municipal); Plano Diretor de Desenvolvimento urbano Ambiental—PDDuA (Directive Plan for urban Development and the Environment); lei Complementar no. 434.
sMa (secretaria de Medio ambiente) México, D.F.; Pruebas en Campo de Autobuses de tecnologías Alternativas en la Ciudad de México: reporte Final (Field testing of Alternative Bus technology in Mexico City: Final report;) México; 2006.
Western Regional air Partnership; offroad Diesel retrofit Guidance Document, volume 2: “Retrofit technologies, application and experience;” section II: “Diesel Oxidation Catalyst;” november 18, 2005.
Wright, l., and l. Fulton; “Climate Change Mitigation and transport in Developing nations,” transport reviews 25(6):691–717; november 2005.
booz allen, FIPe (Fundação Instituto de Pesquisa economica), hlC; Centro de Excelência em Engenharia de transporte—Cenários Futuros; 2006.
Cleaner vehicle task Force; the report of the Alternative Fuels Group of the Cleaner Vehicle task Force - An Assessment of the Emissions Performance of Alternative and Conventional Fuels; January 2000.
Cts (Centro de transporte sustentável); Mexico City Diesel retrofit Pilot Project—Final report; august, 2006.
Detran; Estatísticas de trânsito—Anuário Estatístico 2005; 2005.
Dieselnet; Emission standards—Brazil: on-road Vehicles and Engines; accessed March 2008 at: http://www.dieselnet.com/standards/br/.
DOt (u.s. Department of transportation, bureau of transportation statistics); Nhts 2001 highlights report, Bts03-05; Washington, DC; 2003.
ePa (u.s. environmental Protection agency); A Comprehensive Analysis of Biodiesel Impacts on Exhaust Emissions—Draft technical report; ePa-420-P-001; October 2002. available at:
ePtC (empresa Pública de transporte e Circulação); Database and Meetings; 2007.
ePtC (empresa Pública de transporte e Circulação), PMPa (Perfeitura Municipal de Porto alegre), and sMt (secretaria Municipal dos transportes); Mobilidade urbana em regiôes Metropolitanas; 2003.
ePtC (empresa Pública de transporte e Circulação), tIs (Consórcio Magna-tIs); home-Based origin-Destination survey, 2004.
Fargione J., et al.; Land Clearing and the Biofuel Carbon Debt; February 2008.
FePaM (Fundação estadual de Proteção ambiental); Qualidade Ambiental: Boletim da Qualidade do Ar - 24h - rede Automática; accessed February 29 2008, at: http://www.fepam.rs.gov.br/qualidade/boletim_ar_automatica.asp.
FePaM (Fundação estadual de Proteção ambiental); relatório da Qualidade do Ar 2001–2002; Porto alegre; 2002.
hybrid Center; accessed July 2007, at: http://www.hybridcenter.org/.
Ibge (Instituto brasileiro de geografia e estatística); 2007. available at: http://www1.ibge.gov.br/english/.

WRI: MeasuRIng the InvIsIble
26
the World Resources Institute is an environmental think tank that goes beyond research to find practical solutions to protect the earth and improve people’s lives.
Our mission is to move human society to live in ways that protect earth’s envi-ronment and its capacity to provide for the needs and aspirations of current and future generations.
because people are inspired by ideas, empowered by knowledge, and moved to change by greater understanding, WRI provides—and helps other institutions provide — objective information and practical proposals for policy and institu-tional change that will foster environmentally sound, socially equitable develop-ment.
WRI organizes its work around four key goals:
• People&Ecosystems:Reverserapiddegradationofecosystemsandassuretheir capacity to provide humans with needed goods and services.
• Access:Guaranteepublicaccesstoinformationanddecisionsregardingnatural resources and the environment.
• ClimateProtection:Protecttheglobalclimatesystemfromfurtherharmdue to emissions of greenhouse gases and help humanity and the natural world adapt to unavoidable climate change.
• Markets&Enterprise:Harnessmarketsandenterprisetoexpandeconomicopportunity and protect the environment.
EMBArQ — the World Resources Institute Center for sustainable transport — acts as a catalyst for socially, financially, and environmentally sound solutions to the problems of urban mobility in developing countries. EMBArQ works with politically and financially empowered authorities at local and global levels, reducing the costs, risk, time, and complexity required to diagnose key transport problems, and design and implement sustainable, “best practice” solutions.
through the formation of public-private partnerships, EMBArQ has also turned the attention of the private sector towards the needs of cities, their citizens, and their environment. EMBArQ has also proven that the design and implementa-tion of sustainable urban trasnport strategies in the developing countries can translate into economic opportunities for the forward-thinking business.
established in 2005, the Center for sustainable transport of brazil and south america (Cts-brasil) works with government, civil society, and the private sector to develop and implement sustainable solutions to challenges of urban mobility in brazil and south america. Cts-brasil is a non-profit, civil society organization, staffed with experts in transport engineering, environmental science, and com-munications. Cts-brasil is an active member of the eMbaRQ/WRI network.
PResIDent: JOnathan lash
DIReCtOR: nanCy Kete
DIReCtOR: tOnI lInDau