measuring the effectiveness of improvement strategies beyond district improvement plans workshop...
TRANSCRIPT

Measuring the Effectiveness of Improvement Strategies
Beyond District Improvement Plans WorkshopIndianapolis – November 14, 2007
Division of Compensatory Education/Title I

04/19/23 2
Measuring the Effectiveness of Improvement Strategies
Session Outcomes
1. Participants will understand the critical components of a well-written improvement plan.
2. Participants will be able to write clear, measurable goals focused on identified student learning needs.
3. Participants will be able to identify a variety of evidence useful in determining the effectiveness of improvement actions, including the effectiveness of implementation as well as evidence of progress toward achieving desired results.

04/19/23 3
Measuring the Effectiveness of Improvement Strategies
Key Points
Effective improvement plans have a clear logic that link the plan’s components and guides action.
Effective implementation of planned strategies begins with clear, measurable goals.
The ongoing collection of evidence and data is needed to measure effectiveness of the actions in two areas: fidelity of implementation and impact on student learning.

04/19/23 4
School and District Improvement Plans Serve Multiple Purposes
Improvement Plans
1. Document compliance
2. Guide improvement efforts

04/19/23 5
A logic model depicts the theory of change behind the action.
Goal: 85% of students will be proficient writers at their grade level within three years.
Inputs / Resources
Strategies
Initial Outcomes Intermediate Outcomes
Intended Results
Full-time literacy coaches for each low-performing school and half-time coaches for other schools
Coaches provide professional development and classroom support to teachers in writing process
Teachers learn how to teach writing process
Teachers apply new knowledge and teach writing process in classrooms with support from coaches
65% of fourth grade students will score proficient on state writing assessment

04/19/23 6
Well-planned improvement efforts that follow a clear logic model
can impact student achievement
Research-based reading practices Focused professional development Coaching, support and feedback Formative assessments guiding implementation Establishing a strong reading culture
Scott (2007)
“Reading First” changed reading instruction resulting in student achievement

04/19/23 7
Types of Assessments for Improvement Planning
Planning (needs assessments)
Formative (feedback enroute)
Summative (outcome and impact)
Guskey(2000)

04/19/23 8
Effective Implementation of Strategies Begins with Clear Goals
“Would you tell me, please, which way I ought to go from here?” asked Alice.
“That depends a good deal on where you want to get to,” said the cat.
“I don’t much care where,” said Alice.
“Then it doesn’t much matter which way you go,” said the cat.
Lewis CarrollFrom Alice’s Adventures in Wonderland

04/19/23 9
Research Says…
The impact of setting instructional goals on student achievement ranges from 18 to 41 percentile points. (Marzano, 2003)
The power of student engagement in setting and monitoring goals is second only to active participation in impacting student learning. (Wang, Haertel,& Walberg, 1994).
The existence of common goals in schools was…rare and the lack of agreed upon goals makes school unique among organizations. (Schmoker, 1999).

04/19/23 10
Goals are often too broad or vague
to guide effective action.
Section 2: Create Specific, Measurable Goals Purpose: To devise goals that are specific and measurable, and have a high probability of increasing student achievement.
1. Write the findings from Section 1 in the Findings column. 2. Based on the findings, create a goal for each student subgroup, as appropriate. 3. The goal is for two years and should reflect high expectations while being realistic. 4. Incremental goals that demonstrate a move toward all students meeting AYP are acceptable; goals should also consider safe harbor
and confidence intervals. 5. Goals that are “related” to achievement are acceptable (see Finding number 3 below).
Subgroup Not Meeting AYP
Elem. Middle High Findings Goals (as related to findings)
Free and Reduced Lunch
ELA
Math
ELA
Math
ELA
Math
1. The ISTEP+ ELA achievement scores of
students on free and reduced lunch are consistently lower for males than females to a significant degree.
Increase ELA achievement scores of Free and Reduced males in elementary, middle, and high schools. Grade 4 males: from 49 to 59% passing Grade 6 males: from 43 to 53% passing Grade 8 males: from 39 to 49% passing Grade 10 males: from 25 to 35% passing

04/19/23 11
Goals are often too broad or vague to guide effective action.
Section 2: Create Specific, Measurable Goals Purpose: To devise goals that are specific and measurable, and have a high probability of increasing student achievement.
1. Write the findings from Section 1 in the Findings column. 2. Based on the findings, create a goal for each student subgroup, as appropriate. 3. The goal is for two years and should reflect high expectations while being realistic. 4. Incremental goals that demonstrate a move toward all students meeting AYP are acceptable; goals should also consider safe harbor
and confidence intervals. 5. Goals that are “related” to achievement are acceptable (see Finding number 3 below).
Subgroup Not Meeting AYP
Elem. Middle High Findings Goals (as related to findings)
Free and Reduced Lunch
ELA
Math
ELA
Math
ELA
Math
1. Free and reduced lunch scores are much
lower than paid scores in most grade levels.
2. Progress is being made in grades 3 & 5. Paid scores are close to even with F & R scores.
3. Free and reduced lunch scores also contain special education scores so part of the issue is special education students that are also F & R students.
Increase achievement of F & R student subgroup by 10%.

04/19/23 12
SMART Goals: A Critical Step in Improving Student Learning
S Strategic and Specific
M Measurable
A Attainable
R Results-based
T Time-bound
O’Neill & Cozemius (2006)

04/19/23 13
SMART Goals Tree Diagram:Making goals focused and concrete
GOAL INDICATORS MEASURES TARGETS
--O’Neill and Conzemius, The Power of Smart Goals, 2006

04/19/23 14
Goals focus on the “greatest area of need.”
GOAL INDICATORS MEASURES TARGETS
--O’Neill and Conzemius, The Power of Smart Goals, 2006
85% of students will be proficient writers at their grade level within two years.

04/19/23 15
Indicators are the evidence used to determine if the goal is being achieved.
GOAL INDICATORS MEASURES TARGETS
--O’Neill and Conzemius, The Power of Smart Goals, 2006
85% of students will be proficient writers at their grade level within two years.
Organization
Mechanics / Conventions

04/19/23 16
Measures are the assessments usedto gauge progress on the indicators.
GOAL INDICATORS MEASURES TARGETS
--O’Neill and Conzemius, The Power of Smart Goals, 2006
85% of students will be proficient writers at their grade level within two years.
Organization
Mechanics / Conventions
ISTEP
Classroom Assessment
6 + 1 Traits Assessment
ISTEP

04/19/23 17
Targets are the incremental steps toward a longer-range goal.
GOAL INDICATORS MEASURES TARGETS
--O’Neill and Conzemius, The Power of Smart Goals, 2006
85% of students will be proficient writers at their grade level within two years.
Organization
Mechanics / Conventions
ISTEP
Classroom Assessment
6 + 1 Traits Assessment
ISTEP
70% proficient by end of year one
95% will score proficient on writing
rubric
95% will score level 4 (effective) on 4th
grade samples
70% proficient by end of year one

04/19/23 18
Breaking down the component parts helps to focus the goal toward action.
GOAL INDICATORS MEASURES TARGETS
--O’Neill and Conzemius, The Power of Smart Goals, 2006
All teachers will complete the 6+1 Traits Writing Model professional development and implement the model in their classroom
Participation
Classroom Implementation
Workshop Attendance Log
Teacher Writing Instruction Log
Classroom Walkthrough
100% participation
95% completion rate on teacher logs
4 rating on teacher practice
rubric
04/19/23 19
Measurable goals guide thoughtful action
A well-written goal framing a research-based strategy is the foundation for action that can be measured and adjusted as the improvement team implements the plan.
McKeever, Nine Lessons of Successful School Leadership Teams, (2003)
04/19/23 20
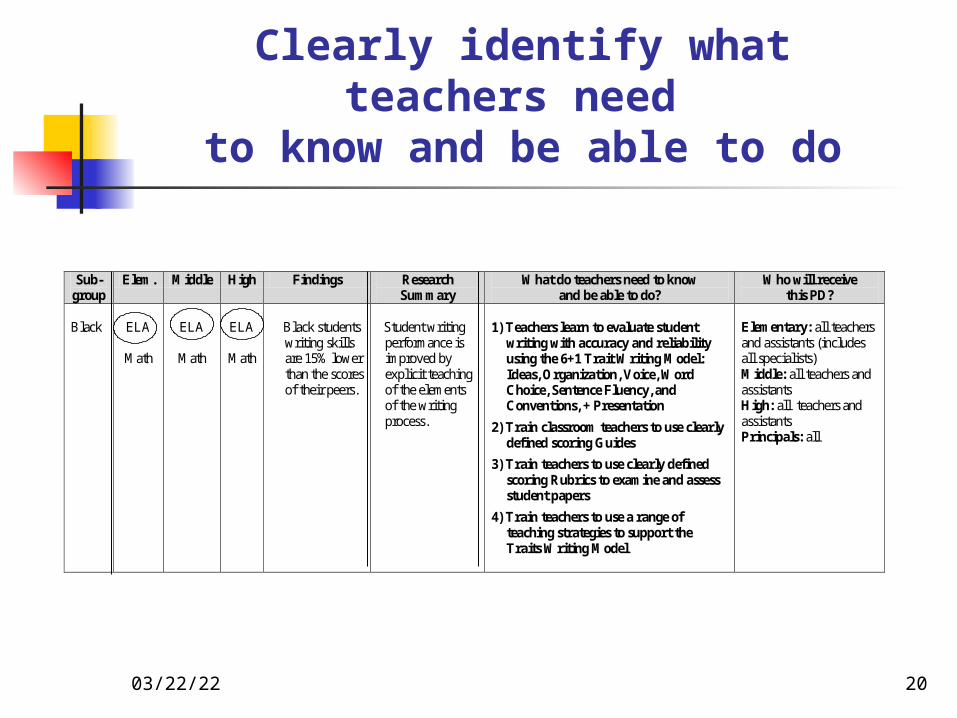
Clearly identify what teachers need
to know and be able to do
Sub-group
Elem. Middle High Findings Research Summary
What do teachers need to know and be able to do?
Who will receive this PD?
Black
ELA
Math
ELA
Math
ELA
Math
Black students
writing skills are 15% lower than the scores of their peers.
Student writing
performance is improved by explicit teaching of the elements of the writing process.
1) Teachers learn to evaluate student
writing with accuracy and reliability using the 6+1 Trait Writing Model: Ideas, Organization, Voice, Word Choice, Sentence Fluency, and Conventions, + Presentation
2) Train classroom teachers to use clearly defined scoring Guides
3) Train teachers to use clearly defined scoring Rubrics to examine and assess student papers
4) Train teachers to use a range of teaching strategies to support the Traits Writing Model
Elementary: all teachers and assistants (includes all specialists) Middle: all teachers and assistants High: all teachers and assistants Principals: all

04/19/23 21
Identify measures of effective implementation of new practice
Corresponding Research Base: Student writing performance is improved by explicit teaching of the elements of the writing process.
Dates Presenter and Credentials
Title / Description of Presentation
In Attendance (include grade levels, specialty areas, etc.)
Session Length
Is this ongoing?
How will teachers’ effective implementation of the practice be
measured? 8/2-3/08
9/6/08 10/1/08 1/11/08
Mark Shore, Trainer 6+1 Trait Writing Model
Introduction to 6+1 Trait Writing Model. Teachers will learn to evaluate student writing with accuracy and reliability using the 6+1 Trait Writing Model: Ideas, Organization, Voice, Word Choice, Sentence Fluency, and Conventions, + Presentation.
K–5 teachers
K–5 principals
K–5 teacher assistants
5 hours for each session (initial workshop two 5-hour sessions)
Yes Mark Shore will conduct initial walkthroughs of classrooms with principals, modeling how to gather data using focused recording sheets.
Each principal will conduct focused walkthroughs of each classroom every two weeks and discuss trends and feedback at grade level meetings.
Teachers will maintain a log of when they provided writing instruction and which trait they addressed.

04/19/23 22
Teacher professional development should affect student achievement
Institute for Education Sciences (2007)
1. The professional development activities increase and improve
teachers’ subject matter knowledge.
2. The new knowledge includes and leads to use of instructional
practices, curriculum and assessment that adhere to the research.
Evaluation of changes in
teachers’ practice
conducted.
3. Changes in instruction, curriculum and assessments lead to increased
student achievement, motivation, and interest. .increases
Evaluation of changes in
students’ behavior and learning conducted.

04/19/23 23
An improvement plan that is useful for guiding action…
Follows a logical path Identifies critical student learning needs Has clear, measurable goals Uses research-proven practices Includes measures of changing practice And measures of impact of practice on
student learning

04/19/23 24
Bartholomew Consolidated School Corporation
Columbus, Indiana
Dr. George Van HornDirector of Special Education
04/19/23 25
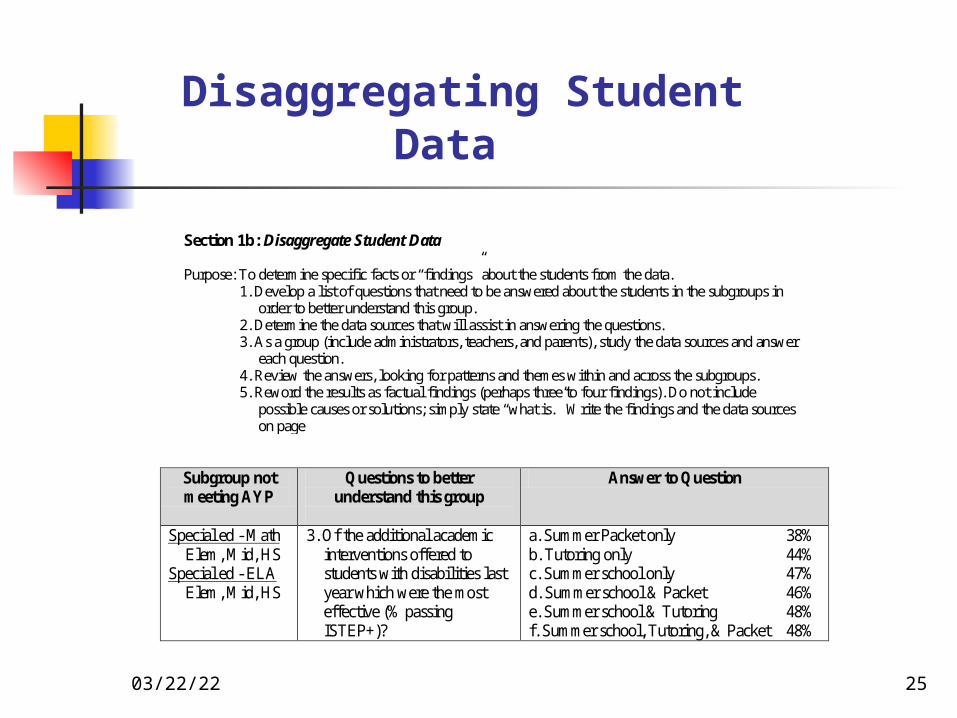
Disaggregating Student Data
Subgroup not meeting AYP
Questions to better understand this group
Answer to Question
Special ed - Math Elem, Mid, HS Special ed - ELA Elem, Mid, HS
3. Of the additional academic interventions offered to students with disabilities last year which were the most effective (% passing ISTEP+)?
a. Summer Packet only 38% b. Tutoring only 44% c. Summer school only 47% d. Summer school & Packet 46% e. Summer school & Tutoring 48% f. Summer school, Tutoring, & Packet 48%
Section 1b: Disaggregate Student Data Purpose: To determine specific facts or “findings” about the students from the data.
1. Develop a list of questions that need to be answered about the students in the subgroups in order to better understand this group.
2. Determine the data sources that will assist in answering the questions. 3. As a group (include administrators, teachers, and parents), study the data sources and answer
each question. 4. Review the answers, looking for patterns and themes within and across the subgroups. 5. Reword the results as factual findings (perhaps three to four findings). Do not include
possible causes or solutions; simply state “what is.” Write the findings and the data sources on page

04/19/23 26
Creating Specific, Measurable Goals
Specific, measurable goals
4. Ensure use of Universal Design for Learning (UDL) principles to drive instruction and assessment throughout all classrooms as measured by the documented number of classrooms/teachers using UDL with a target of 25% for 2008-09 and 50% in 2009-2010.
Section 2: Create Specific, Measurable Goals Purpose: To devise goals that are specific and measurable, and have a high probability of increasing student achievement.
1. Write the findings from Section 1 in the Findings column. 2. Based on the findings, create a goal for each student subgroup, as appropriate. 3. The goal is for two years and should reflect high expectations while being realistic. 4. Incremental goals that demonstrate a move toward all students meeting AYP are acceptable;
goals should also consider safe harbor and confidence intervals. 5. Goals that are “related” to achievement are acceptable (see Finding number 3 below).

04/19/23 27
Measuring Effect of Practices on Student Achievement
Specific, measurable goals
How will effectiveness of this practice for increasing student achievement
be measured? 4. Ensure use of Universal Design for
Learning (UDL) principles to drive instruction and assessment throughout all classrooms as measured by the documented number of classrooms /teachers using UDL with a target of 25% for 2008-09 and 50% in 2009-2010.
4a. Teachers self-assessment using new rubric to measure use of UDL.
4b. Principals observations using new rubric to
measure use of UDL. 4c. Student performance on standardized tests,
corporation’s assessments, and classroom assessments.

04/19/23 28
Framework for Evaluating Professional Development
Collect and Analyze Five Levels of Information
1. Participants' reactions2. Participants' learning3. Organization’s support and change4. Participants' use of new knowledge and skills5. Students’ learning outcomes
Guskey (2002)

04/19/23 29
Framework for Evaluating Professional Development
Collect and Analyze of Five Levels of Information
1. Participants' reactions2. Participants' learning3. Organization’s support and change
4. Participants' use of new knowledge and skills
5. Students’ learning outcomes
Guskey (2002)

04/19/23 30
What guideposts will help to assess progress along the way?
“Feedback is
the breakfast of champions.”
Blanchard (2001)

04/19/23 31
Types of Evidence
Classroom observations or WalkthroughsPrincipal – Coach - Peer
Teacher logs or documentation of activity Journals of reflective practice Teacher portfolios Teacher surveys Instructional materials (e.g., lessons, units) Videotapes Pre-post documentation of knowledge (K-W-L)
Of increased teacher knowledge and/or change in classroom practices
04/19/23 32
Types of Evidence
Local assessments District assessments Local rubrics or scoring guides Structured warm up activities Assessments embedded in units of study Talking with students Grades
Of impact of instruction on student learning
04/19/23 33
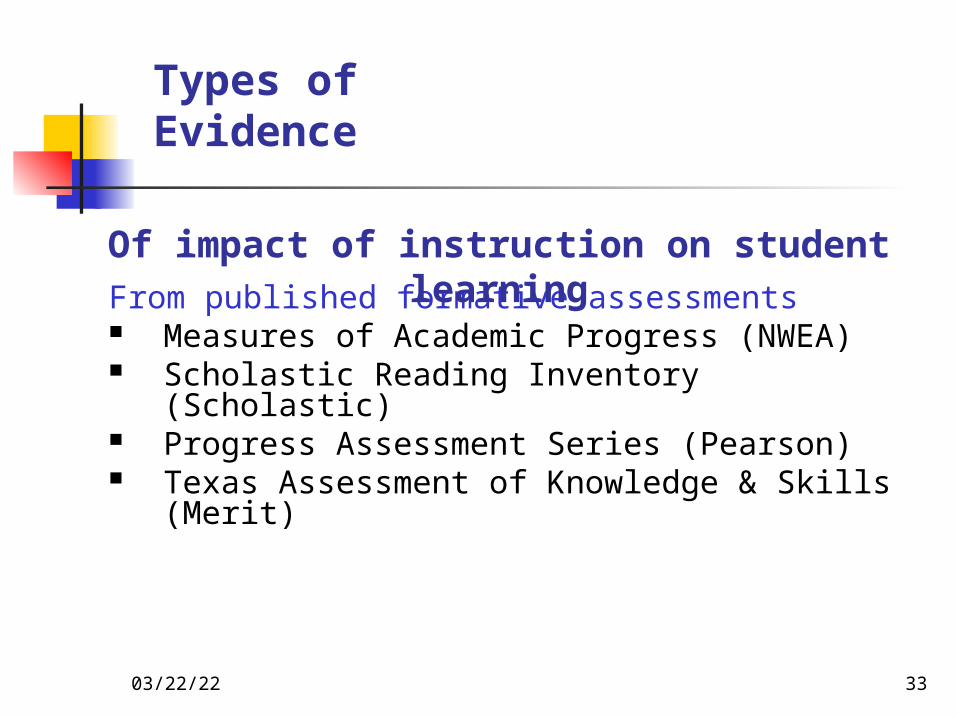
Types of Evidence
From published formative assessments Measures of Academic Progress (NWEA) Scholastic Reading Inventory (Scholastic) Progress Assessment Series (Pearson) Texas Assessment of Knowledge & Skills (Merit)
Of impact of instruction on student learning
04/19/23 34
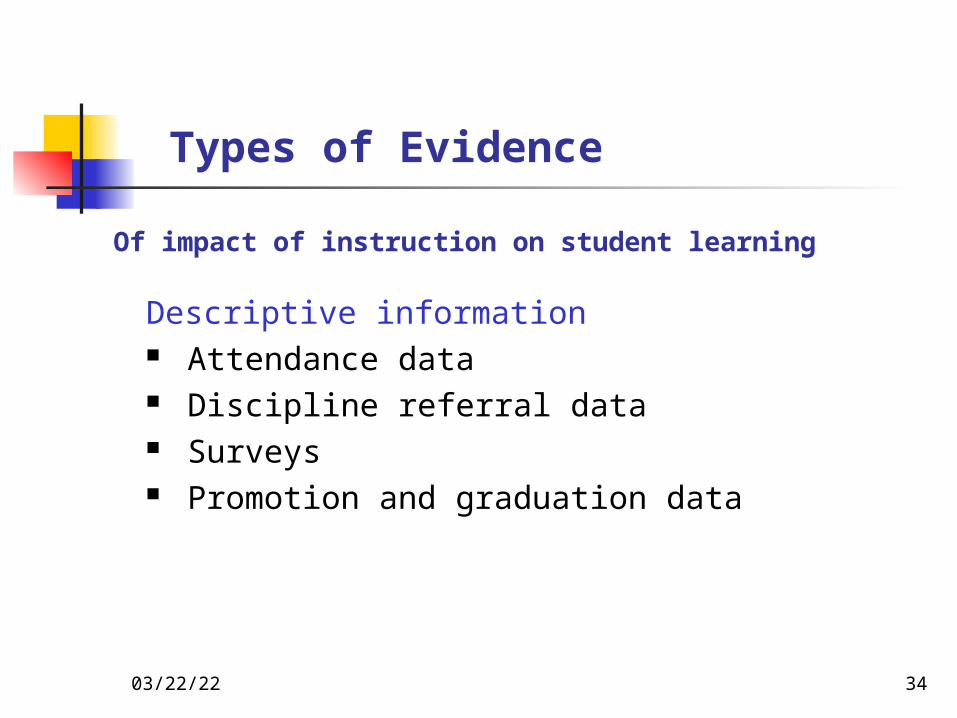
Types of Evidence
Of impact of instruction on student learning
Descriptive information Attendance data Discipline referral data Surveys Promotion and graduation data

04/19/23 35
Characteristics of Measures of Effectiveness
Yield reliable information Can be used efficiently Are minimally intrusive Provide feedback that guides action Are aligned with standards Are consistent with larger, summative measures Indicate progress toward a larger goal

04/19/23 36
A well written goal framing a research-based strategy can be measured and adjusted as the plan is implemented.
Subgroup Not Meeting AYP
Elem. Middle High Findings Goals (as related to findings)
Free and Reduced Lunch
ELA
Math
ELA
Math
ELA
Math
1. Free and Reduced Lunch student scores
are much lower than paid scores in most grade levels.
2. Progress is being made in grades 3 & 5. Paid scores are close to even with F & R scores.
3. Free and reduced lunch scores also contain special education scores so part of the issue is special education students that are also F & R students (addressed in separate goal).
Students receiving Free and Reduced Lunch will improve their scores on the writing portion of ISTEP in 2007: Gr. 3: From 55% to 70% Gr. 4: From 52% to 70% Gr. 5: From 66% to 76% Students receiving Free and Reduced Lunch will improve their scores on the writing portion of ISTEP in 2008: Gr. 3: From 70% to 85% Gr. 4: From 70% to 85% Gr. 5: From 76% to 85%
04/19/23 37
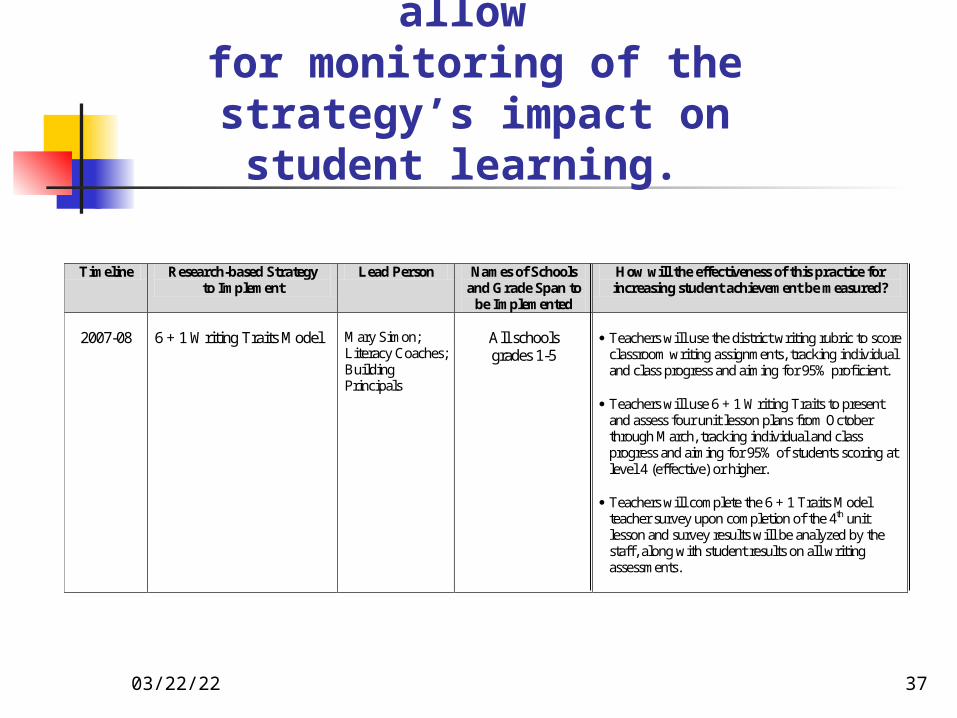
Formative assessments allow for monitoring of the strategy’s
impact on student learning.
Timeline Research-based Strategy to Implement
Lead Person Names of Schools and Grade Span to
be Implemented
How will the effectiveness of this practice for increasing student achievement be measured?
2007-08
6 + 1 Writing Traits Model
Mary Simon; Literacy Coaches; Building Principals
All schools grades 1-5
Teachers will use the district writing rubric to score
classroom writing assignments, tracking individual and class progress and aiming for 95% proficient.
Teachers will use 6 + 1 Writing Traits to present
and assess four unit lesson plans from October through March, tracking individual and class progress and aiming for 95% of students scoring at level 4 (effective) or higher.
Teachers will complete the 6 + 1 Traits Model
teacher survey upon completion of the 4th unit lesson and survey results will be analyzed by the staff, along with student results on all writing assessments.

04/19/23 38
The gathered evidence guides the effective implementation
of new instructional skills.
Corresponding Research Base: Student writing performance is improved by explicit teaching of the elements of the writing process.
Dates Presenter and Credentials
Title / Description of Presentation
In Attendance (include grade levels, specialty areas, etc.)
Session Length
Is this ongoing?
How will teachers’ effective implementation of the practice be
measured? 8/2-3/08
9/6/08 10/1/08 1/11/08
Mark Shore, Trainer 6+1 Trait Writing Model
Introduction to 6+1 Trait Writing Model. Teachers will learn to evaluate student writing with accuracy and reliability using the 6+1 Trait Writing Model: Ideas, Organization, Voice, Word Choice, Sentence Fluency, and Conventions, + Presentation.
K–5 teachers
K–5 principals
K–5 teacher assistants
5 hours for each session (initial workshop two 5-hour sessions)
Yes Mark Shore will conduct initial walkthroughs of classrooms with principals, modeling how to gather data using focused recording sheets.
Each principal will conduct focused walkthroughs of each classroom every two weeks and discuss trends and feedback at grade level meetings.
Teachers will maintain a log of when they provided writing instruction and which trait they addressed.

04/19/23 39
Activity: Identifying measures of effectiveness to guide improvement
1. Work with a LEA colleagues or join with another team/person if you are alone.
2. Discuss the sample goal statement and identify two measures of teachers’ effective implementation of the practice and two measures effectiveness of this practice for increasing student achievement.
3. Use the “Characteristics of Measures of Effectiveness” tool to review your work.

04/19/23 40
Identifying Useful Measures of Effectiveness to Guide Improvement Planning
Subgroup Not Meeting AYP
Elem. Middle High Findings Goals (as related to findings)
Free and Reduced Lunch
ELA
Math
ELA
Math
ELA
Math
1. Free and reduced lunch scores are much
lower than paid scores in most grade levels.
2. Progress is being made in grades 3 & 5. Paid scores are close to even with F & R scores.
Raise the math performance of Free and Reduced Lunch students on the 2007 ISTEP: Gr. 3: Raise from 64% to 75% Gr. 4: Raise from 65% to 75% Gr. 5: Maintain at 79%
Timeline Research-based Strategy
to Implement Lead Person Names of Schools
and Grade Span to be Implemented
How will the effectiveness of this practice for increasing student achievement be measured?
Dates Presenter and
Credentials Title / Description
of Presentation In Attendance
(include grade levels, specialty areas, etc.)
Session Length
Is this ongoing?
How will teachers’ effective implementation of the practice be measured?

04/19/23 41
Characteristics of Measures of Effectiveness
Yield reliable information Can be used efficiently Are minimally intrusive Provide feedback that guides action Are aligned with standards Are consistent with larger, summative measures Indicate progress toward a larger goal

04/19/23 42
Measuring the Effectiveness of Improvement Strategies
Useful improvement plans have clear logic that drives the plan’s components and guides the actions.
Effective implementation of planned strategies begins with clear, measurable goals.
A well written goal framing a research based strategy can be measured and adjusted.
Measures of effectiveness evaluate the degree of implementation with fidelity and the impact on student learning.

04/19/23 43
Break-out Session
A set-aside time to review and revise district improvement plans and apply knowledge gained here.
Available assistance from Great Lakes East Comprehensive Center:
Stacy Rush – Students with disabilities Maria Derrick-Mescua – Students learning English Doug Walker Jayne Sowers
Assistance with measuring effectiveness
within district improvement plans

04/19/23 44
References
Blanchard, K. & Johnson, S. (2001). The one minute manager. London: HarperCollins.
Guskey, T. R., (1999). Evaluating professional development. Thousand Oaks, CA: Corwin Press.
Guskey, T. R. (2002) Does it make a difference? Evaluating
professional development. Educational Leadership, 59(6), 45–51.
Institute for Education Sciences, (2007). Reviewing the evidence on how teacher professional development affects student achievement. Washington, DC: U.S. Department of Education. Retrieved 11/7/07 from http://ies.ed.gov/ncee/edlabs/regions/southwest/pdf/REL_2007033.pdf

04/19/23 45
References, continued
McKeever, B. (2003). Nine lessons of successful school leadership teams. San Francisco, CA: WestEd.
Marzano, R. J. (1998). A theory-based meta-analysis of research on instruction.
Aurora, CO: Mid-continent Research for Education and Learning.
O’Neill, J. & Cozemius, A. (1999) The power of SMART goals: Using goals to improve student learning. Bloomington, IN.
Schmoker, M. (1999). Results: The key to continuous school improvement (2nd ed). Alexandria, VA: ASCD.
Scott, C. (2007). Reading First: Locally appreciated, nationally troubled.
Washington, DC. Center on Education Policy. Retrieved 11/6/07 from http://www.cep-dc.org/index.cfm?fuseaction=document.showDocumentByID&nodeID=1&DocumentID=228

04/19/23 46
References, continued
Wang, M. C., Haertel, G. D., & Walberg, H. J. (1993). Toward a knowledge base for school learning. Review of Educational Research, 63(3), 249–294.