measuring the economic impact of privatizing …
TRANSCRIPT
MEASURING THE ECONOMIC IMPACT OF PRIVATIZING LOUISIANA’S PUBLIC
HOSPITAL SYSTEM
Prepared for:
The Alliance of Public Private Partnership Hospitals
By:
Loren C. Scott & Associates, Inc.
743 Woodview Court
Baton Rouge, LA 70810
225-751-1707
www.lorencscottassociates.com
March 2017

ii
EXECUTIVE SUMMARY
Beginning in early 2013, an important change took place for two major components of
healthcare in Louisiana---the way graduate medical education would be delivered and the way
health care was to be provided to the lower income strata of Louisiana citizens. For decades
these services were provided by state-run hospitals, a model used in only one other state in the
U.S. Under the Jindal Administration this model was changed to a private-public partnership in
which the same---but hopefully improved---services were provided via privately run hospitals.
Transitions have taken place at 9hospitals across the state.
As a result of these transitions over 2013-16 new monies flowed into the state budget
from three sources: (1) the state received lease payments matched by federal medical assistance
percentages (FMAP); (2) FMAP payments for physicians that were previously ineligible for
FMAP; and (3) critical capital improvements were made to state facilities that did not have to be
paid for by the state. These are efficiencies to the provision of healthcare in the state and
represent new monies to the state treasury. The amount of these monies, by year, is tabulated in
the first column of Table EX and sum to nearly $2.7 billion.
Table EX
Impacts If All Efficiency Gains Split 50-50 between Higher Education & Healthcare
(Efficiency Gains, Sales, Earnings & Taxes in Millions)
Year Efficiency Gains Sales Earnings Jobs Taxes
2013 $137.4 $263.2 $99.6 2,742 $7.0
2014 $755.6 $1,447.3 $547.8 14,772 $38.3
2015 $853.7 $1,635.3 $618.9 16,690 $43.3
2016 $905.8 $1,735.0 $656.7 17,527 $46.0
Total $2,652.5 $5,080.9 $1,923.0 12,933* $134.6
*Average over four years
We present three scenarios in which these savings to the state were spent: (1) totally to
fund healthcare; (2) spent totally to fund higher education; and (3) 50-50 between funding
healthcare and higher education. The last four columns of Table EX show the input-output table
estimates of the benefit to the state of these efficiency savings under the 50-50 split. In 2016,
these savings supported: (1) over $1.7 billion in sales at businesses in the state; (2) $656.7
million in new household earnings for Louisiana citizens; (3) 17,527 jobs for Louisianans; and
(4) $46 million in additional taxes for the state treasury. To put these gains in perspective,
consider the following reference points:
Compared to total earnings of $656.7 million from the transition, total farm earnings in
Louisiana in 2015 (latest available) were $622.3 million;
The 17,527 jobs created by the transition is almost equal to total employment in St.
Bernard Parish (17,986) and is larger than employment in 39 of Louisiana’s 64 parishes.
The $46 million in additional taxes collected is slightly less than the state collects from
its alcoholic beverage and liquor taxes ($57 million in FY15).

iii
Table of Contents
Page
I. Introduction ....................................................................................................................1
The Transitions ..............................................................................................................1
Value of the Transition ..................................................................................................2
Lease Payments to the State ..........................................................................................2
FMAP Match for Physicians .........................................................................................3
Capital Improvement Payments ...................................................................................4
Total New Monies to State Due to Transition .............................................................5
II. Measuring the Economic Impact of the Transition on the State ..............................6
Multiplier Effect of Transition Efficiency Gains ........................................................7
The Input-Output Table ................................................................................................8
III. Total Impact of Transition on Louisiana Economy .................................................8
Impacts of all Efficiency Gains Spent in Healthcare ..................................................9
Impacts of all Efficiency Gains Spent in Higher Education ....................................12
Impacts of all Efficiency Gains Spent 50/50 Across Healthcare &
Higher Education .......................................................................................................14
IV. Other Efficiencies Gained from the Transition ......................................................16
Graduate Medical Education ......................................................................................16
Quality of Care Delivered for Medicaid & Uninsured Population .........................16

iv
1
I. Introduction
Beginning in early 2013, an important change took place in the way health care was to be
provided to the lower income strata of Louisiana citizens. For decades these services were
provided by state-run hospitals, a model used in only one other state in the U.S. Under the Jindal
Administration this model was changed to a private-public partnership in which the same---but
improved---services were provided via privately run hospitals and graduate medical education
was preserved in the state.
The Transitions
The timing and the changes by geographic area were as follows:
On April 15, 2013 operations of Earl K. Long Hospital were absorbed by Our Lady of the
Lake Regional Medical Center in Baton Rouge.
On June 23, 2013 W.O. Moss Regional Hospital was closed by legislative action. The
hospital building was leased to Lake Charles Memorial Hospital and is being used to
provide ambulatory clinics at that site. Inpatient services were absorbed by Lake Charles
Memorial Hospital.
On June 24, 2013, University Medical Center in Lafayette was transitioned to Lafayette
General Health system and renamed University Hospital & Clinics.
On June 24, 2013 University Medical Center in New Orleans transitioned to University
Medical Center Management Corporation of LCMC Health.
On June 24, 2013 Leonard J. Chabert Medical Center was absorbed by Terrebonne
General Medical Center/Ochsner Health System.

2
On July 1, 2013 the Huey P. Long Hospital in Alexandria was transitioned to the Central
Louisiana Community Health Solution – CHRISTUS St. Francis Cabrini/Rapides
Regional.
On October 1, 2013 the LSU Health Sciences Center at Shreveport was transitioned to
University Health Shreveport which is a wholly owned subsidiary of the Biomedical
Research Foundation. On October 1, 2013 the EA Conway hospital in Monroe,
transitioned to University Health Monroe which is a wholly owned subsidiary of the
Biomedical Research Foundation. On March 17, 2014 the Bogalusa facility in Bogalusa
was transitioned into Our Lady of the Angels.
Value of the Transition
An obvious question is: “Were these transitions of any value to the State?” In this report
we argue that the answer is a definite “yes”. This transition resulted in three main monetary
gains to the State. We address these monetary gains in detail. There are other gains to the state
such as: (1) reduction in wait times at emergency rooms, (2) an increase in out-patient visits, (3)
the elimination of waiting lists for prescriptions and primary care, (4) an expansion of specialty
services offered, (5) transitions to electronic medical records, etc.
Lease Payments to the State
The focus of this report will be on the three main monetary advantages of the transition.
The largest of these monetary benefits are the lease payments that are being paid to the State that
were not there before the transition. Under the terms of some of the agreements between the
private partner and the state, the state retained ownership of all of the buildings and equipment
that were previously part of the Charity system, in return for lease payments by the hospital

3
partner. Not only is the State receiving the lease payments as a new stream of revenue, but also,
these lease payments are subject to the Federal Medical Assistance Percentages (FMAP). For
example, in 2013 $30,402,481 in lease payments was made to the State by the partner hospitals.
There was a $57,746,201 FMAP associated with these payments, so the state budget was boosted
by a total of $88,148,682 in that year. Figure 1 details the total state budget enhancement in each
calendar year from 2013-16. After a substantial boost in 2014, these payments have risen to a
high of $525,212,915 in 2016.
0
100,000,000
200,000,000
300,000,000
400,000,000
500,000,000
600,000,000
2013 2014 2015 2016
Fig. 1: Lease Payments to the State
Do
llars
$88,148,682
$354,160,373
$421,456,047
$525,212,915
Source: Alliance of Public Private Partnership Hospitals

4
FMAP Match for Physicians
Another way the state gained from the transition from public to privately run healthcare
was that payments made to physicians was now eligible for an FMAP matching payment for the
federal government. Figure 2 details the amount of these payments received over 2013-16. Like
the lease payments, these monies start out relatively small in 2013 ($45.6 million). They then
rise dramatically in 2014 when all the hospitals have made the transition, and they remain in the
$350 million range over 2014-16. Thus, a third of a billion dollars that had not accrued to the
state’s economy suddenly appeared full force in 2014.

5
Capital Improvement Payments
Of the three payments benefitting the state, the smallest---but still significant---are the
capital expenditures made by the partnership hospitals over 2013-16. These were critical capital
expenditures that the state would have had to pay for out of the treasury if the partner hospitals
had not stepped in with this spending. As seen in Figure 3, these range in size from a low of
almost $11 million in 2013 to a high over $68 million in 2016 and totaled $140,3 million over
the 4-year period. The top expenditure was on repair of state property ($39.2 million), followed
40,000,000
80,000,000
120,000,000
160,000,000
200,000,000
240,000,000
280,000,000
320,000,000
360,000,000
400,000,000
2013 2014 2015 2016
Fig. 2: Physcian FMAP Payments
Do
llars
$45,631,609
$356,249,397
$388,578,319
$332,780,886
Source: Alliance of Public Private Partnership Hospitals

6
by equipment purchases ($38.3 million) and property ($36 million). Another $26.8 million was
spent on electronic medical record technology.
Total New Monies to State Due to Transition
Describing each of the monetary injections separately in Figures 1-3 may tend to
minimize the total amount of dollars injected into the economy as a consequence of the
transition. Figure 4 sums these monetary injections across all three sources. The total injections
range from a low of over $137.4 million in 2013 to a high of almost $905.8 million in 2016.
0
10,000,000
20,000,000
30,000,000
40,000,000
50,000,000
2013 2014 2015 2016
Fig. 3: New Capital Expenditures
Do
llars
Source: Alliance of Public Private Partnership Hospitals
$3,650,370
$45,175,336$43,691,064
$47,796,305

7
Over this 4-year period, the transition resulted in nearly $2.7 billion being injected into the
economy.
II. Measuring the Economic Impact of the Transition on the State
Is there a way to measure the economic impact of the “transition” on the Louisiana
economy? One way to think of the payments in Figure 4 is to think of them as efficiency gains
to the state from moving to privately provided services. That is, over this 4-year period the state
received nearly $2.7 billion in federally-matched lease payments, FMAP monies for physicians,
and capital improvements that it would not have received absent the transition. The State of
Louisiana has experienced some serious budgetary issues over the past four years, but these
shortfalls would have been much worse absent the “transition”.
100,000,000
200,000,000
300,000,000
400,000,000
500,000,000
600,000,000
700,000,000
800,000,000
900,000,000
1,000,000,000
2013 2014 2015 2016
Fig. 4: Total New Monies Due to Transition
Source: Alliance of Public Private Partnership Hospitals
Do
llars
$137,430,661
$755,585,106
$853,725,429
$905,790,106

8
In measuring the economic impact of the transition, we begin with the direct effects.
Because of the transition nearly $2.7 billion over 2013-16 was effectively injected into the state
coffers that would not have been there otherwise. Because of constitutional limitations, if these
monies had not materialized in each of the years shown in Figure 4 the state would have had to
make cuts in two primary areas---higher education and healthcare. Specifically, in 2013 $137.4
million was able to be spent on higher education and/or healthcare in Louisiana because of the
efficiency gains from the transition. In 2014, 2015, and 2016 the injections into these two areas
of the economy were $755.6 million, $853.7 million, and $905.8 million, respectively.
Multiplier Effect of Transition Efficiency Gains
When these new monies hit the higher education and healthcare sectors, they created
sales, earnings, and jobs in those two sectors that would not have existed absent the efficiency
gains from the transition. But the gains to the economy do not stop there. When those new
earnings are received by employees in healthcare and higher education, those monies will be
spent in the state, creating new sales, earnings and jobs in grocery stores, car dealerships,
theaters, etc., which will then create further spending by those earners, etc., etc.
This chain-reaction (multiplier effect) causes even more jobs to be created. Think of the
Louisiana economy as a large economic pond. Into that pond a new rock is dropped called
“efficiency gains from the transition”. However, when that rock hits the pond it sends ripples all
the way out to the edge of the pond. It is these ripples that we refer to as the “multiplier effect”.
The Input-Output Table

9
The major difficulty lies in attempting to quantify these multiplier impacts. Fortunately, a
technique has been developed for precisely this purpose---an input-output (I/O) table. An I/O
table is a matrix of numbers that describes the interactions between all industries in a
geographical area. The I/O table provides a complete picture of the flows of products and
services in an economy for a given year, illustrating the relationship between producers and
consumers and the interdependencies of industries in a region.
An I/O table for the State of Louisiana has been constructed by the U.S. Bureau of
Economic Analysis (BEA). The BEA is the federal agency in the U.S. Department of Commerce
that generates several key economic statistics on the economy, including real gross domestic
product, state and local area income, profits, and international trade statistics to name a few.
Essentially, data from Figure 4 are plugged into the BEA I/O tables to estimate separately three
impacts of the efficiency on the State: (1) new sales for firms; (2) new household earnings; and
finally; (3) new jobs.
III. Total Impact of Transition on Louisiana Economy
Over 2013-16 nearly $2.7 billion was injected into the Louisiana treasury economy via
the efficiency gains from the transition. In this section the total impacts----both direct and
multiplier effects—are measured. It is important to note that the impacts may vary depending on
how these new monies might have been spent by the state. Since higher education and
healthcare are the most vulnerable to cuts during deficit periods, we assume these monies were
spent in one of, or both, of those two areas of the state budget. We model three different cases:
(1) all of the new monies spent in healthcare, (2) all of the monies spent in higher education, and
(3) a 50-50 split between the two areas.
10
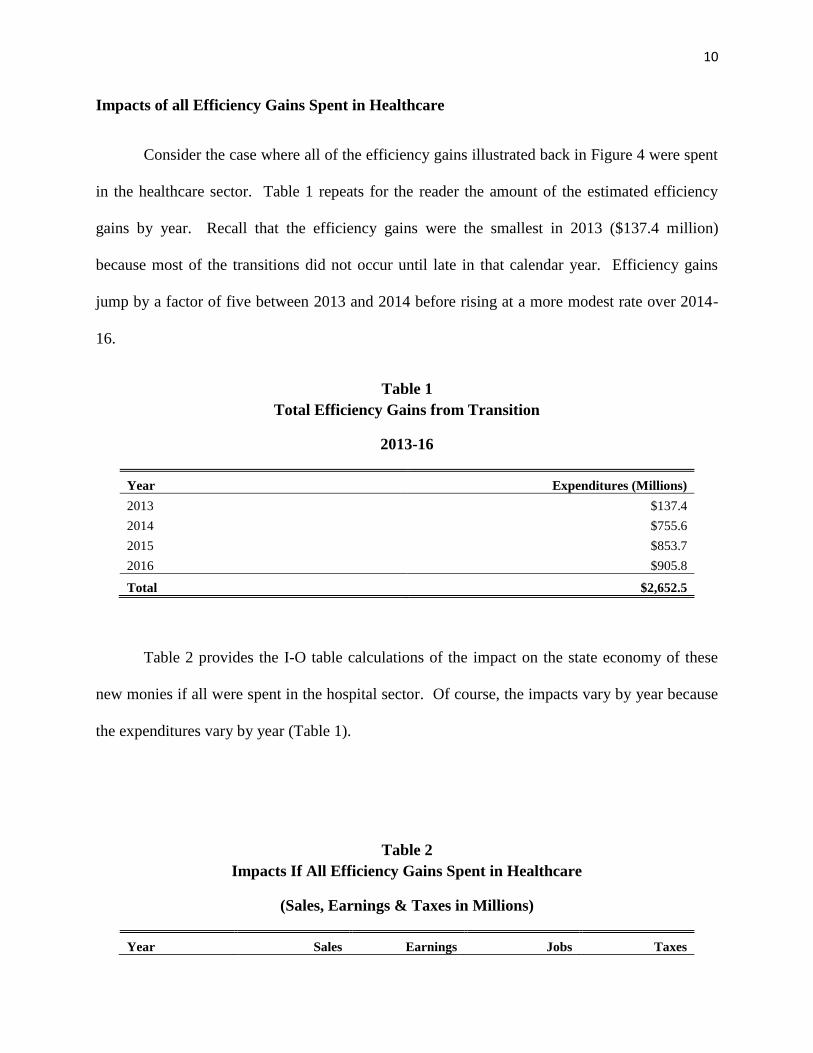
Impacts of all Efficiency Gains Spent in Healthcare
Consider the case where all of the efficiency gains illustrated back in Figure 4 were spent
in the healthcare sector. Table 1 repeats for the reader the amount of the estimated efficiency
gains by year. Recall that the efficiency gains were the smallest in 2013 ($137.4 million)
because most of the transitions did not occur until late in that calendar year. Efficiency gains
jump by a factor of five between 2013 and 2014 before rising at a more modest rate over 2014-
16.
Table 1
Total Efficiency Gains from Transition
2013-16
Year Expenditures (Millions)
2013 $137.4
2014 $755.6
2015 $853.7
2016 $905.8
Total $2,652.5
Table 2 provides the I-O table calculations of the impact on the state economy of these
new monies if all were spent in the hospital sector. Of course, the impacts vary by year because
the expenditures vary by year (Table 1).
Table 2
Impacts If All Efficiency Gains Spent in Healthcare
(Sales, Earnings & Taxes in Millions)
Year Sales Earnings Jobs Taxes

11
2013 $262.3 $97.3 2,199 $6.8
2014 $1,442.0 $534.8 11,849 $37.4
2015 $1,629.3 $604.3 13,388 $42.3
2016 $1,728.7 $641.1 14,059 $44.9
Total $5,062.4 $1,877.5 10,374* $131.4
*Average over 4 years
The gains to the state’s economy are far from trivial. Note that three years after the
transition is fully implemented (2016) these efficiency gains have created: (1) over $1.7 billion
in new business sales in the state, (2) $641.1 million in new household earnings for
Louisianans, and (3) 14,059 jobs for Louisiana citizens. As one reference point, the total
number of jobs created by Louisiana’s film tax credit program in 2016 was 14,194.1 If the
earnings generated ($641.1 million) is divided by the number of jobs created (14,059) the result
is an average wage per job of $45,600---a figure seven percent higher than the average wage in
the private sector in Louisiana in January 2017.2
It is also possible to determine how much this new economic activity, caused by the
efficiency gains, impacts state revenue collections. Officials in Louisiana’s Legislative Fiscal
Office have estimated that for every new dollar created in the economy that state collects about
seven cents in new sales taxes, income taxes, gasoline taxes, fees, etc. Thus, the $641.1 million
in new earnings created by the efficiency gains in 2016 resulted in an estimated $44.9 million in
new revenues for the state treasury.
1 “The Economic Impact of Louisiana’s Entertainment Tax Credit Programs for Film. Live Performance & Sound Production”, Loren C. Scott & Associates, for the Office of Entertainment Industry Development, Louisiana Department of Economic Development, March 2017, p. iv. 2 Louisiana Workforce at a Glance, Louisiana Workforce Commission, March 13, 2017, p. 18.

12
It may be of interest to learn which industries in the state gained the most in 2016 if the
efficiency gains were all spent in the healthcare sector. The data in Table 3 show the I/O table
estimates.
Table 3
Impacts by Industry If All Efficiency Gains Spent In Healthcare
(Sales & Earnings in Millions)
Industry Sales Earnings Jobs
Agriculture, Forestry, Fishing, and Hunting $5.2 $1.2 27
Mining $12.6 $2.2 23
Utilities $28.0 $4.3 46
Construction $9.2 $3.5 63
Durable Goods Manufacturing $12.7 $2.6 52
Nondurable Goods Manufacturing $76.0 $12.0 187
Wholesale Trade $54.3 $17.2 263
Retail Trade $68.2 $24.6 874
Transportation and Warehousing $36.2 $11.5 230
Information $28.5 $6.2 118
Finance and Insurance $71.8 $19.6 444
Real Estate and Rental and Leasing $90.3 $14.7 669
Professional, Scientific, and Technical Services $61.4 $27.6 445
Management Of Companies and Enterprises $14.9 $6.2 81
Administrative and Waste Management Services $47.9 $21.6 780
Educational Services $9.7 $4.5 150
Health Care and Social Assistance $1,003.5 $427.2 8,205
Arts, Entertainment, and Recreation $8.0 $2.4 102
Accommodation $10.3 $2.9 100
Food Services and Drinking Places $34.8 $11.3 622
Other Services $45.1 $16.8 492
Households $0.0 $0.9 85
Total $1,728.7 $641.1 14,059
It should be no surprise that the largest gains are to firms and employees in the healthcare
sector---the sector where the first direct impacts are felt---where the sales gains are over $1
billion, earnings gains to healthcare workers are $427.2 million, and 8,200 jobs were created. In
13
terms of jobs, the next biggest gainers are retail trade (874 jobs), administrative & waste services
(780 jobs), real estate/rentals/leasing (669 jobs) and food & drinking places (622 jobs).
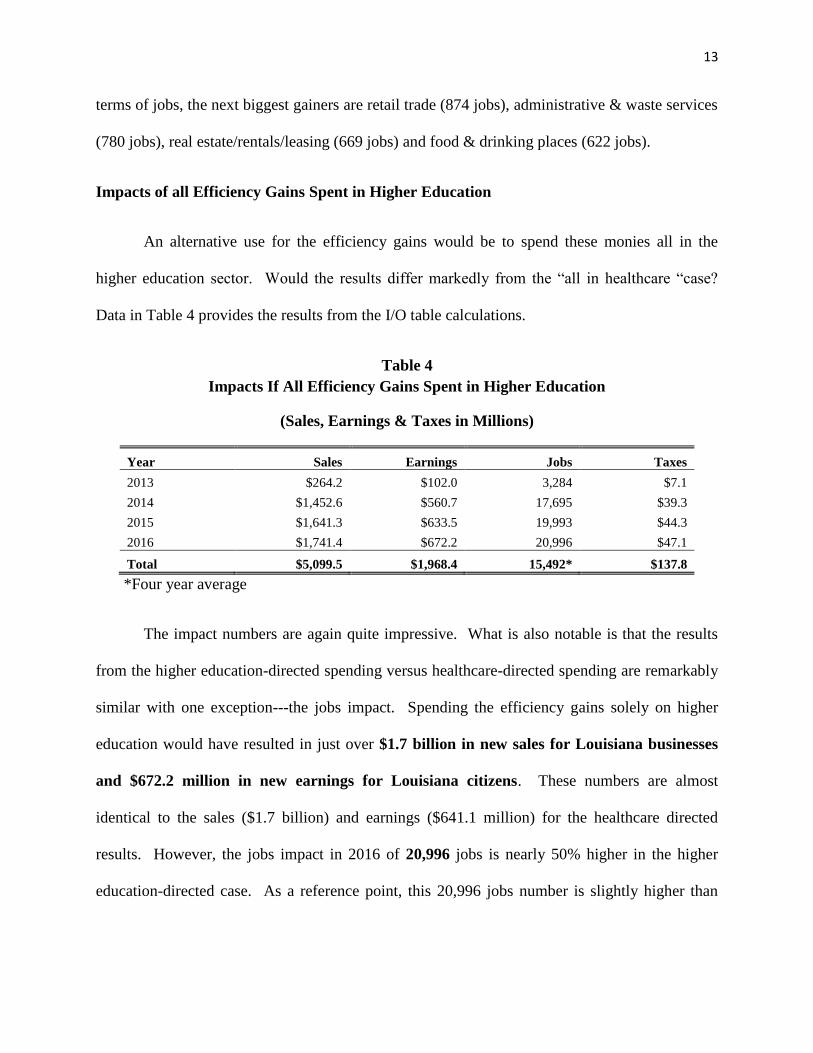
Impacts of all Efficiency Gains Spent in Higher Education
An alternative use for the efficiency gains would be to spend these monies all in the
higher education sector. Would the results differ markedly from the “all in healthcare “case?
Data in Table 4 provides the results from the I/O table calculations.
Table 4
Impacts If All Efficiency Gains Spent in Higher Education
(Sales, Earnings & Taxes in Millions)
Year Sales Earnings Jobs Taxes
2013 $264.2 $102.0 3,284 $7.1
2014 $1,452.6 $560.7 17,695 $39.3
2015 $1,641.3 $633.5 19,993 $44.3
2016 $1,741.4 $672.2 20,996 $47.1
Total $5,099.5 $1,968.4 15,492* $137.8
*Four year average
The impact numbers are again quite impressive. What is also notable is that the results
from the higher education-directed spending versus healthcare-directed spending are remarkably
similar with one exception---the jobs impact. Spending the efficiency gains solely on higher
education would have resulted in just over $1.7 billion in new sales for Louisiana businesses
and $672.2 million in new earnings for Louisiana citizens. These numbers are almost
identical to the sales ($1.7 billion) and earnings ($641.1 million) for the healthcare directed
results. However, the jobs impact in 2016 of 20,996 jobs is nearly 50% higher in the higher
education-directed case. As a reference point, this 20,996 jobs number is slightly higher than
14
total employment in St. Martin Parish in January 2016 (20,362).3 As seen in the last column of
Table 4, the transition was good for the state treasury also through the new taxes and fees created
by the new spending in the economy. In 2016, an estimated $47.1 million flowed into the
treasury via this effect.
While there are more jobs created if the efficiency gains are higher education-directed, it
is important to note that these gains come at the expense of the quality of the jobs. If the 2016
earnings figure of $672.2 million is divided by total jobs created that year (20,996) the result is
an average annual wage of $32,016. This figure is 25% lower than the average annual wage in
the private sector in Louisiana ($42,578).4
Table 5 illustrates the I/O table estimates of the distribution of the sales, earnings, and job
gains across industries for the higher education-directed spending. Obviously, people in the
educational services sector are the top gainers with 14,372 of the total of 20,996 jobs created.
The #2 job beneficiary is the real estate/rental/leasing sector (999 jobs), followed by #3 retail
trade (937) jobs and #4 healthcare (920 jobs). A rough comparison of the job distribution in
Table 5 versus Table 3 gives a clue as to why the overall average wage is much higher in the
healthcare-directed spending. There are far more jobs in healthcare in Table 3, a sector where
the average weekly wage in hospitals is $1,051 as compared to the dominating educational
services sector in Table 5, a sector where the average weekly wage is $744.5
3 Ibid, p. 17. 4 Ibid, p. 18. 5 www.laworks.net. Data are for 2016-III.

15
Table 5
Impacts by Industry If All Efficiency Gains Spent In Higher Education
(Sales & Earnings in Millions)
Industry Sales Earnings Jobs
Agriculture, Forestry, Fishing, and Hunting $5.8 $1.4 29
Mining $14.1 $2.4 27
Utilities $41.6 $6.4 69
Construction $11.8 $4.5 80
Durable Goods Manufacturing $15.4 $3.2 62
Nondurable Goods Manufacturing $70.0 $11.1 186
Wholesale Trade $43.7 $13.9 212
Retail Trade $72.7 $26.1 937
Transportation and Warehousing $38.0 $11.9 237
Information $33.2 $7.2 139
Finance and Insurance $57.3 $15.0 343
Real Estate and Rental and Leasing $133.0 $21.4 999
Professional, Scientific, and Technical Services $46.1 $20.7 334
Management Of Companies and Enterprises $12.9 $5.4 70
Administrative and Waste Management Services $34.5 $15.0 534
Educational Services $922.8 $431.3 14,372
Health Care and Social Assistance $85.0 $38.9 920
Arts, Entertainment, and Recreation $10.1 $3.3 133
Accommodation $13.1 $3.7 127
Food Services and Drinking Places $31.6 $10.2 566
Other Services $48.6 $18.0 531
Households $0.0 $1.0 90
Total $1,741.4 $672.2 20,996
Impacts of all Efficiency Gains Spent 50/50 Across Healthcare & Higher Education
An even more realistic scenario is that the efficiency gains from the transition were split
between the healthcare sector and higher education. What Table 6 shows are the gains to the
state economy with a 50-50 split of the gains distributed between the two sectors. Given what

16
has been learned to this point it is no surprise that the impact estimates lie between the results
shown back in Tables 2 and 4.
Table 6
Impacts If All Efficiency Gains Split 50-50 between Higher Education & Healthcare
(Sales, Earnings & Taxes in Millions)
Year Sales Earnings Jobs Taxes
2013 $263.2 $99.6 2,742 $7.0
2014 $1,447.3 $547.8 14,772 $38.3
2015 $1,635.3 $618.9 16,690 $43.3
2016 $1,735.0 $656.7 17,527 $46.0
Total $5,080.9 $1,923.0 12,933 $134.6
According to the I/O table, in 2016 this distribution would have generated: (1) over $1.7 billion
in new sales for Louisiana businesses, (2) $656.7 million in new household earnings for the
state’s citizens, (3) 17,527 new jobs for Louisianans, and (4) another $46 million for the
state treasury via the multiplier effect. To put these gains in perspective, consider the
following reference points:
Compared to total earnings of $656.7 million from the transition, total farm earnings in
Louisiana in 2015 (latest available) were $622.3 million;6
The 17,527 jobs created by the transition is almost equal to total employment in St.
Bernard Parish (17,986) and is larger than employment in 39 of Louisiana’s 64 parishes.7
The $46 million in additional taxes collected is slightly less than the state collects from
its alcoholic beverage and liquor taxes ($57 million in FY15).8
6 www.bea.gov 7 Louisiana Workforce at a Glance, Louisiana Workforce Commission, March 13, 2017, p. 17. 8 Louisiana Department of Revenue, Annual Tax Collections Report, 2014-15, p. 10.

17
IV. Other Efficiencies Gained from the Transition
Our focus to this point has been on the efficiency gains from the transition that generated
new monies for the state treasury. However, there were other gains from the transition that were
very helpful to the provision of healthcare in the state.
Graduate Medical Education
Just prior to the transition, graduate medical education in Louisiana was in jeopardy. The
privatization secured graduate medical education for the state of Louisiana. The impact of this
for the future of care delivery cannot be ignored---over 50% of the physicians currently
practicing in the state of Louisiana were trained at University Medical Center New Orleans, just
one partner hospital. The partner hospitals train thousands of residents each year, and offer
programs across the spectrum, from acute settings to rural.
Quality of Care Delivered for Medicaid & Uninsured Population
In terms of quality care delivery, the efforts by the partner hospitals since the first
privatization in April 2012 have resulted in improved wait times, significant expansion of
specialty services, cost savings, transition of public employees to private entities, and improved
outcomes throughout the entire State for the citizens most in need. Each partner has expanded
specialty services offered in their region and developed specific programs designed to address
chronic conditions of the Medicaid and uninsured patient population. This focus on preventative
care and wellness will help shift the cost curve from more expensive emergency and acute care.

18
The list of successes is lengthy, but highlights include:
Partner hospitals have generated across the board reduction in ER wait times, increase in
outpatient testing and procedures, and elimination of waiting lists for prescriptions and
primary care. Partner hospitals are reporting over 20% increases in outpatient clinic
visits, with some doubling in visit volume post-transition. L. J. Chabert reports a 60%
increase in out-patient visits, while University Hospital & Clinics has seen an 83%
increase in (less costly vs. inpatient or emergency) outpatient encounters. Partner
hospitals, including the Central Louisiana partnership of Rapides Regional Medical
Center and CHRISTUS St. Frances Cabrini, have established urgent care centers,
allowing patients to access care outside of the emergency rooms.
Chronic conditions such as diabetes and hypertension have been identified and addressed
with programs, patient coaches, and free insulin, glucometer, and supplies. Lake Charles
Memorial Hospital opened a GI and Breast Health Clinic, resulting in increased volume
and compliance with GI screens and mammograms, allowing for early stage diagnosis
and treatment of cancer care.
A major expansion or establishment of specialty services offered has occurred. Patients
no longer have to travel to other cities seeking specialty care for the following:
Oncology Services ENT-Audiology
Neurosurgery Orthopedics
Mental health Pulmonology
Radiology Cardiology
Infectious Disease Electromyography
Dental services Cataract Surgeries and other Eye procedures
Outpatient Therapy Rehabilitation Kidney biopsies, outpatient dialysis
Partner hospitals have reduced costs per patient since the transition. Using existing
operations and efficient processes, L.J. Chabert has reduced cost per adjusted discharge
by more than 12%, Our Lady of the Lake’s cost per patient day declined from $4,137
under Earl K. Long to $1,690 in FY2015, and University Hospital and Clinics (Lafayette)
reports a 23% reduction in expense/adjusted patient day when comparing 2015 to 2013.
The Louisiana Department of Health has reported over $40M in savings at University
Health in Shreveport.
Over 4,000 State employees have been shifted to private employment, and collectively
the partner hospitals currently employ almost 9,000 employees dedicated to the delivery
of healthcare to Medicaid and uninsured patients.

19