measuring solar spectral and angle-of-incidence...
TRANSCRIPT
MEASURING SOLAR SPECTRAL AND ANGLE-OF-INCIDENCE EFFECTS ON PHOTOVOLTAIC MODULES AND SOLAR IRRADIANCE SENSORS
David L. King, Jay A. Kratochvil, and William E. Boyson Sandia National Laboratories, Albuquerque, NM
ABSTRACT SOLAR SPECTRAL INFLUENCE
Historically, two time-of-day dependent factors have complicated the characterization of photovoltaic module and array performance; namely, changes in the solar spectrum over the day and optical effects in the module that vary with the solar angle-of-incidence. This paper describes straightforward methods for directly measuring the effects of these two factors. Measured results for commercial modules, as well as for typical solar irradiance sensors (pyranometers) are provided. The empirical relationships obtained from the measurements can be used to improve the methods used for system design, verification of performance after installation, and diagnostic monitoring of performance during operation.
INTRODUCTION
It is common knowledge to people familiar with photovoltaic technology that the electrical current generated by photovoltaic devices is influenced by the spectral distribution (spectrum) of sunlight. It is also commonly understood that the spectral distribution of sunlight varies during the day, being “redder” at sunrise and sunset and “bluer” at noon. The magnitude of the influence that the changing spectrum has on performance can vary significantly, depending on the photovoltaic technology being considered. In any case, spectral variation introduces a systematic influence on performance that is time-of-day dependent. The influence of spectral variations on photovoltaic devices has been documented by several authors [I , 2, 3, 41. Similarly, the optical characteristics of photovoltaic modules or pyranometers can result in a systematic influence on their performance related to the solar angle-of-incidence [5, 61.
This paper describes straightforward methods for directly measuring the influences of variations in solar spectral irradiance and solar angle-of-incidence as a function of time-of-day. The empirical relationships that result can be directly applied during outdoor performance testing of modules or arrays or for system performance predictions, as demonstrated elsewhere [7, 8, 9, 101.
Sandia is a multiprogram laboratory operated by Sandia Corporation, a Lockheed Martin Company, for the United States Department of Energy under Contract DE-ACO4- 94AL85000.
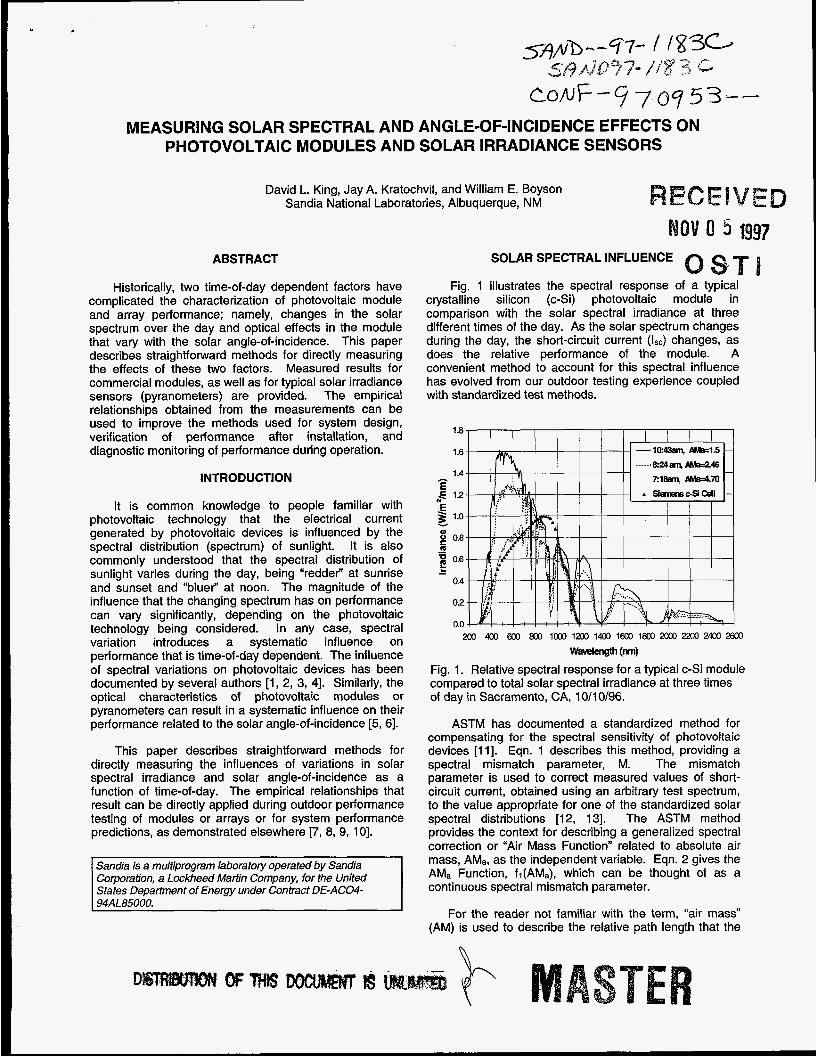
Fig. 1 illustrates the spectral response of a typical crystalline silicon (c-Si) photovoltaic module in comparison with the solar spectral irradiance at three different times of the day. As the solar spectrum changes during the day, the short-circuit current (Isc) changes, as does the relative performance of the module. A convenient method to account for this spectral influence has evolved from our outdoor testing experience coupled with standardized test methods.
is
1.6
1.4 A
E ,E 1.2
$ 1.0 E 0.8 Y
m 0.6
0.4
0.2
0.0
L -
ax, 400 600 800 loo0 lax, 1400 1600 1800mmx,2400 2600
W e n g t h (m) Fig. 1. Relative spectral response for a typical c-Si module compared to total solar spectral irradiance at three times of day in Sacramento, CA, 10/10/96.
ASTM has documented a standardized method for compensating for the spectral sensitivity of photovoltaic devices [Ill. Eqn. 1 describes this method, providing a spectral mismatch parameter, M. The mismatch parameter is used to correct measured values of short- circuit current, obtained using an arbitrary test spectrum, to the value appropriate for one of the standardized solar spectral distributions [12, 131. The ASTM method provides the context for describing a generalized spectral correction or “Air Mass Function” related to absolute air mass, AMa, as the independent variable. Eqn. 2 gives the AMa Function, fi(AMa), which can be thought of as a continuous spectral mismatch parameter.
For the reader not familiar with the term, “air mass” (AM) is used to describe the relative path length that the

DISCLAIMER
This report was prepared as an account of work sponsored by an agency of the United States Government. Neither the United States Government nor any agency thereof, nor any of their employees, makes any warranty, express or implied, or assumes any legal liability or responsibility for the accuracy, completeness, or use- fulness of any information, apparatus, product, or process disclosed, or represents that its use would not infringe privately owned rights. Reference herein to any spe- cific commercial product, process, or service by trade name, trademark, manufac- turer, or otherwise does not necessarily constitute or imply its endorsement, m m - mendation. or favoring by the United States Government or any agency thereof. The views and opinions of authors expressed herein do not necessarily state or reflect those of the United States Government or any agency thereof.

.
1

sun’s rays traverse through the atmosphere before reaching the ground. An AM=l condition occurs when the sun is directly overhead at a sea-level site; air mass values of 10 or greater occur near sunrise and sunset. Air mass is calculated based on the zenith angle of the sun [14]. The zenith angle can be accurately calculated given site location, day of the year, and the time of day. To compensate for sites at altitudes other than sea level, air mass is “pressure corrected and the term “absolute air mass” (AMa) is used. Eqns. (3-5) can be used to calculate AMa as a function of the solar zenith angle, L, and h, the site altitude in meters.
Isc, E,* E Isc,
.-- &I=--;- - f, (AM, 1
Where: E(h) = solar spectral irradiance present during test, Eo@) = reference solar spectral irradiance at prevailing AMaZ1.5 condition, Rt(h) = spectral response of test module at reference temperature, Rr(h) = spectral response of reference thermopile pyranometer, a,b = integration limits defined by test device, c,c! = integration limits defined by reference pyranometer, Eo = total irradiance from thermopile pyranometer for normal incidence, AMa=1.5 condition, E = total irradiance from thermopile pyranometer for test spectrum, normal incidence, lscto = short-circuit current from test module at reference temperature, normal incidence, AMa=1.5 condition, lsct = measured short-circuit current from test module at reference temperature, normal incidence, and prevailing test spectrum.
AM = [cos(Z,) + 05057. (96.080- Zs)-1.634]-1 (3) P
A M , = - - A M Po
(4)
-- p - e (-.0001184. h) (5) Po
Description of Measurement Procedure
During the test to measure the AMa Function, the module and the thermopile pyranometer must be mounted on a solar tracker to eliminate the influence of solar angle- of-incidence. The spectral response of a typical thermopile pyranometer (Eppley PSP) can be considered to be essentially constant over its spectral response range (300 to 3000 nm). In this case, Eqn. 1 reduces to the simpler expression given in Eqn. 2. The four variables in
Eqn. 2 are all directly measured parameters. Thus, the spectral mismatch parameter can be determined on a continuous basis by simply measuring the short-circuit current from the module and the irradiance indicated by the thermopile pyranometer, from sunrise to sunset.
The solar spectrum chosen as the reference for the test was the prevailing spqctrum at the time of day when AMa=1.5. Therefore, Eo and lscto were the values measured during this reference condition. In order to make the results independent of the day of the year, the spectral correction parameter was described as a function of AMa. The resulting empirical relationship, fr(AMa), was called the “AMa Function.” Thus, analogous to the spectral mismatch parameter, M, the AMa Function can be used to relate short-circuit current measured at different times of the day to a reference solar spectral condition.
Fig. 2 illustrates the AMa Functions measured for a variety of photovoltaic devices, including commercial crystalline, multicrystalline, and amorphous silicon modules, a Silicon-FilmTM module, and a silicon- photodiode pyranometer. The magnitude of the AMa Function depends on the spectral response characteristics of the photovoltaic module. In particular, the relative spectral response at long (red) wavelengths versus short (blue) wavelengths dictates the shape of the curve. If the blue response is low and the red high, then higher relative response at large AMa results. Amorphous silicon modules show decreasing response as air mass increases because their spectral response is limited to wavelengths less than about 900 nm.
1.20 1 I I 1 I I I
= 0.60- *ucoRPyrafK#?ter .. a AP4225,Si-Filrn
0.50- I I I I i
0.5 1.5 25 3.5 4.5 5.5 6.5 Absolute Air Mass, AMa
Fig. 2. Relative short-circuit current versus AMa for a variety of photovoltaic modules and a silicon-photodiode pyranometer.
For general applicability, the empirically determined AMa Function needs to be repeatable from day to day, and ideally from site to site. In order to evaluate repeatability, the AMa Function for a crystalline silicon reference cell has been measured many times during the last two years. Fig. 3 illustrates eleven different measurements made in different months of the year under

nominally clear sky conditions. The results were quite repeatable and illustrate the benefit of relating the spectral effect to AMa as the independent variable. In addition, the AMa Function for modules under clear sky conditions has been found to be relatively consistent from day to day, season to season, and even site to site.
1.08
A 1.06 s 3 1.04 d E 1.02
8 1.00
0 Q
U
*= 0.96 Le 0.96
m al -
0.94 0.5 1.0 1.5 2.0 2.5 3.0 3.5 4.0 4.5 5.0 5.5
Absolute Air Mass, AM.
Fig. 3. AMa Functions measured over a two year period for a c-Si reference cell (MK-22).
Direct and Diffuse Irradiance Components
The total solar irradiance, Et, can be considered to be composed of two components, a direct beam component and a diffuse component. The direct component is typically defined as the direct normal irradiance, Edni, the irradiance within a 5.7” view angle with the sun at the center. The irradiance outside that view angle is considered diffuse, Ediff. This distinction is necessary in order to correctly measure the influence of solar angle-of- incidence on module performance.
Most procedures currently used for measuring the performance of modules or arrays do not attempt to distinguish between the direct and the diffuse components of the total solar irradiance. Rather, outdoor performance testing is typically conducted during clear sky conditions when the total irradiance is primarily (-90%) direct irradiance. Calibration of solar irradiance sensors (pyranometers) is also typically conducted during clear conditions. However, in actual operation, both photovoltaic systems and pyranometers are used in clear and in overcast conditions. Therefore, it is desirable to be able to distinguish relative performance under direct versus diffuse irradiance.
The spectral distribution of diffuse solar irradiance behaves differently from the distribution of direct solar irradiance. Fig. 4 illustrates measurements of the direct and diffuse spectral irradiance at two different times of the day, solar noon and late afternoon. From Fig. 4, it can be seen that the spectral distribution of Edni changes significantly over the day, while the spectral distribution of EdiH remains nominally the same. Thus, the AMa Functions previously shown were influenced primarily by
changes in the direct normal spectrum. For completely diffuse irradiance, module performance does not depend on solar angle-of-incidence; for instance, under very overcast conditions, Isc doesn’t change as the module is pointed in different directions.
1.6 -AMa=I I .09, Direct
-.-.AMa=1.09, DiHuse -AMa=3. Direct
1.4 - h
0.2
0.0 200 400 600 800 1000 1200
Wavelength (nm) Fig. 4. Direct and diffuse solar spectral irradiance at solar noon and at high AMa, Sacramento, CA, 8/11/97.
The same test sequence used to measure the AMa Function also provided data for determining separate “calibration constants,” CI and CZ, for direct and diffuse irradiance, respectively. Using the same data, the constants C1 and CP can be determined using multilinear regression and the model in Eqn. 6. On the left side of the equation, the measured Isc was adjusted to a reference temperature, To, using a temperature coefficient, a. The Isc was also adjusted to the reference solar spectrum using the AMa Function previously determined. The reference irradiance level, Eo, was assumed to be 1000 W/m2. During the test, the direct normal irradiance, Edni, was measured using a thermopile pyrheliometer (Eppley NIP). The diffuse irradiance, EdiH, was calculated as in Eqn. 7. The diffuse calibration constant, Cp, is needed to measure the influence of solar angle-of-incidence.
E , = E, - Ehi * COS( AOI) (7)
SOLAR ANGLE-OF-INCIDENCE
The influence of a module’s optical characteristics on its performance can also be measured under outdoor test conditions in a straightforward manner. The measurement procedure developed provided a second empirical function, fz(AOl), called the “A01 Function” which related the module’s Isc to the solar angle-of-incidence (AOI). The A01 Function addresses effects that are beyond the typical geometric “cosine” losses.
To perform the measurement, a computer-controlled two-axis solar tracker was required. A thermopile pyranometer (Eppley PSP) and the test module were
. mounted on the tracker. A thermopile pyrheliometer (Eppley NIP) was mountec on a separate solar tracker. The NIP provided a measurement of Edni and the combination of the NIP and PSP provided the diffuse irradiance, Ediff, as in Eqn. 7. The test module was moved through a programmed sequence of azimuth offset angles in order to vary the AOI from -90 to +90 degrees, while maintaining other variables such as irradiance level, solar spectrum, and ambient temperature nominally constant. The method used for calculating angle-of-incidence is given by Eqn. 8.
cos(Tm)cos(z,) + sin(Tm) sin(Z,)cos(AZ, - AZ,) AOZ = COS-’
Where: AOI = solar angle-of-incidence (deg) Tm =tilt angle of module (deg, 0” is horizontal) Zs = zenith angle of the sun (deg) AZ, = azimuth angle of module (O”=North, 9O0=East) AZs = azimuth angle of sun (deg)
1 .E
0 1 0 m ~ 4 0 5 0 6 0 7 0 8 0 ~
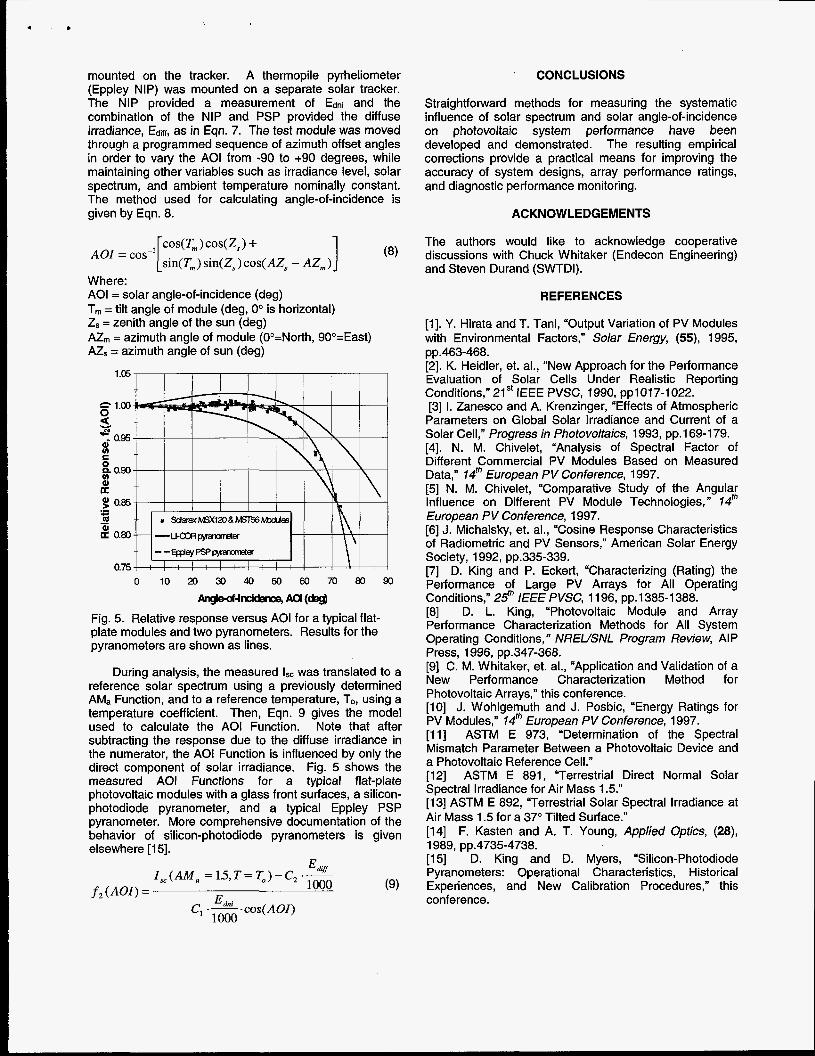
me-ofqncidence, (W Fig. 5. Relative response versus AOI for a typical flat- plate modules and two pyranometers. Results for the pyranometers are shown as lines.
During analysis, the measured Isc was translated to a reference solar spectrum using a previously determined AMa Function, and to a reference temperature, To, using a temperature coefficient. Then, Eqn. 9 gives the model used to calculate the AOI Function. Note that after subtracting the response due to the diffuse irradiance in the numerator, the AOI Function is influenced by only the direct component of solar irradiance. Fig. 5 shows the measured A01 Functions for a typical flat-plate photovoltaic modules with a glass front surfaces, a silicon- photodiode pyranometer, and a typical Eppley PSP pyranometer. More comprehensive documentation of the behavior of silicon-photodiode pyranometers is given elsewhere [15].
CONCLUSIONS
Straightforward methods for measuring the systematic influence of solar spectrum and solar angle-of-incidence on photovoltaic system performance have been developed and demonstrated. The resulting empirical corrections provide a practical means for improving the accuracy of system designs, array performance ratings, and diagnostic performance monitoring.
ACKNOWLEDGEMENTS
The authors would like to acknowledge cooperative discussions with Chuck Whitaker (Endecon Engineering) and Steven Durand (SWTDI).
REFERENCES
[l]. Y. Hirata and T. Tani, “Output Variation of PV Modules with Environmental Factors,” Solar ,Energy, (55), 1995,
[2]. K. Heidler, et. al., “New Approach for the Performance Evaluation of Solar Cells Under Realistic Reporting Conditions,” 21” IEEE PVSC, 1990, pp1017-1022. [3] I. Zanesco and A. Krenzinger, “Effects of Atmospheric Parameters on Global Solar Irradiance and Current of a Solar Cell,” Progress in Photovoltaics, 1993, pp. 169-1 79. [4]. N. M. Chivelet, “Analysis of Spectral Factor of Different Commercial PV Modules Based on Measured Data,” 14M European PV Conference, 1997. [5] N. M. Chivelet, “Comparative Study of the Angular Influence on Different PV Module Technologies,” 14” European PV Conference, 1997. [6] J. Michalsky, et. al., “Cosine Response Characteristics of Radiometric and PV Sensors,” American Solar Energy Society, 1992, pp.335-339. [7] D. King and P. Eckert, “Characterizing (Rating) the Performance of Large PV Arrays for All Operating Conditions,” 2 9 lEEE PVSC, 1 196, pp.1385-1388. [8] D. L. King, ”Photovoltaic Module and Array Performance Characterization Methods for All System Operating Conditions,” NREUSNL Program Review, AIP Press, 1996, pp.347-368. [9] C. M. Whitaker, et. al., “Application and Validation of a New Performance Characterization Method for Photovoltaic Arrays,” this conference. [ lo] J. Wohlgemuth and J. Posbic, “Energy Ratings for PV Modules,” 14“ European PV Conference, 1997. [ll] ASTM E 973, “Determination of the Spectral Mismatch Parameter Between a Photovoltaic Device and a Photovoltaic Reference Cell.” [12] ASTM E 891, “Terrestrial Direct Normal Solar Spectral Irradiance for Air Mass 1.5.” [13] ASTM E 892, “Terrestrial Solar Spectral Irradiance at Air Mass 1.5 for a 37” Tilted Surface.” [14] F. Kasten and A. T. Young, Applied Optics, (28),
[15] D. King and D. Myers, “Silicon-Photodiode Pyranometers: Operational Characteristics, Historical Experiences, and New Calibration Procedures,” this conference.
pp.463-468.
1989, pp.4735-4738.