measuring residential ventilation - lawrence … · 2018-03-26 · 1 system airflows: part 1 j....
TRANSCRIPT

1
Measuring Residential Ventilation System Airflows: Part 1 – Laboratory Evaluation of Airflow Meter Devices J. Chris Stratton, W.J.N Turner, Craig P. Wray, Iain S.
Walker
Environmental Energy Technologies Division
November 2012

2
Disclaimer
This document was prepared as an account of work sponsored by the United States Government. While this
document is believed to contain correct information, neither the United States Government nor any agency
thereof, nor the Regents of the University of California, nor any of their employees, makes any warranty,
express or implied, or assumes any legal responsibility for the accuracy, completeness, or usefulness of any
information, apparatus, product, or process disclosed, or represents that its use would not infringe privately
owned rights. Reference herein to any specific commercial product, process, or service by its trade name,
trademark, manufacturer, or otherwise, does not necessarily constitute or imply its endorsement,
recommendation, or favoring by the United States Government or any agency thereof, or the Regents of the
University of California. The views and opinions of authors expressed herein do not necessarily state or reflect
those of the United States Government or any agency thereof or the Regents of the University of California.
Acknowledgments
This work was supported by the Assistant Secretary for Energy Efficiency and Renewable Energy, Office of
Building Technology, State and Community Programs, of the U.S. Department of Energy under Contract No.
DE-AC02-05CH11231 and by the California Energy Commission under Pier Contract 500-08-061.

3
Key terms: residential, mechanical ventilation, measurement, ASHRAE 62.2, flow hood
ABSTRACT
Building codes increasingly require tighter homes and mechanical ventilation per ASHRAE Standard 62.2. These
ventilation flows must be measured so that energy is not wasted with over ventilation and occupants’ health is not
compromised by under ventilation. Flow hoods are used to measure these ventilation flows, but there is currently no
standard specifying the measurement procedure and measurement devices that should be used. This study evaluates the
accuracy of six commercially available flow hoods under laboratory conditions configured to emulate a residential
mechanical ventilation duct system. The measurements taken with the flow hoods were compared to simultaneous
measurements taken by an in-line reference flow meter having a known uncertainty. Results indicate that powered flow
hoods yield more accurate measurements than non-powered flow hoods, and that a majority of the flow hoods measured
inlet flows more accurately than outlet flows. In several cases, there was little resemblance between the manufacturers’
stated accuracy and the accuracy we found in our laboratory measurements. It is clear that current flow hood calibration
procedures may not consider field application variables such as flow asymmetry, flow angle, and flow direction. A new
flow hood measurement standard that takes these ‘real world’ conditions into account should be developed to ensure that
residential buildings receive the intended ventilation flows.

4
I. INTRODUCTION
Why should we measure ventilation airflows?
Homes need ventilation to maintain acceptable indoor air quality (IAQ). In older homes, infiltration of outdoor air through
leaks in the building envelope was usually sufficient to dilute constantly-emitted indoor pollutants, such as formaldehyde
and bioeffluents, to concentrations that are healthy and comfortable for occupants. Exhaust fans in bathrooms and
kitchens were used to control specific pollution sources such as cooking and combustion byproducts as well as moisture
and odor. However, the envelopes of new homes have become increasingly tight in order to lower heating and cooling
loads. A couple of the longest standing drivers for tighter homes are state weatherization programs that include air
tightening as standard practice and the California State Energy Code for homes (Title 24 Part 6) that includes credits for
homes with tighter envelopes. Home performance ratings such as the RESNET HERS Index or LEED® (see Table 1)1
include reduced air leakage in calculations of and requirements for increased home performance. The US EPA
EnergyStar for homes program has a prescriptive requirement for airtightness2 (5 ACH50 for most of California). The
International Energy Conservation Code (IECC) also has limits for air leakage – currently 7 ACH50 but being reduced in
2012 to 5 ACH50 in Climate Zone (CZ) 1 and 2 and to 3 ACH50 in all other CZs (International Code Council, 2012a,
2012b). To maintain acceptable IAQ, many of these same code, regulatory, and labeling bodies are now requiring whole-
house mechanical ventilation and refer to ASHRAE Standard 62.2 for minimum requirements (ASHRAE, 2010).
Table 1: LEED® for Homes requirements for air leakage
ASHRAE Standard 62.2 requires mechanical ventilation for both whole building and local exhaust. The whole building
airflows are required to be measured. The local exhaust flows can be measured or can meet prescriptive ducting and fan
labeling requirements that use ratings provided by the Home Ventilating Institute (HVI, 2012). Thus, to show compliance
with Standard 62.2, we need a reliable way of measuring ventilation system airflows.
It is important to measure mechanical ventilation flows accurately because installed ventilation systems do not always
perform as expected. If ventilation flows are too low, IAQ can be compromised due to elevated levels of indoor
contaminants. Conversely, ventilation flows that are too high require greater fan power and additional energy to condition
the incoming supply or make-up air. Unbalanced ventilation flows can also depressurize a home and potentially cause
backdrafting and spillage of hazardous combustion appliance emissions into the living space.
1 ‘EA’ refers to Energy & Atmosphere, a category of the LEED rating system
2 6 ACH50 in Climate Zones (CZs) 1 &2, 5 ACH50 in CZs 3 & 4, 4 ACH50 in CZs 5, 6 & 7, and 3 ACH50 in CZ 8. CZ refers to US
DOE CZs and not to California CZs; California is primarily CZ 3. A map showing the DOE CZs is provided in Appendix 3: US
Climate Zone Map from ASHRAE Standard 169-2012 “Weather Data For Building Design Calculations”.

5
How are ventilation airflows measured?
Although ASHRAE Standard 62.2 and California’s Title 24 Part 6 require homes to have minimum ventilation airflows,
they specify neither the device nor the procedure that is to be used to measure these flows. Devices for measuring
ventilation (or space conditioning) airflows in buildings are generally referred to as flow capture hoods, or “flow hoods”
for short. Typically, these hoods capture the flow entering or exiting a terminal and funnel it through some kind of
measurement mechanism. Most flow hoods can measure flows in either direction (both inlet and outlet) and they have the
capability to perform time averaging.
Walker et al. (2001) described two categories of flow hoods, which they called non-powered flow hoods and powered (or
“active”) flow hoods. Non-powered flow hoods passively measure the flow as it goes through the hood. Flow
measurement techniques differ between manufacturers and involve sensing pressure differentials or air velocities (e.g., hot
wire, plate deflection, spinning propellers). Powered flow hoods track the static pressure within the hood relative to the
surrounding area and control a fan such that the fan’s flow matches the terminal flow and the static pressure difference is
brought to zero. This approach, sometimes called the zero pressure compensation method, reduces the effect of the hood
itself on the flow being measured.
What is the range of residential ventilation flows?
There is a wide range of residential mechanical ventilation flows. In homes with fully ducted heat recovery ventilators
(HRVs) or energy recovery ventilators (ERVs), the flows at each terminal can be as low as 10 cubic feet per minute (cfm).
On the high end, flows from commercial-style residential range hoods can exceed 1200 cfm. However, most residential
ventilation flows are in the range of 15 to 200 cfm, so this is the range that we focused on for this study.
How accurate is accurate enough?
Acceptable measurement accuracy differs depending on the intended use for the results. Walker et al. (2001) described
measurement accuracy requirements in terms of evaluating residential HVAC systems. The required minimum accuracy
ranged from a broad ±50% for identifying large leaks and disconnected ducts to a narrow ±3% for determining total
system leakage. Currently, there is no acceptable accuracy range for ventilation airflows required by residential building
standards, and there is no minimum accuracy required for measuring ventilation flows. For our evaluation of residential
ventilation airflows, we decided on a minimum required accuracy of ±5 cfm or ± 10% of measurement reading, whichever
was greater.
What have previous studies found?
Previous studies have evaluated the ability of flow hoods to measure residential airflows accurately. A forthcoming
Belgian study (Caillou, 2012) found that powered hoods provided more accurate measurements than non-powered hoods,
and that non-powered hoods have trouble with outlet flows particularly. Earlier studies considered space conditioning
flows (Walker et al., 2001; Wray et al., 2002). Based on laboratory measurements, Wray et al. (2002) concluded that
powered flow hoods were preferred to non-powered hoods. For the active flow hood3, the mean difference was 1.5% for
outlet flows and 2.5% for inlet flows. For non-powered flow hoods, the mean difference was 12.3% for outlet flows and
33% for inlet flows. The authors concluded that non-uniform entering airflows, placement, and insertion losses were the
primary causes of measurement inaccuracy.
3 The same “EPB” flow hood used in this study. There were no commercially available powered flow hoods available when this study
was performed.

6
How is the accuracy of flow hoods evaluated?
There is currently no standard for calibrating flow hoods that reflects their use in real buildings. ASHRAE Standards 41.2
and 51 discuss how to set up apparatus to perform laboratory evaluations of airflows through conditioning and ventilation
equipment, but do not establish how to calibrate devices that are used to make flow measurements in the field (ASHRAE,
1987, 2007). This situation has left each device manufacturer to develop its own calibration procedure. Flow hoods are
often calibrated in a laboratory using apparatus that produces an approximately uniform flow field that covers the entry of
the flow meter. These calibration procedures do not account for flow asymmetry and flow restrictions (insertion loss),
which make it difficult to measure flows accurately.
Flow asymmetry occurs when the flow velocities and directions across and within the flow hood are non-uniform.
Residential flows (especially outlet flows) are often non-uniform, due to the presence of one or both of the following
common conditions:
the flow exits or enters the terminal at an acute angle – this is common with rain cap outlet terminals on external
walls and with angled or conical diffusers
the flow is not centered in the face of the capture hood – in practice, the geometries of the flow hood and the
terminal being measured often do not allow the flow to be centered in the hood face
Flow restrictions occur because the flow hood creates additional airflow resistance, which in turn increases back pressure
and decreases the flow relative to what it was before the measurement. In general, the smaller the flow hood’s aperture,
the more flow restriction it causes. This lowering of airflow caused by the flow meter is referred to as insertion loss.
Insertion loss has two forms. The first is for single branch ducted systems where the airflow resistance of the flow hood
changes the effective system curve and the fan has a different operating point as a result. The second occurs when using a
flow hood to measure flows in a multi-branch duct system. The flow restriction introduced by the flow hood causes back
pressure in the duct and forces some of the flow that would normally pass through the terminal being measured to pass
through another terminal instead. This ‘insertion loss’ results in a negatively biased measurement of the typical flow for
that terminal. When the measurements of all terminals are summed to find total system flow, the total system flow
measurement also has a negative bias.
To account for these common conditions in residential buildings, a new standard for flow hood calibration needs to be
developed, along with a new measurement standard to address field use of flow hoods. These standards would help to
ensure that flow hoods are capable of measuring all flows to an acceptable accuracy so that homes receive the proper
ventilation rates.
The work described in the remainder of this report focuses on evaluating the accuracy of commercially available flow
hoods for measuring airflows through a range of ventilation system terminals under controlled laboratory conditions, and
on establishing the basis for the formation of a laboratory flow measurement standard. Part 2 of this study will address the
following issues:
California homes’ compliance with ASHRAE 62.2 whole building and local exhaust requirements
The accuracy of field measurements taken with commercially available flow hoods
Impediments to making ventilation flow measurements in the field

7
II. TEST HOODS, APPARATUS, AND METHODS
Flow Hoods Evaluated
In this study, we evaluated seven flow hoods that represent a range of types, manufacturers, sizes, weights, measurement
mechanisms, complexity, and price. Six were commercially available hoods (Figure 1) and one was a research-grade
powered hood constructed by the former Energy Performance of Buildings Group4 at Lawrence Berkeley National
Laboratory (Figure 2). This hood is referred to in this study as “EPB” and has a previously determined accuracy of ±2%.
(Walker et al., 2001) Our sample of commercially available hoods includes four non-powered ones (ABT701, EBT721,
TECEFM, testo417) and two powered, pressure-compensating ones (DIFF, TECFB).567
TSI/Alnor Balometer® Flow Capture Hood ABT701 (ABT701)
Observator DIFF Automatic Air Volume Flow Meter (DIFF)
TSI/Alnor Balometer® Flow Capture Hood EBT721 (EBT721)
Energy Conservatory - Exhaust Fan Flow Meter (TECEFM)
The Energy Conservatory – FlowBlaster™ (TECFB)
testo 417 Vane Anemometer (testo417)
Figure 1: The six commercially available flow hoods evaluated for this study
4 Now called the Residential Building Systems Group.
5 For more information on the devices evaluated, see
Appendix 1: Flow Hood Specifications 6 The testo 417 vane probe anemometer is shown with the optional square flow capture funnel, which was used for all measurements.
7 All device images are taken from manufacturers’ websites.

8
Energy Performance of Buildings Group powered flow capture hood
(EPB)
Figure 2: The EPB custom-built laboratory grade flow hood
Test Apparatus
Our laboratory experiments were designed to ascertain each flow hood’s accuracy for measuring various outlet and inlet
ventilation airflows under controlled conditions where a well-known reference measurement could be employed. In
particular, a range of known airflows was delivered to each flow hood and then the known reference airflow was
compared with the hood’s measurement. To control the delivered airflow, we used an Energy Conservatory Duct Blaster
fan connected in series (Figure 3) to two calibrated reference airflow measurement devices. Note that we did not use the
airflow meter of the Duct Blaster fan in our analyses – we simply used the Duct Blaster as a variable speed fan that had
the required airflow range and control characteristics to drive airflow through our apparatus.
Figure 3: Section view diagram of laboratory flow measurement apparatus
Two different reference airflow measurement devices were used, depending on the delivered airflow range. To provide
reference measurements for low flows (10 to 60cfm), we used a Gerand Venturi8 2-685 2-inch diameter VS-type flow
meter (Figure 5) that we calibrated for use with air.
8 http://www.gerandengineeringco.com/venturis.htm

9
To provide reference measurements for higher ventilation flows (50 – 500 cfm), we used a 6-inch diameter
ThermoBrandt9 NZP1000 Series Nozzle Pitot-Array Air/Gas Flow Sensor.
The experimental uncertainties for the reference flow meters and related temperature and pressure measurement devices
are based on manufacturers’s literature, except for the venturi meter, which we calibrated separately using constant-
injection tracer gas techniques. Using these data and standard error propagation techniques, we estimate that the system
uncertainty for the venturi meter reference flows was ±3%. The rated uncertainty for the ThermoBrandt meter is ±0.5%
for the range of flows we tested.
Outlet and Inlet Terminals
For this study, we refer collectively to connections that are placed at the terminus of a duct to let airflow in or out as
“terminals”. For example, a dryer vent hood would be considered an outlet terminal and a ceiling-mounted bathroom
exhaust fan would be considered an inlet terminal. We have referred to “inlet” flows and “outlet” flows instead of
“return” and “supply” flows. We have also avoided the phrase “exhaust flow,” because while it indicates that a flow is
going from inside to outside the house, it does not describe the relationship of the flow relative to the hood (which is very
important for our study).
It may be useful to have categories of description for flows, one indicating the direction of flow relative to some reference
(such as a flow hood), and the other indicating the function of the flow relative to the house’s systems. In this way, a
dryer vent hood may be described as an “exhaust outlet flow”, or a ceiling-mounted bathroom fan described as an
“exhaust inlet flow” or even a “ventilation exhaust inlet flow”. This nomenclature could also be applied to conditioning
flows.
9 www.thermo.com/eThermo/CMA/PDFs/Product/productPDF_29339.pdf
Figure 7: Detailed section of high-flow reference meter Figure 6: 6-inch ThermoBrandt NZP1000 high flow
reference meter mounted in apparatus
Figure 5: 2-685 Gerand venturi low-flow
reference meter mounted in measurement
apparatus
Figure 4: Detailed section of low-flow
reference meter

10
Nine different commercially available ventilation ‘terminals’ (Figure 8) were each mounted in turn at the end of the test
apparatus to emulate typical residential flow profiles that would be measured by flow hoods. We did not include terminals
typically used for space conditioning flows, such as grilles or registers that have been studied previously (Walker et al.,
2001; Wray et al., 2002). Four terminals were connected to four-inch diameter ducting and five terminals were connected
to six-inch diameter ducting. Our naming format used the duct diameter as the first numeral followed by a second numeral
for each individual terminal. Terminals 4-1 and 4-2, were dryer wall vents. Terminal 4-3 was a bathroom exhaust wall
vent. Terminal 4-4 was a “hole-in-the-return” ventilation wall inlet for incorporating fresh air into a home’s forced air
space conditioning system. Terminal 6-1 was a range hood wall outlet. Terminal 6-2 was an HRV/ERV system wall
outlet and 6-3 was a system wall inlet. Terminal 6-4 could be used as an interior branch outlet or inlet for a fully ducted
HRV/ERV. The BRExinlet was an interior bathroom exhaust fan.
Figure 8: Terminals used for laboratory measurement. The first number in bottom right of each image indicates the diameter of the terminal’s duct
connection in inches. The BRExInlet has a four-inch diameter connection.
Measurement Process
To make measurements, the flow hood to be evaluated was secured to the wooden terminal mounting panel, and we
ensured that there was no visible gap between the hood and the panel. The fan was then set to produce the desired
pressure across the reference meter. When this pressure stabilized, the time was marked and a measurement was taken
with the flow hood and recorded. The measurements recorded by the reference flow meter for the ten seconds following
the initialization of the device would later be averaged and compared to the hood’s measurement to determine accuracy.
After the measurement for the first pressure was completed, the fan was set to achieve the next desired pressure and the
process was repeated. After all measurements had been made with the flow centered in the face of the hood, the mounting
of the hood was adjusted so that the flow was at the edge of its face, after which the measurement process for each flow
rate was repeated. Finally, the process was repeated once more to test flows located at the corner of the hood’s face.

11
The entire range of flows tested was 15 to 220 cfm, but flows were recorded for each flow hood only within the range and
type that it was designed to measure. For instance, the ABT701 is not designed to measure flows lower than 30 cfm, so
there are no measurements in the 15 to 30 cfm range for the ABT701. The same is true for the EBT721, because its lower
threshold is 25 cfm.10
The upper flow measurement range of the TECEFM is 124 cfm, and it is designed to measure inlet
flows only. Therefore, results for the TECEFM do not include outlet flow measurements or measurements greater than
124 cfm. According to the manufacturer, the stated volume flow measuring range for the testo 417 vane anemometer is 0
to 99999 cfm (Raymer, 2012; testo inc.).11
For the testo417, DIFF, EPB, and TECFB, results were recorded for all flows.
In our laboratory measurements, we evaluated each flow hood’s sensitivity to flow asymmetry, flow direction, and flow
rate as follows:
Evaluating for Flow Asymmetry
Flow hoods tend to measure most accurately when the flow is centered (Walker et al.,
2001), but in the field, often it is not possible to center the flow in the hood face when
terminals are located close to ceiling, floor, or wall intersections or if interior furnishings
or cabinetry block access. For this reason, it is important that flow hoods provide
accurate readings even when the flow is not centered. To evaluate the ability of the flow
hoods to measure non-centered flows, we took measurements with each hood at three
positions (see Figure 9) – one position with the terminal centered in the hood (green),
one with the terminal centered along the hood edge (red), and one with the terminal in
the corner of the hood (yellow).
Evaluating for Flow Angle
Flow measurements are also affected by the angle of the flow. Flows tend to
be most uniform (and most easily measured) when they are inlet flows
entering the terminal at an angle that is perpendicular to the mounting plane.
Outlet flows and flows that exit or enter the terminal at an angle that is
tangential to the mounting plane (such as out of a dryer vent hood, for
example – see Figure 10 (Raymer, 2010)), are believed to be more difficult to
measure accurately (Walker et al., 2001).
10
Even though the stated low range for the EBT721 is 25 cfm, it displayed measurement values as low as 18 cfm. 11
A January 2012 article in Home Energy magazine stated that the measurement range for the testo 417 is 0 to 75 cfm when used with
the funnel, but we were unable to find these numbers anywhere in the manufacturer’s literature for the device or its accessories. We
contacted testo and confirmed that the 0 to 99,999 cfm range for the testo 417 also applies when using it with the optional funnel.
Figure 9: The three locations:
middle (green), edge (red), and
corner (yellow) of the terminal
relative to the face of the flow
hood
Figure 10: Terminals cause the flow to exit or
enter at different angle;s affecting devices’
ability to measure flows accurately (images
courtesy Paul Raymer)

12
Evaluating for Flow Rate
Flow hoods must be able to measure a range of typical ventilation airflows. For our laboratory study, we measured flows
ranging from 15 to 220 cfm. We chose these flows because they represent the range found in most ventilation systems
(ASHRAE 62.2 requires a minimum of 50 cfm for bath fans, 100 cfm for kitchen range hoods, and a range of
approximately 35 to 150 cfm for whole building ventilation). Kitchen range hoods often have higher flows. We selected
the upper limit based on work by Delp &Singer (2012), who performed laboratory tests on range hoods and found that
220 cfm is the upper limit of what is required to exhaust cooking fumes effectively in most cases.
Measurement Corrections
To ensure consistency in our flow measurements, we corrected measured flows for air density as needed, and corrected
for test apparatus leakage. We also took care to ensure that reference and hood flows were measured simultaneously.
Air Density Corrections
For each test case, the flow indicated by the hood was compared to the flow measured by the appropriate reference airflow
meter. For the TSI/Alnor hoods, the Energy Conservatory hoods, and the EPB hood, the indicated flow is based on
‘standard conditions’ in terms of air density. 1213
In these cases, using the equation provided by the hood’s manufacturer
(The Energy Conservatory, 2011; TSI/Alnor, 2008, 2009), we corrected the hood’s indicated flow from ‘standard’ to
actual test conditions. All comparisons between hood and reference flows were made using actual test condition flows.
These corrections were typically less than 0.5% of the reference flow.
Correcting for System Leakage
In the measurement apparatus, there is inevitably a small amount of leakage between the reference flow meter and the
terminal where the hood is measuring the flow. Every time we changed the apparatus, we measured the system leakage
by sealing the ends of the apparatus and pressurizing over a range of pressures while simultaneously measuring the flows
required to create these pressures. Using these data, we corrected the reference flow measurement to account for
apparatus leakage. These corrections were typically less than 1% of the reference flow.
Ensuring Simultaneous Measurements
In many cases, the flow hood restricts the flow that is being measured by altering the airflow resistance and therefore the
airflows and pressures of the system. This means that in real homes, the flow before the measurement (during normal
operation) is often different from the flow during the measurement. We did not evaluate this insertion loss in the
laboratory tests because our apparatus differs enough from a typical home ventilation system in terms of duct layout and
the pressure/flow relationship for the fan, such that we were unable to make generalizations about how particular hoods
affect residential flows.14
So that we could measure the same flow test points for each hood, irrespective of the hood’s
effect on the flow, we configured the fan controller to auto-adjust to a fixed flow, as measured by the reference meter.
After waiting for the fan to stabilize at the set flow, each recorded measurement represents an average of measurements
over a 10-second interval, with a sampling frequency of one measurement per second. The reference and hood averages
12
The EPB hood uses an Energy Conservatory DuctBlaster®, so we used the manufacturer’s correction for this flow hood, as directed
by the DuctBlaster® manual. 13
These ‘standard conditions’ often vary from manufacturer to manufacturer. Currently there are no industry-accepted ‘standard
conditions’. 14
The primary differences between the laboratory apparatus and a typical residential ventilation setup: 1) laboratory apparatus has
larger and straighter ducts than residential ventilation systems 2) the laboratory apparatus is a single branch system, whereas many
residential HVAC systems are multi-branch 3) the primary blower in the laboratory apparatus may have a different pressure/flow
curve than those in the typical residential system, and 4) unlike our laboratory setup, most residential ventilation fans do not
compensate when a flow is restricted.

13
were recorded over the same time period. In total, 1021 average measurements were recorded.15
Figure 11 shows an
example of the insertion loss effect on fan flow and how the automatic control system compensated for this effect.
Figure 11: Example of the testing apparatus’ variable speed fan adjusting to compensate for insertion loss during a test
III. RESULTS
Figure 12 through Figure 18 plot the flow measurement errors for each hood relative to the reference flows.
The flows are subdivided into inlet flows and outlet flows. Error bars for each measurement represent the
system uncertainty in the reference flow readings for the reference meter used. For flows evaluated with the
venturi reference flow meter, the system uncertainty is ±3%, for the ThermoBrandt flow meter, it is ±0.5%.
Each figure also shows the acceptability bounds that we defined: the greater of ±5cfm or 10% of the
reference flow.16
15
Not all of these measurements are included in the results below. 16
For the rated accuracies of each hood tested, see Appendix 1: Flow Hood Specifications

14
Figure 12: TSI/Alnor ABT701 - laboratory test results compared to acceptable accuracy range
Figure 13: Observator DIFF - laboratory test results compared to acceptable accuracy range
-50
-40
-30
-20
-10
0
10
20
30
40
50
0 20 40 60 80 100 120 140 160 180 200 220
dif
fere
nce
fro
m r
efe
ren
ce in
cfm
reference flow in cfm
±5 cfm, 10% accuracy
Inlet Flows
Outlet Flows
-50
-40
-30
-20
-10
0
10
20
30
40
50
0 20 40 60 80 100 120 140 160 180 200 220
dif
fere
nce
fro
m r
efe
ren
ce i
n c
fm
reference flow in cfm
±5 cfm, 10% accuracy
Inlet Flows
Outlet Flows

15
Figure 14: TSI/Alnor EBT721 - laboratory test results compared to acceptable accuracy range
Figure 15: EPB Powered Flow Hood - laboratory test results compared to acceptable accuracy range
-50
-40
-30
-20
-10
0
10
20
30
40
50
0 20 40 60 80 100 120 140 160 180 200 220
dif
fere
nce
fro
m r
efe
ren
ce in
cfm
reference flow in cfm
±5 cfm, 10% accuracy
Inlet Flows
Outlet Flows
-50
-40
-30
-20
-10
0
10
20
30
40
50
0 20 40 60 80 100 120 140 160 180 200 220
dif
fere
nce
fro
m r
efe
ren
ce i
n c
fm
reference flow in cfm
±5 cfm, 10% accuracy
Inlet Flows
Outlet Flows

16
Figure 16: Energy Conservatory Exhaust Fan Flow Meter - laboratory test results compared to acceptable accuracy range
(note: inlet flows only)
Figure 17: Energy Conservatory FlowBlaster™ - laboratory test results compared to acceptable accuracy range
-50
-40
-30
-20
-10
0
10
20
30
40
50
0 20 40 60 80 100 120 140 160 180 200 220
dif
fere
nce
fro
m r
efe
ren
ce in
cfm
reference flow in cfm
±5 cfm, 10% accuracy
Inlet Flows
-50
-40
-30
-20
-10
0
10
20
30
40
50
0 20 40 60 80 100 120 140 160 180 200 220
dif
fere
nce
fro
m r
efe
ren
ce in
cfm
reference flow in cfm
±5 cfm, 10% accuracy
Inlet Flows
Outlet Flows

17
Figure 18: testo 417 - laboratory test results compared to acceptable accuracy range
-50
-40
-30
-20
-10
0
10
20
30
40
50
0 20 40 60 80 100 120 140 160 180 200 220
dif
fere
nce
fro
m r
efe
ren
ce i
n c
fm
reference flow in cfm
±5 cfm, 10% accuracy
Inlet Flows
Outlet Flows

18
Table 2 displays the flow measurement difference as a percentage of reference flow and in absolute cfm for measurements
at each of the three flow positions – middle, edge, and corner – and for each flow direction – inlet and outlet -- for each
hood. Included are the mean difference (MD), mean absolute difference (MAD), and the standard deviation (SD) of the
measurements. The mean difference indicates bias, the mean absolute difference indicates overall accuracy, and the
standard deviation indicates how consistent the measurements were. This table is intended to provide an idea of how
sensitive each hood is to the position and direction of the flow being measured. The ‘powered’ hoods include the DIFF,
TECFB, and EPB. The ‘non-powered’ hoods are the ABT701, EBT721, TECEFM, and testo417.
Middle (n =247)
Edge (n =244)
Corner (n =244)
Inlet (n = 285)
Outlet (n = 450)
Total (n = 735)
% pts cfm % pts cfm % pts cfm % pts cfm % pts cfm % pts cfm
ABT701 (n = 99)
MD 4.1 2.5 3.5 2.3 3.1 2.2 -0.8 0.2 6.1 3.5 3.6 2.3
MAD 4.1 2.4 5.0 3.2 4.3 2.6 3.6 2.2 6.7 4.1 4.5 2.7
SD 8.9 4.8 7.0 4.3 6.8 3.6 4.5 2.7 7.8 4.5 7.6 4.2
DIFF (n = 123)
MD 6.2 2.8 1.7 0.6 -0.4 -0.7 3.6 2.3 1.9 0.0 2.5 0.9
MAD 6.6 3.0 4.8 2.7 5.5 3.1 5.2 3.1 5.9 2.8 5.6 2.9
SD 7.1 2.7 6.4 3.6 6.5 3.9 0.1 3.3 0.1 3.3 7.2 3.7
EBT721 (n = 114)
MD 20.8 16.6 31.1 23.3 34.8 27.0 2.4 2.1 41.1 31.7 28.9 22.3
MAD 20.9 16.6 31.9 23.7 35.3 27.3 3.9 2.8 41.1 31.7 29.3 22.5
SD 15.8 17.5 30.1 24.1 30.1 28.9 3.7 2.9 23.7 23.8 26.7 23.2
EPB (n = 123)
MD 2.1 0.7 2.1 0.9 1.7 0.6 3.6 1.5 1.0 0.3 2.0 0.7
MAD 3.1 1.4 3.3 1.8 3.3 1.5 4.3 2.0 2.6 1.4 3.2 1.6
SD 4.1 1.9 3.8 2.4 4.0 1.9 4.0 1.8 3.6 2.1 3.9 2.0
TECEFM (n = 39)
MD -0.3 0.0 0.5 0.0 -0.5 -0.8 -0.1 -0.2 -0.1 -0.2
MAD 4.6 1.7 4.8 2.0 3.8 1.5 4.4 1.7 4.4 1.7
SD 6.1 2.1 5.6 2.6 4.8 1.8 5.4 2.2 5.4 2.2
TECFB (n = 120)
MD 3.0 0.9 3.1 1.1 2.8 0.8 4.9 1.6 1.7 0.5 2.9 0.9
MAD 3.4 1.3 3.5 1.4 3.7 1.5 5.5 2.2 2.4 1.0 3.6 1.4
SD 3.9 1.5 3.9 1.6 4.1 1.8 4.1 1.9 3.3 1.3 3.9 1.6
testo417 (n = 117)
MD 7.5 3.7 -2.4 -2.2 -10.9 -7.1 6.2 2.9 -5.6 -4.0 -1.7 -1.7
MAD 7.8 3.9 11.4 5.7 17.5 9.6 6.1 2.7 15.8 8.6 12.2 6.4
SD 4.8 3.1 14.8 7.4 21.1 13.7 6.0 2.2 18.8 11.6 16.7 10.0
powered (n = 366)
MD 3.8 1.5 2.3 0.8 1.3 0.2 4.1 1.8 1.5 0.3 2.5 0.8
MAD 4.0 0.9 2.3 2.8 4.2 2.0 5.1 2.4 3.6 1.7 4.2 2.0
SD 5.5 2.3 4.8 2.6 5.2 2.8 4.7 2.3 5.4 2.5 5.3 2.6
non-powered (n = 369)
MD 9.8 6.9 9.9 7.2 8.2 6.7 -0.8 0.2 14.2 10.9 5.0 3.8
MAD 10.1 6.9 14.6 9.7 6.7 11.7 2.9 1.8 20.8 14.7 11.6 7.4
SD 12.8 11.9 23.9 17.9 27.9 22.8 4.5 2.7 27.5 22.5 20.3 15.3
All (n = 735)
MD 6.8 3.5 2.3 4.0 4.8 3.5 3.1 1.4 7.7 5.4 3.7 2.3
MAD 7.4 3.6 3.9 6.0 11.0 7.1 4.5 2.2 12.2 8.2 8.1 4.8
SD 10.3 9.2 4.8 13.2 20.3 16.5 5.0 2.5 20.5 16.6 14.7 10.9 Table 2: Summary of laboratory results, with accuracy relative to reference flow. These results do not consider uncertainty MD - mean difference,
MAD - mean absolute difference, SD - standard deviation. Results that fall outside the acceptable accuracy range (the greater of 5 cfm or 10%) are
highlighted and in bold.
Figure 19 shows the mean absolute difference for each hood for all flows measured. The horizontal axis lists each hood.
The vertical axes depict the mean absolute difference for all flows for each hood, as a percentage of reference flow (left

19
vertical axis) and in cfm (right vertical axis). For each hood, the left (darker) column represents the percentage difference,
corresponding to the left vertical axis, and the right (lighter) column represents the flow difference, corresponding to the
right vertical axis. The green horizontal line at the 10% / 5 cfm mark indicates the acceptable accuracy threshold that
we’ve established for measuring ventilation flows – the same values depicted in the plots for each individual hood.
Figure 19: Mean absolute difference of laboratory results relative to reference flow for each hood, as compared to acceptable accuracy range (green
line). Error bars reflect 3% uncertainty in the reference flow measurement.
Figure 20 shows the percentage of each hood’s measurements that are within the acceptable error range of ±5 cfm or 10%
of the reference flow, whichever is greater. The error bars at the top of each bar show the percentage of measurements
within the acceptable range if the uncertainty of the reference flow is considered. The number of flow measurements, n, is
not the same for all hoods, due to the hood’s ability to measure different flow types and rates. For example, the
TECEFM’s rated measurement range maximum flow is 124 cfm and it is only intended to be used to measure inlet flows,
and therefore the number of measurements is considerably lower than for the other hoods.
0.0
5.0
10.0
15.0
20.0
25.0
0%
5%
10%
15%
20%
25%
30%
35%
40%
45%
50%
ABT701 (n = 99)
DIFF (n = 123)
EBT721 (n = 114)
EPB (n = 123)
TECEFM (n = 39)
TECFB (n = 120)
testo417 (n = 117)
me
an a
bso
lute
dif
fern
ce in
cu
bic
fe
et
pe
r m
inu
te
me
an a
bso
lute
dif
fere
nce
as
a %
of
refe
ren
ce
flo
w
% cfm

20
Figure 20: Percentage of laboratory measurements for all hoods that fall within the acceptable accuracy range (±5 cfm, 10%). The error bars
reflect the measurements that are included or excluded when the uncertainty of the given reference flow in considered.
IV. DISCUSSION
Individual Flow Hoods
TSI/Alnor ABT701 (ABT701)
As shown in Figure 20, 90% of the 99 measurements recorded with the ABT701 were within the range of acceptable
difference from the reference flow. When the uncertainty of the reference flow was considered, this percentage was as
high as 91% or as low as 84%. The mean absolute difference for all measurements was in the acceptable range (Figure
19) both as a percentage of the reference flow and in absolute cfm. This holds true even when the uncertainty of the
reference flow was taken into account.
The ABT701’s measurements were not significantly affected by flow location (Table 2), and it measured inlet flows more
accurately than outlet flows (Figure 12). The ABT701’s measurements of outlet flows below 60 cfm were noticeably less
accurate than its other flow measurements.
Note: The ABT701 has an analog gauge that requires interpretation by the user. When taking laboratory measurements,
we had the benefit of having foreknowledge of the reference flow when interpreting the results from the ABT701; this
may have led to interpreted measurements that are more accurate than they would have been for a typical user who would
not already know the correct flow.
Observator DIFF Automatic Air Volume Flow Meter (DIFF)
As shown in Figure 20, 98% of the 123 measurements recorded with the DIFF were within the range of acceptable
difference from the reference flow. When the uncertainty of the reference flow was considered, this percentage was as
high as 99% or as low as 93%. The mean absolute difference for all measurements was in the acceptable range (Figure
19) both as a percentage of reference flow and in absolute cfm, even when the uncertainty of the reference flow was
considered.
0%
20%
40%
60%
80%
100%
ABT701(n = 99)
DIFF(n = 123)
EBT721(n = 114)
EPB(n = 123)
TECEFM(n = 39)
TECFB(n = 120)
testo417(n = 117)

21
The DIFF’s measurements were not significantly affected by flow location (Table 2) and it measured inlet and outlet
flows with similar accuracy (Figure 13).
TSI/Alnor EBT721 (EBT721)
As shown in Figure 20, 35% of the 114 measurements recorded with the EBT721 were within the range of acceptable
difference from the reference flow. When the uncertainty of the reference flow was considered, this percentage was as
high as 37% or as low as 34%. The mean absolute difference for all measurements was well outside the acceptable range
(Figure 19) both as a percentage of reference flow and in absolute cfm, even when the uncertainty of the reference flow
was considered.
The EBT721’s measurements were noticeably affected by flow location (Table 2), measuring non-centered flows less
accurately than centered flows. It measured inlet flows much more accurately than outlet flows (Figure 14).
Note that the ABT701 comes with a flow conditioning screen that attaches to the face of the hood. Although it is the
same size as the ABT701, the EBT721 does not come with a flow conditioning screen. We believe that the flow
conditioning screen reduces the asymmetry in outlet flows and allows the ABT701 to make more accurate measurements
of outlet flows than it would otherwise. We wondered if the screen could do the same for the EBT721, so we attached it
to the EBT721 and found that the screen indeed significantly improved the hood’s accuracy when measuring outlet flows.
For instance, for the 18 paired flow measurements we took using the same terminal, the error was reduced from
approximately 30% to approximately 7%. However, because the hood does not come supplied with the flow conditioning
screen, all of the EBT721 measurements included in this study were taken without the flow conditioning screen.
Energy Conservatory Exhaust Fan Flow Meter (TECEFM)
As shown in Figure 20, 100% of the 39 measurements recorded with the TECEFM were within the range of acceptable
difference from the reference flow. When the uncertainty of the reference flow was considered, this percentage was as
low as 90%. The mean absolute difference for all measurements was in the acceptable range (Figure 19) both as a
percentage of reference flow and in absolute cfm, even when the uncertainty of the reference flow was considered.
The TECEFM’s measurements were not significantly affected by flow location (Table 2). The TECEFM is only intended
to measure inlet flows up to 124 cfm (Figure 17).17
Energy Conservatory FlowBlaster (TECFB)
As shown in Figure 20, 100% of the 120 measurements recorded with the TECFB were within the range of acceptable
difference from the reference flow. When the uncertainty of the reference flow was considered, this percentage was as
low as 98%. The mean absolute difference for all measurements was in the acceptable range (Figure 19) both as a
percentage of reference flow and in absolute cfm, even when the uncertainty of the reference flow was considered.
The TECFB’s measurements were not significantly affected by flow location (Table 2), and it measured outlet flows
slightly more accurately than inlet flows (Figure 17).
testo 417 Vane Anemometer (testo417)
As shown in Figure 20, 67% of the 117 measurements recorded with the testo417 were within the range of acceptable
difference from the reference flow. When the uncertainty of the reference flow was considered, this percentage was as
high as 76% or as low as 58%. The mean absolute difference for all measurements was outside the acceptable range
17
For the 75 “off-label” outlet flow measurements we took with the TECEFM, the mean absolute difference was 10.5% and 5.9 cfm.
Both of these figures are just outside our acceptable accuracy range for ventilation flow measurements. We found that flow location
greatly affects the device’s ability to measure outlet flows accurately.

22
(Figure 19) both as a percentage of reference flow and in absolute cfm, even when the uncertainty of the reference flow
was considered.
The testo417’s measurements were strongly affected by flow location (Table 2), measuring non-centered flows less
accurately than centered flows. It measured inlet flows more accurately than outlet flows (Figure 18).
All Flow Hoods
Powered v. Non-Powered Hoods
Based on previous findings (Wray et al., 2002), we anticipated that the powered, flow-compensating hoods would provide
more accurate measurements than non-powered hoods because they are relatively insensitive to flow asymmetries. In
general, the three powered hoods yielded more reliable and accurate measurements than did the non-powered hoods. The
average mean absolute difference for the three powered hoods was 4.2%, versus 11.6% for the four non-powered hoods
(see Table 2). Two of the non-powered hoods – the ABT701 and the TECEFM – had overall results that were comparable
to the powered hoods in terms of mean absolute difference for the flows that we measured with these two devices.
Direction of Flow (Inlet, Outlet)
The overall accuracy difference between the powered and non-powered hoods is due primarily to their respective abilities
to measure outlet flows. As shown in Table 2, the overall mean absolute differences of the inlet flow measurements for
the powered hoods (5.1%) and non-powered hoods (2.9%) were similar, with the non-powered hoods overall yielding
slightly more accurate results for inlet flows. However, the powered hoods were much more accurate when measuring
outlet flows. For outlet flows, the powered hoods’ mean absolute difference was 3.6% and the non-powered hoods’ was
20.8%. Two of the non-powered hoods had a positive bias when measuring outlet flows (mean difference of 6.1% for the
ABT701 and 41.1% for the EBT721), and one other had a slight negative bias (mean difference of -5.6% for the
testo417).
Based on comparisons of the mean absolute differences, most of the hoods were less accurate when measuring outlet
flows. Exceptions are the TECFB and the EPB powered hoods, which measured outlet flows more accurately than inlet
flows. Among the hoods that measured inlet flows more accurately than outlet flows, the difference for the EBT721 was
the most pronounced: it had a mean absolute difference of 3.9% for inlet flows versus 41.1% for outlet flows.
Angle of Flow
The type of terminal being used, which determines the angle of the flow relative to the mounting face, affected the
accuracy of outlet flow measurements more than it affected inlet flow measurements. The standard deviation of mean
average differences for all inlet flow terminal measurements was 0.5 cfm, versus 3.0 cfm for outlet flow terminal
measurements.
For comparison, the standard deviation of the mean average differences of flows sorted by flow location (middle, edge,
and corner) was 1.8 cfm. The standard deviation of the mean average differences of flows sorted by flow direction (inlet,
outlet) was 4.2 cfm. This reinforces our finding that the direction of flow has a greater effect on measurement accuracy
than does the flow location.
Location of Flow Relative to Hood (Middle, Edge, and Corner)
Table 2 suggests that most of the hoods are relatively unaffected by the location of the flow relative to the face of the
hood. Two exceptions are the testo417 and the EBT721, both of which are noticeably less accurate the farther the flow is

23
from the center of the hood face. In the case of the testo417, this sensitivity to flow location is especially pronounced; its
mean absolute difference is 7.8% for middle flows, 11.4% for edge flows, and 17.5% for corner flows.
V. CONCLUSIONS AND RECOMMENDATIONS
The ultimate function of a flow hood is to measure flows and to report the flow at a terminal under typical field conditions
within a reasonable degree of certainty. All three of the powered hoods (TECFB, DIFF, EPB) that we evaluated had
acceptable accuracy for all ventilation flows, regardless of terminal type, flow direction, or flow location. Two of the four
non-powered hoods we evaluated had acceptable accuracy (ECEFM, ABT701) and two (EBT721, testo417) did not. The
latter two non-powered hoods especially had trouble measuring outlet flows and non-centered ventilation flows
accurately.
There are criteria other than accuracy to consider when choosing a flow hood. These factors, which include price, weight,
usability, appearance, and versatility, will be discussed in more depth in the separate field measurements report.
Next Steps
In this study, we did not evaluate insertion losses: that is, the effect the hood has on the flow it is measuring. In particular,
we did not compare the flow measurements from hoods to the reference flow as measured before the terminal was covered
by the hood, because the test apparatus does not represent the system response of an actual ventilation system. Future
studies could evaluate the effect of hoods on the flow they are measuring. One way to quantify this effect could be to
measure the static pressure within the duct near the terminal before and then during the measurement.
In multi-branch systems, the flow restriction introduced by the hood can reduce the flow at the branch being measured and
increase the flow in other branches at the time of the measurement. A future study could define typical underestimates for
total system flow measurements as caused by the hood’s effect on the flow being measured.
At present, there is no industry consensus standard for assessing flow hood accuracy. For several of the hoods, there was
little resemblance between the manufacturer’s claimed accuracy and the accuracy that we determined in the course of our
measurements. These differences suggest that the accuracy evaluation protocols that manufacturers use are both different
from our own protocol and from each other’s. To ensure that hoods are evaluated uniformly on their ability to measure
flows in the field, there needs to be a standard method of test for accuracy evaluation that incorporates ‘actual use’
considerations, such as terminal type, flow direction, and flow location.
Included in this standard or perhaps in a separate rating standard should be acceptable accuracy ranges for each flow hood
application. Based on results from the standard accuracy evaluation, a hood could then be rated and listed for certain flow
measurement applications. In turn, codes might state, for example, that “a rated and listed hood with an accuracy of ±5
cfm or 10% shall be used to measure ventilation flows to evaluate a home’s compliance with ASHRAE Standard 62.2”.

24
REFERENCES
ASHRAE. (1987). ASHRAE 41.2-1987 Standard Methods for Laboratory Airflow Measurement.
ASHRAE. (2007). ASHRAE Standard 51-07: Laboratory Methods of Testing Fans for Certified Aerodynamic
Peformance Rating.
ASHRAE. (2010). ASHRAE Standard 62.2-2010: Ventilation and Acceptable Indoor Air Quality in Low-Rise Residential
Buildings.
Caillou, S. (2012). Flow Rate Measurement at Air Terminal Devices: Comparison Study of Common Methods for
Residential Applications. Paper presented at the Ventilation 2012, The 10th International Conference on Industrial
Ventilation, Paris, France.
Delp, W. W., & Singer, B. C. (2012). Performance Assessment of U.S. Residential Cooking Exhaust Hoods.
Environmental Science and Technology, 2012(46), 7.
HVI. (2012). Certified Home Ventilating Products Directory: Certified Ratings in Air Delivery, Sound and Energy for
Accurate Specifications and Comparisons. In H. V. Institute (Ed.), (Vol. HVI Publications 911).
International Code Council. (2012a). 2012 International Energy Conservation Code. Washington, DC.
International Code Council. (2012b). 2012 International Residential Code for One- and Two-Family Dwellings.
Washington, DC.
Raymer, P. H. (2010). Residential Ventilation Handbook: Ventilation to Improve Indoor Air Quality. New York:
McGraw-Hill.
Raymer, P. H. (2012, January 2012). Measuring Mechanical Ventilation Airflow. Home Energy, January/February 2012.
testo inc. testo 417 Vane Anemometer: Flow, volume flow (cfm) and temperature with a fixed vane.
The Energy Conservatory. (2011). Minneapolis Duct Blaster Operation Manual (Series B Systems). Minneapolis, MN:
The Energy Conservatory.
TSI/Alnor. (2008). Analog Balancing Tool Models ABT701/ABT703/ABT711/ABT713 Owner's Manual.
TSI/Alnor. (2009). Alnor Electronic Balancing Tool Models EBT720/EBT721 and AIRFLOW Instruments ProHood
Capture Hood Models PH720/PH721 Owner's Manual.
Walker, I. S., Wray, C. P., Dickerhoff, D. J., & Sherman, M. H. (2001). Evaluation of flow hood measurments for
residential register flows (E. P. o. B. Group, Trans.) LBNL#-47382. Berkeley, CA: Lawrence Berkeley National
Laboratory.
Wray, C. P., Walker, I. S., & Sherman, M. H. (2002). Accuracy of Flow Hoods in Residential Applications (E. E. T.
Division, Trans.) LBNL#-49697. Berkeley, CA: Lawrence Berkeley National Laboratory.

25
APPENDICES
Appendix 1: Flow Hood Specifications

26
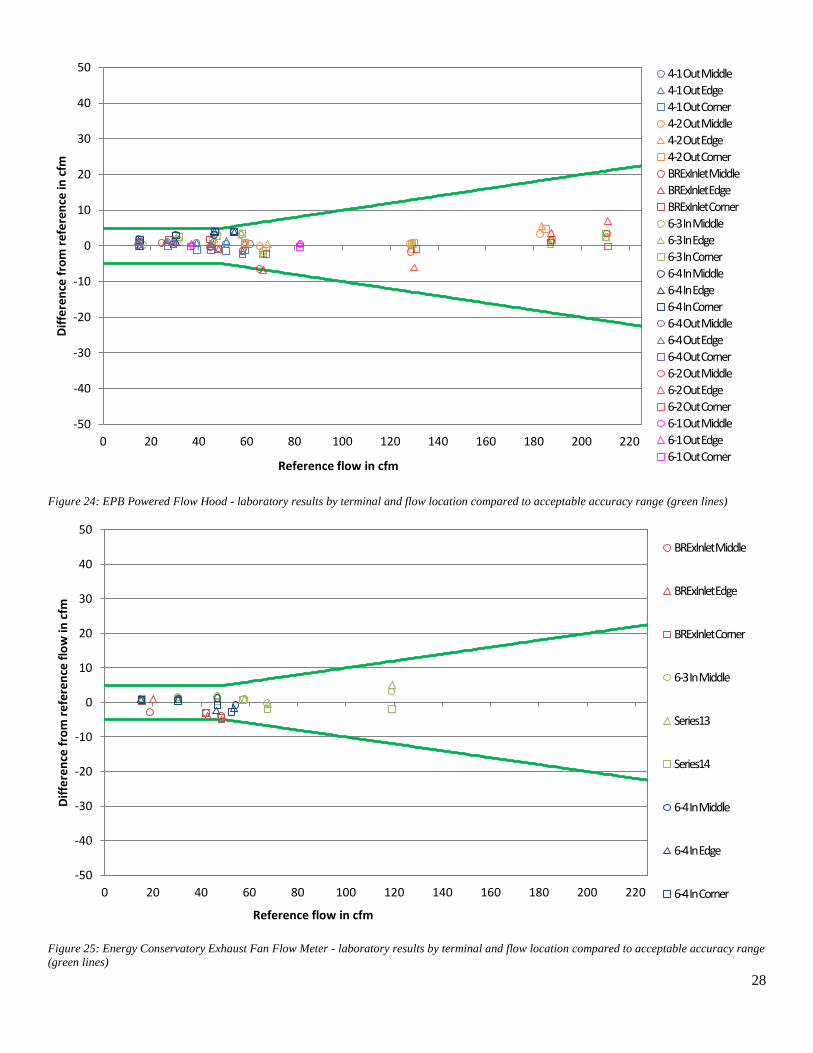
Appendix 2: Flow Measurement Scatter Plot by Terminal for Each Hood
In Figure 21 through Figure 27, the flow measurements for each hood are plotted against the simultaneously recorded
reference flow. Along the horizontal axis is the reference flow in actual cfm. Along the vertical axis is the difference
between the reference flow and the hood’s measured flow, also in actual cfm. This is considered the hood’s error for that
measurement. An error of zero means that the hood and the reference recorded the same flow value for a given point.
The green lines represent an error range of ±5 cfm or ±10%, whichever is greater. This is the minimum acceptable
accuracy threshold that we established for measuring ventilation flows. Each measurement point has a shape (circle,
triangle, or square) and a color. The shapes refer to the location of the flow relative the face of the hood. Circles indicate
that the flow is in the middle of the hood face (i.e., centered). The triangle means the flow is at the edge, and the square
means the flow was in the corner. The colors refer to the terminal being used for that measurement. The names in the
legend (e.g. ‘4-1 Out Middle’) indicate the name of the terminal, whether an inlet or outlet flow being measured, and the
location of the flow.
Figure 21: TSI/Alnor ABT701 - laboratory results by terminal and flow location compared to acceptable accuracy range (green lines)
-50
-40
-30
-20
-10
0
10
20
30
40
50
0 20 40 60 80 100 120 140 160 180 200 220
Dif
fere
nce
fro
m r
efe
ren
ce f
low
in c
fm
Reference flow in cfm
4-1 Out Middle
4-1 Out Edge
4-1 Out Corner
4-2 Out Middle
4-2 Out Edge
4-2 Out Corner
BRExInlet Middle
BRExInlet Edge
BRExInlet Corner
6-3 In Middle
6-3 In Edge
6-3 In Corner
6-4 Out Middle
6-4 Out Edge
6-4 Out Corner
6-2 Out Middle
6-2 Out Edge
6-2 Out Corner
6-1 Out Middle
6-1 Out Edge
6-1 Out Corner

27
Figure 22: Observator DIFF - laboratory results by terminal and flow location compared to acceptable accuracy range (green lines)
Figure 23: TSI/Alnor EBT721 - laboratory results by terminal and flow location compared to acceptable accuracy range (green lines)
-50
-40
-30
-20
-10
0
10
20
30
40
50
0 20 40 60 80 100 120 140 160 180 200 220
Dif
fere
nce
fro
m r
efe
ren
ce f
low
in c
fm
Reference flow in cfm
4-1 Out Middle 4-1 Out Edge 4-1 Out Corner 4-2 Out Middle 4-2 Out Edge 4-2 Out Corner 4-3 Out Middle 4-3 Out Edge 4-3 Out Corner BRExInlet Middle BRExInlet Edge BRExInlet Corner 6-3 In Middle 6-3 In Edge 6-3 In Corner 6-4 In Middle 6-4 In Edge 6-4 In Corner 6-4 Out Middle 6-4 Out Edge 6-4 Out Corner 6-2 Out Middle 6-2 Out Edge 6-2 Out Corner 6-1 Out Middle 6-1 Out Edge
-50
-40
-30
-20
-10
0
10
20
30
40
50
0 20 40 60 80 100 120 140 160 180 200 220
Dif
fere
nce
fro
m r
efe
ren
ce f
low
in c
fm
Reference flow in cfm
4-1 Out Middle 4-1 Out Edge 4-1 Out Corner 4-2 Out Middle 4-2 Out Edge 4-2 Out Corner BRExInlet Middle BRExInlet Edge BRExInlet Corner 6-3 In Middle 6-3 In Edge 6-3 In Corner 6-4 In Middle 6-4 In Edge 6-4 In Corner 6-4 Out Middle 6-4 Out Edge 6-4 Out Corner 4-3 Out Middle 4-3 Out Edge 4-3 Out Corner 6-2 Out Middle 6-2 Out Edge 6-2 Out Corner 6-1 Out Middle 6-1 Out Edge 6-1 Out Corner
28
Figure 24: EPB Powered Flow Hood - laboratory results by terminal and flow location compared to acceptable accuracy range (green lines)
Figure 25: Energy Conservatory Exhaust Fan Flow Meter - laboratory results by terminal and flow location compared to acceptable accuracy range
(green lines)
-50
-40
-30
-20
-10
0
10
20
30
40
50
0 20 40 60 80 100 120 140 160 180 200 220
Dif
fere
nce
fro
m r
efe
ren
ce in
cfm
Reference flow in cfm
4-1 Out Middle
4-1 Out Edge
4-1 Out Corner
4-2 Out Middle
4-2 Out Edge
4-2 Out Corner
BRExInlet Middle
BRExInlet Edge
BRExInlet Corner
6-3 In Middle
6-3 In Edge
6-3 In Corner
6-4 In Middle
6-4 In Edge
6-4 In Corner
6-4 Out Middle
6-4 Out Edge
6-4 Out Corner
6-2 Out Middle
6-2 Out Edge
6-2 Out Corner
6-1 Out Middle
6-1 Out Edge
6-1 Out Corner
-50
-40
-30
-20
-10
0
10
20
30
40
50
0 20 40 60 80 100 120 140 160 180 200 220
Dif
fere
nce
fro
m r
efe
ren
ce f
low
in c
fm
Reference flow in cfm
BRExInlet Middle
BRExInlet Edge
BRExInlet Corner
6-3 In Middle
Series13
Series14
6-4 In Middle
6-4 In Edge
6-4 In Corner

29
Figure 26: Energy Conservatory FlowBlaster - laboratory results by terminal and flow location compared to acceptable accuracy range (in green)
Figure 27: testo 417- laboratory results by terminal and flow location compared to acceptable accuracy range (green lines)
-50
-40
-30
-20
-10
0
10
20
30
40
50
0 20 40 60 80 100 120 140 160 180 200 220
Dif
fere
nce
fro
m r
efe
ren
ce f
low
in c
fm
Reference flow in cfm
4-1 Out Middle 4-1 Out Edge 4-1 Out Corner 4-2 Out Middle 4-2 Out Edge 4-2 Out Corner 4-3 Out Middle 4-3 Out Edge 4-3 Out Corner BRExInlet Middle BRExInlet Edge BRExInlet Corner 6-3 In Middle 6-3 In Edge 6-3 In Corner 6-4 In Middle 6-4 In Edge 6-4 In Corner 6-4 Out Middle 6-4 Out Edge 6-4 Out Corner 6-2 Out Middle 6-2 Out Edge 6-2 Out Corner 6-1 Out Middle 6-1 Out Edge 6-1 Out Corner
-50
-40
-30
-20
-10
0
10
20
30
40
50
0 20 40 60 80 100 120 140 160 180 200 220
Dif
fere
nce
fro
m r
efe
ren
ce f
low
in c
fm
Reference flow in cfm
4-1 Out Middle 4-1 Out Edge 4-1 Out Corner 4-2 Out Middle 4-2 Out Edge 4-2 Out Corner BRExInlet Middle 6-3 In Middle 6-3 In Edge 6-3 In Corner 6-4 In Middle 6-4 In Edge 6-4 In Corner 6-4 Out Middle 6-4 Out Edge 6-4 Out Corner 4-3 Out Middle 4-3 Out Edge 4-3 Out Corner 6-2 Out Middle 6-2 Out Edge 6-2 Out Corner 6-1 Out Middle 6-1 Out Edge 6-1 Out Corner

30
Appendix 3: US Climate Zone Map from ASHRAE Standard 169-2012 “Weather Data For Building Design
Calculations”