measuring over allocation of water resources...premise •much of current water reform and...
TRANSCRIPT

Measuring Over Allocation of Water Resources
Dr Ian Prosser, Science Director Water for a Healthy Country Flagship

Premise
• Much of current water reform and associated investment ($10B)
is aimed at reducing over allocation of water resources.
• Over allocation is understood only in the broadest terms and
there are no accepted ways of measuring it.
• How can we have confidence in resolving over allocation if we
cannot measure it?

Semantics don’t matter
• Is it “over allocation”, “over entitlement”, “over use”, or
“unsustainable use”?
• What it is called is of secondary concern
• All terms reflect a primary concern that too much water is used
with an unacceptable impact on the environment
• It is more important to have acceptable measures of over
allocation than argue about the appropriate term
• How much extractive use is too much?

MDB Sustainable Yields - relative level of surface
water use
Where is use too high ?
Why can’t more water be used ?
0%
10%
20%
30%
40%
50%
60%
70%
Paroo
Ove
ns
Easte
rn M
t Lofty
Ran
ges
Barwon
-Dar
ling
Warre
go
Mac
quar
ie-C
astle
reag
h
Lach
lan
Lodd
on-A
voca
Borde
r River
s
Moo
nie
Cam
pasp
e
Mur
ray
Nam
oi
Gwyd
ir
Gou
lburn
-Bro
ken
Mur
rum
bidg
ee
Con
dam
ine-
Balon
ne
Wim
mer
a
MDB
Rela
tive level of surf
ace w
ate
r use (
%) Historical climate Median 2030 climate
Low
M oderate
M oderately high
High
Very high
Extremely high

No simple measure of acceptable use
Region State Relative level of
use
Fraction of
MDB SW
Resource
Environmental
Assets
Change in average
period between
env. beneficial
floods
Wimmera VIC 55% 1% International 786%
Condamine-Balonne QLD 53% 6% International 384%
Murrumbidgee NSW 53% 18% National 188%
Goulburn-Broken VIC 50% 14% Regional 328%
Gwydir NSW 41% 3% International 77%
Namoi NSW 37% 4% Regional 26%
Murray NSW/VIC/SA 36% 22% Multiple International 155%
Campaspe VIC 36% 1% Regional 58%
Moonie QLD 34% 0% Regional 15%
Border Rivers NSW/QLD 34% 5% Regional 22%
Loddon-Avoca-Avoca VIC 32% 1% Regional 82%
Lachlan NSW 28% 5% National 71%
Macquarie NSW 24% 7% International 114%
Warrego QLD 12% 2% National 0%
Barwon-Darling NSW 11% 0% National 82%
Eastern Mount Lofty Ranges SA 5% 1% National 0%
Ovens VIC 1% 8% National 2%
Paroo QLD 0% 2% Multiple International 0%

Flows required to sustain ecosystems
Arthington et al. 2006

What is over allocation?
• Demands for water cannot all be met
• Conflict between environmental water demand and demand for
extraction
• Need to introduce concept of environmental assets, and values
to recognise fundamental trade-off with reference conditions
• Need to represent environmental water as a demand in the
same terms as other use – volume, timing, reliability
• Over allocation is where environmental and extractive demands
cannot both be met to the required reliability

Why can’t more water be used (max 50%)?
Daily flow (ML)
0
50000
100000
150000
200000
250000
300000
1940
1940
1941
1942
1943
1943
1944
1945
1946
1947
1947
1948
1949
1950
1951
1951
1952
1953
1954
1955
1955
1956
1957
1958
1958
1959
99,864
Total flow in an
unregulated river in
southern Australia used
for summer irrigation,
without floodplain
harvesting
…for environmental use or consumptive use.
Where are the conflicts in resource use?

Manageable water resource 1 – remove floods
Daily flow (ML)
0
50000
100000
150000
200000
250000
3000001940
1940
1941
1942
1943
1943
1944
1945
1946
1947
1947
1948
1949
1950
1951
1951
1952
1953
1954
1955
1955
1956
1957
1958
1958
1959
93,685 Removes 6% of the flow

Manageable water resource 2 – irrigation season
Daily flow (ML)
0
50000
100000
150000
200000
250000
3000001940
1940
1941
1942
1943
1943
1944
1945
1946
1947
1947
1948
1949
1950
1951
1951
1952
1953
1954
1954
1955
1956
1957
1958
1958
1959
56,646 Removes 44% of flow
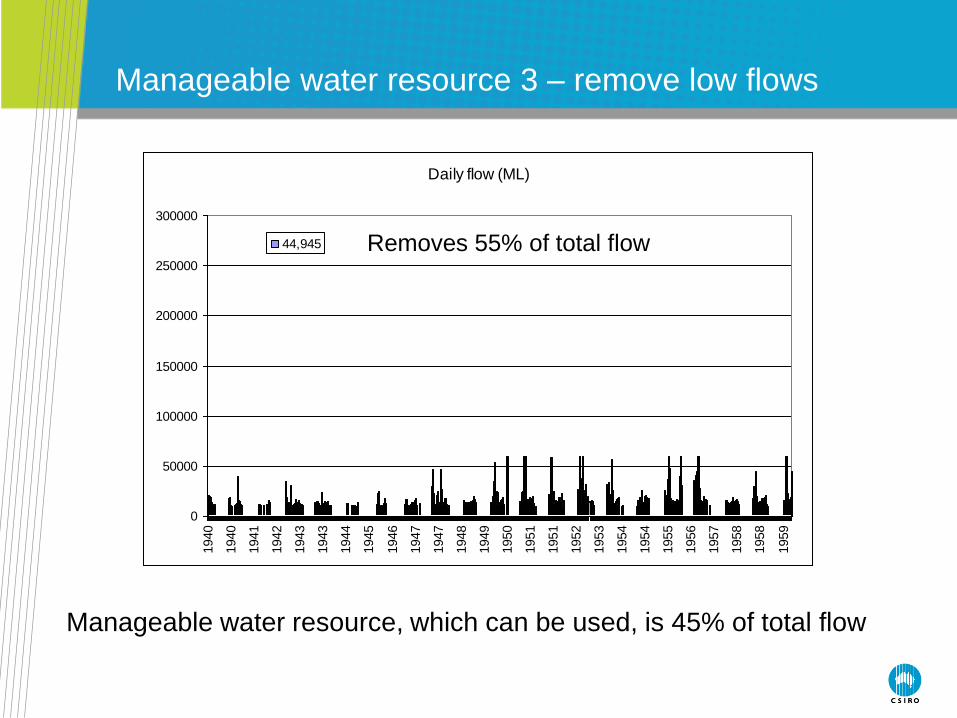
Manageable water resource 3 – remove low flows
Daily flow (ML)
0
50000
100000
150000
200000
250000
3000001940
1940
1941
1942
1943
1943
1944
1945
1946
1947
1947
1948
1949
1950
1951
1951
1952
1953
1954
1954
1955
1956
1957
1958
1958
1959
44,945 Removes 55% of total flow
Manageable water resource, which can be used, is 45% of total flow

High level of use in many drier years
• Level of use >70 percent of total flow in 25 percent of years
0
0.1
0.2
0.3
0.4
0.5
0.6
0.7
0.8
0.9
0 10,000 20,000 30,000 40,000 50,000
Annual flow (GL)
Re
lative
le
ve
l o
f u
se

Uneven risk sharing

Steps to measuring over allocation
• Identify environmental assets, values, condition required
• Define environmental water demands and reliability (timing etc)
• Define extractive water demands and reliability
• Analyse through a range of scenarios if both extractive and
environmental demands can be met at required level of
reliability
• Ensure exposure to risk of reduced supply is shared evenly
• Over allocation is the extent (volume) to which combined
demands cannot be met

Simple example
Year 1 2 3 4 5 6 7 8 9 10
Resource (Gl/y) 500 100 1000 300 400 700 600 800 200 500
Extractive
demand (Gl/y)
200 200 100 200 200 200 200 150 200 200
Environmental
demand (Gl/y)
250 50 900 200 100 600 300 600 50 250
Over allocation
(Gl/y)
0 150 0 100 0 100 0 0 50 0
Sustainable extraction limit at 90% reliability is 100 Gl/y
Over allocated by 100 Gl/y

Conclusions
• Over allocation is subjective
• Must define environmental assets and their condition
• Over allocation is degree of conflict between demands
• The conflicts are often restricted in time – summer, droughts,
low flows, regulation of floods
• Can only be evaluated with detailed analysis of demands
through times and rules for entitlements
• Some simplified proportions of use may be possible for rivers of
the same class
www.csiro.au/mdbsy
Murray-Darling Basin Sustainable Yields Project
funded under the
Raising National Water Standards Program
of the
National Water Commission