measuring outdoor air intake rates using electronic ... outdoor air intake rates using electronic...
TRANSCRIPT

Measuring Outdoor Air Intake Rates Using Electronic Velocity Sensors at Louvers and Downstream of Airflow Straighteners
William Fisk and Douglas Sullivan
Environmental Energy Technologies Division Indoor Environment Department
Lawrence Berkeley National Laboratory Berkeley, CA
Sebastian Cohen
Worcester Polytechnic Institute Worcester, MA
Hwataik Han
Kookmin University Seoul, Korea
October 2008 This research was supported by the California Energy Commission through the San Diego State University Research Foundation under contract 54915A/06-03B through Contract No. DE-AC02-05CH11231 between the University of California and the U.S. Department of Energy.

Measuring Outdoor Air Intake Rates Using Electronic Velocity Sensors at Louvers and Downstream of Airflow
Straighteners
October 2008
William Fisk and Douglas Sullivan Indoor Environment Department, Lawrence Berkeley National Laboratory
Sebastian Cohen, Worcester Polytechnic Institute, Worcester, MA Hwataik Han, Kookmin University, Seoul, Korea
Legal Notice This report was prepared as a result of work sponsored by the California Energy Commission (Commission). It does not necessarily represent the views of the Commission, its employees, or the State of California. The Commission, the State of California, its employees, contractors, and subcontractors make no warranty, express or implied, and assume no legal liability for the information in this report; nor does any party represent that the use of this information will not infringe upon privately owned rights. This report has not been approved or disapproved by the Commission nor has the Commission passed upon the accuracy or adequacy of the information in this report.

Abstract Practical and accurate technologies are needed for continuously measuring and controlling outdoor air (OA) intake rates in commercial building heating, ventilating, and air conditioning (HVAC) systems. This project evaluated two new measurement approaches. Laboratory experiments determined that OA flow rates were measurable with errors generally less than 10 percent using electronic air velocity probes installed between OA intake louver blades or at the outlet face of louvers. High accuracy was maintained with OA flow rates as low as 15 percent of the maximum for the louvers. Thus, with this measurement approach HVAC systems do not need separate OA intakes for minimum OA supply. System calibration parameters are required for each unique combination of louver type and velocity sensor location but calibrations are not necessary for each system installation. The research also determined that the accuracy of measuring OA flow rates with velocity probes located in the duct downstream of the intake louver was not improved by installing honeycomb airflow straighteners upstream of the probes. Errors varied with type of upstream louver, were as high as 100 percent, and were often greater than 25 percent. In conclusion, use of electronic air velocity probes between the blades of OA intake louvers or at the outlet face of louvers is a highly promising means of accurately measuring rates of OA flow into HVAC systems. The use of electronic velocity probes downstream of airflow straighteners is less promising, at least with the relatively small OA HVAC inlet systems employed in this research. Key Words: commercial building, control, HVAC, measurement, outdoor air, ventilation
Introduction Minimum ventilation rates are specified for various types of buildings in building codes and standards, including ASHRAE Standard 62.1 and California’s Title 24. For example, Title 24 requires 0.15 cfm/ft2 in offices, or 15 cfm per person with the assumed typical occupant density. The minimum ventilation rates are chosen to strike a balance between indoor air quality and energy concerns. Higher ventilation rates reduce indoor concentrations of indoor-generated air pollutants and have been shown in research to be associated with improved perceived air quality, reduced adverse health symptoms, and improvements in some aspects of work and school performance (Seppanen et al. 1999; Seppanen and Fisk 2006; Wargocki and Wyon 2007). On the other hand, higher minimum ventilation rates increase building energy consumption, energy costs, and peak energy demands. Despite the importance of ventilation rates, existing data indicate that minimum ventilation rates are often poorly controlled. The most representative data from U.S. commercial buildings are from a survey of 100 representative office buildings (Womble et al. 1996) with 40 measurements taken when ventilation rates should be at the minimum because outdoor temperatures were greater than 75 oF. From the carbon dioxide (CO2) data collected from these 40 buildings, the average minimum ventilation rate (Fisk et al. 2005a) was 28 cfm/occupant -- almost twice the minimum ventilation rate per person specified in Title 24 for offices. A portion of the excess ventilation is due to buildings having occupant densities less than the design density, but poor

control of ventilation air supply is also a major factor. Despite the high average minimum ventilation rate, in 12 percent of the buildings ventilation rates were below Title 24 requirements. While offices are usually over ventilated relative to code requirements, a survey (CARB 2004) indicates that approximately half of elementary-level classrooms in California have less ventilation than specified in codes. These two surveys provide clear evidence that ventilation rates are poorly controlled in many existing commercial buildings. Overall, we expect buildings to be over ventilated relative to codes, because the floor area of office buildings and other commercial buildings with similar HVAC designs is much greater than the floor area of classrooms (ITRON 2006). It is not surprising that ventilation rates are poorly controlled. Few buildings have systems for continuous or even frequent (e.g., monthly) monitoring and adjustment of minimum ventilation rates. In addition, minimum ventilation rates in codes are tied to occupancy but in most buildings the rates of outdoor air supply are not modulated in response to changes in occupancy. The typical practice is to have an air balance company measure the OA flow during initial building commissioning and occasionally, e.g., every several years, thereafter and adjust the dampers for OA, recirculation air, and exhaust air to obtain the desired minimum rate of OA supply. However, accurately measuring OA airflow into HVAC systems is technically challenging even for researchers with special instrumentation and considerable time. In addition, the OA flows may vary as the HVAC supply air flow rates are modulated and because the minimum damper positions set by the air balance professional may be changed by building operators or due to wear or failures in the damper actuators and linkage. Another fairly common practice used in a significant number of buildings is called fan tracking and relies on the difference between supply and return air flow rates to estimate the OA entry rate. Kettler (Kettler 1995; Kettler 2000) shows that the fan tracking often results in large errors in the estimated OA flow rates. In a third practice for controlling ventilation, called demand controlled ventilation (DCV), CO2 concentrations, indicative of ventilation rate per occupant, are measured in occupied spaces or return ducts and OA supply rates are modulated to maintain CO2 concentrations below a target. However, DCV does not control of the minimum ventilation rates per unit floor area specified in Title 24 and ASHRAE Standards. The CO2 signal used by DCV systems also lags changes in occupancy, sometimes by hours. During the first few hours of occupancy, the CO2 sensor may provide no useful information on ventilation rate. Finally, studies of 44 CO2 sensors in California commercial buildings (Fisk et al. 2006) makes it clear that DCV suffers from CO2 measurement errors, which were greater than 300 ppm in many cases. An additional approach for gaining better control of building ventilation rates, and the focus of this paper, is to use technologies that measure, with reasonable accuracy and in real-time, the OA flows into HVAC systems. The measurements of flow rates can be used with existing control systems, and, if desired, in conjunction with DCV, to regulate rates of outdoor air supply. Four such technologies were previously evaluated in laboratory and field studies (Fisk et al. 2004; Fisk et al. 2005a; Fisk et al. 2005b; Fisk et al. 2005c). Some of the measurement systems evaluated in the prior research yielded OA flow rates with large errors because the measurement systems did not account for the complex air flow patterns that occur downstream of OA intake louvers and that vary with louver type. Some technologies were reasonably (e.g., 20%) accurate in some situations, but none was suitable for broad scale use in the typical existing or new commercial building HVAC systems. Most of the technologies had pressure-based velocity

sensors with very small pressure signals at the typical minimum OA intake velocities encountered HVAC systems with economizers. These low pressures cannot be measured accurately with the pressure transducers used in buildings. Some of these systems could provide reasonably accurate measurements of minimum OA flow rates in HVAC systems with separate intake louvers and dampers for the minimum OA supply flow and for the economizer flow; however, such an intake configuration is not common in existing buildings and retrofits to produce such an intake system will often be prohibitively expensive. Even in new construction, space constraints often make it impractical to provide a separate OA intake system for the minimum OA supply. Consequently, the prior research indicated a strong need for practical technologies for measurement of OA intake rates in existing and new buildings. Given this background, the goal of this project was to identify a practical and accurate technology for real time measurement and control of outdoor air intake rates in many existing and new commercial building HVAC systems. The accuracy of two measurement approaches, viewed as promising given the results of the prior research (Fisk et al. 2005a; Fisk et al. 2005b), was evaluated. In one of these measurement approaches, electronic velocity sensors are utilized between the blades of air intake louvers or at the outlet face of louvers. One of the commercialized measurement technologies evaluated previously (Fisk et al. 2005a) employed pressure-based velocity sensors at the louver outlet and this technology performed well when air velocities were sufficient for accurate measurements. By using electronic velocity sensors that can accurately measure lower air velocities than pressure-based sensors, a more broadly applicable measurement system was envisioned. In the second measurement approach, the electronic velocity sensors are utilized downstream of honeycomb airflow straighteners installed between the air intake louver and the outdoor air damper.
Objectives Project objectives were as follows:
1. Evaluate the accuracy of measuring OA flow rates using electronic velocity sensors installed at the outlet plane of air intake louvers or between the blades of air intake louvers.
2. Evaluate the accuracy of measuring OA flow rates using electronic velocity sensors installed downstream of honeycomb airflow straighteners which are located in ductwork between the air intake louver and the OA damper.
Approach Overview of approach Figure 1 is a schematic diagram of the test system used for this research. The laboratory test system has a changeable OA intake louver system, air recirculation ductwork, a fan, dampers, and a precision “reference” airflow meter in the exhaust airstream. The reference airflow meter (Brandt Model NZP1031-10”-1-CF ) has a built-in airflow straightener, a nozzle, a Pitot tube velocity sensor at the nozzle outlet, and a manufacturer’s rated accuracy of ± 0.5 percent. The recirculation flow rates are measured with an estimated ±20 percent accuracy based on the pressure drop across an iris-style damper (Aeroflo, Inc 16” Iris Damper), relying on the manufacturer’s calibration. Highly accurate measurements of recirculation air flow rates were
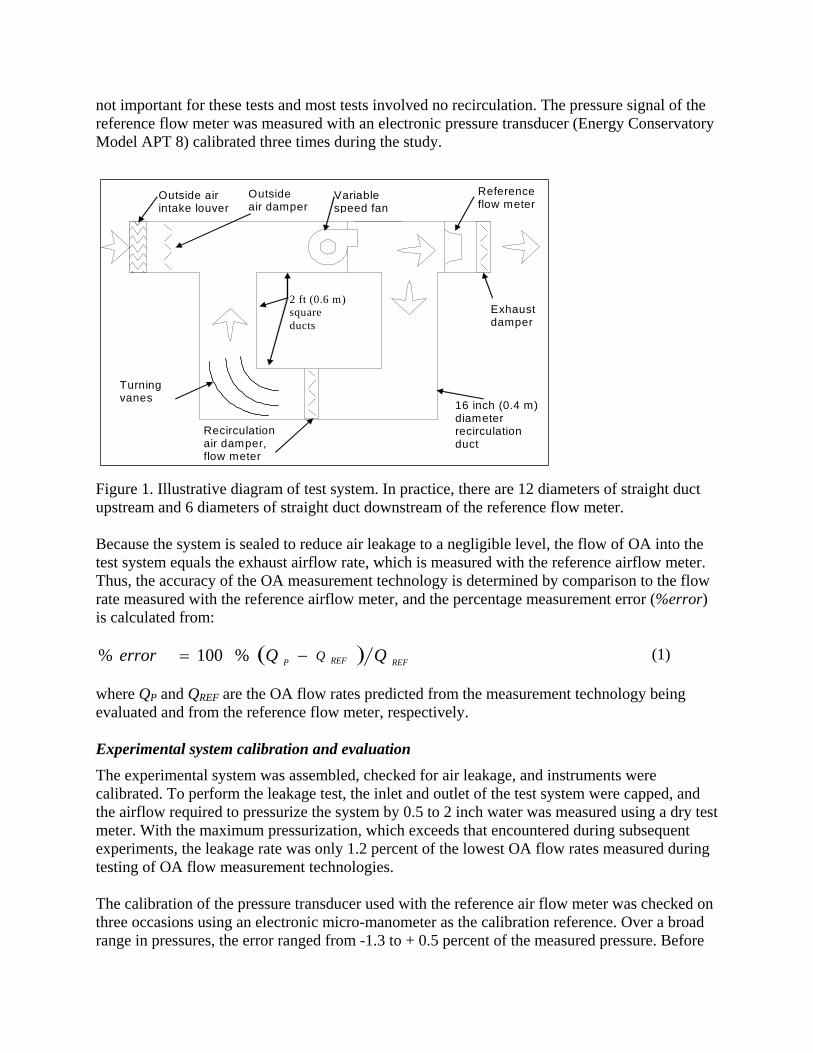
not important for these tests and most tests involved no recirculation. The pressure signal of the reference flow meter was measured with an electronic pressure transducer (Energy Conservatory Model APT 8) calibrated three times during the study.
Reference flow meter
Recirculation air damper, flow meter
Outside air intake louver
Exhaust damper
Variable speed fan
16 inch (0.4 m) diameter recirculation duct
Turning vanes
2 ft (0.6 m) square ducts
Outside air damper
Figure 1. Illustrative diagram of test system. In practice, there are 12 diameters of straight duct upstream and 6 diameters of straight duct downstream of the reference flow meter. Because the system is sealed to reduce air leakage to a negligible level, the flow of OA into the test system equals the exhaust airflow rate, which is measured with the reference airflow meter. Thus, the accuracy of the OA measurement technology is determined by comparison to the flow rate measured with the reference airflow meter, and the percentage measurement error (%error) is calculated from:
( ) REFREFP QQerror Q−= %100% (1) where QP and QREF are the OA flow rates predicted from the measurement technology being evaluated and from the reference flow meter, respectively. Experimental system calibration and evaluation The experimental system was assembled, checked for air leakage, and instruments were calibrated. To perform the leakage test, the inlet and outlet of the test system were capped, and the airflow required to pressurize the system by 0.5 to 2 inch water was measured using a dry test meter. With the maximum pressurization, which exceeds that encountered during subsequent experiments, the leakage rate was only 1.2 percent of the lowest OA flow rates measured during testing of OA flow measurement technologies. The calibration of the pressure transducer used with the reference air flow meter was checked on three occasions using an electronic micro-manometer as the calibration reference. Over a broad range in pressures, the error ranged from -1.3 to + 0.5 percent of the measured pressure. Before

initiating tests of the OA measurement systems, flow rates measured with the reference flow meter were compared to flow rates measured via a standard Pitot tube traverse. The discrepancy between flow rates measured with these two methods varied from -1 percent to + 2 percent of the measured flow rate. Louvers and airflow straighteners Four air intake louvers and two airflow straighteners were selected and purchased for the experiments. Two louvers had horizontal blades and two had vertical blades. Figures 2- 5 depict the louver geometries. All louvers had a factory-installed bird screen at the louver outlet. The manufacturers’ published free areas of the louvers ranged from 30 percent to 48 percent of the nominal louver face area. The “fine” airflow straightener had honeycomb shaped cells with a 0.125 inch dimension between parallel sides of the cells and was 1.25 inch thick in the direction of airflow. The “coarse” airflow straightener had honeycomb shaped cells with a 0.375 inch dimension between parallel sides of the cells and was 2.5 inch thick in the direction of airflow. In experiments using velocity probes between louver blades or at the outlet face of louvers, the inlet face of the louver was 29.5 inch from the centerline of the OA damper. In experiments employing airflow straighteners, the outlet of the airflow straightener was located 15 inch downstream of inlet of the louver, and the centerline of the OA damper was either 14.5 or 50 inch downstream of the outlet of the airflow straightener. Electronic air velocity probes Twelve air velocity probes, 2.8 inch long and 0.75 inch in diameter, each with a single velocity sensor that uses thermal dispersion anemometry, were provided for the study by EBTRON Inc. These probes are depicted schematically in Figure 6. The sensors are designed to measure the range of air speeds encountered in HVAC systems and probes containing multiple sensors are used commercially to measure flow rates in the ducts within HVAC systems including OA flow rates by placing probes downstream of air intake louvers and upstream of OA dampers. Thus, the present study is an evaluation of using the EBTRON probes in a non-standard manner. The minimum diameter probes available from EBTRON were used in the study in order to minimize the blockage of the airflow path air when probes were installed between louver blades. EBTRON suggested that the use of probes with only a few sensors would be the typical practice for the 24 inch by 24 inch air intake systems employed in the research. The experiments employed four to 12 installed sensors; however, in many cases the calculated OA flow rates were based on data from only a subset of the sensors. For use in experiments, multiple of the 2.8 inch long probes containing a single velocity sensor were connected together with cylindrical tubing to produce longer probes containing up to four velocity sensors. To the degree possible, probes were installed so that velocity sensors were located in centers of equal areas of airflow passages; however, the upper probe installed at the outlets face of the ELF375DX louver which was moved upward by 0.5 inch to capture the maximum air speeds. Probes were rotated to yield the maximum air speed at their installed location.

3.4 inch
3.4 inch
3.4 inch
4 inch
1.75 inch
23.5
inch
birdscreen6.5 inch20 inch
23.5 inches
1.75 inch
sensor
6 inch23
.5 in
ch3 inch
sensor (louver outlet)
4.6
inch
4 in
ch4
inch
4 in
ch
sensor (between blades)
bird screen
Figure 2. Side view cross section and outlet view of Arrow EA 64 louver with sensor locations.
4.4 inch3.1 inch
2.9 inch
2.1 inch
23.8
inch
16.5
inch
1.9 inch (typical)
1.4 inch
23.8 inch
sensor
bird screen
EBTRON sensors
1.9 inch
6 in
chbird screenEBTRON sensors
1.9 inch
6 in
chbird screen
Figure 3.Top view cross section and outlet view of Greenheck EVH602 louver with sensor locations.

sensor (louver outlet)
4.8 inch23
.8 in
ch
sensor (between blades)
bird screen
2.9 inch
4.6 inch
4.6 inch
3.6 inch
5.6 inch
23.8 inch
23.8
inch
birdscreen
sensor
Figure 4. Side view cross section and outlet of Ruskin ELF375DX louver with sensor locations.
1.5 inch (typical)
2.
Figure 5. Outlet view and top view cross section of Ruskin EME6625 louver with sensor locations.
5 inch4.1 inch
5.2 inch
23.5 inch
23.5
inch
sensors
Birdscreen
1 inch
1.25 inch0.75 inch
14.1
inch
sensor
6 in
ch
23.5 inch
1.5 inch

The EBTRON probes were factory calibrated at multiple flow rates, are designed to correct for air temperature variations, and have a rated sensor accuracy of ± 2 percent. Before use, the air speeds from the EBTRON probes were compared to airspeeds, ranging from 34 to 1970 ft/min, measured with a new, factory calibrated thermal anemometer (Alnor Model AVM 440 with rated accuracy of ±3 percent of reading or ±3 ft/min) with a calibration traceable to the National Institute of Standards and Technology (NIST). Given the uncertainties in velocity probe placement, the accuracy of data collected with the thermal anemometer may be poorer than ± 3 percent, thus, this sensor intercomparison was only intended to assess whether the EBTRON probes were performing correctly. Considering the air speed range (100 to 1300 ft/min) encountered in subsequent testing, for all EBTRON probes, the relationship with the air speed measured using the thermal anemometer was highly linear with least squares fitting of equations to the data yielding slopes of 0.95 to 1.08, zero offsets of -1 to +27 ft/min and R2 values of 1.00. On average, the EBTRON probes gave a 5 percent larger air speed than the thermal anemometer. Figures 2-5 depict the resulting locations of the four to 12 velocity sensors installed between louver blades or at the outlet face of louvers. Probes at the louver outlet were attached to the bird screens with nylon straps -- the type commonly used to hold electrical wiring in bundles – although metal clips might be necessary to keep probes stationary in actual long-term deployments. Small sections of the bird screen were removed so that wires in the screen were not located directly in front of velocity sensors. Probes were installed between louver blades through holes drilled through the sides of louvers; however, special installation hardware could be developed by probe suppliers to make holes in the louver unnecessary. No experiments were performed with probes between the blade of the Ruskin EME6625 louver because, with the small louver blade spacing, the probes would have blocked most of the airflow passages. When probes were installed downstream of airflow straighteners, three probes were used, each with three velocity sensors, and the probes were located three or five inch downstream of the outlet of the airflow straightener. Average velocities were calculated using velocity data from all installed sensors and from subsets of sensors located in the centers of equal area. Smoke injection and velocity traverses. To provide qualitative information for selecting EBTRON velocity sensor locations, smoke was injected at various locations in the test system. Observation of the smoke flow through a transparent window in a duct wall provided a qualitative indication of airflow patterns. As in our prior research (Fisk et al. 2005b), the smoke flow patterns indicated that a large eddy often forms downstream of the louver and upstream of the OA damper and that smaller eddies form immediately downstream of the outer edges of louvers as depicted in Figure 7. With some OA intake louvers, this eddy extended through the downstream airflow straightener. No eddies were evident at the outlet face of louvers at positions equal distant between adjacent louver blades, which was one of the planned locations for velocity sensors. To provide further information for selection of velocity probe locations, the hot-wire thermal anemometer was used to map air speeds exiting the airflow channels created by adjacent louver blades and to measure air speeds at locations between louver blades. Air speeds measured at the centerlines between adjacent lover blades were similar in magnitude to air speeds measured at the louver outlet equidistant between adjacent louver blades. Also, at louver outlet, speeds were

generally highest, as expected, at locations approximately equidistant from the adjacent louver blades. Evaluation of the OA measurement systems To evaluate the OA measurement systems, the EBTRON probes, louvers, and airflow straighteners were installed as described above, OA flow rates were varied from approximately 15 or 20 percent of the maximum recommend flow rate for the louver (the maximum flow rates are based on rain penetration tests) to approximately the maximum recommend flow while logging QREF and the velocities indicated by the electronic sensors. At each test condition, data were collected every five seconds for six minutes. The four different air intake louvers and two different honeycomb airflow straighteners were employed during the testing. Most experiments were performed without air recirculation in the test system as prior research (Fisk et al. 2005b) had indicated that recirculation did not affect accuracy of OA flow measurements as long as a small (0.04 inch water) pressure drop was maintained across the OA damper – a criterion met in tests in this series. The six-minute-averages of air speeds obtained from all installed EBTRON sensors or from subsets of installed EBTRON sensors were computed. The coincident six-minute-average flow rates through the reference air flow meter were also calculated with a small correction for elevation at the test site, per the manufacturer’s equations. The test system was located in a thermally conditioned indoor space thus the louver was not exposed to winds. Using data collected with velocity probes between louver blades or at the outlet face of louvers, average air speeds measured with the EBTRON probes were plotted versus the measured reference OA air flow rates, and linear equations were fitted to the data using least-squares fitting routines to determine values of ”m” and “b” as defined in the following equation
bmV QREFAVG += (2) where VAVG is the average velocity from the EBTRON probes. Predicted OA flow rates (QP) were then calculated from equation 3 using the m and b “system calibration parameters” as follows
( ) mbVQ AVGP /−= (3)
airflow
zero-power thermister
self-heatedthermister
Figure 6. Schematic illustration of a velocity probe containing one velocity sensor.

outdoor air damper
Louver
air flow
Figure 7. Example of airflow patterns inferred from visualization of smoke flow. Using data collected with EBTRON probes downstream of airflow straighteners, equation 4 was used to calculate QP.
DUCTAVGP AVQ = (4)
where VAVG is the average velocity from the electronic sensors located downstream of the airflow straightener and ADUCT is the cross sectional area of the duct located between the air intake louver and OA damper where the airflow straightener and velocity sensors are installed.
Results Figure 8 shows velocities measured with the EBTRON probes installed at the outlet face of louvers or between louver blades. These velocities are plotted versus values of QREF and the results of fitting linear equations to the data are provided. In all cases that data are very well fit by linear equations with R2 of 0.99 or 1.00. The slopes (values of m) range from 0.75 to 1.02 and the intercepts (values of b) range from -60 to + 61 but are generally positive. Average velocities from three of four sensors fall along the lines of average velocity measured using ten to 12 sensors. Data from repeat tests are consistent with data from original tests and data collected with air recirculation in the test system are not distinct from data collected without air recirculation. Figure 9 shows values of %error calculated from the same test data. Errors range from -12 percent to +11 percent but are generally less than ±5 percent and almost always less than 10 percent. All the error curves have a similar shape with the largest positive errors at intermediate flow rates suggesting that even smaller errors might be obtained by using non-linear equations fitted to the original data to calculated values of QP. Errors based on use of three of four velocity sensors are not significantly different from errors obtained using ten to 12 sensors implying that only a few sensors are necessary to measure the OA flow rate through a 24 inch by 24 inch louver. Overall, the %errors from tests with velocity probes at the louver outlet face are very similar in magnitude to %errors from tests with velocity probes installed between louver blades. A second version of the Ruskin ELF 375DX louver was purchased and the velocity data (figure 8) obtained from tests with this second louver fall along the line of data obtained from tests of the first louver. In addition, values of the system calibration parameters m and b obtained from

tests of the first louver were used to predict the OA flow rates in the second version of this louver with no significant change in %error (Figure 9) suggesting that system calibration parameters from tests of a single louver may apply for all louvers with the same design, size, and velocity probe locations. This finding was expected, given that the louver geometry and probe locations were essentially unchanged. Figure 10 shows the values of %error obtained from tests with velocity probes installed downstream of airflow straighteners with and without an upstream louver. The three charts on the left are based on the velocity data from all nine velocity sensors, while the three charts on the right are based on data from only the vertical row of three air velocity sensors. When data from all nine sensors are used and there is no upstream louver, %error is approximately +20 percent to +30 percent. With upstream louvers, errors are sometimes larger and sometimes smaller, but are as high as +75 percent when data from all nine sensor are used and as high as +100% when data from only three sensors are used. In all but few cases errors are positive (i.e., OA flow is over predicted) and the error often exceeds 25 percent. Errors vary substantially depending on the type of upstream louver, with the location of probes and airflow straighteners unchanged. Errors tended to be slightly smaller when the fine airflow straightener was employed. Errors obtained with velocity probes located three inch, as opposed to five inch, downstream of the airflow straightener were not consistently larger or smaller in magnitude. In tests with the Arrow EA64 louver and fine airflow straightener, values of %error from analogous tests with and without air recirculation flow of 1.7 to 3.2 times the OA flow rates differed by less than 2 percent. Tests using the Ruskin EME6625 louver and fine airflow straightener were repeated and the average %error in the second set of tests was 6.6 percent less than in the first set of tests (Figure 10), which is significantly poorer than the 1 percent repeatability obtained in the previously discussed tests with probes at the louver outlet face. The tests with the Arrow EA64 louver with recirculation may be also be considered a repeat of the analogous tests without recirculation, if, as indicated, recirculation does not affect measurement accuracy. The values of %error from tests with and without air recirculation differed by less than 2 percent. The measured air velocities downstream of the airflow straighteners, or at the same locations without an airflow straightener installed, were highly nonuniform. The ratio of maximum to minimum measured air velocity was often larger than an order of magnitude. The velocity profiles reflected the direction at which air exited the louvers. For example, consider a test with the Arrow EA64 louver, which directs air upward, with probes installed downstream of the fine airflow straightener, and with a reference OA flow rate of 840 cfm. The average velocity of the top row of sensors was 483 fpm and the average velocity of the bottom row of sensors was only 12 fpm. The blockage of airflow by the frames of the louvers is another factor that may have caused the measured velocities to be non-uniform, particularly with the relatively small louvers used in the experiments. Thus, the airflow straighteners did not result in a spatially uniform air velocity at the location of the velocity sensors. In the tests with airflow straighteners, the eddies depicted in Figure 7 sometimes extended through the airflow straighteners, thus, at some locations air flowed backwards through the airflow straightener away toward the OA intake louver. As expected with such non-uniform velocities, the average velocity varied depending on the number of sensors utilized and their locations. The associated errors in OA flow rate predicted using equation 4 also varied depending on the number of sensors utilized and their locations. Figure 10 shows the errors obtained when the average velocity is based on only three

sensors arranged in a vertical row are often larger than the errors with the average air velocity based on data from all nine sensors.
Arrow EA 64 with Velocity Probes at Louver Outlet
200
600
1000
1400
200 600 1000 1400Reference OA Flow (cfm)
e A
vera
g
Velo
city
(fpm
) 12-sensoravg.4-sensoravg.20% ofmax. flow
12 sensory = 0.95x + 25
R2 = 1.00
4 sensory = 0.97x + 13
R2 = 1.00
0200400600800
100012001400
0 500 1000 1500Reference OA Flow (cfm)
Ave
rage
Vel
ocity
(fpm
) 12-sensoravg.4-sensoravg.20% ofmax.flow
12-sensor y = 0.96x + 21
R2 = 1.00
4-sensor y = 1.02x - 0
R2 = 1.00
Arrow EA64 with Velocity Probes Between Louver Blades
Greenheck EVH-602 with 3 Velocity Probes Between Louver Blades
0
300
600
900
1200
0 300 600 900 1200Reference OA Flow (cfm)
Ave
rage
Vel
icity
(fp
m)
3-sensoravg.
20% ofmax.flow
y = 0.87x - 60R2 = 1.00
Ruskin ELF375DX with Velocity Probes Between Louver Blades
0200400600800
100012001400
0 500 1000 1500Reference OA Flow (cfm)
Ave
rage
Vel
ocity
(fp
m)
12-sensoravg.4-sensoravg.20% ofmax.flow
12 sensory = 0.94 x + 44
R2 = 1.00
4 sensory = 0.92 x +53
R2 = 1.00
Ruskin EME 6625 with Velocity Probes at Louver Outlet
0
200
400
600
800
1000
0 300 600 900 1200Reference OA Flow (cfm)
Avg
. Vel
ocity
(fpm
)
4-sensoravg.
repeatof tests
with airrecir-culation
20% ofmax.flow
original testsy= 0.77x + 18
R2 = 0.99
repeat testsy = 0.75x + 7
R2 = 0.99
Greenheck EVH-602 with Velocity Probes at Louver Outlet
0
300
600
900
1200
1500
0 500 1000 1500Reference OA Flow (cfm)
(fpm
)A
vera
ge V
eloc
ity
10-sensoravg.3-sensoravg.
20% ofmax. flow
10-sensory = 0.97x + 41
R2 = 0.99
3-sensory = 0.98x + 38
R2 = 0.99
Ruskin ELF375DX with Velocity Probes at Louver Outlet
0200400600800
100012001400
0 500 1000 1500Reference OA Flow (cfm)
Avg
. Vel
ocity
(fpm
)
12-sensoravg.
4-sensoravg.
12 sensoravg. withrecircu- lation12-sensoravg., 2ndlouver
20% ofmax. flow
12 sensory = 1.01x+50
R2 = 0.99
4 sensory = 0.99 x +61
R2 = 0.99
Figure 8. Relationship of reference outdoor air flow with average velocity measured using electronic probes at louver outlets or between louver blades.

-8-6-4-20246
0 500 1000 1500Reference OA Flow (cfm)
Erro
r in
Pred
icte
d Fl
ow (%
) 12-sensoravg. & cal.eqn.4-sensoravg. & cal.eqn.20% ofmax. flow
Arrow EA64 with Velocity Probes Between Louver Blades
Arrow EA 64 with VelocityProbes at Louver Outlet Face
-8-6-4-202468
200 600 1000 1400Reference OA Flow (cfm)
Erro
r in
Pred
icte
d Fl
ow (%
)12-sensoravg. &cal. eqn.4-sensoravg. &cal. eqn.20% ofmax.flow
Greenheck EVH-602 with Velocity Probes at Louver Outlet
-15
-10
-5
0
5
10
0 500 1000 1500Reference OA Flow (cfm)
Erro
r in
Pred
icte
d Fl
ow (%
)
10-sensoravg. &cal. eqn.3 sensoravg. &cal. eqn.
20% ofmax.flow
Greenheck EVH-602 with 3 Velocity Probes Between Louver Blades
-6
-4
-2
0
2
4
6
0 300 600 900 1200Reference OA Flow (cfm)
Erro
r in
Pred
icte
d Fl
ow (%
)
3-sensoravg. &cal.eqn.20% ofmax.flow
y = 0.87x - 60R2 = 1.00
Ruskin ELF375DX with Velocity Probes at Louver Outlet
-10
-5
0
5
10
15
0 500 1000 1500Reference OA Flow (cfm)
Erro
r in
Pred
icte
d Fl
ow (%
)
12-sensoravg. & cal.eqn.
4-sensoravg. & cal.eqn.
cal. eqn. from1st louverused topredict flowin 2nd louver
Ruskin ELF375DX with Velocity Probes Between Louver Blades
-10
-5
0
5
10
0 500 1000 1500Reference OA Flow (cfm)
Erro
r in
Pred
icte
d Fl
ow (%
)
12-sensoravg. &cal. eqn.4-sensoravg. &cal. eqn.20% ofmax.flow
Ruskin EME 6625 with Velocity Probes at Louver Outlet
-10-8-6-4-20246
0 300 600 900 1200
Reference OA Flow (cfm)
Erro
r in
Pred
icte
d Fl
ow (%
)
4-sensoravg. &and cal.eqn.
repeattests
20% ofmax. flow
Figure 9. Errors in predicted OA flow rates with electronic velocity probes at louver outlets or between louver blades when using linear calibration equations.

-20
0
20
40
60
80
100
Err
or (%
)
No AH RH RV GV No AH RH RV GVNo AH RH RV GV
1228 - 1270 cfm9 velocity sensors
Louver Code
No Straightener
Fine Straightener
Coarse Straightener
-20-10
0102030405060708090
Erro
r (%
)
No AH RH RV GV No AH RH RV GVNo AH RH RV GV
405 - 525 cfm3 velocity sensors
Louver Code
No Straightener
Fine Straightener
Coarse Straightener
-20
0
20
40
60
80
100
Err
or (%
)No AH RH RV GV No AH RH RV GVNo AH RH RV GV
828 - 854 cfm3 velocity sensors
Louver Code
No Straightener
Fine StraightenerCoarse Straightener
-20
0
20
40
60
80
100
Erro
r (%
)
No AH RH RV GV No AH RH RV GVNo AH RH RV GV
1228 - 1270 cfm3 velocity sensors
Louver Code
No Straightener Fine StraightenerCoarse Straightener
-100
102030405060708090
Erro
r (%
)
No AH RH RV GV No AH RH RV GVNo AH RH RV GV
405 - 525 cfm9 velocity sensors
Louver Code
No Straightener
Fine Straightener
Coarse Straightener
= repeat test = with recirculation
-20
0
20
40
60
80
100
Erro
r (%
)
No AH RH RV GV No AH RH RV GVNo AH RH RV GV
828 - 854 cfm9 velocity sensors
Louver Code
No Straightener
Fine StraightenerCoarse Straightener
= repeat test = with recirculation
Louver codes: No = no louver AH = Arrow EA64 RH – Ruskin ELF375DX RV = Ruskin EME6625 GV = Greenheck EVH602
Figure 10. Results of tests using velocity probes with nine or three air velocity sensors located behind airflow straighteners, and for reference, behind no airflow straightener. In all experiments, the inlet of the flow straightener was located 5 to 6 inch behind the outlet of the louver (depending on the louver thickness) and sensors were located 3 inch (dark columns) or 5 inch (light columns) behind the outlet face of the airflow straightener. The distance between the sensors and centerline of the outdoor air damper was 9.5 inch (dark columns) or 45 inch (light columns). Figure 11 provides plots of average measured air velocity, using data from all nine EBTRON velocity sensors, versus reference air flow rate based on the tests with the probes located five inch downstream of the flow straightener and 50 inch of duct between the flow straightener and the centerline of the OA damper. In all cases the relationship of average velocity with reference flow rate is linear (R2 = 1.00 when linear equations are fitted to the data); however, the slope

resulting from the least squares fitting of a linear equations to the data varies with type of upstream louver and type of airflow straightener. The intercepts of the linear equations are often but not always moderate or small relative to the air velocities measured at the lower values of reference air flow rate. The linear relationships do suggest that outdoor air flow rates could be determined with reasonable accuracy if accurate system calibrations (as opposed to sensor calibrations) could be performed in field settings for each specific system. The average air velocities measured these tests with probes downstream of airflow straighteners are smaller than the average air velocities at the same reference OA flow rates when the probes are between louver blades or at the outlet face of louvers.
0
100
200
300
400
500
600
0 500 1000 1500
Reference OA Flow (cfm)
Ave
rage
Vel
ocity
(fpm
)
no flow straightener y = 0.308 x - 2
fine flow straightener y = 0.460 X - 66
coarse flow straightener y = 0.464 x - 42
Arrow EA 64 Louver
R2=1.00
R2=1.00
R2=1.00 0
100
200
300
400
500
0 500 1000 1500
Reference Flow (cfm)
Ave
rage
Vel
ocity
(fpm
) no flow straightener y = 0.378 x - 5
fine flow straightener y = 0.348 x - 29
coarse flow straightenery = 0.334 x - 32
Greenheck EVH 602 Louver
R2 = 1.00
R2 = 1.00
R2 = 1.00
0
100
200
300
400
500
600
0 500 1000 1500
Reference Flow (cfm)
Ave
rage
Vel
ocity
(fpm
) no flow straightener y = 0.397 x + 2
fine flow straightener y = 0.285 x - 3
coarse flow straightenery = 0.308 x - 25
Ruskin EME6625 Louver
R2 = 1.00
R2 = 1.00
R2 = 1.000
100
200
300
400
500
600
0 500 1000 1500
Reference Flow (cfm)
Ave
rage
Vel
ocity
(fpm
) no flow straightener y = 0.372 x + 34
fine flow straightener y = 0.324 x - 35
coarse flow straightener y = 0.347 x - 31
Ruskin ELF 375DX Louver
R2 =1.00
R2 =1.00
R2 =1.00
Figure 11. Average air velocity, using data from nine velocity sensors, versus reference flow from tests with airflow straighteners.
Discussion This research has shown that OA flow rates should be measurable with errors generally less than 10 percent using electronic air velocity sensors installed between louver blades or at the outlet face of louvers. System calibration parameters “m” and “b” are required for each unique combination of louver type and velocity sensor locations. It is possible that the values of these system calibration parameters will also vary with louver size, but this possibility was not evaluated. High accuracy in measurement of OA flow rates is maintained with flow rates as low as 15 percent of the maximum recommended for the louver, corresponding to provision of 15 percent of outdoor air in the supply airstream at minimum OA supply conditions in HVAC systems with economizers. Thus, this measurement approach for OA flow rates does not require
that HVAC systems have a separate OA intake section dedicated to minimum OA supply. Measurement accuracy is similar with velocity probes between louver blades or at the outlet face of louvers. Given that probe installation at the louver outlet face is simpler, this may be the preferred probe location particularly when the measurement system is added to existing HVAC systems. Application of this measurement approach depends on the development of system calibration parameter data (i.e., values of m and b) and probe installation instructions and hardware by the velocity probe manufacturers or some other entity. However, because louvers geometries and probe installation locations are both highly repeatable, and given the results of our tests using a second version of one of the louvers, it seems unlikely that calibrations are necessary at building sites for each specific installation. The research has shown that installation of two types of airflow straighteners did not, in general, improve the accuracy of measuring OA flow rates when the electronic velocity probes were installed in the duct system between OA intake louvers and OA damper. For the louver types and sizes employed, predicted OA flow rates based on the average measured air velocity and duct cross sectional area were often more than 25 percent greater than the “true” reference values of OA flow rate and the errors varied substantially depending on the type of upstream louver. One of the advantages of placing the velocity probes between louver blades or at the immediate outlet of louvers, relative to downstream of airflow straighteners, is that the velocity is spatially more uniform at the first two probe locations. The percent relative standard deviation in velocity averaged 12 percent with the probes between blades or at the louver outlet while the percent relative standard deviation in velocity averaged 93 percent from measurements downstream of airflow straighteners when there was an upstream louver. It is difficult to capture a true average air velocity using a practical number of sensors when the air velocity is highly non uniform. The cause of the general over prediction of OA flow rate in the measurements using airflow straighteners is not known; however, the presence of large scale eddies downstream of louvers, that extend through the airflow straighteners, is a possible partial explanation. If the velocity sensors are located in the plane containing the eddy, the sensor system will detect air flowing both toward and away from the OA damper, while the OA flow rate calculation via equation 4 assumes that all air flows toward the OA damper. However, the OA flow rates are over-predicted with equation 4 even when no upstream louver is used, so this effect could only be a partial explanation. The sensor location is clearly very far from ideal for accurate air flow rate measurements because the long straight sections of ductwork needed to attain an ideal sensor location are impractical within the OA inlet sections of most HVAC systems. The velocity sensors are located approximately 0.8 of a hydraulic diameter from the entrance to the OA duct – a region in which the airflow profile is highly influenced by entrance effects -- while the recommended location of velocity measurements for determining air flow rates is at least 7.5 hydraulic diameters downstream of a section of straight ductwork (ASHRAE 2005). Also, the velocity sensors were located 0.2 hydraulic diameters downstream of the airflow straighteners while the recommended sensor location is approximately five hydraulic diameters downstream of airflow straighteners (ANSI/AMCA 2007). The approximately 25 percent over-prediction of OA flow rate when the OA inlet section of the duct contained no louver or airflow straightener was initially surprising. Much of this

discrepancy may be explained by three factors. First, the velocity probes obstruct 9.4 percent of the cross sectional area of the duct, increasing the air velocity at the location of the probes by 9.4 percent and resulting in a 9.4 percent over-prediction of OA flow rate. Second, the developing air velocity profile at the duct entrance is a partial explanation. For the range of air flow rates encountered in the experiments, fluid dynamics theory (White 1974) indicates that, at the plane of the velocity sensors, there is a region extending approximately one inch from the duct walls in which air velocities are substantially diminished relative to the centerline velocity. All of the velocity sensors were located further than one inch from duct walls, so the sensor system totally misses the region of lower air velocity. The one inch thick region with a diminished air velocity represents approximately 15% of the total cross sectional area of the duct system. If one assumes the air velocity in this region is, on average, approximately half of the centerline velocity, then 7.5 percent (one half of 15 percent) of the over prediction is explained by the developing air velocity profile. Another 5 percent of the discrepancy would be explained if the velocity sensors do, in fact, indicate an average, a velocity 5% larger than the true velocity, as suggested by the calibration checks discussed previously. Thus, approximately 16.9 percent (9.4 percent plus 7.5 percent) to 21.9 percent (16.9 percent plus 5 percent, if the sensors read 5 percent high) of the 25 percent discrepancy is explainable. The errors in OA flow rate measurements in systems using airflow straighteners may be significantly smaller in systems with larger OA intake sections than employed in this research because the edge effects on the airflow patterns would be reduced. For example, the frames at the perimeter of the OA intake louvers blocked a substantial portion of the inlet of the 24 inch by 24 inch duct, but louver frames would block a smaller portion of the duct when larger louvers are used. The research did demonstrate a linear relationship between average measured velocity and reference OA flow rate, suggesting that accurate measurements of OA flow rate should be obtainable with this measurement approach if accurate system calibrations can be performed in field settings for each specific air intake system. It may even be possible to obtain accurate OA flow rates based on laboratory calibrations that account for each specific combination of louver type and size and on the location of velocity sensors in the duct system relative to the location of the louver and OA damper; however, no data were collected to assess this possibility. Also where sufficient straight duct is available so that sensors can be installed away from the zones of influence of the OA louver and damper, then simply multiplying average measured velocity with duct area may yield accurate values of OA flow rate, as the sensors themselves were quite accurate. A number of limitations to this program of research should be mentioned. First, the research utilized only one size of louver. Although, the general findings of this research are very likely to apply for larger louvers, it would be desirable to obtain similar data with larger louvers. Second, the present research involved only a few months of testing in an indoor location, thus, it did not assess whether measurement accuracy would be maintained for longer periods with the probes exposed to outdoor air that varies in temperature and moisture content and that can contain more particulate matter. Third, the tests were performed in a setting without wind which, in theory, may influence the pattern of airflow through louvers and the measurement accuracy. However, in prior field studies of other OA measurement systems (Fisk et al. 2005c), wind speed or direction did not substantially affect measurement accuracy. Fourth, this research employed only EBTRON air velocity sensors; hence, the findings are strictly applicable only for EBTRON

sensors. However, other manufacturers may be able to provide electronic sensors that accurately measure air speed over the same range and that can be used as described above to measure OA flow rates.
Conclusions The use of electronic air velocity probes between the blades of OA intake louvers or at the outlet face of louvers is highly promising as a means of accurately measuring the rates of OA flow into HVAC systems. The expected measurement errors are, in most cases, significantly less than 12 percent. System calibration parameters m and b are required for each specific combination of louver type and velocity sensor locations, but calibrations do not appear to be necessary for each measurement system installation. High accuracy, is attainable even with OA flow rates as low as 15 percent of the maximum recommended flow rate for the louver. Thus, this measurement approach for OA flow rates does not require that HVAC systems have a separate OA intake section dedicated to minimum OA supply. If suitable calibration parameters are provided by sensor manufacturers, this measurement approach should be applicable to both new and existing HVAC systems Installation of two types of airflow straighteners did not improve the accuracy of measuring OA flow rates when the electronic velocity probes were installed in the duct system between OA intake louvers and OA dampers. For the louver types and sizes employed, predicted OA flow rates based on the average measured air velocity and duct cross sectional area were often more than 25 percent greater than the “true” reference values of OA flow rate and the errors varied substantially depending on the type of upstream louver. Thus, this measurement approach is considerably less promising than use of electronic air velocity probes between the blades of OA intake louvers or at the outlet face of louvers.
Recommendations Field studies are recommended to assess the long term accuracy of OA flow rate measurements using velocity probes installed between the blades of OA intake louvers or at the outlet face of louvers. These field tests would also serve as a technology demonstration that will help to build demand for technology commercialization. The testing must be performed in settings where highly accurate reference measurements of OA flow rates are feasible. Tests with a few different louver types and climates are desirable. Outdoor wind speeds and directions should be logged so that the effects of wind on measurement accuracy can be evaluated. Test should be performed to determine of the system calibration parameters m and b required to predict OA flow rates vary with louver size. These tests can be performed by industry or by research institutions. Commercial application of the results of this research depends upon the development of system calibration parameters m and b for various types of louvers and sensor locations. The development of these calibration parameters and the development of suitable probe installation hardware is recommended to the private sector, e.g. to manufacturers of suitable velocity sensors. Once the test system and protocols are established, only a few hours of testing will be required for each unique type of louver-probe combination.

Acknowledgements This research was supported by the California Energy Commission through the San Diego State University Research Foundation under contract 54915A/06-03B through Contract No. DE-AC02-05CH11231 between the University of California and the U.S. Department of Energy. The authors thank David Faulkner for his assistance in ordering experimental components, David Dougan at EBTRON for technical advice and providing the electronic velocity sensors used in this research, and Mike Apte and Leon Alevantis for reviewing a draft of this document.
References ANSI/AMCA (2007). ANSI/AMCA 210-07 and ANSI/ASHRAE 51-07. Laboratory methods of testing
fans for certified aerodynamic performance rating, Air Movement and Control Association. Inc. Arlington Heights, IL and American Society of Heating, Refrigerating, and Air Conditioning Engineers, Atlanta. GA.
ASHRAE (2005). 2005 ASHRAE Handbook, Fundamentals, Chapter 14. Atlanta, GA, American Society of Heating, Refrigerating, and Air Conditioning Engineers, Inc.
CARB (2004). Report to the California Legislature: Environmental health conditions in California’s portable classrooms, California Air Resources Board and California Department of Health Services.
Fisk, W. J., D. Faulkner and D. P. Sullivan (2004). An evaluation of technologies for real-time measurement of rates of outdoor airflow into HVAC systems, LBNL-56397. Berkeley, CA, Lawrence Berkeley National Laboratory.
Fisk, W. J., D. Faulkner and D. P. Sullivan (2005a). "An evaluation of three commercially available technologies for real-time measurement of rates of outdoor airflow into HVAC systems." ASHRAE Transactions 111(2): 443-455.
Fisk, W. J., D. Faulkner and D. P. Sullivan (2005b). "Technologies for measuring flow rates of outdoor air into HVAC systems: some causes and suggested cures for measurement errors." ASHRAE Transactions 111(2): 456-463.
Fisk, W. J., D. Faulkner and D. P. Sullivan (2005c). Real-time measurement of rates of outdoor airflow into HVAC systems: a field study of three technologies. LBNL 58856. Berkeley, CA, Lawrence Berkeley National Laboratory.
Fisk, W. J., D. Faulkner and D. P. Sullivan (2006). Accuracy of CO2 sensors in commercial buildings: a pilot study LBNL-61862. Berkeley, CA.
ITRON (2006). California commercial energy use. Report CEC-400-2006-005 for the California Energy Commission.
Kettler, J. P. (1995). "Minimum ventilation control for VAV systems: fan tracking versus workable solutions." ASHRAE Transactions 101(2): 625-630.
Kettler, J. P. (2000). "Measuring and controlling outdoor airflow." IAQ Applications Winter 2000. Seppanen, O. and W. J. Fisk (2006). "Some quantitative relations between indoor environmental quality
and work performance or health." International Journal of HVAC&R Research 12(4): 957-973. Seppanen, O. A., W. J. Fisk and M. J. Mendell (1999). "Association of ventilation rates and CO2
concentrations with health and other responses in commercial and institutional buildings." Indoor Air 9(4): 226-52.
Wargocki, P. and D. P. Wyon (2007). "The effect of moderately raised classroom temperatures and classroom ventilation rate on the performance of schoolwork by children." HVAC&R Research 13(2): 193-220.
White, F. M. (1974). Chapter 6. Incompressible turbulent mean flow. Viscous Fluid Flow. New York, McGraw Hill.
Womble, S. E., E. L. Ronca, J. R. Girman and H. S. Brightman (1996). Developing baseline information on buildings and indoor air quality (BASE’95). IAQ'96 Paths to Better Building Environments. Baltimore, MD, ASHRAE: 109-117.